US9357963B1 - Grayscale thermographic imaging - Google Patents
Grayscale thermographic imaging Download PDFInfo
- Publication number
- US9357963B1 US9357963B1 US13/439,177 US201213439177A US9357963B1 US 9357963 B1 US9357963 B1 US 9357963B1 US 201213439177 A US201213439177 A US 201213439177A US 9357963 B1 US9357963 B1 US 9357963B1
- Authority
- US
- United States
- Prior art keywords
- area
- thermal
- microbolometer
- skin
- image
- Prior art date
- Legal status (The legal status is an assumption and is not a legal conclusion. Google has not performed a legal analysis and makes no representation as to the accuracy of the status listed.)
- Active, expires
Links
Images


Classifications
-
- A—HUMAN NECESSITIES
- A61—MEDICAL OR VETERINARY SCIENCE; HYGIENE
- A61B—DIAGNOSIS; SURGERY; IDENTIFICATION
- A61B5/00—Measuring for diagnostic purposes; Identification of persons
- A61B5/0059—Measuring for diagnostic purposes; Identification of persons using light, e.g. diagnosis by transillumination, diascopy, fluorescence
- A61B5/0082—Measuring for diagnostic purposes; Identification of persons using light, e.g. diagnosis by transillumination, diascopy, fluorescence adapted for particular medical purposes
-
- A—HUMAN NECESSITIES
- A61—MEDICAL OR VETERINARY SCIENCE; HYGIENE
- A61B—DIAGNOSIS; SURGERY; IDENTIFICATION
- A61B5/00—Measuring for diagnostic purposes; Identification of persons
- A61B5/0059—Measuring for diagnostic purposes; Identification of persons using light, e.g. diagnosis by transillumination, diascopy, fluorescence
- A61B5/0077—Devices for viewing the surface of the body, e.g. camera, magnifying lens
-
- A—HUMAN NECESSITIES
- A61—MEDICAL OR VETERINARY SCIENCE; HYGIENE
- A61B—DIAGNOSIS; SURGERY; IDENTIFICATION
- A61B5/00—Measuring for diagnostic purposes; Identification of persons
- A61B5/01—Measuring temperature of body parts ; Diagnostic temperature sensing, e.g. for malignant or inflamed tissue
- A61B5/015—By temperature mapping of body part
-
- A—HUMAN NECESSITIES
- A61—MEDICAL OR VETERINARY SCIENCE; HYGIENE
- A61B—DIAGNOSIS; SURGERY; IDENTIFICATION
- A61B5/00—Measuring for diagnostic purposes; Identification of persons
- A61B5/44—Detecting, measuring or recording for evaluating the integumentary system, e.g. skin, hair or nails
- A61B5/441—Skin evaluation, e.g. for skin disorder diagnosis
- A61B5/445—Evaluating skin irritation or skin trauma, e.g. rash, eczema, wound, bed sore
-
- G—PHYSICS
- G06—COMPUTING; CALCULATING OR COUNTING
- G06T—IMAGE DATA PROCESSING OR GENERATION, IN GENERAL
- G06T7/00—Image analysis
- G06T7/0002—Inspection of images, e.g. flaw detection
- G06T7/0012—Biomedical image inspection
- G06T7/0014—Biomedical image inspection using an image reference approach
- G06T7/0016—Biomedical image inspection using an image reference approach involving temporal comparison
-
- G—PHYSICS
- G06—COMPUTING; CALCULATING OR COUNTING
- G06T—IMAGE DATA PROCESSING OR GENERATION, IN GENERAL
- G06T7/00—Image analysis
- G06T7/10—Segmentation; Edge detection
- G06T7/11—Region-based segmentation
-
- A—HUMAN NECESSITIES
- A61—MEDICAL OR VETERINARY SCIENCE; HYGIENE
- A61B—DIAGNOSIS; SURGERY; IDENTIFICATION
- A61B2576/00—Medical imaging apparatus involving image processing or analysis
- A61B2576/02—Medical imaging apparatus involving image processing or analysis specially adapted for a particular organ or body part
-
- A—HUMAN NECESSITIES
- A61—MEDICAL OR VETERINARY SCIENCE; HYGIENE
- A61B—DIAGNOSIS; SURGERY; IDENTIFICATION
- A61B5/00—Measuring for diagnostic purposes; Identification of persons
- A61B5/103—Detecting, measuring or recording devices for testing the shape, pattern, colour, size or movement of the body or parts thereof, for diagnostic purposes
- A61B5/107—Measuring physical dimensions, e.g. size of the entire body or parts thereof
- A61B5/1072—Measuring physical dimensions, e.g. size of the entire body or parts thereof measuring distances on the body, e.g. measuring length, height or thickness
-
- A—HUMAN NECESSITIES
- A61—MEDICAL OR VETERINARY SCIENCE; HYGIENE
- A61B—DIAGNOSIS; SURGERY; IDENTIFICATION
- A61B5/00—Measuring for diagnostic purposes; Identification of persons
- A61B5/103—Detecting, measuring or recording devices for testing the shape, pattern, colour, size or movement of the body or parts thereof, for diagnostic purposes
- A61B5/107—Measuring physical dimensions, e.g. size of the entire body or parts thereof
- A61B5/1075—Measuring physical dimensions, e.g. size of the entire body or parts thereof for measuring dimensions by non-invasive methods, e.g. for determining thickness of tissue layer
-
- A—HUMAN NECESSITIES
- A61—MEDICAL OR VETERINARY SCIENCE; HYGIENE
- A61B—DIAGNOSIS; SURGERY; IDENTIFICATION
- A61B5/00—Measuring for diagnostic purposes; Identification of persons
- A61B5/68—Arrangements of detecting, measuring or recording means, e.g. sensors, in relation to patient
- A61B5/6801—Arrangements of detecting, measuring or recording means, e.g. sensors, in relation to patient specially adapted to be attached to or worn on the body surface
- A61B5/6844—Monitoring or controlling distance between sensor and tissue
-
- G—PHYSICS
- G06—COMPUTING; CALCULATING OR COUNTING
- G06T—IMAGE DATA PROCESSING OR GENERATION, IN GENERAL
- G06T2207/00—Indexing scheme for image analysis or image enhancement
- G06T2207/10—Image acquisition modality
- G06T2207/10048—Infrared image
-
- G—PHYSICS
- G06—COMPUTING; CALCULATING OR COUNTING
- G06T—IMAGE DATA PROCESSING OR GENERATION, IN GENERAL
- G06T2207/00—Indexing scheme for image analysis or image enhancement
- G06T2207/20—Special algorithmic details
- G06T2207/20072—Graph-based image processing
-
- G—PHYSICS
- G06—COMPUTING; CALCULATING OR COUNTING
- G06T—IMAGE DATA PROCESSING OR GENERATION, IN GENERAL
- G06T2207/00—Indexing scheme for image analysis or image enhancement
- G06T2207/30—Subject of image; Context of image processing
- G06T2207/30004—Biomedical image processing
- G06T2207/30088—Skin; Dermal
-
- G—PHYSICS
- G16—INFORMATION AND COMMUNICATION TECHNOLOGY [ICT] SPECIALLY ADAPTED FOR SPECIFIC APPLICATION FIELDS
- G16H—HEALTHCARE INFORMATICS, i.e. INFORMATION AND COMMUNICATION TECHNOLOGY [ICT] SPECIALLY ADAPTED FOR THE HANDLING OR PROCESSING OF MEDICAL OR HEALTHCARE DATA
- G16H30/00—ICT specially adapted for the handling or processing of medical images
- G16H30/40—ICT specially adapted for the handling or processing of medical images for processing medical images, e.g. editing
Definitions
- clinicians which term includes herein certified and licensed medical doctors of all specialties, osteopathic doctors of all specialties, podiatrists, dental doctors of all specialties, chiropractors, veterinarians of all specialties, nurses, and medical imaging technicians, have become dependent on the use of medical devices that assist them in their delivery of patient-centered care.
- the common function of these devices is to assist and not replace the clinical judgment of the clinician. This fulfills the dictum that best practice is clinical judgment assisted by scientific data and information.
- LIR thermography has been known to be beneficial in the evaluation of thermal heat intensity and gradiency relating to abnormalities of the skin and subcutaneous tissue (SST).
- SST skin and subcutaneous tissue
- DTI deep tissue injury
- DTI caused by mechanical stress (pressure, shear and frictional forces) can be separated into three categories.
- the first category is a high magnitude/short duration mechanical stress represented by traumatic and surgical wounds.
- the second category is low magnitude/long duration mechanical stress represented by pressure ulcer development, which is also a factor in the development of ischemic and neuropathic wounds.
- the third category is a combination of categories one and two represented by pressure ulcer formation in the bariatric patient.
- the pathophysiologic conditions that occur with DTI and subsequent necrosis of the affected tissue are ischemia, cell distortion, impaired lymphatic drainage, impaired interstitial fluid flow, and reperfusion injury. Category one is dominated by cell distortion and even destruction. Category two is dominated by ischemia. Category three is a combination of cell distortion and ischemia.
- hypoxia causes aerobic metabolism to convert to anaerobic metabolism. This occurrence causes lactic acidosis followed by cell destruction, release of enzymes and lytic reactions. The release of these substances causes additional cell injury and destruction, and initiation of the inflammatory response.
- ischemic-reperfusion injury is associated with all of the above mechanical stress induced SST injuries. This condition is caused by a hypoxia induced enzymatic change and the respiratory burst associated with phagocytosis when oxygen returns after an ischemic event.
- the result of ischemic-reperfusion injury is the formation of oxygen free radicals (hydroxyl, superoxide, and hydrogen peroxide) that cause damage to healthy and already injured cells leading to extension of the original injury
- SST injury and subsequent necrosis can also be caused by vascular disorders.
- Hypoxia can be caused by an arterial occlusion or by venous hypertension.
- Lymphatic flow or node obstruction can also create vascular induced injury by creating fibrous restriction to venous drainage and subsequent cellular stasis in the capillary system. These disorders are also accentuated by reperfusion injury and oxygen free radical formation.
- the common event that addresses all of the above SST injuries is the inflammatory response.
- This response has two stages. The first stage is vascular and the second is cellular.
- the initial vascular response is vasoconstriction that will last a short time.
- the constriction causes decrease blood flow to the area of injury.
- the decrease in blood flow causes vascular “pooling” of blood (passive congestion) in the proximal arterial vasculature in the region of injury and intravascular cellular stasis occurs along with coagulation.
- the second vascular response is extensive vasodilation of the blood vessels in the area of necrosis.
- This dilation along with the “pooled” proximal blood causes increased blood flow with high perfusion pressure into the area of injury.
- This high pressure flow can cause damage to endothelial cells.
- Leakage of plasma, protein, and intravascular cells causes more cellular stasis in the capillaries (micro-thrombotic event) and hemorrhage into the area of injury.
- perivascular collagen is injured, intravascular and extravascular coagulation occurs.
- the rupture of the mast cells causes release of histamine that increases the vascular dilation and the size of the junctions between the endothelial cells. This is the beginning of the cellular phase.
- More serum and cells mainly neutrophils
- emigration diapedesis
- chemotaxic recruitment chemotaxic gradiency
- Stalling of the inflammatory stage can cause the area of necrosis (ring of ischemia) to remain in the inflammatory stage long past the anticipated time of 2-4 days. This continuation of the inflammatory stage leads to delayed resolution of the ischemic necrotic event.
- the proliferation stage starts before the inflammatory stage recedes.
- angiogenesis occurs along with formation of granulation and collagen deposition. Contraction occurs, and peaks, at 5-15 days post injury.
- Re-epithelialization occurs by various processes depending on the depth of injury. Partial thickness wounds can resurface within a few days. Full thickness wounds need granulation tissue to form the base for re-epithelialization to occur. The full thickness wound does not heal by regeneration due to the need for scar tissue to repair the wound. The repaired scarred wound has less vascularity and tensile strength of normal regional uninjured SST. The final stage is remodeling. In this stage the collagen changes from type III to a stronger type I and is rearranged into an organized tissue.
- the LIR thermal and digital imaging device is a non-contact and non-radiating device that can be utilized bedside.
- the combination of imagers allows both visible and invisible radiation from the body to be evaluated. (See FIG. 1 ) This allows both the anatomical and physiologic status of the SST to be evaluated for injuries or disorders that are not yet clinically recognizable.
- the clinician can evaluate the gradiency of the long-wave radiation emitted from the body region being imaged.
- the ability to visualize the thermal gradiency allows the clinician to evaluate the metabolic activity and blood flow of the region being imaged.
- the normal SST can be used as a control for that specific imaging procedure.
- AOI area of interest
- the AOI can be of greater intensity (hotter) or less intensity (cooler) than the normal SST of that region of the body.
- the AOI can then be evaluated by the clinician for the degree of metabolism, blood flow, necrosis, inflammation and the presence of infection by comparing the warmer or cooler thermal intensity of the AOI or wound base and peri-AOI or wound area to the normal SST of the location being imaged.
- Serial imaging also can assist the clinician in the ability to recognize improvement or regression of the AOI or wound over time.
- an LIR thermal and digital visual imager can be a useful adjunct tool for clinicians with appropriate training to be able to recognize physiologic and anatomical changes in an AOI before it presents clinically and also the status of the AOI/wound in a trending format.
- an AOI or wound evaluation will assist the clinician in analyzing the etiology, improvement or deterioration, and the presence of infection affecting the AOI or wound.
- Energy is not a stand-alone concept. Energy can be passed from one system to another, and can change from one form to another, but can never be lost. This is the First Law of Thermodynamics. Energy is an attribute of matter and electromagnetic radiation. It is observed and/or measured only indirectly through effects on matter that acquires, loses or possesses it and it comes in many forms such as mechanical, chemical, electrical, radiation (light), and thermal.
- Thermal energy is the sum of all of the microscopic scale randomized kinetic energy within a body, which is mostly kinetic energy.
- Chemical energy is the energy of electrons in the force field created by two or more nuclei; mostly potential energy.
- Heat is a process in which thermal energy enters or leaves a body as the result of a temperature difference. Heat is therefore the transfer of energy due to a difference in temperature; heat is a process and only exists when it is flowing.
- heat transfer occurs. Heat energy transfers from the warmer areas to the cooler areas until thermal equilibrium is reached. This is the Second Law of Thermodynamics. There are four modes of heat transfer: evaporation, radiation, conduction and convection.
- Molecules are the workhorses and are both vehicles for storing and transporting energy and the means of converting it from one form to another.
- the formation, breaking, or rearrangement of the chemical bonds within the molecules is accompanied by the uptake or release of energy it is usually in the form of heat.
- Work is completely convertible to heat and defined as a transfer due to a difference in temperature, however work is the transfer of energy by any process other than heat. In other words, performance of work involves a transformation of energy.
- Temperature measures the average randomized motion of molecules (kinetic energy) in a body. Temperature is an intensive property by which thermal energy manifests itself. It is measured by observing its effect on some temperature dependent variable on matter (i.e. ice/steam points of water). Scales are needed to express temperature numerically and are marked off in uniform increments (degrees).
- the temperature of the deep tissues of the body remains constant (within ⁇ 1° F./ ⁇ 0.6° C.) unless the person develops a febrile illness. No single temperature can be considered normal. Temperature measurements on people who had no illness have shown a range of normal temperatures.
- the average core temperature is generally considered to be between 98.0° F. and 98.6° F. measured orally or 99.0° F. and 99.6° F. measured rectally.
- the body can temporarily tolerate a temperature as high as 101° F. to 104° F. (38.6° C. to 40° C.) and as low as 96° F. (35.5° C.) or lower.
- Metabolism simply means all of the chemical reactions in all of the cells of the body. Metabolism creates thermal energy. The metabolic rate is expressed in terms to the rate of heat release during the chemical reactions. Essentially all the energy expended by the body is eventually converted into heat.
- Heat production is the principal by-product of metabolism.
- the rate of heat production is called the metabolic rate of the body.
- the important factors that affect the metabolic rate are:
- the heat produced in the body is generated in the deep organs (liver, brain, heart and the skeletal muscles during exercise). The heat is then transferred to the skin where the heat is lost to the air and other structures. The rate that heat is lost is determined by how fast heat can be conducted from where it is produced in the body core to the skin.
- the skin, subcutaneous tissues and especially adipose tissue are the heat insulators for the body.
- the adipose tissue is important since it conducts heat only 33% as effective as other tissue and specifically 52% as effective as muscle. Conduction rate of heat in human tissue is 18 kcal/cm/m2 k.
- the subcutaneous tissue insulator system allows the core temperature to be maintained yet allowing the temperature of the skin to approach the temperature of the surroundings.
- the venous plexus is especially important because it is supplied by inflow from the skin capillaries and in certain exposed areas of the body (hands-feet-ears) by the highly muscular arterio-venous anastomosis. Blood flow can vary in the venous plexus from barely above zero to 30% of the total cardiac output. There is an approximate eightfold increase in heat conductance between the fully vasoconstricted state and the fully vasodilated state.
- the skin is an effective controlled heat radiator system and the controlled flow of blood to the skin is the body's most effective mechanism of heat transfer from the core to the surface.
- Heat exchange is based on the scientific principle that heat flows from warmer to cooler temperatures. Temperature is thought of as heat intensity of an object.
- the methods of heat exchange are: radiation (60%), loss of heat in the form of LIR waves (thermal energy), conduction to a solid object (3%), transfer of heat between objects in direct contact and loss of heat by conduction to air (15%) caused by the transfer of heat, caused by the kinetic energy of molecular motion. Much of this motion can be transferred to the air if it is cooler than the surface. This process is self-limited unless the air moves away from the body. If that happens, there is a loss of heat by convection. Convection is caused by air currents. A small amount of convection always occurs due to warmer air rising. The process of convection is enhanced by any process that moves air more rapidly across the body surface (forced convection). This includes fans, air flow beds and air warming blankets.
- Convection can also be caused by a loss of heat by evaporation which is a necessary mechanism at very high air temperatures.
- Heat thermal energy
- Heat can be lost by radiation and conduction to the surroundings as long as the skin is hotter than the surroundings.
- the surrounding temperature is higher than the skin temperature, the body gains heat by both radiation and conduction. Under these hot surrounding conditions the only way the body can release heat is by evaporation. Evaporation occurs when the water molecule absorbs enough heat to change to gas. Due to the fact water molecules absorb a large amount of heat in order to change into a gas, large amounts of body heat can be removed from the body.
- Insensible heat loss dissipates the body's heat and is not subject to body temperature control (water loss through the lungs, mouth and skin). This accounts for 10% heat loss produced by the body's basal heat production. Sensible heat loss by evaporation occurs when the body temperature rises and sweating occurs. Sweating increases the amount of water to the skins surface for vaporization. Sensible heat loss can exceed insensible heat loss by 30 times. The sweating is caused by electrical or excess heat stimulation of the anterior hypothalamus pre-optic area.
- hypothalamus anterior pre-optic area
- the role of the hypothalamus (anterior pre-optic area) in the regulation of the body's temperatures occurs due to nervous feedback mechanisms that determine when the body temperature is either too hot or too cold.
- the role of temperature receptors in the skin and deep body tissues relate to cold and warm sensors in the skin. Cold sensors outnumber warm sensors 10 to 1 .
- the deep tissue receptors occur mainly in the spinal cord, abdominal viscera and both in and around the great veins. The deep receptors mainly detect cold rather than warmth. These receptors function to prevent low body temperature. These receptors contribute to body thermoregulation through the bilateral posterior hypothalamus area. This is where the signals from the pre-optic area and the skin and deep tissue sensors are combined to control the heat producing and heat conserving reactions of the body.
- LIR thermography evaluates the infra-red thermal intensity.
- the microbolometer is a 320 ⁇ 240 pixel array sensor that can acquire the long-wave infrared wavelength (7-14 micron) (NOT near-infrared thermography) and convert the thermal intensity into electrical resistance. The resistance is measured and processed into digital values between 1-254. A digital value represents the long-wave infrared thermal intensity for each of the 76,800 pixels. A grayscale tone is then assigned to the 1-254 thermal intensity digital values. This allows a grayscale image to be developed.
- LIR thermography is a beneficial device to monitor metabolism and blood flow in a non-invasive test that can be performed bedside with minimal patient and ambient surrounding preparation.
- the ability to accurately measure the LIR thermal intensity of the human body is made possible because of the skins emissivity (0.98 ⁇ is 0.01), which is independent of pigmentation, absorptivity (0.98 ⁇ 0.01) reflectivity (0.02) and transmitability (0.000).
- the human skin mimics the “BlackBody” radiation concept.
- a perfect blackbody only exists in theory and is an object that absorbs and reemits all of its energy. Human skin is nearly a perfect blackbody as it has an emissivity of 0.98, regardless of actual skin color. These same properties allow temperature degrees to be assigned to the pixel digital value.
- a multi-color palate can be developed by clustering pixel values. There are no industry standards how this should be done so many color presentations are being used by various manufacturers. The use of gray tone values is standardized, consistent and reproducible. Black is considered cold and white is considered hot by the industry.
- An LIR camera has the ability to detect and display the LIR wavelength in the electromagnetic spectrum.
- the basis for infrared imaging technology is that any object whose temperature is above 0° K radiates infrared energy. Even very cold objects radiate some infrared energy. Even though the object might be absorbing thermal energy to warm itself, it will still emit some infrared energy that is detectable by sensors.
- the amount of radiated energy is a function of the object's temperature and its relative efficiency of thermal radiation, known as emissivity.
- Emissivity is a measure of a surface's efficiency in transferring infrared energy. It is the ratio of thermal energy emitted by a surface to the energy emitted by a perfect blackbody at the same temperature.
- LIR thermography is a beneficial device to monitor metabolism and blood flow in a non-invasive test that can be performed bedside with minimal patient and ambient surrounding preparation. It uses the scientific principles of energy, heat, temperature and metabolism. Through measurement and interpretation of thermal energy, it produces images that will assist clinicians to make a significant impact on wound care (prevention, early intervention and treatment) through detection.
- the improvement comprising: means for increasing and decreasing pixel value brightness by adding a positive or negative offset to the raw pixel value.
- One embodiment of the present invention is in the method of grayscale digital thermographic imaging of abnormalities of the skin and its subcutaneous tissues, the improvement comprising methods and apparatus for defining pixel intensity variations of a long-wave infrared image by measuring the thermal intensity ratio of the average of all pixel values from a skin abnormality region to the average of all pixel values from unaffected skin regions.
- Another embodiment of the present invention is in the method of grayscale digital thermographic imaging of abnormalities of the skin and its subcutaneous tissues, the improvement comprising methods and apparatus for maintaining the separation of a thermographic imager from skin at a set distance by converging two light beams emanating from the imager at a point that is the set distance for the imager to be from skin.
- Another embodiment of the present invention is in the method of grayscale digital thermographic imaging of abnormalities of the skin at its subcutaneous tissues, the improvement comprising methods and apparatus for obtaining the linear length and width measurements of abnormalities and their square area.
- Another embodiment of the present invention is in the method of grayscale digital thermographic imaging of the skin and its subcutaneous tissues, the improvement comprising methods and apparatus for highlighting the digital thermographic image of an area of skin to be measured and calculating the area of the highlighted portion of the image in square centimeters by determining the total number of pixels highlighted.
- Another embodiment of the present invention is in the method of grayscale digital thermographic imaging of the skin and its subcutaneous tissues, the improvement comprising methods and apparatus for encircling an area of interest and generating a histogram of the encircled area to project the distribution of pixel values therein.
- Another embodiment of the present invention is in the method of grayscale digital thermographic imaging of the skin and its subcutaneous tissues, the improvement comprising methods and apparatus for plotting profile lines in or through an area of skin that is of interest and comparing it with a corresponding profile line of normal skin.
- FIG. 1 Medical long-wave infrared (LIR) and visual views compared.
- FIG. 2 Thermal span with default configuration settings.
- FIG. 2.1 Effect of adding a positive offset on the thermal span.
- FIG. 2.2 Effect of adding a negative offset on the thermal span.
- FIG. 2.3 Thermal image of a hand taken with default settings.
- FIG. 2.4 Thermal image of the hand when a positive offset is added.
- FIG. 3 Normal and abnormal selections made from a thermal image and the corresponding results.
- FIG. 4 An original image (left side) and thermal image (right side—zoomed in) with abnormal selections made.
- FIG. 5 Schematic representing pixel intensity recognition (zoomed).
- FIG. 6 Diagram of laser lights implementation.
- FIG. 7 Experimental setup used to determine digital camera and long-wave infrared microbolometer angels of inclination.
- FIG. 8 An embodiment of laser lights at an 18 inch distance.
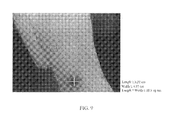
- FIG. 9 Length and width measurements form an area of interest.
- FIG. 10 Schematic representing pixel intensity recognition (zoomed.)
- FIG. 11 Periwound region including the wound base highlighted as area of interest and the results obtained for the area selected.
- FIG. 12 Area including normal, periwound and the wound base regions highlighted as area of interest and the corresponding results obtained for the area selected.
- FIG. 13.1 Wound histograms.
- FIG. 13.2 Normal histograms.
- FIG. 14 Profile line showing the variation in the grayscale values along the line drawn over an area of interest.
- FIG. 15.1 Comparing the Profile Line with the Reference Line.
- FIG. 16 Figure illustrating the formula for calculating area under the curve.
- FIG. 17 Calculating areas above and below the selected normal.
- FIG. 18 Profile Line drawn through three fingers.
- FIG. 19 A Profile Line plot on a graph.
- Thermal images taken of the skin surface are constructed by passively reading emitted radiant energy formed by the subcutaneous tissue and the skin tissue by detecting wavelengths in the long-wave infrared range (LIR) of 7-14 microns, and then in real time converting these values into pixels within a digital image.
- the value assigned to the pixel indicates the thermal intensities of a particular area of the skin when imaged.
- the thermal images in this embodiment are presented in digital unsigned (not having a plus or minus sign) 8-bit grayscale with pixel values ranging from 0-254, however these same techniques work with images of varying color resolutions. These images could be stored in the data bank along with the information about the data the image has captured so that it can be retrieved by a clinician for future review and analysis.
- the unaffected skin thermal intensity will be a uniform gray color within a range of +/ ⁇ 3 to 6 pixel values, which is equal to 0.25 to 0.5 degrees centigrade.
- Abnormally hot areas of the skin will be represented by patches of increasingly white pixels, while abnormally cold areas will be represented by increasingly dark patches of pixels.
- LIR (7-14 microns) imaging along with visual digital imaging allows both physiologic (long-wave infrared and visual) and anatomic assessment of skin and subcutaneous tissue abnormalities and or existing open wounds.
- the gradiency of the thermal intensity is the important component of the long-wave thermal image analysis that will allow the clinician to evaluate pathophysiologic events. This capability is beneficial to the clinician in the prevention, early intervention and treatment assessments of a developing existing condition caused by, but not exclusively, wounds, infection, trauma, ischemic events and autoimmune activity.
- the imager utilizes the raw data captured by the microbolometer. This data is utilized in determining pixel values relating to the intensity of the thermal energy from the long-wave infrared electromagnetic radiation spectrum being emitted by the human body.
- the pixel gradient intensities are represented for visualization by the grayscale presentation.
- the pixel values in the grayscale thermal images also vary with the varying conditions mentioned above and hence the algorithms proposed in this application use the average pixel value of the unaffected skin region for that patient on the day the image was taken as a reference point for all the calculations.
- LIR thermal intensity regions of the human body There is a difference in the LIR thermal intensity regions of the human body.
- LIR images have a defined pixel intensity range that is based on the specific usage of an LIR image. In the arena of skin and subcutaneous tissue LIR thermal gradiency, the range is within homeostasis requirements to sustain life.
- the visualization of pixel intensities is accomplished by the use of a standardized 8-bit grayscale. Black defines cold, gray tones define cool and/or warm and white defines hot. When the imager is used for capturing extremely hot or extremely cold regions that fall outside the thermal range of the imager the pixel values reach the saturation point and it becomes extremely difficult for the human eye to differentiate variations in the pixel values.
- This situation can be addressed by utilizing a visualization technique that increases the pixel values to create a positive offset to make the image look brighter. In the same manner a negative offset can be used to decrease the pixel values to make the image look darker.
- the positive and negative offset can be utilized to assist in visualizing the area of the body being imaged.
- the usage of the offsets can then be documented as being used at the time the image is initially taken.
- the default gray tone that represents the actual pixel values is the raw data being stored in the data bank so future analysis can be performed by clinicians at a later time and/or in another location.
- the default grayscale data is accompanied by documentation of the use of either the positive or negative offset process. This allows for enhanced visualization of black and white extremes in the grayscale image. The goal is to visually enhance the image at either the lower or higher side of the thermal intensity range without altering the original image.
- the thermal imager could be configured to capture the thermal intensity variation information within a certain range of thermal intensity. Configuration settings were carefully chosen such that they capture all thermal intensity variations between 19° C. (66.2° F.) to 40.5° C. (104.9° F.), which covers most of the human body's physiologic thermal intensity range.
- the thermal intensity of an area of interest gets close to 19° C. (66.2° F.)
- the pixel values in the grayscale thermal image appear darker and reach a low saturation point.
- the thermal intensity drops below 19° C. (66.2° F.) the thermal image would still appear dark but would not get any darker as the low saturation point has already been reached.
- the thermal intensity of an area of interest starts increasing, the thermal image starts looking brighter.
- the thermal image reaches the high saturation point and the pixel values in the grayscale image reach the maximum value.
- the thermal intensity goes beyond 40.5° C. (104.9° F.), even though the thermal intensity of the area of interest is increasing, the thermal image would not appear any brighter as the high saturation point has been reached.
- thermographic imager can pick up thermal intensities as low as 19° C. (66.2° F.) the grayscale thermal image for an area of interest at that thermal intensity would appear too dark.
- the human eye is not able to visualize the variation of the 254 pixel values included in the standardized grayscale. This might cause problems when thermographic images are taken on areas of the human body with decreased microcirculation, (i.e., the fingers, toes, etc.) or areas with cartilage (i.e., the tip of the nose, ear, etc.). These body locations are usually the coldest on the skin surface thermal intensity and would appear darker in the thermal images.
- a novel technique has been developed to increase or decrease the brightness of the pixel values by adding a positive or negative offset to the raw pixel values.
- the positive or negative offset allows an enhanced visualization of the black or white extremes in a grayscale image.
- the goal here is to visually enhance the image at either the lower or higher end of the thermal intensity range without altering the original image.
- the thermal intensity range picked up by the thermal imager was as illustrated in FIG. 2 .
- a low saturation grayscale value of 1 was reached at 19° C. (66.2° F.) and the high saturation grayscale value of 254 was reached at 40.5° C. (104.9° F.), giving a thermal span of 21.5 degrees.
- the maximum resolution is then 0.0846° C. with in the image.
- the image appears brighter and reaches the high saturation value at a thermal intensity lower than the high saturation thermal intensity obtained with default settings.
- the imager reached the high saturation thermal intensity at 39° C. (102.2° F.) instead of 40.5° C. (104.9° F.), as obtained with default settings.
- FIG. 2.1 shows the thermal intensity range that is detected when a positive offset is added to the default pixel value configuration setting.
- the thermal span is reduced to 20 degrees instead of 21.5 degrees as obtained with default settings when a positive offset was added.
- the maximum resolution increased to 0.0855° C. which gives more definition to the pixels within the image.
- FIG. 2.2 shows the effect of adding a negative offset on the thermal intensity range that could be picked up by the thermal imager.
- the thermal span is reduced to 19 degrees giving a maximum resolution of 0.0855° C. within the image.
- FIG. 2.3 shows a thermal image of a hand taken with default settings.
- FIG. 2.4 shows an example of the effect on the thermal image when a positive offset is added to the pixel values at default settings to improve the visualization of the image.
- an inventive technique that measures the thermal intensity ratio. This gives the clinician the ability to look at the images captured with the thermal imager and choose pixel points in the image utilizing non-zoomed and zoomed presentations of the image that represent skin and subcutaneous tissue surrounding the area of interest. The clinician also has the ability to select the tissue in which an injury/wound exists as shown in FIGS. 3 and 4 .
- the zoomed capability allows the clinician to be very precise in the selection of the pixels used to measure thermal intensity.
- the zoomed feature is particularly useful because of the complexity of various wound types.
- the wound base and periwound can be disorganized (acute and chronic condition, etc.), organized (wound resurfacing or repairing, etc.), and/or infected (wound base infection with and without periwound cellulitis, etc.).
- FIG. 3 shows a non-zoomed thermal image with unaffected and abnormal selections.
- the ‘X’ marks represent the unaffected skin, the asterisk symbol represents the wound base and the circle marks represent the periwound.
- FIG. 4 shows an original and zoomed thermal image with abnormal selections.
- the table in the image shows selected points on the thermal image with their corresponding grayscale values.
- FIG. 5 shows a schematic representing pixel intensity recognition (zoomed).
- Pixels with uniform gray color represent the unaffected skin and subcutaneous tissue. If the pixel value is too high then it can be an indication of an infection developing in that area.
- the wound base is usually colder than the unaffected skin's thermal intensity and is represented with darker pixels on a thermal image.
- the pixel values for a periwound area are usually higher than the wound base pixel value and less than the pixel value associated with the unaffected tissue as their thermal intensity falls between the unaffected skin thermal intensity and the wound base thermal intensity.
- Wound base to unaffected ratio (Average of all the pixel values from the wound base region)/(Average of all the pixel values from the unaffected region)
- Wound base regions are usually colder than the unaffected skin thermal intensity, causing the pixel values for the wound base regions to be lesser than the pixel values for the unaffected skin regions in an LIR image.
- the wound base to unaffected ratio is less than 1, it is an indication that the wound base is colder than the unaffected regional tissue. If the ratio is greater than 1, it is an indication that the wound base area is hotter than the regions selected as unaffected skin area. In summary, the closer the value gets to 1, the closer the wound base area is getting to unaffected skin.
- the periwound to unaffected ratio is less than 1, it indicates that the periwound is colder than the unaffected skin area. If the ratio is greater than 1, it is an indication that the periwound area is hotter than the regions selected as unaffected skin area. In summary, the closer the value gets to 1, the closer the periwound area is getting to unaffected skin.
- Periwound to Wound Base Ratio (Average of all the pixel values from the periwound region)/(Average of all the pixel values from the wound base region)
- the ratio greater than 1 indicates that the periwound region is hotter than the wound base region and the ratio less than 1 indicates that the wound base region is hotter than the periwound region.
- the closer the ratio gets to 1 the closer the wound base and periwound values get to each other.
- Thermal and visual cameras are used for capturing images of areas of interest, such as wounds in a real time fashion (i.e., bedside or outpatient clinic). Cameras are built so that they can communicate with computer via a USB connection and capture both visual and thermal images by clicking the trigger button on the camera.
- the antenna method was replaced with a more sophisticated method using ultrasonic sound waves.
- An ultrasonic transducer placed on the camera core would release ultrasonic sound waves for transmission in the desired path and when these waves hit the target, which would be the body part in our case, and ultra sonic sound waves would be reflected back from the target in the transmission path.
- the received ultrasonic sound waves can then be converted into an electrical signal that can be processed by a processor to provide distance information.
- the distance can be computed by using the time period from the middle time value of the received electrical signal to the middle time value of the transmitted signal. Whenever this distance equals the standard distance of 18 inches a reduced audible noise will be generated, indicating that the camera is ready to capture an image.
- Limitations of using the ultrasonic method included the complexity of wiring and the size of the apparatus used for measuring the distance and then displaying it so that the end user can see how far the camera is from the target.
- the other major limitation arose with the presence of an object in between the camera and the target. When there is an object in the path, part or all of the waves will be reflected back to the transmitter as an echo and can be detected through the receiver path. It is difficult to make sure that the received ultrasonic sound waves were actually reflected by the target and not by any other object in the path.
- the ultrasonic measuring of the distance was replaced with the use of two Class I Laser LED lights.
- Two Class I A, or of less strength, lasers and/or LED modified lights are used in this method. These lasers emit narrow light beams as opposed to diffused light. They are placed on either side of the camera lens. When the distance between the camera and the target is less than 18 inches the lights coming from these lasers fall on the target as two spots separated by a distance and this distance will keep decreasing as the camera is moved toward from the target. When the distance between the camera and the target equal 18 inches the lights from these two light sources will coincide, indicating that the focus point has been achieved and that the camera is ready for capturing images. The distance between the two light beams starts increasing again when the distance between the camera and the target increases to the standard 18 inches.
- FIG. 6 explains the above embodiment in more detail, where IFR represents the long-wave infrared microbolometer and D represents the visual digital camera, and L represents the laser lights.
- the digital camera ‘D’ is also going to be placed at around 1.5 inches away from the long-wave infrared microbolometer and in order to make both the digital and the long-wave infrared microbolometer to have the same focus point and field of view the digital camera needs to be inclined at an angle.
- FIG. 8 is a representation of an embodiment that uses 18 inches as the desired distance in a clinical setting. By changing the angles of the Class 1 Lasers this distance can be increased or decreased to meet other needs or requirements determined by the clinician.
- the imager has been designed such that the separation distance between the imager and the target is always maintained at 18 inches.
- Several techniques like using a measuring tape, using ultrasound and using Class 1 lasers have been tried and tested to date to maintain this standard distance.
- the final version of the imager makes use of two Class 1 lasers mounted inside the imager at an angle such that the laser beams emitted from these two lasers always converge at 18 inches from the front of the camera.
- MDS Minimum Data Set
- FIG. 9 shows the length and width measurement in centimeters obtained for an image with an area of interest on a heel.
- a novel technique has been developed that gives the clinician the ability to highlight a wound base, periwound or unaffected regions and to measure the area in square centimeters. This will assist the clinician in looking at the overall status of the wound, and evaluating its progression or regression.
- the total number of pixels enclosed within the highlighted area could be used for calculating the area of the region selected.
- test target of size 1.5 inch ⁇ 1.5 inch was used. With the imager at 18 inches from the test target, images were captured.
- Periwound area represents the area surrounding the wound base. By highlighting the area that includes the wound base and the periwound area surrounding it as shown in FIG. 11 , and by counting the number of pixels enclosed in that region, the area of the highlighted region could be calculated in square centimeters. The periwound area could then be obtained by subtracting the wound base area from the area that includes both the periwound and the wound base areas.
- the unaffected area By including the unaffected skin and subcutaneous tissue surrounding the wound in the highlighted area of interest, the unaffected area could be calculated in square centimeters. The unaffected area could then be obtained by subtracting the wound base and periwound area from the region selected that includes unaffected, periwound and the wound base areas.
- FIG. 12 below shows the calculations displaying the highlighted unaffected area and the various calculations obtained from the highlighted regions.
- a histogram can be generated to provide graphical representation of distribution of pixel values within that area.
- Bin number Pixel value ⁇ Minimum value/Bin Size Increment the value of the array at the index [Bin number ⁇ 1], since arrays are zero based, by one. Repeat the steps 5-7 for all the pixels in an image After checking all the pixels in an image, plot the array to generate a histogram. Clinical Significance of Histograms
- Distribution of pixel values as projected by the histograms for a highlighted area of interest provides more in depth information about the signature of a wound. If the histogram plot is more spread out it indicates there is a large variation in the pixel values and hence temperatures within the highlighted area as shown in FIG. 13 . As the plot starts getting more and more narrow it is an indication that all the pixels inside the highlighted portion are getting close to each other and the temperature inside the highlighted portion is starting to get saturated towards a single temperature value. If the saturation occurs at a higher pixel value then it is an indication that all the pixels inside the highlighted portion are getting very hot compared to the selected normal reference point. Similarly if the saturation occurs at a very low pixel value then all the pixels inside the highlighted area are getting very cold.
- FIG. 13 shows some sample histograms generated for an image with a highlighted area of interest.
- a novel feature has been developed to assist a trained clinician to better track a wound by utilizing the ability to plot profile lines through the wound. These plots show the variation in the pixel values across the wound. Since the thermal intensity is directly related to the grayscale pixel values in an image, these plots can be used to monitor how the thermal intensity is varying across an area of interest or wound. This allows the clinician to dissect the wound in precise fashion so the pathophysiologic status of the wound can be assessed and quantified.
- Profile lines can be plotted by simply drawing a line across the area of interest.
- FIG. 14 below shows an example of the profile line generated by drawing a line across the wound present on the heel. As seen in the plot there is a huge drop in the pixel value/thermal intensity across the wound base region and the value starts increasing as the line is moving away from the wound base and entering areas with unaffected skin tissue.
- the difference between the pixel value for the unaffected tissue and the pixel value from the wound base starts decreasing and hence the drop seen in the graph starts decreasing indicating that the wound is healing and is starting to get close to the unaffected skin tissue.
- Pixel_values(1) pixel value of the image at the location x1, y1
- Images taken using a thermal imaging camera can be analyzed and tracked to monitor the status of wounds.
- Profile lines provide a tool for monitoring variations in pixel values and hence the temperatures across the abnormal areas of interest. These variations can be compared against the pixel value representing unaffected region for that patient by selecting a region on the image that represents unaffected skin.
- a circle can be drawn on the image that comprises of only the unaffected pixels and does not include any abnormalities or the background.
- the status of the area of interest can be tracked. As the profile line gets closer to the reference line it indicates that the area of interest is improving and is getting closer to the normal skin characteristics.
- the portions below the reference line represent the segments of the profile line where the pixel values are lower (colder) than the selected normal reference point.
- the points falling above the reference line represent the portion of the profile that is hotter than the selected normal reference.
- the area calculations also give a measure of the portion of the profile line that falls above or below the normal reference line.
- the area that falls above the reference line indicates the regions that have a pixel value higher that the reference point and hence are at a higher temperature.
- the area below the reference line shows the portion of the profile line that has temperatures lower than the selected reference.
- the areas can be calculated using the Trapezoidal rule of calculating area under the curve.
- n is the number of equal length subintervals into which the region [b1, b2] is divided into.
- area for region 3 ⁇ b2 b f3(x) where f3(x) defines the curve in region 3
- the area for this region would be negative indicating that it falls below the normal line.
- Percentage of profile line that falls above the reference line (Number of pixels that fall above the reference line)*100/Total number of pixels across the profile line
- Percentage of profile line that falls below the reference line (Number of pixels that fall below the reference line)*100/Total number of pixels across the profile line
- Percentage of profile line that falls along the reference line (Number of pixels that fall on the reference line)*100/Total number of pixels across the profile line
- Maximum drop below the reference line can be calculated as the maximum negative difference in the pixel values between the profile line and the reference line. An increase in the maximum drop indicates that the pixels on the profile line are colder than the average reference pixel value.
- FIG. 15.2 shows a slope line plotted on to the profile line with a slope variance of 12.
- All the activity done by the clinician on the images can be recorded and saved in a database.
- the information can be retrieved on a later date to see which regions were selected as area of interest on that particular day, and to see what changes have occurred and how the results have changed with time.
- This novel approach will enable a trained clinician to better evaluate the area of interest/wound of the skin and subcutaneous tissue in a standardized and reproducible format.
- a profile line plot can be generated using the algorithm outlined above. The plot can then be used to determine where on the profile line a drop or rise in the pixel value (temperature) occurs.
- the profile line plot can be made interactive so that when the user clicks on the plot the corresponding location on the image can be highlighted and hence making it easier to interpret.
- the algorithm for implementing this can be briefly summarized as follows:
- FIG. 18 shows a profile line drawn on the image of a hand and FIG. 19 shows the profile line plot.
- the X mark on the graph and the image indicates the user's selected point.
Landscapes
- Health & Medical Sciences (AREA)
- Life Sciences & Earth Sciences (AREA)
- Engineering & Computer Science (AREA)
- Physics & Mathematics (AREA)
- Medical Informatics (AREA)
- General Health & Medical Sciences (AREA)
- Surgery (AREA)
- Biomedical Technology (AREA)
- Molecular Biology (AREA)
- Pathology (AREA)
- Animal Behavior & Ethology (AREA)
- Biophysics (AREA)
- Public Health (AREA)
- Veterinary Medicine (AREA)
- Heart & Thoracic Surgery (AREA)
- Theoretical Computer Science (AREA)
- Computer Vision & Pattern Recognition (AREA)
- General Physics & Mathematics (AREA)
- Dermatology (AREA)
- Nuclear Medicine, Radiotherapy & Molecular Imaging (AREA)
- Radiology & Medical Imaging (AREA)
- Quality & Reliability (AREA)
- Measuring And Recording Apparatus For Diagnosis (AREA)
Abstract
Description
-
- 1. Basal Rate of Metabolism (ROM) of all cells of the body.
- 2. Extra ROM caused by muscle activity including shivering.
- 3. Extra ROM caused by the effect of thyroxine and other hormones to a less extent (i.e.: growth hormone, testosterone).
- 4. Extra ROM caused by the effect of epinephrine, norepinephrine, and sympathetic stimulation on the cells.
- 5. Extra ROM caused by increased chemical activity in the cells themselves, especially when the cell temperature increases.
- 1. Vasodilation of all blood vessels, but with intense dilation of skin blood vessels that can increase the rate of heat transfer to the skin eight fold.
- 2. Sweating can remove 10 times the basal rate of body heat with an additional 1° C. increase in body temperature.
- 3. Decrease in heat production by inhibiting shivering and chemical thermogenesis.
Temperature Increasing Mechanisms: - 1. Skin vasoconstriction throughout the body.
- 2. Increase in heat production by increasing metabolic activity.
-
- i. 4 to 5 times increase
-
- i. Adults 10-15% increase
- ii.
Infants 100% increase
Thermal Span (Thermal intensity range picked up by an imager)=(Thermal intensity at which the pixels reach the high saturation value)−(Thermal intensity at which the pixels reach the low saturation value):
Maximum resolution=(High saturation temperature−Low saturation temperature)/Resolution of the gray scale image
For an 8-bit grayscale image the resolution is fixed at 254 parts.
Adding a Positive Offset (Example of Use)
Wound base to unaffected ratio=(Average of all the pixel values from the wound base region)/(Average of all the pixel values from the unaffected region)
Periwound to unaffected ratio=(Average of all the pixel values from the periwound region)/(Average of all the pixel values from the unaffected region)
Periwound to wound base ratio=(Average of all the pixel values from the periwound region)/(Average of all the pixel values from the wound base region)
Length (or width) in pixels=√{square root over ((x2−x1)2+(y2−y1)2)}
Length (or width) in inches=Length in pixels/40
Length (or width) in centimeters=Length in pixels/15.7480
Area in square centimeters for the highlighted region=(Y×14.5161)/3600
| TABLE 1 |
| Summarizing the results obtained from the highlighted normal, |
| periwound, and wound base regions |
| Normal | Periwound | Wound Base | |
| Area in sq. cm | 29.03 | 16.66 | 7.71 |
| Average pixel value | 125.17 | 103.82 | 61.09 |
| Minimum and | [Various range] | [Various range] | [Various range] |
| maximum pixel | |||
| values | |||
Average pixel value=Sum of pixel values for all the pixels that fall inside the highlighted area of interest/Total number of pixels falling inside the highlighted area
Bin size=Maximum value−Minimum value/Total number of bins
Bin number=Pixel value−Minimum value/Bin Size
Increment the value of the array at the index [Bin number−1], since arrays are zero based, by one.
Repeat the steps 5-7 for all the pixels in an image
After checking all the pixels in an image, plot the array to generate a histogram.
Clinical Significance of Histograms
-
- y1=round (y1+y_increment)
Create a new counter variable, let us call it ‘i’
i=1;
While ((i<L) && (x1, y1 fall within the size of the image) - Pixel_values (i+1)=pixel value of the image at the location x1, y1;
- x1=round (x1+x_increment);
- y1=round (y1+y_increment);
- i=i+1;
End
The array ‘Pixel_values’ should contain values of all the pixels that represent the profile line Plotting the values in the array ‘Pixel_values’ gives the plot for the profile line drawn across the area of interest (as shown in the figure above).
- y1=round (y1+y_increment)
Average Normal pixel value=Sum of all the pixels that fall inside the circle representing Normal/Total number of pixels inside the circle
Distance=√{square root over ((x2−x1)2+(y2−y1)2)}
where (x1, y1) represent the X and Y coordinates of the center of the circle and
Where Δx=(b−a)/n, x0=a, x1=a+Δx, x2=a+2Δx . . . xn=a+nΔx=b and ‘n’ is the number of equal length subintervals into which the region [a, b] is divided into.
Area for the
Where f1(x) defines the curve in
Δx=(b1−a)/n, x1=a+Δx, x2=a+2Δx . . . xn=a+nΔx=b1 and ‘n’ is the number of equal length subintervals into which the region [a, b1] is divided into.
Area for
Where f2(x) defines the curve in
Δx=(b2−b1)/n, x1=b1+Δx, x2=b1+2Δx . . . xn=b1+nΔx=b2 and ‘n’ is the number of equal length subintervals into which the region [b1, b2] is divided into.
Similarly area for
The area for this region would be negative indicating that it falls below the normal line.
Area above the Normal line can be obtained by adding areas under
Area below the Normal line=Area under the
Percentage of profile line that falls above the reference line=(Number of pixels that fall above the reference line)*100/Total number of pixels across the profile line
Percentage of profile line that falls below the reference line=(Number of pixels that fall below the reference line)*100/Total number of pixels across the profile line
Percentage of profile line that falls along the reference line=(Number of pixels that fall on the reference line)*100/Total number of pixels across the profile line
Average rise above the reference line=Sum of all the pixels that fall above the reference line/Total number of pixels that fall above the reference line
Average fall below the reference line=Sum of all the pixels that fall below the reference line/Total number of pixels that fall below the reference line
Slopes: Calculating slopes for the profile lines gives information about how often the temperature varies along the profile line. A slope line can be drawn on the profile line every time there has been a significant change in the pixel value (temperature). A positive slope indicates an increase in temperature and a negative slope indicates a drop in the temperature. The steepness of the slope lines indicates the amount of variation in temperatures. The steeper the lines the larger the variation is temperatures and the more irregular the profile line is.
Draw a line on the profile line joining these two points.
Slope for this line can be calculated as follows:
If (x1, y1) represents the x and y coordinates of the starting point and (x2, y2) represent the coordinates of the end point of the slope line then the slope for this line can be calculated as
Slope=(y2−y1)/(x2−x1)
Save this slope value in an array.
Make the end point of the first slope line as the start point for the next slope line to be generated and
Once the start and end points of the slope lines is established plot the slope line on to the profile line and then calculate and save the slope values.
Repeat the process until the end of profile line is reached
-
- 1. Generate an interactive plot for profile line using tools like Telerik
- 2. Create a chart item click event for the plot so that when the user clicks on the profile line plot the x and y values of the click point are recorded
- 3. The X axis value at the click point (saved as ‘index’) shows how far away the point falls from the start point of the profile line. The Y value gives the actual pixel value at the point.
- 4. To locate this point on the profile line drawn on the image, the actual X and Y coordinates on the image need to be determined. The X and Y coordinates of the click point can be obtained as follows:
- 5. Calculate the length of the profile line using the start and end coordinates of the profile line.
- 6. If (X1,Y1) represents the coordinates of the starting point of the profile line on the image and (X2,Y2) represent the end point then the length can be calculated as
- 7. length of the line=L=√{square root over ((X2−X1)2+(Y2−Y1)2)}
- 8. deltaX=absolute value of (X2−X1); deltaY=absolute value of (Y2−Y1)
- 9. x_increment=deltaX/L; y_increment=deltaY/L
- 10. if (x_increment>0 && y_increment<0)
- {
- index=L−index:
- }
- {
- 11. The X and Y coordinates of the point that represents the click point can then be obtained as
- X=X1+(index*x_increment); Y=Y1+(index*y_increment);
- 12. Draw a string on the image at the X and Y coordinates from the previous step to indicate the click point
Similar technique can be used to determine where a point on the image falls on the profile line. The algorithm for doing this can be outlined as follows: - 1. Add a Mouse down click event for the image.
- 2. Note the X and Y coordinates of the point where the user clicked on the image.
- 3. Check whether this point falls on the profile line
- 4. If the point falls on the profile line calculate the distance between the start point of the profile line and the point where the user clicked.
- 5. This distance indicates how far the point falls on the plot from the start point of the graph.
- 6. Draw on the graph to indicate this point.
Claims (12)
Priority Applications (15)
| Application Number | Priority Date | Filing Date | Title |
|---|---|---|---|
| US13/439,177 US9357963B1 (en) | 2011-04-04 | 2012-04-04 | Grayscale thermographic imaging |
| US14/577,571 US20170296064A9 (en) | 2012-04-04 | 2014-12-19 | Method of Monitoring The Status of A Wound |
| US14/601,513 US20170367589A9 (en) | 2012-04-04 | 2015-01-21 | Method of Detecting Potential Deep Tissue Injury |
| US14/876,535 US20160027172A1 (en) | 2012-04-04 | 2015-10-06 | Method of Monitoring the Status of a Wound |
| US14/876,485 US20170296065A9 (en) | 2012-04-04 | 2015-10-06 | Method of Monitoring the Status of a Wound |
| US14/984,855 US20160338594A1 (en) | 2011-04-04 | 2015-12-30 | Grayscale Thermographic Imaging |
| US14/984,346 US10169860B2 (en) | 2011-04-04 | 2015-12-30 | Grayscale thermographic imaging |
| US14/984,950 US20160213305A1 (en) | 2011-04-04 | 2015-12-30 | Grayscale Thermographic Imaging |
| US14/984,679 US20160213304A1 (en) | 2011-04-04 | 2015-12-30 | Grayscale Thermographic Imaging |
| US14/984,802 US20160225143A1 (en) | 2012-04-04 | 2015-12-30 | Grayscale Thermographic Imaging |
| US14/984,897 US10269112B2 (en) | 2012-04-04 | 2015-12-30 | Grayscale thermographic imaging |
| US15/726,399 US20180047162A1 (en) | 2012-04-04 | 2017-10-06 | Method of Monitoring the Status of a Wound |
| US15/727,729 US20180078147A1 (en) | 2012-04-04 | 2017-10-09 | Method of Monitoring the Status of a Wound |
| US16/233,082 US20190231195A1 (en) | 2012-04-04 | 2018-12-26 | Method of Detecting Potential Deep Tissue Injury |
| US16/255,743 US20190167117A1 (en) | 2011-04-04 | 2019-01-23 | Method of Monitoring the Status of a Wound |
Applications Claiming Priority (2)
| Application Number | Priority Date | Filing Date | Title |
|---|---|---|---|
| US201161516459P | 2011-04-04 | 2011-04-04 | |
| US13/439,177 US9357963B1 (en) | 2011-04-04 | 2012-04-04 | Grayscale thermographic imaging |
Related Parent Applications (1)
| Application Number | Title | Priority Date | Filing Date |
|---|---|---|---|
| US14/577,571 Continuation-In-Part US20170296064A9 (en) | 2011-04-04 | 2014-12-19 | Method of Monitoring The Status of A Wound |
Related Child Applications (11)
| Application Number | Title | Priority Date | Filing Date |
|---|---|---|---|
| US14/577,571 Continuation-In-Part US20170296064A9 (en) | 2011-04-04 | 2014-12-19 | Method of Monitoring The Status of A Wound |
| US14/601,513 Continuation-In-Part US20170367589A9 (en) | 2012-04-04 | 2015-01-21 | Method of Detecting Potential Deep Tissue Injury |
| US14/876,485 Continuation-In-Part US20170296065A9 (en) | 2011-04-04 | 2015-10-06 | Method of Monitoring the Status of a Wound |
| US14/876,535 Continuation-In-Part US20160027172A1 (en) | 2012-04-04 | 2015-10-06 | Method of Monitoring the Status of a Wound |
| US14/984,897 Division US10269112B2 (en) | 2012-04-04 | 2015-12-30 | Grayscale thermographic imaging |
| US14/984,855 Division US20160338594A1 (en) | 2011-04-04 | 2015-12-30 | Grayscale Thermographic Imaging |
| US14/984,346 Division US10169860B2 (en) | 2011-04-04 | 2015-12-30 | Grayscale thermographic imaging |
| US14/984,802 Division US20160225143A1 (en) | 2012-04-04 | 2015-12-30 | Grayscale Thermographic Imaging |
| US14/984,679 Division US20160213304A1 (en) | 2011-04-04 | 2015-12-30 | Grayscale Thermographic Imaging |
| US14/984,950 Division US20160213305A1 (en) | 2011-04-04 | 2015-12-30 | Grayscale Thermographic Imaging |
| US16/233,082 Continuation-In-Part US20190231195A1 (en) | 2012-04-04 | 2018-12-26 | Method of Detecting Potential Deep Tissue Injury |
Publications (1)
| Publication Number | Publication Date |
|---|---|
| US9357963B1 true US9357963B1 (en) | 2016-06-07 |
Family
ID=56082951
Family Applications (4)
| Application Number | Title | Priority Date | Filing Date |
|---|---|---|---|
| US13/439,177 Active 2034-04-14 US9357963B1 (en) | 2011-04-04 | 2012-04-04 | Grayscale thermographic imaging |
| US14/984,855 Abandoned US20160338594A1 (en) | 2011-04-04 | 2015-12-30 | Grayscale Thermographic Imaging |
| US14/984,950 Abandoned US20160213305A1 (en) | 2011-04-04 | 2015-12-30 | Grayscale Thermographic Imaging |
| US14/984,679 Abandoned US20160213304A1 (en) | 2011-04-04 | 2015-12-30 | Grayscale Thermographic Imaging |
Family Applications After (3)
| Application Number | Title | Priority Date | Filing Date |
|---|---|---|---|
| US14/984,855 Abandoned US20160338594A1 (en) | 2011-04-04 | 2015-12-30 | Grayscale Thermographic Imaging |
| US14/984,950 Abandoned US20160213305A1 (en) | 2011-04-04 | 2015-12-30 | Grayscale Thermographic Imaging |
| US14/984,679 Abandoned US20160213304A1 (en) | 2011-04-04 | 2015-12-30 | Grayscale Thermographic Imaging |
Country Status (1)
| Country | Link |
|---|---|
| US (4) | US9357963B1 (en) |
Families Citing this family (5)
| Publication number | Priority date | Publication date | Assignee | Title |
|---|---|---|---|---|
| WO2007043899A1 (en) | 2005-10-14 | 2007-04-19 | Applied Research Associates Nz Limited | A method of monitoring a surface feature and apparatus therefor |
| US9179844B2 (en) | 2011-11-28 | 2015-11-10 | Aranz Healthcare Limited | Handheld skin measuring or monitoring device |
| US10013527B2 (en) | 2016-05-02 | 2018-07-03 | Aranz Healthcare Limited | Automatically assessing an anatomical surface feature and securely managing information related to the same |
| US11116407B2 (en) | 2016-11-17 | 2021-09-14 | Aranz Healthcare Limited | Anatomical surface assessment methods, devices and systems |
| EP4183328A1 (en) * | 2017-04-04 | 2023-05-24 | Aranz Healthcare Limited | Anatomical surface assessment methods, devices and systems |
Citations (1)
| Publication number | Priority date | Publication date | Assignee | Title |
|---|---|---|---|---|
| US20050033145A1 (en) * | 2003-07-02 | 2005-02-10 | Graham John S. | Wearable tissue viability diagnostic unit |
Family Cites Families (5)
| Publication number | Priority date | Publication date | Assignee | Title |
|---|---|---|---|---|
| US7277744B2 (en) * | 1999-03-22 | 2007-10-02 | Schaefer Allan L | Early detection of inflammation and infection using infrared thermography |
| US7760927B2 (en) * | 2003-09-10 | 2010-07-20 | Bioimagene, Inc. | Method and system for digital image based tissue independent simultaneous nucleus cytoplasm and membrane quantitation |
| JP3938120B2 (en) * | 2003-09-17 | 2007-06-27 | ノーリツ鋼機株式会社 | Image processing apparatus, method, and program |
| US9117133B2 (en) * | 2008-06-18 | 2015-08-25 | Spectral Image, Inc. | Systems and methods for hyperspectral imaging |
| US20120078113A1 (en) * | 2010-09-28 | 2012-03-29 | Point of Contact, LLC | Convergent parameter instrument |
-
2012
- 2012-04-04 US US13/439,177 patent/US9357963B1/en active Active
-
2015
- 2015-12-30 US US14/984,855 patent/US20160338594A1/en not_active Abandoned
- 2015-12-30 US US14/984,950 patent/US20160213305A1/en not_active Abandoned
- 2015-12-30 US US14/984,679 patent/US20160213304A1/en not_active Abandoned
Patent Citations (1)
| Publication number | Priority date | Publication date | Assignee | Title |
|---|---|---|---|---|
| US20050033145A1 (en) * | 2003-07-02 | 2005-02-10 | Graham John S. | Wearable tissue viability diagnostic unit |
Also Published As
| Publication number | Publication date |
|---|---|
| US20160338594A1 (en) | 2016-11-24 |
| US20160213305A1 (en) | 2016-07-28 |
| US20160213304A1 (en) | 2016-07-28 |
Similar Documents
| Publication | Publication Date | Title |
|---|---|---|
| US10169860B2 (en) | Grayscale thermographic imaging | |
| US20190110740A1 (en) | System, apparatus and method for assessing wound and tissue conditions | |
| US20160213304A1 (en) | Grayscale Thermographic Imaging | |
| Jiang et al. | A perspective on medical infrared imaging | |
| Eriksson et al. | Non-invasive imaging of microcirculation: a technology review | |
| Costello et al. | The use of thermal imaging in assessing skin temperature following cryotherapy: a review | |
| Lahiri et al. | Medical applications of infrared thermography: a review | |
| US20120078113A1 (en) | Convergent parameter instrument | |
| Vardasca et al. | Current issues in medical thermography | |
| US20190167117A1 (en) | Method of Monitoring the Status of a Wound | |
| Haripriya et al. | Development of low-cost thermal imaging system as a preliminary screening instrument | |
| Ovechkin et al. | Thermovisual evaluation of acupuncture points | |
| Pereira et al. | Infrared thermography | |
| US20190231195A1 (en) | Method of Detecting Potential Deep Tissue Injury | |
| US20170367589A9 (en) | Method of Detecting Potential Deep Tissue Injury | |
| US20170296064A9 (en) | Method of Monitoring The Status of A Wound | |
| US7408156B2 (en) | System and method for identifying and classifying dynamic thermodynamic processes in mammals and discriminating between and among such processes | |
| US8233968B1 (en) | Method and apparatus for high resolution dynamic digital infrared imaging | |
| US20170296066A1 (en) | Method for quantifying wound infection using long-wave infrared thermography | |
| Agurto et al. | A thermoregulation model to detect diabetic peripheral neuropathy | |
| TWI689895B (en) | System and method for monitoring color change of skin under unstable light source | |
| US20190236775A1 (en) | Method of Monitoring the Status of a Wound | |
| Tkáčová et al. | Medical thermography application in neuro-vascular deseases diagnostics | |
| Steenackers et al. | Application of passive infrared thermography for DIEP flap breast reconstruction | |
| Ping | Development of a Noninvasive Optical and Thermographic Imaging Protocol for Identification of Pediatric Low Cardiac Output Syndrome |
Legal Events
| Date | Code | Title | Description |
|---|---|---|---|
| AS | Assignment |
Owner name: WOUNDVISION, LLC, INDIANA Free format text: ASSIGNMENT OF ASSIGNORS INTEREST;ASSIGNORS:SPAHN, JAMES G.;NUGURU, KADAMBARI;REEL/FRAME:027987/0545 Effective date: 20110407 |
|
| STCF | Information on status: patent grant |
Free format text: PATENTED CASE |
|
| MAFP | Maintenance fee payment |
Free format text: PAYMENT OF MAINTENANCE FEE, 4TH YR, SMALL ENTITY (ORIGINAL EVENT CODE: M2551); ENTITY STATUS OF PATENT OWNER: SMALL ENTITY Year of fee payment: 4 |
|
| MAFP | Maintenance fee payment |
Free format text: PAYMENT OF MAINTENANCE FEE, 8TH YR, SMALL ENTITY (ORIGINAL EVENT CODE: M2552); ENTITY STATUS OF PATENT OWNER: SMALL ENTITY Year of fee payment: 8 |