US9210600B1 - Wireless network performance analysis system and method - Google Patents
Wireless network performance analysis system and method Download PDFInfo
- Publication number
- US9210600B1 US9210600B1 US13/607,485 US201213607485A US9210600B1 US 9210600 B1 US9210600 B1 US 9210600B1 US 201213607485 A US201213607485 A US 201213607485A US 9210600 B1 US9210600 B1 US 9210600B1
- Authority
- US
- United States
- Prior art keywords
- base transceiver
- metrics
- performance
- wireless communication
- average
- Prior art date
- Legal status (The legal status is an assumption and is not a legal conclusion. Google has not performed a legal analysis and makes no representation as to the accuracy of the status listed.)
- Expired - Fee Related, expires
Links
Images


Classifications
-
- H—ELECTRICITY
- H04—ELECTRIC COMMUNICATION TECHNIQUE
- H04W—WIRELESS COMMUNICATION NETWORKS
- H04W24/00—Supervisory, monitoring or testing arrangements
- H04W24/08—Testing, supervising or monitoring using real traffic
-
- H—ELECTRICITY
- H04—ELECTRIC COMMUNICATION TECHNIQUE
- H04W—WIRELESS COMMUNICATION NETWORKS
- H04W16/00—Network planning, e.g. coverage or traffic planning tools; Network deployment, e.g. resource partitioning or cells structures
-
- H—ELECTRICITY
- H04—ELECTRIC COMMUNICATION TECHNIQUE
- H04W—WIRELESS COMMUNICATION NETWORKS
- H04W24/00—Supervisory, monitoring or testing arrangements
- H04W24/04—Arrangements for maintaining operational condition
-
- H—ELECTRICITY
- H04—ELECTRIC COMMUNICATION TECHNIQUE
- H04W—WIRELESS COMMUNICATION NETWORKS
- H04W28/00—Network traffic management; Network resource management
- H04W28/02—Traffic management, e.g. flow control or congestion control
-
- H—ELECTRICITY
- H04—ELECTRIC COMMUNICATION TECHNIQUE
- H04W—WIRELESS COMMUNICATION NETWORKS
- H04W72/00—Local resource management
- H04W72/12—Wireless traffic scheduling
-
- H—ELECTRICITY
- H04—ELECTRIC COMMUNICATION TECHNIQUE
- H04W—WIRELESS COMMUNICATION NETWORKS
- H04W72/00—Local resource management
Definitions
- Cellular wireless communication networks provide nearly ubiquitous connectivity for mobile devices such as mobile phones, personal digital assistants, and wireless enabled laptop computers.
- cellular network operators build and maintain a large number of cell towers or cell sites.
- a large wireless network providing national coverage may comprise more than 50,000 cell sites.
- the quality of cellular communication service provided by cell sites depends on a number of different factors such as the number of subscribers in a coverage area of the cell site, the radio signal strength of the cell site, and the local environment including foliage. Because these factors change over time as seasons change and as population distributions change, it is a challenge for cellular network operators to evaluate the performance of their network and the quality of service provided to their customers.
- a system for managing a cellular wireless communication network comprises a cellular wireless communication performance data store, wherein the data store comprises cellular wireless communication performance metrics, wherein the performance metrics are segmented according to base transceiver stations.
- the system also comprises a computer and an application that is stored in a non-transitory memory of the computer.
- the application When executed by the computer, the application receives a selection of a plurality of base transceiver stations, retrieves metrics associated with the plurality of selected base transceiver stations from the cellular wireless communication performance data store, analyzes the metrics associated with the plurality of selected base transceiver stations, and identifies a low usage base transceiver station that is one of the plurality of selected base transceiver stations, wherein the low usage base transceiver station is associated with a usage that is less than a predefined usage threshold.
- the application further determines an average of an at least one metric based on the metrics of the plurality of selected base transceiver stations excluding the low usage base transceiver station, builds a presentation of the at least one metric against a time line and at least one of a weather event, a sports event, a public event, and an upgrade installation aligned to the same time line, and transmits the presentation, whereby a user may view the presentation in a display.
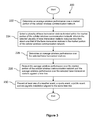
- a method of managing a cellular wireless communication network comprises providing a map of a portion of a cellular wireless communication network, wherein the map provides identification of base transceiver stations, receiving a designation of a geographical area, where the geographical area is located within the map, identifying a plurality of base transceiver stations located within the designated geographical area, accessing performance metrics associated with the identified base transceiver stations from a data store of metrics associated with the cellular wireless communication network, and analyzing the performance metrics of the identified base transceiver stations.
- the method further comprises presenting an average performance metric of the identified base transceiver stations based on the analyzing.
- determining an average performance metric of the identified base transceiver stations based on the analyzing, building a presentation of the average performance metric against a time line and at least one of a weather event, a sports event, a public event, or an upgrade installation aligned to the same time line, and transmitting the presentation, whereby a user may view the presentation in a display.
- a method of managing a cellular wireless communication network comprises determining an average wireless performance over a market portion of the cellular wireless communication network, selecting a plurality of base transceiver stations located within the market portion of the cellular wireless communication network, wherein the selected plurality of base transceiver stations comprise less than about one third of the base transceiver stations in the market portion of the cellular wireless communication network, determining an average wireless performance over the selected base transceiver stations, presenting the average wireless performance over the market portion of the cellular wireless communication network and the average wireless performance over the selected base transceiver stations against a time line, and presenting at least one of a weather event, a sports event, a public event, and an upgrade installation aligned to the same time line.
- FIG. 1 is a block diagram of a system according to an embodiment of the disclosure.
- FIG. 2 is a flow chart of a method according to an embodiment of the disclosure.
- FIG. 3 is a flow chart of another method according to an embodiment of the disclosure.
- FIG. 4 is a block diagram of a computer system according to an embodiment of the disclosure.
- a system for analyzing and presenting cellular communication network performance metrics and for ranking a plurality of market segments of the network relative to each other is taught herein.
- the system may take performance data out of isolated, possibly obscure or siloed locations and promotes sharing and presenting the data in a useful format among a large number of wireless service provider employees.
- the information may be used by customer service representatives to answer a customer question in real-time and to communicate effectively with the customer about their wireless communication experience.
- the information may promote the customer care representative being able to tell the customer what their communication experience will be on the day of his or her call and predict what the customer's communication experience will be tomorrow and the next day.
- the system may promote a market manager determining at a glance how his market segment of the cellular communication network performs relative to the performance of the market segments of his or her peer market managers.
- the system promotes selecting cell sites, determining an aggregate performance metric over the selected cell sites, and comparing the aggregate performance metric over the selected cell sites with a baseline performance metric. For example, cell sites that most often serve a service subscriber may be selected, an aggregate performance metric may be determined for those selected cell sites, and this aggregate performance metric may be compared to a baseline performance metric, for example an aggregate performance metric determined for a market segment of the cellular network.
- the performance of a cell site may be characterized using metrics such as a rate of dropped calls, a rate of blocked calls, a rate of evolution data only (EV-DO) failure, a rate of EV-DO dropped calls, a number of network fault alarms, a number of calls to customer care per 1000 subscribers, a number of trouble tickets, and other performance indicators.
- the performance metrics for a cell site may be determined for each of a plurality of radio sectors of the cell site, for example for each of three different sectors.
- a cell site summary metric may be calculated as a weighted sum of the several individual metrics and/or of the several individual metrics of each of the different sectors of the cell site.
- each metric may be multiplied by a predefined weighting factor or weighting coefficient and these products summed to determine the cell site summary metric.
- the cell site summary metric may be constrained to a defined range of values, for example from 0 to 1, from 0 to 10, from 1 to 10, or some other range of values.
- the cell site summary metric may take any valid value in the range of values, either integer values or non-integer values.
- a market performance metric may be calculated based on the cell site performance metrics of the cell sites located within the subject market.
- the market performance metric may be determined as the sum of each of the cell site performance metrics divided by the number of cell sites located within the subject market, for example an average value of the cell site performance metrics.
- the market performance metric may be determined as the mean of each of the cell site performance metrics.
- cell site summary metrics that are deemed unrepresentative of the market may be excluded from the determination of the market performance metric.
- cell site summary metrics that are deemed to have outlier values may be excluded.
- cell site summary metrics associated with a cell site that has only recently been commissioned and may not yet be calibrated or adjusted may be excluded from the determination of the market performance metric.
- the market performance metric may comprise additional performance related information, for example customer care calls per one thousand subscribers, a number of trouble tickets per one thousand subscribers, or other performance related information.
- the performance metrics of individual cell sectors, the performance metrics of cell sites, and the performance metrics of markets may be determined periodically, for example daily, weekly, or on some other periodic interval.
- the performance metrics may be displayed and compared in a variety of ways.
- Performance metrics of a cell sector may be compared with the performance metrics of the cell site or the performance metrics of the market in which the cell sector is located.
- the performance metrics of a selection of cell sites may be averaged and the averaged metrics of the selection of cell sites may be compared to the averaged performance metrics of a market.
- the metrics being compared may be presented as two dimensional plot of metrics versus time, to promote appreciating how the metrics may change over time.
- Scheduled events that may impact performance may be displayed with the plot of metrics and may cast light on why performance metrics experienced a transient but significant degradation.
- Other information may likewise by presented aligned to the same time line, for example weather event information, upgrade information, and other information.
- the market performance metric may be used to order or rank each of the markets of a wireless cellular communication network, for example a national network.
- the number of markets may be 10 or more.
- the number of markets may be 25 or more.
- the number of markets may be 50 or more.
- the number of markets may be 75 or more.
- the number of markets may be 90 or more.
- the market performance metrics may be used to compare the success of stake holders and/or market managers.
- the market performance metrics may be used to compare the efficiency of deployment of capital budgets by different market managers.
- the market performance metrics may be used to identify markets that should be budgeted additional capital for infrastructure improvements, for example cell site upgrades and/or construction of new cell sites.
- the system provides an interface or front-end for interacting with the performance metrics in a variety of different ways. For example, when a customer calls in to a care center to inquire about their cellular service, a care representative can request that the system determine and/or present the metrics associated with the cell site proximate to the customer's home, the cell site proximate to the customer's workplace, and/or a plurality of cell sites in a geographical area that the customer most commonly inhabits.
- the subject cell sites may be presented in a map view that features the different radio sectors of the cell sites. The map view may promote rapidly identifying a cell sector failure as a culprit in a sudden degradation of the wireless communication experienced by a customer.
- the map view may promote drilling down and discovering that a trouble ticket has been opened on the failed radio sector and that a work order has been issued to replace failed radio sector equipment within the day. Because the customer care representative is easily able to drill down and see trouble tickets associated to network resources, duplication of trouble tickets or opening of duplicate trouble tickets may be avoided.
- the system can aggregate the metrics associated with the selected cell sites and compare them to the market performance metric of the market that most closely covers the selected cell sites.
- the care representative may then be able to tell the customer that the cellular coverage they should be experiencing is above average for the market and that a coverage problem may be due to the mobile device used by the customer.
- the care representative may say that the selected cell site performance metrics are worse than average but that a cell site enhancement is planned for the subject cell site in the next month.
- the system may provide for excluding some cell sites from the designated area based on exceptions associated with the cell sites. For example, the cell sites may support very little traffic most of the time but be heavily loaded during Sunday mornings due to church services in a large church in the coverage area of the cell site.
- the system may access a schedule data store to promote determining if special events such as professional sports events or other events are responsible for unusual cell site performance metrics.
- the front-end of the system promotes a user inputting a threshold usage level and determining metrics based only over cell sites whose usage level meets or exceeds the threshold usage level.
- This function may be referred to as a slider. This function promotes making apples-to-apples type of comparisons or seeing how different cell sites and/or different markets perform under stressed and/or loaded conditions.
- system 100 comprises a performance analysis platform 102 , a metrics data store 104 , a trouble ticket data store 105 , a schedule data store 106 , and an upgrade data store 107 .
- the performance analysis platform 102 may be a computer system that executes one or more applications for cellular network communication performance metrics.
- the performance analysis platform 102 may execute a market rank analysis component 108 , a performance metrics average component 110 , a schedule analysis component 112 , a mapping support component 114 , and a front-end 115 .
- One skilled in the art will appreciate that the functionality provided by the components 108 , 110 , 112 , 114 , 115 may be combined into fewer components or partitioned among more components.
- the system 100 further comprises a network 116 and a plurality of users 118 .
- the network 116 comprises one or more private networks, one or more public networks, or a combination thereof. While the data stores 104 , 105 , 106 , 107 are illustrated in FIG. 1 as directly coupled to the performance analysis platform 102 , it is understood that the data stores 104 , 105 , 106 , 107 may be coupled to the analysis platform 102 via the network 116 .
- the users 118 interact with the performance analysis platform 102 via the front-end 115 .
- the users 118 may be computers such as personal computers, laptop computers, notebook computers, tablet computers, or other computers.
- the users 118 may represent web interfaces provided by the front-end 115 and accessed from computers, for example from web browsers executing on workstations, desktop computers, laptop computers, tablet computers, and the like.
- Different users 118 may be accorded different levels of access to the performance analysis functionality and/or performance metrics by the performance analysis platform 102 and/or the front-end 115 based on a user class, as described more fully below. Computers are discussed in more detail hereinafter.
- the performance analysis platform 102 may be employed to analyze and visualize the performance of a cellular wireless communication network at a variety of different levels of granularity, for example by using the front-end 115 of the performance analysis platform 102 .
- the cellular wireless communication network may comprise a large number of cell sites and/or base transceiver stations, for example more than 20,000 cell sites or more than 50,000 cell sites.
- the cellular wireless communication network may further comprise wired network resources such as mobile switches, home location register (HLR) servers, visitor location register (VLR) servers, media gateways, and other network nodes in a wired network that provide the network infrastructure to connect the mobile devices of subscribers to other mobile devices, other telephones, or to the Internet.
- HLR home location register
- VLR visitor location register
- the cell sites may provide radio communication links to mobile devices using one or more of a code division multiple access (CDMA) wireless protocol, a global system for mobile communications (GSM) wireless protocol, a long term evolution (LTE) wireless protocol, a worldwide interoperability for microwave access (WiMAX) wireless protocol, or an iDEN wireless protocol.
- CDMA code division multiple access
- GSM global system for mobile communications
- LTE long term evolution
- WiMAX worldwide interoperability for microwave access
- iDEN wireless protocol iDEN wireless protocol
- the metrics data store 104 may comprise a variety of data and/or metrics on radio sectors of cell sites and/or cell sites. For example, data and/or metrics about call drops, call blocks, network faults, evolution data only (EV-DO) drops, and other cell site performance related metrics may be stored in the metrics data store 104 . Some of the data and/or metrics about call drops and call blocks may be provided by probes stationed in the serving areas of cell towers. As known by one of ordinary skill in the art, a probe may be similar to a mobile phone and may attempt to originate calls. Unlike a mobile phone, the probe is operated automatically, collects metrics on blocks and drops, and provides this data back to the metrics data store 104 or other node in the service provider's network. Data collected from real mobile devices and data from probes may be distinguished and may promote presenting data associated with real mobile devices separately from data associated with probes.
- EV-DO evolution data only
- the metrics data store 104 may comprise data and/or metrics about data communication activities and data and/or metrics about voice communication activities.
- the metrics data store 104 may comprise data and/or metrics about short message service (SMS) communication activities.
- SMS short message service
- the metrics data store 104 may comprise data about how many voice calls or data sessions are handled by a base transceiver station or cell tower during different units of time, for example numbers of calls or sessions per hour, per day, per week, and/or per other unit of time.
- the metrics data store 104 may receive data and/or metrics updates, for example count updates, on a regular basis.
- the metrics data store 104 may store both raw counts of call drops, call blocks, network faults, and EV-DO drops as well as performance metrics derived from or calculated based on the raw counts.
- the raw counts may be periodically processed to derive call drop rates, call block rates, EV-DO drop rates, EV-DO call failure rates, network fault alarm rates, and other rate based performance metrics.
- the raw counts may be processed when an accumulation of unprocessed raw counts exceeds a predetermined threshold.
- the metrics may be determined at the cell sites and/or at a server in the wireless service provider network and written into the metrics data store 104 periodically or aperiodically.
- At least some of the rate based performance metrics may be determined as a percentage of opportunities, for example as a percentage of all calls attempted and/or as a percentage of all calls connected.
- the raw counts and the rate based performance metrics may be linked to or associated to a radio sector and/or cell site identity and a market identity.
- some rate based performance metrics may be determined by processing all counts accumulated over an hour, a day, a week, a month, or some other interval of time. Some counts may be processed to form per unit of time derived metrics for a plurality of different time units. For example, a raw data may be processed to derive each of a per hour count, a per day count, and a per week count. Some counts may be excluded from rate based performance metric calculations, for example counts accumulated on Mother's Day and/or holidays may be excluded as being non-representative of performance.
- the rate based performance metrics may be determined based on counts that accumulate during a peak usage period of time, for example during a weekday busy hour. In an embodiment, some rate based performance metrics may be determined for each of a plurality of different time periods. For example, a different blocked call rate may be determined for each of a morning period, an afternoon period, an evening period, and a late night period. For example, a blocked call rate may be determined for each hour of the day.
- a blocked call rate may be determined for weekends and a separate blocked call rate may be determined for weekdays.
- the rate based performance metrics may be determined or calculated periodically over the most recent time window. Alternatively, the rate based performance metrics may be determined or calculated after a predefined number of counts accumulate.
- the metrics data store 104 may contain information about cell site enhancements or capacity upgrades associated with the cell sites.
- the enhancements and/or capacity upgrades may be entered into the metrics data store 104 up to two years before the commissioning of the upgrades.
- the information about cell site enhancements and/or capacity upgrades may be stored in another data store or accessed by the performance analysis platform 102 from another source.
- the information about cell site enhancements, capacity upgrades, and other infrastructure improvements may be stored in the upgrade data store 107 .
- Upgrades or enhancements may include capacity upgrades of a wired communication link between the cell site and a wired network, for example the public switched telephone network.
- the performance analysis platform 102 analyzes, processes, and summarizes a variety of information related to performance of the cellular wireless communication network.
- the performance analysis platform 102 promotes a range of analysis granularity to users 118 examining cellular performance.
- the user 118 may take a network wide view across all markets.
- the user 118 may take a market wide view of performance averaged across the subject market.
- the user 118 may take an area view of performance averaged across a plurality of selected cell sites.
- the user 118 may take a view of performance of a single cell site or of a single radio sector of a cell site.
- the user 118 may compare the selected view to any other level of granularity to promote comparisons.
- the user 118 may view the data and or information provided by the performance analysis platform 102 at different levels of time granularity, for example to see metrics represented on a per hour of time basis, on a per day time basis, on a per week time basis or another time basis.
- the data may be displayed on a time line to the user and information in addition to metrics may also be presented aligned with the same time basis, for example notable events that may be recorded in the schedule data store 106 such as a major sporting event and/or installation of upgrades to service.
- the market rank analysis component 108 determines a summary performance metric for each of a plurality of markets into which a cellular wireless network is conceptually partitioned.
- the summary performance metric may be determined based on averages of the different cell site performance metrics, for example an average of the call drop rate, an average of the call block rate, an average of the EV-DO drop rate, and an average of the network fault rate across the cell sites of the subject market. It will be appreciated that this list is exemplary, and the summary performance metric may be based on additional metrics, for example a number of customer care calls associated with a market or a number of customer care calls per 1000 subscribers associated with a market.
- the summary metric may be based on a number of trouble tickets opened that are associated with a market, for example trouble tickets stored in the trouble ticket data store 105 .
- the summary performance metric may take account of short message service lost or undelivered messages.
- the summary performance metric of each market may be determined as a weighted sum of the several averages.
- the summary performance metric may be determined by multiplying each of the averages by a separate weighting or coefficient and then summing these products.
- the metrics associated with some of the cell sites of a market may be excluded from the calculation of a summary performance metric for a market because the subject cell sites may be considered unrepresentative in some way.
- the cell site may not have been in service long enough to be fully adjusted.
- the cell site may have an anomalous loading pattern, for example lightly loaded except on Sunday mornings when church services are held in a large church within the coverage area of the subject cell site.
- the market rank analysis component 108 may depend upon or invoke services provided by the performance metrics averaging component 110 to determine the averages of the cell site metrics across a market.
- the performance metrics averaging component 110 may depend upon or invoke services provided by the schedule analysis component 112 to exclude some atypical metrics from determination of averages.
- the schedule analysis component 112 based on accessing the schedule data store 106 , may indicate that a professional football game was played between noon and 3 PM on a particular Sunday, and the performance metrics averaging component 112 may use this information to exclude metrics associated with a cell site close to the football stadium between 8 AM and 6 PM from calculations of average performance metrics for the subject cell site.
- the schedule data store 106 may contain information on public events such as professional sports events, college sports events, graduation ceremonies, public fireworks displays, as well as other public events.
- the performance metrics averaging component 110 or another component of the performance analysis platform 102 may determine the rate based performance metrics of the cell sites.
- the mapping support component 114 provides mapping functionality to promote presenting a map of the cellular wireless network at different levels of granularity.
- the mapping support component 114 promotes viewing the complete cellular wireless network as a map overlaying market boundaries over a geographical map of the United States and zooming down to a series of finer degrees of granularity. For example, from a national level view that shows metrics or data associated with all markets the map may be zoomed to show data and/or metrics associated with a selected market at a more fine grained level of detail. From the market level view the map may be zoomed to show data and/or metrics associated with a selected area of the selected market at a more fine grained level of detail.
- each level of map granularity or map detail appropriate views of performance metrics can be presented. For example, at the top level view, the rank of each market may be presented within the boundaries of the markets. In an embodiment, other information may be presented within the boundaries of the markets, for example statistics on numbers of subscribers, numbers of completed calls per month, average performance metrics, average performance metrics for the market expressed related to a national average performance metrics, and/or other performance information.
- the mapping support component 114 allows a user 118 to select one or more cell sites by designating an area and/or by excluding some cell sites.
- the performance metrics averaging tool 110 may then be invoked to determine performance metric averages over the selected cell sites and relate these and/or compare these performance metric averages to the corresponding performance metric averages for the subject market and/or for the entire wireless cellular network.
- the user 118 may designate an area and exclude some cell sites to approximate an area frequented by a customer, for example an area encompassing the customer's residence, the customer's workplace, and a commute path between residence and workplace.
- the mapping support component 114 may be used along with the performance metrics averaging component 110 , for example invoked by the front-end component 115 , to determine one or more average performance metrics for the customer and compare these average performance metrics with corresponding average performance metrics for the market and/or for the national average performance metrics.
- the performance analysis platform 102 may promote different classes of access to the different users 118 .
- a first user 118 a may be a market manager, and the performance analysis platform 102 may grant unlimited access to all levels of metrics and analysis functionality to the first user 118 a .
- a second user 118 b may be a customer care representative at a care center providing services to one or a small number of markets.
- the performance analysis platform 102 may limit the second user 118 b to accessing the market or markets associated to his or her care center and possibly executing a restricted set of analysis functionality.
- a third user 118 c may be a contractor providing services related to turning up an enhancement of a cell site.
- the performance analysis platform 102 may restrict access of the third user 118 c to only the metrics of the subject cell site or to the metrics of the subject cell site and average metrics with the market within which the subject cell site is located but not performance metrics associated with other cell sites with in the market.
- the performance analysis platform 102 may promote any number of different user classes and may restrict access of users 118 to metrics and/or functionality based on the user class of the subject user 118 .
- the front-end component 115 may perform the access restriction based on class filtering described above.
- the performance metrics may be presented on a time line that promotes readily seeing how the metrics change over time, for example how the metrics change throughout a day or for example over a longer period of several months.
- Other useful information may likewise be presented aligned with the same time line, for example major events such as sporting events, fireworks displays, and the like.
- Information about planned upgrades may be displayed along the same time line.
- Information about weather events may be displayed along the same time line. The presentation of this wealth of information may promote a more holistic understanding of the performance metrics and what factors may be influencing those performance metrics. This information may be helpful to a customer care representative, for example, who is speaking to a customer about wireless service problems experienced by the customer.
- a method 200 is described.
- provide a map of a portion of a cellular wireless communication network wherein the map provides identification of base transceiver stations.
- receive a designation of a geographical area where the geographical area is located within the map.
- access performance metrics associated with the identified base transceiver stations from a data store of metrics associated with the cellular wireless communication network.
- transmit the presentation whereby a user may view the presentation in a display. It will be appreciated that the user may use the presented information to make management decisions, for example to defer upgrading a first base transceiver station and advancing an upgrade of a second base transceiver station based on the information.
- a method 220 is described.
- FIG. 4 illustrates a computer system 380 suitable for implementing one or more embodiments disclosed herein.
- the computer system 380 includes a processor 382 (which may be referred to as a central processor unit or CPU) that is in communication with memory devices including secondary storage 384 , read only memory (ROM) 386 , random access memory (RAM) 388 , input/output (I/O) devices 390 , and network connectivity devices 392 .
- the processor 382 may be implemented as one or more CPU chips.
- a design that is still subject to frequent change may be preferred to be implemented in software, because re-spinning a hardware implementation is more expensive than re-spinning a software design.
- a design that is stable that will be produced in large volume may be preferred to be implemented in hardware, for example in an application specific integrated circuit (ASIC), because for large production runs the hardware implementation may be less expensive than the software implementation.
- ASIC application specific integrated circuit
- a design may be developed and tested in a software form and later transformed, by well known design rules, to an equivalent hardware implementation in an application specific integrated circuit that hardwires the instructions of the software.
- a machine controlled by a new ASIC is a particular machine or apparatus, likewise a computer that has been programmed and/or loaded with executable instructions may be viewed as a particular machine or apparatus.
- the secondary storage 384 is typically comprised of one or more disk drives or tape drives and is used for non-volatile storage of data and as an over-flow data storage device if RAM 388 is not large enough to hold all working data. Secondary storage 384 may be used to store programs which are loaded into RAM 388 when such programs are selected for execution.
- the ROM 386 is used to store instructions and perhaps data which are read during program execution. ROM 386 is a non-volatile memory device which typically has a small memory capacity relative to the larger memory capacity of secondary storage 384 .
- the RAM 388 is used to store volatile data and perhaps to store instructions. Access to both ROM 386 and RAM 388 is typically faster than to secondary storage 384 .
- the secondary storage 384 , the RAM 388 , and/or the ROM 386 may be referred to in some contexts as computer readable storage media and/or non-transitory computer readable media.
- I/O devices 390 may include printers, video monitors, liquid crystal displays (LCDs), touch screen displays, keyboards, keypads, switches, dials, mice, track balls, voice recognizers, card readers, paper tape readers, or other well-known input devices.
- LCDs liquid crystal displays
- touch screen displays keyboards, keypads, switches, dials, mice, track balls, voice recognizers, card readers, paper tape readers, or other well-known input devices.
- the network connectivity devices 392 may take the form of modems, modem banks, Ethernet cards, universal serial bus (USB) interface cards, serial interfaces, token ring cards, fiber distributed data interface (FDDI) cards, wireless local area network (WLAN) cards, radio transceiver cards such as code division multiple access (CDMA), global system for mobile communications (GSM), long-term evolution (LTE), worldwide interoperability for microwave access (WiMAX), iDEN, and/or other air interface protocol radio transceiver cards, and other well-known network devices. These network connectivity devices 392 may enable the processor 382 to communicate with the Internet or one or more intranets.
- CDMA code division multiple access
- GSM global system for mobile communications
- LTE long-term evolution
- WiMAX worldwide interoperability for microwave access
- iDEN worldwide interoperability for microwave access
- the processor 382 might receive information from the network, or might output information to the network in the course of performing the above-described method steps. Such information, which is often represented as a sequence of instructions to be executed using processor 382 , may be received from and outputted to the network, for example, in the form of a computer data signal embodied in a carrier wave.
- Such information may be received from and outputted to the network, for example, in the form of a computer data baseband signal or signal embodied in a carrier wave.
- the baseband signal or signal embedded in the carrier wave may be generated according to several methods well known to one skilled in the art.
- the baseband signal and/or signal embedded in the carrier wave may be referred to in some contexts as a transitory signal.
- the processor 382 executes instructions, codes, computer programs, scripts which it accesses from hard disk, floppy disk, optical disk (these various disk based systems may all be considered secondary storage 384 ), ROM 386 , RAM 388 , or the network connectivity devices 392 . While only one processor 382 is shown, multiple processors may be present. Thus, while instructions may be discussed as executed by a processor, the instructions may be executed simultaneously, serially, or otherwise executed by one or multiple processors.
- Instructions, codes, computer programs, scripts, and/or data that may be accessed from the secondary storage 384 for example, hard drives, floppy disks, optical disks, and/or other device, the ROM 386 , and/or the RAM 388 may be referred to in some contexts as non-transitory instructions and/or non-transitory information.
- the computer system 380 may comprise two or more computers in communication with each other that collaborate to perform a task.
- an application may be partitioned in such a way as to permit concurrent and/or parallel processing of the instructions of the application.
- the data processed by the application may be partitioned in such a way as to permit concurrent and/or parallel processing of different portions of a data set by the two or more computers.
- virtualization software may be employed by the computer system 380 to provide the functionality of a number of servers that is not directly bound to the number of computers in the computer system 380 .
- virtualization software may provide twenty virtual servers on four physical computers.
- Cloud computing may comprise providing computing services via a network connection using dynamically scalable computing resources.
- Cloud computing may be supported, at least in part, by virtualization software.
- a cloud computing environment may be established by an enterprise and/or may be hired on an as-needed basis from a third party provider.
- Some cloud computing environments may comprise cloud computing resources owned and operated by the enterprise as well as cloud computing resources hired and/or leased from a third party provider.
- the computer program product may comprise one or more computer readable storage medium having computer usable program code embodied therein to implement the functionality disclosed above.
- the computer program product may comprise data structures, executable instructions, and other computer usable program code.
- the computer program product may be embodied in removable computer storage media and/or non-removable computer storage media.
- the removable computer readable storage medium may comprise, without limitation, a paper tape, a magnetic tape, magnetic disk, an optical disk, a solid state memory chip, for example analog magnetic tape, compact disk read only memory (CD-ROM) disks, floppy disks, jump drives, digital cards, multimedia cards, and others.
- the computer program product may be suitable for loading, by the computer system 380 , at least portions of the contents of the computer program product to the secondary storage 384 , to the ROM 386 , to the RAM 388 , and/or to other non-volatile memory and volatile memory of the computer system 380 .
- the processor 382 may process the executable instructions and/or data structures in part by directly accessing the computer program product, for example by reading from a CD-ROM disk inserted into a disk drive peripheral of the computer system 380 .
- the processor 382 may process the executable instructions and/or data structures by remotely accessing the computer program product, for example by downloading the executable instructions and/or data structures from a remote server through the network connectivity devices 392 .
- the computer program product may comprise instructions that promote the loading and/or copying of data, data structures, files, and/or executable instructions to the secondary storage 384 , to the ROM 386 , to the RAM 388 , and/or to other non-volatile memory and volatile memory of the computer system 380 .
- the secondary storage 384 , the ROM 386 , and the RAM 388 may be referred to as a non-transitory computer readable medium or a computer readable storage media.
- a dynamic RAM embodiment of the RAM 388 likewise, may be referred to as a non-transitory computer readable medium in that while the dynamic RAM receives electrical power and is operated in accordance with its design, for example during a period of time during which the computer 380 is turned on and operational, the dynamic RAM stores information that is written to it.
- the processor 382 may comprise an internal RAM, an internal ROM, a cache memory, and/or other internal non-transitory storage blocks, sections, or components that may be referred to in some contexts as non-transitory computer readable media or computer readable storage media.
Abstract
Description
Claims (19)
Priority Applications (1)
| Application Number | Priority Date | Filing Date | Title |
|---|---|---|---|
| US13/607,485 US9210600B1 (en) | 2012-09-07 | 2012-09-07 | Wireless network performance analysis system and method |
Applications Claiming Priority (1)
| Application Number | Priority Date | Filing Date | Title |
|---|---|---|---|
| US13/607,485 US9210600B1 (en) | 2012-09-07 | 2012-09-07 | Wireless network performance analysis system and method |
Publications (1)
| Publication Number | Publication Date |
|---|---|
| US9210600B1 true US9210600B1 (en) | 2015-12-08 |
Family
ID=54708481
Family Applications (1)
| Application Number | Title | Priority Date | Filing Date |
|---|---|---|---|
| US13/607,485 Expired - Fee Related US9210600B1 (en) | 2012-09-07 | 2012-09-07 | Wireless network performance analysis system and method |
Country Status (1)
| Country | Link |
|---|---|
| US (1) | US9210600B1 (en) |
Cited By (10)
| Publication number | Priority date | Publication date | Assignee | Title |
|---|---|---|---|---|
| US20150347951A1 (en) * | 2014-05-27 | 2015-12-03 | Genesys Telecommunications Laboratories, Inc. | Multi-tenant based analytics for contact centers |
| US9432865B1 (en) | 2013-12-19 | 2016-08-30 | Sprint Communications Company L.P. | Wireless cell tower performance analysis system and method |
| US20160328120A1 (en) * | 2015-05-04 | 2016-11-10 | Rivada Networks, Llc | Methods and System for Dynamic Spectrum Arbitrage with a Graphic Administration Application |
| US10123223B1 (en) | 2014-01-30 | 2018-11-06 | Sprint Communications Company L.P. | System and method for evaluating operational integrity of a radio access network |
| US10477426B1 (en) * | 2019-02-06 | 2019-11-12 | Accenture Global Solutions Limited | Identifying a cell site as a target for utilizing 5th generation (5G) network technologies and upgrading the cell site to implement the 5G network technologies |
| US10554478B2 (en) | 2016-08-03 | 2020-02-04 | At&T Intellectual Property I, L.P. | Method and apparatus for providing trouble isolation via a network |
| US10567246B2 (en) * | 2015-12-15 | 2020-02-18 | At&T Intellectual Property I, L.P. | Processing performance data of a content delivery network |
| US10666526B2 (en) * | 2013-11-27 | 2020-05-26 | At&T Intellectual Property I, L.P. | Method and apparatus for measuring end-to-end accessibility in voice over long term evolution networks |
| IT201900015096A1 (en) | 2019-08-27 | 2021-02-27 | Telecom Italia Spa | Self-organizing network system |
| US11310367B2 (en) * | 2014-05-20 | 2022-04-19 | Time Warner Cable Enterprises Llc | Wireless network installation analyzer and reporting |
Citations (81)
| Publication number | Priority date | Publication date | Assignee | Title |
|---|---|---|---|---|
| US5914668A (en) | 1996-08-30 | 1999-06-22 | Lucent Technologies Inc. | Wireless terminal controlled mobility operational parameters |
| US5987099A (en) * | 1992-10-16 | 1999-11-16 | Northern Telecom Limited | Low-power wireless system for telephone services |
| US6115610A (en) * | 1995-12-22 | 2000-09-05 | British Telecommunications Public Limited Company | Mobile radio systems |
| US6216002B1 (en) * | 1998-05-11 | 2001-04-10 | Ericsson Inc. | Method for selecting base transceiver stations for gathering data to determine a mobile station's location in a wireless network |
| US20010036825A1 (en) * | 2000-01-27 | 2001-11-01 | Martin Dannie E. | Cellular/PCS management system and method |
| US20020068559A1 (en) * | 2000-12-05 | 2002-06-06 | Shailendra Sharma | Method and system for remote and local mobile network management |
| US20020069037A1 (en) * | 2000-09-01 | 2002-06-06 | Keith Hendrickson | System and method for measuring wireless device and network usage and performance metrics |
| US20020177448A1 (en) * | 2001-03-20 | 2002-11-28 | Brian Moran | System and method for wireless data performance monitoring |
| US6539221B1 (en) * | 1997-10-16 | 2003-03-25 | Nortel Networks Limited | Automated wireless network design |
| US20030078055A1 (en) * | 2001-09-13 | 2003-04-24 | Airsage, Inc. | System and method for providing traffic information using operational data of a wireless network |
| US20030100317A1 (en) * | 2000-07-02 | 2003-05-29 | Joseph Kaplan | Method for monitoring cellular communication, and system therefor |
| US6587686B1 (en) * | 1999-12-14 | 2003-07-01 | Telefonaktiebolaget L M Ericsson (Publ) | Method and apparatus for detecting base station transceivers malfunctions |
| US20030161265A1 (en) * | 2002-02-25 | 2003-08-28 | Jingjun Cao | System for end user monitoring of network service conditions across heterogeneous networks |
| US6745011B1 (en) * | 2000-09-01 | 2004-06-01 | Telephia, Inc. | System and method for measuring wireless device and network usage and performance metrics |
| US20040127224A1 (en) * | 2002-10-23 | 2004-07-01 | Hiroshi Furukawa | Base-station cell design method and base-station cell design apparatus, and program thereof in mobile communication system |
| US20050014492A1 (en) * | 2001-11-29 | 2005-01-20 | Myong-Soo Kang | Method for controlling data of base station |
| US20050064820A1 (en) * | 2001-12-07 | 2005-03-24 | Park Sang Jin | Network analyzing method and apparatus for optimal performance of network, and a recording medium having programs to conduct said method |
| US20050096842A1 (en) * | 2003-11-05 | 2005-05-05 | Eric Tashiro | Traffic routing method and apparatus for navigation system to predict travel time and departure time |
| US20050192001A1 (en) * | 2004-02-26 | 2005-09-01 | Isaac Samuel | Controlling processor load in a wireless telecommunications network node |
| US20060183471A1 (en) * | 2005-02-17 | 2006-08-17 | Isaac Samuel | Method for predicting air interface capacity based on performance measurements |
| US20060217116A1 (en) * | 2005-03-18 | 2006-09-28 | Cassett Tia M | Apparatus and methods for providing performance statistics on a wireless communication device |
| US20070004394A1 (en) * | 2005-06-30 | 2007-01-04 | Michael Chu | Assessing wireless network quality |
| US20070026886A1 (en) * | 2005-05-09 | 2007-02-01 | Francois Vincent | Method and system for planning the power of carriers in a cellular telecommunications network |
| US20070105583A1 (en) * | 2005-11-04 | 2007-05-10 | Alcatel | Method for automatic resource restriction distribution, a base station, a mobile terminal, a resource distribution device and a mobile network therefor |
| US7236767B1 (en) * | 2005-06-03 | 2007-06-26 | Sprint Communications Company L.P. | Wireless cell site finder and customer service system |
| US7237767B2 (en) * | 2001-08-28 | 2007-07-03 | Mitsubishi Rayon Co., Ltd. | Device and method for manufacturing carbonated spring and carbonic water, control method for gas density applied thereto and membrane module |
| US20070288480A1 (en) * | 2006-04-21 | 2007-12-13 | Mediamote, Inc. | Collection and distribution of sense-on-demand data |
| US20080045245A1 (en) * | 2006-08-18 | 2008-02-21 | Patent Navigation Inc. | Locating people and routes on a digital map |
| US20080152104A1 (en) * | 2006-12-20 | 2008-06-26 | Motorola, Inc. | Intelligent selection of network elements for upgrades |
| US20080215355A1 (en) * | 2000-11-28 | 2008-09-04 | David Herring | Method and System for Predicting Causes of Network Service Outages Using Time Domain Correlation |
| US20080219365A1 (en) * | 2007-03-08 | 2008-09-11 | Fujitsu Limited | Method of grouping and mapping transmission stations in a wireless network |
| US20080233936A1 (en) * | 2007-03-21 | 2008-09-25 | Alcatel-Lucent Technologies Inc. | Method of constructing a quickconfig message in a 1xEvolution data only (1xEV-DO) communication network and method of reducing call and handoff failure rates in the 1xEV-DO network without introducing additional call setup latencies |
| US7454002B1 (en) | 2000-01-03 | 2008-11-18 | Sportbrain, Inc. | Integrating personal data capturing functionality into a portable computing device and a wireless communication device |
| US20090054056A1 (en) | 2006-03-06 | 2009-02-26 | Motorola, Inc. | Service characteristic evaluation in a cellular communication system |
| US20090055719A1 (en) * | 1999-12-22 | 2009-02-26 | Celeritasworks, Llc | Geographic Management System |
| US20090075648A1 (en) * | 2007-09-14 | 2009-03-19 | Actix Limited | Mobile phone network optimisation systems |
| US20090111462A1 (en) | 2005-09-15 | 2009-04-30 | At&T Mobility Ii Llc | Location Based Services Quality Assessment |
| US20090164551A1 (en) * | 2007-12-21 | 2009-06-25 | General Motors Corporation | Sms and packet data performance monitoring |
| US20090161850A1 (en) * | 2007-12-21 | 2009-06-25 | Motorola, Inc. | Efficient mechanism for the management of call/session event information for near real-time causal analysis |
| US20090248711A1 (en) * | 2008-03-28 | 2009-10-01 | Ronald Martinez | System and method for optimizing the storage of data |
| US20090275335A1 (en) * | 2008-05-01 | 2009-11-05 | Beceem Communications Inc. | Determining a handoff metric |
| US20090286526A1 (en) * | 2008-05-15 | 2009-11-19 | Nec Corporation | Radio quality degradation prediction system, wireless terminal and monitoring server therefor, radio quality degradation prediction method and program |
| US20090296674A1 (en) * | 2008-05-29 | 2009-12-03 | Motorola, Inc | Method and apparatus for density determinatioin in a wireless communication network |
| US20100015926A1 (en) * | 2008-07-18 | 2010-01-21 | Luff Robert A | System and methods to monitor and analyze events on wireless devices to predict wireless network resource usage |
| US7693042B1 (en) * | 1999-06-23 | 2010-04-06 | At&T Mobility Ii Llc | Intelligent presentation network management system |
| US20100099405A1 (en) * | 2008-10-20 | 2010-04-22 | At&T Mobility Ii Llc | Management of network technology selection and display in multi-technology wireless environments |
| US20100151920A1 (en) * | 2008-12-16 | 2010-06-17 | Electronics And Telecommunications Research Institute | Method of operating base station with low power consumption |
| US7778591B1 (en) | 2006-04-07 | 2010-08-17 | Dell Products L.P. | Radio with backchannel feedback |
| US20100234031A1 (en) * | 2006-03-29 | 2010-09-16 | Vodafone Group Plc | Method for controlling the operation of the cells of a cellular communication system |
| US7903625B1 (en) * | 2008-12-03 | 2011-03-08 | Sprint Spectrum L.P. | Internet-base-station-based traffic offload analysis |
| US20110143748A1 (en) * | 2009-12-13 | 2011-06-16 | Shah Dipesh H | Method and system for determining service metrics in a wireless network |
| US20110166986A1 (en) * | 2010-01-05 | 2011-07-07 | Bank Of America Corporation | Banking Center First Mortgage Origination |
| US20110201317A1 (en) | 2010-02-15 | 2011-08-18 | TTSL IITB Center for Excellence in Telecom (TICET) | Method for facilitating and analyzing social interactions and context for targeted recommendations in a network of a telecom service provider |
| US8005644B1 (en) * | 2009-02-20 | 2011-08-23 | Sprint Communications Company L.P. | Application transaction analysis |
| US20110275364A1 (en) * | 2010-05-06 | 2011-11-10 | At&T Services, Inc. | Device-driven intelligence and feedback for performance optimization and planning of a service network |
| US20110313695A1 (en) * | 2008-05-15 | 2011-12-22 | John Houston | System and methods for metering and analyzing energy consumption of events within a portable device |
| US20110320588A1 (en) * | 2009-01-28 | 2011-12-29 | Raleigh Gregory G | System and method for wireless network offloading |
| US20120058759A1 (en) * | 2010-09-07 | 2012-03-08 | Telefonaktiebolaget Lm Ericsson (Publ) | Monitoring cellular radio access node performance |
| US8145560B2 (en) | 2006-11-14 | 2012-03-27 | Fmr Llc | Detecting fraudulent activity on a network |
| US8145186B1 (en) * | 2008-03-31 | 2012-03-27 | Sprint Communications Company L.P. | Assessing the comparative performance of telecommunication service areas |
| US20120096065A1 (en) * | 2007-06-22 | 2012-04-19 | Suit John M | System and method for monitoring system performance changes based on configuration modification |
| US8170547B1 (en) * | 2008-01-17 | 2012-05-01 | Sprint Communications Company L.P. | Dynamic adjustment of a base transceiver station in a wireless communication system |
| US20120120078A1 (en) * | 2010-11-17 | 2012-05-17 | Eric Hubbard | Displaying system performance information |
| US8229415B1 (en) * | 2011-08-22 | 2012-07-24 | Sprint Communications Company L.P. | Wireless communication data store construction and analysis |
| US20120295618A1 (en) * | 2011-05-18 | 2012-11-22 | Kalle Ilmari Ahmavaara | Methods and apparatus for controlling provisioning of a wireless communication device |
| US20130053019A1 (en) * | 2011-08-30 | 2013-02-28 | Salesforce.Com, Inc. | Mechanism for facilitating dynamic and segment-based monitoring of cellular network performance in an on-demand services environment |
| US20130052019A1 (en) * | 2011-08-26 | 2013-02-28 | Dyson Technology Limited | Rotor assembly for a turbomachine |
| US20130072222A1 (en) | 2011-09-15 | 2013-03-21 | Vasona Networks | Method and computer readable medium for gathering user equipment location information |
| US20130091452A1 (en) * | 2011-12-23 | 2013-04-11 | Gary SORDEN | Location-based services |
| US8423035B1 (en) * | 2008-07-09 | 2013-04-16 | Clearwire Ip Holdings Llc | Dynamic uplink/downlink capacity allocation in a communication network |
| US20130157652A1 (en) * | 2011-06-20 | 2013-06-20 | Qualcomm Incorporated | Methods and apparatus for deployment and control of small cells |
| US8600384B1 (en) * | 2007-08-29 | 2013-12-03 | Optimi Corporation | Optimization of interlayer handovers in multilayer wireless communication networks |
| US20130331114A1 (en) * | 2012-06-06 | 2013-12-12 | Eden Rock Communications, Llc | Adjacent network aware self organizing network system |
| US20130331082A1 (en) | 2012-06-08 | 2013-12-12 | Dimitrios Topaltzas | System and Method for Evaluating Performance of Concurrent Mobile Services of Mobile Devices |
| US20140003389A1 (en) * | 2012-05-31 | 2014-01-02 | Airvana Llc | Providing circuit switched service |
| US8627125B2 (en) | 2011-04-07 | 2014-01-07 | Symantec Corporation | Context sensitive power management for a resource |
| US20140022918A1 (en) * | 2012-07-18 | 2014-01-23 | Alcatel-Lucent Usa Inc. | Method And Apparatus For Selecting A Wireless Access Point |
| US20140078992A1 (en) * | 2008-02-13 | 2014-03-20 | Qualcomm Incorporated | Sector interference management based on inter-sector performance |
| US20140177430A1 (en) * | 2011-04-21 | 2014-06-26 | Telefonaktiebolaget L M Ericsson (Publ) | Recovery from multiple faults in a communications network |
| US8880600B2 (en) | 2010-03-31 | 2014-11-04 | Facebook, Inc. | Creating groups of users in a social networking system |
| US8966055B2 (en) | 2008-11-14 | 2015-02-24 | Qualcomm Incorporated | System and method for facilitating capacity monitoring and recommending action for wireless networks |
-
2012
- 2012-09-07 US US13/607,485 patent/US9210600B1/en not_active Expired - Fee Related
Patent Citations (83)
| Publication number | Priority date | Publication date | Assignee | Title |
|---|---|---|---|---|
| US5987099A (en) * | 1992-10-16 | 1999-11-16 | Northern Telecom Limited | Low-power wireless system for telephone services |
| US6115610A (en) * | 1995-12-22 | 2000-09-05 | British Telecommunications Public Limited Company | Mobile radio systems |
| US5914668A (en) | 1996-08-30 | 1999-06-22 | Lucent Technologies Inc. | Wireless terminal controlled mobility operational parameters |
| US6539221B1 (en) * | 1997-10-16 | 2003-03-25 | Nortel Networks Limited | Automated wireless network design |
| US6216002B1 (en) * | 1998-05-11 | 2001-04-10 | Ericsson Inc. | Method for selecting base transceiver stations for gathering data to determine a mobile station's location in a wireless network |
| US7693042B1 (en) * | 1999-06-23 | 2010-04-06 | At&T Mobility Ii Llc | Intelligent presentation network management system |
| US6587686B1 (en) * | 1999-12-14 | 2003-07-01 | Telefonaktiebolaget L M Ericsson (Publ) | Method and apparatus for detecting base station transceivers malfunctions |
| US20090055719A1 (en) * | 1999-12-22 | 2009-02-26 | Celeritasworks, Llc | Geographic Management System |
| US7454002B1 (en) | 2000-01-03 | 2008-11-18 | Sportbrain, Inc. | Integrating personal data capturing functionality into a portable computing device and a wireless communication device |
| US20010036825A1 (en) * | 2000-01-27 | 2001-11-01 | Martin Dannie E. | Cellular/PCS management system and method |
| US20030100317A1 (en) * | 2000-07-02 | 2003-05-29 | Joseph Kaplan | Method for monitoring cellular communication, and system therefor |
| US6745011B1 (en) * | 2000-09-01 | 2004-06-01 | Telephia, Inc. | System and method for measuring wireless device and network usage and performance metrics |
| US20020069037A1 (en) * | 2000-09-01 | 2002-06-06 | Keith Hendrickson | System and method for measuring wireless device and network usage and performance metrics |
| US20080215355A1 (en) * | 2000-11-28 | 2008-09-04 | David Herring | Method and System for Predicting Causes of Network Service Outages Using Time Domain Correlation |
| US20020068559A1 (en) * | 2000-12-05 | 2002-06-06 | Shailendra Sharma | Method and system for remote and local mobile network management |
| US20020177448A1 (en) * | 2001-03-20 | 2002-11-28 | Brian Moran | System and method for wireless data performance monitoring |
| US7237767B2 (en) * | 2001-08-28 | 2007-07-03 | Mitsubishi Rayon Co., Ltd. | Device and method for manufacturing carbonated spring and carbonic water, control method for gas density applied thereto and membrane module |
| US6842620B2 (en) * | 2001-09-13 | 2005-01-11 | Airsage, Inc. | System and method for providing traffic information using operational data of a wireless network |
| US20030078055A1 (en) * | 2001-09-13 | 2003-04-24 | Airsage, Inc. | System and method for providing traffic information using operational data of a wireless network |
| US20050014492A1 (en) * | 2001-11-29 | 2005-01-20 | Myong-Soo Kang | Method for controlling data of base station |
| US20050064820A1 (en) * | 2001-12-07 | 2005-03-24 | Park Sang Jin | Network analyzing method and apparatus for optimal performance of network, and a recording medium having programs to conduct said method |
| US20030161265A1 (en) * | 2002-02-25 | 2003-08-28 | Jingjun Cao | System for end user monitoring of network service conditions across heterogeneous networks |
| US20040127224A1 (en) * | 2002-10-23 | 2004-07-01 | Hiroshi Furukawa | Base-station cell design method and base-station cell design apparatus, and program thereof in mobile communication system |
| US20050096842A1 (en) * | 2003-11-05 | 2005-05-05 | Eric Tashiro | Traffic routing method and apparatus for navigation system to predict travel time and departure time |
| US20050192001A1 (en) * | 2004-02-26 | 2005-09-01 | Isaac Samuel | Controlling processor load in a wireless telecommunications network node |
| US20060183471A1 (en) * | 2005-02-17 | 2006-08-17 | Isaac Samuel | Method for predicting air interface capacity based on performance measurements |
| US20060217116A1 (en) * | 2005-03-18 | 2006-09-28 | Cassett Tia M | Apparatus and methods for providing performance statistics on a wireless communication device |
| US20070026886A1 (en) * | 2005-05-09 | 2007-02-01 | Francois Vincent | Method and system for planning the power of carriers in a cellular telecommunications network |
| US7236767B1 (en) * | 2005-06-03 | 2007-06-26 | Sprint Communications Company L.P. | Wireless cell site finder and customer service system |
| US20070004394A1 (en) * | 2005-06-30 | 2007-01-04 | Michael Chu | Assessing wireless network quality |
| US20090111462A1 (en) | 2005-09-15 | 2009-04-30 | At&T Mobility Ii Llc | Location Based Services Quality Assessment |
| US20070105583A1 (en) * | 2005-11-04 | 2007-05-10 | Alcatel | Method for automatic resource restriction distribution, a base station, a mobile terminal, a resource distribution device and a mobile network therefor |
| US20090054056A1 (en) | 2006-03-06 | 2009-02-26 | Motorola, Inc. | Service characteristic evaluation in a cellular communication system |
| US20100234031A1 (en) * | 2006-03-29 | 2010-09-16 | Vodafone Group Plc | Method for controlling the operation of the cells of a cellular communication system |
| US7778591B1 (en) | 2006-04-07 | 2010-08-17 | Dell Products L.P. | Radio with backchannel feedback |
| US20070288480A1 (en) * | 2006-04-21 | 2007-12-13 | Mediamote, Inc. | Collection and distribution of sense-on-demand data |
| US20080045245A1 (en) * | 2006-08-18 | 2008-02-21 | Patent Navigation Inc. | Locating people and routes on a digital map |
| US8145560B2 (en) | 2006-11-14 | 2012-03-27 | Fmr Llc | Detecting fraudulent activity on a network |
| US20080152104A1 (en) * | 2006-12-20 | 2008-06-26 | Motorola, Inc. | Intelligent selection of network elements for upgrades |
| US20080219365A1 (en) * | 2007-03-08 | 2008-09-11 | Fujitsu Limited | Method of grouping and mapping transmission stations in a wireless network |
| US8570955B2 (en) * | 2007-03-08 | 2013-10-29 | Fujitsu Limited | Method of grouping and mapping transmission stations in a wireless network |
| US20080233936A1 (en) * | 2007-03-21 | 2008-09-25 | Alcatel-Lucent Technologies Inc. | Method of constructing a quickconfig message in a 1xEvolution data only (1xEV-DO) communication network and method of reducing call and handoff failure rates in the 1xEV-DO network without introducing additional call setup latencies |
| US20120096065A1 (en) * | 2007-06-22 | 2012-04-19 | Suit John M | System and method for monitoring system performance changes based on configuration modification |
| US8600384B1 (en) * | 2007-08-29 | 2013-12-03 | Optimi Corporation | Optimization of interlayer handovers in multilayer wireless communication networks |
| US20090075648A1 (en) * | 2007-09-14 | 2009-03-19 | Actix Limited | Mobile phone network optimisation systems |
| US20090164551A1 (en) * | 2007-12-21 | 2009-06-25 | General Motors Corporation | Sms and packet data performance monitoring |
| US20090161850A1 (en) * | 2007-12-21 | 2009-06-25 | Motorola, Inc. | Efficient mechanism for the management of call/session event information for near real-time causal analysis |
| US8170547B1 (en) * | 2008-01-17 | 2012-05-01 | Sprint Communications Company L.P. | Dynamic adjustment of a base transceiver station in a wireless communication system |
| US20140078992A1 (en) * | 2008-02-13 | 2014-03-20 | Qualcomm Incorporated | Sector interference management based on inter-sector performance |
| US20090248711A1 (en) * | 2008-03-28 | 2009-10-01 | Ronald Martinez | System and method for optimizing the storage of data |
| US8145186B1 (en) * | 2008-03-31 | 2012-03-27 | Sprint Communications Company L.P. | Assessing the comparative performance of telecommunication service areas |
| US20090275335A1 (en) * | 2008-05-01 | 2009-11-05 | Beceem Communications Inc. | Determining a handoff metric |
| US20110313695A1 (en) * | 2008-05-15 | 2011-12-22 | John Houston | System and methods for metering and analyzing energy consumption of events within a portable device |
| US20090286526A1 (en) * | 2008-05-15 | 2009-11-19 | Nec Corporation | Radio quality degradation prediction system, wireless terminal and monitoring server therefor, radio quality degradation prediction method and program |
| US20090296674A1 (en) * | 2008-05-29 | 2009-12-03 | Motorola, Inc | Method and apparatus for density determinatioin in a wireless communication network |
| US8423035B1 (en) * | 2008-07-09 | 2013-04-16 | Clearwire Ip Holdings Llc | Dynamic uplink/downlink capacity allocation in a communication network |
| US20100015926A1 (en) * | 2008-07-18 | 2010-01-21 | Luff Robert A | System and methods to monitor and analyze events on wireless devices to predict wireless network resource usage |
| US20100099405A1 (en) * | 2008-10-20 | 2010-04-22 | At&T Mobility Ii Llc | Management of network technology selection and display in multi-technology wireless environments |
| US8966055B2 (en) | 2008-11-14 | 2015-02-24 | Qualcomm Incorporated | System and method for facilitating capacity monitoring and recommending action for wireless networks |
| US7903625B1 (en) * | 2008-12-03 | 2011-03-08 | Sprint Spectrum L.P. | Internet-base-station-based traffic offload analysis |
| US20100151920A1 (en) * | 2008-12-16 | 2010-06-17 | Electronics And Telecommunications Research Institute | Method of operating base station with low power consumption |
| US20110320588A1 (en) * | 2009-01-28 | 2011-12-29 | Raleigh Gregory G | System and method for wireless network offloading |
| US8005644B1 (en) * | 2009-02-20 | 2011-08-23 | Sprint Communications Company L.P. | Application transaction analysis |
| US20110143748A1 (en) * | 2009-12-13 | 2011-06-16 | Shah Dipesh H | Method and system for determining service metrics in a wireless network |
| US20110166986A1 (en) * | 2010-01-05 | 2011-07-07 | Bank Of America Corporation | Banking Center First Mortgage Origination |
| US20110201317A1 (en) | 2010-02-15 | 2011-08-18 | TTSL IITB Center for Excellence in Telecom (TICET) | Method for facilitating and analyzing social interactions and context for targeted recommendations in a network of a telecom service provider |
| US8880600B2 (en) | 2010-03-31 | 2014-11-04 | Facebook, Inc. | Creating groups of users in a social networking system |
| US20110275364A1 (en) * | 2010-05-06 | 2011-11-10 | At&T Services, Inc. | Device-driven intelligence and feedback for performance optimization and planning of a service network |
| US20120058759A1 (en) * | 2010-09-07 | 2012-03-08 | Telefonaktiebolaget Lm Ericsson (Publ) | Monitoring cellular radio access node performance |
| US20120120078A1 (en) * | 2010-11-17 | 2012-05-17 | Eric Hubbard | Displaying system performance information |
| US8627125B2 (en) | 2011-04-07 | 2014-01-07 | Symantec Corporation | Context sensitive power management for a resource |
| US20140177430A1 (en) * | 2011-04-21 | 2014-06-26 | Telefonaktiebolaget L M Ericsson (Publ) | Recovery from multiple faults in a communications network |
| US20120295618A1 (en) * | 2011-05-18 | 2012-11-22 | Kalle Ilmari Ahmavaara | Methods and apparatus for controlling provisioning of a wireless communication device |
| US20130157652A1 (en) * | 2011-06-20 | 2013-06-20 | Qualcomm Incorporated | Methods and apparatus for deployment and control of small cells |
| US8229415B1 (en) * | 2011-08-22 | 2012-07-24 | Sprint Communications Company L.P. | Wireless communication data store construction and analysis |
| US20130052019A1 (en) * | 2011-08-26 | 2013-02-28 | Dyson Technology Limited | Rotor assembly for a turbomachine |
| US20130053019A1 (en) * | 2011-08-30 | 2013-02-28 | Salesforce.Com, Inc. | Mechanism for facilitating dynamic and segment-based monitoring of cellular network performance in an on-demand services environment |
| US20130072222A1 (en) | 2011-09-15 | 2013-03-21 | Vasona Networks | Method and computer readable medium for gathering user equipment location information |
| US20130091452A1 (en) * | 2011-12-23 | 2013-04-11 | Gary SORDEN | Location-based services |
| US20140003389A1 (en) * | 2012-05-31 | 2014-01-02 | Airvana Llc | Providing circuit switched service |
| US20130331114A1 (en) * | 2012-06-06 | 2013-12-12 | Eden Rock Communications, Llc | Adjacent network aware self organizing network system |
| US20130331082A1 (en) | 2012-06-08 | 2013-12-12 | Dimitrios Topaltzas | System and Method for Evaluating Performance of Concurrent Mobile Services of Mobile Devices |
| US20140022918A1 (en) * | 2012-07-18 | 2014-01-23 | Alcatel-Lucent Usa Inc. | Method And Apparatus For Selecting A Wireless Access Point |
Non-Patent Citations (6)
| Title |
|---|
| FAIPP Pre-Interview Communication dated Apr. 21, 2015, U.S. Appl. No. 14/135,574, filed Dec. 19, 2013. |
| Final Office Action dated Sep. 25, 2015, U.S. Appl. No. 14/169,046, filed Jan. 30, 2014. |
| First Action Interview Office Action dated Jul. 24, 2015, U.S. Appl. No. 14/135,574, filed Dec. 19, 2013. |
| Ford, Justin L. et al., Patent Application entitled "System and Method for Evaluating Operational Integrity of a Radio Access Network", filed Jan. 30, 2014, U.S. Appl. No. 14/169,046. |
| Jadunandan, Kevin, et al., Patent Application entitled, "Wireless Cell Tower Performance Analysis System and Method" filed Dec. 19, 2013, U.S. Appl. No. 14/135,574. |
| Office Action dated Apr. 8, 2015, U.S. Appl. No. 14/169,046, filed Jan. 30, 2014. |
Cited By (19)
| Publication number | Priority date | Publication date | Assignee | Title |
|---|---|---|---|---|
| US10666526B2 (en) * | 2013-11-27 | 2020-05-26 | At&T Intellectual Property I, L.P. | Method and apparatus for measuring end-to-end accessibility in voice over long term evolution networks |
| US9432865B1 (en) | 2013-12-19 | 2016-08-30 | Sprint Communications Company L.P. | Wireless cell tower performance analysis system and method |
| US10123223B1 (en) | 2014-01-30 | 2018-11-06 | Sprint Communications Company L.P. | System and method for evaluating operational integrity of a radio access network |
| US11310367B2 (en) * | 2014-05-20 | 2022-04-19 | Time Warner Cable Enterprises Llc | Wireless network installation analyzer and reporting |
| US10346785B2 (en) * | 2014-05-27 | 2019-07-09 | Genesys Telecommunications Laboratories, Inc. | Multi-tenant based analytics for contact centers |
| US10121116B2 (en) | 2014-05-27 | 2018-11-06 | Genesys Telecommunications Laboratories, Inc. | System and method for providing dynamic recommendations based on interactions in retail stores |
| US10102491B2 (en) | 2014-05-27 | 2018-10-16 | Genesys Telecommunications Laboratories, Inc. | System and method for bridging online customer experience |
| US11755978B2 (en) | 2014-05-27 | 2023-09-12 | Genesys Telecommunications Laboratories, Inc. | System for providing dynamic recommendations based on interactions in retail stores |
| US20150347951A1 (en) * | 2014-05-27 | 2015-12-03 | Genesys Telecommunications Laboratories, Inc. | Multi-tenant based analytics for contact centers |
| US20160328120A1 (en) * | 2015-05-04 | 2016-11-10 | Rivada Networks, Llc | Methods and System for Dynamic Spectrum Arbitrage with a Graphic Administration Application |
| US10567246B2 (en) * | 2015-12-15 | 2020-02-18 | At&T Intellectual Property I, L.P. | Processing performance data of a content delivery network |
| US20220217061A1 (en) * | 2015-12-15 | 2022-07-07 | At&T Intellectual Property I, L.P. | Processing performance data of a content delivery network |
| US11316762B2 (en) * | 2015-12-15 | 2022-04-26 | At&T Intellectual Property I, L.P. | Processing performance data of a content delivery network |
| US10554478B2 (en) | 2016-08-03 | 2020-02-04 | At&T Intellectual Property I, L.P. | Method and apparatus for providing trouble isolation via a network |
| US10797937B2 (en) | 2016-08-03 | 2020-10-06 | At&T Mobility Ii Llc | Method and apparatus for providing trouble isolation via a network |
| US11469939B2 (en) | 2016-08-03 | 2022-10-11 | At&T Intellectual Property I, L.P. | Method and apparatus for providing trouble isolation via a network |
| US10477426B1 (en) * | 2019-02-06 | 2019-11-12 | Accenture Global Solutions Limited | Identifying a cell site as a target for utilizing 5th generation (5G) network technologies and upgrading the cell site to implement the 5G network technologies |
| WO2021037812A1 (en) | 2019-08-27 | 2021-03-04 | Telecom Italia S.P.A. | Self-organizing network system |
| IT201900015096A1 (en) | 2019-08-27 | 2021-02-27 | Telecom Italia Spa | Self-organizing network system |
Similar Documents
| Publication | Publication Date | Title |
|---|---|---|
| US9432865B1 (en) | Wireless cell tower performance analysis system and method | |
| US9210600B1 (en) | Wireless network performance analysis system and method | |
| US10028098B2 (en) | Categorized location identification based on historical locations of a user device | |
| US10419949B2 (en) | Web server and method for hosting a web page for presenting location based user quality data related to a communication network | |
| US9887894B2 (en) | Recommendations for reducing data consumption based on data usage profiles | |
| US8229470B1 (en) | Correlating user interests and location in a mobile network | |
| US10909554B2 (en) | Analyzing big data to determine a data plan | |
| US8229415B1 (en) | Wireless communication data store construction and analysis | |
| JP2019521427A (en) | Network Advisor Based on Artificial Intelligence | |
| US8391465B1 (en) | Customer care call routing | |
| Diaz-Aviles et al. | Towards real-time customer experience prediction for telecommunication operators | |
| US9652972B1 (en) | Maintenance of telecommunications network infrastructure based on alarm scoring | |
| US11792662B2 (en) | Identification and prioritization of optimum capacity solutions in a telecommunications network | |
| US20110106579A1 (en) | System and Method of Management and Reduction of Subscriber Churn in Telecommunications Networks | |
| US20210383285A1 (en) | System and method for allocating resources and services for an event using forecasting | |
| US10123223B1 (en) | System and method for evaluating operational integrity of a radio access network | |
| US9661504B1 (en) | Use of customer impact to prioritize network efforts | |
| US20120201150A1 (en) | Effective method of measuring wireless consumer experience insights | |
| Sultan et al. | Mobile phone price as a proxy for socio-economic indicators | |
| Murad et al. | Impact of COVID-19 Pandemic Measures and Restrictions on Cellular Network Traffic in Malaysia | |
| US11026108B2 (en) | Fault monitoring in a utility supply network | |
| US11871443B1 (en) | Public stewardship entity wireless communication network portal | |
| US20210035135A1 (en) | Dominant customer locations identification systems and methods | |
| JP2023538121A (en) | Device management system and method | |
| van Olst et al. | How will the new entrant telecommunications operator benefit from being new? |
Legal Events
| Date | Code | Title | Description |
|---|---|---|---|
| AS | Assignment |
Owner name: SPRINT COMMUNICATIONS COMPANY L.P., KANSAS Free format text: ASSIGNMENT OF ASSIGNORS INTEREST;ASSIGNORS:JADUNANDAN, KEVIN;LOBO, SHANE A.;SHINHOLSTER, DREW A., JR.;AND OTHERS;REEL/FRAME:028931/0356 Effective date: 20120906 |
|
| STCF | Information on status: patent grant |
Free format text: PATENTED CASE |
|
| AS | Assignment |
Owner name: DEUTSCHE BANK TRUST COMPANY AMERICAS, NEW YORK Free format text: GRANT OF FIRST PRIORITY AND JUNIOR PRIORITY SECURITY INTEREST IN PATENT RIGHTS;ASSIGNOR:SPRINT COMMUNICATIONS COMPANY L.P.;REEL/FRAME:041895/0210 Effective date: 20170203 |
|
| FEPP | Fee payment procedure |
Free format text: MAINTENANCE FEE REMINDER MAILED (ORIGINAL EVENT CODE: REM.); ENTITY STATUS OF PATENT OWNER: LARGE ENTITY |
|
| LAPS | Lapse for failure to pay maintenance fees |
Free format text: PATENT EXPIRED FOR FAILURE TO PAY MAINTENANCE FEES (ORIGINAL EVENT CODE: EXP.); ENTITY STATUS OF PATENT OWNER: LARGE ENTITY |
|
| STCH | Information on status: patent discontinuation |
Free format text: PATENT EXPIRED DUE TO NONPAYMENT OF MAINTENANCE FEES UNDER 37 CFR 1.362 |
|
| FP | Lapsed due to failure to pay maintenance fee |
Effective date: 20191208 |
|
| AS | Assignment |
Owner name: SPRINT COMMUNICATIONS COMPANY L.P., KANSAS Free format text: TERMINATION AND RELEASE OF FIRST PRIORITY AND JUNIOR PRIORITY SECURITY INTEREST IN PATENT RIGHTS;ASSIGNOR:DEUTSCHE BANK TRUST COMPANY AMERICAS;REEL/FRAME:052969/0475 Effective date: 20200401 |