US9092867B2 - Methods for segmenting images and detecting specific structures - Google Patents
Methods for segmenting images and detecting specific structures Download PDFInfo
- Publication number
- US9092867B2 US9092867B2 US13/201,850 US201013201850A US9092867B2 US 9092867 B2 US9092867 B2 US 9092867B2 US 201013201850 A US201013201850 A US 201013201850A US 9092867 B2 US9092867 B2 US 9092867B2
- Authority
- US
- United States
- Prior art keywords
- regions
- interest
- images
- region
- sequence
- Prior art date
- Legal status (The legal status is an assumption and is not a legal conclusion. Google has not performed a legal analysis and makes no representation as to the accuracy of the status listed.)
- Expired - Fee Related, expires
Links
Images


Classifications
-
- G—PHYSICS
- G06—COMPUTING; CALCULATING OR COUNTING
- G06T—IMAGE DATA PROCESSING OR GENERATION, IN GENERAL
- G06T7/00—Image analysis
- G06T7/10—Segmentation; Edge detection
- G06T7/149—Segmentation; Edge detection involving deformable models, e.g. active contour models
-
- G06T7/0081—
-
- G06T7/0089—
-
- G—PHYSICS
- G06—COMPUTING; CALCULATING OR COUNTING
- G06T—IMAGE DATA PROCESSING OR GENERATION, IN GENERAL
- G06T7/00—Image analysis
- G06T7/10—Segmentation; Edge detection
- G06T7/11—Region-based segmentation
-
- G—PHYSICS
- G06—COMPUTING; CALCULATING OR COUNTING
- G06T—IMAGE DATA PROCESSING OR GENERATION, IN GENERAL
- G06T2207/00—Indexing scheme for image analysis or image enhancement
- G06T2207/10—Image acquisition modality
- G06T2207/10072—Tomographic images
- G06T2207/10076—4D tomography; Time-sequential 3D tomography
-
- G—PHYSICS
- G06—COMPUTING; CALCULATING OR COUNTING
- G06T—IMAGE DATA PROCESSING OR GENERATION, IN GENERAL
- G06T2207/00—Indexing scheme for image analysis or image enhancement
- G06T2207/10—Image acquisition modality
- G06T2207/10072—Tomographic images
- G06T2207/10104—Positron emission tomography [PET]
-
- G—PHYSICS
- G06—COMPUTING; CALCULATING OR COUNTING
- G06T—IMAGE DATA PROCESSING OR GENERATION, IN GENERAL
- G06T2207/00—Indexing scheme for image analysis or image enhancement
- G06T2207/20—Special algorithmic details
- G06T2207/20016—Hierarchical, coarse-to-fine, multiscale or multiresolution image processing; Pyramid transform
-
- G—PHYSICS
- G06—COMPUTING; CALCULATING OR COUNTING
- G06T—IMAGE DATA PROCESSING OR GENERATION, IN GENERAL
- G06T2207/00—Indexing scheme for image analysis or image enhancement
- G06T2207/30—Subject of image; Context of image processing
- G06T2207/30004—Biomedical image processing
- G06T2207/30096—Tumor; Lesion
Definitions
- the present invention relates to a method for segmenting images, a method for detecting particular structures, and a related computer device.
- the invention applies to the field of medical imaging, and more particularly the field of positron emission tomography (PET).
- PET positron emission tomography
- the imaging devices for example X scanner (CT for Computed Tomography), magnetic resonance (MRI) or PET, produce images supplying anatomical or functional information.
- CT Computed Tomography
- MRI magnetic resonance
- PET PET
- image processing algorithms so as to help the physician in establishing his diagnosis.
- One image processing consists of a segmentation operation aiming to group together pixels of the image according to predefined criteria. The pixels are thus grouped together in regions that constitute a partition of the image, for example to visualize the organs or particular structures such as tumors.
- Document FR-0505441 describes a method for segmenting a three-dimensional image or sequence of images comprising, in the performance order of the method, the following steps:
- the aim of the invention is to provide a tool and a method for automatically drawing tumors making it possible to effectively distinguish the tumoral zones, even small ones, from healthy zones.
- the invention will facilitate image processing by a nuclear physician or radiotherapist and thereby improve his diagnostic effectiveness and/or train him, if he is a beginner, in simulated or real data.
- the invention is not limited to diagnosis in humans, but can also apply to animals.
- the invention relates to a method for segmenting an image or sequence of three-dimensional images of the aforementioned type, characterized in that the hierarchical linkage step comprises a linkage step using shape and size criteria for regions so as not to link small regions.
- the method for segmenting an image or sequence of three-dimensional images includes one or more of the following features:
- Cost ⁇ ( R 1 , R 2 ) H ⁇ ( R 1 , R 2 ) F ⁇ ( R 1 ) ⁇ F ⁇ ( R 2 ) ⁇ G ⁇ ( R 1 ) ⁇ G ⁇ ( R 2 ) H being the function depending on the variations of the signal in regions R 1 and R 2 , F and G being functions respectively dependent on the shape and size of the region; then a step for linkage of the images according to a minimum linkage cost rule;
- the invention also relates to a method for detecting at least one particular structure over an image or sequence of images, characterized in that it comprises the following steps:
- the plurality of criteria comprises a shape criterion for the regions of interest so as to discriminate the particular structures among the regions of interest.
- the method for detecting at least one tumor on an image or sequence of images segmented into a plurality of regions of interest includes one or more of the following features:
- the invention also relates to a computer device for segmenting an image or a sequence of three-dimensional images of an object acquired by an imaging device comprising:
- the hierarchical linkage means comprises a linkage means using shape and size criteria for the regions so as not to link the small regions.
- the invention relates to a computer device for detecting at least one particular structure on an image or sequence of images, characterized in that it comprises:
- the computer device for processing an image or sequence of three-dimensional images of an object acquired by an imaging device includes one or more of the following features:
- FIG. 1 is a diagrammatic view of an image acquisition and processing installation according to the invention
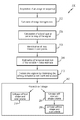
- FIG. 2 is a block diagram illustrating the method for segmenting an image or sequence of three-dimensional images according to the invention
- FIG. 3 is an illustration of successive images obtained during the performance of the segmentation method of an image or sequence of three-dimensional images of a rodent according to the invention.
- FIG. 4 is a block diagram illustrating the method for detecting at least one particular structure in an image or sequence of images according to the invention.
- This invention applies to all types of images, for example medical or more specifically oncology-related.
- FIG. 1 shows an image acquisition and processing installation.
- This installation allows a physician to establish a diagnosis for a patient from an image or series of medical images for the subject.
- This medical image or sequence of images results from the use of an imaging device 102 on an object or subject 104 .
- This imaging device 102 comprises acquisition means 106 and a computer system 108 .
- This computer system 108 is intended to steer the acquisition means 106 and to reconstitute the images using a reconstruction algorithm.
- the imaging device 102 is, for example, an X-ray scanner, a magnetic resonance imaging (MRI) system or a positron emission imaging (PET) system.
- MRI magnetic resonance imaging
- PET positron emission imaging
- the algorithms reconstruct, for all or part of the subject's body 104 , the distribution of a radioactive tracer in the form of a two- or three-dimensional image.
- the images thus obtained are called “raw” 109 because they have not undergone any processing aside from their reconstruction by the image reconstruction algorithm.
- the “raw” images 109 are processed by different algorithms integrated into a computer device 110 intended for example to segment the image or sequence of images 109 , or to detect particular structures in the image, such as tumors.
- the computer device 110 comprises a means 114 for segmenting an image, performing, via a processor, a segmenting method, according to the inventive method that will be described below, intended to partition the raw image or sequence of images 102 into a plurality of regions of interest, for example for the organs, forming a segmented image or sequence of images 116 .
- the computer device 110 has a detection means 118 for detecting at least one particular structure, for example a tumor, on a segmented image or sequence of images 116 .
- This detection means performs, via the processor, a detection method according to the invention, which will be described later.
- the result of this analysis forms a so-called “analyzed” image or sequence of images 120 , which shows the particular structures detected.
- a man-machine interface 119 having a display means, for example a screen, is integrated into the computer device 110 .
- the operator has an information input means relative to the processing of an image or sequence of images 109 or 116 , intended to enter information to perform the processing of the image or sequence of images.
- the input means is for example a keyboard and/or a movement device for a virtual cursor visualized on the display means.
- the operator can display the segmented or “analyzed” image or sequence of images 116 using the man-machine interface display means 119 .
- the computer device 110 helps the doctor improve the efficacy and rapidity of his diagnosis comprising means 122 for automatically adapting a color palette, quantifying 126 diagnostic parameters and a means 128 for comparing these parameters between two images 120 , and a display means 130 , 132 , incorporated into the man-machine interface 119 , information created by these means 122 , 126 and 128 , the operation of which is described below.
- the choice of a color palette for the image takes time from the nuclear physician, and a poor palette risks causing tumors to be missed.
- the color palette is formed by a plurality of colors, for example from white to black, respectively corresponding to minimum P min and maximum P max levels of the palette and associated with the minimum value I min and maximum value I max of the image's intensity. Each color corresponds to a range of values of the intensity of the pixels of the image or sequence of images.
- the physician selects the structure, for example by clicking on it using a virtual pointer, then validates by actuating a button.
- the automatic adaptation means 122 of the color palette then calculates the maximum value R max of the variable measured in the PET image within the region of interest in a given radius and the minimum value R min of the variable measured outside the region in a given radius, for example 5 mm, around said region.
- the minimum level P min , maximum level P max respectively, of the color palette is then reassigned the minimum value R min , maximum value R max respectively, of the variable previously calculated in the region of interest.
- the colors between the black and white are recalibrated regularly between the maximum and minimum values.
- This automatic adaptation means 122 of the color palette of the image is extremely useful for the nuclear physician: it accelerates and improves the detection task, and consequently the establishment of a diagnosis.
- the detection means 118 uses a detection method, according to the invention. It will be described hereinafter. By carrying out this method, regions of interests, called candidates, are detected, and a classification is established according to their probability of being particular structures, such as tumors.
- the display means of the detected structures 130 allows the operator to see all of the candidates, i.e. the regions of interest that seem to be a tumor, for example, between a rank N min and rank N max of the classification established by the detection means 118 .
- the candidates are for example identified by arrows or by a color spot in the image.
- a code for example a color code, is intended to immediately visualize their rank in the classification.
- a quantification means 126 calculates quantitative diagnostic parameters known and used by the physicians to more precisely analyze the particular structures, for example to perform medical follow-up.
- the diagnostic parameters are, for example: the mean or maximum SUV (Standard Uptake Value), the volume of the region, or the total amount of activity in the region.
- a comparison means 128 makes it possible to compare the values of the diagnostic parameters calculated by the quantification means 126 on two different images.
- the computer system 108 of the imaging device 106 includes the image processing device 100 .
- FIG. 2 shows a segmentation method 200 for segmenting a three-dimensional image or sequence of images 109 of a subject 104 , so as to obtain a three-dimensional image or sequence of images partitioned into regions of interest 116 .
- the image or sequence of images 109 acquired by the imaging device 102 comprises a plurality of voxels and measurements for each of the voxels of a variable of the image or sequence of images 109 , during n time intervals (n ⁇ 1).
- FIG. 3 is an illustration of the successive images obtained during the performance of this segmentation method 200 on an image of a rodent obtained by the PET imaging technique.
- said measured variable is the concentration of the tracer.
- this variable is called pharmacokinetic and the regions of interest are called pharmaco-organs.
- the PET emission image is static and the structures to be segmented are tumors.
- the outline of the regions of interest assumes that each organ has a homogenous behavior for a given tracer.
- “Pharmaco-organ” thus in a known manner refers in this description to a structure of the organism whereof all of the elements have an identical response to a tracer. Consequently, a “pharmaco-organ” is a structure within which the concentration of the tracer is homogenous.
- the segmentation method 200 comprises three successive phases: a phase for preparing the image or sequence of images, a phase for dividing the image into regions of interest, and lastly a linkage phase.
- a step for extraction from a background 202 is done.
- the image or sequence of images 109 acquired by the image acquisition device 102 has two zones, one associated with the subject 104 and the other showing a background.
- the PET image only contains noise, reconstruction artifacts and zones not of diagnostic interest (the bed, the patient's gown, etc.). This background can therefore be eliminated from the segmentation without damage, which accelerates it and decreases the risk of error.
- the image or sequence of images is first smoothed before being segmented by a Gaussian function whereof the full width at half maximum maximizes the contrast ratio on the noise at the tumors.
- a transmission image is acquired before or after the emission image on a PET system, so as to correct the emission image from the attenuation of photons by the patient's body.
- a threshold value is defined on this transmission image at an intermediate attenuation value between the air and the soft tissue and makes it possible to remove a mask from the body's tissues, only keeping the voxels whereof the value is greater than said threshold value.
- all or part of the lungs and the lumen of the intestine can be excluded from the mask. These regions being located inside the body, they are bordered with tissues and not connected to the outside of the body.
- the mask of the background 202 -A to be excluded from the segmentation is therefore calculated as the largest connected component (within the meaning of the mathematical morphology) of the opposite of the mask of the body's tissues.
- the segmenting method 200 also comprises a step 206 for calculating a local spatial variance map 204 -A of said variable, for example the PET signal (activity or concentration of the tracer), incorporating the temporal variation of the signal.
- a local spatial variance map 204 -A of said variable for example the PET signal (activity or concentration of the tracer), incorporating the temporal variation of the signal.
- Such a variance is calculated for each voxel of the image or sequence of images 104 .
- SI iterative reconstruction algorithm
- FBP filtered back projection
- ⁇ n partially reflects the noise, and in part the partial volume and/or the physiological movements.
- ⁇ n is the minimum and is a good approximation of ⁇ 2 when V n is not affected by the partial volume effect or by the physiological movements, and reaches local minima in the core of the organs.
- ⁇ n takes into account the local variations of kinetics in the vicinity of the voxel n, corrected by the dependency of the noise on the signal DC t and at ⁇ t .
- ⁇ n is calculated for each voxel n inside the mask of the body delineated in the extraction step from the background 202 .
- the local minima of the local spatial variance map of the PET signal are then extracted, during the performance of an automatic extraction step 206 of at least one core point of the image or the sequence of images 104 .
- the core points are the pixels of the minima of the local spatial variance map of said variable.
- an extraction step 208 is performed for a temporal evolution 208 -A of said variable at each core point.
- An estimate of the overall parameters of the noise is also done.
- the processor calculates the local pharmacokinetics and estimates global parameters of the noise (i.e. ⁇ 2 ) in a vicinity of the core points (of the set ⁇ ).
- the neighborhood used to calculate the activity concentration or the pharmacokinetics within a small region, e.g. a tumor, is of a reduced size to limit the partial volume effect.
- the parameter ⁇ 2 is estimated using the smallest values of the set ⁇ m
- the second phase of the segmentation method 200 comprises a step 210 for dividing the image or sequence of images 104 into a plurality of regions 210 -A.
- the number of core points extracted during the automatic extraction step 206 of at least one core point defines the number of regions of the image or sequence of images partitioned at the end of the division step 210 .
- a so-called “fast marching” method is used to simultaneously extract the active contours of minimal energies that join each voxel m ⁇ to all of the voxels in its neighborhood.
- the voxel n is aggregated to the voxel m ⁇ that minimizes the active contour of the minimal energy that joins the two voxels m and n.
- the energy maps of original active contours of all of the elements ⁇ are calculated simultaneously and competitively on the same map, according to the principle that a voxel is associated with the voxel of ⁇ whereof the energy map reaches it first.
- the PET image of the subject is then partitioned into as many regions as there are voxels in the set ⁇ , i.e. core points, each region being a connected component.
- the last segmentation method phase 200 includes a step 212 for hierarchical linkage of the regions resulting from the division step 210 so as to obtain the three-dimensional image or sequence of images partitioned into regions of interest 212 -A.
- the tumors With a view to detecting tumors, the tumors must be preserved during the linkage, i.e. not be linked.
- the apparent contrast of the small tumors in a PET image is much lower than their actual contrast, due to the Partial Volume effect. In fact, the smaller a tumor, the more it appears in a spherical form in the PET image.
- the hierarchical linkage step 212 comprises two successive linkage steps, one 214 using shape and size criteria of the regions to not link the small regions, and the other without 216 , without shape and size criteria of the regions, of the regions into regions of interest, without shape or size distinction.
- a linkage cost between two regions is calculated from the evolution over time of said variable in each core point and the estimation of the global parameters of the noise extracted during the extraction step 208 .
- the regions are linked according to a minimum linkage cost rule creating a new region or aggregate of regions.
- the linkage costs of the regions two by two are updated (recalculated) at each linkage step and until a number of regions predetermined by the operator exists.
- the linkage cost for a pair of regions or aggregates of regions that are not connected is still infinite.
- the linkage cost, between a region R 1 and a region R 2 is defined:
- Cost ⁇ ( R 1 , R 2 ) H ⁇ ( R 1 , R 2 ) F ⁇ ( R 1 ) ⁇ F ⁇ ( R 2 ) ⁇ G ⁇ ( R 1 ) ⁇ G ⁇ ( R 2 ) where F and G are functions depending respectively on the shape and size of the region.
- the linkage cost between the two regions therefore comprises:
- H ⁇ ( A , B ) 1 T ⁇ ⁇ 1 ⁇ t ⁇ T ⁇ ( ⁇ m A , t - ⁇ m B , t ) 2 , where m A and m B are the core points of regions A and B whereof the local spatial variance of the variable is minimal, i.e.
- the size criterion for a region is its volume.
- the shape criteria for a region is the surface to volume ratio: S ⁇ square root over (S) ⁇ /V. This criterion is independent of the size for a sphere or a cube. It is higher when the region is non-spherical and irrespective of the size of the region. However, it varies little (from 1 to 10) compared to the volume (variation from 1 to 100,000), which is why this ratio is at a significant power, for example 4, to generate a deviation between the spherical structures and the structures with more tortured shapes.
- the hierarchical linkage step 212 is a double linkage comprising a linkage step 218 without shape and size criteria of the regions from the image or sequence or sequence of images divided into regions resulting from the performance of the division step 210 and parallel to the linkage step 214 using shape and size criteria of the regions from the same image or sequence of images followed by the linkage step 216 without shape and sizes criteria of the regions from the image or sequence of images resulting from the performance of the linkage step 214 with shape and size criteria of the regions preceding it.
- This second alternative makes it possible to prevent this preservation of the small tumors from stopping the formation of regions corresponding to the organs, due to the introduction of the shape criterion adapted to the tumors, the processor performs a double linkage, i.e. one for the organs and one for the tumors.
- the first linked regions have little chance of being tumors.
- FIG. 4 is a block diagram illustrating the method 400 for detecting at least one particular structure on an image or sequence of images according to the invention.
- the method for detecting specific structures is carried out by the processor so as to detect tumors.
- This detection method 400 first comprises a step 402 for segmenting the image or sequence of images intended to partition it into a plurality of regions of interest.
- the performance of the segmentation step provides a hierarchical description of the regions delimiting the structures.
- the operator extracts a segmentation image therefrom comprising a number N of regions (N being large enough), or he uses 2M ⁇ 1 or 2R ⁇ 1 regions generated by the hierarchical linkage step 212 .
- the operator uses the 2R ⁇ 1 regions generated by the linkage step 216 without shape or size criteria of the regions made after the linkage step 214 with the shape and size criteria of the regions.
- the detection method 400 for detecting a particular structure also has a step for calculating a plurality of criteria 404 to discriminate between the particular structures to be detected for each region of interest. During its performance, the processor calculates the criteria selected for tumor detection. These criteria are the following, for each region i
- the computer device thus calculates, for each region i, a series ⁇ C j (i) ⁇ 1 ⁇ j ⁇ J of criteria, supposed to assume high values for the regions corresponding to structures to be detected and lower values for the other regions.
- a step 406 is then carried out for calculating an identification function depending on the plurality of criteria for each region of interest.
- the processor calculates the identification function
- the regions are sorted during a step for classification of the regions 408 by decreasing values of their identification function f ⁇ ( ⁇ C j (i) ⁇ 1 ⁇ j ⁇ J ), then a corresponding rank is allocated to them.
- the structure to be detected is identified during the performance of the identification step 410 .
- the region of rank 1 will be the one most likely to be a structure to be detected, for example a tumor.
- the identification method 400 is carried out to identify several different types of structures.
- different identification functions f(1), f(2), . . . , f(L) are defined. It may happen that two or more of these functions are the same, but with different parameter set values ⁇ . These identification functions will probably have some shared identification criteria.
- the detection requires learning on a set B of images b representative of the images in which one hopes to detect the structures (e.g. tumors). These images must therefore contain at least one of these structures, and preferably several.
- the structures to be detected are marked in one way or another as being the structures one is looking for. In another alternative, one also marks other structures as not being structures one is looking for or, failing that, considers that all of the unmarked regions are not structures to be detected.
- the learning step 409 makes it possible, over a certain set of images, to determine the set of parameters ⁇ that optimizes the detection of the structures.
- the learning step can be conducted on several different types of structures, for example metastasis, small tumor, large non-necrotic tumor, necrotic tumor, aggregate of tumors.
- the step for detecting these various types of structures is done simultaneously: all of the identification criteria including the f(1), f(2), . . . , f(L) are functions are calculated for all of the regions. The identification ranks are then calculated for each of these functions and each of these sets of parameters estimated on the learning base.
- the imaging device 102 is an imaging device according to the positron emission tomography technique
- the image or sequence of images of the object or subject 104 is an image or sequence of images of an entire body and the regions of interest resulting from the segmentation method according to the invention are pharmaco-organs, i.e. the regions of interest correspond to functional organs.
- Said variable represents the radioactive concentration at a given moment of at least one active ingredient marked and injected into the body, the set of voxels inside each pharmaco-organ having pharmacological kinetics for distribution of said active ingredient that are similar.
- the variations of the tracer concentration inside a voxel are highly spatially correlated due to the existence of a homogeneity continuum resulting not only from the PET image reconstruction method, but also from the existence of physiological regions that respond to the tracer identically, regions called pharmaco-organs.
- the kinetics are thus assumed to be homogenous within each pharmaco-organ.
- This homogeneity measured as the opposite of the local variance, is maximal at the core of the pharmaco-organs and minimal on the edges of said pharmaco-organs.
- the main non-homogeneity factor of the PET signal in a pharmaco-organ is the so-called “Partial Volume” effect due to the limited resolution of the PET system.
- the body can be animated by physiological movements either of the periodic type, such as breathing, the period of which is reduced in comparison to the acquisition duration of the image or each of the images of the sequence, or of the non-periodic type.
- the periodic type such as breathing
- the period of which is reduced in comparison to the acquisition duration of the image or each of the images of the sequence, or of the non-periodic type.
- the detection method only presents regions sorted from most to least likely to be tumoral. Here, this only involves the relative probability of the regions relative to each other and does not constitute a diagnosis, the final decision falling to the nuclear physician.
- the method can be useful, non-useful or lead to error, but it cannot commit diagnostic errors. It is all the more useful when the nuclear physician is a beginner or not very trained and in organs for which the sensitivity and specificity of the diagnosis are weak without this tool.
- the segmentation method is used to automatically delimit the contour of the tumors in the PET oncology images. Then the automatic method for assisting with the detection of tumors segmented by the segmentation method, based on a sorting of the regions according to their likelihood of being a tumor, makes it possible to improve the sensitivity and specificity of the diagnosis. Lastly, the computer device makes it possible to perform the detection, delineation of the tumors and extraction of diagnostic parameters (contrast, contrast to noise, functional volume) from the automatic method for assisting with detection.
Abstract
Description
-
- dividing the image or sequence of images into a plurality of regions; then
- hierarchically linking the regions resulting from the division so as to obtain the image or sequence of three-dimensional images partitioned into regions of interest.
-
- the hierarchical linkage step also comprises a linkage step of the regions without shape and size criteria for the regions intended to link the regions into regions of interest, without distinguishing by shape or size;
- the step for linking the regions without shape and size of the regions is done after the linkage step using shape and size criteria of the regions and from the image or sequence of images resulting from the performance of this linkage step;
- the hierarchical linkage step is a double linkage also comprising a linkage step without shape and size criteria for the regions from the image or sequence of images divided into regions resulting from the performance of the division step;
- the or each linkage step for the regions without shape and size criteria of the regions comprises a step for calculating a linkage cost, between a region R1 and a region R2, defined by:
Cost(R 1 ,R 2)=H(R 1 ,R 2)
H being a function depending on variations of the signal in regions R1 and R2; then a linkage step for the images according to a minimum linkage cost rule; - the linkage step using shape and size criteria for the regions so as not to link the small regions comprises a step for calculating a linkage cost, between a region R1 and a region R2, defined by:
H being the function depending on the variations of the signal in regions R1 and R2, F and G being functions respectively dependent on the shape and size of the region; then a step for linkage of the images according to a minimum linkage cost rule;
-
- the image or sequence of images comprises a plurality of voxels and measurements for each of the voxels of a variable of the image or sequence of images, during n time intervals (n≧1) and the segmentation method comprises, before the step for division into regions, the following steps intended to define the number of regions separated during the division step:
- a calculation of a local spatial variance map of said measured variable of the image or sequence of images, over time and for each voxel of the image or sequence of images; then
- an automatic extraction of at least one core point of the image or sequence of images, the core points being the pixels of the minima of the local spatial variance map of said variable; the number of core points extracted during this step defining the number of regions of the image or sequence of images divided at the end of the division step;
- the method comprises, after the step for automatic extraction of the core points and before the division step, a step for extracting a temporal evolution of said variable of the or each core point and an estimation of the global parameters of the noise, intended to calculate the linkage cost during the hierarchical linkage step;
- each region resulting from the step for division of the image or sequence of images corresponds to a core point resulting from the step for automatic extraction of the core points of the image or sequence of images and each region groups together the pixels having a similar temporal evaluation of said variable.
- the method comprises a step for excluding a background of the image or sequence of images comprising a step for defining a threshold for the image or sequence of images intended to extract a mask of the object from an image acquired in transmission of the object so as to apply the segmentation method only to the object;
- the exclusion step of the background comprises a smoothing step to maximize a contrast of the image in the small regions of interest before the step for defining a threshold;
- said image or sequence of images is acquired beforehand by an imaging device according to the positron emission tomography technique;
- the image or sequence of images of an object is an image or sequence of images of an entire body, said segmentation method segmenting the body according to a partition into pharmaco-organs;
- the body is animated by physiological movements either of the periodic type, the period of which is reduced in comparison with the acquisition duration of the image or each of the images of the sequence, or the non-periodic type; and
- said variable represents the radioactive concentration at a given moment of at least one active ingredient marked and injected into the body, the set of voxels inside each pharmaco-organ having pharmacological kinetics for distribution of said active ingredient that are similar.
-
- segmentation of the image or sequence of images intended to segment it into a plurality of regions of interest; the segmentation of the image or sequence of images being the result of the performance of a method for segmenting an image or sequence of three-dimensional images of an object as described above;
- calculating a plurality of criteria to discriminate the particular structures to be detected for each region of interest;
- calculating an identification function depending on the plurality of criteria for each region of interest, the identification function being a parametric function depending on a set of parameters;
-
- segmenting the image or sequence of images into a plurality of regions of interest is the result of the performance of a method for segmenting an image or sequence of three-dimensional images of an object having a linkage step without shape and size criteria for the regions after a linkage step with shape and size criteria as described above.
- the method comprises a step for classifying regions of interest according to a probability of being a particular structure to be detected from the calculation of the identification function.
-
- a means for dividing the image or sequence of images into a plurality of regions;
- a means for hierarchical linkage of the regions resulting from the division so as to obtain the three-dimensional image or sequence of images partitioned into regions of interest;
-
- a device for segmenting the image or sequence of images as described above intended to segment it into a plurality of regions of interest;
- a detection means comprising:
- a means for calculating a plurality of criteria to discriminate the particular structures to be detected for each region of interest; the plurality of criteria comprising a shape criteria for the regions of interest so as to discriminate the particular structures among the regions of interest;
- a means for calculating an identification function depending on the plurality of criteria for each region of interest, the identification function being a parametric function depending on a set of parameters.
-
- the device includes:
- a means for automatic adaptation of a color palette for a region of interest of the image or sequence of images designated by an operator; the means for automatic adaptation of a color palette being intended to help the operator establish a diagnosis; and
- a man-machine interface comprising a display means intended to display information generated by the automatic adaptation means of the color palette;
- the man-machine interface comprises a display means for displaying structures detected and classified by the detection means;
- the device comprises a quantification means for diagnostic parameters in a structure designated by the operator, and a comparison means for comparing the diagnostic parameters between at least two images; and the man-machine interface comprises a display means for displaying diagnostic parameters and a result of the comparison done by the comparison means.
- the device includes:
where Vn is a cubic neighborhood of the voxel n, for example size 3×3×3 for tumor detection, μn is the activity or average pharmacokinetics over Vn and an estimate of the signal Sn.
-
- for the
linkage step 216 without shape and size criteria of the regions, by Cost(R1,R2)=H(R1,R2), where H is a function dependent on the variations of the signal in regions R1 and R2, and - for the
linkage step 214 with shape and size criteria of the regions, by
- for the
where F and G are functions depending respectively on the shape and size of the region.
-
- a term taking into account the difference in activity and/or possibly time course between the two regions, the function H,
- a term related to the shape of each of the two regions, the function F, and
- a term related to the size of each of the regions, penalizing the linkage of small regions, the function G.
where mA and mB are the core points of regions A and B whereof the local spatial variance of the variable is minimal, i.e.
-
- a) a linkage of the regions does not correspond to tumors, keeping a high number of regions R, i.e. according to the
linkage step 214 with shape and size criteria for the regions, and - b) a linkage from the segmentation image with R regions resulting from step a) making it possible to link regions corresponding to the same tumor, according to a
linkage step 216 without shape and size criteria of the regions.
- a) a linkage of the regions does not correspond to tumors, keeping a high number of regions R, i.e. according to the
-
- for segmentation of the organs, the
linkage step 218 without shape and size criteria of the regions will be carried out by the processor, and - for segmentation of the tumors, the processor will perform the linkage in two
steps 214 then 216 described in the first alternative.
- for segmentation of the organs, the
-
- criteria related to the activity:
- the contrast is calculated as (μn−υn)/υn where μn is the average of the activity within the neighborhood Vn of the voxel n and where υn is the median of the activity on the periphery of the tumor at a distance from the edges thereof situated between 2 and 4 times the full width at half maximum of the resolution of the PET image.
- criteria related to the activity:
-
-
- the contrast on noise is calculated as (μn−υn)/(υn×σn), where σn,t 2=α2×DCt/Δt, for each voxel n, for a PET image reconstructed by an analytical algorithm and σn 2=α2×υn×DCt/Δt for an image reconstructed by an iterative statistical algorithm. The constant factor α2 being calculated in the PET image during step 4 of the segmentation.
-
-
- a criterion for distinction between tumors and noise points. In order to distinguish between tumors and noise points, the PET image without post-smoothing undergoes a convolution by a Gaussian whereof the full width at half maximum is made to vary between 0 and three times the full width at half maximum, which maximizes the contrast to noise ratio. For each level of smoothing, the local minima of the image Γn are extracted. For each minimum extracted in the smoothing that maximizes the contrast to noise ratio, the full width at half maximum (FWHM) for which this minimum appears in the other images is extracted. The greater this interval, the more the extracted minimum corresponding to the region at a low probability corresponds to a noise peak. The expanse of this interval FWHMMax(i)−FWHMMin(i) is therefore used as selection criterion.
C 3(i)=FWHMMax(i)−FWHMMin(i) - size and shape criteria, as previously defined and used during performance of the segmentation method according to the invention:
- the surface to volume ratio. In fact, the tumors are regions of greater activity, therefore with a higher signal to noise ratio than in a homogenous zone. Consequently, the contours of the tumors are smoother than those of the regions associated with the noise peaks. The small tumors appearing as spheres in the PET images have a high sphericity criterion. This sphericity criterion is lower for larger tumors with a less spherical shape, but this loss of sphericity is offset by a contrast and a high contrast to noise ratio. The sphericity criterion is as follows:
- a criterion for distinction between tumors and noise points. In order to distinguish between tumors and noise points, the PET image without post-smoothing undergoes a convolution by a Gaussian whereof the full width at half maximum is made to vary between 0 and three times the full width at half maximum, which maximizes the contrast to noise ratio. For each level of smoothing, the local minima of the image Γn are extracted. For each minimum extracted in the smoothing that maximizes the contrast to noise ratio, the full width at half maximum (FWHM) for which this minimum appears in the other images is extracted. The greater this interval, the more the extracted minimum corresponding to the region at a low probability corresponds to a noise peak. The expanse of this interval FWHMMax(i)−FWHMMin(i) is therefore used as selection criterion.
-
-
- the volume. In fact, the smallest tumors are greatly affected by the partial volume effect, which decreases their apparent contrast with the surrounding tissues. The main purpose of this detection criterion: C5(i)=1/Vi is to offset the loss of contrast of a tumor due to a smaller size.
-
-
- A criterion of number of points extracted in the tumor during the
extraction step 206 for extracting core points of thesegmentation method 200, so as to separate the tumors from large organs (heart, liver, kidneys). - For tumors, this number of extracted points is smaller (rarely more than three) than in the organs (often more than three). Ni being the number of core points extracted in the tumor during the
extraction step 206 of the core points of thesegmentation method 200,
- A criterion of number of points extracted in the tumor during the
-
- An appearance criterion for the kinetics. The tumors and the inflammatory zones on a dynamic PET image are differentiated according to the pharmacokinetics measured in the regions. They are therefore separated by this kinetics appearance criterion:
- if the kinetics only contains two time points, the slope increases in the tumoral regions. The corresponding criterion is then:
- An appearance criterion for the kinetics. The tumors and the inflammatory zones on a dynamic PET image are differentiated according to the pharmacokinetics measured in the regions. They are therefore separated by this kinetics appearance criterion:
-
-
- if the kinetics contains many time points, the kinetics extracted in a region is compared to a set of kinetics μi (k) specific to the suspected type of cancer, and:
-
which depends on the plurality of criteria for each region of interest. The identification function is a function parametrically depending on a set of parameters Θ={θj}1≦j≦J, the parameters θj being the weights allocated to each criterion Cj(i). The parameters Θ={θj}1≦j≦J can be constant on the image, but also constant by pieces (for example, constant within each organ) or can vary continuously over space (for example, according to a probabilistic atlas describing the organs).
-
- first improve both the sensitivity, by decreasing the number of false negatives, and the specificity, by decreasing the number of false positives, of the diagnosis by the nuclear physician, in particular in the difficult case of small tumors with a contrast that is sometimes weak relative to the background,
- facilitate and accelerate the nuclear physician's work by navigation in the images, tumor detection, extraction of quantitative diagnostic parameters,
- lead a nuclear physician with little experience of lacking practice to progress, on reference data, but also on his own data, by guiding his gaze toward the zones most likely to be tumors, and
- help the radiotherapist by offering a tool for delimiting focal points and zones to be spared.
Claims (26)
Cost(R1,R2)=H(R1,R2)
Cost(R 1 ,R 2)=H(R 1 ,R 2)
Applications Claiming Priority (3)
| Application Number | Priority Date | Filing Date | Title |
|---|---|---|---|
| FR0951289 | 2009-02-27 | ||
| FR0951289A FR2942669B1 (en) | 2009-02-27 | 2009-02-27 | METHODS OF IMAGE SEGMENTATION AND DETECTION OF PARTICULAR STRUCTURES. |
| PCT/FR2010/050218 WO2010097534A1 (en) | 2009-02-27 | 2010-02-10 | Methods for segmenting images and detecting specific structures |
Publications (2)
| Publication Number | Publication Date |
|---|---|
| US20120070052A1 US20120070052A1 (en) | 2012-03-22 |
| US9092867B2 true US9092867B2 (en) | 2015-07-28 |
Family
ID=41136643
Family Applications (1)
| Application Number | Title | Priority Date | Filing Date |
|---|---|---|---|
| US13/201,850 Expired - Fee Related US9092867B2 (en) | 2009-02-27 | 2010-02-10 | Methods for segmenting images and detecting specific structures |
Country Status (4)
| Country | Link |
|---|---|
| US (1) | US9092867B2 (en) |
| EP (1) | EP2401719B1 (en) |
| FR (1) | FR2942669B1 (en) |
| WO (1) | WO2010097534A1 (en) |
Families Citing this family (10)
| Publication number | Priority date | Publication date | Assignee | Title |
|---|---|---|---|---|
| FR2991794B1 (en) * | 2012-06-11 | 2015-12-04 | Commissariat Energie Atomique | METHOD FOR DETERMINING FUNCTIONAL VOLUMES FOR THE DETERMINATION OF BIOCINETICS |
| US9256967B2 (en) * | 2012-11-02 | 2016-02-09 | General Electric Company | Systems and methods for partial volume correction in PET penalized-likelihood image reconstruction |
| DE102014201321A1 (en) * | 2013-02-12 | 2014-08-14 | Siemens Aktiengesellschaft | Determination of lesions in image data of an examination object |
| DE102013210252A1 (en) * | 2013-06-03 | 2014-12-04 | Siemens Aktiengesellschaft | Automatic generation of a selection image data record |
| US9558561B2 (en) * | 2015-01-06 | 2017-01-31 | Varian Medical Systems International Ag | Semiautomatic drawing tool for image segmentation |
| EP3567548B1 (en) * | 2018-05-09 | 2020-06-24 | Siemens Healthcare GmbH | Medical image segmentation |
| US11026649B2 (en) | 2018-06-25 | 2021-06-08 | Siemens Medical Solutions Usa, Inc. | Method and system for determining tumor burden in medical images |
| CN109785296B (en) * | 2018-12-25 | 2023-07-04 | 西安电子科技大学 | CTA image-based three-dimensional spherical index determination method |
| US11508061B2 (en) * | 2020-02-20 | 2022-11-22 | Siemens Healthcare Gmbh | Medical image segmentation with uncertainty estimation |
| CN114359288B (en) * | 2022-03-22 | 2022-06-07 | 珠海市人民医院 | Medical image cerebral aneurysm detection and positioning method based on artificial intelligence |
Citations (16)
| Publication number | Priority date | Publication date | Assignee | Title |
|---|---|---|---|---|
| US4525858A (en) * | 1983-01-03 | 1985-06-25 | General Electric Company | Method and apparatus for reconstruction of three-dimensional surfaces from interference fringes |
| US5768413A (en) * | 1995-10-04 | 1998-06-16 | Arch Development Corp. | Method and apparatus for segmenting images using stochastically deformable contours |
| US5859891A (en) * | 1997-03-07 | 1999-01-12 | Hibbard; Lyn | Autosegmentation/autocontouring system and method for use with three-dimensional radiation therapy treatment planning |
| US6122042A (en) * | 1997-02-07 | 2000-09-19 | Wunderman; Irwin | Devices and methods for optically identifying characteristics of material objects |
| US6307914B1 (en) * | 1998-03-12 | 2001-10-23 | Mitsubishi Denki Kabushiki Kaisha | Moving body pursuit irradiating device and positioning method using this device |
| US6373918B1 (en) * | 1999-03-16 | 2002-04-16 | U.S. Philips Corporation | Method for the detection of contours in an X-ray image |
| US7092548B2 (en) * | 1998-10-23 | 2006-08-15 | Facet Technology Corporation | Method and apparatus for identifying objects depicted in a videostream |
| US7251374B2 (en) * | 2003-10-03 | 2007-07-31 | Confirma, Inc. | System and method for hierarchical analysis of contrast enhanced medical imaging information |
| WO2008001694A1 (en) * | 2006-06-29 | 2008-01-03 | Fujifilm Corporation | Medical image dividing device and medical image dividing program |
| US7382907B2 (en) * | 2004-11-22 | 2008-06-03 | Carestream Health, Inc. | Segmenting occluded anatomical structures in medical images |
| US7558611B2 (en) * | 2001-11-24 | 2009-07-07 | Image Analysis, Inc. | Automatic detection and quantification of coronary and aortic calcium |
| US20100128950A1 (en) * | 2008-10-16 | 2010-05-27 | Icad, Inc. | Computer-Aided Detection of Regions of Interest in Tomographic Breast Imagery |
| US20100272341A1 (en) * | 2002-10-18 | 2010-10-28 | Cornell Research Foundation, Inc. | Method and Apparatus for Small Pulmonary Nodule Computer Aided Diagnosis from Computed Tomography Scans |
| US7941462B2 (en) * | 2008-09-24 | 2011-05-10 | Toshiba Medical Visualization Systems Europe, Limited | Method and apparatus for classification of coronary artery image data |
| US8331641B2 (en) * | 2008-11-03 | 2012-12-11 | Siemens Medical Solutions Usa, Inc. | System and method for automatically classifying regions-of-interest |
| US8346483B2 (en) * | 2002-09-13 | 2013-01-01 | Life Technologies Corporation | Interactive and automated tissue image analysis with global training database and variable-abstraction processing in cytological specimen classification and laser capture microdissection applications |
Family Cites Families (1)
| Publication number | Priority date | Publication date | Assignee | Title |
|---|---|---|---|---|
| FR505441A (en) | 1919-02-05 | 1920-07-29 | Brown | Device for adjusting the position of the guide vanes in centrifugal compressors |
-
2009
- 2009-02-27 FR FR0951289A patent/FR2942669B1/en not_active Expired - Fee Related
-
2010
- 2010-02-10 WO PCT/FR2010/050218 patent/WO2010097534A1/en active Application Filing
- 2010-02-10 US US13/201,850 patent/US9092867B2/en not_active Expired - Fee Related
- 2010-02-10 EP EP10708318A patent/EP2401719B1/en not_active Not-in-force
Patent Citations (18)
| Publication number | Priority date | Publication date | Assignee | Title |
|---|---|---|---|---|
| US4525858A (en) * | 1983-01-03 | 1985-06-25 | General Electric Company | Method and apparatus for reconstruction of three-dimensional surfaces from interference fringes |
| US5768413A (en) * | 1995-10-04 | 1998-06-16 | Arch Development Corp. | Method and apparatus for segmenting images using stochastically deformable contours |
| US6122042A (en) * | 1997-02-07 | 2000-09-19 | Wunderman; Irwin | Devices and methods for optically identifying characteristics of material objects |
| US5859891A (en) * | 1997-03-07 | 1999-01-12 | Hibbard; Lyn | Autosegmentation/autocontouring system and method for use with three-dimensional radiation therapy treatment planning |
| US6249594B1 (en) * | 1997-03-07 | 2001-06-19 | Computerized Medical Systems, Inc. | Autosegmentation/autocontouring system and method |
| US6307914B1 (en) * | 1998-03-12 | 2001-10-23 | Mitsubishi Denki Kabushiki Kaisha | Moving body pursuit irradiating device and positioning method using this device |
| US7092548B2 (en) * | 1998-10-23 | 2006-08-15 | Facet Technology Corporation | Method and apparatus for identifying objects depicted in a videostream |
| US6373918B1 (en) * | 1999-03-16 | 2002-04-16 | U.S. Philips Corporation | Method for the detection of contours in an X-ray image |
| US7558611B2 (en) * | 2001-11-24 | 2009-07-07 | Image Analysis, Inc. | Automatic detection and quantification of coronary and aortic calcium |
| US8346483B2 (en) * | 2002-09-13 | 2013-01-01 | Life Technologies Corporation | Interactive and automated tissue image analysis with global training database and variable-abstraction processing in cytological specimen classification and laser capture microdissection applications |
| US20100272341A1 (en) * | 2002-10-18 | 2010-10-28 | Cornell Research Foundation, Inc. | Method and Apparatus for Small Pulmonary Nodule Computer Aided Diagnosis from Computed Tomography Scans |
| US7251374B2 (en) * | 2003-10-03 | 2007-07-31 | Confirma, Inc. | System and method for hierarchical analysis of contrast enhanced medical imaging information |
| US7382907B2 (en) * | 2004-11-22 | 2008-06-03 | Carestream Health, Inc. | Segmenting occluded anatomical structures in medical images |
| US8126231B2 (en) * | 2006-06-29 | 2012-02-28 | Fujifilm Corporation | Medical image segmentation apparatus and medical image segmentation program |
| WO2008001694A1 (en) * | 2006-06-29 | 2008-01-03 | Fujifilm Corporation | Medical image dividing device and medical image dividing program |
| US7941462B2 (en) * | 2008-09-24 | 2011-05-10 | Toshiba Medical Visualization Systems Europe, Limited | Method and apparatus for classification of coronary artery image data |
| US20100128950A1 (en) * | 2008-10-16 | 2010-05-27 | Icad, Inc. | Computer-Aided Detection of Regions of Interest in Tomographic Breast Imagery |
| US8331641B2 (en) * | 2008-11-03 | 2012-12-11 | Siemens Medical Solutions Usa, Inc. | System and method for automatically classifying regions-of-interest |
Non-Patent Citations (10)
| Title |
|---|
| Cates, et al., "Case Study: An Evaluation of User-Assisted Hierarchical Watershed Segmentation", Medical Image Analysis, Oxford University Press, Oxford, GB, vol. 9, No. 6, Dec. 1, 2005, pp. 566-578. |
| Feng, et al., "Graph-Based Mumford-Shah Segmentation of Dynamic PET with Application to Input Function Estimation", IEEE Transactions on Nuclear Science, IEEE Service Center, NY, US, vol. 52, No. 1, Feb. 2, 2005, pp. 79-89. |
| Hong Guo, Rosemary Renaut, Kewei Chen, Eric Reiman, "Clustering huge data sets from parametric PET imaging"; 2003, Elsevier Ireland Ltd. * |
| Hong Guo, Rosemary Renaut, Kewei Chen, Eric Reiman, "Clustering huge data sets from parametric PET imaging"; 2003, Elsevier Ireland Ltd., DOI-10.1016/S0303-264(03)00112-6. * |
| International Search Report and Written Opinion issued in PCT/FR2010/050218. |
| Maroy, et al., "Segmentation of Rodent Whole-Body Dynamic PET Images: An Unsupervised method Based on Voxel Dynamics", IEEE Transactions o Medical Imaging, IEEE Service Center, Piscataway, NJ, US, vol. 27, No. 3, Mar. 1, 2008, pp. 342-354. |
| Michaelann S. Tartis 1, Dustin E. Kruse, Hairong Zheng, Hua Zhang, Azadeh Kheirolomoom, Jan Marik, Katherine W. Ferrara, "Dynamic microPET imaging of ultrasound contrast agents and lipid delivery", May 6, 2008. * |
| Paolo Zanotti-Fregonara, Renaud Maroy, Claude Comtat, Sebastient Jan, Veronique Gaura, Avner Bar-Hen, Maria-Joao Ribeiro, and Regine Trebossen; "Comparison of 3 Methods of Automated Internal Carotid Segmentation in Human Brain PET Studies: Application to the Estimation of Arterial Input Function" Feb. 17, 2009, Published by the Society of Nuclear M. * |
| Paolo Zanotti-Fregonara, Renaud Maroy, Claude Comtat, Sebastient Jan, Veronique Gaura, Avner Bar-Hen, Maria-Joao Ribeiro, and Regine Trebossen; "Comparison of 3 Methods of Automated Internal Carotid Segmentation in Human Brain PET Studies: Application to the Estimation of Arterial Input Function" Feb. 17, 2009. * |
| Ronald Boellaard, PhD; Nanda C. Krak, MD; Otto S. Hoekstra, PhD; and Adriaan A. Lammertsma, PhD, "Effects of Noise, Image Resolution, and ROI Definition on the Accuracy of Standard Uptake Values: A Simulation Study",Nov. 24, 2003. * |
Also Published As
| Publication number | Publication date |
|---|---|
| WO2010097534A1 (en) | 2010-09-02 |
| US20120070052A1 (en) | 2012-03-22 |
| EP2401719B1 (en) | 2013-01-16 |
| FR2942669A1 (en) | 2010-09-03 |
| EP2401719A1 (en) | 2012-01-04 |
| FR2942669B1 (en) | 2011-04-01 |
Similar Documents
| Publication | Publication Date | Title |
|---|---|---|
| US9092867B2 (en) | Methods for segmenting images and detecting specific structures | |
| US7876938B2 (en) | System and method for whole body landmark detection, segmentation and change quantification in digital images | |
| EP3855391A1 (en) | Methods and systems for characterizing anatomical features in medical images | |
| US9135695B2 (en) | Method for creating attenuation correction maps for PET image reconstruction | |
| US7283652B2 (en) | Method and system for measuring disease relevant tissue changes | |
| US9230320B2 (en) | Computer aided diagnostic system incorporating shape analysis for diagnosing malignant lung nodules | |
| US8229200B2 (en) | Methods and systems for monitoring tumor burden | |
| US11443433B2 (en) | Quantification and staging of body-wide tissue composition and of abnormal states on medical images via automatic anatomy recognition | |
| El-Baz et al. | Appearance analysis for diagnosing malignant lung nodules | |
| El-Baz et al. | Appearance analysis for the early assessment of detected lung nodules | |
| ES2914387T3 (en) | immediate study | |
| US9014456B2 (en) | Computer aided diagnostic system incorporating appearance analysis for diagnosing malignant lung nodules | |
| US20050207630A1 (en) | Lung nodule detection and classification | |
| Kakar et al. | Automatic segmentation and recognition of lungs and lesion from CT scans of thorax | |
| Shimizu et al. | Automated pancreas segmentation from three-dimensional contrast-enhanced computed tomography | |
| JP2023507109A (en) | Automated tumor identification and segmentation from medical images | |
| US9600877B2 (en) | Quantitative imaging | |
| US9087370B2 (en) | Flow diverter detection in medical imaging | |
| Sun et al. | Juxta-vascular nodule segmentation based on flow entropy and geodesic distance | |
| CN112529900A (en) | Method, device, terminal and storage medium for matching ROI in mammary gland image | |
| US20050041869A1 (en) | Method and system for fast normalized cross-correlation between an image and a gaussian for detecting spherical structures | |
| Kurugol et al. | Centerline extraction with principal curve tracing to improve 3D level set esophagus segmentation in CT images | |
| US8165375B2 (en) | Method and system for registering CT data sets | |
| KR102332472B1 (en) | Tumor automatic segmentation using deep learning based on dual window setting in a medical image | |
| US20090069669A1 (en) | Efficient Features for Detection of Motion Artifacts in Breast MRI |
Legal Events
| Date | Code | Title | Description |
|---|---|---|---|
| AS | Assignment |
Owner name: COMMISSARIAT A L'ENERGIE ATOMIQUE ET AUX ENERGIES Free format text: ASSIGNMENT OF ASSIGNORS INTEREST;ASSIGNORS:MAROY, RENAUD;TREBOSSEN, REGINE;FREGONARA, PAOLO ZANOTTI;SIGNING DATES FROM 20110909 TO 20111027;REEL/FRAME:027301/0076 |
|
| STCF | Information on status: patent grant |
Free format text: PATENTED CASE |
|
| FEPP | Fee payment procedure |
Free format text: MAINTENANCE FEE REMINDER MAILED (ORIGINAL EVENT CODE: REM.); ENTITY STATUS OF PATENT OWNER: LARGE ENTITY |
|
| LAPS | Lapse for failure to pay maintenance fees |
Free format text: PATENT EXPIRED FOR FAILURE TO PAY MAINTENANCE FEES (ORIGINAL EVENT CODE: EXP.); ENTITY STATUS OF PATENT OWNER: LARGE ENTITY |
|
| STCH | Information on status: patent discontinuation |
Free format text: PATENT EXPIRED DUE TO NONPAYMENT OF MAINTENANCE FEES UNDER 37 CFR 1.362 |
|
| FP | Lapsed due to failure to pay maintenance fee |
Effective date: 20190728 |