CROSS-REFERENCE TO RELATED APPLICATION(S)
The present application claims priority to U.S. Provisional Application Ser. No. 61/203,334, filed Dec. 22, 2008. The entire content of the above-referenced application is incorporated herein by reference.
STATEMENT REGARDING FEDERALLY SPONSORED RESEARCH OR DEVELOPMENT
This invention was made with government support under Grant No. NS036485 awarded by the National Institutes of Health. The government has certain rights in the invention.
INCORPORATION BY REFERENCE
The material in the text file entitled “12645431SEQLISTING” amended Sep. 26, 2012 and being 82,374 bytes in size, is herein incorporated by reference in its entirety.
BACKGROUND OF THE INVENTION
Because of its stem cell properties and numerous derivatives, the vertebrate neural crest (NC) represents an excellent system for examining questions of cell specification and differentiation during development. A gene regulatory network (GRN) defines the regulatory state of neural crest cells (Meulemans D & Bronner-Fraser M (2004) Dev Cell 7(3):291-299), such that modules of transcription factors function sequentially to first specify the neural plate border and then the nascent neural crest. The intricate regulatory interactions within the NC-GRN start with a group of transcription factors comprising an evolutionarily “inflexible” neural plate border regulatory unit, whose essential upstream function is to establish identity of the progenitor territory (Nikitina N, Sauka-Spengler T, & Bronner-Fraser M (2008) Proc Natl Acad Sci USA 105(51):20083-20088). Neural crest specifiers are genes responsible for formation of the neural crest. Sox10 is one of the earliest neural crest-specifying genes, driving delamination and directly regulating numerous downstream effectors and differentiation gene batteries. FoxD3 is one of the first markers of pre-migratory neural crest in many vertebrate species including mouse, chick, Xenopus and zebrafish (Hromas et al., 1999; Kos et al., 2001; Labosky and Kaestner, 1998; Lister et al., 2006; Pohl and Knochel, 2001; Sasai et al., 2001; Yamagata and Noda, 1998). Identification of region-specific regulatory elements as described herein, provides an important tool for identifying and manipulating the spatially-specified neural crest cells.
SUMMARY OF THE INVENTION
Identified and isolated DNA enhancer sequences are provided for use in constructs to identify early stage embryonic neural crest cells. The enhancer sequences can be used in parallel with short-hairpin RNA in a vector construct for endogenously regulated gene knockdowns. The disclosed enhancer sequences can be used to isolate a selected population of early stage embryonic cells.
In a first aspect of the invention, an isolated DNA sequence is provided, the sequence being selected from the group consisting of SEQ ID NOS: 1-6.
In a second aspect of the invention, an isolated DNA sequence is provided, the sequence being selected from the group consisting of SEQ ID NOS: 7-12.
In a third aspect of the invention, a method is provided for isolating a selected group of cells from a population of cells, the method comprising: transfecting the population of cells with a DNA vector construct having at least one enhancer sequence, wherein activation of the at least one enhancer sequence occurs in the selected population and actuates expression of a reporter protein; identifying the selected group of cells; and collecting the selected population of cells by isolating cells expressing the reporter protein from cells which do not express the reporter protein.
In a fourth aspect of the invention, a DNA vector is provided for down-regulating gene expression, the DNA vector comprising: a short-hairpin RNA sequence under transciptional control of at least one enhancer sequence.
In a fifth aspect of the invention, a method is provided for down-regulating gene expression using a DNA vector comprising a short-hairpin RNA sequence under the transciptional control of at least one enhancer sequence, the method comprising: controlling transcription of the short-hairpin RNA sequence with endogenous factors that actuate the at least one enhancer sequence.
In a sixth aspect of the invention, a method is provided for down-regulating gene expression using a DNA vector comprising a short-hairpin RNA sequence under transciptional control of at least one enhancer sequence, the method comprising: controlling transcription of the short-hairpin RNA sequence with endogenous factors that actuate the at least one enhancer sequence.
In a seventh aspect of the invention, an isolated DNA sequence is provided, the sequence having 60%, 70%, 80%, 90% or 95% homology to a sequence selected from the group consisting of SEQ ID NOS: 1-12.
BRIEF DESCRIPTION OF THE DRAWINGS
The patent or application file contains at least one drawing executed in color. Copies of this patent or patent application publication with color drawing(s) will be provided by the Office upon request and payment of the necessary fee.
FIG. 1 shows a schematic diagram of comparative genomic analysis surrounding the SOX10 gene in chicken, zebrafish, Xenopus, opossum, mouse, rat and human genomes.
FIG. 2 shows a table of primers used to amplify the at least 70% homologous regions across the compared genomes.
FIGS. 3B-3F show EGFP reporter expression activated by SOX10E.
FIGS. 3G-3J show in situ hybridization of endogenous Sox10.
FIGS. 4A-4F show spatially distinct expression of EGFP activated by Sox10E1 and Sox10E2 in HH9, HH15 and HH18 embryos.
FIG. 5A shows homology of Sox10E1 and Sox10E2 across chicken, opossum, mouse, rat and human genomes.
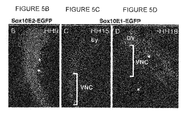
FIGS. 5B-5D show Sox10E1- and Sox10E2-activated EGFP expression in HH9, HH15 and HH18 embryos.
FIG. 5E shows as schematic of a chick embryo with cranial, vagal and trunk regions aligned with a table showing Sox10E1 and Sox10E2 activated EGFP expression.
FIGS. 6A-6B show the region of Sox10E2 from the genomic comparison of FIG. 5A.
FIG. 7A shows putative binding sites within Sox10E2.
FIGS. 7B-7F show Sox10E2-activated EGFP expression and the effect of mutations in putative binding sites in Sox10E2.
FIGS. 8A-8E show Sox10E2-activated EGFP expression and the effect of mutations in putative binding sites.
FIGS. 9A-9I show Sox10E2-activated EGFP expression in the presence of morpholinos to Ets1 and cMyb.
FIGS. 9J-9N show in situ hybridization of cMyb, Sox9 and Ets1 in HH6, HH8, and HH10 embryos.
FIGS. 10A-10F show Sox10E2-activated EGFP expression in the presence of Sox9 morpholinos.
FIGS. 11A-11H show that Sox9, cMyb and Ets1 morpholinos decrease endogenous Sox10 expression.
FIGS. 11I-11L show rescue of the Sox9, cMyb or Ets1 knockdown of Sox10 expression with co-expression of Sox9, cMyb or Ets1 DNA.
FIGS. 12A-12B show FITC labeled Ets1, cMyb and Sox9 morpholinos.
FIGS. 12C-12D show TUNEL staining.
FIGS. 12E-12F show anti-phospho histone H3 (PH3) antibody staining.
FIGS. 12G-12H show overlays of 12A-12F.
FIGS. 12 i-12J show statistical calculations of stained cells.
FIGS. 13A-13J show that overexpression of Sox9, Ets1 or cMyb ectopically induces Sox10E2-activated EGFP expression.
FIG. 13K shows agarose gel from EMSA assay.
FIG. 13L shows a Western blot of a DNA pulldown assay.
FIG. 13M shows results of in vivo qChIP assay.
FIGS. 14A-14F show ectopic Sox10E2-activated EGFP expression with mutations in binding sites in Sox10E2 and misexpression of Sox9, cMyb and Ets1.
FIGS. 15A-15D show Western blots of cross-linked endogenous Ets1, cMyb and Sox9.
FIGS. 16A-16D show calculated direct binding of Ets1, cMyb and Sox9 to Sox10E2.
FIG. 17 shows a schematic diagram of comparative genomic analysis surrounding the FoxD3 gene in chicken, zebrafish, Xenopus, mouse, and human genomes.
FIGS. 18A-18M show in situ hybridization of FoxD3 and NC1-, NC2- and SC1-activated EGFP expression in chick embryos.
FIG. 19 shows a schematic of the sequence dissection of the NC1 enhancer region.
FIGS. 20A-20J show EGFP expression activated by NC1.1 and NC1.2 fragments of NC1 and Mut.7, Mut.8, and Mut.12 mutations of NC1.
FIGS. 21A-21G show EGFP expression activated by binding site mutations in NC1.
FIG. 22 shows a schematic of the sequence dissection of the NC2 enhancer region.
FIG. 23 shows a table of summarizing the expression of NC2 fragments.
FIG. 24A shows short-hairpin miRNA vector under the control of NC1.
FIG. 24B shows short-hairpin miRNA vector with human beta globin introns surrounding the miRNA cloning site and an empty cloning site for an enhancer sequence.
FIG. 25 shows a schematic for the design and concept of short hairpin RNA vectors. Vector 2 differs from Vector 1 in that Vector 2 has surrounded the microRNA with human beta globin intron sequence.
FIGS. 26A-26B show Sox10 knockdown by Sox10 shmiRNA under the control of NC1 enhancer sequence.
FIG. 26C shows corresponding QPCR and FIG. 26D shows endogenous levels of Sox10mRNA by in situ hybridication.
FIGS. 27A-27B show EGFP tracer expression from the NC1-Sox10 shmiRNA vector of FIGS. 26A-26B.
FIG. 28A shows RFP in human ES cells infected with NC1-activated RFP; FIG. 28B shows RFP in human ES cells infected with SOX10E-activated RFP.
DETAILED DESCRIPTION OF THE INVENTION
Dissection of the cis-regulatory regions of the essential neural crest specifiers, Sox10 and FoxD3, has identified enhancer sequence regions with distinct regulatory activities in the chick embryo. A Sox10 enhancer region termed Sox10E (SEQ ID NO: 1) was identified and isolated. From dissection of the Sox10E region, Sox10E1 (SEQ ID NO: 2) and Sox10E2 (SEQ ID NO: 3) were identified and isolated. Three FoxD3 enhancer regions termed NC1 (SEQ ID NO: 4), NC2 (SEQ ID NO: 5), and SC1 (SEQ ID NO: 6) were identified and isolated.
The enhancer regions were identified using a comparative sequence analysis approach between multiple species. Sox10 and FoxD3 are genes important for formation, migration and differentiation, and are therefore, highly conserved. Therefore, in principle, non-coding cis-regulatory regions are also conserved along with the genes they control. As shown herein, the genomic sequences from chick, zebrafish, Xenopus, opossum, rat, mouse and human were compared. Conserved genomic regions isolated in this manner were amplified and subcloned into reporter vectors, and the expression pattern of the reporter in vivo was tested using methods of in and ex ovo electroporation in chick embryos. The embryos were then cultured and allowed to developed for 12-24 hours and subsequently examined for reporter activity.
As further described herein, the Sox10 and FoxD3 enhancer constructs have been subcloned into a variety of expression vectors that simultaneously express fluorescent proteins. These reporter constructs can be introduced into cells either by electroporation or by viral infection using lenti virus. As shown herein, the enhancer constructs isolated from the chicken genome have been used to infect human embryonic stem (ES) cells, wherein the reporter protein was activated in cells directed to differentiate as human neural crest cells (FIGS. 28A, 28B).
Because neural crest cells represent an important stem cell population, the enhancer constructs, as described herein, are important indicators of when a cell has acquired a neural crest fate and, thus, can be utilized in regenerative medicine laboratories for replacing neural crest derivatives. In one embodiment, the enhancer regions, as described herein, are a tool for identifying and isolating neural crest cells. In another embodiment, the enhancer regions, when driving transcription of a short-hairpin RNA expression vector, control targeted gene knockdowns to endogenous levels. In another embodiment, the enhancer regions are used to infect human embryonic stem (ES) cells, thereby providing a means for directing human ES cells to differentiate.
Isolation of Sox10E, Sox10E1 and Sox10E2
Genomic sequences surrounding the Sox10 coding region from chicken, zebrafish, Xenopus, opossum, mouse, rat and human were compared in silico (FIG. 1), employing the ECR Browser program. Using Sox10 BAC clone, genomic fragments of approximately 3-5 kilobases (kb), containing one or more conserved regions (≧70% homology) (FIG. 2) (SEQ ID NOS: 1, 13-18), were cloned into an EGFP (enhanced green fluorescent protein) reporter vector upstream of thymidine kinase (tk) basal promoter (Uchikawa et al. (2003) Dev Cell 4(4):509-519) and functionally tested in vivo for its ability to recapitulate Sox10 expression during early neural crest formation. Using an ex ovo and in ovo electroporation techniques (Sauka-Spengler and Barembaum (2008) Methods Cell Biol 87:237-256), the entire epiblast of stage 4 (HH4) chick embryos, according to Hamburger and Hamilton (HH), or dorsal neural tube of stage HH8-12 embryos were transfected with reporter construct (green), together with a pCI-H2B-RFP (red) ubiquitous tracer to assess transfection extent and efficiency. Embryos were collected after 8-48 hours (HH8 to HH18), fixed and analyzed for EGFP expression.
The results reveal a 3.5 kb fragment, that is approximately 1 kb downstream of the Sox10 coding region, that activates EGFP reporter expression (FIGS. 3B-3F) in a manner that recapitulates endogenous Sox10 transcription (FIGS. 3G-3J), as the neural crest delaminates and migrates from the neural tube. EGFP transcripts were detected in cranial neural crest cells as early as HH8+ (FIG. 3B), in embryos with six somites, when Sox10 is first distinguishable by in situ hybridization (FIG. 3G). Both the EGFP reporter and endogenous Sox10 were maintained on actively migrating cranial neural crest (FIGS. 3D, 3F, 3I) as expression initiates progressively caudally (FIGS. 3I, 3J) (Cheng Y, et al. (2000) Brain Res Dev Brain Res 121(2):233-241.). However, while endogenous Sox10 is down-regulated as crest cells enter the branchial arches (FIG. 3J), expression of the EGFP reporter was maintained in branchial arches (similar to FIG. 4 b). Both Sox10 and EGFP were also expressed in otic placode cells by stage HH10 (FIGS. 3C, 3H) and later, more caudally, in actively migrating, but not early delaminating vagal and trunk neural crest (FIGS. 3D, 3E, 3I, 3J).
Thus, this 3.5 kb Sox10 genomic fragment (denoted Sox10E) (SEQ ID NO: 1) contains regulatory modules that mediate initial Sox10 activation during early neural crest delamination at the cranial, but not more caudal levels. Of the six other fragments upstream of the coding region, five fragments lacked functional activity at the time points of interest. Another 5 kb fragment, denoted Sox10L8 (FIG. 1), exhibited weak EGFP activity in neural crest and otic cells by HH13 (6/6), but not in emigrating neural crest. (The ratio (6/6) refers to the number of times the result was observed over the number of times electroporation was performed. This ratio will be found throughout.)
Two Highly Conserved Regions within Sox10E Genomic Fragment Activate Distinct Spatiotemporal Reporter Expression.
The ECR browser program was used to search for highly conserved sequences, potentially representing minimal essential core regulatory elements. By screening for 70% conservation across 100 bp windows within multiple aligned genomic regions between Sox10 and the first downstream neighboring gene, POLR2F, the program revealed two clusters of ˜160 base pairs (bp) and ˜267 bp within the 3.5 kb Sox10E fragment (SEQ ID NO: 1) (FIG. 5A). Assaying two smaller fragments, each containing one identified conserved region, revealed that they activated EGFP expression in spatially distinct populations and in temporally distinct manners. A 600 bp fragment termed, Sox10E1 (SEQ ID NO: 2), lacked activity in emigrating or migrating cranial crest (FIG. 4A-4D). It was first active in migrating vagal crest at HH15 (FIG. 5C) and in trunk crest, otic vesicle and condensed trigeminal ganglia (FIGS. 5D, 5E, 5F), but did not drive EGFP expression in delaminating vagal or trunk neural crest.
Systematic deletions within the Sox10E (SEQ ID NO: 1) region revealed a second active region—a 264 bp minimal enhancer fragment, termed Sox10E2 (SEQ ID NO: 2), comprised of an essential highly conserved 160 bp core and supporting elements within 59 bp upstream thereof. (FIG. 6). In contrast to the late activating Sox10E1, Sox10E2 displayed enhancer activity as early as HH8+ in the first cranial crest emigrating from the neural tube, mimicking Sox10E activity (FIG. 3B) that intensified through HH9 (FIG. 5B). At HH12-15, Sox10E2 reporter expression was maintained in periocular crest, rostral hindbrain streams and otic vesicle (OV) (FIGS. 4 b, 4 e), but absent from caudal hindbrain or trunk levels (FIGS. 4B, 4C, 4E, 4F). Just as Sox10E (SEQ ID NO: 1) displays regulatory activity within the branchial arches, Sox10E2 (SEQ ID NO: 3) drives EGFP expression in rostral hindbrain crest populating the first two arches (FIGS. 4B, 4E), and Sox10E1 (SEQ ID NO: 2) is active in vagally-derived crest (rhombomeres 6-8) (arrows, FIG. 4B) of posterior branchial arches 3-5 (arrowheads, FIG. 4D). In contrast, expression of endogenous Sox10 is down-regulated upon entering the arches (FIG. 3J). This ectopic expression is indicative of a loss of a repressor element from the Sox10E fragments. The results show that both cis-regulatory fragments Sox10E1 (SEQ ID NO: 2) and Sox10E2 (SEQ ID NO: 3) can regulate Sox10 expression in neural crest and otic regions, but in spatially and temporally distinct patterns. Each Sox10E1 (SEQ ID NO: 2) and Sox10E2 (SEQ ID NO: 3) regulates a portion of endogenous Sox10 expression, which initiates in a rostrocaudal temporal sequence (FIGS. 5E, 5F).
Binding Motifs for SoxE, Ets and Myb are Necessary for Sox10E2 Regulatory Activity.
To identify putative transcription factor binding sites within the 264 bp Sox10E2 regulatory fragment, the corresponding sequences from human, mouse, rat, opossum and Xenopus genomic regions were aligned to chicken and screened for conserved motifs. Concomitantly, sequences were analyzed for known transcription factor consensus sites using Transfac 7.0, rVista and Jaspar programs. This revealed three highly conserved binding motifs (100% homology across amniotes), two for the SoxE family of proteins (Sox8, Sox9, Sox10) and one for Ets factors. Conservation of other putative binding motifs ranged from 50-80% (FIG. 7A). Computationally identified binding motifs within Sox10E2 were tested for function via mutation/deletion analyses. Mutated versions of Sox10E2-EGFP constructs were generated for individual putative binding motifs, electroporated into chicken embryos, and analyzed after 10-12 hours (HH10-12).
Mutation of a putative Ets binding motif, within the enhancer core (M9; FIG. 7A), completely abolished Sox10E2 expression (FIG. 7C; 8/8). Similarly, reporter activity in cranial neural crest (FIG. 7B) was eliminated upon mutation of either SoxE binding site within the essential core region (M8, M11; FIG. 7A), indicating both were required for its activity (FIG. 8 b; 13/13). Interestingly, there are two putative binding motifs for Myb factors in Sox10E2, one within the core and the other in the upstream adjacent supporting region (M2, M12; FIG. 7A), each contributing to regulatory activity. When both were replaced with random sequences, this double mutation completely abolished reporter expression (FIG. 8C; 7/7). Individual mutation of other computationally identified motifs only reduced enhancer activity. For example, perturbations of SoxD (M13; 10/10), Elk/Ets (M4; 7/7) and single Myb (M2, M12; 6/6) sites diminished EGFP signal intensity (FIGS. 7A,7D; FIG. 8D) suggesting they enhance regulatory function. In contrast, several mutations had no effect; e.g. simultaneous mutation of four putative Pax binding sites (M1, M3, M5, M7; FIGS. 7A, 7E; 7/7), deletion of 45 bp within the core region (FIG. 7A, faded portion; 11/11), or mutation of either of two NFκB binding site (M6, M10; FIG. 8; 6/6). Taken together, these results show that SoxE, Ets and Myb binding motifs are each necessary for Sox10E2 regulatory function. In addition to neural crest expression, these mutations also affected expression of the Sox10E2 reporter in the otic placode.
We tested whether SoxE, Ets and Myb binding sites, within the 264 bp Sox10E2 fragment (SEQ ID NO: 3), are essential for regulatory activity of a larger construct from the Sox10 locus. To this end, we mutated these same sites (M2, M8, M9, M11, M12; FIG. 7A) within a much larger genomic fragment (˜3.5 kb) to test whether other genomic regions surrounding these enhancers could compensate for the loss of activity. Whereas the full length, non-mutated construct gave robust GFP staining that recapitulated endogenous Sox10 expression, reporter activity in delaminating neural crest was completely eliminated in the same construct bearing mutations in SoxE, Ets and Myb binding sites within Sox10E2 (FIG. 7F; 6/6). As expected, later reporter expression was observed in migrating vagal and trunk neural crest since the mutated version still contained an intact Sox10E1 enhancer. These results strongly suggest that 264 bp Sox10E2 fragment (SEQ ID NO: 3) represents an essential regulatory module, and that binding sites for SoxE, Ets and Myb proteins are absolutely required for early Sox10 expression within the context of the Sox10 locus.
Knockdown of Ets1, cMyb or Sox9 Diminishes Sox10E2 Regulatory Activity.
To test if Ets1, cMyb and Sox9 transcription factors are required for exogenous Sox10E2 regulatory activity in delaminating neural crest, we co-electroporated either Ets1, cMyb, or Sox9 morpholino with the Sox10E2 reporter construct. The right side of each embryo received morpholino plus Sox10E2 reporter, whereas the left side received reporter plasmid alone. When the reporter construct was co-electroporated with control morpholino, reporter signal on the right side was unaffected and comparable to the contralateral side (FIGS. 9A-9C; 10/10). Conversely, in the presence of cMyb (FIGS. 9D-9F; 11/15), Ets1 (FIGS. 9G-9I; 13/15), or Sox9 morpholino (FIG. 10; 15/15) expression was greatly decreased or abolished. These results show that Ets1, cMyb and Sox9, are independently required for the normal Sox10E2 regulatory activity, therefore making them good candidate factors responsible for the initial regulation of Sox10 through the identified Ets, Myb and SoxE functional binding motifs within Sox10E2.
Knockdown of Ets1, cMyb or Sox9 Diminishes Endogenous Sox10 Expression.
Although cMyb transcripts have been detected in early embryogenesis (Karafiat V, et al. (2005) Cell Mol Life Sci 62(21):2516-2525), their distribution was unknown and has not been described within the context of the neural crest gene regulatory network. Our results, using in situ hybridization, show that cMyb is expressed at stage HH6 in the neural plate border (FIG. 9J), and that transcripts accumulate in the neural folds by HH8, with strongest expression at the dorsal margins containing neural crest precursors (FIGS. 9K, 9K′). At HH10, transcripts are seen in neural crest cells delaminating and emigrating from the cranial neural tube (FIGS. 9L, 9L′). Thus, cMyb, like Sox9 (FIG. 9M) and Ets1 (FIG. 9N), is expressed in presumptive cranial neural crest prior to Sox10. The presence of cMyb at the neural plate border and premigratory neural crest illuminates a new role, at the onset of Sox10 expression, in neural crest cell specification. Its initial expression coincides with that of early neural crest specifiers such as AP-2, c-Myc or Snail2. Furthermore, overexpression of cMyb up-regulates Msx1 and Snail2, and thus, participates in BMP4 input into the epithelial-mesenchymal transition of trunk neural crest (Karafiat V, et al. (2005) Cell Mol Life Sci 62(21):2516-2525).
In order to confirm that endogenous Ets1, Sox9 or cMyb proteins are required as upstream regulators of Sox10 in delaminating crest in vivo, the effects of cMyb, Ets1 or Sox9 morpholinos on endogenous Sox10 expression at HH8+−9 was examined The results reveal a dose-dependent effect on Sox10 expression on the electroporated versus contralateral side. A mild diminution was observed when individual morpholinos were electroporated at 1 mM (Sox9 3/3; cMyb 9/10; Ets1 7/10), but a marked decrease at 3 mM (Sox9 n=5, cMyb and Ets1 n=6, p<0.02; FIGS. 11A-11C, 11E-11G). The effect of cMyb knockdown was less strong than either Ets1 or Sox9 inactivation (phenotypes ranging from 50-75% loss in Sox10 transcript). In contrast, electroporation of a control morpholino had no effect (FIGS. 11L, 11M; 10/10) and co-electroporation of morpholinos with the corresponding mRNAs mutated within the morpholino target region successfully rescued the loss-of-function phenotype (Sox9, n=6, p<0.03; cMyb n=5, p≦0.04; Ets1, n=5, p<0.03; FIGS. 11I-11K). No statistically significant differences were noted in phosphohistone H3 or TUNEL staining between electroporated and control sides of embryos receiving either individual or all three morpholinos (−3 mM). Thus, changes in cell proliferation or cell death cannot account for loss of Sox10 transcript (FIG. 12). The cumulative results indicate that Sox9, cMyb and Ets1 are each required for expression of endogenous Sox10. Importantly, the combined electroporation of all three morpholinos virtually eliminated transcript expression on the electroporated side (n=6, p≦0.01; FIGS. 12D, 12H). As shown herein, Sox9, cMyb and Ets1 together are necessary for initial activation of Sox10.
Sox9, Ets1 and cMyb Ectopically Activate and are Required for Sox10E2 Reporter Expression.
All three SoxE genes, Sox8, Sox9 and Sox10 are expressed by neural crest progenitors (Haldin C E & Labonne C (2009) Int J Biochem Cell Biol.) Because these genes can act redundantly (Finzsch et al. (2008) Development 135(4):637-646; Stolt et al. (2004) Development 131(10):2349-2358; Taylor and Labonne (2005) Dev Cell 9(5):593-603), theoretically any could activate the Sox10E2 reporter construct within the endogenous context. In all vertebrates examined, however, Sox9 expression precedes Sox10 (Antonellis A, et al. (2006) Hum Mol Genet 15(2):259-271; Dutton J R, et al. (2008) BMC Dev Biol 8:105; Werner et al. (2007) Nucleic Acids Res 35(19):6526-6538; Hong and Saint-Jeannet, (2005)Semin Cell Dev Biol 16(6):694-703.) e.g. chick Sox9 is expressed in dorsal neural folds as early as HH8, before either Sox10 or Sox8 (Cheung and Briscoe (2003) Development 130(23):5681-5693). This narrow (4-6 hr) time delay and the Sox9 morpholino knock down results indicate that Sox9 directly regulates Sox10 onset and that this SoxE protein is responsible for initiating Sox10 expression. To test if Sox9 can regulate the identified Sox10E2 regulatory element, Sox9 protein was ectopically expressed using ubiquitous H2B-RFP expression vector. Whereas no ectopic reporter expression was seen when Sox10E2 reporter was co-electroporated with control plasmid (FIGS. 13A, 13F; 9/9), co-electroporation with Sox9 plasmid caused ectopic reporter activity in extra-embryonic region (FIGS. 13B, 13G; 6/6). Similar results were obtained when cMyb was ectopically expressed (FIGS. 13D, 13I; 3/3). Because Sox9 is expressed only transiently in migrating neural crest cells, it is likely that Sox10 and/or Sox8 later act to maintain Sox10 expression.
Co-electroporation of Ets1 plasmid with Sox10E2 reporter resulted in ectopic reporter activation not only in extra-embryonic regions, but also in the trunk neural tube, which normally does not express Ets1(Tahtakran and Selleck (2003) Gene Expr Patterns 3(4):455-458) (arrowheads; FIGS. 13C, 13H; 12/12). In the embryo, Ets1 plays a role in cranial neural crest delamination and appears to mitigate the requirement for S phase synchronization to promote crest emigration in a cluster-like fashion. Moreover, ectopic expression of Ets1 in the trunk results in excess, cluster-like emigration of Sox10-expressing cells (Theveneau et al. (2007) PLoS ONE 2(11): e1142). Since expression of both Ets1 and the Sox10E2-driven reporter is cranial-specific, Sox10E2 acts like a switch distinguishing head and trunk crest populations. Since Sox9 and cMyb, but not Ets1, are normally expressed in the trunk neural tube (Tahtakran and Selleck, (2003) Gene Expr Patterns 3(4):455-458; Karafiat V, et al. (2005) Cell Mol Life Sci 62(21):2516-2525), Cheung and Briscoe, (2003) Development 130(23):5681-5693), ectopic Ets1 in this location likely cooperates with these other factors to induce reporter expression. To support this, combined overexpression of Sox9, Ets1 and cMyb has a broader effect and induces strong ectopic Sox10E2 expression not only extra-embryonically, but also along the neural tube, and in the ectoderm (FIGS. 14 a, 14 d; 5/5).
Sox9, Ets1 or cMyb are each sufficient to trigger ectopic Sox10E2 enhancer activity. However, mutation of individual binding motifs or knock down of individual factors in the endogenous context shows that all three factors are necessary for normal Sox10E2 regulatory activity. Ectopic reporter activity driven by overexpression of individual transcription factors occurs mainly in the extra-embryonic region. This result indicates that these naïve, early stage cells already contain regulatory factors characteristic of multipotent tissue and are, thus, competent to switch on a neural crest-like transcriptional program in response to the proper single inputs.
To test if regulatory activity is mediated via the corresponding binding motifs of Sox9, Ets1 and Myb within Sox10E2 enhancer, we assayed their ability to ectopically activate mutated reporter constructs. Either Sox9-H2B RFP (6/6) or cEts1-H2B RFP (6/6) were co-electroporated with Sox10E2 construct with corresponding binding motif mutations. In all cases, electroporated embryos lacked ectopic reporter expression (FIGS. 13E, 13J). However, ectopic reporter expression was also affected when overexpressing either Ets1, cMyb or Sox9 with other Sox10E2 versions, containing mutations within non-cognate biding sites. For example, when Sox9 and cMyb were overexpressed and combined with a Sox10E2 reporter carrying a mutation within the Ets motif (M9), ectopic reporter expression in the extra-embryonic region was not observed (FIGS. 14B, 14E; 6/6). If Sox9 and Ets1 were over-expressed together with a Sox10E2 carrying a single mutated Myb site (M12), ectopic reporter expression was weak (FIGS. 14C, 14F; 3/3). This shows that for the Sox10E2 enhancer to have ectopic regulatory activity all binding sites need to be functional and indicates a cluster-like conformation of the motifs and synergistic action of the corresponding upstream regulators.
Sox9, Ets1 and cMyb Directly Bind to the Sox10E2 Element.
To determine if Sox9, Ets1 and cMyb can bind directly to the corresponding motifs within the Sox10E2 element, EMSA assays were performed using biotinylated double stranded oligonucleotides containing the corresponding Sox10E2 sub-fragments (underlined, FIG. 7A). A clear electrophoretic shift was observed in samples incubated with nuclear extracts from chicken embryonic fibroblasts overexpressing Sox9, Ets1 or cMyb, but not from the cells transfected with control plasmid (white arrowheads; FIG. 13K). This binding was out-competed by adding 200-fold excess of the corresponding non-labeled (cold) fragment to the binding reaction, showing specificity. The identity of the transcription factors directly binding to Sox10E2 subfragments was confirmed using a streptavidin-biotin DNA pulldown approach followed by Western blot with specific antibodies. Using biotinylated target and scrambled control fragments as bait, it was shown that specific subfragments pull down corresponding binding proteins (Sox9, Ets1 and cMyb) from the embryonic nuclear extracts. Conversely non-coated streptavidin-conjugated magnetic beads or beads coated with scrambled control fragments display no specific protein binding (FIG. 13L).
Direct binding of these transcription factors to the Sox 10E2 enhancer was determined in vivo using quantitative ChIP(qChIP). Crosslinked chromatin isolated from cranial regions of HH8-12 somite embryos was immunoprecipitated using Sox9, Ets1 and cMyb antibodies and ChIP-enriched DNA was used in site-specific QPCR, with primers designed to amplify fragments within the Sox10E2 region. The results show significant (4-8×) enrichment over non-specific antibody indicating that Sox10 locus and, in particular, Sox10E2 regulatory element, was occupied by endogenous Sox9, Ets1 and cMyb proteins in cranial region of HH8-HH10 chicken embryos (FIG. 13M).
As shown in FIGS. 3B-16 d, Sox10E1 and Sox10E2 regulate different stages of Sox10 expression. In one embodiment, Sox10E1 (SEQ ID NO: 2) is used as a vector expression “driver” to identify cells or manipulate in vivo expression (targeted gene knockdown using miRNA, morpholino, etc) at stage HH15. In another embodiment, Sox10E2 (SEQ ID NO: 3) is used as an vector expression “driver” to identify cells or manipulate in vivo expression (at stages HH8-HH15. Cells or in vivo expression can be identified or monitored using a number of methods known in the art—e.g. the “driven” or activated expression can be of any protein that can be monitored. As shown herein, the EGFP and RFP proteins are expressed and the fluorescence is imaged. The enhancer sequences can “drive” the expression of any protein that can be monitored via fluorescence alone if the expressed protein is a fluorescent protein, specific antibody to the protein, or an antibody to a tag fused with the protein. Fluorescent expression allows for the utilization of flow cytometry to specifically isolate and sort those cells which are able to activate the particular enhancer region, from those which cannot.
Expression Patterns of FoxD3 Enhancers: NC1, NC2 and SC1
The genomic region of FoxD3 was examined for conservation across chick, mouse, human and also opossum, Xenopus and zebrafish. The region spanned 160 kb between the genes immediately up and downstream of FoxD3, Atg4C and Alg6 (FIG. 17). Conserved regions varying in size from 1 kb to 4 kb were tested for enhancer activity between stages 8 and 14. Three enhancers, NC1, NC2 and SC1, (SEQ ID NOS: 4-6) were found to drive specific expression. All three enhancers are upstream of the FoxD3 gene. NC1 (SEQ ID NO: 4) is located 20 kb upstream; NC2 (SEQ ID NO: 5) is located 44 kb upstream and SC1 (SEQ ID NO: 6) is located 24 kb upstream.
In situ hybridization of FoxD3 at stage 8 is shown in FIG. 18A. NC1-directed (SEQ ID NO: 4) expression of EGFP in the premigratory cranial neural crest beginning at stage 8 is shown in FIG. 18B. In situ hybridization of FoxD3 in stage 11 embyros as shown in FIG. 18C. NC1-directed expression in stage 11 embryos continued during neural crest migration (FIG. 18D, 18G) and lasted until approximately stage 14, at which stage only very weak EGFP expression could be detected. Only the neural crest from the midbrain to rhombomere (R) 2 showed expression from NC1 (FIG. 18D). Expression of NC-1-EGFP was not seen caudal to R3.
In contrast to NC-1, the enhancer NC2 (SEQ ID NO: 5) directed strong expression of EGFP in the premigratory and migratory neural crest in R6 and caudal to R6 (FIG. 18E). The expression pattern of EGFP in the vagal and trunk neural crest matched the mRNA expression of FoxD3, and both extend to the premigratory crest at the level of the 4th most caudal somite. Expression of NC-2-activated EGFP in R4 crest was weaker, in contrast to the early expression in the vagal and trunk neural crest (FIG. 18E). There was also weak expression of EGFP in the migrating cranial neural crest (FIG. 18H), which was not detected prior to stage 9+. The first expression of EGFP driven by NC2 was observed in the vagal and trunk levels of stage 9 embryos in pre-migratory neural crest. Additionally, very weak EGFP expression was also observed in the developing optic retina from stage 11 and a very small number of cells displayed very weak expression in the otic vesicle at stage 12.
To examine the temporal regulation of the NC2 enhancer (SEQ ID NO: 5), stage 8 to 14 embryos were electroporated using in ovo electroporation, and the embryos were fixed after 24-48 h. FoxD3 is expressed in most pre-migratory and migratory vagal and trunk neural crest, but is not expressed by pre-migratory and migratory melanoblasts, which undergo emigration approximately 24 h after the emigration of ganglionic neural crest. NC2-activated EGFP expression was observed in melanoblasts prior to and during migration (FIG. 18L), in addition to expression in the dorsal root ganglia. To confirm that this expression was due to activity of the enhancer and not stability of EGFP, in situ hybridization for EGFP was performed and mRNA for EGFP was detected in melanoblasts and dorsal root ganglia. Expression of NC-2-activated EGFP was also observed in neural crest cells migrating along the enteric nervous system.
The third FoxD3 enhancer, SC1 (SEQ ID NO: 6), directed expression of EGFP in a subset of cells in the vagal and trunk neural tube from R5 caudally beginning at stage 8+. These SC-1-activated EGFP-positive cells were seen in the dorsal neural tube in the location of pre-migratory neural crest, and also in at mid levels of the neural tube (FIG. 18F, 18J). Some SC-1-activated EGFP-positive cells were seen emigrating from the neural tube, however expression was not seen in the dorsal root ganglia. FIG. 18M shows a cross-section of E4 embryo with EGFP driven by SC1 enhancer. Electroporation at stage 12 and fixation after 24 and 48 h revealed no expression with SC1-activated EGFP in the dorsal root ganglia or other neural crest derivatives, but SC-1-activated EGFP was seen in a population of interneurons in the neural tube at E4, which corresponds to a region of FoxD3 expression (FIG. 18M).
Dissection of NC1
To reduce the size of NC1 (SEQ ID NO: 4) and NC2 (SEQ ID NO: 5) to the minimal core regions, primers (Table 1) were designed to remove portions from the ends of the enhancers. The conservation of the enhancers was used as a guide to identify the most important regulatory regions. Using this approach, NC1 (SEQ ID NO: 4) was reduced to a 550 bp fragment referred to as NC1.1 (SEQ ID NO: 7) (FIG. 19) and does not show a loss of activity (FIGS. 20A, 20B). A further deletion to a 300 bp fragment referred to as NC1.2 (SEQ ID NO: 8) (FIG. 19) resulted in weak EGFP expression specifically in the cranial neural crest (FIGS. 20C, 20D), suggesting that the regions at the ends of the 300 bp fragment enhance activity of the enhancer, however the critical regions are present within the 300 bp fragment. The core 300 bp NC1.2 fragment (SEQ ID NO: 8) was further analyzed by substituting 100 bp regions of sequence within the larger 550 bp fragment. This analysis revealed that 200 bp was required for expression of the enhancer. 20 bp blocks were substituted across this region, and a region of 80 bp was found that was critical for detectable expression of EGFP shown in Mut.7, Mut.8 (FIGS. 20E-20H). A further 80 bp region was required as a unit for EGFP expression, however the individual 20 bp regions within this secondary region when substituted only resulted in weakened EGFP expression. (Mut.12, FIGS. 20I, 20J). None of the substitutions resulted in expansion of the enhancer-driven expression. The 172 bp fragment (NC1.3) (SEQ ID NO: 9) (FIG. 19) containing the most critical and supportive regions was amplified and electroporated into embryos, and the 80 bp putative core region (NC1.4) (SEQ ID NO: 10) was tested in tandem by placing two copies into the ptkEGFP construct (see Example X). The 172 bp fragment (SEQ ID NO: 9) alone drove very weak expression of EGFP in the neural crest. Two copies of the 80 bp core region (SEQ ID NO: 10) was sufficient to drive EGFP expression in the same pattern as the full-length NC1 enhancer, albeit slightly weaker, suggesting that the 80 bp region contains the core elements essential for activity of this enhancer.
Binding site mutations were made within NC1. Potential transcription factor binding sites within the core region were identified using Rvista, MatInspector and Jasper (FIG. 21A). Mutations were made to these sites by substituting 6-8 bp of the core binding site as shown in Table 2. Mutations to the Ikaros binding site or to the Ets/Zeb binding site did not affect expression of EGFP (FIGS. 21B, 21C), however mutation of the homeodomain site or Ets/Gata site resulted in loss of EGFP expression (FIGS. 21D-21G). Msx1 and Lmx1b are two of the homeodomain proteins expressed in the neural folds prior to expression of FoxD3, and candidates for regulation of FoxD3. Ets 1 is expressed specifically in the cranial neural crest just after the onset of FoxD3 expression. We tested whether these genes could be regulating FoxD3 expression by co-electroporating one or more FITC-conjugated morpholinos to knockdown these genes together with an NC1 reporter directing expression of Cherry. There was no effect on the expression of the NC1 enhancer or on endogenous FoxD3 using a morpholino against Ets1 (at 1 or 2 mM).
Dissection of NC2
The NC2 (SEQ ID NO: 5) region was analyzed using the same process of deletions and substitutions as that employed to dissect NC2 (FIG. 22). Interestingly, the most highly conserved region of NC2 was not required for activity of the enhancer, and when tested alone drove no activity. This allowed reduction of the full-length enhancer to a 1339 bp fragment called NC2.3 (SEQ ID NO: 11) (FIG. 22), in which all further analysis was conducted. NC2.4 (SEQ ID NO: 12) is a 600 bp fragment that directs expression in the vagal and trunk neural crest, but not in the cranial migrating crest. 100 bp and 30 bp substitutions within NC2.9 (FIG. 22), isolated from NC2.3 narrowed the required regions of the enhancer activity in the vagal and trunk neural crest to approximately 120 bp, with auxiliary regions on either side of the core being required for strong expression.
FIG. 23 shows a chart summarizing the EGFP expression when “driven” by various NC1 and NC2 subfragments and mutations as indicated.
As shown in FIGS. 17-22, NC1, NC2 and SC1 regulate stages of FoxD3 expression. In one embodiment, NC1, NC1.1, NC1.2, NC1.3 or NC1.4 (SEQ ID NOS: 4, 7-10) is used as a vector expression “driver” to identify cells or manipulate in vivo expression (e.g. gene knockdowns using miRNA, morpholinos, etc) at stages HH8-HH14. In another embodiment, NC2 (SEQ ID NO: 5) is used as a vector expression “driver” to identify cells or manipulate in vivo expression at stages HH9-HH24. In another embodiment, SC1 (SEQ ID NO: 6)) is used as a vector expression “driver” to identify cells or manipulate in vivo expression at stages HH8-HH24. Cells or in vivo expression can be identified or monitored using a number of methods known in the art—e.g. the “driven” or activated expression can be of any protein that can be monitored. As shown herein, the EGFP and RFP proteins are expressed and the fluorescence is imaged. The enhancer sequences can “drive” the expression of any protein that can be monitored via specific antibody to the protein, or an antibody to a tag fused with the protein. Fluorescent expression allows for the utilization of flow cytometry to specifically isolate and sort those cells which are able to activate the particular enhancer region, from those which cannot.
Binding sites in the Enhancer Regions of SEQ ID NOS 1-12
The presence of transcription factors and their ability to bind a DNA site is the mechanism for activating an enhancer region that then subsequently activates expression of an endogenous gene or expression protein in a vector construct. Specific manipulation of the binding sites, which are commonly 6 basepairs in length, indicates that a one base pair mutation within the six, does not disrupt transcription factor binding. However, two or more mutations within 6 basepairs, (in a transcription factor binding site), has shown disrupted reporter expression, due to the inability for the transcription factor to bind. Accordingly, in one embodiment, an enhancer region is provided having a DNA sequence of any one of SEQ ID NOS: 1-12 or a DNA sequence of any one of SEQ ID NOS: 1-12 having one or more nucleotide mutations, but no more than one mutation within any 6 consecutive nucleotides. More than one nucleotide mutation in a region outside of a transcription factor binding site does not disrupt reporter expression.
As mentioned previously, early naive cells contain regulatory factors characteristic of multipotent tissue and are, thus, competent to switch on a neural crest-like transcriptional program in response to the proper signal inputs. Accordingly, in one embodiment, an enhancer region of the present invention (any one of SEQ ID NOS: 1-12) is utilized in early uncommitted cells to induce neural crest traits. The early uncommitted cells are any cells sharing similar neural crest develop, e.g. human, mouse, rat, avian.
Short-Hairpin RNA
The critical issue with short-hairpin vectors is that their constitutive expression driving high copy numbers within a cell which, following splicing, results in large numbers of MiR vector arms saturating the cell transcriptional machinery. To control this, in one embodiment, a short-hairpin miRNA system is disclosed wherein short hairpins are generated at lower, but still effective levels and whose expression is limited to a specific time and location within the developing embryo. This offers the further advantage of addressing more specific questions on the role of a particular gene at a particular time or location during development.
In FIGS. 24A, 24B two alternative vectors are shown. The vector of FIG. 24A provides a strong knockdown of (down-regulation of) gene expression with moderate EGFP expression, and the miRNA vector of FIG. 24B which is used in parallel with the EGFP as a tracer, gives a strong EFGP signal but with weaker knockdown. The example vector shown here combines the NC1 (SEQ ID NO: 4) enhancer driving expression of a short hairpin RNA designed against Sox10 (‘FoxD3-shSox10’) or against RFP (‘FoxD3-shRFP’) for control. This is expressed in the pre-migratory cranial neural crest from approximately 4 somite stage to the 10 somite stage. The EGFP expression (FIGS. 27A, 27B) and mRNA expression patterns observed with in situ hybridization for each vector (FIGS. 26A, 26B). The same knockdown was analysed by QPCR (FIG. 26C). The loss of Sox10 expression on the targeted side is apparent in shSox10 vectors but not in shRFP control vectors. FIG. 26D shows in situ hybridization of Sox10 mRNA.
Proof of specificity is the major test for any method of gene knockdown. To demonstrate that no non-targeted genes are affected by the expression of the vector, RNA was extracted from control and electroporated sides of embryos expressing either FoxD3(NC1)-shSox10 or FoxD3 sh-RFP. Following cDNA synthesis, QPCR was performed for a panel of 3 related neural crest specifier genes—FoxD3, Sox9 and MSX. Sox9 and MSX levels are unaffected by introduction of either vector, demonstrating that the loss of Sox10 was not due to uncontrolled side effects within the early embryo. The loss of FoxD3 is caused by feedback and cross-regulation with Sox10, indicating that Sox10 is necessary for the maintained expression of FoxD3 within the embryo.
An analysis comparing the use of existing pRFPRNAi vectors (Das et al 2006) to morpholinos was performed by (Mende et al 2008) who observe that sh-MiR vectors cause many non-specific defects and recommend against using these in early embryos. These non-specific effects include both ectopic and loss of expression of non-targeted genes. It was found that, irrespective of the gene targeted, these vectors disrupted otic cup morphology and caused loss of otic markers such as Pax2. As a further control for specificity, we performed in situ hybridization on embryos expressing the FoxD3 premigratory-shSox10 vector. We find that otic cup morphology and Pax2 expression is unaffected in the electroporated half compared to the non-electroporated control.
Although short hairpin based RNA interference vectors exist for avian model systems (Das et al. 2006) their use in early development has been limited by non-specific effects resulting from constitutive expression and high expression levels. These compromise the accuracy of our understanding of gene function gained by studying the knockdown. For these reasons, a vector system where targeted knockdown can be controlled to endogenous levels and locations using enhancer activity is advantageous. This offers a significant improvement on existing vectors.
Isolating Neural Crest Cells Using Neural Crest Enhancer DNA Fragments
In one embodiment, a method for isolating a specific Hamburger and Hamilton stage or stages of neural crest cells using enhancer DNA of the present invention as the driver for EGFP expression in a vector. After electroporation of the enhancer activated EGFP vector into the chick embryos, embryonic neural crest cells having the stage-specific enhancer binding proteins will activate the EGFP, and these cells can be isolated by flow cytometry as further described in the Examples.
Infection of Sox10 and FoxD3 Enhancers into Human Embryonic Stem (ES) Cells
Sox10E (SEQ ID NO: 1) and NC1 (SEQ ID NO: 4) were both separately subcloned into an RFP lentiviral vector. Human embryonic stem (ES) cells were infected with each vector separately, differentiated into neural crest fate and imaged by microscopy for RFP expression. Both NC1 (FIG. 28A) and Sox10E (FIG. 28B) were activated to direct RFP expression in those cells. The enhancers of the present invention function in human cells. Given the stage-specificity of the enhancers as disclosed herein, an enhancer construct of the present invention subcloned into human cells would allow for identification and isolation of cells corresponding to the stage(s) represented by the enhancer region. In one embodiment, enhancers of the present invention are used to identify early stage cells. In another embodiment, enhancers of the present invention are used to identify early stage human cells. In another embodiment, enhancers of the present invention are used to induce neural crest traits with directed differentiation in early stage uncommitted cells.
Conservation and Function of Homologous Sequences Across Species
As discussed and shown herein, the Sox10 and FoxD3 enhancers and their subfragment sequences (SEQ ID NOS: 1-12) are conserved across several species. It has been shown previously that enhancer sequences from one species can replace endogenous enhancers of another species, as reported in Abbasi et al., 2007, PLoS ONE, 2(4): e366. Homologous sequences are known to function in vivo across species as shown herein (FIGS. 28A, 28B) and as reported in Jiang et al. 2009, Stem Cells Dev. 18(7): 1059-1070). Thus, the chick embryonic enhancer sequences as described herein are not limited to in vivo function in the chick embryo, and can be utilized in other organisms, including, but not limited to, human, mouse, rat, opossum, zebrafish and xenopus.
Accordingly, in one embodiment, an isolated DNA sequence is provided, wherein the sequence has at least 60% homology to one selected from the group consisting of SEQ ID NOS: 1-12. In another embodiment, an isolated DNA sequence is provided, wherein the sequence has at least 70% homology to one selected from the group consisting of SEQ ID NOS: 1-12. In another embodiment, an isolated DNA sequence is provided, wherein the sequence has at least 80% homology to one selected from the group consisting of SEQ ID NOS: 1-12. In another embodiment, an isolated DNA sequence is provided, wherein the sequence has at least 90% homology to one selected from the group consisting of SEQ ID NOS: 1-12. In another embodiment, an isolated DNA sequence is provided, wherein the sequence has at least 95% homology to one selected from the group consisting of SEQ ID NOS: 1-12
EXAMPLES/METHODS
Comparative Genomic Analyses and Cloning of Sox10 and FoxD3 Regulatory Regions.
Highly conserved genomic regions were identified using ECR browser. Binding motifs were predicted using Jaspar database and P-Match program from Transfac database. FIGS. 1A and 17 show a schematic diagram showing comparative genomic analysis using ECR browser.
In FIG. 1, chicken, zebrafish, Xenopus, opossum, mouse, rat and human genomic sequences were compared between Sox10 and neighboring genes, Slc16A8 and PolR2F. Red peaks=highly conserved elements; blue=coding exons; green=transposable elements and simple repeats. Boxed Sox10 putative regulatory regions L8 (L=late) and E (E=early) show activity in neural crest. UTRs shaded in yellow.
FIG. 17 shows the genomic region of chicken FoxD3 compared to other vertebrates using the UCSC and Rvista programs. The genomic region analyzed was 160 kb, from the 3′ end of the Atg4C gene immediately upstream of FoxD3, to the start of the Alg6 gene immediately downstream Regions that were conserved across most or all vertebrates were identified and primers were designed to amplify the conserved regions from BACs CH261-166E22 and CH261-100C15. The primers used to amplify these regions and further dissect these regions, are shown in Table Y. The amplified regions were directionally cloned into the ptkEGFP vector (Uchikawa et al., 2003) donated by H. Kondoh, Osaka University, Japan) using KpnI and XhoI sites.
In general, putative regulatory regions were amplified with Expand High Fidelity Plus (Roche, Indianapolis, Ind.), from chicken BAC DNA (BACPAC, Oakland, Calif.) and cloned into the ptk-EGFP vector (Uchikawa et al. (2003) Dev Cell 4(4):509-519). Sox10 and FoxD3 genomic regions were amplified with the Expand High Fidelity Plus PCR System using BAC DNA clones as the template (Chicken BAC library Chori 26). Each fragment, ranging from ˜3 kb-5 kb in size, was cloned into the SmaI-linearized ptk-EGFP vector. The ptk-EGFP reporter vector has the Herpes simplex virus thymidine kinase basic promoter upstream of enhanced GFP and was a kind gift of Dr. Hisato Kondoh. The clones with the appropriate orientation were identified by colony PCR and sequenced. The plasmid DNA of the correct clones was prepared and purified using the Endo-free maxi kit (Qiagen) and eluted in EDTA-free buffer.
ptk-Cherry and pCI H2B-RFP plasmids were generated for use in this study. ptk-Cherry reporter vector was made by swapping EGFP with Cherry fluorescent protein in the ptk-EGFP reporter vector (Uchikawa et al. (2003) Dev Cell 4(4):509-519). pCI H2B-RFP, a tracer construct that yields ubiquitous expression under the control of chicken beta actin promoter is a bicistronic vector allowing for exogenous expression of proteins of interest and of a fusion protein of human histone 2B and monomeric RFP protein, translated from the IRES. The pCI H2B-RFP construct was made by replacing the 3xNLS-EGFP sequence within the pCI-GFP vector (Megason S G & McMahon A P (2002) Development 129(9):2087-2098) with the H2B-mRFP1 sequence.
In situ hybridization. Whole-mount in situ hybridization was performed using a procedure previously described (Wilkinson DG (1992) In situ Hybridization: A Practical Approach, ed Wilkinson DG (IRL Press, Oxford), pp 75-83). Whole mounts were imaged using microscope and Axiovision camera and software. Fluorescent in situ procedure using GFP probe was adapted from (Acloque and Nieto (2008) Methods Cell Biol 87:169-185). Whole-mount in situ hybridizations were performed using a procedure previously described (Antonellis A, et al. (2008) PLoS Genet 4(9):e1000174). Fluorescent in situ procedure using GFP probe was adapted from (Dutton et al. (2008) BMC Dev Biol 8:105. With the exception of the Sox9 and Sox10 probes, which were prepared using full length cDNA constructs (a gift from Yi-Chuan Cheng) (Cheng et al. (2000) Brain Res Dev Brain Res 121(2): 233-241), as a template, all other digoxigenin-labeled antisense RNA probes, were prepared from chicken EST clones obtained from (ARK Genomics and MRC geneservice). Sox10 template was digested with HindIII, while all EST clones were linearized using NotI restriction enzyme. All antisense RNA probes was synthesized using T3 RN A polymerase, according to standard protocols. FIG. 3B shows that at HH8+, GFP transcripts are detected by fluorescent in situ hybridization in cranial neural crest (CNC) similar to endogenous Sox10 expression (FIG. 3G). Distribution of EGFP transcripts (FIGS. 3C, 3D, 3E; HH9+; HH12, H15, respectively) is similar to endogenous Sox10 in FIGS. 3H-3J, respectively. FIG. 3D shows EGFP expression at HH12 in rhombomere 5 stream surrounding the otic vesicle (OV) resembles endogenous Sox10 (FIG. 3I), but is missing in vagal neural crest (VNC). (FIG. 3F). Cross section of embryo in FIG. 3D shows specific Sox10E regulatory activity in CNC around optic vesicle (OpV). (FIGS. 3G-3J) show endogenous Sox10 expression at HH8+−HH15; (OP is otic placode).
Ex Ovo and in Ovo Electroporations.
Chicken embryos were electroporated at stages HH4-HH8 to target the cranial neural crest cell population and at stages HH10-12 to target vagal and/or trunk neural crest cells following previously described electroporation procedures (Sauka-Spengler and Barembaum (2008), Methods Cell Biol 87:237-256). In ex-ovo experiments, the DNA plasmid constructs (enhancer driven reporter with ubiquitously-expressing tracer) were introduced in the entire epiblast of the early chicken embryo, while in in-ovo electroporations only one half of the neural tube received the DNA. Injected DNA plasmid concentrations were as follows: 2 μg/μl of ptk-EGFP or ptk-Cherry reporter construct, containing each of Sox 0 or FoxD3 putative cis-regulatory regions or the Sox10E2, NC1, NC2 and SC1 mutated versions, combined with 1 μg/μl of either tracer (pCI H2B-RFP) or expression constructs (Sox9-pCI H2B-RFP or Ets1-pCI H2B-RFP).
Microscopy and Immunohistochemistry.
The electroporated embryos were collected at different stages, fixed in 4% paraformaldehyde O/N and then washed three times in PBS at room temperature. A Zeiss axioskop2 Plus fluorescence microscope equipped with the AxioVision software was employed to image the embryos. Images were processed using Adobe Photoshop CS2. After imaging, embryos were cryo-protected in two steps: 15% sucrose/PBS and 7.5% gelatin/15% sucrose/PBS, equilibrated and mounted in 20% gelatin/PBS and frozen in liquid nitrogen. 12 μm cryosections were collected on Super Frost Plus slides (Fischer Scientific, Pittsburgh, Pa.) and de-gelatinized for 2×10 minutes at 42° C. in PBS. To intensify EGFP signal, the sections were washed 4× in PBS for 5 minutes, blocked for 1 hour in 10% Donkey serum/PBTW (PBS/0.1% Tween-20) and stained with 1:1000 anti-GFP primary antibody (Abcam Inc., Cambridge, Mass.) followed by 1:2000 Donkey anti-goat Alexa-Fluor 488-conjugated secondary antibody (Molecular probes). Sections were subsequently washed, cover slipped and imaged using the same imaging procedure described for the in situ whole-mounts.
Dissection of Sox10 Downstream Putative Regulatory Region and Mutation of Candidate Binding Sites.
The 3.5 kb genomic region downstream Sox10 coding (Sox10E) was divided into smaller regions, dissected and mutated fragments amplified using Expand High Fidelity Plus PCR System (Roche Applied Science, Indianapolis, Ind.). For the initial dissection of the Sox10E fragment, the following primers were used:
| |
Sox10E1_5′, |
| |
(SEQ ID NO: 19) |
| |
5′-ATTAGGTACCTCTGATACAGATGCAAGGCTG-3′ |
| |
|
| |
Sox10E1_3′, |
| |
(SEQ ID NO: 20) |
| |
5′-TAATCTCGAGAATTTGCAGCACTGTGGCCTT-3′; |
| |
|
| |
Sox10E2_5′, |
| |
(SEQ ID NO: 21) |
| |
5′-AATTGGTACCGGCAAGAGTGGCAATTTAACC-3′ |
| |
|
| |
Sox10E2_3′, |
| |
(SEQ ID NO: 22) |
| |
5′-ATTACTCGAGATTGCTTCCCCCTAGACAGTT-3′; |
| |
|
| |
Sox10E3_5′, |
| |
(SEQ ID NO: 23) |
| |
5′-TTTTGGTACCTAACCAGGGAGGAGTTGTGG-3′ |
| |
|
| |
Sox10E3_3′, |
| |
(SEQ ID NO: 24) |
| |
5′-AATTCTCGAGAAGGCCCACAGCAGAGTG-3′. |
To perturb candidate binding sites within the Sox10E2 fragment, we used single or fusion PCR as previously described (Nikitina N, Sauka-Spengler T, & Bronner-Fraser M (2008) Proc Natl Acad Sci USA 105(51):20083-20088; Sauka-Spengler T & Bronner-Fraser M (2006) Curr Opin Genet Dev 16(4):360-366).
The primers having mutations are listed here. Mutated regions are underlined, the mutated nucleotides are shown in bold and fusion primer sequences are italicized:
| First 2 Pax sites clusters (M1, M3)_5′, |
| (SEQ ID NO: 25) |
| 5′-AATTGGTACCGGCAA AGCCCATG - ATTTAACCTACAACTGCTGAG |
| |
| CTTGTAGGA AGCCCATG GGCGACTGTGCTTCCGGCT-3′; |
| |
| Myb(M2)_5′, |
| (SEQ ID NO: 26) |
| 5′-ATTAGGTACCTGGCAAGAGTGGCAA- GGGATGGACTGGTAGATGG |
| |
| AAG TGTAGGACTGTGACTGGCGA-3′; |
| |
| Second 2 Pax cluster sites (M5, M7)_3′, |
| (SEQ ID NO: 27) |
| 5′-TCCCTGCTCCTGCT-GCTTATCA TGGGCT GGGATCCCCTTTCA TG |
| |
| GGCT CTGCCCCAGCCGGAAGCACAGT-3′; |
| |
| Ets/Elk(M4)_5′, |
| (SEQ ID NO: 28) |
| 5′-ATTAGGTACCTGGCAAGAGTGGCAA-TTTAACCTACAACTGCTGA |
| |
| GCTTGTAGGACTGTGACTGGCGACTGT ATGGTTAAT TGGGGCAGTGCC |
| |
| ACTGAAA-3′; |
| |
| NFKB1 (M6)_3′, |
| (SEQ ID NO: 29) |
| 5′-TGCTGCTTATCAGTGATG- AGCCCATGGTCTCAGTGGCACTGCCC |
| |
| CAG3′; |
| |
| Lef/Tcf/SoxE (M8)_3′, |
| (SEQ ID NO: 30) |
| 5′-TCTCATCAAATCACCT CCATCTA - CCCTGCTCCTGCTGCTTATCA |
| |
| GT-3′; |
| |
| Ets(M9)_3′, |
| (SEQ ID NO: 31) |
| 5′-AATTCTCGAGATTGCTTCCCCCTAGACA-GTTGGGCCTTTGTGCC |
| |
| CTGAGCAGGTTGCTGTGGAAACCCCCAAT GGG CTCTCTGGCCAGAGCT |
| |
| GGCT-3′; |
| |
| NFKB1/Lef/Tcf/Ets1_3′, |
| (SEQ ID NO: 32) |
| 5′-AATTCTCGAGTTGCTTCCC-CCTAGACAGTTGGGCCTTTGTGCCC |
| |
| TGAGCAGGTTGCTGTGG AGCCCATGGTC TTCCTCTCTGGCCAGAGC-3′; |
| |
| SoxE/Lef/Tcf(M10)_3′, |
| (SEQ ID NO: 33) |
| 5′-ATTACTCGAGATTGCTTCCCCC-TAGACAGTTGGGC G T A TG C GCC |
| |
| CTGAGCAGGTTGCTGTGGAAA-3′; |
| |
| Myb(M11)_3′, |
| (SEQ ID NO: 34) |
| 5′-ATTACTCGAGATTGCTTCCCCCTA- CTCCATAA GGCCTTTGTGCC |
| |
| CTGAGCA-3′; |
| |
| SoxD(M12)_3′, |
| (SEQ ID NO: 35) |
| 5′-ATTACTCGAG GCCAA TTCCCCCTAGAC-AGTTGGGC-3′; |
| |
| Δ1_3′, |
| (SEQ ID NO: 36) |
| 5′-AATTTCCTCTCTGGCCAGA AAATCACC-TATTGTTTCCCT-3′; |
| |
| R1_3′, |
| (SEQ ID NO: 37) |
| 5′-AATTTCCTCTCTGGCCAG CCTCGGGGTACA-TCCGCTCGGAGGAG |
| |
| GCCTCCCAGCCCATGGTCT AAATCACCTATTGTTTCCCT-3′. |
After PCR amplification, each fragment was purified using PCR product purification kit (Qiagen) and cloned into KpnI/XhoI digested ptk-EGFP or ptk-Cherry reporter vectors.
Dissection of Sox10E Reveals Two Regulatory Regions that Function in a Specific Spatiotemporal Manner: Sox10E2 is Activated as Cranial Neural Crest Cells Delaminate Whereas Sox10E1 is Activated in Later Migrating Vagal and Trunk Neural Crest.
As shown in FIG. 4A, Sox10E1 displays no activity in the delaminating cranial neural crest. FIG. 4B shows Sox10E2 activity at HH15 persists in the periocular crest and otic vesicle, but also within the first two branchial arches, which lack endogenous Sox10; Sox10E2 is not expressed in vagal neural crest at this stage or later, at HH18 shown in FIG. 4C, and in either the vagal or trunk regions (FIGS. 4D-4F). Panels corresponding to (4A-4C), respectively, show expression of the co-electroporated tracer pCI H2B-RFP to locate cells that received both tracer and reporter EGFP plasmid DNA.
Sox10E Contains Distinct Spatiotemporal Regulatory Elements: Sox10E2 in Delaminating CNC and Sox10E1 in Later Migrating Vagal (VNC) and Trunk Neural Crest. FIG. 5A
Schematic diagram representing dissection of Sox10E fragment, located ˜1 kb downstream of Sox10 locus (UTR in yellow). Two smaller active regulatory fragments embedded within Sox10E, (Sox10E1&E2) each contain a conserved region (red bar) with 70% sequence homology between amniotes. (FIG. 5B) Sox10E2 drives expression in delaminating CNC (arrows) at HH8+; Sox10E1 is first active in migrating VNC at HH15 (FIG. 5C). (FIG. 5D) Sox10E1 activity persists in migrating VNC, trunk neural crest (arrow), and branchial arches 3-5(arrowhead). (FIG. 5E) Table 1 summarizes distinct temporal (HH9-18) and spatial (cranial/vagal/trunk) regulatory activity of Sox10E1 &E2. Red−=no expression; green+=EGFP reporter expression.
Dissection of the Sox10E2 Fragment Reveals an Essential Core and Auxiliary Region Important for Optimal Enhancer Activity.
FIG. 6A shows a magnified image showing the region Sox10E2 from the genomic comparative analysis illustrated in FIG. 4A. Each uncolored peak represents the conserved region equivalent to region Sox10E2 in chicken for each corresponding species. Inside the conserved regions, the red patches represent highly conserve portions (85%-90% each 30 bp). The order of species from top to bottom: mouse, dog, opossum, rat, chimpanzee and human. FIG. 6B shows a schematic diagram representing the different successive deletions (dotted lines) that were performed, guided by bioinformatics, to identify the main core element responsible for the regulatory activity of the Sox10E2 fragment. The horizontal black lines represent different fragments. Red portion of the lines denote a 160 bp region (referred to as essential core element), highly conserved between dog, chimpanzee and human, capable of producing weak tissue-specific regulatory activity in delaminating cranial neural crest cells. The gray arrow points to a non-conserved 59 bp-long auxiliary region, necessary for achieving strong regulatory activity of the enhancer. CNC, cranial neural crest.
Transcriptional Inputs into the Sox10E2 Regulatory Region.
FIG. 7A shows a schematic diagram showing sequence alignment of 264 bp Sox10E2 regulatory region; essential core region shaded in yellow. Colored frames indicate computationally identified putative transcription factors binding motifs. Mutations M1-M13 were replaced by random sequences. Faded sequence shows a 45 bp region deleted or replaced by mCherry coding sequence. Highlighted in blue are conserved nucleotides within putative binding motifs. Single dashed lines indicate no bases in aligned sequence. Thick dashed lines indicate nonalignable sequences. Thick solid underlines delineate Sox 0E2 subfragments used in EMSA and pulldown assays. Sox10E2-driven EGFP expression in CNC (FIG. 7B) is abolished upon mutation of an Ets1 binding motif (FIG. 7C), but only decreased after mutation of putative SoxD motif (FIG. 7D), and not affected by simultaneous mutation of four putative Pax sites (FIG. 7E). Simultaneous inactivation of SoxE, Ets and Myb binding sites (M2, M8, M9, M11, M12) within a much larger genomic region abolishes reporter expression in delaminating CNC (FIG. 7F).
Dissection of FoxD3 NC1, NC2 and SC1 Regions
Enhancer substitutions and mutations: regions of NC1 and NC2 were replaced with EGFP coding sequence using fusion PCR. For 100 bp substitutions, the region of EGFP used was (SEQ ID NO: 38) (tggagtacaactacaacagccacaacgtctatatcatggccgacaagcagaagaacggcatcaaggtgaactt-caagatccgccacaacatcgaggacgg); for 20 bp substitutions (SEQ ID NO: 39) (tggagtacaactacaacagc), and for 30 bp substitutions (SEQ ID NO: 40) (acaagcagaagaacggcatcaaggtgaact). Amplified fusion constructs were cloned into ptk-EGFP vector (Uchikawa et al., 2003) and sequenced to ensure no additional mutations were present. Binding sites were identified using Jasper, RVista and MatInspector databases and programs. Sites were mutated by substituting 6-8 adjacent critical base pairs with GFP coding sequence, using fusion PCR and cloning into ptkEGFP. Mutated enhancer constructs were electroporated into stage 4 embryos as described herein and analyzed for expression of EGFP and RFP at stages 8-12.
| TABLE 1 |
| |
| Text in capitals indicates enhancer sequence, and text in small letters indicates |
| replacement GFP sequence. To make the mutated constructs, mutated primers were paired |
| with flanking primers (NC1.1 or NC2.9), amplified and joined in a fusion |
| PCR reaction using the flanking primers. |
| Primer Name |
Primer Sequence |
| |
| NC1 fwd |
(SEQ ID NO: 41) |
AGGCAATGCAGCGAATGACC |
| |
| NC1 rev |
(SEQ ID NO: 42) |
GACCTGGCTCCCTTTGAGAC |
| |
| NC1.1 fwd |
(SEQ ID NO: 43) |
CAGTAAGCTTTCCACCAACA |
| |
| NC1.1 rev |
(SEQ ID NO: 44) |
GTTTAACATACACTATCCAATG |
| |
| NC1.2 fwd |
(SEQ ID NO: 45) |
CCTGAAGCTCATTAGATATT |
| |
| NC1.2 rev |
(SEQ ID NO: 46) |
CCGACATTTGGGAAATTAAA |
| |
| NC1.3 fwd |
(SEQ ID NO: 47) |
CATTAGATATTCCCTGG |
| |
| NC1.3 rev |
(SEQ ID NO: 48) |
AAAGAGGCCAGTAATTGTC |
| |
| NC1 80 bp core fwd |
(SEQ ID NO: 49) |
CATTAGATATTCCCT |
| |
| NC1 80 bp core rev |
(SEQ ID NO: 50) |
CCCACAGAGATTGCT |
| |
| NC1.1 Mut 1 fwd |
(SEQ ID NO: 51) |
caagcagaagaacggcatcaaggtgaacttcaagatccgccacaacatcgaggacgg |
| |
|
GAGACTCTCCCT |
| |
| NC1.1 Mut 1 rev |
(SEQ ID NO: 52) |
gatgccgttcttctgcttgtcggccatgatatagacgttgtggctgttgtagttgta |
| |
|
ctccaAAACCCACTGAA |
| |
| NC1.1 Mut 2 fwd |
(SEQ ID NO: 53) |
caagcagaagaacggcatcaaggtgaacttcaagatccgccacaacatcgaggacgg |
| |
|
ACTTAAGCTAAATGG |
| |
| NC1.1 Mut 2 rev |
(SEQ ID NO: 54) |
gatgccgttcttctgcttgtcggccatgatatagacgttgtggctgttgtagttgta |
| |
|
ctccaCTCCTATTGGCA |
| |
| NC1.1 Mut 3 fwd |
(SEQ ID NO: 55) |
caagcagaagaacgg catcaaggtgaacttcaagatccgccacaacatcgaggacg |
| |
|
gCGGATTTTGGTG |
| |
| NC1.1 Mut 3 rev |
(SEQ ID NO: 56) |
gatgccgttcttctgcttgtcggccatgatatagacgttgtggctgttgtagttgta |
| |
|
ctccaCGATTAATGTAACTC |
| |
| NC1.1 Mut 4 fwd |
(SEQ ID NO: 57) |
agtacaactacaacagcCATTAGATATTCC |
| |
| NC1.1 Mut 4 rev |
(SEQ ID NO: 58) |
tgttgtagttgtactccaAAGAATTCTCTTTT |
| |
| NC1.1 Mut 5 fwd |
(SEQ ID NO: 59) |
agtacaactacaacagcATTCTCCTAAGTA |
| |
| NC1.1 Mut 5 rev |
(SEQ ID NO: 60) |
tgttgtagttgtactccaAGCTTCAGGAAA |
| |
| NC1.1 Mut 6 fwd |
(SEQ ID NO: 61) |
agtacaactacaacagcTAACAGGATTTTC |
| |
| NC1.1 Mut 6 rev |
(SEQ ID NO: 62) |
tgttgtagttgtactccaATAGGCCAGGGA |
| |
| NC1.1 Mut 7 fwd |
(SEQ ID NO: 63) |
agtacaactacaacagcGAGCAATCTCTG |
| |
| NC1.1 Mut 7 rev |
(SEQ ID NO: 64) |
tgttgtagttgtactccaTAAAATCTAATTACTTAG |
| |
| NC1.1 Mut 8 fwd |
(SEQ ID NO: 65) |
agtacaactacaacagcAATAGGAGACTC |
| |
| NC1.1 Mut 8 rev |
(SEQ ID NO: 66) |
tgttgtagttgtactccaTGATCTGTTGAAA |
| |
| NC1.1 Mut 9 fwd |
(SEQ ID NO: 67) |
agtacaactacaacagcTCTGGCCTTACC |
| |
| NC1.1 Mut 9 rev |
(SEQ ID NO: 68) |
tgttgtagttgtactccaCCCACAGAGATT |
| |
| NC1.1 Mut 10 fwd |
(SEQ ID NO: 69) |
agtacaactacaacagcAGCATGGATAAC |
| |
| NC1.1 Mut 10 rev |
(SEQ ID NO: 70) |
tgttgtagttgtactccaGGGAGAGTCTCCTA |
| |
| NC1.1 Mut 11 fwd |
(SEQ ID NO: 71) |
agtacaactacaacagcTGGGAGTTAATAG |
| |
| NC1.1 Mut 11 rev |
(SEQ ID NO: 72) |
tgttgtagttgtactccaGCCCTGCTGGTAA |
| |
| NC1.1 Mut 12 fwd |
(SEQ ID NO: 73) |
agtacaactacaacagcACTGGCCTCTTT |
| |
| NC1.1 Mut 12 rev |
(SEQ ID NO: 74) |
tgttgtagttgtactccaGCCTGGATGTTA |
| |
| NC1.1 Mut 13 fwd |
(SEQ ID NO: 75) |
agtacaactacaacagcTTACATTAATGCACT |
| |
| NC1.1 Mut 13 rev |
(SEQ ID NO: 76) |
tgttgtagttgtactccaAATTGTCCTATTAAC |
| |
| NC1.1 Mut 14 fwd |
(SEQ ID NO: 77) |
agtacaactacaacagcACTTAAGCTAAATG |
| |
| NC1.1 Mut 14 rev |
(SEQ ID NO: 78) |
tgttgtagttgtactccaAAAGAGGCCAGTA |
| |
| NC2 fwd |
(SEQ ID NO: 79) |
TGAGTGTGCCTCCATGTGTC |
| |
| NC2 rev |
(SEQ ID NO: 80) |
GATGGTGCAGCACACGGTTG |
| |
| NC2.1/NC2.4 rev |
(SEQ ID NO: 81) |
TGTGGTAGGCTTATTGTTTTGCT |
| |
| NC2.2 rev |
(SEQ ID NO: 82) |
TCGGTTTTGTTTCACAGTTTG |
| |
| NC2.3/NC2.4/ |
(SEQ ID NO: 83) |
GGTGCATAGAACAAACTGTG |
| |
| NC2.6/NC2.9 fwd |
|
|
| |
| NC2.5 fwd |
(SEQ ID NO: 84) |
GCACTGGGTTCATGAAGTTTC |
| |
| NC2.5 rev |
(SEQ ID NO: 85) |
CTACCTCAGAAGGCATTGTA |
| |
| NC2.7/NC2.8 fwd |
(SEQ ID NO: 86) |
CGATTCTCTGTCTGCCAATTT |
| |
| NC2.8/NC2.9/NC2.10 rev |
(SEQ ID NO: 87) |
GTTCACCCAGTAAACCAGTA |
| |
| NC2.10 fwd |
(SEQ ID NO: 88) |
TGTCATCTTCCGCTCACTT |
| |
| NC2.9 Mut 1 fwd |
(SEQ ID NO: 89) |
caagcagaagaacggcatcaaggtgaacttcaagatccgccacaacatcgaggacgg |
| |
|
GGAAACTGATGG |
| |
| NC2.9 Mut 1 rev |
(SEQ ID NO: 90) |
gatgccgttcttctgcttgtcggccatgatatagacgttgtggctgttgtagttgta |
| |
|
ctccaGACATAACTTTGTC |
| |
| NC2.9 Mut 2 fwd |
(SEQ ID NO: 91) |
caagcagaagaacggcatcaaggtgaacttcaagatccgccacaacatcgaggacgg |
| |
|
AAATTACTCCGATT |
| |
| NC2.9 Mut 2 rev |
(SEQ ID NO: 92) |
gatgccgttcttctgcttgtcggccatgatatagacgttgtggctgttgtagttgtac |
| |
|
tccaCCAAATACTTTCACT |
| |
| NC2.9 Mut 3 fwd |
(SEQ ID NO: 93) |
caagcagaagaacggcatcaaggtgaacttcaagatccgccacaacatcgaggacgg |
| |
|
TAGCAAGGGGCTT |
| |
| NC2.9 Mut 3 rev |
(SEQ ID NO: 94) |
gatgccgttcttctgcttgtcggccatgatatagacgttgtggctgttgtagttgta |
| |
|
ctccaGTATCATTTCAATTAG |
| |
| NC2.9 Mut 4 fwd |
(SEQ ID NO: 95) |
caagcagaagaacggcatcaaggtgaacttcaagatccgccacaacatcgaggacgg |
| |
|
CCGCTACCTTCA |
| |
| NC2.9 Mut 4 rev |
(SEQ ID NO: 96) |
gatgccgttcttctgcttgtcggccatgatatagacgttgtggctgttgtagttgta |
| |
|
ctccaCAGCAGCCACTT |
| |
| NC2.9 Mut 5 fwd |
(SEQ ID NO: 97) |
caagcagaagaacggcatcaaggtgaacttcaagatccgccacaacatcgaggacgg |
| |
|
GTATTCATCCCCAA |
| |
| NC2.9 Mut 5 rev |
(SEQ ID NO: 98) |
gatgccgttcttctgcttgtcggccatgatatagacgttgtggctgttgtagttgta |
| |
|
ctccaTGGTAGGCTTAT |
| |
| NC2.9 Mut 6 fwd |
(SEQ ID NO: 99) |
caagcagaagaacggcatcaaggtgaacttcaagatccgccacaacatcgaggacgg |
| |
|
CAGTAGGAAAAAC |
| |
| NC2.9 Mut 6 rev |
(SEQ ID NO: 100) |
gatgccgttcttctgcttgtcggccatgatatagacgttgtggctgttgtagttgta |
| |
|
ctccaAACACTTATCTCTAC |
| |
| NC2.9 Mut 7 fwd |
(SEQ ID NO: 101) |
caagcagaagaacggcatcaaggtgaacttcaagatccgccacaacatcgaggacgg |
| |
|
TAGTTCAACTGTGT |
| |
| NC2.9 Mut 7 rev |
(SEQ ID NO: 102) |
gatgccgttcttctgcttgtcggccatgatatagacgttgtggctgttgtagttgta |
| |
|
ctccaAACCGAGCGCAA |
| |
| NC2.9 Mut 8 fwd |
(SEQ ID NO: 103) |
caagcagaagaacggcatcaaggtgaacttcaagatccgccacaacatcgaggacgg |
| |
|
TCAGTGCAATTC |
| |
| NC2.9 Mut 8 rev |
(SEQ ID NO: 104) |
gatgccgttcttctgcttgtcggccatgatatagacgttgtggctgttgtagttgta |
| |
|
ctccaGAACTATTTTGGAT |
| |
| NC2.9 Mut 9 fwd |
(SEQ ID NO: 105) |
gaagaacggcatcaaggtgaactATGGGCAATAAT |
| |
| NC2.9 Mut 9 rev |
(SEQ ID NO: 106) |
ttgatgccgttcttctgcttgtCCAAATACTTTCA |
| |
| NC2.9 Mut 10 fwd |
(SEQ ID NO: 107) |
gaagaacggcatcaaggtgaactACCTCCCTGTTA |
| |
| NC2.9 Mut 10 rev |
(SEQ ID NO: 108) |
ttgatgccgttcttctgcttgtGGCAACCAAACT |
| |
| NC2.9 Mut 11 fwd |
(SEQ ID NO: 109) |
gaagaacggcatcaaggtgaactGAAATGATACAAAT |
| |
| NC2.9 Mut 11 rev |
(SEQ ID NO: 110) |
ttgatgccgttcttctgcttgtCATGACTTTTTTG |
| |
| NC2.9 Mut 12 fwd |
(SEQ ID NO: 111) |
gaagaacggcatcaaggtgaactCTGCCAATTTAG |
| |
| NC2.9 Mut 12 rev |
(SEQ ID NO: 112) |
ttgatgccgttcttctgcttgtAATTAGTTACTAGC |
| |
| NC2.9 Mut 13 fwd |
(SEQ ID NO: 113) |
gaagaacggcatcaaggtgaactGGTCAAATGAGC |
| |
| NC2.9 Mut 13 rev |
(SEQ ID NO: 114) |
ttgatgccgttcttctgcttgtACAGAGAATCGG |
| |
| NC2.9 Mut 14 fwd |
(SEQ ID NO: 115) |
gaagaacggcatcaaggtgaactGTTTGAAGTGGC |
| |
| NC2.9 Mut 14 rev |
(SEQ ID NO: 116) |
ttgatgccgttcttctgcttgtCTTGACCACAAC |
| |
| NC2.9 Mut 15 fwd |
(SEQ ID NO: 117) |
gaagaacggcatcaaggtgaactCTTGGTGTGGAC |
| |
| NC2.9 Mut 15 rev |
(SEQ ID NO: 118) |
ttgatgccgttcttctgcttgtATAGTTTCATGAAT |
| |
| NC2.9 Mut 16 fwd |
(SEQ ID NO: 119) |
gaagaacggcatcaaggtgaactCATTACCCCATA |
| |
| NC2.9 Mut 16 rev |
(SEQ ID NO: 120) |
ttgatgccgttcttctgcttgtCCCCTTGCTATG |
| |
| NC2.9 Mut 17 fwd |
(SEQ ID NO: 121) |
gaagaacggcatcaaggtgaactCACAGATAGCAA |
| |
| NC2.9 Mut 17 rev |
(SEQ ID NO: 122) |
ttgatgccgttcttctgcttgtTCCAGAGGAGTC |
| |
| NC2.9 Mut 18 fwd |
(SEQ ID NO: 123) |
gaagaacggcatcaaggtgaactGCTACCTTCAGC |
| |
| NC2.9 Mut 18 rev |
(SEQ ID NO: 124) |
ttgatgccgttcttctgcttgtCAGCACTCTCCT |
| |
| NC2.9 Mut 19 fwd |
(SEQ ID NO: 125) |
gaagaacggcatcaaggtgaactTCTGTGTCAGTC |
| |
| NC2.9 Mut 19 rev |
(SEQ ID NO: 126) |
ttgatgccgttcttctgcttgtGGTGGTAGGCTT |
| |
| NC2.9 Mut 20 fwd |
(SEQ ID NO: 127) |
gaagaacggcatcaaggtgaactCTGACCAGGATA |
| |
| NC2.9 Mut 20 rev |
(SEQ ID NO: 128) |
ttgatgccgttcttctgcttgtGAAGCTTTTGATG |
| |
| NC2.9 Mut 21 fwd |
(SEQ ID NO: 129) |
gaagaacggcatcaaggtgaactTAAGTGTTGTATTC |
| |
| NC2.9 Mut 21 rev |
(SEQ ID NO: 130) |
ttgatgccgttcttctgcttgtAGGCAGCCACTG |
| |
| SC1 fwd |
(SEQ ID NO: 131) |
GACAAAGATAACCATCCTCC |
| |
| SC1 rev |
(SEQ ID NO: 132) |
CACTTCTTCAATTGCTGAGG |
| |
| SC1.1 rev |
(SEQ ID NO: 133) |
ATAGCAAAGACACATTGTGC |
| |
| SC1.1a rev |
(SEQ ID NO: 134) |
GTGCAGAAATCAACAGCTA |
| |
| SC1.1b fwd |
(SEQ ID NO: 135) |
GGCCATTATGATCTTTAACT |
| |
| TABLE 2 |
| |
| Primer name |
Primer sequence |
| |
| NC1.1 Ikaros mut. Fwd |
gaCTACAAGAGCcctattctccta |
| (SEQ ID NO: 136) |
|
| |
| NC1.1 Ikaros mut. rev |
aggGCTCTTGTAGtctaatgagctt |
| (SEQ ID NO: 137) |
|
| |
| NC1.1 Ets/Zeb mut. fwd |
ctattTAGAACagtaattagatttta |
| (SEQ ID NO: 138) |
|
| |
| NC1.1 Ets/Zeb mut. rev |
tactGTTCTAaataggccaggga |
| (SEQ ID NO: 139) |
|
| |
| NC1.1 HD mut. fwd |
cctaCTACCACCgattttaacagg |
| (SEQ ID NO: 140) |
|
| |
| NC1.1 HD mut. rev |
atcGGTGGTAGtaggagaatagg |
| (SEQ ID NO: 141) |
|
| |
| NC1.1 Ets/Gata mut. fwd |
ttaaACAACAGCtcaacagatcag |
| (SEQ ID NO: 142) |
|
| |
| NC1.1 Ets/Gata mut. rev |
tgaGCTGTTGTttaaaatctaattac |
| (SEQ ID NO: 143) |
| |
The regions that were mutated are indicated by capital letters. Primers were paired with NC1.1 fwd or rev primers in a first round of amplification, then joined in fusion PCR using the flanking NC1.1 fwd and rev primers.
EMSA and Pull-Down Assays
EMSA was performed using LightShift Chemiluminescent EMSA Kit (Thermo Scientific, Rockford, Ill.) following manufacturer's instructions. Five Sox10E2 subfragments (M2, M4, M8, M9, M11/M12) and three control fragments were obtained by annealing synthetic oligonucleotides with or without 5′ biotin modification (IDT Biotechnology). Double stranded fragments used in EMSA assay either had biotin tags on both ends or were not labeled (cold probes).
The sequences of Sox10E2 subfragments used in these approaches were:
| |
(SEQ ID NO: 144) |
| |
M2, GCAATTTAACCTACAACTGCTGAGCTTGTA; |
| |
|
| |
(SEQ ID NO: 145) |
| |
M4, GGCGACTGTGCTTCCGGCTGGGGCAGTG; |
| |
|
| |
(SEQ ID NO: 146) |
| |
M8, GGAGCAGGGAAACAATAGGTGATTT; |
| |
|
| |
(SEQ ID NO: 147) |
| |
M9, TGGCCAGAGAGGAAATTGGGGGTTT; |
| |
|
| |
(SEQ ID NO: 148) |
| |
M11/12, TCAGGGCACAAAGGCCCAACTGTCTAGGGGG. |
The sequences of scrambled controls were selected based on the absence of binding sites with homology of greater than 70%, according to exhaustive survey of Jaspar and Transfac databases. They were as follows: Myb Co, (SEQ ID NO: 149) TCTTCAAGTCCGCCAT-GCCCGAAGG; Sox9 Co, (SEQ ID NO: 150) TACGGCAAGCTGTTCATCTGCACCA; Ets1 Co, (SEQ ID NO: 151) ATGTCTACGTCGAGCGCGACGGCGA.
EMSA.
Nuclear extracts from chicken embryonic transfected with corresponding expression plasmids (Sox9- Ets1-, cMyb- or control-pCI H2BRFP) were obtained using standard hypotonic buffer (10 mM HEPES pH7.9, 1.5 mM MgCl2, 10 mM KCl, 0.5 mM DTT, 1× Complete EDTA-Free Protease Inhibitors, 0.2 mM PMSF) to isolate the nuclei and extraction buffer (20 mM HEPES pH7.9, 0.42 M NaCl, 1.5 mM MgCl2, 0.2 mM EDTA, 25% (v/v) glycerol, 1 mM DTT, 1× Complete EDTA-Free Protease Inhibitors) to obtain nuclear extracts. Binding reactions and gel shift detection was performed using LightShift Chemiluminescent EMSA Kit (Thermo Fisher Scientific, Rockford, Ill.) following manufacturer's instructions.
Pull-Down Assays.
Pulldown binding assays were performed using streptavidin Dynal beads (Invitrogen) and the same biotin-labeled Sox10E2 subfragments as in EMSA, carrying a single biotin tag. Dynal streptavidin beads (Invitrogen) were coated according to manufacturer's instructions, using equimolar quantities of the fragment labeled on either 5′ or 3′ end. 400-500 μg of embryonic nuclear proteins (extracted from cephalic regions of chicken embryos at stage HH9-HH12) in final volume of ˜800 μl of binding buffer (12% glycerol, 12 mM HEPES pH 7.9, 4 mM Tris pH 7.9, 150 mM KCl, 1 mM EDTA, 1 mM DTE, and 0.1 μg/μl poly(dI-dC). These were pre-exhausted using ˜1.5 mg of streptavidin Dynal beads and distributed among 4 Dynal bead preps: 2 coated with specific DNA fragment, one with scrambled control and one without DNA. Binding reactions were allowed to proceed for 30′ at RT, and were subsequently washed 4 times with the binding buffer (only 1st wash contained poly(dI-dC)). After the 4th wash, the beads were transferred to a new tube, bound proteins eluted in 30 μl of 50 mM Tris pH 7.5, 100 mM NaCl, 5 mM EDTA, 1× Protease Inhibitors, 0.1% SDS and analyzed by Western blot using Sox9, Ets1 and cMyb antibodies.
Ets1, cMyb and Sox9 Antibodies Recognize Cross-Linked Endogenous Corresponding Proteins.
(FIG. 15A, 15B) Western blots, using Sox9 and cMyb antibodies on cross-linked or cross-linked/sonicated material performed under moderate denaturing conditions. Specific bands were noted at ˜120 kDa for Sox9 and at ˜80 kDa and 120 kDa for cMyb. Similar Sox9 and cMyb protein bands were detected after pull-down assays. 120 kDa cMyb protein was also bound to cMyb scrambled control (Myb CO) with 70% homology threshold (FIG. 15D). Partial denaturating conditions show that other less prominent bands likely represent complex associations rather than Sox9 or cMyb bands, as they are less prominent in the sonicated condition. (FIG. 15C) ChIP using Ets1 antibody, followed by western blot using the same target antibody. Detection was performed using IP-Western kit (GenScript, Piscataway, N.J.) and shows several bands in cross-linked and sonicated input, under moderate denaturating conditions, with a single Ets1-precipitated band (arrow) detected in the ChIP and input lanes, but not in samples precipitated with IgG antibody. IP—Immunoprecipitated fraction, SN—1st supernatant, IgG IP—Immunoprecipitation with normal rabbit IgGs (negative control), M2—subfragment of Sox 10E2 enhancer containing N-terminal Myb site, M11/12—subfragment of Sox10E2 enhancer containing C-terminal Myb site, Myb CO—scrambled control fragment containing no Myb sites with >70% homology, —DNA—control pulldown using streptavidin magnetic beads only, without DNA fragment.
Chromatin Immunoprecipitation with Sox9, Ets1 and cMyb Antibodies.
For ChIP, chromatin was prepared from cranial regions of 8-12 somite chicken embryos and immuno-precipitated using Ets1(sc-350; Santa Cruz), Sox9 (ab71762, Abcam and rabbit polyclonal, Dr. M. Wegner) and cMyb antibodies (Karafiat et al. (2005) Cell Mol Life Sci 62(21):2516-2525) with normal rabbit IgGs (sc-2027, Santa Cruz; ab27478, Abcam) as negative controls. The protocol was adapted from (Buchholz et al (2006) Methods in Signal Transduction, eds Whitman M & sater Ak (CRC Press), 257-271; Dahl and Collas (2008) Nat Protoc 3(6):1032-1045).
For each preparation of nuclei, cranial regions from 20 stage 8-12 somite embryos were dissected in Ringer's solution and transferred to 1 ml isotonic buffer (0.5% Triton X-100, 10 mM Tris-HCl, pH 7.5, 3 mM CaCl2, 0.25 M sucrose, protease inhibitor tablet (Complete Protease Inhibitor EDTA-free, Roche), 1 mM DTT, and 0.2 mM PMSF) on ice (adapted from Buchholz et al. 2006). Tissue was homogenized using Dounce homogenizer and cells cross-linked by adding formaldehyde to a final concentration of 1% and nutated for 10′ at room temperature. Glycine (final concentration of 125 mM) was added to stop the cross-linking reaction and solution was incubated by nutation for 5′ at RT. The cross-linked cells were washed 3 times and cell pellets were either snap frozen in liquid nitrogen and kept at −80° C. until the ChIP procedure. Preparations were kept up to a month without altering the quality of results. The pellets were re-suspended in isotonic buffer and nuclei isolated using Dounce homogenizer washed and lysed in SDS lysis buffer (1% SDS, 10 mM EDTA, 50 mM Tris-HCl, pH 8.0) for 10′-1 h. The lysate was then diluted three-fold with ChIP dilution buffer (0.01% SDS, 1.2 mM EDTA, 16.7 mM Tris-HCl, pH 8.0, 167 mM NaCl, 1 mM DTT, 0.4 mM PMSF, and protease inhibitors) and ½ of chromatin (420 ul) was sonicated using Misonix 4000 sonicator at following settings: Amp 3, 10 consecutive cycles of 30″ sonication each with 1′ pause in between. Triton X was added to the sonicated material to a final concentration of ˜1%, chromatin was cleared by centrifugation, diluted 3-4 times with ChIP Dilution Buffer w/1.1% Triton X-100 and was distributed between 2-3 antibody/bead complexes (400 ul each) and incubated ON at 4° C. 50 ul of the chromatin preparation was conserved at −80° C. as the input fraction. Antibody/magnetic bead were prepared as per Young protocol. Post-immunoprecipitation washes were performed using RIPA wash buffer (50 mM Hepes-KOH, pH 7.6, 500 mM LiCl, 1 mM EDTA, 1% NP-40, 0.7% Na-Deoxycholate). The complexes were then washed with Tris-EDTA/NaCl (10 mM Tris-HCl, 1 mM EDTA pH 8.0, 50 mM NaCl) for 5′ and transferred to a new chilled tube, prior to last separation (Dahl and Collas, 2008). The chromatin was eluted in elution buffer (1% SDS, 10 mM EDTA, 50 mM Tris-HCl, pH 8.0) and cross-link reversed overnight by incubation at 65° C. The samples were consecutively treated with RNase A (0.2 mg/ml) and then Proteinase K (0.2 mg/ml), extracted with Phenol/Chloroform/Isoamyl Alcohol, precipitated and resuspended in 50 ul of 10 mM Tris pH 8.0. Real-time PCR reactions were performed in a 96-well plate ABI7000 QPCR machine. Reactions were set up using SybrGreen (Biorad), 450 μM of each (forward and reverse primer) and 1 ul of each ChIP reaction or 1:100-200 dilution of Input fraction. The ΔΔCt method was used for quantification and calculations performed according to ChIP-qPCR Data Analysis instructions (SupperArray, Bioscience Corporation). In order to select suitable negative control primers, large regions (potentially corresponding to genomic deserts) of chromosome 1 were surveyed. Because Ets1 binding sites are present in large proportion of the chicken genome non-specific binding was a concern; therefore, 8-10 different sets of primers were tested.
The primers presented in FIG. 13M corresponding to Sox10E2 fragment were:
| |
Sox10E2_1 |
5′-TGCTCCTGCTGCTTATCA-3′; |
| |
|
| |
Sox10E2_1 rev |
5′-ATCAGCTCCACTGCACAT-3′; |
| |
|
| |
Sox10E2_2 |
5′-TGATAAGCAGCAGGAGCA-3′; |
| |
|
| |
Sox10E2_2 rev |
5′-TGAGCAGGT-TGCTGTGGAAA-3′. |
Control primer sets that amplify negative control region situated on the same chromosome as Sox10 locus were as follows:
| |
negcont_1 |
5′-TCGGATTTTAATGGGCTCAG-3′; |
| |
|
| |
negcont_1 rev |
5′-CCGCAGATAGTTCTGCATCA-3′; |
| |
|
| |
negcont_2 |
5′-GGTTGGATTTCCAGTCTCCA-3′; |
| |
|
| |
negcont_2 rev |
5′-TGTTTTGCTG-GACAATCTGC-3′. |
Ets1, cMyb and Sox9 Bind Directly to Sox10E2 Enhancer Element In Vivo.
Direct binding of Ets1, cMyb and Sox9 transcription factors to the Sox 0E2 regulatory element driving the onset of Sox 10 expression in the delaminating neural crest was assessed using chromatin immunoprecipitation (qChIP). (FIG. 16 a) shows qChIP positive control using antibody against H3K36me3, chromatin mark generally associated with active gene transcription. Chromatin immunoprecipitation (ChIP) shows high occupancy of H3K36me3 mark in proximity of the transcriptional start site (TSS) of Sox10 and control active β-actin locus. Relative enrichment over input using specific and negative control antibodies (normal rabbit IgGs) are presented. FIG. 16 b shows qChIP results obtained using specific target antibodies (Sox9, Ets1 and cMyb) to precipitate chromatin regions specifically bound by those factors. The results presented as relative enrichment over input using specific or negative control antibody (normal IgGs) were obtained by quantitative PCR where the same amount of DNA from each pulldown was used in a separate reaction and two primer sets specific with Sox10E2 region (red bars) and two primer sets within negative non-bound region (grey bars). FIG. 16 c shows enrichment is expressed relative to input DNA using the same amount of DNA in the QPCR reaction for each Chromatin IP. Enrichment of the specific factors (Ets1, cMyb or Sox9) at Sox10E2 enhancer region is presented as red bars, enrichment of specific factor at negative control regions is presented in blue. Background levels (mean enrichment from control antibodies) at enhancer and negative control regions are shown as pale red or pale blue bars, respectively. FIG. 16 d shows means and standard deviations of relative enrichment (fold over negative control antibody) are presented from 3-4 independent experiments for each specific antibody used. Green bars represent enrichment at Sox10E2, grey bars at negative control regions.
Over Expression Constructs
Open reading frames of chick Sox9, cMyb and Ets1 genes were amplified from a full length cDNA clones or chicken cDNA (Sox9 cDNA clone was a gift from Yi-Chuan Cheng, Ets1 clone was isolated from the stage 8-12 somites chicken macroarrayed cDNA library constructed by Laura Gammill (Kelsh RN (2006) Bioessays 28(8):788-798) and cloned into XhoI/EcoRV or XhoI/ClaI digested pCI H2B-RFP expression vector. The Sox9 and Ets1 rescue constructs were generated from expression constructs by PCR, using primers carrying mutations within the morpholino target sites that do not alter the amino acid sequence of the recombinant proteins. The following primers were used:
| Sox9_5′ |
| (SEQ ID NO: 160) |
| 5′-AATTCTCGAGGCCACCTGCTCAAGGGCT-ACGACTGG-3′ |
| and |
| |
| Sox9_3′ |
| (SEQ ID NO: 161) |
| 5′-ATTAGATATCTTTAAGGCC-GGGTGAGCTGC-3′; |
| |
| Ets1_5′ |
| (SEQ ID NO: 162) |
| 5′-AATACTCGAGGGCCTCAACC-ATGAAGGCGGCGGTGGA-3′ |
| and |
| |
| Ets1_3′ |
| (SEQ ID NO: 163) |
| 5′-ATTAGATATCTCACT-CATCAGCATCTGGCTTG-3′; |
| |
| cMyb_5′ |
| (SEQ ID NO: 164) |
| 5′-ATTACTCGAGgccaccATGGCCCGGAGAC; |
| |
| cMyb_3′, |
| (SEQ ID NO: 165) |
| 5′-ATTAATCGATTCACAT-CACCAGAGTCC; |
| |
| Sox9mut_5′ |
| (SEQ ID NO: 166) |
| 5′-ATTACTCGAGgccaccATGAActTgtTg-GAtCCCTTCATGAAAAT |
| |
| GAC; |
| |
| Ets1mut_5′, |
| (SEQ ID NO: 167) |
| 5′-ATTACTCGAGTCAA-CCATGAAaGCtGCcGTcGAttTaAAaCCCAC |
| |
| CCTGACCATCA. |
Transcriptional Inputs into the Sox10E2 Regulatory Region.
FIG. 8 a shows EGFP pattern of expression in neural crest cells driven by the intact Sox10E2 regulatory region. FIGS. 8 b, 8 c show EGFP expression is abolished in cranial neural crest when binding motifs for putative upstream regulators, SoxE and a pair of Myb are mutated (SoxE, M8 in FIG. 8 b and Myb, M2/M12 in FIG. 8 c). FIG. 8 d shows a mutation of a single Myb binding site mildly decreases EGFP reporter expression while FIG. 8 e shows that a NFkB1 mutation does not affect reporter signal.
Comparative Genomic Analyses
To identify highly conserved genomic regions, the ECR Browser software was employed. Chicken, zebrafish, Xenopus, opossum, mouse, chimpanzee, dog, rat and human genomic sequences were downloaded using UCSC genome browser. Following instructions available on the ECR website, these sequences were computationally compared from between all the species, with conservation parameters set to 70-80%. The “zoom in” feature, built in the program, was used to closely analyze the sequence conservation by increasing the threshold up to 90% and using different window sizes ranging from 20 bp to 50 bp. To search for putative binding motifs, we used the jaspar_core database from Jaspar and the P-Match program available through Transfac database. Briefly, the 264 bp-long sequence of Sox 10E2 genomic fragment was uploaded into these programs using desired parameters and the programs returned potential binding motifs based on the position weight matrix (PWM) score. Simultaneously, using rVista 2.0, Sox10E2 sequence was aligned and compared to the corresponding mouse sequence to screen the latter sequence for conserved putative binding motifs identified in chicken by either Jaspar, Transfac or both search engines. We used the position weight matrix (PWM) score, a value given to a site based on the distribution frequency of each base at each position (Sauka-Spengler T & Bronner-Fraser M (2008) Nat Rev Mol Cell Biol 9(7): 557-568) to determine the probability of binding score. This was then used to guide mutational analysis, since, as with any informatics approach, there are several caveats: 1) this only predicts motifs for factors with known consensus sites; 2) not all functional sites have high PWM scores since they can differ greatly from consensus (Antonellis et al. (2006) Hum Mol Genet 15(2): 259-271) and 3) not all sites with high PWM are functional.
Cell Death and Proliferation Assays
Histology. Embryos electroporated unilaterally with single or triple morpholino (@3 mM concentration) were fixed in 4% paraformaldehyde and dehydrated to 100% methanol. After re-hydration, embryos were cryoprotected in 15% sucrose, equilibrated in 15% sucrose/7.5% gelatin, embedded in 20% gelatin and sectioned at 10 um using Micron cryostat.
TUNEL Reaction.
The slides were first washed twice in PBS at 42° C. for 10′ to remove gelatin, followed by 3-4 10′ washes in PBST (PBS+0.5% Triton X-100) at RT. After 10′ incubation in Permeabilization solution (0.1% sodium Citrate, 0.5% Triton in PBS) and two PBST rinses, the slides were incubated in Tunel reaction mix (In Situ Cell Death Detection Kit, TMR red, Roche). Labeling solution was first diluted 10 times with Tunel buffer (30 mM Tris pH 7.2, 140 mM Sodium cacodylate, 1 mM CoCl2) and then combined with enzyme mix as per manufacturer's instructions (1 part enzyme+9 parts label). A positive control slide, pre-treated with DNAse I (2 ul of 10 U/ul stock in 100 ul of DNase buffer: 10 mM CaCl2, 40 mM Tris Cl pH7.4, 10 mM MgCl2, mM NaCl, for 1 h at RT) was prepared in advance, rinsed with 2 mM EDTA in PBST to quench DNase activity, washed twice in PBST and stained with Tunel reaction mix as well. Negative control slide was incubated in Tunel labeling mix, without TdT enzyme. The labeling was performed in the dark, for 4 h in a humidified chamber at 37° C. The slides were then washed 3×PBST for at least 15 min each time, the positive control slide was rinsed in a separate container.
Immunostaining.
The slides were incubated in blocking buffer (10% donkey serum in PBST) for 1 hour followed by primary antibodies diluted in blocking buffer overnight at 4° C., (1:1000 rabbit antiPh3 (Phospho-Histone 3) and 1:800 Alexa 488 goat anti FITC). Slides were then rinsed 3-4 times in PBST, 30 min each wash. Secondary antibody was diluted in PBST or blocking buffer and applied for 1 hour at RT. As the TUNEL staining is red (TMR red), we used 1:1000 Alexa 350 goat anti-Rabbit (blue) to detect antiPh3 and FITC (morpholino) was labeled in green. All consecutive sections from the cranial region were counted and number of Ph3- (and Tunel-) positive cells within the neural fold was compared between morpholino-ed and control sides for individual, triple and control morpholinos. We present the mean value of electroporated/control side ratio for triple and control morpholinos. The statistical values were calculated using unpaired student t-test.
Ets1 and cMyb Transcription Factors are Necessary for Activation of Sox10E2 Regulatory Element.
FIG. 9A shows control morpholino (MO) (right; red) has no effect on Sox10E2-driven Cherry (FIG. 9B; green) compared to non-electroporated (left) side. FIG. 9D shows cMyb MO significantly reduces, whereas Ets1 MO (FIG. 9G) abolishes Sox 0E2-driven Cherry expression, (FIGS. 9E, 9H, respectively. FIGS. 9C, 9F, 9I are merged images of FIGS. 9A/B, 9D/E and 9G/H, respectively). White dotted lines=midline. Green/red channels inverted for consistency.
In situ hybridization is shown in FIGS. 9J-9N. FIGS. 9J-9L show that endogenous cMyb, Sox9 and Ets1 expression precedes that of Sox10, consistent with being upstream regulators. At HH6, cMyb is expressed within the neural plate border (FIG. 9J) and confined to dorsal neural folds containing CNC by HH8 (FIGS. 9K; 9K′; arrowheads). At HH10, cMyb is observed in migrating neural crest (FIG. 9L and section at dotted line, FIG. 9L′ arrows). At HH8, prior to Sox 10 onset, Sox9 (FIG. 9M) and Ets1 (FIG. 9N) are expressed by presumptive cranial neural crest in the dorsal neural tube.
Morpholino-Mediated Knock-Down Experiments
Morpholino-mediated knock-down experiments were performed by injecting the translation-blocking, FITC-labelled morpholino antisense oligonucleotides in one half of the epiblast (right to the primitive streak) or, in some cases, by double electroporations to differentially transfect each half of the embryo ex-ovo. For Sox10E2, double electroporations were performed by introducing each morpholino combined with the Sox10E2-Cherry plasmid on the right side and the Sox10E2-Cherry reporter only on the left side of the embryo. Morpholinos for knockdowns in conjunction with SOX10E2-EGFP were obtained from Gene Tools (Philomath, Oreg.) and their sequences are as follows:
| | Ets1 |
| | (SEQ ID NO: 168) |
| | 5′-GCTTCAGGTCCACCGCCGCCTTCAT-3′; |
| | |
| | cMyb |
| | (SEQ ID NO: 169) |
| | 5′-ATGGCCGCGAGCTCCGCGTGCAGAT-3′; |
| | |
| | Sox9 |
| | (SEQ ID NO: 170) |
| | 5′-GGGTCTAGGAGATTCATGCGAGAAA-3′; |
| | |
| | Control |
| | (SEQ ID NO: 171) |
| | 5′-ATGGCCTCGGAGCTGGAGAGCCTCA-3′. |
The final molar concentration of each morpholino oligonucleotide used was 725 nM.
Morpholino-Mediated Sox9 Knock-Down Significantly Reduces Sox10E2 Regulatory Activity.
FIG. 10A shows FITC-labeled control morpholino (in red) does not affect Sox10E2 driven Cherry expression in FIG. 10B (green). FIG. 10C shows a merged image of 10A and 10B, revealing with control morpholino (red) with Sox 10E2 driving expression of Cherry (green). FIG. 10D shows Sox9 FITC-labeled morpholino (red) strongly reduces Sox 0E2 driven Cherry expression as shown in 10E (green, white arrow). FIG. 10F shows a merged image of 10D and 10E. Embryos were electroporated on the right side only. The images were pseudo-colored using Photoshop, with green and red channels inverted for consistency, indicative of reporter expression.
Sox9, cMyb and Ets1 are Required for Endogenous Sox10 Expression in Delaminating Neural Crest Cells.
FIG. 11 shows HH8+ embryos with unilateral electroporation of Sox9 (FIGS. 11A, 11E), cMyb (11B,11F) and Ets1 (11C,11G) morpholinos (MO) show significant decrease in endogenous Sox10 expression in delaminating CNC compared to non-electroporated side, whereas control MO (10L, 10M) has no effect. Co-electroporation of Sox9, cMyb, Ets1 MOs completely abolishes endogenous Sox10 expression (10D, 10H). Showing specificity, the effect is rescued by co-electroporation with corresponding expression construct: Sox9 MO+Sox9 DNA (10I), cMyb MO+cMyb DNA (10J) or Ets1 MO+Ets1 DNA (10K). Statistical relevance by chi-squared test of MOs on Sox10 expression was p<0.02; of rescues was p<0.03(Sox9; Ets1) and p<0.04(cMyb).
Electroporation of Ets1, cMyb, Sox9 and Control Morpholinos does not Affect Cell Proliferation and does not Induce Apoptotic Cell Death.
FIGS. 12A, 12 b 12B show embryos electroporated with FITC-labeled triple (Ets1, cMyb and Sox9) or control morpholinos. FIGS. 12C, 12D show embryos sectioned, followed by TUNEL staining. FIGS. 12E, 12F show anti-Phospho-Histone H3 (Ph3) antibody staining of sections. FIGS. 12G, 12H show overlays of FITC, TUNEL and Ph3 staining presented in (12A, 12C, 12E) and (12B, 12D, 12F), respectively. All consecutive sections from the cranial region were counted and the number of Ph3- (and Tunel-) positive cells within the neural fold was compared between morpholino-ed and control sides. Mean value and standard deviation of electroporated/control side ratio from four independent embryos are presented (12I shows TUNEL, red bars; 12J shows Ph3, blue bars). The statistical calculations performed using unpaired student t-test show no statistically significant differences in cell death or proliferation counts between electroporated and control sides of embryos receiving either three specific morpholinos or control (at 3 mM).
Binding Motifs for SoxE, Ets and Myb within Sox10E2 Enhancer Need to be Functional in Order for Ectopic Reporter Expression to Occur when Misexpressing Sox9, cMyb and/or Ets1, Individually or in Combination.
FIG. 14D shows ectopic SOX10E2-activated EGFP expression in the extraembryonic region, ectoderm cells (arrowheads) and along the neural tube when Sox9-pCI H2B-RFP, Ets1-pCI H2B-RFP and cMyb-pCI H2B-RFP (red) are simultaneously over-expressed as shown in FIG. 14A. Figure B shows that combined Sox9 and cMyb misexpression fails to activate ectopic EGFP expression through a mutated Sox10E2 regulatory region (M9) that lacks an Ets binding motif (FIG. 14E). Whereas, overexpressing Sox9 and Ets1 (FIG. 14C) simultaneously can activate weak reporter expression (arrows) through a mutated Sox10E2 lacking one Myb (M12) binding motif (FIG. 14F).
Sox9, cMyb and Ets1 Overexpression Ectopically Induces Sox10E2 Regulatory Activity.
EGFP is observed in migrating crest and otic vesicle (OV) when Sox10E2-EGFP is co-electroporated with control plasmid, pCI H2B-RFP (FIGS. 13A, 13F). Overexpression of either Sox9 (FIGS. 13B, 13G), Ets1(FIGS. 13C, 13H) or cMyb (FIGS. 13D, 13I) ectopically activates Sox10E2-driven EGFP expression in extraembryonic ectoderm (white arrows). In FIG. 13H, arrowheads show EGFP expression in posterior neural tube. Misexpression of Ets1(FIG. 10E) fails to activate ectopic EGFP expression (Figure J, arrows) in a mutated Sox10E2 construct lacking an Ets binding motif (M9).
EMSA shows a clear band shift (FIG. 13K, white arrowhead) when nuclear extracts containing overexpressed Sox9, Ets1 or cMyb proteins are combined with Sox10E2 subfragments, M11, M9 and M2, respectively (1st lane). This binding is outcompeted when excess non-labeled probe is added (2nd lane) and absent from nuclear extracts from control plasmid-transfected cells (3rd lane). Biotinylated Sox10E2 subfragments (M8, M11-Sox9, M4, M9-Ets1 and M2, M12-cMyb), as well as scrambled control fragments and non-coated Dynal streptavidin beads, used as bait in a DNA pulldown assay show specific transcription factor binding as analyzed on a Western blot in FIG. 13L. FIG. 13M shows direct binding of Ets1, cMyb and Sox9 to the Sox10E2 enhancer element in vivo as assessed by qChIP. Binding to Sox10E2 (red bars) or control region (grey bars) was assessed with two primer sets for each region and expressed as relative enrichment of target over control antibody; graph reflects mean±SD from a representative experiment. qChIP was performed 3-4 times for each factor. Enrichment relative to input DNA from all independent experiments is shown in FIG. 16.
Short-Hairpin RNA Vectors
Vector design and modification. The vectors in FIGS. 24A, 24B were generated through sequential generations of adaptation and modification. Enhancers are cloned into a Kpn1/BglII multiple cloning site and short hairpins cloned into a unique EcoR1/XhoI sites. In FIG. 24A, the NC1 enhancer sequence (SEQ ID NO: 4) is shown. The full sequence schematic for the vector in FIG. 24B is shown in Appendix (SEQ ID NO: 172). The general vector designs are shown in FIG. 25 wherein Vector 1 concept is the vector of FIG. 24A and Vector 2 concept is the vector of FIG. 24B. Integration sites for genomic insertion can be provided in either vector providing the same knockdown results.
Short Hairpin Design and Amplification.
Oligonucleotides (oligos) were selected using software designed by the Hannon laboratory at Cold Spring Harbor Laboratory, and the 90-mer ordered from IDT (Integrated DNA Technologies Inc., San Diego 92121, USA). These were amplified and EcoR1/XhoI sites added using the primers: SH2fwd (SEQ ID NO: 173) (5′-GATGGCTG-CTCGAGAAGGTATATTGCTGTTGACAGTGAGCG-3′) and SH2reverse (SEQ ID NO: 174) (5′-GTCTAGAGGAATTCCGAGGCAGTAGGCA-3′). This was performed using the following PCR reaction: Thermopol Buffer (1× final conc.) Mg2SO4 2 mM, DMSO 5%, dNTPs 200 uM, Template oligo 100 ng, Forward Primer 0.5 uM, Reverse Primer 0.5 uM, VENT Polymerase 1 U/reaction. The conditions used are: 1) 94° C. 5 mins, 2) 94° C. 30 seconds, 3) 54° C. 30 seconds, 4) 75° C. 30 seconds, cycles 2-4 repeated 12 cycles; 5) 75° C. 2 mins.
Electroporation and Analysis for Short-Hairpin miRNA Vectors.
Unless otherwise stated, embryos were electroporated at HH3+−HH4 (Hamburger & Hamilton 1951) and placed in EC culture (Chapman et al. 2001, Dev. Dyn. 220(3): 284-289). The left side only of the neural plate was electroporated in all cases (unilateral electroporation). Embryos were electroporated with 5×7V of a pulsed square current (50 ms ON 100 ms OFF) and incubated at 37 deg C., 5% CO2 until they reached the required somite number. For QPCR, embryos were bisected down the midline into electroporated and non-electroporated sides and cDNA synthesis/QPCR was performed separately on each half. Data from electroporated/non-electroporated for targeted and control (RFP) embryos were compared (FIG. 26). Electroporation at 4 mg/ml (FIG. 26) gives efficient knockdown of target gene during the period the enhancer is active. When unilateral electroporatoration was unfeasible, embryos were bilaterally electroporated whole embryos used for QPCR with targeted versus RFP results presented. For experiments using the MSX-shFoxD3 and Spalt4-shPax3 vectors, embryos were electroporated at HH3 at a point prior to ingression of the mesoderm. This allows sufficient time for transcription of short hairpins to begin prior to expression of the targeted gene. In situ hybridization as shown in FIGS. 26A, 26B was performed as described herein.
Neural Crest Cell Isolation/Dissociation
Electroporate the reporter construct of interest (enhancer driving fluorescent protein) or use the transgenic mouse expressing the fluorescent reporter under the control of neural crest enhancer. Dissect the region of interest. Collect tissue in Ringer's and keep on ice. Thaw a vial of each: dispase (prepared in DMEM+Hepes at a cc of 1.5 mg/ml) and trypsin (Trypsin-EDTA: 1×0.05% Trypsin, 0.53 mM EDTA in HBSS). Use the 37° Celsius (C) water bath for 5 min. Treat the dissected tissue with 2 ml of dispase for 10 min at 37° C. Use the 15 ml falcon tube, and triturate (using 2 ml plastic sterile pipets) and incubate for additional 5 min at 37° C. Before trituration, pipet up and down media +10% FBS to coat the pipet and prevent cells from sticking to it. Triturate, add 40 ul of Trypsin and incubate for 1 min. Stop the reaction by adding 10 mls DMEM, 10% FBS. Centrifuge at 1000 rcf for 10 min. Remove the supernatant, re-suspend the cells in 1 ml of Hanks solution (w/o phenol red+2.5 mg/ml BSA fraction V). Place the 40 micrometer filter on a 50 ml falcon tube. Pass the 1 ml+ cells through the filter. Take out 10 ul of Hanks+ cells and add 10 ul of trypan blue. Count the cells using hemocytometer: (# of cells×dilution factor)×2×10^4=#of cells/ml. Take a small sample and look under fluorescence microscope. Centrifuge at 1000 rcf for min. Take out ˜600 ul of Hanks solution and leave cells re-suspended in the remaining 300-350 ul of hanks solution. Transfer the cells in Hanks solution to a 5 mls falcon tube. Prepare a few 1.5 eppendorf tubes (4 per sample to be sorted) with approximately 1 ml of media (DMEM+10% FBS) to collect sorted cells. Run the cell suspension through the FACS (Fluorescence-Activated Cell Sorting) machine and collect isolated neural crest cells that express fluorescent marker under the control of neural crest enhancers. For incubations at 37° C. use a water bath. To reduce the stickiness of the cells, due to accidental nuclear lysis, the prep can be treated with DNAse for a short time. This treatment should be avoided if whole cell extracts are to be used in DNA sensitive applications.
In summary, DNA enhancer sequences are provided for use in constructs to identify early stage embryonic cells. The enhancer sequences can be used in parallel with short-hairpin RNA in a vector construct for endogenously regulated gene knockdowns. The disclosed enhancer sequences can be used to isolate a selected population of early stage embryonic cells.
All references cited in the application are incorporated in their entirety as if explicitly recited herein, particularly all references directed to methodologies of synthesis.