US7714862B1 - Dig-Cola: directed graph layout through constrained energy minimization - Google Patents
Dig-Cola: directed graph layout through constrained energy minimization Download PDFInfo
- Publication number
- US7714862B1 US7714862B1 US11/321,059 US32105905A US7714862B1 US 7714862 B1 US7714862 B1 US 7714862B1 US 32105905 A US32105905 A US 32105905A US 7714862 B1 US7714862 B1 US 7714862B1
- Authority
- US
- United States
- Prior art keywords
- nodes
- coordinates
- bands
- constrained
- minimization
- Prior art date
- Legal status (The legal status is an assumption and is not a legal conclusion. Google has not performed a legal analysis and makes no representation as to the accuracy of the status listed.)
- Expired - Fee Related
Links
Images


Classifications
-
- G—PHYSICS
- G06—COMPUTING; CALCULATING OR COUNTING
- G06T—IMAGE DATA PROCESSING OR GENERATION, IN GENERAL
- G06T11/00—2D [Two Dimensional] image generation
- G06T11/20—Drawing from basic elements, e.g. lines or circles
- G06T11/206—Drawing of charts or graphs
Definitions
- the invention relates generally to methods for constructing graphs. More specifically, the invention provides a method for drawing directed graphs.
- FIG. 1A illustrates a graph drawn with one known algorithm by Sugiyama.
- Sugiyama See K. Sugiyama, S. Tagawa and M. Toda, “Methods for Visual Understanding of Hierarchical Systems”, IEEE Trans. Systems, Man, and Cybernetics 11 (1981), 109-125].
- the y-coordinates are computed by dividing the y-axis into a finite number of layers and associating each node with exactly one layer. Edges between nodes on the same layer are not allowed and edges spanning multiple layers are split into chains of dummy nodes. Layer assignment is usually computed with the goal of minimizing edge-length (and hence the number of dummy nodes).
- the layer assignment methods used are generally incapable of handling cyclic-digraphs and so preprocessing is required to make the graph acyclic by reversing a minimal number of edges. Assigning the x-coordinates is normally done in two stages: first ordering nodes within layers to minimize crossings and then exact placement subject to the computed ordering to optimize aesthetic criteria such as minimizing edge bends.
- Each of the optimization problems outlined above has been shown to be NP-hard so heuristic approaches have been designed that offer reasonable results in most cases.
- the present invention is directed to a method and system for drawing directed graphs.
- a first aspect of the invention provides a method and system for drawing directed graphs including receiving data coordinates associated with nodes for graphing, performing a constrained stress minimization, and outputting results of the constrained stress minimization and displaying the results on a visual medium.
- a second aspect of the invention provides a method for drawing directed graphs including receiving data associated with nodes for graphing, assigning hierarchical levels to the nodes for graphing, minimizing a stress function constrained by the assigned hierarchical levels, and outputting results of the step of minimizing a stress function constrained by the assigned hierarchical levels and displaying the results in a layout on a visual medium.
- a third aspect of the invention provides a computer readable medium containing instructions for performing the steps of receiving data associated with nodes for graphing, assigning hierarchical levels to the nodes for graphing, minimizing a stress function constrained by the assigned hierarchical levels, and outputting results of the step of minimizing a stress function constrained by the assigned hierarchical levels and displaying the results in a layout on a visual medium.
- FIGS. 1A and 1B illustrate directed graphs constructed with a hierarchical and undirected layout respectively.
- FIGS. 2A , 2 B and 2 C illustrate varying degrees of hierarchy associated with digraphs.
- FIG. 3 illustrates an exemplary embodiment of a system for constructing directed graphs.
- FIGS. 4A , 4 B, 4 C, and 4 D illustrate exemplary embodiments of hierarchy shown with bands.
- FIGS. 5A and 5B illustrate embodiments of directed graphs constructed by hierarchical and undirected layouts respectively.
- FIG. 5C illustrates an embodiment of a directed graph constructed from DIG-COLA.
- FIG. 6A illustrates an embodiment of a directed graph constructed by DIG-COLA.
- FIG. 6B illustrates an embodiment of a directed graph constructed with a hierarchical layout.
- FIGS. 7A and 7B illustrate embodiments of related directed graphs constructed by DIG-COLA with varied characteristics.
- FIGS. 8A and 8B illustrate embodiments of related directed graphs constructed by DIG-COLA with varied characteristics.
- FIGS. 9A and 9B illustrate experimental results from constructing directed graphs by DIG-COLA.
- FIG. 10 illustrates experimental results from constructing directed graphs by DIG-COLA.
- FIGS. 11A , 11 B, and 11 C illustrate experimental results of exemplary performance testing of DIG-COLA.
- FIG. 12 illustrates an embodiment of a directed graph constructed by DIG-COLA.
- FIG. 13 illustrates an embodiment of a directed graph constructed by DIG-COLA.
- FIGS. 14 , 15 , and 16 illustrate embodiments of directed graphs constructed with DIG-COLA.
- FIG. 17 illustrates a diagram of an exemplary embodiment of the DIG-COLA method.
- FIG. 18 illustrates a diagram of another exemplary embodiment of the DIG-COLA method.
- a new method for constructing directed graphs is described herein.
- This new method and associated system for constructing directed graphs may be described for illustrative purposes as directed graph drawing through constrained layout optimization.
- the system and method may be referred to as such throughout.
- the described method and system may also be referred to for ease of reference as “DIG-COLA.”
- graph is used herein to refer to the abstract relational structure.
- the method described herein will receive an input in various forms and the method visualizes or draws the graph.
- the input may vary greatly in characteristic and the described methods and systems may be utilized in numerous industry, business and technology sectors.
- an enormous variety of data may be visualized using the described methods ranging from gene networks, to engineering flow diagrams, to breakfast cereal characteristics and on and on.
- drawing includes displaying on a computer monitor or printing on paper.
- the new approach introduced is distinguished from those above for example by the fact that it does not separate the computation of the various axes, but computes all axes simultaneously using constrained energy minimization.
- the method described herein generally define a cost function (or a force model) whose minimization generally produces an acceptable node placement.
- Any use of a Force Directed Placement (FDP) for drawing directed-graphs in a general sense has up until now specifically included the force model being extended by ‘angle forces’ that encourage all directed edges to point in the same direction.
- FDP Force Directed Placement
- this requirement adds additional complexity to the force model and the inferred energy function is complicated, and thus prone to numerical stiffness and rich in local minima.
- the method and system described herein possess the advantages of both constraint programming techniques and a state-of-the-art force-directed placement (FDP) algorithm so that the directed nature of the graph is highlighted while useful properties of FDP—such as emphasis of symmetries and preservation of proximity relations—are retained.
- the described method automatically identifies those parts of the digraph that contain hierarchical information and draws them accordingly. Additionally, those parts that do not contain hierarchy are drawn at the same quality expected from a non-hierarchical, undirected layout algorithm.
- One illustrative application of the described method is directional multidimensional scaling (DMDS).
- DMDS deals with low-dimensional embedding of multivariate data where we want to emphasize the overall flow in the data (e.g. chronological progress) along one of the axes.
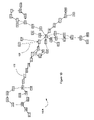
- FIGS. 1A and 1B illustrate the special attributes of digraph layouts with two different layouts of the structure of a small gene expression network.
- FIG. 1A illustrates a digraph 100 A drawn by conventional methods while FIG. 1B illustrates a digraph 100 B based upon the same originating data as that used to draw FIG. 1A , however a force directed layout was used to construct FIG. 1B .
- Each node 110 in the network represents a gene and a directed edge 120 indicates that the source gene affects the expression of the target gene (i.e. by binding the product of one gene to the promoter region of another gene).
- Undirected (or bidirected) edges i.e. edges for which no preferred directionality should be shown) are shown without an arrow end.
- edge direction is shown with an arrow.
- Hierarchical layout places the genes from top to bottom in activation order. The undirected layout could be considered clearer (with fewer edge crossings, more consistent edge length and ideally better representation of cycles, clusters and symmetry) but it gives no indication of the chronological order of interactions.
- one of the axes is dedicated to conveying hierarchical information.
- the usual axis separation approach is not pursued in FIG. 1B . Separate computation of different axes can be appealing as it allows a convenient divide-and-conquer strategy. However, such a separation can make it difficult to control common aesthetic properties in the resulting drawing.
- Prime examples are uniformity of edge lengths (preventing very long edges) or balancing aspect ratio (equal spread along the x and y-axes).
- DIG-COLA constrained layout of digraphs
- Each edge (i,j) is further associated with a number ⁇ ij that expresses the relative hierarchy of the nodes.
- ⁇ ij 1 for a directed edge i ⁇ j, meaning that i precedes j by one unit.
- ⁇ ij 0 for any undirected edge, meaning that there is no hierarchical precedence between i and j.
- a d-dimensional layout is denoted by an n ⁇ d matrix X.
- node i is located at X i ⁇ d and the axes of the layout are X (1) , . . . , X (d) ⁇ n .
- the stress function is a traditional measure of drawing quality, based on the heuristic that a nice drawing relates to good isometry: i.e. it calls for placing the nodes so that the resulting pairwise Euclidean distances will approach the corresponding target distances (e.g. graph-theoretical distances). Specifically, we have an ideal distance d ij for every pair of nodes i and j exists, modeled as a spring. Given a d-D layout, where node i is placed at point Xi, the energy of the system is
- the distance d ij is typically the graph-theoretical distance between nodes i and j (i.e. the length of the shortest path connecting i and j).
- the normalization constant w ij equals d ij ⁇ .
- Stress majorization One may also compute a graph layout by minimizing the stress function through majorization, following works in the field of multidimensional scaling.
- Majorization is a rather global optimization process offering some distinct advantages over localized processes like gradient descent—especially guaranteed monotonic decrease of stress, improved robustness against local minima and shorter running times.
- Majorization minimizes the stress function by iteratively minimizing quadratic forms that approximate and bound it from above. Recall that w ij are the normalization constants in the stress function.
- the n ⁇ n matrix L w is used, defined by
- n ⁇ n matrix is defined by L Z by
- ⁇ stress stress ⁇ ( X ⁇ ( r ) ) - stress ⁇ ( X ⁇ ( t + 1 ) ) stress ⁇ ( X ⁇ ( t ) ) ⁇ ⁇ , ( 8 )
- An optimal arrangement of a digraph, y* is defined as a minimizer of the hierarchy energy. It will try to place the nodes such that the height difference y i ⁇ y j for any adjacent pair (i,j) will be close to ⁇ ij , the relative hierarchy (i,j). This optimal arrangement is given by solving the linear equations
- the optimal arrangement shows the height of each node in the hierarchy as induced by the digraph structure.
- FIG. 17 illustrates a flowchart showing a general flow of steps in one exemplary embodiment of the described method. Numerous specific embodiments have been considered and are consistent with the method described herein. Describing the method illustrated in FIG. 17 briefly, a first step includes receiving data 1510 at a certain location typically associated with nodes for potential display in a graph. Next, constrained stress minimization 1520 consistent with the features and substeps described is performed. Next, the results from the constrained stress minimization is output 1530 . Finally, a layout is visualized or displayed 1540 . The digraphs displayed in step 1540 may be displayed on any of known medium for display of graphs and other pictorial items. For example, among the medium considered are monitors, printed paper, projection etc.
- FIG. 18 illustrates some substeps of the embodiment described in FIG. 18 .
- FIG. 18 shows substeps included in one embodiment of the constrained step minimization 1520 .
- hierarchical levels as described later are specifically assigned to each of the nodes. Multiple nodes may be placed in a given hierarchical level. Additionally, in certain embodiments, or portions of embodiments, only one node will be placed in s hierarchical level.
- quadratic functions are selected 1526 depending on specific characteristics involved. Then, these selected quadratic functions are minimized.
- the results would be displayed as shown in the flowchart of FIG. 17 . The specifics of the described process are elaborated in more detail below.
- the described method follows in a tradition of drawing undirected graphs by minimizing a stress or energy function.
- constraints are imposed on the layout.
- Hierarchy as constraints Generally, a digraph can be said to induce a hierarchical structure on its nodes based on the precedence relationships defined by its directed edges. Consequently, an appropriate depiction of a digraph allocates one of the axes to showing this hierarchy. Henceforth, the y-axis will serve for this exemplary purpose. Thus, if node i precedes node j in the hierarchy, then i will be drawn above j on the y-axis. This usually leads to the majority of directed edges pointing downwards, thereby showing a clear flow from top to bottom. Accordingly, since most of the directed edges point downwards, this downwards direction may be referred to as a primary direction of orientation of the edges.
- the primary direction of orientation typically includes the general direction of orientation of the edge. For example, an edge oriented generally downward but also some amount to the left may be considered to possess a primary direction of orientation of downward.
- our first step is to compute the hierarchy induced by the digraph.
- 1 ⁇ k ⁇ n is a value depending on the graph properties.
- these sets may be referred to as “hierarchical levels” or just “levels”. Consequently, the directional properties of the digraph are expressed by imposing hierarchy constraints: for all 1 ⁇ i ⁇ j ⁇ k place all nodes of than those of in the y-axis.
- FIG. 2 illustrates digraphs 200 A, 200 B, and 200 C, each possessing varying degrees of hierarchy.
- FIG. 2A one would like to say that node 1 precedes node 2 , which precedes node 3 and so on.
- all nodes are symmetric, and none precedes any other in the hierarchy.
- a default choice is to base the partition on the optimal arrangement y*, which was previously defined. This allows us to deal with all digraphs, including those that are cyclic or those that also include undirected edges.
- An advantageous property of the optimal arrangement is that it will not introduce hierarchy that is not induced by the graph structure. This is very important, as we don't want to impose any unjustified constraint on the layout. For example, for the digraph in FIG. 2B , all nodes will be assigned the same position in y* meaning that there are no hierarchical constraints; whereas for the digraph in FIG. 2C all nodes except node 6 will be assigned the same y* position, yielding a constraint stating that node 6 should be placed above all other nodes.
- FIG. 3 is a diagram of an illustrative computer network system 300 for implementing the DIG-COLA method.
- the components depicted here are merely illustrative and a vast number of computers, software, network and related modules may be form a system implementing DIG-COLA.
- 310 A and 310 B illustrate desktop and laptop computers. Numerous similar terminals may be utilized.
- computers 310 A and 310 B are communicably connected to a server 350 via a router 355 .
- Desktop computer 310 A is connected via Ethernet or hard wire and laptop computer is connected to the server via a wireless access point 357 .
- a wide array of devices, hardware, and processors may be utilized in the system.
- Computer 310 A is connected and interfaces with a sensor system 312 that obtains data, meanwhile printer 311 is configured to print out for display information and data located on computer 310 A.
- printer 311 is configured to print out for display information and data located on computer 310 A.
- PDAs and cellular phone type devices 310 C are among devices potentially used with the described system. While one embodiment of a system for DIG-COLA is illustratively described, a wide variety of devices, processors and computing machines and network may be utilized.
- convex quadratic programming Such a constrained optimization is commonly called convex quadratic programming. It is well known that the global minimizer of a convex quadratic program can be computed efficiently. To summarize, when integrating stress majorization with level constraints, for each iteration a convex quadratic program is solved, instead of minimizing a quadratic function. While solving convex quadratic programs is more involved than just minimizing quadratic functions, optimal solutions can efficiently be obtained using a variety of available solvers. Notably, the majorization process, which must obey all constraints, still monotonically decreases the stress function and hence is convergent. In more detail, suppose a given initial layout X(0) ⁇ n ⁇ d . Then in the t-th iteration compute layout X(t) as the solution of the quadratic program:
- the target function is the same as in the usual majorization process defined in (4).
- the sets , . . . are the hierarchical levels that were defined in the previous subsection.
- the column X (1) ⁇ n is the axis that represents the hierarchical information (the y-coordinates in our examples).
- k ⁇ 1 auxiliary variables l 1 , l 2 , . . . l k ⁇ 1 are used for expressing the constraints succinctly: l i must be below the nodes in but above the nodes of +1 .
- the matrices L w and L X(t-1) were defined in (2) and (3), respectively. Note that L w and the constraints are fixed during the entire process.
- a layout produced by our algorithm can be partitioned into horizontal bands, each band 470 (as seen in several Figures including FIGS. 4B and 4D ) containing all nodes belonging to a single hierarchy level.
- the described bands decompose the X (1) -axis (usually the y-axis) into the intervals [ ⁇ , l 1 ], [l 1 , l 2 ], [l 2 , l 3 ], . . . , [l k ⁇ 1 , ⁇ ].
- the sizes of the bands are non-uniform and depend on the computed layout, which reflects the graph structure. The reason these bands are of interest is that all nodes in the same band are considered to have the same level in the hierarchy.
- Unsaturated colors typically include a color not diluted with white, a pure unmixed color. Thus, node color can be used to display other attributes, as demonstrated in FIG. 13 .
- Various of these described features of the described graphs are apparent in numerous of the Figures and the features serve a number of functions including facility use, understanding and visualization by a reader/viewer.
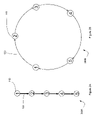
- FIG. 4 An example showing bands for a few small graphs is given in FIG. 4 .
- a digraph 400 A with a directed circle is shown. Such a digraph contains no hierarchy and hence all layout is within a single band. In fact, when drawing such a graph, DIG-COLA generates no constraints and so it becomes equivalent to undirected stress minimization algorithms.
- FIG. 4B a digraph 400 B with a directed tree is shown. Each level of the tree is placed within a separate band yielding six bands.
- Another “tree” with the root replaced by a directed cycle is shown in digraph 400 C in FIG. 4C . The cycle is contained within the top band, while the remaining nodes are partitioned into bands according to their distance from the root cycle.
- FIG. 4C An example showing bands for a few small graphs is given in FIG. 4 .
- 4D illustrates a digraph 400 D including a directed cycle with an extra node pointing to it. Naturally, the whole cycle is contained within one band, while the extra node is shown in a separate, higher band.
- explicit drawing of bands may provide useful information regarding the hierarchical relations between nodes and the amount of hierarchy contained in the graph.
- FIG. 5 where three drawings of a digraph containing a directed cycle are shown.
- the Sugiyama-style layout FIG. 5A partitions the digraph into four hierarchical levels with the nodes involved in the cycle spread across all levels.
- FIG. 5B the result of Carmel et al., which assigns y-coordinates directly from hierarchy energy, gives all nodes in the cycle the same y-coordinate. While this is true from the hierarchical standpoint, it is clearly undesirable in terms of readability.
- DIG-COLA FIG. 5C
- FIG. 5C also places the cycle in a single top band, but adjusts this band so the cycle becomes clear.
- Quadratic programming solvers Many quadratic solvers are available employing a number of different optimization methods. All of them can serve for solving problem (10). One skilled in the art will be aware of such methods. An illustrative list includes, MOSEK, CPLEX, OOQP, BQPD and COPL QP. Experiments were carried out to further demonstrate the methods and systems described using the MOSEK package.
- warm-start is not trivial for the barrier (or interior-point) methods used by most commercial solvers.
- active-set is the so-called “active-set” approach.
- active-set it should be possible to further improve the performance of an active-set method based on insight into the specific type of constraints used (for example, in our case each constraint involves only two variables).
- Known algorithms may seem very fast indeed, although they may only deal with single-variable constraints.
- the graphs 700 A and 700 B, Nos 4 , in FIGS. 7A and 7B respectively, is based on a finite element approximation to a beam structure.
- the second set of graphs 800 A and 800 B, Plat 362 , in FIGS. 8A and 8B is based on a finite-difference model for the shallow wave equations for the Atlantic ocean.
- the first class of graphs is a set of 258 gene-activation networks.
- the graphs are of varying sizes (up to
- 95,
- 110), generally quite sparse (
- the second set comes from specific AT&T Graphs. This latter repository contains over 5000 directed graphs. Of these, we extracted the largest connected component from each graph and filtered out very large and very small graphs (leaving 2464 graphs of 10 ⁇
- a third set of 34 graphs is obtained with 200 ⁇
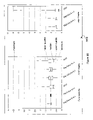
- the average sample standard deviation ⁇ was smaller for the sparser gene activation networks than the AT&T graphs, however for all data sets the DOT layout ⁇ was at least double that of the DIG-COLA layouts, as shown in FIG. 9( a ). From the box plots 900 B in FIG. 9B , it may be observed that, while the edge-length distribution is narrow and even for DIG-COLA layouts, DOT layouts give a large difference between the upper quartile and maximum edge lengths. That is, DOT layouts tend to have a small number of very long edges. Note that, as per speculation described elsewhere in, setting a negative value for G gave a further decrease in edge-length variance at the expense of more upward pointing edges.
- edge lengths reported for DOT output are a conservative estimate based on Euclidean distance between start and end node positions (i.e. bends are not considered).
- Variable Edge Length Other Partitionings and directional MDS: The capability for conservation of default edge length that has been demonstrated herein, can be very useful in applications where relative edge weights need to be studied.
- Bayesian networks are directed acyclic graphs where nodes represent variables and edges represent causality relationships between pairs of variables. The edges can be weighted to indicate the strength of these relationships.
- Bayesian networks are visualized using Sugiyama style layout.
- graph 1200 in FIG. 12 for example, a small example of a Bayesian network drawn with DIG-COLA such that edge lengths correspond to the inverse of these weights is provided. That is, the shorter the edge between a pair of nodes, the stronger the causality relationship between the corresponding variables. Based on the results of a quantitative analysis it can be observed that such a close correlation between edge weight and length would be very difficult to achieve with a Sugiyama layout.
- graph 1300 in FIG. 13 shows an evolving graph with hierarchy bands corresponding to different time periods.
- the graph is the citation network featured in the Infovis 2004 Competition.
- Nodes represent papers and they are constrained in the y-dimension to lie in bands corresponding to year of publication.
- Other methods for visualizing such evolving graphs e.g. FIG. 1A ) require fixing nodes in one dimension, which leaves less freedom to satisfy desired edge lengths.
- MDS multidimensional scaling
- DMDS A practical example of DMDS is shown in graph 1400 in FIG. 14 .
- a multivariate data set of nutritional information for popular breakfast cereals has been used to construct a dissimilarity matrix.
- Eight variables (fibre, starch, sodium etc.) were used.
- a traditional MDS algorithm would produce a 2D map of the cereals so that their relative positions correspond to their nutritional similarity.
- DMDS a 9th variable of the dataset, a dietitian's “health rating” of each cereal may be clearly shown.
- partitioning the cereals based on this health rating we introduce hierarchy to the layout such that the healthiest cereals appear at the top and the least healthy are constrained to the bottom. The result achieves two goals.
- Graphs 1500 and 1600 appearing in FIGS. 15 and 16 respectively, illustrate the displaying of the resultants of the described “googling.”
- the main distinction is a modification of the constraints or parameters applied.
- Graph 1600 is constrained such that each of the bands 470 is the same height.
- Graph 1500 was not constrained in such a manner.
- These two graphs 1500 and 1600 illustrate a manner in which characteristic constraints available using the described methods and systems.
- Force-directed placement is considered most popular approach to drawing undirected graphs.
- FDP Force-directed placement
- DIG-COLA Force-directed placement
- one or more aspects of the invention may be embodied in computer-executable instructions, such as in one or more program modules, executed by one or more computers or other devices.
- program modules include routines, programs, objects, components, data structures, etc. that perform particular tasks or implement particular abstract data types when executed by a processor in a computer or other device.
- the computer executable instructions may be stored on a computer readable medium such as a hard disk, optical disk, removable storage media, solid state memory, RAM, etc.
- the functionality of the program modules may be combined or distributed as desired in various embodiments.
- the functionality may be embodied in whole or in part in firmware or hardware equivalents such as integrated circuits, field programmable gate arrays (FPGA), and the like.
Landscapes
- Physics & Mathematics (AREA)
- General Physics & Mathematics (AREA)
- Engineering & Computer Science (AREA)
- Theoretical Computer Science (AREA)
- Image Generation (AREA)
Abstract
Description
stress(X)≦F Z(X) (5)
L w X (a) =L Z Z (a), a=1, . . . , d. (6)
L w X(t+1)(a) =L X(t) X(t)(a), a=1, . . . , d. (7)
-
- Function PartitionToLevels {G(V={1, . . . , n}, E)}
- % Partition the nodes into levels reflecting hierarchy
- % Constants controlling number of levels:
- α←0.1, β←=0.01% lower values encourage more levels
- Compute the optimal arrangement y*εn

- % Sort according to y*:
- Compute a
permutation 1≦v1, . . . , vn≦n, so that y*vi ≧y*vi ≧y*vi+1
-
-
- k←1
- for i=1 to n−1 do
- ←
 ∪{vi}
∪{vi} - if y*v
i −y*vi+1 >ε then- % A new level based on a significant gap in y*:
- k←
k+ 1
- end if
-
- end for
- ←∪{vn}
- return ,
 , . . . ,
-
Claims (20)
Priority Applications (1)
| Application Number | Priority Date | Filing Date | Title |
|---|---|---|---|
| US11/321,059 US7714862B1 (en) | 2005-12-30 | 2005-12-30 | Dig-Cola: directed graph layout through constrained energy minimization |
Applications Claiming Priority (1)
| Application Number | Priority Date | Filing Date | Title |
|---|---|---|---|
| US11/321,059 US7714862B1 (en) | 2005-12-30 | 2005-12-30 | Dig-Cola: directed graph layout through constrained energy minimization |
Publications (1)
| Publication Number | Publication Date |
|---|---|
| US7714862B1 true US7714862B1 (en) | 2010-05-11 |
Family
ID=42139342
Family Applications (1)
| Application Number | Title | Priority Date | Filing Date |
|---|---|---|---|
| US11/321,059 Expired - Fee Related US7714862B1 (en) | 2005-12-30 | 2005-12-30 | Dig-Cola: directed graph layout through constrained energy minimization |
Country Status (1)
| Country | Link |
|---|---|
| US (1) | US7714862B1 (en) |
Cited By (9)
| Publication number | Priority date | Publication date | Assignee | Title |
|---|---|---|---|---|
| US20100073375A1 (en) * | 2008-09-25 | 2010-03-25 | International Business Machines Corporation | Optimizing edge crossing computations when creating a drawing of a directed graph having a minimum number of edge crossings |
| US20120141972A1 (en) * | 2010-12-02 | 2012-06-07 | Microsoft Corporation | Untangled Euler Diagrams |
| US20120185775A1 (en) * | 2011-01-18 | 2012-07-19 | Alexander Clemm | Visualization of performance data over a network path |
| US20120313949A1 (en) * | 2011-06-07 | 2012-12-13 | International Business Machines Corporation | Automatic Selection of Different Visualizations for the Organization of Multivariate Data |
| US20150092766A1 (en) * | 2012-03-29 | 2015-04-02 | Oren Jean | Localization, synchronization and navigation using passive sensor networks |
| US9106966B2 (en) | 2012-12-14 | 2015-08-11 | International Business Machines Corporation | Multi-dimensional channel directories |
| US20150262094A1 (en) * | 2014-03-12 | 2015-09-17 | International Business Machines Corporation | Automatically instantiating an organizational workflow across different geographical locations |
| US9824469B2 (en) | 2012-09-11 | 2017-11-21 | International Business Machines Corporation | Determining alternative visualizations for data based on an initial data visualization |
| US10977959B2 (en) * | 2018-01-05 | 2021-04-13 | International Business Machines Corporation | Nutrition graph |
-
2005
- 2005-12-30 US US11/321,059 patent/US7714862B1/en not_active Expired - Fee Related
Non-Patent Citations (14)
| Title |
|---|
| E. Gansner, Y. Koren and S. North, "Graph Drawing by Stress Majorization", Proc. 12th Int. Symp. Graph Drawing (GD'04), LNCS 3383, Springer Verlag, pp. 239-250, 2004. |
| E.R. Gansner, Y. Koren and Stephen North, "Graph Drawing by Stress Majorization," Graph Drawing, pp. 239-250, 2004. * |
| Eiglsperger, Markus and Siebenhaller, Martin and Kaufmann, Michael (2004) An Efficient Implementation of Sugiyama's Algorithm for Layered Graph Drawing. In Pach. János, Eds. Proceedings Graph Drawing, pages pp. 155-166, New York. * |
| L. Carmel, D. Harel, and Y. Koren, "Combining Hierarchy and Energy for Drawing Directed Graphs," IEEE Trans. Visualization and Computer Graphics, vol. 10, pp. 46-57, 2004. * |
| L. Carmel, D. Harel, Y. Koren, "Combining Hiearchy and Energy for Drawing Directed Graphs", IEEE Transactions on Visualization and Computer Graphics, vol. 10, No. 1, pp. 46-57, Jan.-Feb. 2004. * |
| T. Dwyer and Y. Koren, "Dig-CoLa: Directed Graph Layout through Constrained Energy Minimization," Proc. IEEE Symp. Information Visualization (Infovis '05), pp. 65-72, 2005. * |
| T. Dwyer, Y. Koren and K. Marriott, "Stress Majorization with Orthogonal Ordering Constraints", Proceedings of 13th Int. Symp. Graph Drawing (GD'05), Lecture Notes in Computer Science, vol. 3843, Springer Verlag, pp. 141-152, 2005. * |
| T. Dwyer, Y. Koren, and K. Marriott, "Stress Majorization with Orthogonal Ordering Constraints," Proc. 13th Int'l Symp. Graph Drawing (GD '05), Published as Technical Report 2005/175, University of Monash, Austrilia, Aug. 2005, pp. 1-15, http://www.csse.monash.edu.au/~tdwyer/ or http://citeseer.ist.psu.edu/735896.html. * |
| T. Dwyer, Y. Koren, and K. Marriott, "Stress Majorization with Orthogonal Ordering Constraints," Proc. 13th Int'l Symp. Graph Drawing (GD '05), Published as Technical Report 2005/175, University of Monash, Austrilia, Aug. 2005, pp. 1-15, http://www.csse.monash.edu.au/˜tdwyer/ or http://citeseer.ist.psu.edu/735896.html. * |
| T. Dwyer, Y. Koren, and K. Marriott, "Stress Majorization with Orthogonal Ordering Constraints," Proc. 13th Int'l Symp. Graph Drawing (GD '05), Sep. 12-14, 2005. * |
| W. He, K. Marriott "Constrained Graph Layout", Symp. On Graph Drawing, GD '96, vol. 1190 of Lecture notes in Computer Science, Springer, 1996, pp. 217-232. * |
| Y. Koren and D. Harel, Axis-by-Axis Stress Minimization Proc. Graph Drawing (GD '03), 2003. * |
| Y. Koren, Graph drawing by subspace optimization, in: Proc. 6th Eurographics-IEEE TCVG Symposia on Visualization (VisSym'04), Eurographics, 2004, pp. 65-74. * |
| Yehuda Koren, David Harel, One-dimensional layout optimization, with applications to graph drawing by axis separation, Computational Geometry: Theory and Applications, v.32 n.2, p. 115-138, Oct. 2005. * |
Cited By (17)
| Publication number | Priority date | Publication date | Assignee | Title |
|---|---|---|---|---|
| US20100073375A1 (en) * | 2008-09-25 | 2010-03-25 | International Business Machines Corporation | Optimizing edge crossing computations when creating a drawing of a directed graph having a minimum number of edge crossings |
| US8994730B2 (en) * | 2008-09-25 | 2015-03-31 | International Business Machines Corporation | Optimizing edge crossing computations when creating a drawing of a directed graph having a minimum number of edge crossings |
| US20120141972A1 (en) * | 2010-12-02 | 2012-06-07 | Microsoft Corporation | Untangled Euler Diagrams |
| US8442930B2 (en) * | 2010-12-02 | 2013-05-14 | Microsoft Corporation | Untangled Euler diagrams |
| US20120185775A1 (en) * | 2011-01-18 | 2012-07-19 | Alexander Clemm | Visualization of performance data over a network path |
| US9489279B2 (en) * | 2011-01-18 | 2016-11-08 | Cisco Technology, Inc. | Visualization of performance data over a network path |
| US20120313949A1 (en) * | 2011-06-07 | 2012-12-13 | International Business Machines Corporation | Automatic Selection of Different Visualizations for the Organization of Multivariate Data |
| US20120313947A1 (en) * | 2011-06-07 | 2012-12-13 | International Business Machines Corporation | Automatic Selection of Different Visualizations for the Organization of Multivariate Data |
| US9892530B2 (en) * | 2011-06-07 | 2018-02-13 | International Business Machines Corporation | Automatic selection of different visualizations for the organization of multivariate data |
| US9299173B2 (en) * | 2011-06-07 | 2016-03-29 | International Business Machines Corporation | Automatic selection of different visualizations for the organization of multivariate data |
| US20150092766A1 (en) * | 2012-03-29 | 2015-04-02 | Oren Jean | Localization, synchronization and navigation using passive sensor networks |
| US11140645B2 (en) * | 2012-03-29 | 2021-10-05 | Sulu Networks Ltd. | Localization, synchronization and navigation using passive sensor networks |
| US9824469B2 (en) | 2012-09-11 | 2017-11-21 | International Business Machines Corporation | Determining alternative visualizations for data based on an initial data visualization |
| US9824472B2 (en) | 2012-09-11 | 2017-11-21 | International Business Machines Corporation | Determining alternative visualizations for data based on an initial data visualization |
| US9106966B2 (en) | 2012-12-14 | 2015-08-11 | International Business Machines Corporation | Multi-dimensional channel directories |
| US20150262094A1 (en) * | 2014-03-12 | 2015-09-17 | International Business Machines Corporation | Automatically instantiating an organizational workflow across different geographical locations |
| US10977959B2 (en) * | 2018-01-05 | 2021-04-13 | International Business Machines Corporation | Nutrition graph |
Similar Documents
| Publication | Publication Date | Title |
|---|---|---|
| US7714862B1 (en) | Dig-Cola: directed graph layout through constrained energy minimization | |
| Akimushkin et al. | Text authorship identified using the dynamics of word co-occurrence networks | |
| Behrisch et al. | Matrix reordering methods for table and network visualization | |
| US7352371B2 (en) | System and method for providing a perspective-corrected representation of a multi-dimensional cluster | |
| Cavallo et al. | A visual interaction framework for dimensionality reduction based data exploration | |
| De Carvalho et al. | Adaptive Hausdorff distances and dynamic clustering of symbolic interval data | |
| US20240126418A1 (en) | Localized visual graph filters for complex graph queries | |
| US7885957B2 (en) | System and method for displaying clusters | |
| Veldt et al. | Minimizing localized ratio cut objectives in hypergraphs | |
| US9104963B2 (en) | Self organizing maps for visualizing an objective space | |
| Nguyen et al. | On the faithfulness of graph visualizations | |
| Dwyer et al. | Dig-CoLa: directed graph layout through constrained energy minimization | |
| US20180348998A1 (en) | Data access interface | |
| US20060161814A1 (en) | Method and system of data analysis using neural networks | |
| Wortmann | Surveying design spaces with performance maps: A multivariate visualization method for parametric design and architectural design optimization | |
| Alaçam et al. | Reconnoitring computational potentials of the vault-like forms: Thinking aloud on muqarnas tectonics | |
| Beliakov et al. | Density based fuzzy c-means clustering of non-convex patterns | |
| Dwyer et al. | Drawing directed graphs using quadratic programming | |
| Meidiana et al. | New quality metrics for dynamic graph drawing | |
| Didimo et al. | Fast layout computation of hierarchically clustered networks: Algorithmic advances and experimental analysis | |
| Ahajjam et al. | Community detection in social networks | |
| Scaldelai et al. | MulticlusterKDE: a new algorithm for clustering based on multivariate kernel density estimation | |
| CN113392332A (en) | Simplified visual analysis method for large-scale multi-element network data | |
| Zhao et al. | Structure revealing techniques based on parallel coordinates plot | |
| US20140372442A1 (en) | K-grid for clustering data objects |
Legal Events
| Date | Code | Title | Description |
|---|---|---|---|
| AS | Assignment |
Owner name: AT&T CORP.,NEW YORK Free format text: ASSIGNMENT OF ASSIGNORS INTEREST;ASSIGNOR:KOREN, YEHUDA;REEL/FRAME:023954/0786 Effective date: 20060503 |
|
| AS | Assignment |
Owner name: AT&T PROPERTIES, LLC,NEVADA Free format text: ASSIGNMENT OF ASSIGNORS INTEREST;ASSIGNOR:AT&T CORP.;REEL/FRAME:024068/0004 Effective date: 20100225 Owner name: AT&T INTELLECTUAL PROPERTY II, L.P.,NEVADA Free format text: ASSIGNMENT OF ASSIGNORS INTEREST;ASSIGNOR:AT&T PROPERTIES, LLC;REEL/FRAME:024068/0085 Effective date: 20100225 |
|
| FPAY | Fee payment |
Year of fee payment: 4 |
|
| FEPP | Fee payment procedure |
Free format text: MAINTENANCE FEE REMINDER MAILED (ORIGINAL EVENT CODE: REM.) |
|
| LAPS | Lapse for failure to pay maintenance fees |
Free format text: PATENT EXPIRED FOR FAILURE TO PAY MAINTENANCE FEES (ORIGINAL EVENT CODE: EXP.) |
|
| STCH | Information on status: patent discontinuation |
Free format text: PATENT EXPIRED DUE TO NONPAYMENT OF MAINTENANCE FEES UNDER 37 CFR 1.362 |