US7283231B2 - Compressive sampling and signal inference - Google Patents
Compressive sampling and signal inference Download PDFInfo
- Publication number
- US7283231B2 US7283231B2 US11/183,838 US18383805A US7283231B2 US 7283231 B2 US7283231 B2 US 7283231B2 US 18383805 A US18383805 A US 18383805A US 7283231 B2 US7283231 B2 US 7283231B2
- Authority
- US
- United States
- Prior art keywords
- optical signal
- measurements
- sampling
- elements
- transmission function
- Prior art date
- Legal status (The legal status is an assumption and is not a legal conclusion. Google has not performed a legal analysis and makes no representation as to the accuracy of the status listed.)
- Active, expires
Links
Images


Classifications
-
- G—PHYSICS
- G06—COMPUTING; CALCULATING OR COUNTING
- G06T—IMAGE DATA PROCESSING OR GENERATION, IN GENERAL
- G06T9/00—Image coding
-
- H—ELECTRICITY
- H04—ELECTRIC COMMUNICATION TECHNIQUE
- H04N—PICTORIAL COMMUNICATION, e.g. TELEVISION
- H04N19/00—Methods or arrangements for coding, decoding, compressing or decompressing digital video signals
- H04N19/10—Methods or arrangements for coding, decoding, compressing or decompressing digital video signals using adaptive coding
- H04N19/102—Methods or arrangements for coding, decoding, compressing or decompressing digital video signals using adaptive coding characterised by the element, parameter or selection affected or controlled by the adaptive coding
- H04N19/103—Selection of coding mode or of prediction mode
- H04N19/105—Selection of the reference unit for prediction within a chosen coding or prediction mode, e.g. adaptive choice of position and number of pixels used for prediction
-
- H—ELECTRICITY
- H04—ELECTRIC COMMUNICATION TECHNIQUE
- H04N—PICTORIAL COMMUNICATION, e.g. TELEVISION
- H04N19/00—Methods or arrangements for coding, decoding, compressing or decompressing digital video signals
- H04N19/10—Methods or arrangements for coding, decoding, compressing or decompressing digital video signals using adaptive coding
- H04N19/102—Methods or arrangements for coding, decoding, compressing or decompressing digital video signals using adaptive coding characterised by the element, parameter or selection affected or controlled by the adaptive coding
- H04N19/12—Selection from among a plurality of transforms or standards, e.g. selection between discrete cosine transform [DCT] and sub-band transform or selection between H.263 and H.264
-
- H—ELECTRICITY
- H04—ELECTRIC COMMUNICATION TECHNIQUE
- H04N—PICTORIAL COMMUNICATION, e.g. TELEVISION
- H04N19/00—Methods or arrangements for coding, decoding, compressing or decompressing digital video signals
- H04N19/10—Methods or arrangements for coding, decoding, compressing or decompressing digital video signals using adaptive coding
- H04N19/102—Methods or arrangements for coding, decoding, compressing or decompressing digital video signals using adaptive coding characterised by the element, parameter or selection affected or controlled by the adaptive coding
- H04N19/132—Sampling, masking or truncation of coding units, e.g. adaptive resampling, frame skipping, frame interpolation or high-frequency transform coefficient masking
-
- H—ELECTRICITY
- H04—ELECTRIC COMMUNICATION TECHNIQUE
- H04N—PICTORIAL COMMUNICATION, e.g. TELEVISION
- H04N19/00—Methods or arrangements for coding, decoding, compressing or decompressing digital video signals
- H04N19/10—Methods or arrangements for coding, decoding, compressing or decompressing digital video signals using adaptive coding
- H04N19/134—Methods or arrangements for coding, decoding, compressing or decompressing digital video signals using adaptive coding characterised by the element, parameter or criterion affecting or controlling the adaptive coding
- H04N19/136—Incoming video signal characteristics or properties
- H04N19/14—Coding unit complexity, e.g. amount of activity or edge presence estimation
-
- H—ELECTRICITY
- H04—ELECTRIC COMMUNICATION TECHNIQUE
- H04N—PICTORIAL COMMUNICATION, e.g. TELEVISION
- H04N19/00—Methods or arrangements for coding, decoding, compressing or decompressing digital video signals
- H04N19/10—Methods or arrangements for coding, decoding, compressing or decompressing digital video signals using adaptive coding
- H04N19/169—Methods or arrangements for coding, decoding, compressing or decompressing digital video signals using adaptive coding characterised by the coding unit, i.e. the structural portion or semantic portion of the video signal being the object or the subject of the adaptive coding
- H04N19/17—Methods or arrangements for coding, decoding, compressing or decompressing digital video signals using adaptive coding characterised by the coding unit, i.e. the structural portion or semantic portion of the video signal being the object or the subject of the adaptive coding the unit being an image region, e.g. an object
- H04N19/176—Methods or arrangements for coding, decoding, compressing or decompressing digital video signals using adaptive coding characterised by the coding unit, i.e. the structural portion or semantic portion of the video signal being the object or the subject of the adaptive coding the unit being an image region, e.g. an object the region being a block, e.g. a macroblock
-
- H—ELECTRICITY
- H04—ELECTRIC COMMUNICATION TECHNIQUE
- H04N—PICTORIAL COMMUNICATION, e.g. TELEVISION
- H04N19/00—Methods or arrangements for coding, decoding, compressing or decompressing digital video signals
- H04N19/10—Methods or arrangements for coding, decoding, compressing or decompressing digital video signals using adaptive coding
- H04N19/169—Methods or arrangements for coding, decoding, compressing or decompressing digital video signals using adaptive coding characterised by the coding unit, i.e. the structural portion or semantic portion of the video signal being the object or the subject of the adaptive coding
- H04N19/18—Methods or arrangements for coding, decoding, compressing or decompressing digital video signals using adaptive coding characterised by the coding unit, i.e. the structural portion or semantic portion of the video signal being the object or the subject of the adaptive coding the unit being a set of transform coefficients
-
- H—ELECTRICITY
- H04—ELECTRIC COMMUNICATION TECHNIQUE
- H04N—PICTORIAL COMMUNICATION, e.g. TELEVISION
- H04N19/00—Methods or arrangements for coding, decoding, compressing or decompressing digital video signals
- H04N19/10—Methods or arrangements for coding, decoding, compressing or decompressing digital video signals using adaptive coding
- H04N19/169—Methods or arrangements for coding, decoding, compressing or decompressing digital video signals using adaptive coding characterised by the coding unit, i.e. the structural portion or semantic portion of the video signal being the object or the subject of the adaptive coding
- H04N19/184—Methods or arrangements for coding, decoding, compressing or decompressing digital video signals using adaptive coding characterised by the coding unit, i.e. the structural portion or semantic portion of the video signal being the object or the subject of the adaptive coding the unit being bits, e.g. of the compressed video stream
-
- H—ELECTRICITY
- H04—ELECTRIC COMMUNICATION TECHNIQUE
- H04N—PICTORIAL COMMUNICATION, e.g. TELEVISION
- H04N19/00—Methods or arrangements for coding, decoding, compressing or decompressing digital video signals
- H04N19/50—Methods or arrangements for coding, decoding, compressing or decompressing digital video signals using predictive coding
- H04N19/59—Methods or arrangements for coding, decoding, compressing or decompressing digital video signals using predictive coding involving spatial sub-sampling or interpolation, e.g. alteration of picture size or resolution
-
- H—ELECTRICITY
- H04—ELECTRIC COMMUNICATION TECHNIQUE
- H04N—PICTORIAL COMMUNICATION, e.g. TELEVISION
- H04N19/00—Methods or arrangements for coding, decoding, compressing or decompressing digital video signals
- H04N19/50—Methods or arrangements for coding, decoding, compressing or decompressing digital video signals using predictive coding
- H04N19/593—Methods or arrangements for coding, decoding, compressing or decompressing digital video signals using predictive coding involving spatial prediction techniques
-
- H—ELECTRICITY
- H04—ELECTRIC COMMUNICATION TECHNIQUE
- H04N—PICTORIAL COMMUNICATION, e.g. TELEVISION
- H04N19/00—Methods or arrangements for coding, decoding, compressing or decompressing digital video signals
- H04N19/60—Methods or arrangements for coding, decoding, compressing or decompressing digital video signals using transform coding
- H04N19/63—Methods or arrangements for coding, decoding, compressing or decompressing digital video signals using transform coding using sub-band based transform, e.g. wavelets
Definitions
- Embodiments of the present invention relate to systems and methods for compressive sampling in spectroscopy and spectral imaging. More particularly, embodiments of the present invention relate to systems and methods for using less than one measurement per estimated signal value in spectroscopy and spectral imaging.
- a signal is a physical phenomenon distributed over a space. Examples include signals distributed over time, such as electromagnetic waves on antennas or transmission lines, signals distributed over Fourier space, such as optical or electrical spectra, and multidimensional signals distributed over physical space, such as 2D and 3D images.
- Digital signal analysis consists of signal estimation from discrete measurements. For many years, sampling theory formed the theoretical core of signal analysis. Basic signal characterization required regular sampling at a rate proportional to the signal bandwidth. The minimal sampling rate is termed the Nyquist frequency.
- Multiresolution sampling is regarded as a generalization of generalized sampling and is used as a means of balancing sampling rates and parallel signal analysis.
- Multiresolution representations implemented using fractal and wavelet analysis, have been found to be critically enabling for signal compression on the basis of the empirically observed self-similarity of natural signals on multiple scales. For appropriate bases, natural signals yield sparse multiscale representations. Sparsity and hierarchical self-similarity have been combined in signal compression algorithms such as the embedded zero-tree and set partitioning in hierarchical trees algorithms.
- Generalized sampling and compression technologies resolve specific challenges in signal processing systems.
- Generalized sampling enables systems to sample at lower rates than the Nyquist frequency, and data compression enables post-sampling reduction of the system data load.
- Parameter estimation uses sampled data to fit an a priori signal model.
- the signal model typically involves much greater constraints than conventional band limits. For example, one can assume that the signal consists of a single point source or a source state described by just a few parameters.
- parameter estimation several studies have considered estimation of the frequency or position of an unknown but narrow-band source from sub-Nyquist samples. Interpolation generates new samples from measured data by curve fitting between known points.
- One embodiment of the present invention is a method for compressively sampling an optical signal.
- An optical component with a plurality of transmissive elements and a plurality of opaque elements is created. The location of the plurality of transmissive elements and the plurality of opaque elements is determined by a transmission function.
- the optical component includes but is not limited to a transmission mask or a coded aperture.
- the spectrum of the optical signal is dispersed across the optical component. Signals transmitted by the plurality of transmissive elements are detected in a single time step at each sensor of a plurality of sensors dispersed spatially with respect to the optical component. Each sensor of the plurality of sensors produces a measurement resulting in a number of measurements for the single time step.
- a number of estimated optical signal values is calculated from the number of measurements and the transmission function. The transmission function is selected so that the number of measurements is less than the number of estimated optical signal values.
- the spectrometer includes a transmission mask, a diffraction grating, a plurality of sensors, and a processor.
- the transmission mask has a plurality of transmissive elements and a plurality of opaque elements. The location of the plurality of transmissive elements and the plurality of opaque elements is determined by a transmission function.
- the diffraction grating disperses a spectrum of an optical signal across the transmission mask.
- the plurality of sensors is dispersed spatially with respect to the transmission mask. Each sensor of the plurality of sensors detects signals transmitted by the plurality of transmissive elements in a single time step. Each sensor also produces a measurement resulting in a number of measurements for the single time step.
- the processor calculates a number of estimated optical signal values from the number of measurements and the transmission function. The transmission function is selected so that the number of measurements is less than the number of estimated optical signal values.
- the optical wavemeter includes a slit, a diffraction grating, a mask, a complementary grating, and a linear detector array.
- a monochromatic source is incident on the slit.
- the diffraction grating produces an image of the slit in an image plane at a horizontal position that is wavelength dependent.
- the mask has a two-dimensional pattern of transmission variations.
- the mask produces different vertical intensity channels for different spectral channels.
- the complementary grating produces a stationary image of the slit independent of wavelength.
- the linear detector array measures vertical variations in intensity of the stationary image. The mask is created so that a number of measurements made by the linear detector is less than a number of spectral channels sampled.
- Another embodiment of the present invention is a method for temporally compressively sampling a signal.
- a plurality of analog to digital converters is assembled to sample the signal.
- Each analog to digital converter of the plurality of analog to digital converters is configured to sample the signal at a time step determined by a temporal sampling function.
- the signal is sampled over a period of time using the plurality of analog to digital converters.
- Each analog to digital converter of the plurality of analog to digital converters produces a measurement resulting in a number of measurements for the period of time.
- a number of estimated signal values is calculated from the number of measurements and the temporal sampling function.
- the temporal sampling function is selected so that the number of measurements is less than the number of estimated signal values.
- Another embodiment of the present invention is a method for compressively sampling an optical signal using an imaging system.
- the imaging system is created from a plurality of subimaging systems.
- Each subimaging system includes a subaperture and a plurality of sensors.
- the optical signal is collected at each subaperture of the plurality of subimaging systems at a single time step.
- the optical signal is transformed into a subimage at each subimaging system of the plurality of subimaging systems.
- the subimage includes at least one measurement from the plurality of sensors of the subimaging system.
- An image of the optical signal is calculated from the sampling function and each subimage, spatial location, pixel sampling function, and point spread function of each subimaging system of the plurality of subimaging systems.
- the sampling function is selected so that the number of measurements from the plurality of subimages is less than the number of estimated optical signal values that make up the image.
- Another embodiment of the present invention is a method for spatially focal plane coding an optical signal using an imaging system.
- the imaging system is created from a plurality of subimaging systems.
- Each subimaging system includes an array of electronic detectors.
- Each subimaging system is dispersed spatially with respect to a source of the optical signal according to a sampling function.
- the optical signal is collected at each array of electronic detectors of the plurality of subimaging systems at a single time step.
- the optical signal is transformed into a subimage at each subimaging system.
- the subimage includes at least one measurement from the array of electronic detectors of the subimaging system.
- An image of the optical signal is calculated from the sampling function and each subimage, spatial location, pixel sampling function, and point spread function of each subimaging system of the plurality of subimaging systems.
- the sampling function is selected so that the number of measurements for the plurality of subimages is less than the number of estimated optical signal values that make up the image.
- Another embodiment of the present invention is a method for temporally focal plane coding an optical signal using an imaging system.
- the imaging system is created from a plurality of subimaging systems.
- Each subimaging system includes an array of electronic detectors.
- the optical signal is collected at each array of electronic detectors of the plurality of subimaging systems at a different time step according to a temporal sampling function.
- the optical signal is transformed into a subimage at each subimaging system of the plurality of subimaging systems.
- the subimage includes at least one measurement from an array of electronic detectors of each subimaging system.
- An image of the optical signal is calculated from the temporal sampling function and each subimage, time step, pixel sampling function, and point spread function of each subimaging system of the plurality of subimaging systems.
- the temporal sampling function is selected so that the number of measurements for the plurality of subimages is less than the number of estimated optical signal values comprising the image.
- Another embodiment of the present invention is a method for spatially and temporally focal plane coding an optical signal using an imaging system.
- the imaging system is created from a plurality of subimaging systems.
- Each subimaging system includes an array of electronic detectors.
- Each subimaging system is dispersed spatially with respect to a source of the optical signal according to a spatial sampling function.
- the optical signal is collected at each array of electronic detectors of the plurality of subimaging systems at a different time step according to a temporal sampling function.
- the optical signal is transformed into a subimage at each subimaging system of the plurality of subimaging systems.
- the subimage includes at least one measurement from an array of electronic detectors of the each subimaging system.
- An image of the optical signal is calculated from the spatial sampling function, the temporal sampling function and each subimage, spatial location, time step, pixel sampling function, and point spread function of each subimaging system of the plurality of subimaging systems.
- the spatial sampling function and the temporal sampling function are selected so that the number of measurements for the plurality of subimages is less than the number of estimated optical signal values that make up the image.
- Another embodiment of the present invention is a method for compressively sampling an optical signal using multiplex sampling.
- Group measurement of multiple optical signal components on single detectors is performed such that less than one measurement per signal component is taken.
- Probabilistic inference is used to produce a decompressed optical signal from the group measurement on a digital computer.
- Another embodiment of the present invention is method for compressively sampling an optical signal.
- a reflective mask is created with a plurality of reflective elements and a plurality of non-reflective elements. The location of the plurality of reflective elements and the plurality of non-reflective elements is determined by a reflection function.
- a spectrum of the optical signal is dispersed across the reflective mask. Signals reflected by the plurality of reflective elements are detected in a single time step at each sensor of a plurality of sensors dispersed spatially with respect to the reflective mask. Each sensor of a plurality of sensors produces a measurement resulting in a number of measurements for the single time step.
- a number of estimated optical signal values is calculated from the number of measurements and the reflection function. The reflection function is selected so that the number of measurements is less than the number of estimated optical signal values.
- Another embodiment of the present invention is a method for compressively sampling an optical signal using an optical component to encode multiplex measurements.
- a mapping is created from the optical signal to a detector array by spatial and/or spectral dispersion.
- Signals transmitted are detected by a plurality of transmissive elements of the optical component at each sensor of a plurality of sensors of the detector array dispersed spatially with respect to the optical component.
- Each sensor of the plurality of sensors produces a measurement resulting in a number of measurements.
- a number of estimated optical signal values is calculated from the number of measurements and a transmission function, wherein the transmission function is selected so that the number of measurements is less than the number of estimated optical signal values.
- the spectrometer includes a plurality of optical components and a digital computer.
- the plurality of optical components measures multiple linear projections of a spectral signal.
- the digital computer performs decompressive inference on the multiple linear projections to produce a decompressed signal.
- FIG. 1 is an exemplary plot of a planar function space where a subspace spanned by the physical sampling is isomorphic to a subspace spanned by possible signals, in accordance with an embodiment of the present invention.
- FIG. 2 is an exemplary plot of a planar function space where a subspace spanned by the physical sampling is indicative of a subspace spanned by possible signals, in accordance with an embodiment of the present invention.
- FIG. 3 is a flowchart showing an exemplary method for compressively sampling an optical signal using a spectrometer, in accordance with an embodiment of the present invention.
- FIG. 4 is a schematic diagram of an exemplary spectrometer implementing arbitrary mapping, in accordance with an embodiment of the present invention.
- FIG. 5 is a plot of an exemplary spectral transmission mask for multiscale Haar sampling, in accordance with an embodiment of the present invention.
- FIG. 6 is an exemplary 8 ⁇ 8 transformation code for a quantized cosine transform, in accordance with an embodiment of the present invention.
- FIG. 7 is a comparison of exemplary simulated image reconstructions using permuted Hadamard transform, discrete cosine transform, and quantized cosine transform matrices using 4.69%, 15.63%, and 32.81% of the transformed components or available measurements, in accordance with an embodiment of the present invention.
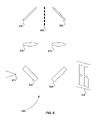
- FIG. 8 is a schematic diagram of an exemplary spectrometer employing compressive sampling, in accordance with an embodiment of the present invention.
- FIG. 9 is a plot of an exemplary spectral transmission mask used to make measurements on Haar-wavelet averages and details, in accordance with an embodiment of the present invention.
- FIG. 10 is a flowchart showing an exemplary method for reconstructing Haar-wavelet averages and details for the exemplary spectral transmission mask shown in FIG. 9 , in accordance with an embodiment of the present invention.
- FIG. 11 is a plot of an exemplary comparison of original neon spectral data and reconstructed neon spectral data using the exemplary method shown in FIG. 10 , in accordance with an embodiment of the present invention.
- FIG. 12 is a plot of an exemplary comparison of original neon wavelet coefficient data and reconstructed neon coefficient data using the exemplary method shown in FIG. 10 , in accordance with an embodiment of the present invention.
- FIG. 13 is a schematic diagram showing an exemplary optical wavemeter, in accordance with an embodiment of the present invention.
- FIG. 14 is a plot of an exemplary mask for a 256-channel wavemeter with binary sensors, in accordance with an embodiment of the present invention.
- FIG. 15 is a plot of an exemplary mask for a 256-channel wavemeter with 4-level sensors, in accordance with an embodiment of the present invention.
- FIG. 16 is a depiction of an exemplary sample image taken using the exemplary optical wavemeter of FIG. 13 and the exemplary mask of FIG. 14 , in accordance with an embodiment of the present invention.
- FIG. 17 is a plot of exemplary expected bit patterns for each of 100 wavelengths using the exemplary optical wavemeter of FIG. 13 and the exemplary mask of FIG. 14 , in accordance with an embodiment of the present invention.
- FIG. 18 is a plot of exemplary measured bit patterns for each of 100 wavelengths using the exemplary optical wavemeter of FIG. 13 and the exemplary mask of FIG. 14 , in accordance with an embodiment of the present invention.
- FIG. 19 is a plot of exemplary measured errors in bit patterns for each of 100 wavelengths using the exemplary optical wavemeter of FIG. 13 and the exemplary mask of FIG. 14 , in accordance with an embodiment of the present invention.
- FIG. 20 is a plot of exemplary quaternary digit patterns for each of 100 wavelengths using the exemplary optical wavemeter of FIG. 13 and the exemplary mask of FIG. 15 , in accordance with an embodiment of the present invention.
- FIG. 21 is a plot of exemplary measured quaternary digit patterns for each of 100 wavelengths using the exemplary optical wavemeter of FIG. 13 and the exemplary mask of FIG. 15 , in accordance with an embodiment of the present invention.
- FIG. 22 is a plot of exemplary measured errors in quaternary digit patterns for each of 100 wavelengths using the exemplary optical wavemeter of FIG. 13 and the exemplary mask of FIG. 15 , in accordance with an embodiment of the present invention.
- FIG. 23 is a flowchart showing an exemplary method for temporally compressively sampling a signal, in accordance with an embodiment of the present invention.
- FIG. 24 is a flowchart showing an exemplary method for spatially focal plane coding an optical signal using an imaging system, in accordance with an embodiment of the present invention.
- FIG. 25 is a flowchart showing an exemplary method for temporally focal plane coding an optical signal using an imaging system, in accordance with an embodiment of the present invention.
- FIG. 26 is a flowchart showing an exemplary method for spatially and temporally focal plane coding an optical signal using an imaging system, in accordance with an embodiment of the present invention.
- FIG. 27 is a flowchart showing an exemplary method for compressively sampling an optical signal using multiplex sampling, in accordance with an embodiment of the present invention.
- FIG. 28 is a flowchart showing an exemplary method for compressively sampling an optical signal using a reflective mask, in accordance with an embodiment of the present invention.
- FIG. 29 is a flowchart showing an exemplary method for compressively sampling an optical signal using an optical component to encode multiplex measurements, in accordance with an embodiment of the present invention.
- compressive sampling is to reduce the number of measurements needed to characterize a signal.
- the defining characteristic of compressive sampling is that less than one measurement is registered in the system per signal value estimated.
- Compressive sampling can be viewed as an implementation of data compression in the physical layer.
- One embodiment of the present invention is a method for using compressive sampling in optical imaging and spectroscopy.
- Positivity is the defining feature of images and spectra.
- the nominal detected signal is envisioned as a positive count of the number of photons detected over a certain spatial and temporal window. It is, of course, possible to introduce negative and complex weights in optical measurements using spatial, temporal or spectral filters.
- compressive sampling enables cameras with more pixels in the estimated image than in the electronic focal plane.
- Compressive sampling can be particularly important in spectral and temporal sampling of image data, in which cases the number of measurements per spatial resolution element can or cannot exceed one but the number of measurements per estimated sample in the full space-time-spectral data cube is much less than one.
- compressive sampling enables spectral characterization with fewer detectors than conventional systems. Deeper spectroscopic significance arises, however, from using compressive sampling for direct molecular or atomic analysis without forming a conventional spectrum.
- Linearity and predeterminism are the defining features of sampling strategies.
- Predeterminism refers to the condition that the measurement transformation H is fixed prior to measurement and is independent of the outcome of any single measurement. While there are many examples of adaptive measurement in both imaging and spectroscopy, simplicity dictates focusing on single step non-adaptive measurement.
- Compressive sampling integrates previous work in signal sampling, representation and compression, multiplex sensing and group testing.
- Compressive sampling is a novel approach for sub-Nyquist frequency measurement.
- One novelty is in the combination of generalized sampling and multiscale data compression strategies with two previously unrelated approaches: multiplex sensing and group testing.
- Multiplex sensing consists of taking measurements that depend on multiple source points in the object space under examination.
- Multiplex sensing involves the concept of the object space.
- the object space terminology originates in spectroscopy, where Fourier and Hadamard transform instruments are referred to as multiplex spectrometers in contrast to isomorphic instruments based on grating diffraction.
- multiplex sensing has also been applied in coded aperture and interferometric imaging systems.
- coded aperture and interferometric imaging systems A variety of other sensor modalities are viewed as multiplex systems, including computed tomography and coherence tomography sensors.
- Compressive sampling extends the adaptive multiscale sensing approach by using multiplex sensing to implement group testing on multiscale features.
- Group testing has generally been applied to analysis of discrete objects, such as coins, weights or chemical samples.
- Another embodiment of the present invention is a method that applies group sampling to filter bank samples drawn from spatially distributed signals.
- group testing consists of making signal measurements which depend on disjoint groups of resolution or filter elements abstracted from the signal.
- Representation sampling is distinct from measurement sampling.
- Representation sampling refers to the mathematical representation of a continuous function ⁇ (x), x ⁇ d , in terms of finite or countably many discrete numbers.
- a representation sampling system consists of a rule for generating sample values from ⁇ (x) and a rule for approximating ⁇ (x) from the sample values.
- the sampling rule for Nyquist-Shannon sampling returns values of ⁇ (x) at equally spaced points and signal approximation consists of summing products of sample values with the sin c basis.
- Measurement sampling refers to the physical process of measuring “samples” of ⁇ (x). For example, a camera measures samples of the light intensity on a focal plane. The measurement samples are the raw signal values measured from the physical pixels.
- Imagers and spectrometers infer representation samples from measurement samples of physical signals.
- representation samples are identical to measurement samples.
- representation samples are not unique for a given signal.
- Sensor systems are often modeled by continuous transformations of ⁇ (x), as in the Fourier or Radon transform, prior to discrete sampling.
- representations are constructed using discrete bases on the transformed space, and measurement samples are treated as representation samples on the transform space. This approach is taken, for example, in x-ray tomography.
- Representation samples can also take many forms on the native continuous space of ⁇ (x). In most cases it is assumed that this space is L 2 ( d ).
- Measurement sampling on transformed spaces are selected on the basis of physical characteristics of measurement systems.
- Tomographic systems for example, measure Radon transforms rather than native samples because Radon data can be measured non-invasively.
- Generalized representation sampling in contrast, has been considered primarily in post-processing. It is possible to design sensors for which measurements directly estimate generalized representation samples, but to date examples of this approach are rare.
- physical constraints in particular, require that optical signals be non-negative, and modal coherence constraints limit the capacity to implement arbitrary sampling schemes.
- Isomorphism between representation samples and measurement samples is not necessarily a design goal.
- Generalized representation sampling focuses primarily on high fidelity description of the signal on the native space.
- the goal of compressive sampling is to ensure that measured data is as useful as possible in estimating the signal. Given a finite number of measurements, surprisingly little analysis of whether or not conventional samples represent a good strategy has been done. Issues of uniform verses nonuniform sampling have been widely considered, but such analyses normally consider the sample itself to relatively simple and local in a continuous space.
- a precise model for what is meant by a “measurement” and how the measurement is associated with the signal is needed.
- the process of measurement is associated with the process of analog to digital conversion, and measurement is specifically defined to be the process of abstracting a digital number from an analog process.
- a measurement sample is thus a digital number with at least partial dependence on an analog state.
- representation samples are in theory continuous or discrete
- representation sample values are also rational numbers.
- the primary difference between measurement samples and representation samples is that representation samples are associated in some simple way with signal values in a continuous space. Measurement samples are, in principle, associated with any property of the signal and need not be locally dependent on the signal value.
- Optical sensing includes a long history of sensing based on non-local measurements, dating back to before the Michelson interferometer.
- Concepts of locality are also fluid in optics.
- Fourier space is the native signal space for spectroscopy.
- Fourier and Hadamard spectrometers have been particularly popular non-local measurement systems. Sensors for which measurements depend on multiple points in the native signal space are called multiplex sensors in the optical literature.
- Embodiments of the present invention examine and exploit deliberately encoded differences between representation samples and measurement samples.
- these embodiments show that the number of measurements needed to characterize a signal can be less than the number of representation samples used to describe the signal.
- a system in which less than one measurement is made per reconstructed representation sample is compressively sampled. Multiplex sensing is essential to compressive sampling.
- a representation sampling model is a mapping between a sample space of discrete vectors and a reconstruction space of continuous functions.
- the function space associated with Shannon's sampling for example, consists of band-limited functions in L 2 ( ), any function ⁇ (x) in the subspace can be exactly represented, or reconstructed perfectly from the samples, by Eqn. (1).
- Discrete representation of a continuous function is the motivation for representation sampling.
- ⁇ (x) lies within the subspace spanned by the sampling functions.
- the process of projecting ⁇ (x) onto the sampling basis and representing on the reconstruction basis is a projection of ⁇ (x) onto a subspace of the full range of possible signals.
- f c T ⁇ is the projection of ⁇ into the space V c .
- the components of f c are referred to as the canonical signal values.
- f c is the digital image of the object.
- f c represents the projection of the spectrum of the source under test into the space V c .
- h the vector of measurement response functions h n (x), which is also referred to as the physical sampling functions.
- h n (x) the vector of measurement response functions
- the rectangle averaging function is common in measurement sampling.
- a digital camera for example, integrates the value of the optical intensity over a square pixel.
- Measurement sampling is connected to representation sampling through the physical sampling functions h n (x).
- Eqn. (7) is the basic model for the forward transformation from ⁇ (x) to measurements.
- Signal estimation consists of inversion of this model.
- the utility and effectiveness of these systems is evaluated based on measures of the fidelity between the estimated and canonical signals.
- the measurement system is completely specified by matrix H. It is a multiplex system if H has non-zero off-diagonal elements.
- a measurement system is compressive if the length of g is less than the length of f c (i.e., the number of rows is less than the number of columns in H).
- V h represents the subspace of V c spanned by the physical sampling functions.
- V ⁇ represents the subspace orthogonal to V h in V c .
- Functions in V ⁇ produce zero measurement by the measurement system H.
- V ⁇ denotes the subset of V c spanned by possible signals ⁇ (x). If V h is isomorphic to V ⁇ , g approximates f c . If V h is indicative of V ⁇ , there is a one-to-one mapping between g and f c .
- FIG. 1 is an exemplary plot of a planar function space 100 , V c , where a subspace spanned by the physical sampling 110 , V h , is isomorphic to subspace spanned by possible signals 120 , V ⁇ , in accordance with an embodiment of the present invention.
- Isomorphic signal inference is attractive when V ⁇ 120 corresponds to a linear subset of V c 100 .
- V ⁇ 120 corresponds to a line on the plane.
- V h 110 is made equal to line 120 .
- V ⁇ 120 is a straight line, or an affine space in V c 100 .
- a simple linear projection is be used to relate V h 110 to V ⁇ 120 .
- the projection completely describes the state of the signal f c .
- the sampling is therefore compressive and the inference is linear.
- FIG. 2 is an exemplary plot of a planar function space 200 , V c , where a subspace spanned by the physical sampling 210 , V h , is indicative of a subspace spanned by possible signals 220 , V ⁇ , in accordance with an embodiment of the present invention.
- Indicative signal inference is attractive when V ⁇ 220 is indexed by a linear projection of V c 200 .
- V ⁇ 220 corresponds to a curve on the plane. If V h 210 is a line parallel to the vertical axis, a one-to-one correspondence is drawn between points in V h 210 and points in V ⁇ 220 . Each point in V h 210 is mapped on to the corresponding point in V ⁇ 210 by adding a unique vector drawn from V ⁇ .
- V ⁇ 220 is a curve of one parameter. Its canonical components are dependent on the parameter.
- the component ⁇ h by compressive sampling, can be used as an index or as parameters of ⁇ c .
- f h uniquely determines the signal f c .
- the challenge in isomorphic measurement is to discover the subset of V c that approximates V ⁇ .
- Discovery is accomplished by Karhunen-Loéve decomposition, for example, and similar methods.
- Indicative measurement poses the dual challenges of characterizing V ⁇ and of development of an algorithm to map g on to f c . While isomorphic inference is always linear in g, linear and nonlinear methods of indicative inference can be considered.
- the primary challenges in using signal inference to achieve compressive sampling are characterization of V ⁇ , design of H such that V h is both indicative of V ⁇ and physically achievable in sensor hardware, and development of an efficient and accurate algorithm mapping g into an estimate for f h and mapping the estimated f h into an estimate for f c .
- V ⁇ is typically characterized by analyzing a representative sample of signals methods such as Karhunen-Loéve decomposition. Estimation algorithms are relatively straightforward in this case.
- f h is linearly determined by measurement g, but the relationship between g and f ⁇ is nonlinear and represented via the integration of the information of f h with prior knowledge regarding V ⁇ .
- efficient group testing sensors have been demonstrated for the case in which V ⁇ is known to consist of isolated point sources in V c .
- f c has at most one nonzero component. Signals of much greater complexity for which an articulated description of V ⁇ is unavailable are considered below.
- ⁇ c For signal reference, various methods to explore and exploit the relationship between g and ⁇ ⁇ are presented.
- the components of ⁇ c from multi-scale group testing measurement have a hierarchically local relationship.
- ⁇ h After the estimation of ⁇ h , methods that attempt to optimize certain objective measures over the null space of H are used, subject to certain constraints. Both the optimization objectives and the constraints are based on the priori knowledge of the targeted signals.
- the priori knowledge may be described by physical models, statistical models, or their combinations.
- one set of group testing methods rely on Bayesian inference based on statistical models of spectra and images as well as multiplex measurements.
- the optical field is characterized such that g, H and f c are bipolar or complex.
- f c represents a nonnegative power spectral density or radiance. It is assumed that the components of g, H and f c are nonnegative and real. The primary motivation for this restriction is the realization that potential bipolar or complex representations not withstanding, the vast majority of images and spectra of interest are represented as nonnegative arrays.
- H Selection of a physically achievable and numerically attractive kernel H is the core of sensor system design.
- H must have a multiplex structure because identity mappings are not physically achievable.
- identity mapping is physically achievable if aperture size and system volume are not constrained.
- multiplexing is performed as a means of achieving compressive sampling and of optimizing design constraints such as sensor cost, sensor sampling rate, and design geometry.
- FIG. 3 is a flowchart showing an exemplary method 300 for compressively sampling an optical signal, in accordance with an embodiment of the present invention.
- an optical component with a plurality of transmissive elements and a plurality of opaque elements is created.
- the location of the plurality of transmissive elements and the plurality of opaque elements is determined by a transmission function.
- the optical component includes but is not limited to a transmission mask or a coded aperture.
- step 320 the spectrum of the optical signal is dispersed across the optical component.
- step 330 signals transmitted by the plurality of transmissive elements are detected in a single time step at each sensor of a plurality of sensors dispersed spatially with respect to the optical component. Each sensor of the plurality of sensors produces a measurement resulting in a number of measurements for the single time step.
- a number of estimated optical signal values is calculated from the number of measurements and the transmission function.
- the transmission function is selected so that the number of measurements is less than the number of estimated optical signal values.
- the number of estimated optical signal values is calculated by multiplying the number of measurements by a pseudo-inverse of the transmission function. In another embodiment of the present invention, the number of estimated optical signal values is calculated by a linear constrained optimization procedure. In another embodiment of the present invention, the number of estimated optical signal values is calculated by a non-linear constrained optimization procedure. In another embodiment of the present invention, the optical component is adaptively or dynamically variable. In another embodiment of the present invention, the adaptively or dynamically variable optical component is based on electro-optic effects, liquid crystals, or micro mechanical devices. In another embodiment of the present invention, the optical component implements positive and respective negative elements of an encoding.
- FIG. 4 is a schematic diagram of an exemplary spectrometer 400 implementing arbitrary mapping, in accordance with an embodiment of the present invention.
- Single mode spectrometer 400 is a baseline design.
- the input field is mapped through a pinhole spatial filter 410 .
- Pinhole 410 is collimated by spherical lens 420 and diffracted by grating 430 .
- Grating 430 disperses the spectrum by creating a linear mapping between direction of propagation or wavenumber and wavelength.
- Cylindrical lens 440 following grating 430 , focuses the field along the dispersion direction such that spectral components at coded mask 450 are separated into lines.
- each line is a column
- codes arranged perpendicular to the dispersion direction in coded mask 450 modulate the spectrum in rows.
- the ij th pixel on coded mask 450 then corresponds to the ij th component of H, h ij .
- the value of h ij equal to the transmittance of coded mask 450 at the corresponding pixel and is set arbitrarily between zero and one.
- f is calculated from g and H using processor 480 , for example.
- FIG. 4 demonstrates a form of compressive sampling in building an optical wavemeter, in accordance with an embodiment of the present invention. While this approach demonstrates that any filter array can be implemented in a spectrometer, the resulting system is physically nearly as large as a fully sampled spectrometer with the same resolution.
- Another embodiment of the present invention is a multiplex spectrometer with much smaller size that uses a photonic crystal filter. In this embodiment, which is a compact system, it is not possible to implement arbitrary filter functions.
- coded mask 450 is implemented using a holographic filter, a holographic filter array, a multiplex grating hologram, a multipass interferometer, a thin film filter, an array of thin film filters, and an array of photonic crystal filters.
- Another embodiment of the present invention is a method involving multiscale sampling and group testing of correlated and uncorrelated signal components.
- Signals are random processes with finite correlation distances.
- the signal component ⁇ i is highly correlated with the signal component ⁇ i+1 , but is independent of ⁇ i+N for sufficiently large N.
- a group test is implemented on two uncorrelated coefficients linear combinations of ⁇ i and ⁇ i+N can be measured.
- Such delocalized group tests are easily implemented in a long baseline spectrometer system.
- FIG. 5 is a plot of an exemplary spectral transmission mask 500 for multiscale Haar sampling, in accordance with an embodiment of the present invention.
- Transmission mask 500 is, for example, coded mask 450 of spectrometer 400 in FIG. 4 .
- the spectrum consists of 256 channels. The first 16 rows sample the mean spectrum of length 16 blocks. The next 16 rows sample the means of the first eight channels sampled in the previous blocks, the final 128 measurements sample individual channels.
- Mask 500 represents a unipolar nonnegative sampling of the Haar wavelet decomposition, with nonnegativity obtained by zeroing the negative components as discussed above for Hadamard and Fourier spectroscopy. Mask 500 is not compressive, 256 spectra are reconstructed from 256 measurements.
- the estimated or reconstructed signal is linearly related to the measurements g.
- the sampling space V h contains the source space V s .
- digital compression systems may implement essentially any transformation H for any specified source space, the range of physically achievable sensor transformations is more limited. In other words, V h and V s are not the same in many practical situations.
- the component ⁇ ⁇ is estimated in the subspace orthogonal to V h , based on both the obtainable solution ⁇ h and priori knowledge about the joint space of V s and V ⁇ .
- the priori knowledge is described in two aspects: the physical aspect and the statistical aspect. It can be exploited in signal estimate or reconstruction as well as in the design of sampling system H.
- the design of sensing system H includes the selection of representation basis functions ⁇ and the design of sampling functions.
- representation basis functions ⁇ In imaging, it is both desirable and feasible to select representational functions with spatially local support at multiple scales, such as a family of multi-scale wavelet functions.
- spectroscopy a spectral function is expected to be continuous and have one or more than one peak.
- Representational functions are selected so that both the base and peak features are captured well with as few as possible basis functions. Some representational functions, therefore, have global support.
- a non-compressive design is viewed as an extreme case where all measurements are used.
- certain transforms are used to enable measurements of the principle components of the source image in a representation and to enable source estimates by numerical decompression with high fidelity.
- FIG. 6 is an exemplary 8 ⁇ 8 transformation matrix 600 , Q, for a QCT, in accordance with an embodiment of the present invention.
- Transform matrix 600 has the following properties. Its elements are from the set (0, 1, ⁇ 1). The rows of matrix 600 are orthogonal. The row vectors are nearly even in Euclidean length, with the ratio between the largest and the smallest.
- the transformed block C ij exhibits the compressible property that its elements decay along the diagonals. The elements on the lower anti-diagonals are, therefore, truncated and the remaining elements are measured with fewer sensors. Denote by C ij the truncated block matrix. An estimate of the source block S ij is then obtained from Q ⁇ 1 C ijQ ⁇ (decompression). The same transform matrix is used for all blocks of image S.
- the above ideas are similar to the image compression with discrete cosine transforms, as used in the JPEG protocol.
- the specific matrix Q can be obtained by rounding the discrete cosine transform (DCT) of the second kind into the set (0, 1, ⁇ 1).
- DCT discrete cosine transform
- QCT quantized cosine transform
- FIG. 7 is a comparison 700 of exemplary simulated image reconstructions using permuted Hadamard transform (PHT), DCT, and QCT matrices using 4.69%, 15.63%, and 32.81% of the transformed components or available measurements, in accordance with an embodiment of the present invention.
- PHT permuted Hadamard transform
- DCT digital coherence tomography
- QCT quadrature transform
- Another embodiment of the present invention is a method for linear signal inference. More specifically, a first order approximation of ⁇ ⁇ from ⁇ h is estimated based on priori knowledge of the source space. Priori knowledge about deterministic features of a signal distribution is described, accurately or approximately, by linear operators mapping from ⁇ h to ⁇ . The following optimization problem for locating the deviation is based on the priori knowledge about the source function
- the matrix N can be obtained once for all from H such as via the QR factorization.
- the component f n is computed via a least-squares (LS) solution to (10) instead of using the closed-form expression of (11).
- Another embodiment of the present invention is a method of determining a linear inference with minimal gradient.
- the input is obtained.
- the input includes sampling matrix H, measurement vector g.
- a projection into the sampling space is calculated. This calculation includes solving for a solution f ⁇ to the underdetermined system of equations.
- a minimal gradient calculated. This calculation includes obtaining the matrix N and solving f n using the least-squares solution in (10).
- Statistical knowledge of a signal distribution is exploited in at least two ways. One is based on the Karhunen-Lo'eve transform, the other is based on conditional probabilities.
- the statistics are drawn from a sufficiently large data set.
- the data set is represented with a matrix X.
- the j-th column corresponds to the samples of the j-th random variable x j .
- S is the matrix obtained from X with the mean translated to zero and the variances normalized to 1.
- the discrete KL-transform also called the Hotelling transform, is determined as follows.
- the KL-transform is applied often for the so-called Principal Component Analysis (PCA) where the number of decorrelated variables with dominant variances (i.e., the principal components Y p ) is significantly smaller than the number of the original variables.
- PCA Principal Component Analysis
- Nonlinear signal inference consists of estimating f ⁇ by combining the measured value of f ⁇ with prior knowledge of the signal subspace V f .
- f ⁇ is completely indicative of f c
- f ⁇ est (f ⁇ est ) is the point in V ⁇ indicated as a component of f c .
- Bayesian inference is based on statistical characterization of V f . Distributions for components of f given measurement states are estimated from a library of known signals. These distributions are then used to determine likely signal states given measurements from unknown signals. Bayesian inference produces an estimate corresponding to the most likely value of f c given the measurement g. System design for Bayesian inference consists of choosing H such that the most likely signal corresponds to the actual signal for a given measurement. In practice, global maximization of the probability given a measurement state is less practical.
- Objective inference is based on plausibility measures of f est . Plausibility is expressed in one or more “objective functions,” ⁇ (f est ) Objective functions are measures of signal continuity, smoothness, or coherence. Objective inference selects f ⁇ est (f ⁇ est ) to maximize objective measures of f est .
- the challenge of objective inference is to discover a mapping H and an objective function such that f est is a good estimate of f c .
- Another embodiment of the present invention is a method using graphical inference.
- Graphical inference constructs objective functions from empirical samples drawn from V f .
- graphical inference is viewed as an integration of Bayesian and objective methods.
- Physical implementations of compressive sampling include but are not limited to spectroscopy, digital imaging and temporal signal analysis.
- FIG. 8 is a schematic diagram of an exemplary spectrometer 800 employing compressive sampling, in accordance with an embodiment of the present invention.
- Spectrometer 800 includes spectral source 810 , diffraction grating 820 , lens 830 , mirror 840 , mask 850 , complementary mirror 860 , complementary lens 870 , complementary diffraction grating 880 , and detector array 890 .
- Unknown spectral source 810 is imaged onto a slit at the input.
- Spectral source 810 is assumed to uniformly illuminate the slit. If spectral source 810 is a point source, a combination of cylindrical lenses can be used to expand spectral source 810 to fully illuminate the slit normal to the plane of FIG.
- spectral source 810 focused in the plane of the FIG. 8 .
- the input slit is imaged onto mask 850 through diffraction grating 820 or a hologram.
- the effect of diffraction grating 820 is to separate the image by color component.
- blue is imaged at the top of the mask, green in the middle, and red at the bottom.
- Mask 850 is divided into rows. Each element in a row is a filter component, modulating the color channel corresponding to the corresponding column. The modulation is by absorption, meaning that the filter weights are all positive. Negative or complex filter weights are obtained by linear weighting of the output filtered signals.
- each element on the detector array consists of a filtered projection of the input spectrum. Since the filter function corresponds exactly to the transmittance of the mask, any filtering operation is implemented by spectrometer 800 . Thus, it is possible to implement a compressive sampling scheme in spectrometer 800 .
- Another embodiment of the present invention is a method for compressive sampling using Haar-wavelet based spectral sampling.
- the target spectra consists of discrete projections
- s ⁇ [ n ] ⁇ S ⁇ ⁇ ( ⁇ ) , rect ⁇ ⁇ ( ⁇ - n ⁇ ⁇ ⁇ ⁇ ⁇ ⁇ ⁇ ) ⁇ ( 15 )
- the resolution of spectrometer 800 is ⁇ and there are N spectral channels. So the slits in mask 850 are designed to pass spectral signals of width ⁇ on to detector array 890 .
- the slits are of discrete width so that measurements on spectrometer 800 take the form
- ⁇ n′n assumes values 0 or 1. However, within each row (corresponding to the n′ th measurement) any sequence ⁇ n′n can be implemented.
- Hadamard S-Matrix codes of s[n′l] are implemented in each mask row. For example,
- Compressively sampled spectroscopy consists of making measurements of the form
- ⁇ a J [n] describes the signal averages at level J using a Haar-wavelet transform
- ⁇ d J [n] 1 ⁇ j ⁇ J describes the Haar details for levels 1 through J.
- the following measurements are made.
- 2 ⁇ J N values of sums of some permutations of details are measured, (i.e.,
- FIG. 9 is a plot of an exemplary spectral transmission mask 900 used to make measurements on Haar-wavelet averages and details, in accordance with an embodiment of the present invention.
- Mask 900 measures 256 spectral channels with just 80 measurements, implementing 31.25% compression.
- Mask 900 makes measurements using a “lifting” procedure.
- a Haar-wavelet transform is implemented with the following direct transform:
- a J + 1 ⁇ [ n ] A J ⁇ [ 2 ⁇ n - 1 ] + A J ⁇ [ n ] 2 ( 19 )
- D J + 1 ⁇ [ n ] A J ⁇ [ 2 ⁇ n - 1 ] - A J ⁇ [ n ] 2 ( 20 )
- a j and D j are the average and detail coefficients at level j.
- the inverse transform is given by
- a J ⁇ [ 2 ⁇ n - 1 ] A J + 1 ⁇ [ n ] + D J + 1 ⁇ [ n ] 2 ( 21 )
- a J ⁇ [ 2 ⁇ n ] A J + 1 ⁇ [ n ] - D J + 1 ⁇ [ n ] 2 ( 22 )
- Mask 900 measures all 32 average coefficients at level 3.
- the Haar average coefficients are the sum of spectral channels of appropriate length and scaled to an appropriate factor depending on the level. These averages at level 3 are used to find the averages and details at level 4 using the direct transform defined in Eq. (19).
- measurements of sums of combinations of details for levels 1 through 3 are made. Specifically, sums of 2 level 3 details, sums of 4 level 2 details and sums of 8 level 1 details are measured. Since averages can be easily measured with mask 900 , sums of the averages at each level are measure and the sums of details are then estimated with the prior knowledge of all the parent details and parent averages.
- m j ⁇ [ n ] ⁇ j ⁇ ⁇ k ⁇ ⁇ A j ⁇ [ k ] ( 23 ) where k includes all the averages selected by the mask for the measurement at n.
- k includes all the averages selected by the mask for the measurement at n.
- the averages at level j are related to the averages and details at Level j+1 as given in Eq. 21. Therefore,
- k′ represents the parent averages and details corresponding to index k.
- Eq. 26 The sum of the details in Eq. 26 is then assigned to each of the individual detail coefficient based on a weighting scheme. Specifically, a proportional weighting scheme is used in all the reconstructions.
- FIG. 10 is a flowchart showing an exemplary method 1000 for reconstructing Haar-wavelet averages and details for mask 900 shown in FIG. 9 , in accordance with an embodiment of the present invention.
- Method 1000 can be used for any mask.
- FIG. 11 is a plot of an exemplary comparison 1100 of original neon spectral data and reconstructed neon spectral data using the exemplary method 1000 shown in FIG. 10 , in accordance with an embodiment of the present invention.
- FIG. 12 is a plot of an exemplary comparison 1200 of original neon wavelet coefficient data and reconstructed neon coefficient data using the exemplary method 1000 shown in FIG. 10 , in accordance with an embodiment of the present invention.
- Another embodiment of the present invention is a multiplex optical sensor that efficiently determines the wavelength of a quasi-monochromatic source.
- the measurement efficient optical wavemeter is a special case of a general spectrometer based on compressive sampling in that the source is assumed to have only one spectral channel.
- the goal of the wavemeter is to estimate ⁇ and ⁇ o from the measurements m[n].
- the number of possible outcomes from the estimation process is D ⁇ N ⁇ , where D ⁇ is the dynamic range estimated in ⁇ , and N ⁇ is the number of possible values of ⁇ o .
- the number of possible outcomes from the measurement process is D m M m , where D m is the measurement of dynamic range, and N m is the number of measurements. If the sensor system is designed to achieve a one-to-one mapping between measurement outcomes and sensor outcomes, the number of measurements required is
- h n ( ⁇ ) is independently specified within each wavelength channel to a dynamic range of D h .
- Possible values for h n ( ⁇ ) range from 0 to h n max .
- Eq. (29) produces D h N m different measurement states.
- N m ⁇ 1 additional measurements characterize ⁇ o if D h N m ⁇ 1 ⁇ N ⁇ , or N m ⁇ 1+log D h N ⁇ (32)
- Another embodiment of the present invention is a method for achieving the limit specified in Eq. (32).
- the method assumes that the N ⁇ possible outcomes for estimation of ⁇ o are ordered and assigned indices n( ⁇ ) such that 1 ⁇ n( ⁇ ) ⁇ N ⁇ . This ordering is such that n( ⁇ ) is monotonic in ⁇ min , but such proportionality is not necessary and physical design constraints may make some other ordering attractive.
- Let d(n, l, b) be the l th digit of n in the base b.
- a filter array such that
- m[n]/( ⁇ h n max ) is the n th digit in the base D h representation of n( ⁇ 0 ).
- h n ( ⁇ ) is programmed using transmission masks in a grating-based Fourier filter system.
- the transmittance of such masks is normally determined in a multiple step coating process.
- Eq. (32) suggests that a 1024 channel source can be characterized using just 3 measurements.
- just one deposition step a 1024 channel source is characterized in 11 measurements.
- a key step in the compressive wavemeter is the imprinting of a spatial-spectral intensity code on the source.
- FIG. 13 is a schematic diagram showing an exemplary optical wavemeter 1300 , in accordance with an embodiment of the present invention.
- Wavemeter 1002 includes source 1305 , slit 1310 , lens 1315 , diffraction grating 1320 , lens 1325 , intensity encoding mask 1330 , lens 1335 , diffraction grating 1340 , lens 1345 , and linear detector array 1350 .
- Wavemeter 1300 utilizes a one-dimensional spatial-spectral intensity code. In other words, 1-D positional variation in intensity is produced that is a function of wavelength.
- diffraction grating 1320 converts the spectral density of source 1305 into a spatially-varying intensity profile. Because source 1305 is monochromatic and grating 1320 is located in the center of a 4-f imaging system, this produces an image of the input slit in the image plane at a horizontal position that is wavelength dependent.
- mask 1330 with a 2-D pattern of transmission variations is placed in the image plane.
- the image of slit 1310 interacts with a narrow horizontal region of mask 1330 and is intensity-modulated by the vertical transmission pattern of mask 1330 at that horizontal location. Because the horizontal image location is wavelength dependent, a horizontal variation in the mask transmission produces different vertical intensity patterns for different spectral channels.
- diffraction grating 1340 and imaging setup undo the correlation between spectral channel and horizontal position, producing a stationary image of slit 1310 regardless of wavelength.
- the vertical variation of intensity that was imprinted by mask 1330 remains.
- linear detector array 1350 By arranging linear detector array 1350 along the vertical direction of the slit image, this intensity variation can be measured.
- the spectral channel of source 1305 is uniquely determined.
- linear detector array 1350 is a two-dimensional array or a single element detector. In another embodiment of the present invention, the linear detector array 1350 is a base-N encoded mask and measures N levels of intensity. In another embodiment of the present invention, mask 1330 is a single element photodiode and is dynamically variable.
- Another embodiment of the present invention is a method of creating transmission mask 1330 .
- mask 1330 has a vertical layer for each measurement (and hence, sensor) required by the encoding. Each layer subdivides each region of the layer above into m sub-regions, each with one of m levels of transmission.
- FIG. 14 is a plot of an exemplary mask 1400 for a 256-channel wavemeter with binary sensors, in accordance with an embodiment of the present invention.
- FIG. 15 is a plot of an exemplary mask 1500 for a 256-channel wavemeter with 4-level sensors, in accordance with an embodiment of the present invention. Again, white regions are completely transmissive and black regions are completely opaque.
- the top line of mask 1400 provides information about the signal power, and also provides a reference level for the remaining rows.
- Wavemeter 1300 is an exemplary method of building wavemeter 1300 shown in FIG. 13 for use with mask 1400 of FIG. 14 and mask 1500 of FIG. 15 .
- Wavemeter 1300 has a resolution substantially equivalent to one nanometer.
- Mask 1400 and mask 1500 are designed to resolve 256 wavelengths with either four or eight measurements.
- the resolution and the wavelength range of wavemeter 1300 is determined by the smallest feature size that can be implemented in either mask and also by the focal length ‘f’ of the lenses and the grating period ‘ ⁇ ’.
- the primary grating equation for diffraction order m is
- a 4-f imaging system uses 50 mm focal length lenses.
- An Agilent Tunable laser source 81618A is used as the input test source 1305 .
- Laser source 1305 has an operating wavelength range of 1466-1586 nm. The range is further restricted to 1470-1570 nm (i.e., 100 channels with a 1 nm even though the masks can resolve up to 256 channels).
- An Indigo Systems AlphaNIR camera for example, is used as detector array 1350 .
- the NIR camera is used as only an 8-element linear detector measuring only the intensity on each detector.
- Another embodiment of the present invention is wavemeter 1300 of FIG. 13 including binary mask 1400 of FIG. 14 .
- An Agilent tunable laser source for example, is used as the test source 1305 .
- the output from the laser source is tuned to each of the 100 wavelengths in the 1471-1570 nm range.
- the fiber coupled output from the source 1305 is collimated and a vertical slit of size 25 ⁇ m is placed after the collimator.
- Slit 1310 is imaged on to the mask patterns of mask 1300 using a 4-f imaging system and through a diffraction grating, for example. Due to grating 1320 , the slit that is imaged onto mask 1400 falls at different locations and hence gets spectrally coded differently based on the input wavelength. These patterns uniquely determine the wavelength of input source 1305 .
- FIG. 16 is a depiction of an exemplary sample image 1600 taken using exemplary optical wavemeter 1300 of FIG. 13 and the exemplary mask 1400 of FIG. 14 , in accordance with an embodiment of the present invention.
- the output plane of wavemeter 1300 is imaged rather than letting it strike linear detector array 1350 .
- the clear representation of the bit-pattern “10001100” is seen image 1600 .
- the analysis of the data is done by simulating the presence of a linear array in the detection plane. That is, for each simulated photodetector, a pixel region is designated in the image. Further, these regions are of identical size and shape, and are regularly spaced along a line.
- FIG. 17 is a plot of exemplary expected bit patterns 1700 for each of 100 wavelengths using exemplary optical wavemeter 1300 of FIG. 13 and exemplary mask 1400 of FIG. 14 , in accordance with an embodiment of the present invention.
- the 100 nm (1471-1570 nm) scan range is due to the limited tunability of source 1305 .
- FIG. 18 is a plot of exemplary measured bit patterns 1800 for each of 100 wavelengths using the exemplary optical wavemeter 1300 of FIG. 13 and the exemplary mask 1400 of FIG. 14 , in accordance with an embodiment of the present invention.
- the 100 wavelength channels are scanned and the bit patterns obtained on each of the 8 detector element regions on the NIR camera are measured. 82 unique patterns are observed from the measurements.
- FIG. 19 is a plot of exemplary measured errors 1900 in bit patterns for each of 100 wavelengths using exemplary optical wavemeter 1300 of FIG. 13 and exemplary mask 1400 of FIG. 14 , in accordance with an embodiment of the present invention.
- Measured errors 1900 are the absolute values of the error patterns. Errors are chiefly observed in the 7th and 8th bits because of the small feature sizes involved in mask 1400 . Also, some errors are caused by the well-known curvature of a slit imaged through a grating. This slight curvature is seen in image 1600 of FIG. 16 too. As a result, the light (especially in the high resolution areas of the mask) is masked as if it is in a neighboring spectral channel. These errors can be corrected in modifying mask 1400 so that it has a slight arc to match the expected curvature of the slit image.
- Wavemeter 1300 of FIG. 13 including 4-level mask 1500 of FIG. 15 .
- Mask 1500 is also designed for 256 wavelength channels. Again a laser source 1305 restricts testing only 100 wavelength channels (the 1471-1570 nm range).
- FIG. 20 is a plot of exemplary quaternary digit patterns 2000 for each of 100 wavelengths using exemplary optical wavemeter 1300 of FIG. 13 and exemplary mask 1500 of FIG. 15 , in accordance with an embodiment of the present invention.
- Mask 1500 is a base-4 encoded mask. The values are indicated by the colorbar. The calibration row is suppressed in FIG. 20 .
- FIG. 21 is a plot of exemplary measured quaternary digit patterns 2100 for each of 100 wavelengths using exemplary optical wavemeter 1300 of FIG. 13 and exemplary mask 1500 of FIG. 15 , in accordance with an embodiment of the present invention.
- the measured intensity at each sensor is assigned to either 3, 2, 1 or 0 based on a threshold relative to the total power as determined by an additional 5th sensor.
- the values are indicated by the colorbar.
- the calibration row is suppressed in FIG. 20 .
- FIG. 22 is a plot of exemplary measured errors 2200 in quaternary digit patterns for each of 100 wavelengths using exemplary optical wavemeter 1300 of FIG. 13 and exemplary mask 1500 of FIG. 15 , in accordance with an embodiment of the present invention.
- Measured errors 2200 are the absolute values of the error patterns. Again measured errors 2200 are due to the curvature, which could be corrected by compensating for it in the encoding mask.
- a temporal signal includes but is not limited to a communications signal, radio wave, or video image pixel.
- h n (t) is, for example, implemented electrically. Since an electrical circuit can be designed to multiply the input signal by any function h n (t), arbitrary compressive sampling is implemented for temporal signals using an electrical circuit.
- FIG. 23 is a flowchart showing an exemplary method 2300 for temporally compressively sampling a signal, in accordance with an embodiment of the present invention.
- a plurality of analog to digital converters is assembled to sample the signal.
- Each analog to digital converter of the plurality of analog to digital converters is configured to sample the signal at a time step determined by a temporal sampling function.
- step 2320 the signal is sampled over a period of time using the plurality of analog to digital converters.
- Each analog to digital converter of the plurality of analog to digital converters produces a measurement resulting in a number of measurements for the period of time.
- step 2330 the number of estimated signal values is calculated from the number of measurements and the temporal sampling function.
- the temporal sampling function is selected so that the number of measurements is less than the number of estimated signal values.
- the challenge in an imaging system is to obtain non-local response in h n x ,n y (x,y).
- Method for programming h n x ,n y (x,y) include but are not limited to setting the shape and interconnectivity of electronic pixels on a focal plane and/or by masking pixels, replicating the input image multiple times ⁇ (x,y) over redundant apertures and by sampling these resulting images with different focal plane and/or mask structures, and using optical fan-out through birefringent structures, micro-optical-mechanical devices or diffraction gratings.
- Another embodiment of the present invention is a parallel bank of imaging systems that is used to synthesize a single global image.
- the primary motivating factor for this embodiment is a reduction in the form factor of the imaging system.
- a system consisting of N sub-apertures rather than a single coherent aperture is approximately N times thinner than a single lens system.
- compressive sampling it is possible to also reduce the transverse area of such systems in comparison to non-encoded imagers.
- focal plane coding and compressive sampling enable superior data acquisition and handling in imaging systems.
- Physical layer data compression reduces the data transfer requirements off of the focal plane without reducing image resolution. This may be applied in achieving imaging systems with diffraction limited image resolution without electronic sampling at the diffraction limit.
- Focal plane coding and compressive sampling imaging also enables superior color management, including multispectral and hyperspectral imaging at reasonable data rates.
- Focal plane coding and compressive sampling can also be used in developing polarization cameras.
- Focal plane coding and compressive sampling imaging strategies can also be applied in temporal focal plane sampling to improve data rates and light sensitivity in video imaging systems.
- the focal plane is the interface between the optical field and digitized image data.
- the theory of analog-digital conversion across such interfaces began half a century ago with the Whitakker-Shannon sampling theorem. From the perspective of optical imaging, Whittaker-Shannon indicates that image resolution is proportional to the focal plane sampling rate.
- Whittaker-Shannon indicates that image resolution is proportional to the focal plane sampling rate.
- generalized sampling theory showed that it was possible to reconstruct band-limited signals by sub-Nyquist sampling of parallel multi-channel linear transformations. Many investigators have applied sampling theory to digital image super-resolution.
- Focal plane coding and compressive sampling imaging is based on two improvements to digital super-resolution techniques.
- the first improvement is sampling function optimization. While the importance of the sampling functions to reconstruction fidelity has been clear from the origins of generalized sampling, only translation, rotation, and scale have been realized for image super-resolution.
- Another embodiment of the present invention is a method of using multiplex focal plane encoding to optimize linear transformations for image reconstruction.
- Focal plane coding is chosen over aperture or wavefront coding, because previous experience with multiplex imaging systems has shown that for conventional imaging tasks the highest entropy measurement states are obtained from compact impulse response transformations of the focal plane.
- An emphasis on adaptation of imaging system design to the statistics of specific imaging tasks is outlined in the second improvement.
- the second improvement is compressive sampling.
- Fourier-space sampling theorems assume that information is uniformly distributed across the image signal space.
- the success of image compression algorithms over the past decade has emphatically demonstrated that this assumption is incorrect.
- Recognition that image data is spatially and, in the case of video, temporally correlated on multiple scales enables dramatic compression, particularly with the development of multiscale fractal and wavelet compression bases.
- focal plane coding enables direct integration of compressive coding in the image acquisition layer, thereby enabling dramatic improvements in the data and computational efficiency of digital super-resolution.
- Another embodiment of the present invention is an optical sensor employing compressive sampling that tracks a source over N pixels using only log(N) electronic samples.
- p(x,y) is the pixel sampling distribution on the focal plane
- A is the pixel spacing
- h(x,y) is the imaging system point spread function.
- Another embodiment of the present invention is a method for measuring multiple demagnified copies of ⁇ (x,y) and integrating computationally these copies into the original full resolution image.
- Multiple image copies are gathered by measuring the same object over multiple imaging systems, typically using a lenslet array.
- the final integrated signal is referred to as “the image” and the copies gathered during the measurement process are referred to as “subimages.”
- a conventional imaging system has an aperture for collecting the field. In this embodiment the aperture is segmented into multiple “subapertures” for each subimaging system.
- k refers to the subimage gathered over the k th subaperture.
- p abk (x,y) is the measurement sampling function for the ab th pixel in the k th subimage.
- h k (x,x′,y,y′) is the point spread function mapping from the density at (x′,y′) in the image to the optical intensity at (x,y) on the focal plane in the k th subimage.
- this embodiment allows for the possibility that the pixel sampling function and the point spread functions are shift variant. Shift variance is important in creating non-redundant codes between subimages.
- Non-redundant coding between sub-images is, for example, achieved by the following mechanisms.
- One mechanism involves employing image shifts. Simple shifts in the optical image relative to the focal plane from one subaperture to the next make the system weakly non-redundant. This approach is used in TOMBO imaging and similar systems.
- the TOMBO system demonstrates nondegenerate coding of multiple subimages but does not demonstrate compressive sampling of signal inference. Variations in the registration of the pixel sampling function relative to the subimage from subaperture to subaperture is the core of this mechanism.
- Birefringent shift filters allow controlled and self-registering image shifts and also allow multiplexed image acquisition and reconstruction. Modulation of the point spread function from subimage to subimage is at the core of this mechanism.
- sampling masks are placed in the focal plane to vary p(x,y) from one sub-image to the next. Variations in the spatial structure of the pixel sampling function from subimage to subimage is at the core of this mechanism.
- Microlenslet and microprism arrays are be used to remap the optical focal plane from subimage to subimage. This mechanism modulates the point spread function in a shift-variant manner.
- Spectral filters such as gratings and Fabry-Perot and Fizeau Filters can remap the spatio-spectral pattern of the image from one sub-aperture to the next. This mechanism modulates the structure of the point spread function, typically in a chromatically varying fashion.
- Another mechanism involves the physical structure of the focal plane and focal plane read dynamics.
- the physical structure of the focal plane and focal plane read dynamics may vary from one subimage and from one pixel to the next. This mechanism is similar to foveation. This mechanism modulates the structure of the pixel sampling function more profoundly than can be done using simple pixel masks.
- Micro-optical mechanical devices such as deformable mirror arrays, digital light projectors, and similar dynamic elements are used to encode the optical impulse response for compressive sampling.
- Liquid crystal or electro-optic spatial light modulators might are similarly applied to effectively combine the functions of coding masks and micro-optical elements.
- Dynamic spatial light modulators are used to adapt sensor encodings to improve compressive sampling.
- Another embodiment of the present invention is a focal plane coding and compressive sampling imaging system that measures linear transformations of an image ⁇ (x,y) such that the full image is digitally reconstructed.
- This embodiment uses optical and electro-optical prefilters to encode the linear transformations to enable and improve the fidelity of image reconstruction.
- the imaging system is regarded as a filter bank and/or sampling system array.
- Pixel shift coding consists of measurement under different pixel shifts from one subaperture to the next.
- Pixel shift coding has been previously considered by many. Some, in particular, have considered the use of pixel shift coding using multiple subimage arrays. Registration of the subimages relative to the global image coordinates has been a primary challenge for these methods. Others have focused on interpolation of full images based on self-registration using correlations between captured images.
- the total pixel shift from subimage to subimage is also due to shifts in the registration of the optical axis of each subaperture relative to the axis of the object.
- the differential shift due to the subaperture-object shift is
- the object range dependent differential shift makes it difficult to implement uniform coding using pixel shifts and requires the self-registration techniques used by several authors.
- the value of the differential pixel shifts critically determines the conditioning of the subimages for full image estimation. Uniformly spaced shifts spanning the range of the pixel sampling period are particularly attractive.
- the simplest approach to understanding image estimation for shifted pixel imagers relies on expansion of p(x,y) on a finite basis. In typical systems, p(x,y) is a uniform rectangular function with finite fill factor. Assuming 100% fill factor it can be assumed that
- ⁇ n ⁇ ( x ) ⁇ o ⁇ ( x - n ⁇ ⁇ ⁇ ⁇ ) ( 45 ) spans the range of the pixel sampling functions specifically
- f c is estimated by direct algebraic inversion or other methods.
- ⁇ / ⁇ is not generally an integer, in which case there is no convenient finite basis for representation of f c . In this case, interpolation methods are required.
- Another embodiment of the present invention is a method for birefringent shift coding.
- Birefringent coding elements having previously been used to produce coded optical fan-out.
- Each layer of a birefringent filter produces two orthogonally polarized copies of the incident field. It is assumed that the image field is unpolarized, although coding to estimate polarization image is also possible.
- the transformation with shift coding induced by a birefringent filter is
- g ab k ⁇ ⁇ ⁇ ⁇ p ⁇ ⁇ ( x - a ⁇ ⁇ ⁇ , y - b ⁇ ⁇ ⁇ ) ⁇ ⁇ h ⁇ ⁇ ( x - x ′ , y - y ′ ) ⁇ ⁇ n ⁇ ⁇ f ⁇ ⁇ ( M ⁇ ⁇ x ′ - ⁇ ⁇ ⁇ x nk , M ⁇ ⁇ y ⁇ ′ - ⁇ ⁇ ⁇ y nk ) ⁇ d x ⁇ d y ⁇ d ′ ⁇ d y ′ ( 49 )
- the discrete Fourier transform (DFT) of the measured data is:
- N sub 4 ⁇ ( ⁇ ⁇ ⁇ N . A . ⁇ ) 2 independent samples of F(u,v) are multiplexed in each Fourier sample. Ideally, N sub copies of the image are sampled with different birefringent shifts to invert and reconstruct.
- F ⁇ ( n M ⁇ ⁇ ⁇ - ⁇ M ⁇ ⁇ ⁇ ⁇ N 8 , m M ⁇ ⁇ ⁇ - ⁇ M ⁇ ⁇ ⁇ ⁇ N 8 ) is a DCT of Fourier coefficients over the range of n and m. Ideally inversion of this DCT requires
- birefringent coding offers several improvements over pixel shift coding.
- birefringent shifts are coded by setting the thickness and orientation of a birefringent plate. Birefringent fan-out can be programmed at the tolerances required for this application. Exact coding of shifts has not been demonstrated to the same tolerance.
- birefringent shifts are self-registering.
- the challenge of shift coding is that the shift is object range dependent and alignment dependent.
- Subimage shifts in a birefringently coded system cause a global phase shift on the subimage Fourier transform.
- the image can be recovered from the magnitude of its Fourier transform.
- one algorithm can eliminate shift variance by considering
- the image is coded against its own reference.
- Another embodiment of the present invention is a method for birefringent shift coding.
- the idea of coding with a mask is to select t(x,y) such that the linear transformation is well-conditioned for conventional or compressively sampled reconstruction.
- micro-optical elements such as lenslets, diffractive elements and prisms
- interferometers in the optical path including Fabry-Perot, Fizeau and Mach-Zender devices, can also code the impulse response.
- Another embodiment of the present invention is a method for optical prefilter encoding.
- the possibility that the point spread function is dispersive (wavelength dependent) is also included.
- Wavelength dispersion is both a challenge and an opportunity. In cases for which one is more interested in the achromatic image, wavelength dispersion can decrease signal to noise by binning light from similar spatial location in different detection channels. In cases where one is interested in multispectral or hyperspectral images, wavelength dispersion offers an opportunity to create a coded cross-spectral measurement system.
- Temporal variations and adaptation in the optical prefilter is another possibility with micro-optical signal encoding.
- a spatial light modulator such as a micromirror array, a liquid crystal or acoustic modulator
- h k (x,x′,y,y′, ⁇ ) ⁇ (mx′,my′, ⁇ ) is another possibility with micro-optical signal encoding.
- This can be used to implement time domain compressive sampling or to match the PSF to the image signal.
- a focal plane is an array of electronic detectors.
- the array has a grid of rectangular pixels. Rectangular pixels are particularly appropriate for, for example, charge coupled device based detectors (CCDs).
- CCDs charge coupled device based detectors
- Other electronic detectors include active pixel CMOS VLSI detector arrays. In infrared systems, CMOS or CCD systems are used for the backend or front-end detector array.
- CMOS detectors Using CMOS detectors, microbolometer, or other detector arrays it is possible to shape both the spatial distribution of pixel sampling functions and the temporal read-out circuit for compressive sampling.
- temporal variations is included in the pixel sampling function. This constitutes temporal variation in the read-out rate and read-out filter from different pixels rather than temporal changes in the spatial structure.
- FIG. 24 is a flowchart showing an exemplary method 2400 for spatially focal plane coding an optical signal using an imaging system, in accordance with an embodiment of the present invention.
- the imaging system is created from a plurality of subimaging systems.
- Each subimaging system includes an array of electronic detectors.
- Each subimaging system is dispersed spatially with respect to a source of the optical signal according to a sampling function.
- step 2420 the optical signal is collected at each array of electronic detectors of the plurality of subimaging systems at a single time step.
- the optical signal is transformed into a subimage at each subimaging system.
- the subimage includes at least one measurement from the array of electronic detectors of the subimaging system.
- an image of the optical signal is calculated from the sampling function and each subimage, spatial location, pixel sampling function, and point spread function of each subimaging system of the plurality of subimaging systems.
- the sampling function is selected so that the number of measurements for the plurality of subimages is less than the number of estimated optical signal values that make up the image.
- FIG. 25 is a flowchart showing an exemplary method 2500 for temporally focal plane coding an optical signal using an imaging system, in accordance with an embodiment of the present invention.
- the imaging system is created from a plurality of subimaging systems.
- Each subimaging system includes an array of electronic detectors.
- step 2520 the optical signal is collected at each array of electronic detectors of the plurality of subimaging systems at a different time step according to a temporal sampling function.
- the optical signal is transformed into a subimage at each subimaging system of the plurality of subimaging systems.
- the subimage included at least one measurement from an array of electronic detectors of each subimaging system.
- an image of the optical signal is calculated from the temporal sampling function and each subimage, time step, pixel sampling function, and point spread function of each subimaging system of the plurality of subimaging systems.
- the temporal sampling function is selected so that the number of measurements for the plurality of subimages is less than the number of estimated optical signal values comprising the image.
- FIG. 26 is a flowchart showing an exemplary method 2600 for spatially and temporally focal plane coding an optical signal using an imaging system, in accordance with an embodiment of the present invention.
- the imaging system is created from a plurality of subimaging systems.
- Each subimaging system includes an array of electronic detectors.
- Each subimaging system is dispersed spatially with respect to a source of the optical signal according to a spatial sampling function.
- step 2620 the optical signal is collected at each array of electronic detectors of the plurality of subimaging systems at a different time step according to a temporal sampling function.
- the optical signal is transformed into a subimage at each subimaging system of the plurality of subimaging systems.
- the subimage includes at least one measurement from an array of electronic detectors of the each subimaging system.
- an image of the optical signal is calculated from the spatial sampling function, the temporal sampling function and each subimage, spatial location, time step, pixel sampling function, and point spread function of each subimaging system of the plurality of subimaging systems.
- the spatial sampling function and the temporal sampling function are selected so that the number of measurements for the plurality of subimages is less than the number of estimated optical signal values that make up the image.
- micro-electro-optical mechanical devices or other dynamic spatial light modulators are used to adapt sampling filters and codes.
- instructions configured to be executed by a processor to perform a method are stored on a computer-readable medium.
- the computer-readable medium can be a device that stores digital information.
- a computer-readable medium includes a compact disc read-only memory (CD-ROM) as is known in the art for storing software.
- CD-ROM compact disc read-only memory
- the computer-readable medium is accessed by a processor suitable for executing instructions configured to be executed.
- instructions configured to be executed and “instructions to be executed” are meant to encompass any instructions that are ready to be executed in their present form (e.g., machine code) by a processor, or require further manipulation (e.g., compilation, decryption, or provided with an access code, etc.) to be ready to be executed by a processor.
- Systems and methods in accordance with an embodiment of the present invention disclosed herein can advantageously reduce sensor cost, reduce sensor data load, reduce processing load, increase spatial sampling capacity and improve spatial abstraction.
- detector cost is a significant component of overall system cost. Compressive sampling enables lower system cost by reducing the detector count necessary for a given range and resolution specification.
- Hyperspectral imagers for example, require simultaneous sampling of myriad spatial and spectral channels. Efficient packing of sampling points requires mechanical scanning or large system apertures. Compressive sampling enables spatial and spectral sampling to be folded into smaller system volumes and shorter scanning times.
- Sensor systems are based on naive isomorphisms between object and measurement spaces.
- the discrete abstractions of compressive sampling enable generalized models for the object space, including multidimensional object spaces and differences between the dimensionality of the measurement and object space.
- FIG. 27 is a flowchart showing an exemplary method 2700 for compressively sampling an optical signal using multiplex sampling, in accordance with an embodiment of the present invention.
- step 2710 of method 2700 group measurement of multiple optical signal components on single detectors is performed such that less than one measurement per signal component is taken.
- step 2720 probabilistic inference is used to produce a decompressed optical signal from the group measurement on a digital computer.
- FIG. 28 is a flowchart showing an exemplary method 2800 for compressively sampling an optical signal using a reflective mask, in accordance with an embodiment of the present invention.
- a reflective mask with a plurality of reflective elements and a plurality of non-reflective elements is created.
- the location of the plurality of reflective elements and the plurality of non-reflective elements is determined by a reflection function.
- the reflective mask includes but is not limited to a reflection mask or a coded aperture.
- step 2820 the spectrum of the optical signal is dispersed across the reflective mask.
- step 2830 signals reflected by the plurality of reflective elements are detected in a single time step at each sensor of a plurality of sensors dispersed spatially with respect to the reflective mask. Each sensor of the plurality of sensors produces a measurement resulting in a number of measurements for the single time step.
- a number of estimated optical signal values is calculated from the number of measurements and the reflection function.
- the reflection function is selected so that the number of measurements is less than the number of estimated optical signal values.
- the number of estimated optical signal values is calculated by multiplying the number of measurements by a pseudo-inverse of the reflection function. In another embodiment of the present invention, the number of estimated optical signal values is calculated by a linear constrained optimization procedure. In another embodiment of the present invention, the number of estimated optical signal values is calculated by a non-linear constrained optimization procedure.
- the reflective mask is adaptively or dynamically variable. In another embodiment of the present invention, the adaptively or dynamically variable reflective mask is based on electro-optic effects, liquid crystals, or micro mechanical devices. In another embodiment of the present invention, the reflective mask implements positive and respective negative elements of an encoding.
- FIG. 29 is a flowchart showing an exemplary method 2900 for compressively sampling an optical signal using an optical component to encode multiplex measurements, in accordance with an embodiment of the present invention.
- a mapping is created from the optical signal to a detector array by spatial and/or spectral dispersion.
- step 2920 signals transmitted are detected by a plurality of transmissive elements of the optical component at each sensor of a plurality of sensors of the detector array dispersed spatially with respect to the optical component.
- Each sensor of the plurality of sensors produces a measurement resulting in a number of measurements.
- a number of estimated optical signal values is calculated from the number of measurements and a transmission function, wherein the transmission function is selected so that the number of measurements is less than the number of estimated optical signal values.
- the spectrometer includes a plurality of optical components and a digital computer.
- the plurality of optical components measure multiple linear projections of a spectral signal.
- the digital computer performs decompressive inference on the multiple linear projections to produce a decompressed signal.
- the specification may have presented the method and/or process of the present invention as a particular sequence of steps. However, to the extent that the method or process does not rely on the particular order of steps set forth herein, the method or process should not be limited to the particular sequence of steps described. As one of ordinary skill in the art would appreciate, other sequences of steps may be possible. Therefore, the particular order of the steps set forth in the specification should not be construed as limitations on the claims. In addition, the claims directed to the method and/or process of the present invention should not be limited to the performance of their steps in the order written, and one skilled in the art can readily appreciate that the sequences may be varied and still remain within the spirit and scope of the present invention.
Landscapes
- Engineering & Computer Science (AREA)
- Multimedia (AREA)
- Signal Processing (AREA)
- Physics & Mathematics (AREA)
- General Physics & Mathematics (AREA)
- Discrete Mathematics (AREA)
- Theoretical Computer Science (AREA)
- Investigating Or Analysing Materials By Optical Means (AREA)
Abstract
Description
where
where h is the vector of measurement response functions hn(x), which is also referred to as the physical sampling functions. In contrast with the sophisticated and complete basis of Shannon sampling, the rectangle averaging function is common in measurement sampling. A digital camera, for example, integrates the value of the optical intensity over a square pixel.
h=Hψ, (5)
with
h ij =∫h i(x)ψj(x)dx. (6)
g=Hf c +b (7)
where b represents noise.
g=Hf h +b (8)
Eqn. (8) is generally well-conditioned for estimation of fh. But estimation of f⊥ from g is impossible in general without further information.
g=Hf c +b (9)
Here the physical realization of this mapping in optical spectrometers and imagers is considered.
where ∇ is the backward finite difference, or the discrete gradient, the column of N span the null space of H, and ∥·∥2 is the Euclidean vector norm. In matrix form, the matrix for the backward finite difference, denoted by B∇, is a lower bidiagonal matrix with all the diagonal elements equal to 1 and all the supper-diagonal elements equal to −1. Via the normal equation corresponding to the minimization problem (10), the explicit linear dependence of fn on f* is as follows
f n =Ny=N(C T C)−1 C T B ∇ƒ* (11)
where C=B∇N. In practical computation, the matrix N can be obtained once for all from H such as via the QR factorization. The component fn is computed via a least-squares (LS) solution to (10) instead of using the closed-form expression of (11).
g=(HY p)f p. (12)
f est =f ∥ est +f ⊥ est(f ∥ est) (13)
As discussed earlier, nonlinear inference is attractive when there exists a one-to-one mapping between fc and f∥ even though Vf is not a linear projection of Vc. In this case, f∥ is completely indicative of fc and f⊥ est (f⊥ est) is the point in V⊥ indicated as a component of fc.
m[n]=
Multiplex spectroscopy under which hn corresponds to a Fourier component or a Hadamard/Walsh code is common. More generally, hn represents a filter function. Almost any real positive valued filter function can be implemented. Bipolar and complex filters are constructed from linear transformations of real positive filters.
The resolution of
where ƒaJ[n] describes the signal averages at level J using a Haar-wavelet transform, ƒdJ[n], 1≦j≦J describes the Haar details for
where ƒ(n,np) is a perturbation of signal positions n′>N).
where Aj and Dj are the average and detail coefficients at level j. The inverse transform is given by
where k includes all the averages selected by the mask for the measurement at n. From the definition of the Haar transform, the proportional factor αj at level j is given by
αj=√{square root over (2)}j (24)
The averages at level j are related to the averages and details at Level j+1 as given in Eq. 21. Therefore,
where k′ represents the parent averages and details corresponding to index k.
m[n]=∫h n(λ)S(λ)dλ, (27)
where n is the index of the discrete array of measurements. Measurements are taken at different points in time (e.g. serially) or at different points in space (in parallel), or in some spatial and temporal combination. Measurements taken at different points in time rely on one or just a few optical detectors, with changes in the optical system accounting for variation in hn(λ) from one measurement to the next. Measurements taken in parallel require an array of optical detectors.
S(λ)=αδ(λ−λo), (28)
where α is the amplitude of the signal at λ=λo. In this case, the measurements are:
m[n]=αh n(λo) (29)
m[2]=ακ(λ−λmin) (31)
N m≧1+logD
enables characterization of λo in Nλ/log Dh measurements. The method has been described in Eq. (31) for the case Dh=Nλ, yielding Nm=2. In the more general case, comparing of Eqs. (29) and (33) it can be seen that m[n]/(αhn max) is the nth digit in the base Dh representation of n(λ0).
where θi and θd are the incidence and diffraction angles respectively. For a given center wavelength of operation λc, this equation determines the operating diffraction angle at a particular incidence angle. The grating used has 600 lines per mm and the wavemeter is designed for a center wavelength of 1520 mm. With these values and for normal incidences, the diffraction angle is 65.8°.
and the linear dispersion of the grating on the mask is given by
Δx=ƒΔθd (36)
where f is the focal length of the lens in the 4-f imaging system. These dispersion equations determine the feature size of the masks used. A 4-f imaging system uses 50 mm focal length lenses.
m[n]=
m[n z ,n y]=
g ab =∫∫∫∫p(x−aΔ,y−bΔ)h(x−x′,y−y′)ƒ(x′,y′)dxdydx′dy′ (39)
where p(x,y) is the pixel sampling distribution on the focal plane, A is the pixel spacing and h(x,y) is the imaging system point spread function.
g ab k =∫∫∫∫p abk(x,y)h k(x,x′,y,y′)ƒ(mx′,my′)dxdydx′dy′ (40)
g ab k
where δ is a subimage to subimage differential shift. While it is assumed here that there is a constant differential shift, the differential pixel shift, in practice, can vary nonlinearly and image rotations can also be considered from one subimage to the next.
ε=mod(Δlens,Δ) (42)
where mod( ) is the modulus function.
where F is the focal length of the imaging lenslet and R is the object range.
where β0( ) is the order 0 B-spline. If Δ/δ is an integer, the family of functions
spans the range of the pixel sampling functions specifically
where it is assumed that Δ/δ is even. Defining a canonical representation for the discrete image fc as
ƒc(n,m)=∫∫∫∫φn(x) φm(y)h(x−x′,y−y′)ƒ(Mx′,My′)dxdydx′dy′ (47)
Eqn. (41) is expressed in discrete form as
g=Tf c (48)
where T consists of N2 ap submatricies, one for each subimage. Each row of T contains (Δ/δ)2 ones and all other components are zero. Although T is not particularly well conditioned, fc is estimated by direct algebraic inversion or other methods.
This means that approximately
independent samples of F(u,v) are multiplexed in each Fourier sample. Ideally, Nsub copies of the image are sampled with different birefringent shifts to invert and reconstruct.
The set of measurements over the subapertures of
is a DCT of Fourier coefficients over the range of n and m. Ideally inversion of this DCT requires
where (n′,m′) is the subaperture index.
g ij =∫∫t(x,y)p(x−iΔ,y−jΔ)h(x−x′,y−y′)ƒ(mx′,my′)dxdydx′dy′ (55)
The idea of coding with a mask is to select t(x,y) such that the linear transformation is well-conditioned for conventional or compressively sampled reconstruction.
6.3.3 Microoptic, Diffractive, and Interferometric Coding
g ij k =∫∫p(x−iΔ,y−jΔ)h k(x,x′,y,y′,λ)ƒ(mx′,my′,λ)dxdydx′dy′dλ (56)
with the basic point being that the point spread function is not shift invariant and that it is non-redundantly coded in each subaperture. The possibility that the point spread function is dispersive (wavelength dependent) is also included.
g ij k(t)=∫∫p k(x−iΔ,y−jΔ,t)h(x−x′,y−y′)ƒ(mx′,my′)dxdydx′dy′ (57)
The possibility of temporal variations is included in the pixel sampling function. This constitutes temporal variation in the read-out rate and read-out filter from different pixels rather than temporal changes in the spatial structure.
Claims (11)
Priority Applications (7)
| Application Number | Priority Date | Filing Date | Title |
|---|---|---|---|
| US11/183,838 US7283231B2 (en) | 2004-07-20 | 2005-07-19 | Compressive sampling and signal inference |
| US11/831,730 US7463174B2 (en) | 2004-07-20 | 2007-07-31 | Compressive sampling and signal inference |
| US11/831,840 US7432843B2 (en) | 2004-07-20 | 2007-07-31 | Compressive sampling and signal inference |
| US11/831,832 US7616306B2 (en) | 2004-07-20 | 2007-07-31 | Compressive sampling and signal inference |
| US11/831,847 US7427932B2 (en) | 2004-07-20 | 2007-07-31 | Compressive sampling and signal inference |
| US11/831,855 US7463179B2 (en) | 2004-07-20 | 2007-07-31 | Compressive sampling and signal inference |
| US11/834,453 US7532772B2 (en) | 2004-07-20 | 2007-08-06 | Coding for compressive imaging |
Applications Claiming Priority (4)
| Application Number | Priority Date | Filing Date | Title |
|---|---|---|---|
| US58953004P | 2004-07-20 | 2004-07-20 | |
| US58947504P | 2004-07-20 | 2004-07-20 | |
| US62218104P | 2004-10-26 | 2004-10-26 | |
| US11/183,838 US7283231B2 (en) | 2004-07-20 | 2005-07-19 | Compressive sampling and signal inference |
Related Child Applications (6)
| Application Number | Title | Priority Date | Filing Date |
|---|---|---|---|
| US11/831,832 Division US7616306B2 (en) | 2004-07-20 | 2007-07-31 | Compressive sampling and signal inference |
| US11/831,855 Division US7463179B2 (en) | 2004-07-20 | 2007-07-31 | Compressive sampling and signal inference |
| US11/831,847 Division US7427932B2 (en) | 2004-07-20 | 2007-07-31 | Compressive sampling and signal inference |
| US11/831,730 Continuation US7463174B2 (en) | 2004-07-20 | 2007-07-31 | Compressive sampling and signal inference |
| US11/831,840 Division US7432843B2 (en) | 2004-07-20 | 2007-07-31 | Compressive sampling and signal inference |
| US11/834,453 Continuation-In-Part US7532772B2 (en) | 2004-07-20 | 2007-08-06 | Coding for compressive imaging |
Publications (2)
| Publication Number | Publication Date |
|---|---|
| US20060038705A1 US20060038705A1 (en) | 2006-02-23 |
| US7283231B2 true US7283231B2 (en) | 2007-10-16 |
Family
ID=35909125
Family Applications (6)
| Application Number | Title | Priority Date | Filing Date |
|---|---|---|---|
| US11/183,838 Active 2026-01-31 US7283231B2 (en) | 2004-07-20 | 2005-07-19 | Compressive sampling and signal inference |
| US11/831,840 Expired - Fee Related US7432843B2 (en) | 2004-07-20 | 2007-07-31 | Compressive sampling and signal inference |
| US11/831,855 Expired - Fee Related US7463179B2 (en) | 2004-07-20 | 2007-07-31 | Compressive sampling and signal inference |
| US11/831,730 Expired - Fee Related US7463174B2 (en) | 2004-07-20 | 2007-07-31 | Compressive sampling and signal inference |
| US11/831,847 Expired - Fee Related US7427932B2 (en) | 2004-07-20 | 2007-07-31 | Compressive sampling and signal inference |
| US11/831,832 Active 2026-04-27 US7616306B2 (en) | 2004-07-20 | 2007-07-31 | Compressive sampling and signal inference |
Family Applications After (5)
| Application Number | Title | Priority Date | Filing Date |
|---|---|---|---|
| US11/831,840 Expired - Fee Related US7432843B2 (en) | 2004-07-20 | 2007-07-31 | Compressive sampling and signal inference |
| US11/831,855 Expired - Fee Related US7463179B2 (en) | 2004-07-20 | 2007-07-31 | Compressive sampling and signal inference |
| US11/831,730 Expired - Fee Related US7463174B2 (en) | 2004-07-20 | 2007-07-31 | Compressive sampling and signal inference |
| US11/831,847 Expired - Fee Related US7427932B2 (en) | 2004-07-20 | 2007-07-31 | Compressive sampling and signal inference |
| US11/831,832 Active 2026-04-27 US7616306B2 (en) | 2004-07-20 | 2007-07-31 | Compressive sampling and signal inference |
Country Status (1)
| Country | Link |
|---|---|
| US (6) | US7283231B2 (en) |
Cited By (24)
| Publication number | Priority date | Publication date | Assignee | Title |
|---|---|---|---|---|
| US20080074291A1 (en) * | 2004-07-20 | 2008-03-27 | Brady David J | Compressive sampling and signal inference |
| US20090196513A1 (en) * | 2008-02-05 | 2009-08-06 | Futurewei Technologies, Inc. | Compressive Sampling for Multimedia Coding |
| US20100076693A1 (en) * | 2008-09-22 | 2010-03-25 | University Of Ottawa | Method to extract target signals of a known type from raw data containing an unknown number of target signals, intereference, and noise |
| US20100309467A1 (en) * | 2009-06-05 | 2010-12-09 | Spectral Sciences, Inc. | Single-Shot Spectral Imager |
| US20110142339A1 (en) * | 2009-11-20 | 2011-06-16 | Tripurari Singh | Method and System for Compressive Color Image Sampling and Reconstruction |
| US8005992B1 (en) * | 2006-10-13 | 2011-08-23 | Cadence Design Systems, Inc. | Scalable storage and retrieval of multiple asynchronous signals |
| US20120029854A1 (en) * | 2010-07-30 | 2012-02-02 | Kla-Tencor Corporation | Readout methodology for multi-channel acquisition of spatially distributed signal |
| US20130120755A1 (en) * | 2011-11-11 | 2013-05-16 | Bruker Optik Gmbh | Recording a spectrally resolved image by reading out several partial arrays in a plurality of interferometer scans |
| US8516340B2 (en) | 2011-12-08 | 2013-08-20 | Harris Corporation | Data system for interfacing with a remote data storage facility using compressive sensing and associated methods |
| US8538329B2 (en) | 2011-12-08 | 2013-09-17 | Harris Corporation | System with sub-nyquist signal acquisition and transmission and associated methods |
| US20140043486A1 (en) * | 2011-06-20 | 2014-02-13 | Guangjie Zhai | Multi-Spectral Imaging Method for Ultraweak Photon Emission and System Thereof |
| US8742982B2 (en) | 2010-03-30 | 2014-06-03 | Sony Corporation | Indirect radar holography apparatus and corresponding method |
| US20140270565A1 (en) * | 2013-03-14 | 2014-09-18 | Lawrence Livermore National Security, Llc | Measurement of wave-front aberration in a small telescope remote imaging system using scene-based wave-front sensing |
| US9013691B2 (en) | 2012-01-29 | 2015-04-21 | Ramot At Tel-Aviv University | Snapshot spectral imaging based on digital cameras |
| US9209861B2 (en) | 2013-03-15 | 2015-12-08 | The United States Of America, As Represented By The Secretary Of The Navy | Ultra-wideband frequency position modulation using nonlinear compressed sensing |
| US9335281B2 (en) | 2011-10-07 | 2016-05-10 | Duke University | Apparatus for coded aperture X-ray scatter imaging and method therefor |
| JP2016090576A (en) * | 2014-10-29 | 2016-05-23 | パナソニックIpマネジメント株式会社 | Imaging apparatus, spectroscopy system, and spectroscopy method |
| US9613439B1 (en) * | 2015-10-16 | 2017-04-04 | The United States Of America, As Represented By The Secretary Of The Navy | System and method for a hierarchical Bayesian-map approach for solving inverse problems |
| US9654208B2 (en) | 2011-08-30 | 2017-05-16 | The United States Of America, As Represented By The Secretary Of The Navy | System and method for photonic compressive sampling |
| US10004464B2 (en) | 2013-01-31 | 2018-06-26 | Duke University | System for improved compressive tomography and method therefor |
| US10107768B2 (en) | 2013-08-13 | 2018-10-23 | Duke University | Volumetric-molecular-imaging system and method therefor |
| US10909670B2 (en) | 2018-12-06 | 2021-02-02 | Massachusetts Institute Of Technology | Computational reconfigurable imaging spectrometer |
| US10987071B2 (en) * | 2017-06-29 | 2021-04-27 | University Of Delaware | Pixelated K-edge coded aperture system for compressive spectral X-ray imaging |
| US11555935B2 (en) * | 2017-10-20 | 2023-01-17 | Australian Nuclear Science And Technology Organisation | Compressive imaging method and system comprising a detector, a mask, and a drive for rotating the mask about at least one of one or more axes of rotational symmetry |
Families Citing this family (78)
| Publication number | Priority date | Publication date | Assignee | Title |
|---|---|---|---|---|
| US7532772B2 (en) * | 2004-07-20 | 2009-05-12 | Duke University | Coding for compressive imaging |
| US7646924B2 (en) * | 2004-08-09 | 2010-01-12 | David Leigh Donoho | Method and apparatus for compressed sensing |
| US20090295910A1 (en) * | 2005-03-24 | 2009-12-03 | Jose Mir | Hyperspectral Imaging System and Methods Thereof |
| GB0510470D0 (en) * | 2005-05-23 | 2005-06-29 | Qinetiq Ltd | Coded aperture imaging system |
| GB0602380D0 (en) * | 2006-02-06 | 2006-03-15 | Qinetiq Ltd | Imaging system |
| GB2434937A (en) | 2006-02-06 | 2007-08-08 | Qinetiq Ltd | Coded aperture imaging apparatus performing image enhancement |
| GB2434936A (en) | 2006-02-06 | 2007-08-08 | Qinetiq Ltd | Imaging system having plural distinct coded aperture arrays at different mask locations |
| GB2434877A (en) * | 2006-02-06 | 2007-08-08 | Qinetiq Ltd | MOEMS optical modulator |
| GB2434934A (en) * | 2006-02-06 | 2007-08-08 | Qinetiq Ltd | Processing coded aperture image data by applying weightings to aperture functions and data frames |
| GB2434935A (en) * | 2006-02-06 | 2007-08-08 | Qinetiq Ltd | Coded aperture imager using reference object to form decoding pattern |
| US20070199700A1 (en) * | 2006-02-27 | 2007-08-30 | Grant Hocking | Enhanced hydrocarbon recovery by in situ combustion of oil sand formations |
| GB0615040D0 (en) * | 2006-07-28 | 2006-09-06 | Qinetiq Ltd | Processing method for coded apperture sensor |
| US7289049B1 (en) * | 2006-08-21 | 2007-10-30 | L3 Communications Integrated Systems L.P. | Method and apparatus for compressed sensing |
| WO2008034432A2 (en) * | 2006-09-21 | 2008-03-27 | Ruped Systems Gmbh | Method and device for identifying properties of objects |
| US7345603B1 (en) * | 2006-11-07 | 2008-03-18 | L3 Communications Integrated Systems, L.P. | Method and apparatus for compressed sensing using analog projection |
| EP2122409B1 (en) * | 2007-02-25 | 2016-12-07 | Humaneyes Technologies Ltd. | A method and a system for calibrating and/or visualizing a multi image display and for reducing ghosting artifacts |
| US20080219579A1 (en) * | 2007-03-05 | 2008-09-11 | Aksyuk Vladimir A | Methods and Apparatus for Compressed Imaging Using Modulation in Pupil Plane |
| US7907784B2 (en) * | 2007-07-09 | 2011-03-15 | The United States Of America As Represented By The Secretary Of The Commerce | Selectively lossy, lossless, and/or error robust data compression method |
| US9035968B2 (en) * | 2007-07-23 | 2015-05-19 | Humaneyes Technologies Ltd. | Multi view displays and methods for producing the same |
| WO2009017496A1 (en) * | 2007-07-31 | 2009-02-05 | Georgia Tech Research Corporation | Systems and methods for utilizing cylindrical beam volume holograms |
| EP2046045A1 (en) * | 2007-10-02 | 2009-04-08 | Thomson Licensing | Methods of encoding and reconstructing image data and devices implementing said methods |
| EP2046046A1 (en) * | 2007-10-02 | 2009-04-08 | Thomson Licensing | Methods of encoding and reconstructing image data and devices implementing said methods |
| US8194391B2 (en) * | 2007-12-21 | 2012-06-05 | Murata Manufacturing Co., Ltd. | Multilayer ceramic electronic component and manufacturing method thereof |
| US20090201498A1 (en) * | 2008-02-11 | 2009-08-13 | Ramesh Raskar | Agile Spectrum Imaging Apparatus and Method |
| US20100091127A1 (en) * | 2008-09-30 | 2010-04-15 | University Of Victoria Innovation And Development Corporation | Image reconstruction method for a gradient camera |
| TW201022959A (en) * | 2008-10-30 | 2010-06-16 | Ibm | Method, device, computer program and computer program product for determining a representation of a signal |
| EP2350926A2 (en) * | 2008-11-24 | 2011-08-03 | Institut Ruder Boskovic | Method of and system for blind extraction of more than two pure components out of spectroscopic or spectrometric measurements of only two mixtures by means of sparse component analysis |
| GB0822281D0 (en) * | 2008-12-06 | 2009-01-14 | Qinetiq Ltd | Optically diverse coded aperture imaging |
| US8149400B2 (en) | 2009-04-07 | 2012-04-03 | Duke University | Coded aperture snapshot spectral imager and method therefor |
| US8263939B2 (en) * | 2009-04-21 | 2012-09-11 | The Boeing Company | Compressive millimeter wave imaging |
| US20110068268A1 (en) * | 2009-09-18 | 2011-03-24 | T-Ray Science Inc. | Terahertz imaging methods and apparatus using compressed sensing |
| US9124755B2 (en) * | 2009-12-07 | 2015-09-01 | William Marsh Rice University | Apparatus and method for compressive imaging and sensing through multiplexed modulation |
| US8238514B2 (en) * | 2009-12-17 | 2012-08-07 | Empire Technology Development, Llc | Ultra-short pulsed X-ray imaging |
| EP2357785B1 (en) * | 2009-12-22 | 2013-02-13 | Sony Corporation | Passive radiometric imaging device and corresponding method |
| KR101643607B1 (en) * | 2009-12-30 | 2016-08-10 | 삼성전자주식회사 | Method and apparatus for generating of image data |
| US8692708B2 (en) | 2010-03-30 | 2014-04-08 | Sony Corporation | Radiometric imaging device and corresponding method |
| US9654752B2 (en) * | 2010-06-18 | 2017-05-16 | William Marsh Rice University | Method and apparatus for compressive acquisition and recovery of dynamic imagery |
| CN101893552B (en) * | 2010-07-06 | 2012-06-27 | 西安电子科技大学 | Hyperspectral imager and imaging method based on compressive sensing |
| US8570405B2 (en) | 2010-08-11 | 2013-10-29 | Inview Technology Corporation | Determining light level variation in compressive imaging by injecting calibration patterns into pattern sequence |
| JP2012042385A (en) * | 2010-08-20 | 2012-03-01 | Fujitsu Ltd | Dispersion measurement apparatus |
| US8390490B2 (en) * | 2011-05-12 | 2013-03-05 | Texas Instruments Incorporated | Compressive sensing analog-to-digital converters |
| US20130011051A1 (en) * | 2011-07-07 | 2013-01-10 | Lockheed Martin Corporation | Coded aperture imaging |
| US8547260B2 (en) * | 2011-09-16 | 2013-10-01 | Texas Instruments Incorporated | Compressive sense based reconstruction algorithm for non-uniform sampling based data converter |
| US20140063314A1 (en) * | 2012-02-28 | 2014-03-06 | Aswin C Sankaranarayanan | System And Method Of Video Compressive Sensing For Spatial-Multiplexing Cameras |
| IL219773A (en) * | 2012-05-13 | 2015-09-24 | Elbit Sys Electro Optics Elop | Apparatus and method for increasing the resolution of a cryogenically cooled and vacuum-sealed infrared imaging detector |
| WO2013192624A1 (en) * | 2012-06-22 | 2013-12-27 | Northeastern University | Fiber orientation image processing methods and systems |
| US9277139B2 (en) * | 2013-01-16 | 2016-03-01 | Inview Technology Corporation | Generating modulation patterns for the acquisition of multiscale information in received signals |
| US20140257755A1 (en) * | 2013-03-11 | 2014-09-11 | Mitsubishi Electric Research Laboratories, Inc. | Method for Reconstructing Signals from Phase-Only Measurements |
| US9230302B1 (en) * | 2013-03-13 | 2016-01-05 | Hrl Laboratories, Llc | Foveated compressive sensing system |
| CN103152573A (en) * | 2013-03-15 | 2013-06-12 | 惠州Tcl移动通信有限公司 | Method and system for transmitting image frame between mobile terminal and intelligent television set |
| SG11201509961SA (en) * | 2013-06-05 | 2016-01-28 | Ev Group E Thallner Gmbh | Measuring device and method for ascertaining a pressure map |
| US9523635B2 (en) * | 2013-06-20 | 2016-12-20 | Rigaku Raman Technologies, Inc. | Apparatus and methods of spectral searching using wavelet transform coefficients |
| EP3022536B1 (en) | 2013-07-14 | 2022-09-07 | B.G. Negev Technologies and Applications Ltd., at Ben-Gurion University | Compressive sensing spectroscopic method and device using thin-layered devices |
| WO2015154033A1 (en) | 2014-04-04 | 2015-10-08 | The Arizona Board Of Regents On Behalf Of The University Of Arizona | Compressive sensing systems and related methods |
| FR3021127B1 (en) * | 2014-05-19 | 2017-10-13 | Commissariat Energie Atomique | SYSTEM AND METHOD FOR ACQUIRING HYPERSPECTRAL IMAGES |
| CN109163805B (en) | 2014-11-19 | 2022-03-22 | 松下知识产权经营株式会社 | Light splitting system |
| CN104406696B (en) * | 2014-11-27 | 2016-08-31 | 国家海洋环境预报中心 | A kind of hyperspectral imager outfield spectral radiometric calibration method and device |
| CN105791640B (en) | 2015-01-08 | 2020-07-10 | 松下知识产权经营株式会社 | Image pickup apparatus |
| US10057383B2 (en) * | 2015-01-21 | 2018-08-21 | Microsoft Technology Licensing, Llc | Sparsity estimation for data transmission |
| CN106331442B (en) * | 2015-07-02 | 2021-01-15 | 松下知识产权经营株式会社 | Image pickup apparatus |
| CN105139339A (en) * | 2015-07-27 | 2015-12-09 | 中国人民解放军陆军军官学院 | Polarization image super-resolution reconstruction method based on multi-level filtering and sample matching |
| US10015499B1 (en) * | 2015-07-30 | 2018-07-03 | Teradici Corporation | Method and apparatus for layered wavelet image compression |
| US9903757B1 (en) | 2015-09-25 | 2018-02-27 | Hrl Laboratories, Llc | Active multi-spectral sensor |
| US10295462B1 (en) | 2016-03-02 | 2019-05-21 | Hrl Laboratories, Llc | Detection by active spatially and spectrally structured sensing and learning (DAS4L) |
| CN106124415A (en) * | 2016-06-03 | 2016-11-16 | 中国科学技术大学 | Optical rotation method for real-time measurement based on pixel polarisation camera and measurement apparatus |
| US10276134B2 (en) * | 2017-03-22 | 2019-04-30 | International Business Machines Corporation | Decision-based data compression by means of deep learning technologies |
| CN107655571B (en) * | 2017-09-19 | 2019-11-15 | 南京大学 | A kind of spectrum imaging system and its spectrum reconstruction method fuzzy based on dispersion |
| CN107727238B (en) * | 2017-10-13 | 2023-09-12 | 中国科学院上海技术物理研究所 | Infrared parallel compression imaging system and imaging method based on mask modulation |
| CN107783148A (en) * | 2017-11-29 | 2018-03-09 | 苏州蛟视智能科技有限公司 | Compressed sensing imaging device and method |
| CN108225561B (en) * | 2017-12-05 | 2020-05-22 | 深圳先进技术研究院 | Compressed spectrum imaging system, reconstruction method, device and terminal equipment |
| WO2019237659A1 (en) | 2018-06-11 | 2019-12-19 | Suzhou Aqueti Technology Co., Ltd. | Blind compressive sampling method, apparatus and imaging system |
| CN109839749B (en) * | 2019-04-02 | 2021-04-20 | 上海理工大学 | Variable period grating photonic crystal super-resolution imaging device |
| US11060843B2 (en) * | 2019-04-16 | 2021-07-13 | Hi Llc | Interferometric parallel detection using digital rectification and integration |
| CN110501071B (en) * | 2019-08-02 | 2021-07-13 | 杭州电子科技大学 | Compressed hyperspectral mask optimization method based on fuzzy coding |
| US20210287798A1 (en) * | 2020-03-13 | 2021-09-16 | Symptomsense, Llc | Systems and methods for non-invasive virus symptom detection |
| US11639873B2 (en) * | 2020-04-15 | 2023-05-02 | Viavi Solutions Inc. | High resolution multi-pass optical spectrum analyzer |
| US11303839B1 (en) | 2020-10-05 | 2022-04-12 | Raytheon Company | Coded aperture focal plane array |
| US11871131B2 (en) | 2021-08-06 | 2024-01-09 | Raytheon Company | Foveal compressive upsampling |
Citations (5)
| Publication number | Priority date | Publication date | Assignee | Title |
|---|---|---|---|---|
| US6128078A (en) * | 1999-04-09 | 2000-10-03 | Three Lc, Inc. | Radiation filter, spectrometer and imager using a micro-mirror array |
| US6208413B1 (en) * | 1997-03-13 | 2001-03-27 | Institut Fuer Physikalische Hochtechnologie E.V. | Hadamard spectrometer |
| US6870619B1 (en) * | 1999-09-29 | 2005-03-22 | Valtion Teknillinen Tutkimuskeskus | Spectrometer and method for measuring optical spectrum |
| US6996292B1 (en) * | 2002-04-18 | 2006-02-07 | Sandia Corporation | Staring 2-D hadamard transform spectral imager |
| US7196789B2 (en) * | 2003-10-15 | 2007-03-27 | Polychromix Corporation | Light processor providing wavelength control and method for same |
Family Cites Families (5)
| Publication number | Priority date | Publication date | Assignee | Title |
|---|---|---|---|---|
| FR2755324B1 (en) * | 1996-10-25 | 1999-01-08 | Thomson Multimedia Sa | CONVERSION OF AN ANALOG SIGNAL INTO DIGITAL SIGNAL IN PARTICULAR TV VIDEO SIGNAL |
| US6046808A (en) * | 1999-04-09 | 2000-04-04 | Three Lc, Inc. | Radiation filter, spectrometer and imager using a micro-mirror array |
| JP4132714B2 (en) * | 2001-04-12 | 2008-08-13 | 三菱電機株式会社 | Video signal sampling device, display device, and video signal sampling method |
| US7266245B1 (en) * | 2002-03-28 | 2007-09-04 | Magnachip Semiconductor Ltd. | Image signal compression method and system |
| US7283231B2 (en) * | 2004-07-20 | 2007-10-16 | Duke University | Compressive sampling and signal inference |
-
2005
- 2005-07-19 US US11/183,838 patent/US7283231B2/en active Active
-
2007
- 2007-07-31 US US11/831,840 patent/US7432843B2/en not_active Expired - Fee Related
- 2007-07-31 US US11/831,855 patent/US7463179B2/en not_active Expired - Fee Related
- 2007-07-31 US US11/831,730 patent/US7463174B2/en not_active Expired - Fee Related
- 2007-07-31 US US11/831,847 patent/US7427932B2/en not_active Expired - Fee Related
- 2007-07-31 US US11/831,832 patent/US7616306B2/en active Active
Patent Citations (5)
| Publication number | Priority date | Publication date | Assignee | Title |
|---|---|---|---|---|
| US6208413B1 (en) * | 1997-03-13 | 2001-03-27 | Institut Fuer Physikalische Hochtechnologie E.V. | Hadamard spectrometer |
| US6128078A (en) * | 1999-04-09 | 2000-10-03 | Three Lc, Inc. | Radiation filter, spectrometer and imager using a micro-mirror array |
| US6870619B1 (en) * | 1999-09-29 | 2005-03-22 | Valtion Teknillinen Tutkimuskeskus | Spectrometer and method for measuring optical spectrum |
| US6996292B1 (en) * | 2002-04-18 | 2006-02-07 | Sandia Corporation | Staring 2-D hadamard transform spectral imager |
| US7196789B2 (en) * | 2003-10-15 | 2007-03-27 | Polychromix Corporation | Light processor providing wavelength control and method for same |
Non-Patent Citations (44)
| Title |
|---|
| Aldroubi and Grochenig, "Nonuniform sampling and reconstruction in shift-invariant spaces," Siam Review, vol. 43, No. 4, pp. 585-620, 2001. |
| Brady, Pitsianis, and Sun, "Reference Structure Tomography," Journal of the Optical Society of America A, vol. 21, No. 7, pp. 1140-1147, 2004. |
| Buccigrossi and Simoncelli, "Image compression via joint statistical characterization in the wavelet domain," IEEE Transactions on Image Processing, vol. 8, No. 12, pp. 1688-1701, 1999. |
| Djokovic and Vaidyanathan, "Generalized sampling theorems in multi-resolution subspaces," IEEE Transactions on Signal Processing, vol. 45, No. 3, pp. 583-599, 1997. |
| Donoho, Vetterli, Devore, and Daubechies, "Data compression and harmonic analysis," IEEE Transactions on Information Theory, vol. 44, No. 6, pp. 2435-2476, 1998. |
| Fenimore, "Coded aperture imaging-predicted performance of uniformly redundant arrays," Applied Optics, vol. 17, No. 22, pp. 3562-3570, 1978. |
| Field, "Relations between the statistics of natural images and the response properties of cortical-cells," J. Opt. Soc. Am. (Optics Image Science and Vision), vol. 4, No. 12, pp. 2379-2394, 1987. |
| Frajka and Zeger, "Downsampling dependent upsampling of images," Signal Processing-Image Communication, vol. 19, No. 3, pp. 257-265, 2004. |
| Grochenig, "A discrete theory of irregular sampling," Linear Algebra and Its Applications, vol. 193, pp. 129-150, 1993. |
| Healy and Weaver, "2 applications of wavelet transforms in magnetic-resonance-imaging," IEEE Transactions on Information Theory, vol. 38, No. 2, pp. 840-860, 1992. |
| Itoh and Ohtsuka, "Fourier-transform spectral imaging: retrieval of source information from three-dimensional spatial coherence," Journal of the Optical Society of America A, vol. 3, No. 1, pp. 94-100, 1986. |
| Janssen, "The zak transform and sampling theorems for wavelet subspaces," IEEE Transactions on Signal Processing, vol. 41, No. 12, pp. 3360-3364, 1993. |
| Jensen and Anastassiou, "Subpixel edge localization and the interpolation of still images," IEEE Transactions on Image Processing, vol. 4, No. 3, pp. 285-295, 1995. |
| Jerri, "The Shannon sampling theorem-its various extensions and applications: a tutorial review," Proc. IEEE, vol. 65, pp. 1565-1596, 1977. |
| Kitamura, Shogenji, Yamada, Miyatake, Miyamoto, Morimoto, Masaki, Kondou, Miyazaki, Tanida, and Ichioka, "Reconstruction of a high-resolution image on a compound-eye image-capturing system," Applied Optics, vol. 43, No. 8, pp. 1719-1727, 2004. |
| Liu and Moulin, "Information-theoretic analysis of interscale and intrascale dependencies between image wavelet coefficients," IEEE Transactions on Image Processing, vol. 10, No. 11, pp. 1647-1658, 2001. |
| Marks, Stack, and Brady, "3D coherence imaging in the fresnel domain," Applied Optics, vol. 38, pp. 1332-1342, 1999. |
| Meijering, "A chronology of interpolation: From ancient astronomy to modern signal and image processing," Proceedings of the IEEE, vol. 90, No. 3, pp. 319-342, 2002. |
| Nyquist, "Certain topics in telegraph transmission theory," IEEE Trans., vol. 47, pp. 617-644, 1928. |
| Pace, Leino, and Styer, "Use of the symmetrical number system in resolving single-frequency undersampling aliases," IEEE Transactions on Signal Processing, vol. 45, No. 5, pp. 1153-1160, 1997. |
| Papoulis, "Generalized sampling expansion," IEEE Transactions on Circuits and Systems, vol. 24, No. 11, pp. 652-654, 1977. |
| Park, Park, and Kang, Super-resolution image reconstruction: A technical overview, IEEE Signal Processing Magazine, vol. 20, No. 3, pp. 21-36, 2003. |
| Rajan and Chaudhuri, "Generalized Interpolation and its application in super-resolution imaging," Image and Vision Computing, vol. 19, No. 13, pp. 957-969, 2001. |
| Roddier, "Interferometric imaging in optical astronomy," Physics Reports, vol. 170, No. 2, pp. 97-166, 1988. |
| Ruderman and Bialek, "Statistics of natural images-scaling in the woods," Phys. Rev. Lett., vol. 73, No. 6, pp. 814-817, 1994. |
| Said and Pearlman, "A new fast and efficient image codec based on set partitioning in hierarchical trees," IEEE Transactions on Circuits and Systems for Video Technology, vol. 6, pp. 243-250, 1996. |
| Shannon, "Communications in the presence of noise," Proc. IRE, vol. 37, pp. 10-21, 1949. |
| Shapiro, "Embedded image-coding using zerotrees of wavelet coefficients," IEEE Trans. Signal Process, vol. 41, No. 12, pp. 3445-3462, 1993. |
| Shogenji, Kitamura, Yamada, Miyatake, and Tanida, "Multispectral imaging using compact compound optics," Optics Express, vol. 12, No. 8, pp. 1643-1655, 2004. |
| Srivastava, Lee, Simoncelli, and Zhu, "On advances in statistical modeling of natural images," Journal of Mathematical Imaging and Vision, vol. 18, No. 1, pp. 17-33, 2003. |
| Strohmer, "Numerical analysis of the non-uniform sampling problem," Journal of Computational and Applied Mathematics, vol. 122, No. 1-2, pp. 297-316, 2000. |
| Tanida, Kumagai, Yamada, Miyatake, Ishida, Morimoto, Kondou, Miyazaki, and Ichioka, "Thin observation module by bound optics (TOMBO): concept and experimental verification," Applied Optics, vol. 40, No. 11, pp. 1806-1813, 2001. |
| Tanida, Shogenji, Kitamura, Yamada, Miyamoto, and Miyatake, "Color imaging with an integrated compound imaging system," Optics Express, vol. 11, No. 18, pp. 2109-2117, 2003. |
| Tumbar and Brady, "Sampling field sensor with anisotropic fan-out," Applied Optics, vol. 41, No. 31, pp. 6621-6636, 2002. |
| Unser, "Sampling-50 years after Shannon," Proc. IEEE, vol. 88, No. 4, pp. 569-587, 2000. |
| Vaidyanathan, "Generalizations of the sampling theorem: Seven decades after Nyquist," IEEE Transactions on Circuits and Systems I-Fundamental Theory and Applications, vol. 48, No. 9, pp. 1094-1109, 2001. |
| Vio, Strohmer, and Wamsteker, "On the reconstruction of irregularly sampled time series," Publications of the Astronomical Society of the Pacific, vol. 112, No. 767, pp. 74-90, 2000. |
| Wagner, Brown, and Metz, "On the multiplex advantage of coded source aperture photon imaging," Proceedings of the Society of Photo-Optical Instrumentation Engineers (SPIE), vol. 314, pp. 72-76, 1981. |
| Wainwright, Simoncelli, and Willsky, "Random cascades on wavelet trees and their use in analyzing and modeling natural images," Applied and Computational Harmonic Analysis, vol. 11, No. 1, pp. 89-123, 2001. |
| Walter, "A sampling theorem for wavelet subspaces," IEEE Transactions on Information Theory, vol. 38, No. 2, pp. 881-884, 1992. |
| Xia and Zhang, "On sampling theorem, wavelets, and wavelet transforms," IEEE Transactions on Signal Processing, vol. 41, No. 12, pp. 3524-3535, 1993. |
| Xia, "An efficient frequency-determination algorithm from multiple undersampled waveforms," IEEE Signal Processing Letters, vol. 7, No. 2, pp. 34-37, 2000. |
| Zhou and Sun, "On the sampling theorem for wavelet subspaces," Journal of Fourier Analysis and Applications, vol. 5, No. 4, pp. 347-354, 1999. |
| Zoltowski and Mathews, "Real-time frequency and 2-D angle estimation with sub-Nyquist spatiotemporal sampling," IEEE Transactions on Signal Processing, vol. 42, No. 10, pp. 2781-2794, 1994. |
Cited By (36)
| Publication number | Priority date | Publication date | Assignee | Title |
|---|---|---|---|---|
| US20080080773A1 (en) * | 2004-07-20 | 2008-04-03 | Brady David J | Compressive sampling and signal inference |
| US7427932B2 (en) * | 2004-07-20 | 2008-09-23 | Duke University | Compressive sampling and signal inference |
| US7463174B2 (en) * | 2004-07-20 | 2008-12-09 | Duke University | Compressive sampling and signal inference |
| US20080074291A1 (en) * | 2004-07-20 | 2008-03-27 | Brady David J | Compressive sampling and signal inference |
| US8005992B1 (en) * | 2006-10-13 | 2011-08-23 | Cadence Design Systems, Inc. | Scalable storage and retrieval of multiple asynchronous signals |
| US20090196513A1 (en) * | 2008-02-05 | 2009-08-06 | Futurewei Technologies, Inc. | Compressive Sampling for Multimedia Coding |
| US8553994B2 (en) | 2008-02-05 | 2013-10-08 | Futurewei Technologies, Inc. | Compressive sampling for multimedia coding |
| US20100076693A1 (en) * | 2008-09-22 | 2010-03-25 | University Of Ottawa | Method to extract target signals of a known type from raw data containing an unknown number of target signals, intereference, and noise |
| US8073634B2 (en) * | 2008-09-22 | 2011-12-06 | University Of Ottawa | Method to extract target signals of a known type from raw data containing an unknown number of target signals, interference, and noise |
| US8351031B2 (en) | 2009-06-05 | 2013-01-08 | Spectral Sciences, Inc. | Single-shot spectral imager |
| US20100309467A1 (en) * | 2009-06-05 | 2010-12-09 | Spectral Sciences, Inc. | Single-Shot Spectral Imager |
| US8761525B2 (en) | 2009-11-20 | 2014-06-24 | Tripurari Singh | Method and system for compressive color image sampling and reconstruction |
| US20110142339A1 (en) * | 2009-11-20 | 2011-06-16 | Tripurari Singh | Method and System for Compressive Color Image Sampling and Reconstruction |
| US8742982B2 (en) | 2010-03-30 | 2014-06-03 | Sony Corporation | Indirect radar holography apparatus and corresponding method |
| US8941049B2 (en) * | 2010-07-30 | 2015-01-27 | Kla-Tencor Corporation | Readout methodology for multi-channel acquisition of spatially distributed signal |
| US20120029854A1 (en) * | 2010-07-30 | 2012-02-02 | Kla-Tencor Corporation | Readout methodology for multi-channel acquisition of spatially distributed signal |
| US9807317B2 (en) * | 2011-06-20 | 2017-10-31 | Center For Space Science And Applied Research, Chinese Academy Of Sciences | Multi-spectral imaging method for ultraweak photon emission and system thereof |
| US20140043486A1 (en) * | 2011-06-20 | 2014-02-13 | Guangjie Zhai | Multi-Spectral Imaging Method for Ultraweak Photon Emission and System Thereof |
| US9654208B2 (en) | 2011-08-30 | 2017-05-16 | The United States Of America, As Represented By The Secretary Of The Navy | System and method for photonic compressive sampling |
| US9335281B2 (en) | 2011-10-07 | 2016-05-10 | Duke University | Apparatus for coded aperture X-ray scatter imaging and method therefor |
| US20130120755A1 (en) * | 2011-11-11 | 2013-05-16 | Bruker Optik Gmbh | Recording a spectrally resolved image by reading out several partial arrays in a plurality of interferometer scans |
| US9086319B2 (en) * | 2011-11-11 | 2015-07-21 | Bruker Optik Gmbh | Recording a spectrally resolved image by reading out several partial arrays in a plurality of interferometer scans |
| US8516340B2 (en) | 2011-12-08 | 2013-08-20 | Harris Corporation | Data system for interfacing with a remote data storage facility using compressive sensing and associated methods |
| US8538329B2 (en) | 2011-12-08 | 2013-09-17 | Harris Corporation | System with sub-nyquist signal acquisition and transmission and associated methods |
| US9013691B2 (en) | 2012-01-29 | 2015-04-21 | Ramot At Tel-Aviv University | Snapshot spectral imaging based on digital cameras |
| US10004464B2 (en) | 2013-01-31 | 2018-06-26 | Duke University | System for improved compressive tomography and method therefor |
| US8995787B2 (en) * | 2013-03-14 | 2015-03-31 | Lawrence Livermore National Security, Llc | Measurement of wave-front aberration in a small telescope remote imaging system using scene-based wave-front sensing |
| US20140270565A1 (en) * | 2013-03-14 | 2014-09-18 | Lawrence Livermore National Security, Llc | Measurement of wave-front aberration in a small telescope remote imaging system using scene-based wave-front sensing |
| US9209861B2 (en) | 2013-03-15 | 2015-12-08 | The United States Of America, As Represented By The Secretary Of The Navy | Ultra-wideband frequency position modulation using nonlinear compressed sensing |
| US9515698B2 (en) | 2013-03-15 | 2016-12-06 | The United States Of America, As Represented By The Secretary Of The Navy | Ultra-wideband frequency position modulation using nonlinear compressed sensing |
| US10107768B2 (en) | 2013-08-13 | 2018-10-23 | Duke University | Volumetric-molecular-imaging system and method therefor |
| JP2016090576A (en) * | 2014-10-29 | 2016-05-23 | パナソニックIpマネジメント株式会社 | Imaging apparatus, spectroscopy system, and spectroscopy method |
| US9613439B1 (en) * | 2015-10-16 | 2017-04-04 | The United States Of America, As Represented By The Secretary Of The Navy | System and method for a hierarchical Bayesian-map approach for solving inverse problems |
| US10987071B2 (en) * | 2017-06-29 | 2021-04-27 | University Of Delaware | Pixelated K-edge coded aperture system for compressive spectral X-ray imaging |
| US11555935B2 (en) * | 2017-10-20 | 2023-01-17 | Australian Nuclear Science And Technology Organisation | Compressive imaging method and system comprising a detector, a mask, and a drive for rotating the mask about at least one of one or more axes of rotational symmetry |
| US10909670B2 (en) | 2018-12-06 | 2021-02-02 | Massachusetts Institute Of Technology | Computational reconfigurable imaging spectrometer |
Also Published As
| Publication number | Publication date |
|---|---|
| US20080074291A1 (en) | 2008-03-27 |
| US20080129568A1 (en) | 2008-06-05 |
| US7463179B2 (en) | 2008-12-09 |
| US7427932B2 (en) | 2008-09-23 |
| US7463174B2 (en) | 2008-12-09 |
| US20080074292A1 (en) | 2008-03-27 |
| US20080080773A1 (en) | 2008-04-03 |
| US20080074663A1 (en) | 2008-03-27 |
| US7432843B2 (en) | 2008-10-07 |
| US7616306B2 (en) | 2009-11-10 |
| US20060038705A1 (en) | 2006-02-23 |
Similar Documents
| Publication | Publication Date | Title |
|---|---|---|
| US7283231B2 (en) | Compressive sampling and signal inference | |
| US7532772B2 (en) | Coding for compressive imaging | |
| US10184830B2 (en) | Apparatus and method for snapshot spectral imaging | |
| US7336353B2 (en) | Coding and modulation for hyperspectral imaging | |
| US9880053B2 (en) | Image pickup apparatus, spectroscopic system, and spectroscopic method | |
| WO2016012980A1 (en) | Compact multifunctional system for imaging spectroscopy | |
| WO2021085014A1 (en) | Filter array and optical detection system | |
| US20210341657A1 (en) | Photodetection device, photodetection system, and filter array | |
| KR20190036442A (en) | Hyperspectral Imaging Reconstruction Method Using Artificial Intelligence and Apparatus Therefor | |
| Degraux et al. | Multispectral compressive imaging strategies using Fabry–Pérot filtered sensors | |
| CN109682476B (en) | Method for performing compressed hyperspectral imaging by using self-adaptive coding aperture | |
| Moshtaghpour et al. | A variable density sampling scheme for compressive Fourier transform interferometry | |
| Pfeffer et al. | A micro-mirror array based system for compressive sensing of hyperspectral data | |
| Kar | Computational spectral imaging techniques using diffractive lenses and compressive sensing | |
| Leblanc et al. | Interferometric lensless imaging: rank-one projections of image frequencies with speckle illuminations | |
| Marquez et al. | Multiple Snapshot Colored Compressive Spectral Imager Via Deformable Mirrors | |
| Zhang et al. | Spectral Polarization Image Reconstruction Using Compressed Sensing Method | |
| Shields et al. | Cognition at the Point of Sensing | |
| WO2023106143A1 (en) | Device and filter array used in system for generating spectral image, system for generating spectral image, and method for manufacturing filter array | |
| Baraniuk et al. | Compressive Optical Imaging Systems–Theory, Devices and Implementation | |
| Leblanc et al. | Interferometric Lensless Imaging | |
| Lee | Compressive Hyperspectral Imaging: Acquisition, Recovery, and Unmixing | |
| Scholl et al. | Model based compression of the calibration matrix for hyperspectral imaging systems | |
| Stern | Special Aspects of the Application of Compressive Sensing in Optical Imaging and Sensing: Challenges, Some Solutions, and Open Questions | |
| Wang | A framework for the analysis and evaluation of optical imaging systems with arbitrary response functions |
Legal Events
| Date | Code | Title | Description |
|---|---|---|---|
| AS | Assignment |
Owner name: DUKE UNIVERSITY, NORTH CAROLINA Free format text: ASSIGNMENT OF ASSIGNORS INTEREST;ASSIGNORS:BRADY, DAVID J.;PITSIANIS, NIKOS;SUN, XIAOBAI;AND OTHERS;REEL/FRAME:016802/0193 Effective date: 20050719 |
|
| STCF | Information on status: patent grant |
Free format text: PATENTED CASE |
|
| FPAY | Fee payment |
Year of fee payment: 4 |
|
| REMI | Maintenance fee reminder mailed | ||
| FPAY | Fee payment |
Year of fee payment: 8 |
|
| SULP | Surcharge for late payment |
Year of fee payment: 7 |
|
| MAFP | Maintenance fee payment |
Free format text: PAYMENT OF MAINTENANCE FEE, 12TH YR, SMALL ENTITY (ORIGINAL EVENT CODE: M2553); ENTITY STATUS OF PATENT OWNER: SMALL ENTITY Year of fee payment: 12 |