US20010022518A1 - Capacity estimation method, degradation estimation method and degradation estimation apparatus for lithium-ion cells, and lithium-ion batteries - Google Patents
Capacity estimation method, degradation estimation method and degradation estimation apparatus for lithium-ion cells, and lithium-ion batteries Download PDFInfo
- Publication number
- US20010022518A1 US20010022518A1 US09/804,503 US80450301A US2001022518A1 US 20010022518 A1 US20010022518 A1 US 20010022518A1 US 80450301 A US80450301 A US 80450301A US 2001022518 A1 US2001022518 A1 US 2001022518A1
- Authority
- US
- United States
- Prior art keywords
- charge
- capacity
- ion cell
- time
- discharge
- Prior art date
- Legal status (The legal status is an assumption and is not a legal conclusion. Google has not performed a legal analysis and makes no representation as to the accuracy of the status listed.)
- Granted
Links
Images
Classifications
-
- H—ELECTRICITY
- H02—GENERATION; CONVERSION OR DISTRIBUTION OF ELECTRIC POWER
- H02M—APPARATUS FOR CONVERSION BETWEEN AC AND AC, BETWEEN AC AND DC, OR BETWEEN DC AND DC, AND FOR USE WITH MAINS OR SIMILAR POWER SUPPLY SYSTEMS; CONVERSION OF DC OR AC INPUT POWER INTO SURGE OUTPUT POWER; CONTROL OR REGULATION THEREOF
- H02M3/00—Conversion of dc power input into dc power output
- H02M3/02—Conversion of dc power input into dc power output without intermediate conversion into ac
- H02M3/04—Conversion of dc power input into dc power output without intermediate conversion into ac by static converters
- H02M3/06—Conversion of dc power input into dc power output without intermediate conversion into ac by static converters using resistors or capacitors, e.g. potential divider
- H02M3/07—Conversion of dc power input into dc power output without intermediate conversion into ac by static converters using resistors or capacitors, e.g. potential divider using capacitors charged and discharged alternately by semiconductor devices with control electrode, e.g. charge pumps
-
- G—PHYSICS
- G01—MEASURING; TESTING
- G01R—MEASURING ELECTRIC VARIABLES; MEASURING MAGNETIC VARIABLES
- G01R31/00—Arrangements for testing electric properties; Arrangements for locating electric faults; Arrangements for electrical testing characterised by what is being tested not provided for elsewhere
- G01R31/36—Arrangements for testing, measuring or monitoring the electrical condition of accumulators or electric batteries, e.g. capacity or state of charge [SoC]
- G01R31/392—Determining battery ageing or deterioration, e.g. state of health
-
- H—ELECTRICITY
- H01—ELECTRIC ELEMENTS
- H01M—PROCESSES OR MEANS, e.g. BATTERIES, FOR THE DIRECT CONVERSION OF CHEMICAL ENERGY INTO ELECTRICAL ENERGY
- H01M10/00—Secondary cells; Manufacture thereof
- H01M10/05—Accumulators with non-aqueous electrolyte
- H01M10/052—Li-accumulators
- H01M10/0525—Rocking-chair batteries, i.e. batteries with lithium insertion or intercalation in both electrodes; Lithium-ion batteries
-
- H—ELECTRICITY
- H01—ELECTRIC ELEMENTS
- H01M—PROCESSES OR MEANS, e.g. BATTERIES, FOR THE DIRECT CONVERSION OF CHEMICAL ENERGY INTO ELECTRICAL ENERGY
- H01M10/00—Secondary cells; Manufacture thereof
- H01M10/42—Methods or arrangements for servicing or maintenance of secondary cells or secondary half-cells
- H01M10/425—Structural combination with electronic components, e.g. electronic circuits integrated to the outside of the casing
-
- H—ELECTRICITY
- H01—ELECTRIC ELEMENTS
- H01M—PROCESSES OR MEANS, e.g. BATTERIES, FOR THE DIRECT CONVERSION OF CHEMICAL ENERGY INTO ELECTRICAL ENERGY
- H01M10/00—Secondary cells; Manufacture thereof
- H01M10/42—Methods or arrangements for servicing or maintenance of secondary cells or secondary half-cells
- H01M10/44—Methods for charging or discharging
-
- H—ELECTRICITY
- H02—GENERATION; CONVERSION OR DISTRIBUTION OF ELECTRIC POWER
- H02J—CIRCUIT ARRANGEMENTS OR SYSTEMS FOR SUPPLYING OR DISTRIBUTING ELECTRIC POWER; SYSTEMS FOR STORING ELECTRIC ENERGY
- H02J7/00—Circuit arrangements for charging or depolarising batteries or for supplying loads from batteries
- H02J7/0047—Circuit arrangements for charging or depolarising batteries or for supplying loads from batteries with monitoring or indicating devices or circuits
- H02J7/0048—Detection of remaining charge capacity or state of charge [SOC]
-
- G—PHYSICS
- G01—MEASURING; TESTING
- G01R—MEASURING ELECTRIC VARIABLES; MEASURING MAGNETIC VARIABLES
- G01R31/00—Arrangements for testing electric properties; Arrangements for locating electric faults; Arrangements for electrical testing characterised by what is being tested not provided for elsewhere
- G01R31/36—Arrangements for testing, measuring or monitoring the electrical condition of accumulators or electric batteries, e.g. capacity or state of charge [SoC]
- G01R31/382—Arrangements for monitoring battery or accumulator variables, e.g. SoC
- G01R31/3842—Arrangements for monitoring battery or accumulator variables, e.g. SoC combining voltage and current measurements
-
- G—PHYSICS
- G01—MEASURING; TESTING
- G01R—MEASURING ELECTRIC VARIABLES; MEASURING MAGNETIC VARIABLES
- G01R31/00—Arrangements for testing electric properties; Arrangements for locating electric faults; Arrangements for electrical testing characterised by what is being tested not provided for elsewhere
- G01R31/36—Arrangements for testing, measuring or monitoring the electrical condition of accumulators or electric batteries, e.g. capacity or state of charge [SoC]
- G01R31/396—Acquisition or processing of data for testing or for monitoring individual cells or groups of cells within a battery
-
- H—ELECTRICITY
- H01—ELECTRIC ELEMENTS
- H01M—PROCESSES OR MEANS, e.g. BATTERIES, FOR THE DIRECT CONVERSION OF CHEMICAL ENERGY INTO ELECTRICAL ENERGY
- H01M10/00—Secondary cells; Manufacture thereof
- H01M10/42—Methods or arrangements for servicing or maintenance of secondary cells or secondary half-cells
- H01M10/48—Accumulators combined with arrangements for measuring, testing or indicating the condition of cells, e.g. the level or density of the electrolyte
-
- Y—GENERAL TAGGING OF NEW TECHNOLOGICAL DEVELOPMENTS; GENERAL TAGGING OF CROSS-SECTIONAL TECHNOLOGIES SPANNING OVER SEVERAL SECTIONS OF THE IPC; TECHNICAL SUBJECTS COVERED BY FORMER USPC CROSS-REFERENCE ART COLLECTIONS [XRACs] AND DIGESTS
- Y02—TECHNOLOGIES OR APPLICATIONS FOR MITIGATION OR ADAPTATION AGAINST CLIMATE CHANGE
- Y02E—REDUCTION OF GREENHOUSE GAS [GHG] EMISSIONS, RELATED TO ENERGY GENERATION, TRANSMISSION OR DISTRIBUTION
- Y02E60/00—Enabling technologies; Technologies with a potential or indirect contribution to GHG emissions mitigation
- Y02E60/10—Energy storage using batteries
Definitions
- the present invention relates to a lithium-ion cell (in the following, the lithium-ion cell will be called as an Li-ion cell) and a lithium-ion battery (in the following, the lithium-ion battery will be called as an Li-ion battery). More specifically, the present invention relates to a capacity estimation method, a degradation estimation method and a degradation estimation apparatus for the Li-ion cell and the Li-ion battery.
- Ni/MH cell nickel-metal hydride cell
- Li-ion cell energy which is accumulated in the Ni/MH cell or the Li-ion cell is higher than that of a conventional lead-acid cell or a nickel-cadmium cell (in the following, the nickel-cadmium cell will be called as an Ni/Cd cell) so that damage which may be caused by a trouble of the Ni/MH cell or the Li-ion cell is more serious than that of the lead-acid cell or the Ni/Cd cell.
- volumetric or gravimetric energy density of the Ni/MH cell or the Li-ion cell is much higher than that of the lead-acid cell or the Ni/Cd cell, energy which is accumulated in the Ni/MH cell or the Li-ion cell is higher than the lead-acid cell or the nickel-cadmium cell.
- the Li-ion cell does not have gas absorbing reaction mechanism which absorbs gas which is generated due to side reaction of overcharging although the lead-acid cell, the Ni/Cd cell, and the Ni/MH cell have such a gas absorbing reaction mechanism.
- the latter cells include aqueous solution, sulfuric acid or alkaline solution, as electrolyte. Oxygen gas evolves on the cathode and the gas is absorbed in anode active materials for these cells.
- the Li-ion cell includes lithiated transition metal oxide as cathode active material which intercalates and deintercalates lithium, carbon compound as anode active material which intercalates and deintercalates lithium, and nonaqueous organic mixed solvent in which lithium salts are dissolved as electrolyte.
- gases which are generated by the Li-ion cell due to side reaction of overcharging are CO, CO 2 or other organic gases for which any gas absorbing reaction mechanism has not been established.
- the lead-acid cell, the Ni/Cd cell, and the Ni/MH cell have recoverable safety vent which releases oxygen gas which evolves due to side reaction of overcharging and cannot be absorbed in anode active material.
- the safety vent is not recovered for the Li-ion cell because of preventing from outer moisture. The Li-ion cell thus does not operate once the vent opens. Therefore, as for the Li-ion cell, cell reaction and the safety vent mechanism for keeping safety are largely limited.
- SBS has only functions of charge control, residual capacity management and the like so that it does not have a function of grasping degradation status of cells. Therefore, exchanging of cells or batteries is performed through user's intuition.
- An object of the present invention is to provide a method for performing capacity estimation of the Li-ion cell accurately, a method for performing degradation estimation of the Li-ion cell accurately, an apparatus for performing degradation estimation of the Li-ion cell accurately, and a Li-ion battery which includes a capability for performing degradation estimation accurately.
- the above object of the present invention is achieved by a capacity estimation method for a Li-ion cell, comprising the steps of:
- the above object of the present invention is achieved by a capacity estimation method for a Li-ion cell, comprising the steps of:
- the above object of the present invention is achieved by a capacity estimation method for a Li-ion cell, comprising the steps of:
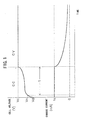
- FIG. 1 shows variation per time of voltage and current values of a Li-ion cell when charging the Li-ion cell by the constant current and constant voltage (CC-CV) charging method which is generally used for charging the Li-ion cell;
- CC-CV constant current and constant voltage
- FIG. 2 shows a configuration of a general power source part and peripheral equipment of an apparatus which mounts the Li-ion cell to which the degradation estimation method of the present invention is applied;
- FIG. 3 shows a general circuit configuration of a Li-ion battery which includes a capability of degradation estimation of the present invention
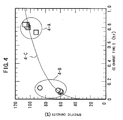
- FIG. 4 shows relationship between elapsed time t and specific capacity which are obtained by the charge and discharge cycle experiment in an example 1-1.
- FIG. 5 shows relationship between CC charge time and specific capacity which are obtained by the charge and discharge cycles in the example 1-1;
- FIG. 6 shows the number of data sets used for preparing equations of an example 1-2 and widths of absolute value of error where the upper limit indicates the maximum error (absolute value) and the lower limit indicates the minimum error (absolute value);
- FIG. 7 shows relationship between CC charge time and specific capacity obtained in an example 1-3
- FIG. 8 shows relationship between CC charge time and specific capacity obtained in an example 1-4
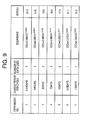
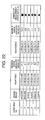
- FIG. 9 is a table showing each charge time per one cycle used for preparing equations of an example 1-5, the number of sets of data for each experiment, prepared equations and absolute values of estimation errors calculated by applying the equations;
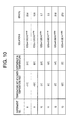
- FIG. 10 is a table showing temperatures of lower temperature tests used for preparing the equations of an example 1-6, obtained equations, and absolute values of estimation errors calculated by applying the equations;
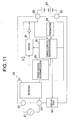
- FIG. 11 shows a configuration of a charger according to an embodiment 1-7
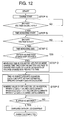
- FIG. 12 is a flowchart showing degradation estimation procedures performed in an experiment 1-7;
- FIG. 13 shows relationship between elapsed time t and specific capacity which are obtained by charge and discharge cycle experiment of an example 2-1;
- FIG. 14 shows relationship between specific capacity and the elapsed time t of CC mode charge obtained in charge and discharge cycles at 0.1 CmA of charge current, which is a comparison example for an example 2-1;
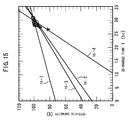
- FIG. 15 shows relationship between specific capacity and elapsed time t of CC mode charge in an example 2-3, and obtained equations;
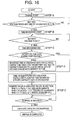
- FIG. 16 is a flowchart showing degradation estimation procedures performed in an experiment 2-4;
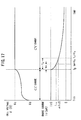
- FIG. 17 is a figure for explaining capacity estimation method of the Li-ion cell according to a third embodiment of the present invention.
- FIG. 18 shows variations of CV mode charge current profiles on which the capacity estimation method and the degradation estimation method of the present invention are based according to the third embodiment
- FIG. 19 shows relationship between elapsed time since the CV charge starts until the charge current becomes half (charge current half reduction time) and specific capacity for explaining the capacity estimation method and the degradation estimation method of the present invention according to the third embodiment;
- FIG. 20 shows relationship between charge current after a lapse of 5 minutes from the instant when charge mode is changed from CC mode to CV mode and specific capacity
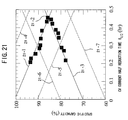
- FIG. 21 shows relationship between time t 1 ⁇ 2 and specific capacity Cr which are results of charge and discharge cycling tests in an example 3-1;
- FIG. 22 shows equations obtained in an example 3-2 of the present invention.
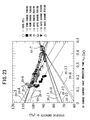
- FIG. 23 shows relationship between the time t 1 ⁇ 2 elapsed from the instant when the CV mode charge starts to the instant when charge current decreases to half and the specific capacity Cr, and each equation obtained in an example 3-2 of the present invention
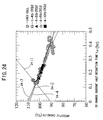
- FIG. 24 shows data of relationship between the time t 1 ⁇ 2 elapsed from the instant when the CV mode charge starts to the instant when charge current decreases to half and the specific capacity Cr, and each equation obtained in an example 3-3 of the present invention
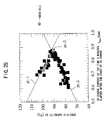
- FIG. 25 shows data of relationship between the charge current I 5min after a lapse of 5 minutes from the start of the CV mode charge and the specific capacity Cr, and each equation in an example 3-4 of the present invention
- FIG. 26 shows data of relationship between charge current after a lapse of a predetermined time from the start of the CV mode charge and the specific capacity Cr, and each equation in an example 3-5 of the present invention
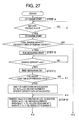
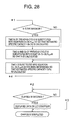
- FIG. 27 is a flowchart showing degradation estimation procedures performed in an experiment 3-6 of the present invention.
- FIG. 28 is a continuation of FIG. 27;
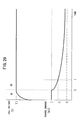
- FIG. 29 is a figure for explaining profiles of cell voltage and charge current by the CC-CV charge method according to a fourth embodiment
- FIG. 30 shows a configuration of a charge control circuit to which the capacity estimation method is applied according to the fourth embodiment of the present invention.
- FIG. 31 shows relationship between charge current and discharge capacity according to results of experiment of an example 4-1 of the present invention
- FIG. 32 shows relationship between time when the charge current was measured after CV mode charge starting and estimated error according to results of experiment of an example 4-2 of the present invention
- FIG. 33 shows relationship between charge current after a lapse of 31 minutes from the start of CV charging and specific capacity according to results of experiment of an example 4-2 of the present invention
- FIG. 34 shows relationship between charge current after a lapse of 10 minutes from the start of CV charging and specific capacity according to results of experiment of an example 4-3 of the present invention
- FIG. 35 is a figure for explaining profiles of cell voltage and charge current by the CC-CV charge method according to a fifth embodiment
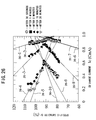
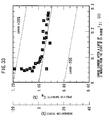
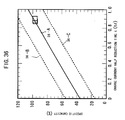
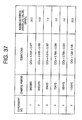
- FIG. 36 shows relationship between charge current half reduction time and specific capacity in an example 5-1, and a line representing an equation obtained in an experiment No. 4 shown in FIG. 37;
- FIG. 37 shows capacity estimation equation and the resulted error (absolute values) for the charge and discharge cycles with various charge time in an example 5-2;
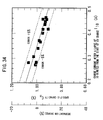
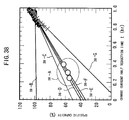
- FIG. 38 shows relationship between charge current half reduction time t and specific capacity C/Co in an example 5-2, and lines of each equation;
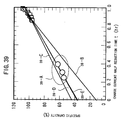
- FIG. 39 shows relationship between charge current half reduction time t and specific capacity C/Co in an example 5-3, and lines of each equation;
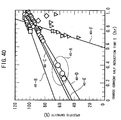
- FIG. 40 shows relationship between charge current half reduction time t and specific capacity C/Co in an example 5-4, and lines of each equation
- FIG. 41 shows relationship between charge current half reduction time t and specific capacity C/Co in an example 5-5, and lines of each equation
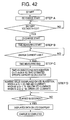
- FIG. 42 is a flowchart showing degradation estimation procedures performed in an experiment 5-6;
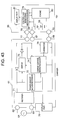
- FIG. 43 shows an electric circuit configuration when the Li-ion battery in PEV is charged by a charger which is connected to utility power source in which capacity estimation and degradation estimation are performed while charging;
- FIG. 44 shows an example of display screen of PEV which displays remaining mileage “Rest of run” and remaining life “Rest of battery life”;
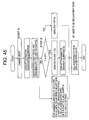
- FIG. 45 is a flowchart showing procedures of calculating remaining mileage of the PEV and remaining life of Li-ion battery mounted in the PEV;
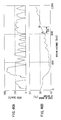
- FIGS. 46A and 46B show a running state of HEV and a state of charge of mounted battery
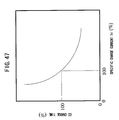
- FIG. 47 shows relationship between the CC charge current and the CC charge time used for obtaining conversion coefficient used for applying monitored current to degradation estimation equation in HEV;
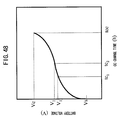
- FIG. 48 shows a profile of CC charge voltage used for obtaining CC charge time applied to estimation equation from monitored charge voltage in HEV.
- capacity estimation and degradation estimation are performed in a constant current and constant voltage charge method focusing attention on three points: (1) a charge time in a constant current mode; (2) a current value after a lapse of a predetermined time interval in a constant voltage mode; and (3) a time taken for charge current to decrease to a predetermined current value.
- the capacity estimation method and the degradation estimation method using (1) the charge time in the constant current mode will be described.
- the charge time in the constant current mode will be used as in the first embodiment in which estimation equations which are simpler than those in the first embodiment will be used.
- the capacity estimation method and the degradation estimation method using (2) the current value after a lapse of a predetermined time interval in the constant voltage mode and (3) the time taken for charge current to decrease to a predetermined current value will be described.
- the capacity estimation method and the degradation estimation method using (2) the current value after a lapse of a predetermined time interval in the constant voltage mode will be described in which these methods are simpler than those in the third embodiment.
- the capacity estimation method and the degradation estimation method using (3) the time taken for charge current to decrease to a predetermined current value will be described in which these methods are simpler than those in the third embodiment.
- battery means “secondary battery as a self-contained power source” in which a cell or a plurality of cells and safety control circuits or charge/discharge control circuits are integrated wherein the plurality of cells are connected in series or in parallel or in combination.
- FIG. 1 shows profiles of voltage and charge current of a Li-ion cell when charging the Li-ion cell.
- the Li-ion cell which may be a Li-ion cell in a battery
- a predetermined charge limit voltage Vc with a predetermined constant current Ic in the constant current mode
- the charge limit voltage Vc is normally 4.1 V/cell or 4.2 V/cell.
- charge of the constant voltage mode in the following, the constant voltage mode will be called as CV mode
- starts in which the charge current decreases over time while the charge voltage (which is shown as “cell voltage” in FIG. 1) keeps the constant value Vc.
- the capacity estimation method of the Li-ion cell of the present invention when the cell is charged in the CC mode in the constant current and constant voltage charge method (in the following, the constant current and constant voltage charge will be called as CC-CV charge), a time t is monitored and the time t is used for capacity estimation of the Li-ion cell, wherein the time t is a time lapsed from the instant when the cell voltage reaches a voltage Vs which is set such that it is equal to or larger that a discharge cut-off voltage Vd and smaller than the charge limit voltage Vc to the instant when the CC mode is changed to the CV mode.
- Li in the cathode active material dissolves as Li + ions in the electrolyte and the Li + ions are intercalated into the anode carbon.
- Li intercalated into anode dissolves as Li + ions in the electrolyte and the Li+ ions are intercalated into the cathode active material.
- transition metal such as Co, Ni, or Mn which constitutes the cathode active material dissolves in the electrolyte so that the reaction area is decreased since the separator is clogged and the compounds are deposited on the anode surface, a passive film is generated on the anode surface due to electrolyte decomposition with Li + ions in the electrolyte, inactive or dead Li remains in the cathode and anode active materials after discharging and charging, or particles of electrode component materials become to be disconnected electrically due to degradation of polymer binder. As a result, electron passing through electrode particles and Li + ion mobility in the electrolyte degrade.
- the inventors of the present invention discover a correlation between decrease of capacity and decrease of the charge time in the CC mode so that they invent the present invention which will be described with the first embodiment.
- the correlation is not necessarily represented as an analytic equation.
- it may be represented as a line graph in which measured values in a correlation diagram are connected by lines.
- the life-span of the cell can be estimated, that is, it can be estimated how many times the cell can be recharged and reused before degradation.
- accuracy of the life-span estimation becomes high.
- the favorable range of the charge current Ic can be represented as Co/(30 hours) ⁇ Ic ⁇ Co/(1 hour), wherein Co is the nominal capacity of the Li-ion cell which is the target of capacity estimation.
- Co is the nominal capacity of the Li-ion cell which is the target of capacity estimation.
- the current is represented by (1/T) CmA.
- Co/(20 hours) can be represented as 0.05 CmA. Therefore, the above condition can be represented as 0.033 CmA ⁇ Ic ⁇ 1.0 CmA.
- the estimated capacity Ce can be obtained by using the time t.
- the capacity estimation method according to this embodiment of the present invention is effective for Li-ion cells used under a normal condition.
- Apparatuses and chargers which adopt a current value which is out of the range are used only for very limited use such as in a case when very high rate charge is required in an emergency. These apparatuses and chargers hardly requires the capacity estimation method of the present invention.
- the equation (1) represents relationship between the time t in the CC mode charge in a charge condition of an apparatus mounting Li-ion cell to which the equation is applied and an estimated specific capacity Ce/Co under the charge condition.
- the charge current value in the CC mode for obtaining the equation (1) is different from the charge current value in the CC mode of the apparatus mounting the cell or the charger, following processes need to be performed.
- the time t is obtained under each charge condition beforehand. Then, after obtaining a ratio te/tm wherein the time te is obtained under the condition for preparing the equation (1) and the time tm is obtained under a condition which corresponds to the apparatus or the charger, a result of multiplying measured time by the ratio te/tm is substituted into the equation (1).
- charge ratio is ratio of the CC mode charge period to full charge period
- a charge and discharge cycle are repeated at least equal to or more than two times by using a Li-ion cell which is a capacity estimation target or the same kind of Li-ion cell as the Li-ion cell, wherein the charge and discharge cycle includes a charge period from 3 hours to 10 days in which charge is performed by the CC-CV charge method, a discharge period, a rest period which is provided as necessary between the charge period and the discharge period.
- a cell or a battery which is the same kind of a cell or a battery for which degradation is estimated is used and two kinds of charge and discharge cycle experiments are performed so as to obtain data necessary for preparing the equation (1).
- the environment temperature is set from 10° C. to 30° C.
- the environment temperature is set from ⁇ 10° C. to 5° C.
- the temperatures are set such that the difference becomes larger than 15° C.
- the charge and discharge cycle experiment for obtaining the equation (1) is performed by setting a voltage range which is the same as that in a charge condition, charge limit voltage Vc, and discharge cut-off voltage Vd, of a real apparatus mounting Li-ion cells.
- a charge current value which is the same as a charge current value of the real apparatus or which is from 0.033 CmA to 1.0 CmA is used.
- the charge period per one cycle is set to be from 3 hours to 10 days or from 3 days to 10 days which is favorable when the experiment environment temperature is set from 10° C. to 30° C.
- the charge period per one cycle is set to be from 3 hours to 10 days or 3 days to 10 days desirably, the cell degrades moderately per one cycle so that data necessary for preparing the equation (1) accurately can be obtained efficiently.
- the charge period is set to be shorter than that used in the above experiment from 10° C. to 30° C., that is, the charge period is set to be from 3 hours to 24 hours or from 3 hours to 12 hours desirably. Because, when the cell is charged and discharged in a low temperature, cell degradation due to overcharge when charging within the set voltage range becomes smaller than that of the case when the cell is charged and discharged at about room temperature. Therefore, in the case of the experiment at the low temperature, the number of the charge discharge cycles in a predetermined period is increased in order to accelerate cell degradation. When the upper limit of the charge period is set as 12 hours, the effect further increases.
- the discharge current value in the charge and discharge cycle is set to be from 0.5 CmA to 2.0 CmA.
- the lower limit is set to be from 1.0 CmA to 2.0 CmA, data can be obtained more efficiently.
- the discharge current is smaller than 0.5 CmA, it takes much time to discharge completely, which is not favorable.
- the discharge current is larger than 2.0 CmA, discharge period becomes too short.
- measurement values of discharge capacity may vary.
- the capacity may decrease abruptly so that the equation (1) can not be prepared accurately. This is not favorable.
- a time tn which is taken until the CC mode charge ends from the time when the charge voltage is a voltage Vs and a discharge capacity Cn are measured for each charge and discharge cycle, wherein the voltage Vs is equal to or larger than the discharge cut-off voltage and smaller than the charge limit voltage Vc in the CC mode charge, the discharge capacity Cn is obtained by integrating discharge current with respect to time, and n is a number which is assigned to each cycle. Then, the measured times tn and capacities Cn are plotted to be applied to the equation (1).
- the estimation may be performed by comparing estimated specific capacity Ce/Co (Co is nominal capacity) and limit specific capacity Cmin/Co. This method is favorable since Ce/Co is directly calculated by the equation (1).
- the apparatus includes:
- [0124] means for obtaining, when the Li-ion cell is charged by a CC-CV charge method, an elapsed time t from the instant when charge voltage in CC charge reaches a predetermined voltage Vs to the instant when charge condition is changed from a CC mode to a CV mode;
- [0126] means for outputting a signal representing that the Li-ion cell is degraded when the estimated capacity Ce becomes smaller than a predetermined limit capacity Cmin.
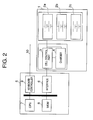
- FIG. 2 shows a configuration of a general power source part and peripheral-equipment of an apparatus which mounts the Li-ion cell.
- This part includes the power source part 1 which includes Li-ion cells 2 a, 2 b, and 2 c. Charge/discharge and safety of the Li-ion cells 2 a, 2 b, and 2 c are controlled by a cell control part 3 in the power source part 1 .
- the power source part 1 includes a charger 4 which charge the cells 2 a, 2 b, and 2 c controlled by the cell control part 3 .
- a logic part 5 includes an interface 6 , a CPU 7 , a memory 8 and keyboard controller 9 .
- the cell control part 3 is connected to the CPU 7 via the interface 6 and receives information on the cells 2 a, 2 b, and 2 c and instruction of control.
- the cell control part 3 sends data on cell control to the CPU 7 .
- the CPU 7 and the memory 8 provide instructions for control, perform operations, store information on cell control and store data. IDs of the cells 2 a, 2 b, and 2 c are input via the keyboard controller 9 .
- a line 10 is connected to the keyboard controller 9 for sending data.
- the equation (1) of the present invention is stored in an available memory in the CPU 7 and the like beforehand. Or, the equation (1) is stored in an memory chip which is added as necessary.
- the CPU provides the cell control part 3 with an instruction to measure the time t from the instant when the charge voltage in the CC mode charge reaches the voltage Vs which is within the range of use voltage until the instant when the CC mode charge is changed to the CV mode charge, and receives data of the time t from the cell control part 3 .
- the CPU 7 performs calculation by substituting the time t into the equation (1) so that the CPU 7 obtains the estimated capacity Ce(or the estimated specific capacity Ce/Co).
- the memory 8 stores the estimated capacity Ce(or the estimated specific capacity Ce/Co) if necessary.
- the Li-ion cell is estimated to be degraded.
- the result of degradation estimation is applied to the body of the apparatus via the line 10 such as a system management bus.
- the body of the apparatus displays the estimation result to a display part of the apparatus and sounds an alert by using a beep or a voice as necessary. Accordingly, the apparatus which has the degradation estimation capability for the Li-ion cells are realized.
- the configuration is not limited to the above mentioned one as long as the degradation estimation of the present invention is performed.
- the method of the present invention can also be applied to a Li-ion battery.
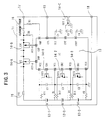
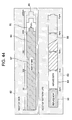
- a configuration example of the Li-ion battery is shown in FIG. 3.
- FIG. 3 shows a general circuit configuration of the Li-ion battery in which three Li-ion cells ( 12 - 1 , 12 - 2 , and 12 - 3 ) are connected in series.
- 11 indicates the body of the battery and 12 - 1 , 12 - 2 , and 12 - 3 indicate the Li-ion cells.
- 13 indicates an IC for protection which monitors voltage, current, temperature and the like, and performs safety control.
- 14 - 1 , 14 - 2 , and 14 - 3 indicate FET for controlling charge current of each cell indicated by 12 - 1 , 12 - 2 , and 12 - 3 .
- 14 -A and 14 -B indicate the FET controlling discharge and charge current of the battery.
- 14 -C indicates the FET controlling earth current from the body.
- 15 indicates a PTC (Positive Temperature Coefficient) element which is a temperature fuse which interrupts current when the temperature increases too much or when the current is large extraordinarily.
- 16 indicates a current fuse which interrupts current when the amount of current increases abnormally.
- 17 indicates a plus terminal, 18 indicates a minus terminal and 19 indicates a terminal for outputting information and controlling.
- a timer is mounted in the IC 13 for protection in the above safety mechanism and the equation (1) is stored in an available memory beforehand.
- the IC 13 monitors the voltage across the Li-ion cells 12 - 1 , 12 - 2 , and 12 - 3 by using terminals Vcc and Vss and counts elapsed time t from the time when charge voltage in the CC mode reaches a start voltage Vs until the CC mode charge is changed to the CV mode charge wherein the start voltage Vs is determined beforehand such that it is equal to or higher than the discharge cut-off voltage Vd and lower than the charge limit voltage Vc.
- the IC 13 can monitor one of the voltages of each Li-ion cell, 12 - 1 , 12 - 2 , or 12 - 3 by using terminals VCC and VC 1 , VC 1 and VC 2 , or VC 2 and VSS, or can monitor the all voltages of each cells if necessary. Then, the counted time t is substituted into the equation (1) so that the estimated capacity Ce is calculated. An additional IC can be provided at a proper position in the battery if necessary.
- a warning (by using electronic signal in this case) which represents capacity degradation is output to the body of the apparatus which mounts the battery via the terminal 19 in order to display the warning on a display or sound an alarm.
- the battery itself includes means of outputting the warning, for example, by displaying characters or an image, or sounding beep tones or a voice.
- Such a battery can be realized by applying the present invention and conventional technologies.
- the Li-ion battery which includes means of performing degradation estimation according to the present invention by modifying an existing Li-ion battery minimally.
- the configuration is not limited to that of the above mentioned Li-ion battery as long as the degradation estimation of the present invention is performed.
- the degradation estimation method and the Li-ion battery which includes the degradation estimation capability of the present invention can be applied to apparatuses for which high reliability is required.
- the present invention By applying the present invention to the apparatuses, degradation status of cells can be grasped properly and the cells can be exchanged in a timely fashion so that troubles of the apparatuses can be avoided.
- any apparatus which uses Li-ion cells adopts the degradation estimation method of the present invention. Accordingly, cells can be exchanged with minimum waste so that the present invention can be used very advantageously.
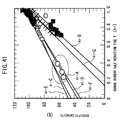
- FIG. 4 shows obtained data.
- FIG. 4 shows relationship between the elapsed times t and the specific capacities Cn/Co which are obtained by the charge and discharge cycle experiment.
- 4 -A in FIG. 4 shows a group of data obtained from the test at 25° C.
- 4 -B in FIG. 4 shows a group of data obtained from the test at 0° C.
- the constants A and B in the equation (1) which is a function of t and which represents the estimated specific capacity Ce/Co are obtained by using the data so that a following equation (2) is prepared.
- the same kind of prismatic Li-ion cell (the nominal capacity is 600 mAh) was used.
- the test cells were cycled 5 times by discharging at 600 mA (1.0 CmA) to 2.75V and charging in CC-CV mode at 600 mA (1.0 CmA) to 4.1V for 3 hr with intervals of 10 minutes between charge and discharge.
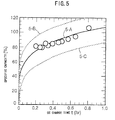
- FIG. 5 shows the relationship between the CC mode charge times and the specific capacities Cn/Co which are obtained by the charge and discharge cycles. As shown in FIG. 5, results until the 11th cycle are plotted.
- 5 -A indicates a curve represented by the equation (2) which is obtained by data shown in FIG. 4.
- 5 -B indicates a curve which has 20% larger specific capacity values than those of 5 -A (assuming +20% error).
- 5 -c indicates a curve which has 20% smaller specific capacity values than those of 5 -A (assuming ⁇ 20% error).
- the same kind of prismatic Li-ion cell (the nominal capacity is 600 mAh) was used.
- the test cells were cycled 12 times by discharging at 600 mA (1.0 CmA) to 2.75V and charging in CC-CV mode at 600 mA (1.0 CmA) to 4.1V for 3 hr with intervals of 10 minutes between charge and discharge.
- equations were prepared by using 2 sets of data, 3 sets of data, 5 sets of data, 10 sets of data, 11 sets of data and 15 sets of data respectively for each of 0° C. and 25° C. Then, each equation was applied to the above mentioned experiment results so that maximum and minimum errors were obtained. Accordingly, the accuracy of the equation according to the number of data sets was verified.
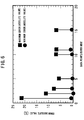
- FIG. 6 shows the number of data sets used for preparing the equations and widths of absolute value of error where the upper limit indicates the maximum error (absolute value) and the lower limit indicates the minimum error (absolute value).
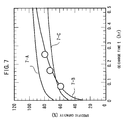
- FIG. 7 shows the relationship between the CC mode charge time and the specific capacities Cn/Co for the degraded cell.
- 7 -A indicates a curve represented by the equation.
- 7 -B which is shown for comparison, indicates a curve represented by the equation (2) prepared in the example 1-1.
- 7 -C indicates a curve which has 20% smaller specific capacity values than those of the equation (4), that is, a curve indicating error of ⁇ 20%.
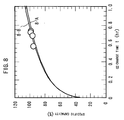
- FIG. 8 shows the relationship between the CC mode charge times and the specific capacities Cn/Co for the degraded cell.
- 8 -A indicates a curve representing the equation (5).
- 8 -B which is shown for comparison, indicates a curve representing the equation (2) prepared in the example 1-1.
- FIG. 9 is a table showing each charge period per one cycle used for preparing the equations of this example, the number of sets of data for each experiment, prepared equations and absolute values of estimation errors calculated by applying the equations.
- test cell was cycled under the same condition as above mentioned, except charge current of 46 mA (0.033 CmA) instead of 1400 mA (1.0 CmA), and charge limit voltage of 3.5V instead of 4.1V.
- charge current of 46 mA 0.033 CmA
- charge limit voltage 3.5V instead of 4.1V.
- FIG. 10 is a table showing each temperature for the lower temperature tests used for preparing the equations of this example, obtained equations, and absolute values of estimation errors calculated by applying the equations.
- the battery includes three prismatic Li-ion cells (nominal capacity of each is 600 mAh) which are connected in series.
- the charge limit voltage is 12.3V
- the charge current is 600 mA(1.0 CmA)
- charge-end current which is a threshold for ending charge is 60 mA.
- FIG. 11 shows a configuration of the charger according to this embodiment.
- the charger 20 is connected to a utility power source by terminals 22 and 23 .
- a Li-ion battery 24 can be connected to the charger 20 via terminals 25 and 26 for charging.
- the battery 24 is charged in the following way.
- the charger 20 converts current provided from the utility current source 21 into direct current by a rectifier 27 .
- the charger 20 controls the above mentioned charge conditions by using a power source microprocessor 29 and a charge control microprocessor 30 while monitoring charge current, battery voltage, and monitoring temperature by a thermistor 28 .
- the charger 20 performs control for detecting and avoiding overcharge, over discharge, abnormal large current, abnormal battery temperature increase and the like by using the power source microprocessor 29 and the charge control microprocessor 30 .
- the charge is stopped by a switch 31 when the charge is completed or when something abnormal is detected. Completion of charge or something abnormal is displayed to a display part 32 by using the charge control microprocessor 30 .
- the display part 32 includes LEDs (light-emitting diodes) which indicate a state of charge (red one is used for indicating a charging state, green one is used for indicating completion of charge), LEDs which indicate degradation estimation results (red one is used for indicating the cell should be replaced, yellow one is used for indicating the cell should be replaced shortly, green one is used for indicating replacement of the cell is not necessary) and an LCD (liquid crystal display) which displays the degradation estimation results numerically and abnormal events.
- the green LED illuminates only when the charge completes. During charge, the red LED illuminates. In other cases, that is, in abnormal cases, either of the LEDs does not illuminate.
- the red LED illuminates when the estimated specific capacity Ce/Co is smaller than 60%, which means that the battery should be replaced by a new battery.
- the yellow LED illuminates when the estimated specific capacity Ce/Co is equal to or larger than 60% and smaller than 70%, which indicates that the battery should be replaced within several months which depend on using condition.
- the green LED illuminates when the estimated specific capacity Ce/Co is larger than 70% since the battery is new or can be used for a long time which means that replacement of the battery is not necessary.
- the LCD liquid crystal display
- the LCD is provided for the sake of displaying information by characters. For example, faulty connection of the battery, alarm information on safety and the like are displayed on the LCD, by which it can be recognized that normal charge is difficult. In addition, degradation estimation results are shown on the LCD. Further, in the case that the utility power source stops to provide power unexpectedly, power is supplied from the battery placed in the charger so that information of the outage of the utility power source is displayed only when the voltage of the battery is higher than 8.25V.
- a program embodying the equation (2) and procedures shown in FIG. 12 is stored in the charge control microprocessor 30 beforehand.
- the degradation estimation is performed by measuring CC charge time t by the internal timer while monitoring the battery voltage and substituting the time t into the equation (2).
- the estimation result is displayed on the display part 32 .
- Data of change of charge voltage with respect to time is stored in the charge control microprocessor beforehand.
- the battery voltage is monitored from the start of charge.
- Time measuring is started from the time when the charge voltage becomes a voltage which is higher than the start voltage and is nearest to a value of 8.25+0.15 ⁇ n (n is an integer, 0 ⁇ n25) which is between or equal to 8.25V (2.75V/cell) and 12V (4.0V/cell) and increases in steps of 0.15V.
- an elapsed time t′′ until the charge voltage reaches the charge limit voltage 12.3V (until CC mode charge ends) is measured.
- the charge time t′′ from the above start voltage to 12.3 V is converted into the CC mode charge time t from 8.25 V to 12.3 V by using the voltage-profile data stored in the charge control microprocessor 30 .
- step B When the battery voltage reaches the value which satisfies the equation (6), time measuring is started. The time is counted until the battery voltage reaches the charge limit voltage 12.3V.
- step C When the battery voltage reaches the charge limit voltage 12.3V, the time measuring ends.
- the charge start voltage is the discharge cut-off voltage 8.25V, the measured time t is used for degradation estimation.
- step D When the charge start voltage is higher than 8.25V, the measured time is converted into the CC mode charge time taken for the battery voltage to change from 8.25V to 12.3V by comparing measured data with data of voltage change with respect to time which is stored beforehand. The converted time t is used for degradation estimation. The time t is substituted into the equation (2) so that the estimated specific capacity Ce/Co is calculated.
- step E The calculation result is displayed on the LCD and the LED. According to the estimated specific capacity, one of red, yellow and green LEDs illuminates. At the same time, a numeric value is displayed on the LCD. The value is displayed on the LCD for 30 seconds and the LED illuminates the charger is connected to the utility power source.
- Li-ion battery shown in FIG. 3 was manufactured.
- the Li-ion battery can be mounted in a portable information terminal which has a capability of performing the CC-CV mode charge on condition that the charge limit voltage is 12.3V, charge current is 600 mA(1.0 CmA) and the charge-end current is 60 mA.
- the battery includes three prismatic Li-ion cells (nominal capacity is 600 mAh) 12 - 1 , 12 - 2 , and 12 - 3 which are connected in series.
- the equation (2) and the data of change of charge voltage with respect to time as described in the example 1-7 are stored in the IC for protection such that the CC mode charge time taken for the charge voltage to change from 8.25V to 12.3V can be calculated even when the battery voltage at the charge start time is higher than the discharge cutoff voltage 8.25V.
- a program is stored in a memory in the IC 13 for protection. According to this program, following process is performed.
- the voltage across the cells is monitored by using Vcc and Vss.
- Time measuring is started from the time when the charge voltage becomes a voltage which is higher than a charge start voltage Vs and is nearest to a value of 8.25+0.15 ⁇ n (n is an integer, 0 ⁇ n ⁇ 25) which is higher than the charge start voltage Vs, wherein the charge start voltage Vs which is determined beforehand is equal to or higher than the discharge cut-off voltage Vdd and lower than the charge limit voltage Vc.
- an elapsed time t′′ until the charge voltage reaches the charge limit voltage 12.3V is measured.
- the time t′′ is converted into the CC mode charge time t taken for the voltage to change from 8.25V to 12.3V.
- the time t is substituted into the equation (2) so that the estimated specific capacity Ce/Co is calculated.
- the battery is configured such that the result is output to the body of the portable terminal in order to be displayed on an LCD of the portable terminal via the terminal 19 .
- a command for doing degradation estimation is provided from the body of the terminal concurrently with the start of charge.
- Procedures for performing the degradation estimation are the same as those shown in FIG. 12 except for the result to be sent to the body since the result is displayed on the display of the terminal.
- the battery was mounted in the portable information terminal and used for one hour. After that, charge of the battery was started by connecting the terminal to the utility power source. The estimation result of the battery was displayed as 87% right after the start of the charge. After checking that a sign of charge completion was displayed, the information terminal was powered off and the battery was removed from the terminal. Then, the battery was connected to the battery charge and discharge automatic test apparatus by using proper codes and the discharge capacity was measured by discharging the battery on condition that the discharge current was 600 mA(1.0 CmA) and the discharge cut-off voltage was 8.25V. The discharge capacity was 534.6 mAh, which is 89.1% in specific capacity. Thus, the error of estimation was ⁇ 2.1%.
- the capacity estimation method of the Li-ion cell according to the second embodiment includes the steps of:
- the constant current Ic is set to be smaller or equal to Co/(20 hours) in order to estimate the capacity of the cell accurately. If the charge is performed by using a current larger than this, error becomes large in capacity estimation by using the equation (7).
- the Li-ion cell which is a target of the capacity estimation of the present invention is a Li-ion cell which is used in a condition that each charge period is equal to or shorter than 30 days.
- the charge period is longer than 30 days, large estimation error may arise since degree of degradation due to overcharge may vary and degradation of cell component material with respect to time becomes outstanding.
- the charge voltage Vs at the time when time measuring is started is equal to or higher than the discharge cut-off voltage Vd and at least 0.2V lower than the charge limit voltage Vc.
- the difference between the voltage Vs and the charge limit voltage Vc is lower than 0.2V, measured time t becomes so short that large estimation error may occur.
- the equation of this embodiment is applied to capacity estimation only when cell degradation is such state that discharge capacity C is equal to or more than 50% of the nominal capacity Co, wherein the discharge capacity C is obtained by integrating discharge current with respect to time when discharging from full charge state to the discharge cut-off voltage Vd.
- the discharge capacity C is obtained by integrating discharge current with respect to time when discharging from full charge state to the discharge cut-off voltage Vd.
- the equation (7) represents relationship between the time t in the constant current (CC) mode charge in a charge condition of an apparatus mounting the Li-ion cell or a charger to which the equation is applied and an estimated specific capacity Ce/Co under the charge condition.
- the time t is obtained under each charge condition beforehand. Then, after obtaining a ratio te/tm wherein the time te is obtained under the condition for preparing the equation (7) and the time tm is obtained under a condition which corresponds to the apparatus or the charger, a result of multiplying measured time by the ratio te/tm is substituted into the equation (7). The reason is the same as one explained in the first embodiment.
- the positive constants A and B are calculated by the steps of:
- the charge and discharge cycle includes a charge period from 3 days to 10 days by the CC-CV charge method, a discharge period, a rest period provided between the charge period and the discharge period as necessary, wherein charge current in the charge period is equal to or smaller than Co/(20 hours), discharge current in the discharge period is from Co/(5 hours) to Co/(0.5 hour) and a predetermined discharge cut-off voltage Vd is used in the discharge period;
- a cell or a battery which is the same kind as the Li-ion cell for which capacity is estimated is used.
- Charge is performed by the CC-CV charge method in which the cell is charged by using a constant current equal to or smaller than 0.05 CmA (Co/20 hours) until the charge voltage reaches the charge limit voltage Vc, after that, the charge is continued by using a constant voltage.
- Charge period is set to be from 3 days to 30 days.
- discharge current is set to be from 2 CmA to 20 CmA (from Co/5 hours to Co/0.5 hour) and the discharge cut-off voltage Vd is set to be the same as that of the cell for which capacity is estimated. A rest is provided between charge and discharge as necessary.
- the cycle is repeated equal to or more than three times. Then, an elapsed time tn from the instant when charge voltage in CC charge reaches a predetermined voltage Vs to the instant when the CC mode charge ends (when the charge voltage reaches a charge limit voltage Vc) and discharge capacity Cn in each cycle are recorded, wherein Vs is between Vd and (Vc-0.2V) and Cn is obtained by integrating discharge current with respect to time. Then, values of the constants A and B are determined from the elapsed time tn and the discharge capacity Cn.
- Charge period per one cycle is set to be from 3 days to 30 days. By setting the charge period like this, cell degradation per one cycle proceeds properly so that data necessary for preparing the equation (7) accurately can be obtained efficiently. If the charge period per one cycle exceeds 30 days, degree of degradation due to overcharge becomes large and degree of degradation of cell component material with respect to time becomes large. Thus, the relationship between the time tn and the specific capacity Cn/Co does not become linear relationship which is represented by the equation (7) (assuming that Cn/Co is substituted for the left side and that tn is substituted into t in the right side). Therefore, large error may occur by using the equation in which the constants A and B are determined by such data.
- Discharge current in the charge and discharge cycle is set to be from 0.2 CmA to 2.0 CmA.
- the discharge current is set from 1.0 CmA to 2.0 CmA, data can be obtained more efficiently.
- the discharge current is smaller than 0.2 CmA, it takes much time to discharge completely, which i not favorable.
- the discharge current is larger than 2.0 CmA, the time taken for discharge becomes so short that measured values of discharge capacity may vary and the capacity decreases abruptly when degradation proceeds. Thus, the equation (7) is not prepared accurately, which is not favorable.
- Temperature conditions under which the charge and discharge cycle experiment is performed are not particularly determined. However, it is favorable that the experiment is performed under temperature range which the manufacturer recommends as temperature range of the Li-ion cell, or under the same temperature as that under which the Li-ion cell is actually used. When the temperature for the experiment is different from the temperature of actual use vary much, the capacity is corrected by using data representing relationship between discharge capacity and temperature.
- the apparatus includes:
- [0246] means for obtaining, when the Li-ion cell is charged by a CC-CV charge method, an elapsed time t from the instant when charge voltage in CC charge reaches a predetermined voltage Vs to the instant when the charge voltage reaches a charge limit voltage Vc;
- an arithmetic circuit for calculating an estimated specific capacity Ce/Co of the Li-ion cell by using an equation Ce/Co At+B, wherein Ce is an estimated capacity of the Li-ion cell, Co is a nominal capacity of the Li-ion cell, and A and B are positive constants;
- [0249] means for displaying estimation result obtained by the circuit for estimating, or, generating an alarm which warns of degradation of the Li-ion cell.
- the degradation estimation apparatus for example, the apparatus described in the first embodiment with reference to FIG. 2 can be used. In this embodiment, the equation (7) is used.
- the capacity estimation method of the present invention for the Li-ion cell can be applied to a battery by providing a control microprocessor and additional memory as necessary in the battery.
- the battery shown in FIG. 3 is an example of the battery to which this capacity estimation method is applied.
- the equation (7) is used. By using the equation (7), capacity estimation can be realized by simpler calculation.
- the degradation estimation method and the Li-ion battery which includes the degradation estimation capability of the present invention can be applied to apparatuses for which high reliability is required such as a backup power source.
- the present invention By applying the present invention to the apparatuses, degradation status of cells can be grasped properly and-the cells can be exchanged in a timely fashion so that troubles of the apparatuses can be avoided.
- apparatuses which use Li-ion cells adopts the degradation estimation method or the Li-ion battery which has the degradation estimation capability. Accordingly, cells can be exchanged with minimum waste so that the present invention can be used very advantageously.
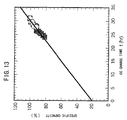
- FIG. 13 shows obtained data.
- FIG. 13 shows relationship between the elapsed times t and the specific capacities C/Co which are obtained by the charge and discharge cycle experiment. “ ⁇ ” in this figure shows the obtained data.
- the constants A and B in the equation (1) which is a function of t and which represents the estimated specific capacity Ce/Co are obtained by using the data so that a following equation (8) is prepared.
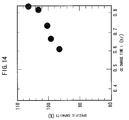
- FIG. 14 shows relationship between obtained specific capacity C/Co and the time t elapsed until the CC mode charge ended. “ ⁇ ” in this figure shows obtained data.
- the specific capacity C/Co is not linearly related to the time t, which means that accurate equation can not be prepared.
- a prismatic cell (the nominal capacity was 600 mAh) was removed from a cellular phone and set in the cell charge and discharge automatic test apparatus by connecting each of the cathode terminal and anode terminal to the apparatus. Then, the cell was charged in CC-CV mode at 20 mA (0.033 CmA) to 4.1V for one day. After one hour rest, the cell was discharged at 600 mA (1.0 CmA) to 2.75V. Then, the time t (hr) taken for the CC charge and ratio of the discharge capacity C to the nominal capacity, that is, the specific capacity C/Co were obtained. According to this experiment, the time t was 15.31 hours and the specific capacity C/Co was 63.5%.
- the estimated specific capacity Ce/Co for the equation (10) corresponding to 3 day charge is 74.1%
- the estimated specific capacity Ce/Co for the equation (11) corresponding to 30 day charge is 72.3%
- the estimated error Err is ⁇ 10.6% and ⁇ 8.8% respectively. Both of the errors are within ⁇ 20%.
- the estimated specific capacity Ce/Co was 90.8% and the estimated error Err was ⁇ 27.3%, which revealed that a good equation can not be obtained from data of only two cycles.
- a Li-ion battery which was used in a laptop computer was disassembled and a cylindrical Li-ion cell (18650 type, the nominal capacity was 1350 mAh) was removed. Then, leads are soldered to the cathode terminal and the cell side (anode), and the Li-ion cell was set in the cell charge and discharge automatic test apparatus. Then, the cell was charged in CC-CV mode at 45 mA (0.033 CmA) to 4.1V for one day. After one hour rest, the cell was discharged at 1350 mA (1.0 CmA) to 2.75V. Then, the time t (hr) taken for the CC charge and ratio of the discharge capacity C to the nominal capacity Co, that is, the specific capacity C/Co were obtained. According to this experiment, the time t was 19.34 hours and the specific capacity C/Co was 0.671.
- the estimated specific capacity Ce/Co obtained by the equation (15) corresponding to 0.2 CmA discharge current was 72.3% and the estimated error Err was ⁇ 5.2%.
- the estimated specific capacity Ce/Co obtained by the equation (16) corresponding to 2.0 CmA discharge current is 76.8%, and the estimated error Err was 9.7%.
- the discharge current used for the experiment for obtaining the equation was from 0.2 CmA to 2.0 CmA.
- the estimated specific capacity was 90.5% and the estimated error was ⁇ 23.4%.
- a charger which charges a battery by using the CC-CV charge method and performs capacity and degradation estimation of the battery was manufactured and will be shown.
- the battery includes three cylindrical Li-ion cells (18650 type, nominal capacity of each is 1350 mAh) which are connected in series.
- the charge limit voltage is 12.3V
- the charge current is 45 mA(0.033 CmA)
- the total charge period is 3 days.
- a configuration of this charger is the same as that shown in FIG. 11. In this embodiment, the equation (8) is used.
- Data of change of charge voltage with respect to time is stored in the charge control microprocessor beforehand.
- the battery voltage is monitored from the start of charge.
- Time measuring is started from the time when the charge voltage becomes a voltage which is higher than the start voltage and is nearest to a value in four values between or equal to 8.25V (2.75V/cell) and 11.7V (3.9V/cell which is 0.2V/cell lower than the charge limit voltage 4.1V/cell) increasing in steps of 1.15V, that is, 8.25V, 9.40V, 10.55V, and 11.70V.
- an elapsed time t′′ until the charge voltage reaches the charge limit voltage 12.3V, that is, until the CC mode charge ends is measured.
- the time t′′ is converted into the CC mode charge time t elapsing between the time when the voltage is 8.25V and when the voltage is 12.3V by performing comparison calculation using the stored data.
- step B When the battery voltage V reaches any one of the values, time measuring is started. The time is counted until the battery voltage reaches the charge limit voltage 12.3V.
- step C When the battery voltage V reaches the charge limit voltage 12.3V, the time measuring ends.
- the charge start voltage is the discharge cut-off voltage 8.25V, the measured time t is used for degradation estimation.
- step D When the charge start voltage is higher than 8.25V, the measured time is converted into the CC mode charge time required for the battery voltage to change from 8.25V to 12.3V by comparing measured data with data of voltage change with respect to time which is stored beforehand. The converted time t is used for degradation estimation. The time t is substituted into the equation (8) so that the estimated specific capacity Ce/Co is calculated.
- step E The calculation result is displayed on the LCD and the LED. According to the estimated specific capacity, one of red, yellow and green LEDs illuminates. At the same time, a numeric value is displayed on the LCD. The value is displayed on the LCD for 30 seconds and the LED illuminates while the charger is connected to the utility power source.
- the charged battery was mounted in the battery charge and discharge automatic test apparatus so that constant current discharge was performed wherein the discharge current was set to be 1350 mA(1.0 CmA) and the discharge cut-off voltage was set to be 8.25V.
- the discharge capacity was 860.0 mAh according to this test. This value is equivalent to 63.7% as specific capacity, which revealed that the error of capacity estimation was about 1.7%.
- a Li-ion battery which is mounted in a laptop computer was manufactured.
- the configuration is the same as that shown in FIG. 3.
- the Li-ion battery has a capability of performing the CC-CV charge mode charge on condition that the charge limit voltage is 12.3V, charge current is 45 mA(0.033 CmA) and the total charge period is 3 days.
- the battery includes three cylindrical Li-ion cells (nominal capacity is 1350 mAh) 12 - 1 , 12 - 2 , and 12 - 3 which are connected in series.
- the equation (8) and the basic data of change in charge voltage with respect to time as described in the example 2-4 are stored in the IC for protection such that the time of CC mode charging from 8.25V to 12.3V can be calculated even when the battery voltage at the charge start time is higher than the discharge cutoff voltage 8.25V.
- a program is stored in a memory in the IC 13 for protection. According to this program, following process is performed. The voltage across the cells is monitored. Time measuring is started from the time when the charge voltage becomes a voltage which is higher than a charge start voltage Vs and is nearest to a value in 8.25V, 9.40.V, 10.55V, or 11.70V, wherein the charge start voltage Vs which is determined beforehand is equal to or higher than the discharge cut-off voltage Vd and lower than the charge limit voltage Vc. Then, an elapsed time t′′ until the charge voltage reaches the charge limit voltage 12.3V is measured. After that, the time t′′ is converted into the CC mode charge time t required for the voltage to change from 8.25V to 12.3V. The time t is substituted into the equation (8) so that the estimated specific capacity Ce/Co is calculated.
- the battery is configured such that the result is output to the body of the laptop computer in order to be displayed on an LCD of the laptop computer via the terminal 19 .
- a command for doing degradation estimation is provided from the body of the laptop computer concurrently with the start of charge.
- Procedures for performing the degradation estimation are the same as those shown in FIG. 16 except for the result to be sent to the body since the result is displayed on the display of the laptop computer.
- the battery was mounted in the laptop computer and used for one hour. After that, charge of the battery was started by connecting the computer to the utility power source. The estimation result of the battery was displayed as 73% after the start of the charge. After checking that a sign of charge completion was displayed, the laptop computer was powered off and the battery was removed from the laptop computer. Then, the battery was connected to the battery charge and discharge automatic test apparatus by using proper codes and the discharge capacity was measured by discharging the battery at 1350 mA(1.0 CmA) to 8.25V. As a result, the discharge capacity was 1093.5 mAh, which means that the specific capacity was 81.0%. Thus, the error of estimation was ⁇ 8.0%.
- the capacity estimation method and the degradation estimation method using the current value after a lapse of a predetermined time in the constant voltage mode (in the following, the constant voltage mode will be called as CV mode) and the time taken for charge current to decrease to a predetermined current will be described, wherein 1 ⁇ 2 can be used as the predetermined time and 5 minutes can be used as the predetermined current.
- CV mode constant voltage mode
- the Li-ion battery and apparatuses which include these capabilities will be described.
- the capacity estimation method and the degradation estimation method, a Li-ion battery and apparatuses which can estimate capacity and degradation according to these methods will be described.
- charge of a Li-ion cell or a Li-ion battery is performed in which the CC-CV charge method is used.
- the CC-CV charge method As mentioned before, in the constant current and constant voltage (CC-CV) method, the Li-ion cell or the Li-ion battery is charged at a constant current until the cell voltage becomes a predetermined charge limit voltage, after that, the Li-ion cell or the Li-ion battery is charged while the voltage is kept constant.
- the constant current mode in the following, the constant current mode will be called as CC mode
- required time for the charge current to decrease to a value, for example 1 ⁇ 2 of the initial current of the CV mode is measured.
- the charge voltage after a lapse of a predetermined time, for example 5 minuets, since the CV mode charge starts is measured. The measured time or voltage is used for the estimation.
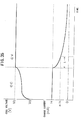
- FIG. 17 shows change of the cell voltage V and the charge current Ic with respect to time when the Li-ion cell is charged by the CC-CV charge method.
- the charge limit voltage Vc is from 4.1V/cell to 4.2V/cell (/cell means per once cell)
- the charge current is from 0.033 CmA to 1.0 CmA
- the discharge cut-off voltage is from 2.75V/cell to 3.0V/cell
- the inventors repeated charge and discharge cycle several times in which each cycle included one charge process and one discharge process.
- the Li-ion cell was charged at the constant current Ic0 until the cell voltage reached the predetermined charge limit voltage Vc.
- the discharge process the Li-ion cell after the charge process was discharged, which corresponds to a process in which the cell is used for a power source.
- the inventors conducted a close study of correlations between the discharge capacity Cd (will be called capacity in the following) which was obtained by integrating discharge current with respect to time and variations of charge current in the CV mode (will be called CV charge in the following).
- CV charge in the following variations of charge current in the following
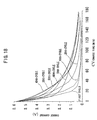
- FIG. 18 shows variations of the charge current in the CV charge with time per one cycle.
- the charge current decreases with time in any cycle, and, the decreasing speed simply descends until 40th cycle.
- decreasing of charge current is faster than that of 40th cycle in initial stage of CV charge process, after the initial stage, decreasing of charge current becomes slower with time. That is, as shown in FIG. 18, the decreasing pattern in a cycle after the 40th cycle is different from that before the 40th cycle.
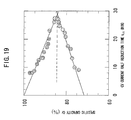
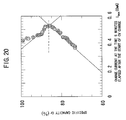
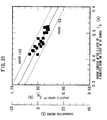
- FIG. 20 shows relationship between charge current I 5min at the instant when a predetermined time (5 minutes in the figure) elapses since CV charge starts and the specific capacity Cr.
- N′ is a positive constant
- capacity estimation and degradation estimation are performed by using equations generalized from the equations (18′) and (19′).
- capacity estimation and degradation estimation are performed by using equations generalized from the equations (20′) and (21′).
- the charge current I tm at the time when a predetermined time tm elapses since the charge mode is changed to the CV mode when the cell voltage V reaches the charge limit voltage Vc is measured, wherein 0 ⁇ tm ⁇ 0.8Co/Ic0 and Co is the nominal capacity of the cell.
- the specific capacity Cr is estimated by using an equation
- tm there is a favorable range of tm in order to perform accurate estimation. As is evident from FIG. 20, 5 minute is within the favorable range of tm. As will be described in following examples, for example, in the example 3-5, the favorable range is from 1 minute to 15 minute. As mentioned above, tm should satisfy an inequality 0 ⁇ tm ⁇ 0.8 Co/Ic0. As described later, the maximum value of Ic0 is 1.0 CmA. Even when Ic0 is the maximum, the inequality becomes 0 ⁇ tm ⁇ 48 minutes. Thus, the above mentioned favorable range of tm satisfies this inequality.
- the Li-ion cell needs to be charged by current from 0.033 CmA to 1.0 CmA.
- the current is smaller than 0.033 CmA, charge is not fully performed and an effect of self-discharge can not be neglected so that the specific capacity calculated by the equations (18), (19), (20) and (21) becomes different from an actual specific capacity, which is not favorable for capacity estimation and degradation estimation.
- the charge current is larger than 1.0 CmA, the necessary time for charge is short so that measured time may include large error and variations of charge time due to degradation may differ, which is also not favorable for capacity estimation and degradation estimation of the present invention.
- charge current values which are applied to almost all apparatuses mounting the Li-ion cell and chargers are within the above mentioned range.
- Apparatuses and chargers which adopt a current value which is out of the range are used only for very limited use such as in a case when very high rate charge is required in an emergency. These apparatuses and chargers hardly requires the capacity estimation method of the present invention.
- the equations (18), (19), (20) and (21) represent relationship between the necessary time t ⁇ for the charge current to become a times from the start of the CV mode charge in a charge condition of an apparatus using Li-ion cell to which the equations are applied and the specific capacity Cr under the condition, or, represent relationship between the charge current I tm after a lapse of a predetermined time from the start of CV charge and the specific capacity Cr.
- the charge current I tm in the equations (20) and (21) used for capacity estimation and degradation estimation of the Li-ion cell is monitored after a laps of the time tm from 1 minute to 15 minuets since the CV mode charge starts.
- tm is shorter than 1 minute, variation of the charge current is very susceptible to the state in the cell so that error may occur in measuring current.
- tm is longer than 15 minutes, the relationship between the charge current I tm and the specific capacity Cr hardly become the symmetric shape with respect to the cusp so that error in estimation becomes large, which is not favorable.
- the method includes the steps of:
- charge period per one cycle is from 3 hours to 10 days or from 3 days to 10 days favorably, discharge current Id is from 0.2 CmA to 2.0 CmA, ambient temperature is from 0° C. to 45° C. or from 15° C. to 30° C. which is more favorable;
- the charge period per one cycle is set to be from 3 hours to 10 days. Accordingly, cell degradation per cycle progresses properly so that data for preparing the equation (18) or (20) accurately can be obtained effectively. Particularly, it is favorable that the charge period is set to be from 3 days to 10 days since, by using this range, capacity decrease can be recognized clearly so that data for preparing the equation (18) or (20) can be collected effectively, in addition, an equation by which accurate estimation is realized can be obtained as shown in an example 3-2.
- the discharge current in the charge and discharge cycle experiment is set to be from 0.2 CmA to 2.0 CmA.
- the lower limit of the charge current is change to 1.0 CmA, that is, when the charge current is set to be from 1.0 CmA to 2.0 CmA, data can be obtained more effectively.
- the charge current is smaller than 0.2 CmA since it take much time to be discharge completely.
- the discharge current is larger than 2.0 CmA, the time required for the discharge becomes so short that measured values of discharge capacity C may vary, in addition, the capacity C decreases suddenly when degradation progresses. Thus, it is not favorable that it becomes impossible to generate the equation (18) and (20) accurately.
- the necessary time t ⁇ for the charge current to decrease to a times (0 ⁇ 1) from the time when the CC mode changes to the CV mode and specific capacity percentage Cr which is a ratio of the discharge capacity Cd to the nominal capacity Co are measured for each charge and discharge cycle, wherein the discharge capacity Cd is obtained by integrating discharge current with respect to time. Then, relationship between the measured time t ⁇ and the specific capacity Cr is plotted. Then, the constants A and B are determined such that the equation (18) approximates the relationship accurately.
- the capacity estimation method and the degradation estimation method for the Li-ion cell using the equations (18), (19), (20) and (21) can be applied to various apparatuses which have a function for charging mounted cells by the CC-CV charge method wherein the apparatuses mount the Li-ion cells as a power source or a backup power source.
- the apparatuses to which the capacity estimation method and the degradation estimation method are applied for example, the apparatus described in the first embodiment with reference to FIG. 2 can be used.
- the equations (18′) and (19′) are input in an available memory in the CPU 7 and the like beforehand, or, in an IC memory which is added as necessary.
- the CPU 7 provide instructions for measuring the time t 1 ⁇ 2 for the charge current to decrease to half from the instant when the charge mode changes from the CC mode to the CV mode.
- the CPU 7 receives and stores the time t 1 ⁇ 2 measured by the control part 5 .
- the CPU 7 substitute the time t 1 ⁇ 2 into the equation (18′) or (19′) to perform capacity estimation and degradation estimation according to the first method of capacity estimation and degradation estimation and calculate the result.
- the result is stored in the memory 8 as necessary.
- the result of degradation estimation is applied to the body of the apparatus via the line 10 such as a system management bus.
- the body of the apparatus displays the estimation result to a display part of the apparatus and sounds an alert by using a beep as necessary.
- the apparatus which includes capabilities for performing the capacity estimation method and the degradation estimation method for the Li-ion cell according to the present invention.
- the Li-ion cell power source apparatus which includes capacity estimation capability and degradation estimation capability can be realized.
- the configuration is not limited to the above mentioned one as long as the capacity estimation and the degradation estimation of the Li-ion cell can be performed according to the present invention.
- the Li-ion cell power source apparatus which performs capacity estimation and degradation estimation by using the equations (18) and (19) or equations (20) and (21) can be realized by modifying calculation way in the CPU 7 and measurement targets in the control part 5 in the configuration shown in FIG. 2.
- the capacity estimation method and the degradation estimation method for the Li-ion cell in the third embodiment can be also applied to a battery by providing a control microprocessor and additional memory as necessary.
- An example of such a battery is shown in FIG. 3.
- a timer is provided in the IC 13 for protection of safety mechanism and the equations (18′) and (19 ) are input in an available memory.
- the IC 13 for protection monitors the voltage across the Li-ion cells 12 - 1 , 12 - 2 , and 12 - 3 .
- the time t 1 ⁇ 2 for the charge current to decrease to half from the instant when the charge mode changes from the CC mode to the CV mode is counted and stored.
- the time t 1 ⁇ 2 is substituted into the equations (18′) and (19′) to calculate the specific capacity Cr.
- An additional IC can be provided other than the IC 13 for protection at a proper position in the battery as necessary.
- the result of degradation estimation is output to the body of the apparatus which mounts the battery 11 .
- the body of the apparatus displays the estimation result to a display or sounds an alert by using a beep.
- the Li-ion battery which includes the degradation estimation capability of the present invention can be realized from an existing Li-ion battery with a minimum modification.
- the configuration is not limited to the above mentioned one as long as the capacity estimation and the degradation estimation of the Li-ion cell can be performed according to the present invention.
- the Li-ion cell battery which performs capacity estimation and degradation estimation by using the equations (18) and (19) or equations (20) and (21) can be realized by modifying calculation way in the IC for protection and measurement targets for performing capacity estimation and degradation estimation of the cell.
- the capacity estimation method and the degradation estimation method and the Li-ion battery which includes the capacity estimation capability and the degradation estimation capability of the present invention can be applied to apparatuses for which high reliability is required.
- the present invention By applying the present invention to the apparatuses, degradation status of cells can be grasped properly and the cells can be exchanged in a timely fashion so that troubles of the apparatuses can be avoided.
- any apparatus which use Li-ion cells adopts the degradation estimation method or the Li-ion battery which has the degradation estimation capability. Accordingly, cells can be exchanged with minimum waste so that the present invention can be used very advantageously.
- a used prismatic Li-ion cell (the nominal capacity was 600 mAh) was used.
- the used cell was cycled by discharging at 600 mA (1.0 CmA) to 2.75V and charging in CC-CV mode at 600 mA (1.0 CmA) to 4.1V for 3 hours with intervals of 10 minutes between charge and discharge.
- FIG. 21 shows relationship between the time t 1 ⁇ 2 and the specific capacity Cr.
- 21 - 1 indicates a line which represents the equation (22)
- 21-2 indicates data (measurement point) of the 9th cycle
- 21 - 3 indicates a line which represents the equation (23).
- 21 - 4 and 21 - 5 indicate lines which represent ⁇ 10% (that is, error of ⁇ 10%) of the estimated capacity obtained by the equation (22).
- 21 - 6 and 21 - 7 are lines which represent ⁇ 10% of the estimated capacity obtained by the equation (23).
- Equations I shown in FIG. 22 were obtained from data of the time t 1 ⁇ 2 (hr) and the specific capacity Cr which was obtained from 4th cycle till 10th cycle.
- t is used as “t 1 ⁇ 2 ”
- C is used as “Cr”.
- symbols shown in FIG. 23 which represent measurement points used for obtaining the equations I are indicated.
- a used prismatic Li-ion cell (the nominal capacity was 600 mAh) was used.
- the used cell was cycled 45 times by discharging at 600 mA (1.0 CmA) to 2.75V and charging in CC-CV mode at 600 mA (1.0 CmA) to 4.1V for 3 hours with intervals of 10 minutes between charge and discharge.
- the test was done at ambient temperature.
- FIG. 23 shows relationship between the time t 1 ⁇ 2 and the specific capacity Cr.
- points of measurement data until 45th cycle are indicated by closed circles (gray circles).
- FIG. 23 points of experiment data for preparing the equations I shown in FIG. 22 and lines representing the equations I are shown in which the points of experiment data are indicated by symbols shown in FIG. 22.
- 23 - 1 indicates a line which represents the equation I prepared by data of 2 hour charge period
- 23 - 2 indicates a line which represents the equation I prepared by data of 3 hour charge period
- 23 - 3 indicates a line which represents the equation I prepared by data of 3 day charge period
- 23 - 4 indicates a line which represents the equation I prepared by data of 7 day charge period
- 23 - 5 indicates a line which represents the equation I prepared by data of 10 day charge period
- 23 - 6 indicates a line which represents the equation I prepared by data of 11 day charge period.
- 23 - 7 indicates a measurement point (corresponding to the cusp) in which the time t 1 ⁇ 2 is the maximum, and lines representing the equations II which were prepared by using the maximum value are shown.
- 23 - 8 indicates a line which represents the equation II prepared by data of 2 hour charge period
- 23 - 9 indicates a line which represents the equation II prepared by data of 3 hour charge period
- 23 - 10 indicates a line which represents the equation II prepared by data of 3 day charge period
- 23 - 11 indicates a line which represents the equation II prepared by data of 7 day charge period
- 23 - 12 indicates a line which represents the equation II prepared by data of 10 day charge period
- 23 - 12 indicates a line which represents the equation II prepared by data of 11 day charge period
- the estimated specific capacity was calculated by substituting the time t 1 ⁇ 2 into each equation I and maximum error between the estimated specific capacity and actual measurement specific capacity was obtained.
- the maximum error for each equation I is shown in FIG. 22. As shown in FIG. 22, when the charge period was 7 days, the maximum error was minimum.
- estimated specific capacity was calculated from the equation II when the time t 1 ⁇ 2 was 0.1 hr and difference in the estimated specific capacity with reference to the equation II corresponding to 7 day charge period is shown as maximum error for each equation II in FIG. 22.
- FIG. 24 shows the relationship between the necessary time t 1 ⁇ 2 (hr) from the start of the CV charge mode until the charge current decreases to half and the specific capacity Cr.
- the closed circles indicate actual measurement data for the used prismatic cell obtained in the example 3-2
- 24 - 1 indicates a line which represents the equation prepared by measurement data from first cycle to 4th cycle
- 24 - 2 indicates a line which represents the equation prepared by measurement data of 4th cycle and 5th cycle
- 24 - 3 indicates a line which represents the equation prepared by measurement data from 4th cycle to 6th cycle
- 24 - 4 indicates a line which represents the equation prepared by measurement data from 4th cycle to 10th cycle.
- symbols of measurement data which were used for obtaining the equations and cycles corresponding to the symbols are shown.
- the maximum error of the specific capacity calculated by the equation prepared from data from first cycle till 4th cycle against actual measurement data is 43.5%, which is not favorable since it exceeds ⁇ 20%.
- a following equation (24) was obtained from data of the charge current I 5min (CmA) after a lapse of 5 minutes from the start of the CV mode charge and the specific capacity Cr(%) obtained by the cycles from 4th cycle to 10th cycle.
- I 5min indicates the maximum value at 30th cycle. After that, I 5min decreased as the number of repetitions of the cycle increased.
- FIG. 25 shows the relationship between the charge current I 5min (CmA) after a lapse of 5 minutes from the start of the CV mode charge and the specific capacity Cr(%).
- the closed circles (gray circles) indicate actual measurement data for the used prismatic cell.
- Closed (black) rectangles indicate measurement data points obtained by cycles for preparing the equations (24) and (25).
- 25 - 1 indicates a line which represents the equation (24)
- 25 - 3 indicates a line which represents the equation (25) which was prepared by deciding the constants from the cusp 25 - 2 (a point in which I 5min takes the maximum value) in measurement data.
- FIG. 26 shows measurement data obtained by the experiment and lines representing equations prepared from the charge currents (I 30sec , I 1min , I 5min , I 15min , and I 20min ) from 4th cycle till 10th cycle and the specific capacities Cr.
- 26 - 1 indicates a line prepared from the charge current I 30sec after 30 seconds from the start of CV charge
- 26 - 2 indicates a line prepared from the charge current I 1min after 1 minute from the start of CV charge
- 26 - 3 indicates a line prepared from the charge current I 5min after 5 minute from the start of CV charge
- 26 - 4 indicates a line prepared from the charge current I 15min after 15 minute from the start of CV charge
- 26 - 5 indicates a line prepared from the charge current I 20min after 20 minute from the start of CV charge.
- the lapse time from the start of the CV charge to the charge current measuring time, and the corresponding measurement data symbols are shown.
- the battery includes three prismatic Li-ion cells (nominal capacity of each is 600 mAh) which are connected in series.
- the charge limit voltage is 12.3V
- the charge current is 600 mA(1.0 CmA)
- charge-end current which is a threshold for ending charge is 60 mA(0.05 CmA).
- the charger has capabilities for performing capacity estimation and degradation estimation in which cell life estimation criterion Ck is 360 mAh(60% of the nominal capacity) according to the present invention. That is, the charger includes the degradation estimation apparatus for the Li-ion cell of the present invention.
- the configuration of the battery is the same as that shown in FIG. 11.
- FIGS. 27 and 28 are continuation of FIG. 27.
- step A The CC charge is started by placing the battery in the charger so that the battery voltage is monitored.
- the charge mode is changed to the CV mode at the time when the battery voltage reaches the charge limit voltage 12.3V(4.1V/cell). Then, when total charge capacity exceeds three times of the nominal capacity, time measuring for capacity estimation and degradation estimation is started. At the same time, the charge current is monitored.
- step B When the charge current reaches 300 mA(0.5 CmA), the time measuring ends. The elapsed time t 1 ⁇ 2 (hr) from the instant when the charge voltage reaches the charge limit voltage to the instant when the charge current reaches 300 mA is recorded.
- the specific capacity Cr(%) (this is indicated by Cb) is obtained by substituting t 1 ⁇ 2 b into the equation (22).
- step D The calculation result is displayed on the LCD and the LED. According to the estimated specific capacity, one of red, yellow and green LEDs illuminates. At the same time, a numeric value is displayed on the LCD. The value is displayed on the LCD for 30 seconds and the LED illuminates while the charger is connected to the utility power source.
- a program including the equation (22) prepared in the example 3-1 and the steps shown in FIGS. 27 and 28 are stored in the charge be control microprocessor 30 beforehand. While monitoring of the battery voltage and the charge current, the internal timer measures the time t 1 ⁇ 2 elapsed from the time the battery voltage reaches 12.3 V, that is, from the time the charge mode changes from the CC mode to the CV mode until the charge current decreases to 1 ⁇ 2 (300 mA). Then, capacity estimation and degradation estimation of the Li-ion battery is performed by applying the time t 1 ⁇ 2 to the equation (22) or (23′) so that the estimated capacity and the result of degradation estimation are displayed on the display part 32.
- the charger of this embodiment displays a timer on the LCD such that the charge time of the battery can be recognized.
- the charged battery was mounted in the battery charge and discharge automatic test apparatus so that constant current discharge was performed wherein the discharge current was set to be 600 mA(1.0 CmA) and the discharge cut-off voltage was set to be 8.25V.
- the discharge capacity was 534 mAh according to this test. This value is equivalent to 89% as specific capacity, which revealed that the error of capacity estimation was about 3%.
- the charger having capabilities of capacity estimation and degradation estimation of the present invention can estimate capacity with high accuracy, thus, can estimate degradation with high accuracy.
- the charge control microprocessor forms the degradation estimation apparatus of the Li-ion battery of the present invention.
- an degradation estimation apparatus which can perform the degradation estimation of the Li-ion battery with high accuracy.
- a Li-ion battery which can be mounted in a portable information terminal was manufactured.
- the configuration is the same as that shown in FIG. 3.
- the Li-ion battery has a capability of performing the CC-CV method charge on condition that the charge limit voltage is 12.3V, charge current is 600 mA(1.0 CmA) and the charge end current is 60 mA.
- the battery includes three prismatic Li-ion cells (nominal capacity is 600 mAh) 12 - 1 , 12 - 2 , and 12 - 3 which are connected in series.
- the equation (22) is stored in the IC for protection beforehand.
- a program is stored in a memory in the IC 13 for protection. According to this program, following process is performed.
- the voltage across the cells 12 - 1 , 12 - 2 , and 12 - 3 is monitored by Vcc and Vss.
- the charge voltage is monitored and the elapsed time t 1 ⁇ 2 from the time when the voltage becomes the charge limit voltage 12.3V(4.1V/cell), that is, from the time when the charge mode changes from the CC mode to the CV mode to the time the charge current decreases to 1 ⁇ 2 (300 mA(0.5 CmA)) is measured.
- the time t 1 ⁇ 2 is substituted into the equation (22).
- the equation (23′) described in the example 3-6 is prepared and t 1 ⁇ 2 is substituted into the equation (23′).
- the specific capacity Cr is calculated.
- the battery is configured such that the result is output to the body of the portable terminal in order to be displayed on an LCD of the portable terminal via the terminal 19 .
- a numerical value indicating the degradation estimation result is displayed as % and a bar in which a part of the bar corresponding to the % value ratio is-colored is displayed.
- a command for doing degradation estimation is provided from the body of the portable terminal concurrently with the start of charge.
- Procedures for performing the degradation estimation are the same as those shown in FIGS. 27 and 28 except for the result to be sent to the body since the result is displayed on the display of the portable terminal.
- the battery was mounted in the portable information terminal and used for one hour. After that, charge of the battery was started by connecting the terminal to the utility power source. The estimated specific capacity of the battery was displayed as 86% after the start of the charge. After checking that a sign of charge completion was displayed, the information terminal was powered off and the battery was removed from the terminal. Then, the battery was connected to the battery charge and discharge automatic test apparatus by using proper codes and the discharge capacity was measured by discharging the battery at 600 mA(1.0 CmA) to 8.25V(2.75V/cell). As a result, the discharge capacity was 501 mAh, which means that the specific capacity was 83.5%.
- This battery is also the Li-ion battery which includes the degradation estimation capability of the present invention. Since degradation estimation by the degradation estimation capability is performed on the basis of the capacity estimation capability having high accuracy, this battery can be the to be a Li-ion battery having accurate degradation estimation capability.
- the charge current after a lapse of a time in the CV charge mode may not indicate the maximum value with respect to -capacity variation depending on the charge current, the discharge current, cell use period and the like, or, the time for the charge current to become half may not indicate the maximum value.
- simpler capacity estimation methods and degradation estimation methods for such cases will be described as the fourth embodiment and the fifth embodiment in the following.
- FIG. 29 is a figure similar to FIG. 17.
- the constant current and constant voltage charge method in the case where a Li-ion cell is charged by the constant current and constant voltage charge method (in the following, the constant current and constant voltage charge method will be called as the CC-CV charge method)
- the current It obtained after a lapse of a predetermined time t from the time when the charge mode is changed from the constant current mode (in the following, the constant current mode will be called as the CC mode) to the constant voltage mode (in the following, the constant voltage mode will be called as the CV mode) is constant if the capacity of the cell is constant.
- the time t is within a range
- the current It increases as the capacity decreases.
- capacity is estimated by the method including the steps of:
- a plurality of Li-ion cells which are same kind as a Li-ion cell which is target of capacity estimation are prepared in which a plurality of the Li-ion cells have different capacities due to repetition of use.
- charge and discharge cycle is repeated in which the charge current at the above mentioned time is measured. From the result, correlation between the capacity of the cell and the charge current is obtained.
- the correlation is not necessarily represented as an analytic equation.
- it may be represented as a line graph in which measured values in a correlation diagram are connected by lines.
- Co is the nominal capacity of the Li-ion cell
- a and b are constants determined by the Li-ion cell and the time t).
- the favorable range such that error becomes small is from 30 seconds to 30 minutes.
- the more favorable range is from 30 seconds to 20 minutes.
- Monitoring for obtaining the current It is performed several times per 10 ⁇ second for example and an intermediate value or a mean value is selected. This monitoring method is favorable since improper recognition due to noise can be avoided. However, monitoring method is not limited to this as long as the capacity estimation method of the present invention is possible.
- the estimation capacity Ce of the cell is calculated by the equation (26) by using the current It. For this purpose, it is necessary to determine a and b. In order to determine a and b, a following method can be used for example.
- d, e, f, and h are constants determined by the Li-ion cell and 0 ⁇ d, e ⁇ 0, 0 ⁇ f, and h ⁇ 0.
- the constants d, e, f, and h can be obtained by the following method for example.
- K is a constant
- ⁇ c is a value corresponding to concentration gradient of Li in solid
- n is electrochemical equivalent
- F is Faraday constant
- the function may become more complex.
- the constants a and b in the degradation estimation equation (26) in this embodiment become high-order functions with respect to the measured time t such that the capacity Ce of the estimation target cell can be obtained by measuring the current value It after a lapse of the time t satisfying 0.5 ⁇ t ⁇ 30, wherein the capacity Ce does not depend on the measured time t.
- the estimated capacity Ce shown in the equation (26) is a capacity when complete discharge is carried out in which the complete discharge is to discharge the cell from the full charge state to a predetermined lower limit voltage.
- the estimated capacity Ce is not a discharge capacity when the cell is discharged halfway.
- Successive approximation method or least square approximation method or the like can be used for determining the constants.
- a following charge and discharge cycle can be used in which the Li-ion cell of the target of capacity estimation or the same kind of Li-ion cell is used, the charge current is a value such that the charge ratio becomes from 0.5 C to 2 C, or, the charge period is from 3 hours to one month for the CC-CV charge method using charge limit voltage which is recommended as charge condition or which is determined by a charger or an apparatus mounting the cell, and the discharge current is a value such that the discharge ratio becomes from 0.2 C to 2 C, or, the discharge period is determined by using discharge cut-off voltage which is recommended as discharge condition or which is determined by a charger or an apparatus mounting the cell.
- the charge and discharge cycle includes a rest between the charge period and the discharge period as necessary.
- the charge and discharge cycle is repeated at least 5 times in order to determine coefficients of the degradation equation. Since the degradation equation (26) of the present invention is a linear function, the coefficients can be determined by using data of at least two cycles. However, in actuality, when using data of equal to or smaller than 4 cycles, estimation error exceeds ⁇ 20% due to error of reading current values. Thus, in order to secure degradation estimation accuracy within ⁇ 20%, it is favorable to obtain data of at least 5 cycles.
- the equation (26) is prepared at temperatures between 10° C. and 45° C.
- the temperature is lower than 10° C.
- the relationship between the capacity Ct and the charge current It does not become linear as the equation (26).
- the temperature higher than 45° C. does not suit the range of use temperature of the Li-ion cell.
- the capacity estimation is performed at temperatures within ⁇ 10° C. of the temperate at which the equation (26) is prepared, and between 10° C. and 45° C.
- the capacity estimation is performed at a temperature 10° C. or more higher, or, 10° C. or more lower than the temperature at which the equation is obtained, it becomes difficult to estimation capacity accurately since charge current values become different.
- the above method can be applied to a Li-ion battery shown in FIG. 3 for example.
- the Li-ion battery includes a safety securing part which has an IC, a memory for storing numeric data used for calculating an estimated capacity of the Li-ion battery in the IC or an IC added to the IC, and a circuit for calculating the estimated capacity by using the numeric data and charge current while charging the Li-ion battery.
- the capacity estimation method for the Li-ion cell of the present invention is a simple method and degradation of the Li-ion cell can be performed easily and simply by using this method. Thus, remarkable effect can be obtained in actual use.
- the capacity of the cells in the battery can be estimated only by using then battery. Accordingly, capacity degradation of the cells can be estimated automatically. Thus, remarkable effect can be obtained in actual use.
- FIG. 30 shows a configuration of a charge control circuit which performs the above mentioned method.
- 41 indicates the charge control circuit
- 42 indicates Li-ion cells which are the target of estimation
- 43 indicates a charge control microprocessor
- 44 indicates a power source microprocessor
- 45 indicates a switch
- 46 indicates a thermistor
- 47 indicates an abnormal output detection terminal
- 48 indicates a cell connection plus terminal
- 49 indicates a cell connection minus terminal
- 50 indicates a power source connection plus terminal
- 51 indicates a power source connection minus terminal.
- the capacity estimation method of the present invention it is necessary to measure time by a timer and to measure the charge current It.
- the timer is originally included in the charge control microprocessor 43 , and the charge current It can be monitored by using the abnormal output detection terminal 47 .
- the capacity estimation of the present invention can be performed in which calculation of the equations (26), (27) or (28) is performed by using an available memory in the charge control microprocessor 43 .
- the circuit is not limited to this configuration as long as the capacity estimation can be performed.
- the capacity estimation method of the present invention can be performed by adding additional capability to the body of the apparatus as mentioned above, the capability can also be provided in the safety mechanism of the battery such as shown in FIG. 3.
- the Li-ion battery which includes means of performing capacity estimation according to the present invention by modifying an existing Li-ion battery minimally.
- the configuration is not limited to that of the above mentioned Li-ion battery as long as the capacity estimation of the present invention is performed.
- the degradation estimation method and the Li-ion battery which includes the capacity estimation capability of the present invention can be applied to apparatuses for which high reliability is required.
- the present invention By applying the present invention to the apparatuses, degradation status of cells can be grasped properly and the cells can be exchanged in a timely fashion so that troubles of the apparatuses can be avoided.
- any apparatuses which mount Li-ion cells adopts the capacity estimation method or the Li-ion battery which has the degradation estimation capability. Accordingly, cells can be exchanged with minimum waste so that the present invention can be used very advantageously.
- a used prismatic Li-ion cell (the nominal capacity was 600 mAh) was used.
- the cell was cycled by discharging at 600 mA (1.0 CmA) to 2.75V and charging in CC-CV mode at 600 mA (1.0 CmA) to 4.1V for 7 days (168 hours) with intervals of one hour between charge and discharge.
- FIG. 31 shows relationship between the ratio (Cn/Co) of the discharge capacity (Cn) to the nominal capacity (Co) and the charge current It after a lapse of 5 minutes from the start of CV mode charge in which the ratio Cn/Co is indicated as nominal capacity ratio Cm in FIG. 31 and It is indicated as I 5 .
- a criterion of degradation degree which is obtained from the measured capacity Cn and the nominal capacity Co is also shown in FIG. 31.
- the solid line in the figure indicates the equation (32).
- FIG. 32 shows relationship between a plurality of charge currents It after a lapse of each time equal to or smaller than 35 minutes from the time when the mode changed from the CC mode to the CV mode, and, each mean value of error, absolute value of maximum error and absolute value of minimum error.
- the error is within ⁇ 20% when the time after the start of the CV charge is from 0.5 minute to 30 minutes, which becomes no problem in actual use. Further, the error is within ⁇ 6% when the time is from 0.5 minute to 20 minutes, which indicates that the capacity estimation method of the present invention realizes accurate estimation.
- FIG. 33 shows the relationship between the charge current I 31 (A) and the discharge capacity Cm in which the charge current I 31 (A) is a value obtained after a lapse of 31 minutes from the start of the CV mode.
- the two dotted lines indicate estimated capacity C 31 when error which is calculated by the equation (34′) is ⁇ 20%.
- a Li-ion battery having the same configuration shown in FIG. 3 was manufactured.
- the Li-ion battery includes three of the same kind of Li-ion cells (nominal capacity is 600 mAh) as those in the example 4-1, a safety securing mechanism, and an IC for protection in which a timer, the equations (30), (31), and (32) and the calculation mechanism are input beforehand.
- the battery was placed in a cell charge and discharge automatic test apparatus which has data collection and data storing capability.
- the battery was cycled 15 times by discharging at 600 mA (1.0 CmA) to 2.75V and charging in CC-CV mode at 600 mA (1.0 CmA) to 4.1V for 10 days (240 hours) with intervals of one hour between charge and discharge.
- FIG. 34 shows relationship between the charge current I 10 and the discharge capacity Cm.
- the error of the capacity Cm is within ⁇ 5%.
- the Li-ion battery which realize accurate capacity estimation can be provided.
- the fifth embodiment will be described.
- the capacity estimation method and the degradation estimation method using the time taken for charge current in the constant voltage mode (in the following, the constant voltage mode will be called as the CV mode) to decrease to a predetermined current will be described.
- FIG. 35 is a figure like FIG. 17.
- the capacity estimation method in this embodiment includes the steps of:
- the correlation is not necessarily represented as an analytic equation.
- it may be represented as a line graph in which measured values in a correlation diagram are connected by lines.
- the life-span of the cell can be estimated, that is, it can be estimated how many times the cell can be recharged and reused before degradation.
- Co is the nominal capacity of the Li-ion cell which is the target of capacity estimation. This condition will be represented as from 0.2 CmA to 2.0 CmA in the following description.
- the equation (36) represents relationship between the elapsed time t from the start of CV mode charge until the charge current decreases to half in a charge condition of an apparatus using Li-ion cell to which the equation is applied and an estimated specific capacity Ce/Co under the charge condition.
- initial charge current value for obtaining the equation (36) is different from the initial charge current value at CV mode charge start time of the apparatus mounting the cell or the charger, following processes need to be performed.
- the positive constants A and B are calculated by steps of:
- An experiment is performed for a Li-ion cell or a battery.
- charge and discharge cycles are repeated equal to or more than 5 times or 6 times, which is more favorable.
- the charge limit voltage Vc, the charge current Ic, and the discharge cut-off voltage Vd are set to be the same as those of a Li-ion cell or a battery which is the target of capacity estimation.
- the charge period is set from 3 hours to 10 days or from 3 days to 10 days, which is more favorable.
- Discharge current is set from 0.2 CmA to 2.0 CmA and the temperature is set from 0° C. to 45° C., or from 15° C. to 30° C., which is more favorable.
- the charge period per one cycle is set to be from 3 hours to 10 days.
- the cell degrades moderately per one cycle so that data necessary for preparing the accurate equation (36) can be obtained efficiently.
- the charge period per one cycle is set to be from 3 days to 10 days, degradation of capacity associated with the charge and discharge cycle can be clearly recognized so that data necessary for preparing the accurate equation (36) can be obtained efficiently, which is more favorable.
- the discharge current value in the charge and discharge cycle is set to be from 0.2 CmA to 2.0 CmA.
- the lower limit is set to be from 1.0 CmA to 2.0 CmA, data can be obtained more efficiently.
- the discharge current is smaller than 0.2 CmA, it takes much time to discharge completely, which is not favorable.
- the discharge current is larger than 2.0 CmA, discharge period becomes too short.
- measurement values of discharge capacity may vary.
- the capacity may decrease abruptly so that the equation (36) can not be prepared accurately. This is not favorable.
- the estimated capacity Ce of the Li-ion cell is calculated, and it is judged that the Li-ion cell is degraded when the estimated capacity Ce becomes smaller than a predetermined limit capacity Cmin.
- the estimation may be performed by comparing estimated specific capacity Ce/Co (Co is nominal capacity) and limit specific capacity Cmin/Co.
- the apparatus includes:
- [0608] means for obtaining, when the Li-ion cell is charged by a CC-CV charge method, an elapsed time t from the instant when charge condition is changed from a CC mode to a CV mode to the instant when charge current becomes ⁇ (0 ⁇ 1) times of charge current Ic in the CC mode;
- [0610] means for outputting a signal representing that the Li-ion cell is degraded when the estimated capacity Ce (or estimated specific capacity Ce/Co) becomes smaller than a predetermined limit capacity Cmin (or limit specific capacity Cmin/Co).
- FIG. 2 shows an configuration example of this apparatus.
- the equation (36) of the present invention is stored in an available memory in the CPU 7 and the like beforehand. Or, the equation (36) is stored in an memory chip which is added as necessary.
- the CPU 7 provides the cell control part 3 with an instruction to measure the elapsed time t from the time when the charge mode changes from the CC mode to the CV mode until the time when the charge current decreases to half, and receives data of the time t from the cell control part 3 .
- the CPU 7 performs calculation by substituting the time t into the equation (36) so that the CPU 7 obtains the estimated capacity Ce(or the estimated specific capacity Ce/Co).
- the memory 8 stores the estimated capacity Ce(or the estimated specific capacity Ce/Co) if necessary.
- a result of degradation estimation based on estimated capacity (or estimated specific capacity) is applied to the body of the apparatus via the line 10 such as a system management bus.
- the body of the apparatus displays the estimation result to a display part of the apparatus and sounds an alert by using a beep or a voice as necessary. Accordingly, the apparatus which has the degradation estimation capability for the Li-ion cells is realized.
- the configuration is not limited to the above mentioned one as long as the degradation estimation of the present invention is performed.
- the method of this embodiment can be applied to the battery as shown in FIG. 3.
- a timer is mounted in the IC 13 for protection in the above safety mechanism and the equation (36) is stored in an available memory beforehand.
- the IC 13 monitories the voltage across the Li-ion cells 12 - 1 , 12 - 2 , and 12 - 3 by using terminals Vcc and Vss and counts the elapsed time t from the time when the charge mode changes from the CC mode to the CV mode until the time when the charge current decreases to half. Then, the counted time t is substituted into the equation (36) so that the estimated capacity Ce is calculated.
- An additional IC can be provided at a proper position in the battery if necessary.
- a warning (by using electronic signal in this case) which represents capacity degradation is output to the body of the apparatus which mounts the battery via the terminal 19 in order to display the warning on a display or sound an alarm.
- the battery itself includes means of outputting the warning, for example, by displaying characters or an image, or sounding beep tones or a voice.
- Such a battery can be realized by applying the present invention and conventional technologies.
- the Li-ion battery which includes means of performing degradation estimation according to the present invention by modifying an existing Li-ion battery minimally.
- the configuration is not limited to that of the above mentioned Li-ion battery as long as the degradation estimation of the present invention is performed.
- the degradation estimation method and the Li-ion battery which includes the degradation estimation capability of the present invention can be applied to apparatuses for which high reliability is required.
- the present invention By applying the present invention to the apparatuses, degradation status of cells can be grasped properly and the cells can be exchanged in a timely fashion so that troubles of the apparatuses can be avoided.
- any apparatus which uses Li-ion cells adopts the degradation estimation method or the Li-ion battery which has the degradation estimation capability.
- cells can be exchanged with minimum waste so that the present invention can be used very advantageously.
- a used prismatic Li-ion cell (the nominal capacity was 1300 mAh) was used.
- the cell was cycled 3 times by discharging at 1300 mA (1.0 CmA) to 2.75V and charging in CC-CV mode at 1300 mA (1.0 CmA) to 4.1V for 3 hours with intervals of 10 minutes between charge and discharge.
- FIG. 36 shows relationship between the time tn obtained in the cycles and the specific capacity Cn/Co.
- data till third cycle is plotted.
- 36 -A indicates a line which represents the equation (37).
- 36 -B indicates a line representing values 20% higher than values of the equation (37) (that is, error of +20%)
- 36 -C indicates a line representing values 20% lower than values of the equation (37) (that is, error of ⁇ 20%).
- Equations shown in FIG. 37 were obtained from data of the time tn and the specific capacity Cn/Co which was obtained from 4th cycle till 10th cycle.
- a used prismatic Li-ion cell (the nominal capacity was 1300 mAh) was used.
- the cell was cycled 3 times by discharging at 1300 mA (1.0 CmA) to 2.75V and charging in CC-CV mode at 1300 mA (1.0 CmA) to 4.1V for 3 hours with intervals of 10 minutes between charge and discharge.
- FIG. 38 shows the result.
- FIG. 38 shows relationship between the time tn and the specific capacity Cn/Co.
- 38 -A shows measurement data till the third cycle.
- 38 -B indicates a line which represents the equation prepared by data of 2 hour charge period
- 38 -C indicates a line which represents the equation prepared by data of 3 hour charge period
- 38 -D indicates a line which represents the equation prepared by data of 3 day charge period
- 38 -E indicates a line which represents the equation prepared by data of 7 day charge period
- 38 -F indicates a line which represents the equation prepared by data of 10 day charge period
- 38 -G indicates a line which represents the equation prepared by data of 11 day charge period.
- FIG. 39 shows the relationship between the elapsed time tn from the start of the CV charge mode until the charge current decreases to half and the specific capacity Cn/Co.
- 39 -A indicates measurement data of the used prismatic cell measured in the example 5-2
- 39 -B indicates a line which represents the equation prepared by measurement data of all cycles
- 39 -C indicates a line which represents the equation prepared by measurement data of 4th cycle and 5th cycle
- 39 -D indicates a line which represents the equation prepared by measurement data from 4th cycle to 6th cycle
- 39 -E indicates a line which represents the equation prepared by measurement data from 4th cycle to 10th cycle.
- the maximum error (absolute value) of the specific capacity calculated by the equation prepared from data of 4th cycle and 5th cycle against actual measurement data is 6.1%
- the maximum error (absolute value) of the specific capacity calculated by the equation prepared from data from 4th cycle till 6th cycle against actual measurement data is 2.7%
- the maximum error (absolute value) of the specific capacity calculated by the equation prepared from data from 4th cycle till 10th cycle against actual measurement data is 2.5%, which shows good estimation accuracy.
- the maximum error of the specific capacity calculated by the equation prepared from data of all cycles (from first cycle till 10th cycle) against actual measurement data is 20.4%, which is not favorable since it exceeds ⁇ 20%.
- FIG. 40 shows the relationship between the elapsed time tn from the start of the CV charge mode to the instant when the charge current decreases to half and the specific capacity Cn/Co.
- 40 -A indicates measurement data of the used prismatic cell measured in the example 5-2
- 40 -B indicates a line which represents the equation prepared by measurement data of experiment of 0.15 CmA charge current
- 40 -C indicates a line which represents the equation prepared by measurement data of experiment of 0.2 CmA charge current
- 40 -D indicates a line which represents the equation prepared by measurement data of experiment of 1.0 CmA charge current
- 40 -E indicates a line which represents the equation prepared by measurement data of experiment of 2.0 CmA charge current
- 40 -F indicates a line which represents the equation prepared by measurement data of experiment of 2.5 CmA charge current.
- FIG. 41 shows the relationship between the elapsed time tn from the start of the CV charge mode until the charge current decreases to half and the specific capacity Cn/Co.
- 41 -A indicates measurement data of the used prismatic cell measured in the example 5-2
- 41 -B indicates a line which represents the equation prepared by measurement data of experiment at ⁇ 5° C.
- 41 -C indicates a line which represents the equation prepared by measurement data of experiment at 0° C.
- 41 -D indicates a line which represents the equation prepared by measurement data of experiment at 15° C.
- 41 -E indicates a line which represents the equation prepared by measurement data of experiment at 30° C.
- 41 -F indicates a line which represents the equation prepared by measurement data of experiment at 45° C.
- 41 -G indicates a line which represents the equation prepared by measurement data of experiment at 50° C.
- a charger which charges a battery by using the CC-CV charge method and performs capacity and degradation estimation of the battery was manufactured and will be shown.
- the battery includes three prismatic Li-ion cells (nominal capacity of each is 600 mAh) which are connected in series.
- the charge limit voltage is 12.3V(2.75V/cell)
- the charge current is 600 mA(1.0 CmA)
- the charge-end current which is a threshold for ending the charge is 30 mA(0.05 CmA).
- a configuration of this charger is the same as that shown in FIG. 11.
- step A The charge is started by placing the battery in the charger and the battery voltage is monitored. When the battery voltage V reaches the charge limit voltage 12.3V(4.1V/cell), time measuring for degradation estimation is started. At the same time, the charge current is monitored.
- step B When the charge reaches 300 mA(0.5 CmA), the time measuring ends. Then, the elapsed time t from the time when the charge voltage reaches the charge limit voltage until the current reaches 300 mA is recorded.
- step C The time t is substituted into the equation (37) so that the estimated specific capacity Ce/Co is calculated.
- step D The calculation result is displayed on the LCD and the LED. According to the estimated specific capacity, one of red, yellow and green LEDs illuminates. At the same time, a numeric value is displayed on the LCD. The value is displayed on the LCD for 30 seconds and the LED illuminates while the charger is connected to the utility power source.
- a program including the equation (37) prepared in the example 5-1 and the steps shown in FIG. 42 is stored in the charge control microprocessor 30 beforehand. While monitoring of the battery voltage and the charge current, the internal timer measures the time t elapsed from the time when the battery voltage reaches 12.3 V, that is, from the time the charge mode changes from the CC mode to the CV mode until the charge current decreases to 1 ⁇ 2 (300 mA). Then, capacity estimation and degradation estimation of the Li-ion battery is performed by applying the time t to the equation (37) so that the estimated capacity and the result of degradation estimation are displayed on the display part 32 .
- the charger of this embodiment displays a timer on the LCD such that the charge time of the battery can be recognized.
- the charged battery was mounted in the battery charge and discharge automatic test apparatus so that constant current discharge was performed wherein the discharge current was set to be 600 mA(1.0 CmA) and the discharge cut-off voltage was set to be 8.25V.
- the discharge capacity was 542 mAh according to this test. This value is equivalent to 90.3% as specific capacity, which revealed that the error of capacity estimation was about 1.7%.
- a Li-ion battery which can be mounted in a portable information terminal was manufactured.
- the configuration is the same as that shown in FIG. 3.
- the Li-ion battery has a capability of performing the CC-CV method charge on condition that the charge limit voltage is 12.3V, charge current is 600 mA(1.0 CmA) and the charge-end current is 60 mA.
- the battery includes three prismatic Li-ion cells (nominal capacity is 600 mAh) 12 - 1 , 12 - 2 , and 12 - 3 which are connected in series.
- the equation (37) is stored in the IC for protection beforehand.
- a program is stored in a memory in the IC 13 for protection. According to this program, following process is performed.
- the voltage across the cells 12 - 1 , 12 - 2 , and 12 - 3 is monitored by Vcc and Vss.
- the charge voltage is monitored and the elapsed time t from the time when the voltage becomes the charge limit voltage 12.3V(4.1V/cell), that is, from the time when the charge mode changes from the CC mode to the CV mode to the time when the charge current decreases to 1 ⁇ 2 (300 mA(0.5 CmA)) is measured.
- the measured time t is substituted into the equation (37) so that the specific capacity Ce/Co is calculated.
- the battery is configured such that the result is output to the body of the portable terminal in order to be displayed on an LCD of the portable terminal via the terminal 19 .
- a command for doing degradation estimation is provided from the body of the portable terminal concurrently with the start of charge.
- Procedures for performing the degradation estimation are the same as those shown in FIG. 42 except for the result to be sent to the body since the result is displayed on the display of the portable terminal.
- the battery was mounted in the portable information terminal and used for one hour. After that, charge of the battery was started by connecting the terminal to the utility power source. The estimated specific capacity of the battery was displayed as 75% after the start of the charge. After checking that a sign of charge completion was displayed, the information terminal was powered off and the battery was removed from the terminal. Then, the battery was connected to the battery charge and discharge automatic test apparatus by using proper codes and the discharge capacity was measured by discharging the battery on condition that the discharge current was 600 mA(1.0 CmA) and the discharge cut-off voltage was 8.25V(2.75V/cell). As a result, the discharge capacity was 472 mAh, which means that the specific capacity was 78.7%.
- the capacity estimation and degradation estimation method can be applied to various apparatuses which mount the Li-ion battery.
- examples which mount the Li-ion cell or the Li-ion battery to which the capacity estimation and degradation estimation method of the present invention are applied will be shown.
- the electric vehicle in this embodiment is a pure electric vehicle (PEV) which mounts a Li-ion battery including 12 modules, 96 cells in which the rating voltage is 28.8V and the rating capacity is 100 Ah.
- the seating capacity of the PEV is 4 passengers and the weight is 1415 kg.
- the mileage per one charge (5 hour charge) is larger that 200 km.
- the PEV is driven only by the battery. Thus, it is important to grasp not only remaining capacity but also the life of the battery.
- the capacity estimation and degradation estimation methods of the present invention can be used effectively for evaluating the capacity and the life properly.
- FIG. 43 shows a configuration when the Li-ion battery in the PEV is charged by a charger.
- the configuration of the charger is the same as that described so far.
- the charger 61 is connected to the utility power 64 via the cable terminals 62 and 63 .
- the Li-ion battery 66 in the PEV 65 is connected to the charger via cable terminals 67 , 68 , 69 , and 70 .
- alternating current from the utility power 64 is converted into direct power.
- the charge control microprocessor 74 controls charge on the basis of information from the power source microprocessor and control information on safety from the thermistor 73 .
- the switch 75 is used for ending the charge.
- the charge control microprocessor 74 displays charge state and safety state on the display part 76 of the charger 61 and activates an alarm.
- a program for performing the estimation by using the equation of the present invention is stored in an available memory in the charge control microprocessor 74 beforehand so that the specific capacity Cr(%), the degradation degree Deg(%) are calculated by applying data of voltage for charge control, current monitor, and the timer to the equation.
- Terminals are provided in the charger and the PEV 65 for connecting and disconnecting a cable for sending calculated values.
- the specific capacity Cr(%) and the degradation degree Deg(%) which are calculated by the charge control microprocessor 74 are sent to a control and monitoring microprocessor 79 in the PEV 65 .
- the data calculated on the basis of the capacity estimation and degradation estimation method of the present invention is displayed, with information of the engine 80 , on a proper display part 81 such as an instrument panel and a navigation system display, and generates an alarm.
- wireless communication instead of using the cable can be used by providing a wireless communication apparatus or a jig between the charger and the PEV.
- the program for performing the capacity estimation and degradation estimation by using one of the equations of the present invention is stored beforehand in the charge control microprocessor 74 in the charger.
- the battery voltage and current are monitored, time is measured by the internal timer so that the specific capacity Cr(%) and the degradation degree Deg(%) are calculated.
- the calculated values are transmitted to the control and monitoring microprocessor 79 via a cable between the cable terminals 77 and 78 .
- the control and monitoring microprocessor 79 has a program for calculating the mileage expectancy Dr(km) and the life expectancy Y(year) of the battery per one charge.
- the control and monitoring microprocessor 79 calculates them by using the specific capacity Cr(%) and the degradation degree Deg(%) based on the following equations
- Dr 0 is the mileage expectancy of a new battery per one charge
- Y 0 is the life expectancy of the new battery
- the display part 81 of the PEV 65 displays the calculated results.
- FIG. 44 shows an example of the display screen.
- remaining mileage “Rest of run” 82 and remaining life “Rest of battery life” 83 are displayed on the display part 81 of the PEV 65 .
- the mileage expectancy Dr 0 of a new battery is shown as a cell shape 85 by dotted lines.
- the mileage expectancy Dr which is calculated by the equation (38) is shown as a cell shape 86 by solid lines.
- the battery energy which is consumed by driving the PEV is obtained by a conventional remaining time estimation method and the remaining mileage can be indicated by using a cell shape 87 filled with a color in the cell shape 86 which indicates full charge state.
- the remaining life is indicated by five cell shapes 88 .
- the second cell 89 from the left side is shown by yellow, which is attention color, and indicates “Replace soon”.
- the cell 90 of the left side is shown by red, which is warning color, and indicates “Replace Now!”.
- the remaining life Y(%) is shown by filling the cells from the left side. By indicating that the filled area of the remaining life Y(%) includes error, the right end of the filled area may be cut in a slanting direction.
- the cell shapes can be omitted and only “Replace soon” and “Replace Now!” can be displayed, or only an alarm can be sounded.
- FIG. 45 is a flowchart showing a procedure for displaying the remaining mileage and the remaining life of the battery by applying the capacity estimation and the degradation estimation method of the present invention to the Li-ion battery in the PEV. In the following, the procedure will be described with reference to FIG. 45.
- step A The Li-ion battery mounted in the PEV is charged and the specific capacity Cr(%) and the degradation degree Deg(%) are calculated by applying the capacity estimation and the degradation estimation method of present invention to the Li-ion battery in the PEV. Then, the mileage expectancy Dr(%) and the remaining life Y(%) are calculated by using equations (38) and (39).
- step B The mileage expectancy Dr(%) and the remaining life Y(%) obtained in the step A are displayed. That is, when the remaining life Y(%) is displayed, N is obtained such that Y is divided by 20
- the remaining mileage Dr(%) can be displayed by the cell shape in which the length is determined by Dr(%) obtained by the equation (38).
- the capacity estimation method and the degradation estimation method can be applied to a power assist bicycle.
- the procedure for the power assist bicycle is the same as that for the PEV.
- space for displaying data is generally limited, thus, the part 83 of the remaining life in the display part shown n FIG. 44 can be moved to the side of the charger.
- the capacity estimation method and the degradation estimation method can be applied to a hybrid electric vehicle (HEV), a solar cell generator system (SCS), a windmill generator system (WMS).
- HEV hybrid electric vehicle
- SCS solar cell generator system
- WMS windmill generator system
- FIGS. 46A and 46B show an example of a state of charge (SOC) of the battery mounted in the HEV.
- SOC state of charge
- FIGS. 46A and 46B variations between the speed of the HEV and the SOC of the battery are shown, in which the lateral axis indicates the deriving distance and the vertical axis indicates the speed and the SOC in FIGS. 46A and 46B respectively.
- the method of performing estimation by using constant current charge (in the following, the constant current charge will be called as the CC charge) time is most appropriate for capacity estimation and degradation estimation of the Li-ion battery mounted in the HEV.
- the capacity estimation method and the degradation estimation method of the present invention can be applied in several ways. For example, after identifying a time at which the battery is charged for loner than a predetermined time, preferably for 30 seconds, and, then, capacity estimation and degradation estimation is performed by using charge current and voltage in the time. When the charge period is shorter than 30 seconds, the time for monitoring is not enough so that effective date can not be obtained. In addition, since charge amount is small, estimation error may become large.
- Monitoring of charge voltage is performed equal to or more than at least three times in 10 seconds. Then, a mean value of monitored voltages is obtained. Obtaining the mean voltage is performed a plurality of times at intervals of equal to or longer than at least 10 seconds. Accordingly, data of voltage variation in the cc charge can be obtained.
- charge current when the system has a mechanism for controlling charge current such that the charge current becomes constant, the constant charge current is used.
- the charge current is limited to a predetermined range of value, or when the charge current is not controlled at all, a following method can be used as an example.
- monitoring of the charge current is performed equal to or more than three times in 10 seconds. Then, a mean value of the monitored currents is obtained. Obtaining the mean current is performed a plurality of times at intervals of equal to or longer than at least 10 seconds. When the error of the obtained mean currents is smaller than 5%, the charge becomes CC charge. In addition, when discharge is not included in the interval of obtaining the mean current and the interval is equal to or longer than 30 seconds, the charge mode is regarded as in the CC charge mode. Then, the obtained mean current and the charge time t are used for capacity estimation and degradation estimation.
- the remaining life Y is calculated from the capacity and the degradation degree so that the remaining life Y can be displayed on a proper display part such as an instrument panel or a navigation system.
- the capacity estimation method and the degradation estimation method of the present invention can be used in order to display the remaining life of the battery in the same way as the HEV.
- the SCS or the WMS repeats charge and discharge as frequently as the HEV and the charge time per one time is longer than that of the HEV, monitoring becomes relatively easy.
- the present invention it becomes possible to provide a simple method for estimating capacity of the Li-ion cell, a simple method and apparatus for estimating degradation of the Li-ion cell and a Li-ion battery which includes means of performing capacity estimation and means for warning degradation of the cell as necessary.
- the present invention can greatly contribute to management of the Li-ion cell.
- the present invention can be applied to various apparatuses and can greatly contribute to ensuring reliability and enlarging application of electronic devices.
Landscapes
- Engineering & Computer Science (AREA)
- Chemical & Material Sciences (AREA)
- Electrochemistry (AREA)
- Manufacturing & Machinery (AREA)
- Chemical Kinetics & Catalysis (AREA)
- General Chemical & Material Sciences (AREA)
- General Physics & Mathematics (AREA)
- Physics & Mathematics (AREA)
- Power Engineering (AREA)
- Microelectronics & Electronic Packaging (AREA)
- Materials Engineering (AREA)
- Secondary Cells (AREA)
- Charge And Discharge Circuits For Batteries Or The Like (AREA)
Abstract
A capacity estimation method for a Li-ion cell is provided. In the method, according to a first aspect, an elapsed time from the time when charge voltage in constant current charge reaches a predetermined voltage to the time when charge condition is changed to a constant voltage mode is used for calculating an estimated capacity of said Li-ion cell. According to a second aspect, a charge current after a lapse of a predetermined time from the time when charge condition is changed to a constant voltage mode is used. According to a third aspect an elapsed time from the time when charge condition is changed to a constant voltage mode to the time when charge current becomes α (0<α<1) times is used.
Description
- 1. Field of the Invention
- The present invention relates to a lithium-ion cell (in the following, the lithium-ion cell will be called as an Li-ion cell) and a lithium-ion battery (in the following, the lithium-ion battery will be called as an Li-ion battery). More specifically, the present invention relates to a capacity estimation method, a degradation estimation method and a degradation estimation apparatus for the Li-ion cell and the Li-ion battery.
- 2. Description of the Related Art
- Recently, demand for cells is growing as various electronic devices become smaller, sophisticated and portable. According to this growing demand, cells are intensively developed and improved. Accordingly, the scope of application of cells has been extended.
- As the cells are becoming widespread, demand for improvement of reliability of the cells is growing. Especially, ensuring reliability of a nickel-metal hydride cell (in the following, the nickel-metal hydride cell will be called as an Ni/MH cell) and a Li-ion cell is an important problem since energy which is accumulated in the Ni/MH cell or the Li-ion cell is higher than that of a conventional lead-acid cell or a nickel-cadmium cell (in the following, the nickel-cadmium cell will be called as an Ni/Cd cell) so that damage which may be caused by a trouble of the Ni/MH cell or the Li-ion cell is more serious than that of the lead-acid cell or the Ni/Cd cell. That is, since volumetric or gravimetric energy density of the Ni/MH cell or the Li-ion cell is much higher than that of the lead-acid cell or the Ni/Cd cell, energy which is accumulated in the Ni/MH cell or the Li-ion cell is higher than the lead-acid cell or the nickel-cadmium cell.
- In addition, the Li-ion cell does not have gas absorbing reaction mechanism which absorbs gas which is generated due to side reaction of overcharging although the lead-acid cell, the Ni/Cd cell, and the Ni/MH cell have such a gas absorbing reaction mechanism. The latter cells include aqueous solution, sulfuric acid or alkaline solution, as electrolyte. Oxygen gas evolves on the cathode and the gas is absorbed in anode active materials for these cells. On the other hand, the Li-ion cell includes lithiated transition metal oxide as cathode active material which intercalates and deintercalates lithium, carbon compound as anode active material which intercalates and deintercalates lithium, and nonaqueous organic mixed solvent in which lithium salts are dissolved as electrolyte. Thus, gases which are generated by the Li-ion cell due to side reaction of overcharging are CO, CO 2 or other organic gases for which any gas absorbing reaction mechanism has not been established.
- Furthermore, the lead-acid cell, the Ni/Cd cell, and the Ni/MH cell have recoverable safety vent which releases oxygen gas which evolves due to side reaction of overcharging and cannot be absorbed in anode active material. On the other hand, the safety vent is not recovered for the Li-ion cell because of preventing from outer moisture. The Li-ion cell thus does not operate once the vent opens. Therefore, as for the Li-ion cell, cell reaction and the safety vent mechanism for keeping safety are largely limited.
- In addition, when a plurality of Li-ion cells are placed in series in which degradation of each cell is proceeding, overcharging or over discharging may occur due to imbalance between characteristics of cells so that safety can not be secured. Especially, since the Li-ion cell is expensive, the number of times of exchanging a cell is desired to be as small as possible so as to use the cell over a long time period as possible. However, since safety of the Li-ion cell which is in the last period of its life degrades very much, it is favorable that the cell is exchanged before it is in the unsafe condition. Therefore, for the Li-ion cell, there is an economical problem.
- To exchange a cell timely by keeping track of degradation of the cell accurately is one of methods for attaining reliability. As for high energy density cells such as the Ni/MH cell or the Li-ion cell, Smart Battery System (SBS) which was proposed in 1994 is becoming widespread while being modified as a battery management system including charging control and residual capacity evaluation (www.sbs-forum.org can be referred to). However, for controlling and managing cells, only a method based on managing enormous volumes of data is adopted, in which the enormous volumes of data include manufacturing makers, kinds of cells, in addition, data obtained by always monitoring currents, voltages, temperature of cells and the like. Thus, this method is very costly so that prices of products become high.
- In addition, monitoring degradation of cells which is important for keeping safety is not regarded as important while keeping and monitoring use time per charge or residual capacity are regarded as important. One of the reason of this is that model changes are often performed for devices which mount the Li-ion cells.
- Especially, SBS has only functions of charge control, residual capacity management and the like so that it does not have a function of grasping degradation status of cells. Therefore, exchanging of cells or batteries is performed through user's intuition.
- In addition to SBS, a method of controlling and managing the Li-ion cell used in a video camera is proposed. In this method, since degradation of the cell is judged only by applying previous capacity to relationship between capacity and the number of repetition of charge and discharge which is stored in a memory beforehand, there is a problem in accuracy.
- An object of the present invention is to provide a method for performing capacity estimation of the Li-ion cell accurately, a method for performing degradation estimation of the Li-ion cell accurately, an apparatus for performing degradation estimation of the Li-ion cell accurately, and a Li-ion battery which includes a capability for performing degradation estimation accurately.
- According to a first aspect of the present invention, the above object of the present invention is achieved by a capacity estimation method for a Li-ion cell, comprising the steps of:
- obtaining, when the Li-ion cell is charged by a constant current and constant voltage charging method, an elapsed time from the instant when charge voltage in constant current charge reaches a predetermined voltage to the instant when charge condition is changed from a constant current mode to a constant voltage mode; and
- calculating an estimated capacity of the Li-ion cell by using the elapsed time.
- According to a second aspect of the present invention, the above object of the present invention is achieved by a capacity estimation method for a Li-ion cell, comprising the steps of:
- obtaining, when the Li-ion cell is charged by a constant current and constant voltage charging method, a charge current after a lapse of a predetermined time from the instant when charge condition is changed from a constant current mode to a constant voltage mode; and
- calculating an estimated capacity of the Li-ion cell by using the charge current.
- According to a third aspect of the present invention, the above object of the present invention is achieved by a capacity estimation method for a Li-ion cell, comprising the steps of:
- obtaining, when the Li-ion cell is charged by a constant current and constant voltage charging method, an elapsed time from the instant when charge condition is changed from a constant current mode to a constant voltage mode to the instant when charge current becomes a (0<α<1) times of charge current in the constant current mode; and
- calculating an estimated capacity of the Li-ion cell by using the elapsed time.
- Other objects, features and advantages of the present invention will become more apparent from the following detailed description when read in conjunction with the accompanying drawings, in which:
- FIG. 1 shows variation per time of voltage and current values of a Li-ion cell when charging the Li-ion cell by the constant current and constant voltage (CC-CV) charging method which is generally used for charging the Li-ion cell;
- FIG. 2 shows a configuration of a general power source part and peripheral equipment of an apparatus which mounts the Li-ion cell to which the degradation estimation method of the present invention is applied;
- FIG. 3 shows a general circuit configuration of a Li-ion battery which includes a capability of degradation estimation of the present invention;
- FIG. 4 shows relationship between elapsed time t and specific capacity which are obtained by the charge and discharge cycle experiment in an example 1-1.
- FIG. 5 shows relationship between CC charge time and specific capacity which are obtained by the charge and discharge cycles in the example 1-1;
- FIG. 6 shows the number of data sets used for preparing equations of an example 1-2 and widths of absolute value of error where the upper limit indicates the maximum error (absolute value) and the lower limit indicates the minimum error (absolute value);
- FIG. 7 shows relationship between CC charge time and specific capacity obtained in an example 1-3;
- FIG. 8 shows relationship between CC charge time and specific capacity obtained in an example 1-4;
- FIG. 9 is a table showing each charge time per one cycle used for preparing equations of an example 1-5, the number of sets of data for each experiment, prepared equations and absolute values of estimation errors calculated by applying the equations;
- FIG. 10 is a table showing temperatures of lower temperature tests used for preparing the equations of an example 1-6, obtained equations, and absolute values of estimation errors calculated by applying the equations;
- FIG. 11 shows a configuration of a charger according to an embodiment 1-7;
- FIG. 12 is a flowchart showing degradation estimation procedures performed in an experiment 1-7;
- FIG. 13 shows relationship between elapsed time t and specific capacity which are obtained by charge and discharge cycle experiment of an example 2-1;
- FIG. 14 shows relationship between specific capacity and the elapsed time t of CC mode charge obtained in charge and discharge cycles at 0.1 CmA of charge current, which is a comparison example for an example 2-1;
- FIG. 15 shows relationship between specific capacity and elapsed time t of CC mode charge in an example 2-3, and obtained equations;
- FIG. 16 is a flowchart showing degradation estimation procedures performed in an experiment 2-4;
- FIG. 17 is a figure for explaining capacity estimation method of the Li-ion cell according to a third embodiment of the present invention;
- FIG. 18 shows variations of CV mode charge current profiles on which the capacity estimation method and the degradation estimation method of the present invention are based according to the third embodiment;
- FIG. 19 shows relationship between elapsed time since the CV charge starts until the charge current becomes half (charge current half reduction time) and specific capacity for explaining the capacity estimation method and the degradation estimation method of the present invention according to the third embodiment;
- FIG. 20 shows relationship between charge current after a lapse of 5 minutes from the instant when charge mode is changed from CC mode to CV mode and specific capacity;
- FIG. 21 shows relationship between time t ½ and specific capacity Cr which are results of charge and discharge cycling tests in an example 3-1;
- FIG. 22 shows equations obtained in an example 3-2 of the present invention;
- FIG. 23 shows relationship between the time t ½ elapsed from the instant when the CV mode charge starts to the instant when charge current decreases to half and the specific capacity Cr, and each equation obtained in an example 3-2 of the present invention;
- FIG. 24 shows data of relationship between the time t ½ elapsed from the instant when the CV mode charge starts to the instant when charge current decreases to half and the specific capacity Cr, and each equation obtained in an example 3-3 of the present invention;
- FIG. 25 shows data of relationship between the charge current I 5min after a lapse of 5 minutes from the start of the CV mode charge and the specific capacity Cr, and each equation in an example 3-4 of the present invention;
- FIG. 26 shows data of relationship between charge current after a lapse of a predetermined time from the start of the CV mode charge and the specific capacity Cr, and each equation in an example 3-5 of the present invention;
- FIG. 27 is a flowchart showing degradation estimation procedures performed in an experiment 3-6 of the present invention;
- FIG. 28 is a continuation of FIG. 27;
- FIG. 29 is a figure for explaining profiles of cell voltage and charge current by the CC-CV charge method according to a fourth embodiment;
- FIG. 30 shows a configuration of a charge control circuit to which the capacity estimation method is applied according to the fourth embodiment of the present invention;
- FIG. 31 shows relationship between charge current and discharge capacity according to results of experiment of an example 4-1 of the present invention;
- FIG. 32 shows relationship between time when the charge current was measured after CV mode charge starting and estimated error according to results of experiment of an example 4-2 of the present invention;
- FIG. 33 shows relationship between charge current after a lapse of 31 minutes from the start of CV charging and specific capacity according to results of experiment of an example 4-2 of the present invention;
- FIG. 34 shows relationship between charge current after a lapse of 10 minutes from the start of CV charging and specific capacity according to results of experiment of an example 4-3 of the present invention;
- FIG. 35 is a figure for explaining profiles of cell voltage and charge current by the CC-CV charge method according to a fifth embodiment;
- FIG. 36 shows relationship between charge current half reduction time and specific capacity in an example 5-1, and a line representing an equation obtained in an experiment No. 4 shown in FIG. 37;
- FIG. 37 shows capacity estimation equation and the resulted error (absolute values) for the charge and discharge cycles with various charge time in an example 5-2;
- FIG. 38 shows relationship between charge current half reduction time t and specific capacity C/Co in an example 5-2, and lines of each equation;
- FIG. 39 shows relationship between charge current half reduction time t and specific capacity C/Co in an example 5-3, and lines of each equation;
- FIG. 40 shows relationship between charge current half reduction time t and specific capacity C/Co in an example 5-4, and lines of each equation;
- FIG. 41 shows relationship between charge current half reduction time t and specific capacity C/Co in an example 5-5, and lines of each equation;
- FIG. 42 is a flowchart showing degradation estimation procedures performed in an experiment 5-6;
- FIG. 43 shows an electric circuit configuration when the Li-ion battery in PEV is charged by a charger which is connected to utility power source in which capacity estimation and degradation estimation are performed while charging;
- FIG. 44 shows an example of display screen of PEV which displays remaining mileage “Rest of run” and remaining life “Rest of battery life”;
- FIG. 45 is a flowchart showing procedures of calculating remaining mileage of the PEV and remaining life of Li-ion battery mounted in the PEV;
- FIGS. 46A and 46B show a running state of HEV and a state of charge of mounted battery;
- FIG. 47 shows relationship between the CC charge current and the CC charge time used for obtaining conversion coefficient used for applying monitored current to degradation estimation equation in HEV;
- FIG. 48 shows a profile of CC charge voltage used for obtaining CC charge time applied to estimation equation from monitored charge voltage in HEV.
- As mentioned above, in the present invention, capacity estimation and degradation estimation are performed in a constant current and constant voltage charge method focusing attention on three points: (1) a charge time in a constant current mode; (2) a current value after a lapse of a predetermined time interval in a constant voltage mode; and (3) a time taken for charge current to decrease to a predetermined current value.
- In the following, in a first embodiment, the capacity estimation method and the degradation estimation method using (1) the charge time in the constant current mode will be described. In a second embodiment, the charge time in the constant current mode will be used as in the first embodiment in which estimation equations which are simpler than those in the first embodiment will be used.
- In a third embodiment, the capacity estimation method and the degradation estimation method using (2) the current value after a lapse of a predetermined time interval in the constant voltage mode and (3) the time taken for charge current to decrease to a predetermined current value will be described. In a fourth embodiment, the capacity estimation method and the degradation estimation method using (2) the current value after a lapse of a predetermined time interval in the constant voltage mode will be described in which these methods are simpler than those in the third embodiment. In a fifth embodiment, the capacity estimation method and the degradation estimation method using (3) the time taken for charge current to decrease to a predetermined current value will be described in which these methods are simpler than those in the third embodiment.
- In addition, in a sixth embodiment, examples for applying the capacity estimation method and the degradation estimation method to an electric vehicle and the like will be described.
- First Embodiment
- In the following, the capacity estimation method of the Li-ion cell of the first embodiment of the present invention will be described with reference to figures in detail. In the following description, “battery” means “secondary battery as a self-contained power source” in which a cell or a plurality of cells and safety control circuits or charge/discharge control circuits are integrated wherein the plurality of cells are connected in series or in parallel or in combination.
- FIG. 1 shows profiles of voltage and charge current of a Li-ion cell when charging the Li-ion cell. In FIG. 1, first, the Li-ion cell, which may be a Li-ion cell in a battery, is charged to a predetermined charge limit voltage Vc with a predetermined constant current Ic in the constant current mode (in the following, the constant current mode will be called as CC mode), wherein the charge limit voltage Vc is normally 4.1 V/cell or 4.2 V/cell. After the charge voltage reaches the predetermined voltage Vc, charge of the constant voltage mode (in the following, the constant voltage mode will be called as CV mode) starts in which the charge current decreases over time while the charge voltage (which is shown as “cell voltage” in FIG. 1) keeps the constant value Vc.
- In the capacity estimation method of the Li-ion cell of the present invention, when the cell is charged in the CC mode in the constant current and constant voltage charge method (in the following, the constant current and constant voltage charge will be called as CC-CV charge), a time t is monitored and the time t is used for capacity estimation of the Li-ion cell, wherein the time t is a time lapsed from the instant when the cell voltage reaches a voltage Vs which is set such that it is equal to or larger that a discharge cut-off voltage Vd and smaller than the charge limit voltage Vc to the instant when the CC mode is changed to the CV mode.
- In the following, the reason why such estimation is possible will be described.
- In the charge process of the Li-ion cells, Li in the cathode active material dissolves as Li + ions in the electrolyte and the Li+ ions are intercalated into the anode carbon. In contrast, in the discharge process, Li intercalated into anode dissolves as Li+ ions in the electrolyte and the Li+ ions are intercalated into the cathode active material.
- Due to repeating charge and discharge, long time nonoperation, or overcharging, transition metal such as Co, Ni, or Mn which constitutes the cathode active material dissolves in the electrolyte so that the reaction area is decreased since the separator is clogged and the compounds are deposited on the anode surface, a passive film is generated on the anode surface due to electrolyte decomposition with Li + ions in the electrolyte, inactive or dead Li remains in the cathode and anode active materials after discharging and charging, or particles of electrode component materials become to be disconnected electrically due to degradation of polymer binder. As a result, electron passing through electrode particles and Li+ ion mobility in the electrolyte degrade. Therefore, effective area which performs reaction of electrodes or the number of storage sites of Li decreases so that internal resistance of the cell increases. Then, Li+ ion at the time of charging deintercalates from cathode active material so that the amount of Li+ ions which disperse in the inside of the anode and the rate of dispersion decreases. In this state, charge time in the CC mode becomes shorter since the internal resistance of the cell increases. In the CC mode, diffusion rate of Li in the anode gradually decreases and it delays relaxation of the Li in the surface layer of the electrode dispersing to the inside layer. Eventually, the speed of decrease of the current value decreases.
- The inventors of the present invention discover a correlation between decrease of capacity and decrease of the charge time in the CC mode so that they invent the present invention which will be described with the first embodiment.
- Outline of the First Embodiment
- In the first embodiment, a capacity estimation method for a Li-ion cell will be described. The method comprises the steps of:
- obtaining, when the Li-ion cell is charged by the CC-CV charge method, an elapsed time t from the instant when charge voltage in constant current charge reaches a predetermined voltage Vs to the instant when charge condition is changed from a CC mode to a CV mode; and
- calculating an estimated capacity Ce of the Li-ion cell by using the time t.
- In order to enable this estimation method, it is necessary to obtain correlation between the estimated capacity Ce and the time t beforehand. For example, there is a following method to obtain the correlation.
- Charge and discharge cycle is repeated for a Li-ion cell which has the same structure and the same specification (which will be called as the same kind in this specification) as a Li-ion cell which is the target of capacity estimation. Then, correlation between the time tn of each cycle and discharge capacity Cn which is obtained by integrating discharge current with respect to time (n is a number which is assigned to each cycle). In this case, since it is favorable that the value of the discharge capacity Cn ranges widely, it is favorable to perform the above method for a plurality of Li-ion cells which are the same kind and have different capacities when the discharge capacity Cn does not range widely.
- The correlation is not necessarily represented as an analytic equation. For example, it may be represented as a line graph in which measured values in a correlation diagram are connected by lines.
- When the analytic equation is adopted as representation of the correlation, there is a favorable range in the charge current Ic when the constant current charge (in the following, the constant current charge will be called as CC charge) is performed.
- In addition, if relationship between the estimated capacities Ce and the number of charge repetitions is obtained by recording the estimated capacities Ce which are calculated in each charge, the life-span of the cell can be estimated, that is, it can be estimated how many times the cell can be recharged and reused before degradation. When a Li-ion cell is used by repeating charge and discharge under usage condition which is the same as or similar to that used in the estimation, accuracy of the life-span estimation becomes high.
- The favorable range of the charge current Ic can be represented as Co/(30 hours)≦Ic≦Co/(1 hour), wherein Co is the nominal capacity of the Li-ion cell which is the target of capacity estimation. Generally, when a current of the cell is Co/(T hours), the current is represented by (1/T) CmA. For example, Co/(20 hours) can be represented as 0.05 CmA. Therefore, the above condition can be represented as 0.033 CmA≦Ic ≦1.0 CmA.
- When the charge current Ic satisfies the above condition, a following equation approximately holds, wherein A and B are positive constants which are determined by the Li-ion cell, the voltage Vs and the charge current Ic.
- Ce/Co=A×tB (1)
- Thus, according to this equation, the estimated capacity Ce can be obtained by using the time t.
- When the charge current Ic does not satisfy the above condition, it is not favorable to calculate the estimated capacity Ce by using the equation (1). That is, when the charge current Ic is smaller than the above limitation range, a calculated capacity by the equation (1) becomes different from an actual capacity for reasons that the cell is not fully charged, effect of self-discharge can not be neglected and the like. When the charge current Ic is larger than the above limitation range, since the time taken for charging the cell becomes short, the measured value of the time t may includes large error and variations of charge time due to degradation becomes different to each other. Thus, it becomes also difficult to estimate capacity accurately.
- However, since charge current values which are applied to almost all apparatuses mounting the Li-ion cell and chargers are within the range of the above condition, the capacity estimation method according to this embodiment of the present invention is effective for Li-ion cells used under a normal condition.
- Apparatuses and chargers which adopt a current value which is out of the range are used only for very limited use such as in a case when very high rate charge is required in an emergency. These apparatuses and chargers hardly requires the capacity estimation method of the present invention.
- The equation (1) represents relationship between the time t in the CC mode charge in a charge condition of an apparatus mounting Li-ion cell to which the equation is applied and an estimated specific capacity Ce/Co under the charge condition. When the charge current value in the CC mode for obtaining the equation (1) is different from the charge current value in the CC mode of the apparatus mounting the cell or the charger, following processes need to be performed.
- That is, the time t is obtained under each charge condition beforehand. Then, after obtaining a ratio te/tm wherein the time te is obtained under the condition for preparing the equation (1) and the time tm is obtained under a condition which corresponds to the apparatus or the charger, a result of multiplying measured time by the ratio te/tm is substituted into the equation (1).
- Because the smaller the current value is, the larger the charge ratio in the CC mode charge (charge ratio is ratio of the CC mode charge period to full charge period) is. That is, because the smaller the current value is, the larger the charge ratio is. In addition, since the ratio varies according to cell size, cell shape, manufacturer, cell component material and the like, it is necessary to grasp effects of the current value by performing experiments.
- For preparing the equation (1), it is necessary to determine the constants A and B in the equation (1). For this purpose, as mentioned above, it is appropriate to determine the constants A and B by using a cell or a battery which is the same kind as the Li-ion cell or battery which is the target of the capacity estimation. Because, in commercial Li-ion cells, many kinds of cathode active materials, anode carbons and electrolytes are used so that initial charge behaviors as well as variations of charge voltage behaviors due to-cell degradation differ.
- Next, the method for determining the constants A and B will be described.
- In this embodiment, a charge and discharge cycle are repeated at least equal to or more than two times by using a Li-ion cell which is a capacity estimation target or the same kind of Li-ion cell as the Li-ion cell, wherein the charge and discharge cycle includes a charge period from 3 hours to 10 days in which charge is performed by the CC-CV charge method, a discharge period, a rest period which is provided as necessary between the charge period and the discharge period. In each cycle, an elapsed time tn from the instant when charge voltage in CC charge reaches a predetermined voltage Vs to the instant when charge condition is changed from a CC mode to a CV mode and discharge capacity Cn (n is a number assigned to each cycle) which is obtained by integrating discharge current with respect to time are obtained and recorded.
- Then, values of the constants A and B from the elapsed time tn and the discharge capacity Cn are determined so that the estimated capacity can be calculated.
- In the following, the determining method of A and B in detail.
- A cell or a battery which is the same kind of a cell or a battery for which degradation is estimated is used and two kinds of charge and discharge cycle experiments are performed so as to obtain data necessary for preparing the equation (1). In one experiment, the environment temperature is set from 10° C. to 30° C. In another experiment, the environment temperature is set from −10° C. to 5° C. In addition, the temperatures are set such that the difference becomes larger than 15° C.
- The reason why the experiments are performed under two kinds of environments is to ensure high accuracy by incorporating characteristics in an environment temperature at the time of performing degradation estimation of an Li-ion cell which is set in an actual apparatus or in an environment temperature which is very close to the realistic one into the equation (1). In addition, by performing experiment in an temperature which is equal to or more than 15° C. lower than the above temperature, cell characteristics data of a cell having very low capacity which is the same as a case when the cell degrades very much. It is not favorable to perform only one kind of experiment in which the temperature is the same as that of usage environment or a temperature close to that of usage environment which is from 10° C. to 30° C. since enormous time is required for a cell to degrade. The present invention surely determines equation (1) sooner than such a conventional procedure.
- The charge and discharge cycle experiment for obtaining the equation (1) is performed by setting a voltage range which is the same as that in a charge condition, charge limit voltage Vc, and discharge cut-off voltage Vd, of a real apparatus mounting Li-ion cells. In addition, a charge current value which is the same as a charge current value of the real apparatus or which is from 0.033 CmA to 1.0 CmA is used.
- The charge period per one cycle is set to be from 3 hours to 10 days or from 3 days to 10 days which is favorable when the experiment environment temperature is set from 10° C. to 30° C. By setting the charge period per one cycle to be from 3 hours to 10 days or 3 days to 10 days desirably, the cell degrades moderately per one cycle so that data necessary for preparing the equation (1) accurately can be obtained efficiently.
- When the charge period is smaller than 3 hours, the Li-ion cell degrades slowly. Thus, several hundred cycles are necessary for obtaining the equation (1) accurately so that enormous time is consumed. In some cases, charge is performed insufficiently so that degradation and insufficient charge are mixed. As a result, degradation status and characteristics of the Li-ion cell can not obtained properly, which is not favorable.
- When the charge period is longer than 10 days, the time necessary for performing one cycle experiment becomes long so that it takes much time for obtaining necessary data, which is also not favorable.
- When the experiment environment temperature is set to be from −10° C. to 5° C. inclusive, the charge period is set to be shorter than that used in the above experiment from 10° C. to 30° C., that is, the charge period is set to be from 3 hours to 24 hours or from 3 hours to 12 hours desirably. Because, when the cell is charged and discharged in a low temperature, cell degradation due to overcharge when charging within the set voltage range becomes smaller than that of the case when the cell is charged and discharged at about room temperature. Therefore, in the case of the experiment at the low temperature, the number of the charge discharge cycles in a predetermined period is increased in order to accelerate cell degradation. When the upper limit of the charge period is set as 12 hours, the effect further increases.
- If the charge period is longer than 24 hours (one day), the number of the cycles decreases so that cell degradation does not proceed adequately. This is not favorable. If the charge period is shorter than 3 hours, cell charge becomes insufficient so that cell degradation does not proceed adequately. This is not favorable, either.
- The discharge current value in the charge and discharge cycle is set to be from 0.5 CmA to 2.0 CmA. When the lower limit is set to be from 1.0 CmA to 2.0 CmA, data can be obtained more efficiently. When the discharge current is smaller than 0.5 CmA, it takes much time to discharge completely, which is not favorable. When the discharge current is larger than 2.0 CmA, discharge period becomes too short. Thus, measurement values of discharge capacity may vary. In addition, when degradation proceeds, the capacity may decrease abruptly so that the equation (1) can not be prepared accurately. This is not favorable.
- When the charge and discharge cycle experiment is performed, a rest is included between charge and discharge as necessary due to limitation of settings of the apparatus.
- More particularly, in order to obtain the constants A and B in the equation (1), a time tn which is taken until the CC mode charge ends from the time when the charge voltage is a voltage Vs and a discharge capacity Cn are measured for each charge and discharge cycle, wherein the voltage Vs is equal to or larger than the discharge cut-off voltage and smaller than the charge limit voltage Vc in the CC mode charge, the discharge capacity Cn is obtained by integrating discharge current with respect to time, and n is a number which is assigned to each cycle. Then, the measured times tn and capacities Cn are plotted to be applied to the equation (1).
- As for above mentioned charge and discharge cycle experiment, more than two cycles are performed in order to obtain data necessary for achieving high accuracy in the degradation estimation result which is within ±20% of real capacity. If only one cycle is performed, only two points of data can be used for determining the constants A and B in the equation (1) so that accurate degradation estimation becomes impossible.
- In the following, a method for determining whether the cell degrades will be described.
- It is judged that Li-ion cell is degraded when the estimated capacity Ce becomes smaller than a predetermined limit capacity Cmin. In the above method, the estimation may be performed by comparing estimated specific capacity Ce/Co (Co is nominal capacity) and limit specific capacity Cmin/Co. This method is favorable since Ce/Co is directly calculated by the equation (1).
- As the limit capacity Cmin, a value of 60% of the nominal capacity is used for example (in this case, Cmin/Co=0.6).
- Next, an apparatus which can estimate degradation by using the above method will be described.
- The apparatus includes:
- means for obtaining, when the Li-ion cell is charged by a CC-CV charge method, an elapsed time t from the instant when charge voltage in CC charge reaches a predetermined voltage Vs to the instant when charge condition is changed from a CC mode to a CV mode; and
- an arithmetic circuit for calculating an estimated capacity Ce of the Li-ion cell by using the time t; and
- means for outputting a signal representing that the Li-ion cell is degraded when the estimated capacity Ce becomes smaller than a predetermined limit capacity Cmin.
- A configuration of the apparatus will be described in detail with reference to FIG. 2.
- FIG. 2 shows a configuration of a general power source part and peripheral-equipment of an apparatus which mounts the Li-ion cell. This part includes the
power source part 1 which includes Li-ion cells ion cells cell control part 3 in thepower source part 1. Thepower source part 1 includes acharger 4 which charge thecells cell control part 3. Alogic part 5 includes aninterface 6, aCPU 7, amemory 8 andkeyboard controller 9. Thecell control part 3 is connected to theCPU 7 via theinterface 6 and receives information on thecells cell control part 3 sends data on cell control to theCPU 7. In thelogic part 5, theCPU 7 and thememory 8 provide instructions for control, perform operations, store information on cell control and store data. IDs of thecells keyboard controller 9. Aline 10 is connected to thekeyboard controller 9 for sending data. - The equation (1) of the present invention is stored in an available memory in the
CPU 7 and the like beforehand. Or, the equation (1) is stored in an memory chip which is added as necessary. The CPU provides thecell control part 3 with an instruction to measure the time t from the instant when the charge voltage in the CC mode charge reaches the voltage Vs which is within the range of use voltage until the instant when the CC mode charge is changed to the CV mode charge, and receives data of the time t from thecell control part 3. In addition, theCPU 7 performs calculation by substituting the time t into the equation (1) so that theCPU 7 obtains the estimated capacity Ce(or the estimated specific capacity Ce/Co). Thememory 8 stores the estimated capacity Ce(or the estimated specific capacity Ce/Co) if necessary. If Ce<Cmin (or Ce/Co<Cmin/Co ) when the estimated capacity Ce (or the estimated specific capacity Ce/Co) is compared with the predetermined limit capacity Cmin (or limit specific capacity Cmin/Co), the Li-ion cell is estimated to be degraded. The result of degradation estimation is applied to the body of the apparatus via theline 10 such as a system management bus. The body of the apparatus displays the estimation result to a display part of the apparatus and sounds an alert by using a beep or a voice as necessary. Accordingly, the apparatus which has the degradation estimation capability for the Li-ion cells are realized. The configuration is not limited to the above mentioned one as long as the degradation estimation of the present invention is performed. - The method of the present invention can also be applied to a Li-ion battery. A configuration example of the Li-ion battery is shown in FIG. 3.
- FIG. 3 shows a general circuit configuration of the Li-ion battery in which three Li-ion cells ( 12-1, 12-2, and 12-3) are connected in series.
- In FIG. 3, 11 indicates the body of the battery and 12-1, 12-2, and 12-3 indicate the Li-ion cells. 13 indicates an IC for protection which monitors voltage, current, temperature and the like, and performs safety control. 14-1, 14-2, and 14-3 indicate FET for controlling charge current of each cell indicated by 12-1, 12-2, and 12-3. 14-A and 14-B indicate the FET controlling discharge and charge current of the battery. And, 14-C indicates the FET controlling earth current from the body. These FETs insulate the current in case of extraordinarily enormous current. 15 indicates a PTC (Positive Temperature Coefficient) element which is a temperature fuse which interrupts current when the temperature increases too much or when the current is large extraordinarily. 16 indicates a current fuse which interrupts current when the amount of current increases abnormally. 17 indicates a plus terminal, 18 indicates a minus terminal and 19 indicates a terminal for outputting information and controlling.
- In FIG. 3, a timer is mounted in the
IC 13 for protection in the above safety mechanism and the equation (1) is stored in an available memory beforehand. TheIC 13 monitors the voltage across the Li-ion cells 12-1, 12-2, and 12-3 by using terminals Vcc and Vss and counts elapsed time t from the time when charge voltage in the CC mode reaches a start voltage Vs until the CC mode charge is changed to the CV mode charge wherein the start voltage Vs is determined beforehand such that it is equal to or higher than the discharge cut-off voltage Vd and lower than the charge limit voltage Vc. TheIC 13 can monitor one of the voltages of each Li-ion cell, 12-1, 12-2, or 12-3 by using terminals VCC and VC1, VC1 and VC2, or VC2 and VSS, or can monitor the all voltages of each cells if necessary. Then, the counted time t is substituted into the equation (1) so that the estimated capacity Ce is calculated. An additional IC can be provided at a proper position in the battery if necessary. When the estimated capacity Ce (or estimated specific capacity Ce/Co) becomes smaller than a predetermined limit capacity Cmin (or limit specific capacity Cmin/Co), a warning (by using electronic signal in this case) which represents capacity degradation is output to the body of the apparatus which mounts the battery via the terminal 19 in order to display the warning on a display or sound an alarm. - When the body of the apparatus does not have any means of warning of degradation, it is favorable that the battery itself includes means of outputting the warning, for example, by displaying characters or an image, or sounding beep tones or a voice. Such a battery can be realized by applying the present invention and conventional technologies.
- Accordingly, it becomes possible to provide the Li-ion battery which includes means of performing degradation estimation according to the present invention by modifying an existing Li-ion battery minimally. The configuration is not limited to that of the above mentioned Li-ion battery as long as the degradation estimation of the present invention is performed.
- The degradation estimation method and the Li-ion battery which includes the degradation estimation capability of the present invention can be applied to apparatuses for which high reliability is required. By applying the present invention to the apparatuses, degradation status of cells can be grasped properly and the cells can be exchanged in a timely fashion so that troubles of the apparatuses can be avoided. However, there is no problem in that any apparatus which uses Li-ion cells adopts the degradation estimation method of the present invention. Accordingly, cells can be exchanged with minimum waste so that the present invention can be used very advantageously.
- Examples in the First Embodiment
- In the following, the capacity estimation method, the degradation estimation method and a degradation estimation apparatus for the Li-ion cell and the Li-ion battery will be described in more detail. However, the present invention is not limited to the following examples.
- An experiment was performed by using a cell charge and discharge automatic test apparatus which has data collection and data storing capability in order to obtain an equation for a prismatic Li-ion cell (the nominal capacity is 600 mAh). In the experiment, two kinds of
temperatures 25° C. and 0° C. were used. The test cells were cycled 5 times by discharging at 600 mA (charge current ratio of 1.0 C, 1.0 CmA) to 2.75V and charging in CC-CV mode at 600 mA (1.0 CmA) to 4.1V with intervals of one hour between charge and discharge. That is, the discharge and charge cycle was repeated 5 times. The charge period was 7 days when the temperature was 25° C. and the charge period was 3 hours when the temperature was 0° C. - In each cycle of charge and discharge, an elapsed time t from the charge start time to the end of CC mode charge and a specific capacity Cn/Co (n is a number assigned to each cycle) were measured. In this experiment, it is assumed that the voltage Vs is the same as charge voltage at the time when the CC mode charge starts.
- FIG. 4 shows obtained data. FIG. 4 shows relationship between the elapsed times t and the specific capacities Cn/Co which are obtained by the charge and discharge cycle experiment. 4-A in FIG. 4 shows a group of data obtained from the test at 25° C., and 4-B in FIG. 4 shows a group of data obtained from the test at 0° C. The constants A and B in the equation (1) which is a function of t and which represents the estimated specific capacity Ce/Co are obtained by using the data so that a following equation (2) is prepared.
- Ce/Co=1.067×t0.228 (2)
- Strictly speaking, “t” in this equation (2) should be represented as (t/1 hour), that is, should be represented as a dimensionless number. However, in the equation (2), it is represented as simply t for the sake of convenience. The same goes for following equations.
- The relationship which is represented by the equation (2) is indicated by 4-C in FIG. 4.
- In order to verifying validity of the equation (2), a following experiment was performed.
- In this experiment, the same kind of prismatic Li-ion cell (the nominal capacity is 600 mAh) was used. The test cells were cycled 5 times by discharging at 600 mA (1.0 CmA) to 2.75V and charging in CC-CV mode at 600 mA (1.0 CmA) to 4.1V for 3 hr with intervals of 10 minutes between charge and discharge.
- In each cycle of charge and discharge, a time t (hr) necessary for the CC mode charge, and the ratio of discharge capacity Cn to the nominal capacity 600 mAh, that is, a specific capacity Cn/Co were recorded.
- The results are shown in FIG. 5. FIG. 5 shows the relationship between the CC mode charge times and the specific capacities Cn/Co which are obtained by the charge and discharge cycles. As shown in FIG. 5, results until the 11th cycle are plotted. In FIG. 5, 5-A indicates a curve represented by the equation (2) which is obtained by data shown in FIG. 4. 5-B indicates a curve which has 20% larger specific capacity values than those of 5-A (assuming +20% error). 5-c indicates a curve which has 20% smaller specific capacity values than those of 5-A (assuming −20% error).
- As shown in FIG. 5, every plotted data is within the error range ±20%. In addition, the curve 5-A of the equation (2) is very close to each data point. Thus, it can be understood that the result of the degradation estimation is superior.
- An experiment was performed by using a cell charge and discharge automatic test apparatus which has data collection and data storing capability in order to obtain an equation for a prismatic Li-ion cell (the nominal capacity is 600 mAh). In this experiment, the cell was cycled in the same condition as the experiment for preparing the equation in the example 1-1. In each cycle of charge and discharge, an elapsed time t (hr) from the charge start time to the end of CC mode charge and a specific capacity Cn/Co were measured.
- In this example, the constants A and B in the equation (1) of the necessary time t of the CC mode and the estimated specific capacity Ce/Co were obtained by using one set of data for each experiment in 0° C. and 25° C. so that a following equation (3) was prepared.
- Ce/Co=1.089×t0.114 (3)
- In order to verifying validity of the equation (3), a following experiment was performed.
- In this experiment, the same kind of prismatic Li-ion cell (the nominal capacity is 600 mAh) was used. The test cells were cycled 12 times by discharging at 600 mA (1.0 CmA) to 2.75V and charging in CC-CV mode at 600 mA (1.0 CmA) to 4.1V for 3 hr with intervals of 10 minutes between charge and discharge.
- In each cycle of charge and discharge, a time t (hr) necessary for the CC mode charge, and the ratio of discharge capacity Cn to the nominal capacity 600 mAh, that is, a specific capacity Cn/Co were recorded.
- The equation (3) was applied to the charge and discharge cycle experiment results obtained like this so that maximum and minimum errors were obtained. The maximum error was −21.7% and the minimum error was −1.0%.
- In the same way, equations were prepared by using 2 sets of data, 3 sets of data, 5 sets of data, 10 sets of data, 11 sets of data and 15 sets of data respectively for each of 0° C. and 25° C. Then, each equation was applied to the above mentioned experiment results so that maximum and minimum errors were obtained. Accordingly, the accuracy of the equation according to the number of data sets was verified.
- The result is shown in FIG. 6. FIG. 6 shows the number of data sets used for preparing the equations and widths of absolute value of error where the upper limit indicates the maximum error (absolute value) and the lower limit indicates the minimum error (absolute value).
- As is evident from FIG. 6, by using equal to or more than 2 sets of data for each experiment of 0° C. and 25° C. for preparing the equation, accurate equation can be prepared so that the error falls within ±20%. By using an equation prepared by using one set of data for each experiment of 0° C. and 25° C., the error may exceed ±20% which is unfavorable. In addition, it is revealed that accuracy of an equation prepared by using equal to or more than 11 sets of data for each experiment is almost the same as that prepared by using from 2 sets of data to 10 sets of data.
- An experiment was performed in order to obtain an equation by using the same kind of prismatic Li-ion cell as was used in the example 1-1. In the experiment, two kinds of
temperatures 25° C. and 0° C. were used. In each of thetemperatures 25° C. and 0° C., the test cells were cycled 5 times by discharging at 600 mA (discharge current ratio was 1.0 C, 1.0 CmA) to 2.75V and charging in CC-CV mode at 600 mA (charge current ratio was 1.0 C, 1.0 CmA) to 4.1V for 7 days with intervals of one hour between charge and discharge. - In each cycle of charge and discharge, an elapsed time t (hr) from the charge start time to the end of CC mode charge and a specific capacity Cn/Co (n is a number assigned to each cycle) were measured. According to this experiment, a following equation (4) was obtained.
- Ce/Co=1.015×t0.0794 (4)
- In order to verify validity of the equation (4), a following experiment was performed.
- In this experiment, the same kind of used prismatic Li-ion cell as that used for preparing the equation was collected and used for the experiment. The test cells were cycled 3 times by discharging at 600 mA (1.0 CmA) to 2.75V and charging in CC-CV mode at 600 mA (1.0 CmA) to 4.1V for 3 hr with intervals of 10 minutes between charge and discharge. In each cycle of charge and discharge, a time t (hr) necessary for the CC mode charge, and a specific capacity Cn/Co of the discharge capacity Cn to the nominal capacity 600 mAh were recorded.
- By applying data obtained by this experiment, the accuracy of the equation (4) was verified.
- The result of verification is shown in FIG. 7. FIG. 7 shows the relationship between the CC mode charge time and the specific capacities Cn/Co for the degraded cell. In FIG. 7, 7-A indicates a curve represented by the equation. 7-B, which is shown for comparison, indicates a curve represented by the equation (2) prepared in the example 1-1. 7-C indicates a curve which has 20% smaller specific capacity values than those of the equation (4), that is, a curve indicating error of −20%.
- As is evident from FIG. 7, the curve 7-B indicating the equation (2) exists very close to each obtained data, which shows that the accuracy of the estimation is high. On the other hand, as for the equation (4) obtained by this example, the curve deviates by much amount from data. In addition, as for the equation (4), data exists at a position which is lower than −20% error position, which is unfavorable. That is, it can be understood that the equation (2) prepared in the example 1-1 is more suitable for capacity estimation than the equation (4) prepared in this example.
- An experiment was performed in order to obtain an equation by using the same kind of prismatic Li-ion cell as was used in the example 1-1. In the experiment, two kinds of
temperatures 25° C. and 0° C. were used. In each of thetemperatures 25° C. and 0° C., the test cells were cycled 5 times by discharging at 600 mA (discharge current ratio was 1.0 C, 1.0 CmA) to 2.75V and charging in CC-CV mode at 60 mA (charge current ratio was 0.1 C, 0.1 CmA) to 4.1V for 3 hr with intervals of one hour between charge and discharge. - In each cycle of charge and discharge, an elapsed time t (hr) from the charge start time until the end of CC mode charge and a specific capacity Cn/Co (n is a number assigned to each cycle) were measured. According to this experiment, a following equation (5) was obtained.
- Ce/Co=1.046×t0.219 (5)
- In order to verify validity of the equation (5), a following experiment was performed.
- In this experiment, the same kind of used prismatic Li-ion cell as that used for preparing the equation (5) was collected and used for this experiment. The test cells were cycled 4 times by discharging at 600 mA (1.0 CmA) to 2.75 V and charging in CC-CV mode at 60 mA (0.1 CmA) to 4.1V for 30 days with intervals of one hour between charge and discharge. In each cycle, CC mode charge time (hr), and a specific capacity Cn/Co of the discharge capacity Cn to the nominal capacity 600 mAh were recorded.
- By applying data obtained by this experiment, the accuracy of the equation (5) was verified.
- The result of verification is shown in FIG. 8. FIG. 8 shows the relationship between the CC mode charge times and the specific capacities Cn/Co for the degraded cell. 8-A indicates a curve representing the equation (5). 8-B, which is shown for comparison, indicates a curve representing the equation (2) prepared in the example 1-1.
- As is evident from FIG. 8, both of the curves of the equation (5) prepared in this example and the equation (2) which is a comparison example prepared in the example 1-1 exist near the data, which shows that both equations have favorable high accuracy. More precisely, it can be seen that the equation (2) enables more accurate degradation estimation than the equation (5). Therefore, it is understood that the range from 3 days to 10 days of the charge period is more favorable than the range from 3 hours to 10 days for the test at higher temperature.
- An experiment was performed for a 18650 size cylindrical Li-ion cell (the nominal capacity was 1400 mAh). In this experiment, two kinds of
temperatures 30° C. and 5° C. were used. The test cells were cycled 4 times by discharging at 2800 mA (2.0 CmA) to 2.75V and charging in CC-CV mode at 1400 mA (1.0 CmA) to 4.1V with intervals of one hour between charge and-discharge. When the temperature was 30° C., 7 values from 2.5 hours to 11 days were used for the charge period per one cycle. The 7 values are shown in FIG. 9. When the temperature was 5° C., the charge period per one cycle was set to be 5 hours. - In each cycle of charge and discharge, an elapsed time t (hr) from the time when the charge voltage was 3.50V until the end of CC mode charge and the specific capacity Cn/Co were recorded.
- This experiment was performed for 21 days. The constants A and B in the equation (1) of t and Ce/Co were determined by using sets of data in 30° C. and the same number of sets of data in 5° C. obtained in this experiment so that a equation was prepared. When equal to or more than five sets of data were obtained for each of 30° C. and 5° C., the equation was prepared from five sets of data for each of 30° C. and 5° C.
- In addition, when the charge period was set to be 7 days in 30° C. experiment temperature, another experiment was performed in which the charge current was set as 46 mA (0.033 CmA). A time t from the charge voltage of 3.5V until the end of the CC mode charge was obtained. As a result, t(1.0)/t(0.033)=0.030 was obtained as conversion ratio of the CC mode necessary time by using 1400 mA(1.0 CmA) to the CC mode charge time by using 46 mA (0.033 CmA) as the charge current.
- Additionally, a following experiment was performed.
- In this experiment, a used 18650 size cylindrical Li-ion cell (the nominal capacity was 1350 mAh) was collected and set in the charge and discharge automatic test apparatus. Then, charge of the CC-CV charge method was performed wherein the charge limit voltage was 4.1V, the charge current was 44.6 mA (0.033 CmA) and the charge period was 7 days. Next, discharge was performed wherein discharge current was 2700 mA (2.0 CmA) and the discharge cut-off voltage was 2.75V. Then, a time t′ (hr) elapsed from the instant when the charge voltage was 3.5V to the instant when the CC mode charge ended and the ratio of discharge capacity Cm to the nominal capacity Co, that is, a specific capacity Cm/Co were recorded. Then, a value of t calculated by t=t′×(t(1.0)/t(0.033))=0.030 t′ was substituted into each above mentioned equation so that the estimated specific capacity Ce/Co was calculated. After that, absolute value of Err=(Ce/Co-Cm/Co), that is, absolute value of difference between the estimated specific capacity Ce/Co and the actual measurement specific capacity Cm/Co was obtained.
- The result is shown in FIG. 9. FIG. 9 is a table showing each charge period per one cycle used for preparing the equations of this example, the number of sets of data for each experiment, prepared equations and absolute values of estimation errors calculated by applying the equations.
- As is evident from FIG. 9, when any charge period from 3 hours to 10 days, which is a condition of the present invention for preparing the equation, is used, the estimation error is within ±20% which shows favorable high accuracy. On the other hand, when any charge period smaller than 3 hours or larger than 10 days is used, large error which exceeds ±20% occurs which shows that there is a problem in estimation accuracy.
- An experiment was performed for a 18650 size cylindrical Li-ion cell (the nominal capacity is 1400 mAh). In this experiment, the test cells were cycled 5 times by discharging at 2800 mA (2.0 CmA)-to 2.75V and charging in CC-CV mode at 1400 mA (1.0 CmA) to 4.1V with intervals of one hour between charge and discharge. In this experiment, temperatures were 20° C. for higher temperature test, and −11° C., −10° C., 0° C., 5° C., 6° C., and 15° C. for lower temperature tests. Charge period was 7 days for the higher temperature tests and 5 hours for the lower temperature tests. 2 cycles were performed for each temperature. In each cycle, an elapsed time t (hr) of the CC mode charge and the specific capacity Cn/Co were recorded.
- The constants A and B in the equation (1) of t and Ce/Co were determined by using two sets of data for the higher temperature (20° C.) test and the lower temperature test. Thus, six equations were obtained.
- In addition, as another higher temperature test, the test cell was cycled under the same condition as above mentioned, except charge current of 46 mA (0.033 CmA) instead of 1400 mA (1.0 CmA), and charge limit voltage of 3.5V instead of 4.1V. As a result, t(1.0)/t(0.033)=0.029 was obtained as conversion ratio of the elapsed time by using 1400 mA(1.0 CmA) to the elapsed time by using 46 mA (0.033 CmA).
- Additionally, a following experiment was performed.
- In this experiment, a used 18650 size cylindrical Li-ion cell (the nominal capacity is 1350 mAh) was collected and set in the charge and discharge automatic test apparatus. Then, charge of the CC-CV charge method was performed wherein the charge limit voltage was 4.1V, the charge current was 44.6 mA (0.033 CmA) and the charge period was 7 days in the same way as the example 1-5. Next, discharge was performed wherein discharge current was 2700 mA (2.0 CmA) and the discharge cut-off voltage was 2.75V. Then, a time t′ (hr) elapsed from the instant when the charge voltage was 3.5V to the instant when the CC mode charge ended and the ratio of discharge capacity Cm to the nominal capacity Co, that is, a specific capacity Cm/Co were recorded.
- Then, a value of t calculated by t=t′×(t(1.0)/t(0.033))=0.029t′ was substituted into each of above mentioned six equations so that the estimated specific capacities Ce/Co were calculated, wherein t(1.0)/t(0.033)=0.029 was the above mentioned conversion ratio. After that, absolute value of Err=(Ce/Co-Cm/Co), that is, absolute value of difference between the estimated specific capacity Ce/Co and the actual measurement specific capacity Cm/Co was obtained.
- The result is shown in FIG. 10. FIG. 10 is a table showing each temperature for the lower temperature tests used for preparing the equations of this example, obtained equations, and absolute values of estimation errors calculated by applying the equations.
- As is evident from FIG. 10, when the temperature is set from −0° C. to 5° C. for the lower temperature tests and the temperature difference between the higher and lower temperature tests is equal to or higher than 15° C., the estimation error is within ±20% which shows favorable high accuracy.
- In this example, a charger which charges a battery by using the constant current and constant voltage charge (CC-CV) method and performs capacity and degradation estimation of the battery was manufactured and will be shown.
- The battery includes three prismatic Li-ion cells (nominal capacity of each is 600 mAh) which are connected in series. In the CC-CV charge method used by the charger for charging the battery, the charge limit voltage is 12.3V, the charge current is 600 mA(1.0 CmA) and charge-end current which is a threshold for ending charge is 60 mA.
- A schematic diagram of the charger is shown in FIG. 11. That is, FIG. 11 shows a configuration of the charger according to this embodiment. As shown in FIG. 11, the
charger 20 is connected to a utility power source byterminals charger 20 viaterminals - The
charger 20 converts current provided from the utilitycurrent source 21 into direct current by arectifier 27. Thecharger 20 controls the above mentioned charge conditions by using apower source microprocessor 29 and acharge control microprocessor 30 while monitoring charge current, battery voltage, and monitoring temperature by athermistor 28. In addition, thecharger 20 performs control for detecting and avoiding overcharge, over discharge, abnormal large current, abnormal battery temperature increase and the like by using thepower source microprocessor 29 and thecharge control microprocessor 30. - The charge is stopped by a
switch 31 when the charge is completed or when something abnormal is detected. Completion of charge or something abnormal is displayed to adisplay part 32 by using thecharge control microprocessor 30. Thedisplay part 32 includes LEDs (light-emitting diodes) which indicate a state of charge (red one is used for indicating a charging state, green one is used for indicating completion of charge), LEDs which indicate degradation estimation results (red one is used for indicating the cell should be replaced, yellow one is used for indicating the cell should be replaced shortly, green one is used for indicating replacement of the cell is not necessary) and an LCD (liquid crystal display) which displays the degradation estimation results numerically and abnormal events. - As for the LEDs for indicating the state of charge, the green LED illuminates only when the charge completes. During charge, the red LED illuminates. In other cases, that is, in abnormal cases, either of the LEDs does not illuminate.
- As for the LEDs for indicating the degradation estimation results, the red LED illuminates when the estimated specific capacity Ce/Co is smaller than 60%, which means that the battery should be replaced by a new battery. The yellow LED illuminates when the estimated specific capacity Ce/Co is equal to or larger than 60% and smaller than 70%, which indicates that the battery should be replaced within several months which depend on using condition. The green LED illuminates when the estimated specific capacity Ce/Co is larger than 70% since the battery is new or can be used for a long time which means that replacement of the battery is not necessary.
- The LCD (liquid crystal display) is provided for the sake of displaying information by characters. For example, faulty connection of the battery, alarm information on safety and the like are displayed on the LCD, by which it can be recognized that normal charge is difficult. In addition, degradation estimation results are shown on the LCD. Further, in the case that the utility power source stops to provide power unexpectedly, power is supplied from the battery placed in the charger so that information of the outage of the utility power source is displayed only when the voltage of the battery is higher than 8.25V.
- For performing degradation estimation of the present invention, a program embodying the equation (2) and procedures shown in FIG. 12 is stored in the
charge control microprocessor 30 beforehand. The degradation estimation is performed by measuring CC charge time t by the internal timer while monitoring the battery voltage and substituting the time t into the equation (2). The estimation result is displayed on thedisplay part 32. - As for the charger of this example, since charge is not necessarily performed after complete discharge, the degradation estimation is performed in the following way.
- Data of change of charge voltage with respect to time is stored in the charge control microprocessor beforehand. The battery voltage is monitored from the start of charge. Time measuring is started from the time when the charge voltage becomes a voltage which is higher than the start voltage and is nearest to a value of 8.25+0.15×n (n is an integer, 0≦n25) which is between or equal to 8.25V (2.75V/cell) and 12V (4.0V/cell) and increases in steps of 0.15V. Then, an elapsed time t″ until the charge voltage reaches the charge limit voltage 12.3V (until CC mode charge ends) is measured. After that, the charge time t″ from the above start voltage to 12.3 V is converted into the CC mode charge time t from 8.25 V to 12.3 V by using the voltage-profile data stored in the
charge control microprocessor 30. - Next, the procedures for degradation estimation stored in the
charge control microprocessor 30 shown in FIG. 12 will be described. - (step A) The charge is started by placing the battery in the charger so that the battery voltage is monitored. It is monitored whether the battery voltage V reaches a value which satisfies V=8.25+0.15×n (n is an integer, 0≦n≦25) (6).
- (step B) When the battery voltage reaches the value which satisfies the equation (6), time measuring is started. The time is counted until the battery voltage reaches the charge limit voltage 12.3V.
- (step C) When the battery voltage reaches the charge limit voltage 12.3V, the time measuring ends. When the charge start voltage is the discharge cut-off voltage 8.25V, the measured time t is used for degradation estimation.
- (step D) When the charge start voltage is higher than 8.25V, the measured time is converted into the CC mode charge time taken for the battery voltage to change from 8.25V to 12.3V by comparing measured data with data of voltage change with respect to time which is stored beforehand. The converted time t is used for degradation estimation. The time t is substituted into the equation (2) so that the estimated specific capacity Ce/Co is calculated.
- (step E) The calculation result is displayed on the LCD and the LED. According to the estimated specific capacity, one of red, yellow and green LEDs illuminates. At the same time, a numeric value is displayed on the LCD. The value is displayed on the LCD for 30 seconds and the LED illuminates the charger is connected to the utility power source.
- By using this charger, a used battery of the same type was charged. The degradation estimation result was displayed 4.5 minuets after the start of charge. “65%” was displayed on the LCD and the yellow LED illuminated. The charge was completed in 2.5 hours. Then, the charged battery was mounted in the battery charge and discharge automatic test apparatus so that constant current discharge was performed wherein the discharge current was set to be 600 mA(1.0 CmA) and the discharge cut-off voltage was set to be 8.25V. The discharge capacity was 414.2 mAh according to this test. This value is equivalent to 69% in specific capacity, which revealed that the error of capacity estimation was about 4%.
- Accordingly, it is evident that the charger having capabilities of the present invention can estimate degradation in high accuracy.
- Li-ion battery shown in FIG. 3 was manufactured. The Li-ion battery can be mounted in a portable information terminal which has a capability of performing the CC-CV mode charge on condition that the charge limit voltage is 12.3V, charge current is 600 mA(1.0 CmA) and the charge-end current is 60 mA. The battery includes three prismatic Li-ion cells (nominal capacity is 600 mAh) 12-1, 12-2, and 12-3 which are connected in series. The equation (2) and the data of change of charge voltage with respect to time as described in the example 1-7 are stored in the IC for protection such that the CC mode charge time taken for the charge voltage to change from 8.25V to 12.3V can be calculated even when the battery voltage at the charge start time is higher than the discharge cutoff voltage 8.25V.
- In addition, a program is stored in a memory in the
IC 13 for protection. According to this program, following process is performed. The voltage across the cells is monitored by using Vcc and Vss. Time measuring is started from the time when the charge voltage becomes a voltage which is higher than a charge start voltage Vs and is nearest to a value of 8.25+0.15×n (n is an integer, 0≦n≦25) which is higher than the charge start voltage Vs, wherein the charge start voltage Vs which is determined beforehand is equal to or higher than the discharge cut-off voltage Vdd and lower than the charge limit voltage Vc. Then, an elapsed time t″ until the charge voltage reaches the charge limit voltage 12.3V is measured. After that, the time t″ is converted into the CC mode charge time t taken for the voltage to change from 8.25V to 12.3V. The time t is substituted into the equation (2) so that the estimated specific capacity Ce/Co is calculated. - The battery is configured such that the result is output to the body of the portable terminal in order to be displayed on an LCD of the portable terminal via the
terminal 19. - On the LCD, a numerical value indicating the estimation result is displayed as % and a bar in which a part of the bar corresponding to the % value ratio is colored is displayed.
- A command for doing degradation estimation is provided from the body of the terminal concurrently with the start of charge. Procedures for performing the degradation estimation are the same as those shown in FIG. 12 except for the result to be sent to the body since the result is displayed on the display of the terminal.
- The battery was mounted in the portable information terminal and used for one hour. After that, charge of the battery was started by connecting the terminal to the utility power source. The estimation result of the battery was displayed as 87% right after the start of the charge. After checking that a sign of charge completion was displayed, the information terminal was powered off and the battery was removed from the terminal. Then, the battery was connected to the battery charge and discharge automatic test apparatus by using proper codes and the discharge capacity was measured by discharging the battery on condition that the discharge current was 600 mA(1.0 CmA) and the discharge cut-off voltage was 8.25V. The discharge capacity was 534.6 mAh, which is 89.1% in specific capacity. Thus, the error of estimation was ±2.1%.
- Therefore, it became evident that the degradation estimation capability of the battery of the present invention can provide estimation result with high accuracy.
- Second Embodiment
- Next, the second embodiment of the present invention will be described. In the second embodiment, capacity estimation is performed by using equations simpler than those of the first embodiment.
- Outline of the Second Embodiment
- The outline of the second embodiment will be described in the following.
- The capacity estimation method of the Li-ion cell according to the second embodiment includes the steps of:
- obtaining, when the Li-ion cell is charged by a constant current and constant voltage charge method (in the following, the constant current and constant voltage charge method will be called as CC-CV charge method), an elapsed time t from the instant when charge voltage in constant current charge (in the following, the constant current charge will be called as CC charge) reaches a predetermined voltage Vs to the instant when the charge voltage reaches a charge limit voltage Vc, wherein charge current is equal to or smaller than Co/(20 hours) wherein Co is a nominal capacity of the Li-ion cell; and
- calculating an estimated specific capacity Ce/Co of the Li-ion cell by using an equation Ce/Co=At+B (7), wherein Ce is an estimated capacity of the Li-ion cell, and A and B are positive constants.
- That is, when performing charge by the CC-CV charge method shown in FIG. 1, a time t elapsed from the time when the charge time reaches a voltage Vs until CC charge starts (that is, the charge voltage reaches Vc) is monitored, wherein the voltage Vs is between or equal to the discharge cut-off voltage Vd and the charge limit voltage Vc. Then, the estimated specific capacity Ce/Co of the Li-ion cell is calculated from the equation (7) by using t.
- In this case, the constant current Ic is set to be smaller or equal to Co/(20 hours) in order to estimate the capacity of the cell accurately. If the charge is performed by using a current larger than this, error becomes large in capacity estimation by using the equation (7).
- In addition, it is favorable that the Li-ion cell which is a target of the capacity estimation of the present invention is a Li-ion cell which is used in a condition that each charge period is equal to or shorter than 30 days. When the charge period is longer than 30 days, large estimation error may arise since degree of degradation due to overcharge may vary and degradation of cell component material with respect to time becomes outstanding.
- Further, it is favorable that the charge voltage Vs at the time when time measuring is started is equal to or higher than the discharge cut-off voltage Vd and at least 0.2V lower than the charge limit voltage Vc. When the difference between the voltage Vs and the charge limit voltage Vc is lower than 0.2V, measured time t becomes so short that large estimation error may occur.
- The equation of this embodiment is applied to capacity estimation only when cell degradation is such state that discharge capacity C is equal to or more than 50% of the nominal capacity Co, wherein the discharge capacity C is obtained by integrating discharge current with respect to time when discharging from full charge state to the discharge cut-off voltage Vd. When the cell is degraded largely such that the specific capacity C/Co is lower than 50%, the relationship between the elapsed time t and the specific capacity C/Co does not become linear as indicated in the equation (7) so that error of capacity estimation by using the equation becomes large, which is not favorable.
- The equation (7) represents relationship between the time t in the constant current (CC) mode charge in a charge condition of an apparatus mounting the Li-ion cell or a charger to which the equation is applied and an estimated specific capacity Ce/Co under the charge condition. When the charge current value in the CC mode for obtaining the equation (7) is different from the charge current value in the CC mode of the apparatus or the charger, following processes need to be performed.
- The time t is obtained under each charge condition beforehand. Then, after obtaining a ratio te/tm wherein the time te is obtained under the condition for preparing the equation (7) and the time tm is obtained under a condition which corresponds to the apparatus or the charger, a result of multiplying measured time by the ratio te/tm is substituted into the equation (7). The reason is the same as one explained in the first embodiment.
- As in the case of the first embodiment, it is most appropriate to determine the constants A and B by using the same kind of a cell or a battery as the Li-ion cell or battery for which capacity is estimated.
- Thus, in this embodiment, the positive constants A and B are calculated by the steps of:
- repeating a charge and discharge cycle at least equal to or more than three times by using the same kind of Li-ion cell as a Li-ion cell which is a target of capacity estimation, wherein the charge and discharge cycle includes a charge period from 3 days to 10 days by the CC-CV charge method, a discharge period, a rest period provided between the charge period and the discharge period as necessary, wherein charge current in the charge period is equal to or smaller than Co/(20 hours), discharge current in the discharge period is from Co/(5 hours) to Co/(0.5 hour) and a predetermined discharge cut-off voltage Vd is used in the discharge period;
- obtaining an elapsed time tn from the instant when charge voltage in CC charge reaches a predetermined voltage Vs to the instant when the charge voltage reaches a charge limit voltage Vc and discharge capacity Cn in each cycle; and
- determining values of the constants A and B from the elapsed time tn and the discharge capacity Cn.
- To be more specific, a cell or a battery which is the same kind as the Li-ion cell for which capacity is estimated is used. Charge is performed by the CC-CV charge method in which the cell is charged by using a constant current equal to or smaller than 0.05 CmA (Co/20 hours) until the charge voltage reaches the charge limit voltage Vc, after that, the charge is continued by using a constant voltage. Charge period is set to be from 3 days to 30 days. As for discharge, discharge current is set to be from 2 CmA to 20 CmA (from Co/5 hours to Co/0.5 hour) and the discharge cut-off voltage Vd is set to be the same as that of the cell for which capacity is estimated. A rest is provided between charge and discharge as necessary. The cycle is repeated equal to or more than three times. Then, an elapsed time tn from the instant when charge voltage in CC charge reaches a predetermined voltage Vs to the instant when the CC mode charge ends (when the charge voltage reaches a charge limit voltage Vc) and discharge capacity Cn in each cycle are recorded, wherein Vs is between Vd and (Vc-0.2V) and Cn is obtained by integrating discharge current with respect to time. Then, values of the constants A and B are determined from the elapsed time tn and the discharge capacity Cn.
- That is, the left side of the equation (7) is substituted into Cn/Co and t in the right side is substituted into tn. Then, the constants A and B are determined such that the equation represents the relationship between Cn/Co and tn.
- Charge period per one cycle is set to be from 3 days to 30 days. By setting the charge period like this, cell degradation per one cycle proceeds properly so that data necessary for preparing the equation (7) accurately can be obtained efficiently. If the charge period per one cycle exceeds 30 days, degree of degradation due to overcharge becomes large and degree of degradation of cell component material with respect to time becomes large. Thus, the relationship between the time tn and the specific capacity Cn/Co does not become linear relationship which is represented by the equation (7) (assuming that Cn/Co is substituted for the left side and that tn is substituted into t in the right side). Therefore, large error may occur by using the equation in which the constants A and B are determined by such data.
- In addition, when the charge period per one cycle is longer than 30 days, the elapsed time per one cycle becomes long so that it takes much time to obtain necessary data.
- On the other hand, when the charge period per one cycle is shorter than 3 days, degradation of electrodes due to the charge and discharge cycle becomes remarkable and degree of degradation due to overcharge becomes small. When the constants A and B are determined in this condition and capacity estimation is performed by using the equation (7) having the constants A and B, capacity estimation error becomes large on condition that the target cell is used such that conditions of discharge and charge are different each time, except that the target cell is used such that charge and discharge are performed frequently.
- Discharge current in the charge and discharge cycle is set to be from 0.2 CmA to 2.0 CmA. When the discharge current is set from 1.0 CmA to 2.0 CmA, data can be obtained more efficiently. When the discharge current is smaller than 0.2 CmA, it takes much time to discharge completely, which i not favorable. When the discharge current is larger than 2.0 CmA, the time taken for discharge becomes so short that measured values of discharge capacity may vary and the capacity decreases abruptly when degradation proceeds. Thus, the equation (7) is not prepared accurately, which is not favorable.
- When performing the charge and discharge cycle experiment, a rest can be taken for a predetermined time between charge and discharge as necessary, for example, due to limitation of setting of the apparatus.
- In each charge and discharge cycle, the time t elapsed from the time when the charge voltage is the voltage Vs until the CC mode ends and the charge specific capacity Cn/Co obtained by discharge are measured, wherein the voltage Vs is from the discharge cut-off voltage Vd to (Vc-0.2V) which is 0.2V lower than the charge limit voltage Vc. Then, the time t and the specific capacity Cn/Co are plotted so that the constants A and B are obtained by applying the time t and the specific capacity Cn/Co to the equation (7).
- In the charge and discharge cycle experiment, the cycle is repeated equal to or more than three times in order to obtain data of the time tn and the specific capacity Cn/Co necessary for obtaining accurate result of capacity estimation Ce such that Ce is within the bounds of ±20% of actual capacity C.
- When the cycle is repeated only two times, only two points of data are obtained for determining the constants A and B so that accurate capacity estimation becomes impossible, which is not favorable.
- Temperature conditions under which the charge and discharge cycle experiment is performed are not particularly determined. However, it is favorable that the experiment is performed under temperature range which the manufacturer recommends as temperature range of the Li-ion cell, or under the same temperature as that under which the Li-ion cell is actually used. When the temperature for the experiment is different from the temperature of actual use vary much, the capacity is corrected by using data representing relationship between discharge capacity and temperature.
- Next, a degradation estimation apparatus for performing degradation estimation using the above mentioned method will be described.
- The apparatus includes:
- means for obtaining, when the Li-ion cell is charged by a CC-CV charge method, an elapsed time t from the instant when charge voltage in CC charge reaches a predetermined voltage Vs to the instant when the charge voltage reaches a charge limit voltage Vc; and
- an arithmetic circuit for calculating an estimated specific capacity Ce/Co of the Li-ion cell by using an equation Ce/Co=At+B, wherein Ce is an estimated capacity of the Li-ion cell, Co is a nominal capacity of the Li-ion cell, and A and B are positive constants;
- an arithmetic circuit for estimating degradation state of the Li-ion cell on the basis of the estimated specific capacity Ce/Co; and
- means for displaying estimation result obtained by the circuit for estimating, or, generating an alarm which warns of degradation of the Li-ion cell.
- As the degradation estimation apparatus, for example, the apparatus described in the first embodiment with reference to FIG. 2 can be used. In this embodiment, the equation (7) is used.
- In addition, the capacity estimation method of the present invention for the Li-ion cell can be applied to a battery by providing a control microprocessor and additional memory as necessary in the battery. The battery shown in FIG. 3 is an example of the battery to which this capacity estimation method is applied. In this embodiment, the equation (7) is used. By using the equation (7), capacity estimation can be realized by simpler calculation.
- Like the first embodiment, the degradation estimation method and the Li-ion battery which includes the degradation estimation capability of the present invention can be applied to apparatuses for which high reliability is required such as a backup power source. By applying the present invention to the apparatuses, degradation status of cells can be grasped properly and-the cells can be exchanged in a timely fashion so that troubles of the apparatuses can be avoided. There is no problem in that apparatuses which use Li-ion cells adopts the degradation estimation method or the Li-ion battery which has the degradation estimation capability. Accordingly, cells can be exchanged with minimum waste so that the present invention can be used very advantageously.
- In the following, the capacity estimation method, the degradation estimation method and a degradation estimation apparatus for the Li-ion cell and the Li-ion battery will be described in more detail. However, the present invention is not limited to the following examples.
- An experiment was performed by using a cell charge and discharge automatic test apparatus which has data collection and data storing capability in order to obtain an equation for a cylindrical Li-ion cell (18650 type, the nominal capacity is 1350 mAh). In the experiment, test was done at 25° C. The test cell was cycled 5 times by discharging at 1350 mA (1.0 CmA) to 2.75V and charging in CC-CV mode at 45 mA (0.033 CmA) to 4.1V for 30 days with intervals of one hour between charge and discharge.
- In each cycle of charge and discharge, an elapsed time t (hr) from the charge start time until the CC mode charge ended and a specific capacity C/Co which is a ratio of discharge capacity C to the nominal capacity Co were measured, wherein the discharge capacity C was calculated by integrating the discharge current with respect to time.
- FIG. 13 shows obtained data. FIG. 13 shows relationship between the elapsed times t and the specific capacities C/Co which are obtained by the charge and discharge cycle experiment. “◯” in this figure shows the obtained data. The constants A and B in the equation (1) which is a function of t and which represents the estimated specific capacity Ce/Co are obtained by using the data so that a following equation (8) is prepared.
- Ce/Co=0.0263×t+0.207 (8)
- Strictly speaking, “t” in this equation (2) should be represented as (t/1 hour), that is, should be represented as a dimensionless number. However, in the equation (8), it is represented as simply t for the sake of convenience. The same goes for following equations.
- The equation (8) is represented as a line shown in FIG. 13.
- In order to verifying validity of the equation (8), a following experiment was performed.
- In this experiment, the same kind of cylindrical Li-ion cell (the nominal capacity was 1350 mAh) was used. The test cell was cycled by discharging at 1350 mA (1.0 CmA) to 2.75V and charging in CC-CV mode at 45 mA (0.033 CmA) to 4.1V for 30 days with intervals of 10 minutes between charge and discharge.
- In each cycle of charge and discharge, a CC charge time t (hr), and the ratio of discharge capacity C to the nominal capacity 1350 mAh, that is, a specific capacity C/Co are recorded.
- The result of this experiment is shown by “▪” in FIG. 13. As shown in FIG. 13, data shown by a plurality of “▪” is very close to values of the equation (8) shown by the line, which means that the capacity estimation result is accurate.
- In order to make a comparison, another experiment was performed for preparing an equation under the same condition as the above mentioned experiment except that the charge current of this experiment was 135 mA (0.1 CmA). FIG. 14 shows relationship between obtained specific capacity C/Co and the time t elapsed until the CC mode charge ended. “” in this figure shows obtained data. As is evident from FIG. 14, when the charge current is larger than 0.05 CmA, the specific capacity C/Co is not linearly related to the time t, which means that accurate equation can not be prepared.
- Charge and discharge cycle experiment was performed in which the cycle was repeated up to five times at the maximum under the same conditions as the example 2-1 except that four prismatic Li-ion cells (the nominal capacity is 600 mAh) were used, the charge current was 20 mA(0.033 CmA), the discharge current was 600 mA(1.0 CmA) and the charge periods were 2.5 days, 3 days, 30 days and 35 days. Then, equations for each charge period were prepared for 153 days by the same procedure as was shown in the example 2-1.
- As a result, an equation which was prepared in the case where the charge period was 2.5 days was
- Ce/Co=0.00961×t+0.704 (9),
- an equation which was prepared in the case where the charge period was 3 days was
- Ce/Co=0.0167×t+0.485 (10), and
- an equation which was prepared in the case where the charge period was 30 days was
- Ce/Co=0.0180×t+0.447 (11).
- In the case where the charge period was 35 days, the charge and discharge cycle was repeated two times. An equation prepared by using data of the two cycles was
- Ce/Co=0.00627×t+0.801 (12).
- In order to evaluate estimation accuracy of the obtained equations, following experiment was performed.
- A prismatic cell (the nominal capacity was 600 mAh) was removed from a cellular phone and set in the cell charge and discharge automatic test apparatus by connecting each of the cathode terminal and anode terminal to the apparatus. Then, the cell was charged in CC-CV mode at 20 mA (0.033 CmA) to 4.1V for one day. After one hour rest, the cell was discharged at 600 mA (1.0 CmA) to 2.75V. Then, the time t (hr) taken for the CC charge and ratio of the discharge capacity C to the nominal capacity, that is, the specific capacity C/Co were obtained. According to this experiment, the time t was 15.31 hours and the specific capacity C/Co was 63.5%.
- The CC charge time t=15.31(hr) was substituted into each of the equations (9), (10), (11) and (12). Then, the estimated specific capacity Ce/Co and estimated error
- Err=C/Co-Ce/Co=0.635-Ce/Co was obtained for each equation.
- As a result, the estimated specific capacity Ce/Co for the equation (10) corresponding to 3 day charge is 74.1%, the estimated specific capacity Ce/Co for the equation (11) corresponding to 30 day charge is 72.3%, and the estimated error Err is −10.6% and −8.8% respectively. Both of the errors are within ±20%. Thus, it was revealed that good estimation can be performed by using the equations (10) and (11).
- On the other hand, when the equation (9) corresponding to 2.5 day charge is used, the estimated specific capacity becomes 85.1% and the estimated error becomes −21.6%. In addition, when the equation (12) corresponding to 35 day charge is used, the estimated specific capacity becomes 89.7% and the estimated error becomes 26.2%. Therefore, both of them can not be used since the error is too large.
- For comparison purposes, following equation was prepared from data of initial two cycles performed in the experiment of 3 day charge,
- Ce/Co=0.00579×t+0.819 (13).
- Then, the estimated specific capacity Ce/Co and the estimated error Err were calculated by substituting t=15.31 into the equation (13). As a result, the estimated specific capacity Ce/Co was 90.8% and the estimated error Err was −27.3%, which revealed that a good equation can not be obtained from data of only two cycles.
- Charge and discharge cycle experiment was performed by under the same conditions as the example 2-1 except that four cylindrical Li-ion cells (18650 type, the nominal capacity is 1350 mAh) were used and four kinds of discharge currents, 135 mA(0.1 CmA), 270 mA(0.2 CmA), 2700 mA(2.0 CmA) and 3000 mA(2.2 CmA) were used. Then, equations for each discharge current were prepared by the same procedure as in the example 2-1.
- The results are shown in FIG. 15. In FIG. 15, “ 15-1” indicates a line representing an equation
- Ce/Co=0.00918×t+0.727 (14)
- which was prepared from the experiment in which the discharge current was 0.1 CmA. “ 15-2” indicates a line representing an equation
- Ce/Co=0.0242×t+0.255 (15)
- which was prepared from the experiment in which the discharge current was 0.2 CmA. “ 15-3” indicates a line representing an equation
- Ce/Co=0.0205×t+0.372 (16)
- which was prepared from the experiment in which the discharge current was 2.0 CmA. “ 15-4” indicates a line representing an equation
- Ce/Co=0.0521×t−0.552 (17)
- which was prepared from the experiment in which the discharge current was 2.2 CmA.
- In order to evaluate estimation accuracy of the obtained equations, following experiment was performed.
- A Li-ion battery which was used in a laptop computer was disassembled and a cylindrical Li-ion cell (18650 type, the nominal capacity was 1350 mAh) was removed. Then, leads are soldered to the cathode terminal and the cell side (anode), and the Li-ion cell was set in the cell charge and discharge automatic test apparatus. Then, the cell was charged in CC-CV mode at 45 mA (0.033 CmA) to 4.1V for one day. After one hour rest, the cell was discharged at 1350 mA (1.0 CmA) to 2.75V. Then, the time t (hr) taken for the CC charge and ratio of the discharge capacity C to the nominal capacity Co, that is, the specific capacity C/Co were obtained. According to this experiment, the time t was 19.34 hours and the specific capacity C/Co was 0.671.
- The obtained time t=19.34 (hr) was substituted into each of the equations (14), (15), (16) and (17). Then, the estimated specific capacity Ce/Co and estimated error Err=C/Co-Ce/Co=0.671-Ce/Co was obtained for each equation.
- As a result, the estimated specific capacity Ce/Co obtained by the equation (15) corresponding to 0.2 CmA discharge current was 72.3% and the estimated error Err was −5.2%. The estimated specific capacity Ce/Co obtained by the equation (16) corresponding to 2.0 CmA discharge current is 76.8%, and the estimated error Err was 9.7%. Thus, good estimation results were obtained in these cases where the discharge current used for the experiment for obtaining the equation was from 0.2 CmA to 2.0 CmA. On the other hand, as for the equation (14) corresponding to 0.1 CmA discharge current which is not within the above mentioned range, the estimated specific capacity was 90.5% and the estimated error was −23.4%. In addition, as for the equation (17) corresponding to 2.2 CmA discharge current which is not within the above mentioned range, the estimated specific capacity was 45.6% and the estimated error was +21.5%. It revealed that accurate Li-ion cell capacity estimation is difficult by using these equations obtained by experiments where the discharge current was not within the above mentioned range since estimation error becomes large.
- In this example, a charger which charges a battery by using the CC-CV charge method and performs capacity and degradation estimation of the battery was manufactured and will be shown. The battery includes three cylindrical Li-ion cells (18650 type, nominal capacity of each is 1350 mAh) which are connected in series. In the CC-CV charge method used by the charger for charging the battery, the charge limit voltage is 12.3V, the charge current is 45 mA(0.033 CmA) and the total charge period is 3 days.
- A configuration of this charger is the same as that shown in FIG. 11. In this embodiment, the equation (8) is used.
- As for the charger of this example, since charge is not necessarily performed after complete discharge, the degradation estimation is performed in the following way.
- Data of change of charge voltage with respect to time is stored in the charge control microprocessor beforehand. The battery voltage is monitored from the start of charge. Time measuring is started from the time when the charge voltage becomes a voltage which is higher than the start voltage and is nearest to a value in four values between or equal to 8.25V (2.75V/cell) and 11.7V (3.9V/cell which is 0.2V/cell lower than the charge limit voltage 4.1V/cell) increasing in steps of 1.15V, that is, 8.25V, 9.40V, 10.55V, and 11.70V. Then, an elapsed time t″ until the charge voltage reaches the charge limit voltage 12.3V, that is, until the CC mode charge ends is measured. After that, the time t″ is converted into the CC mode charge time t elapsing between the time when the voltage is 8.25V and when the voltage is 12.3V by performing comparison calculation using the stored data.
- Next, the procedures for degradation estimation stored in the
charge control microprocessor 30 shown in FIG. 16 will be described. - (step A) The charge is started by placing the battery in the charger so that the battery voltage is monitored. It is monitored whether the battery voltage V reaches a value which satisfies V=8.25, 9.40V, 10.55V, or 11.70V.
- (step B) When the battery voltage V reaches any one of the values, time measuring is started. The time is counted until the battery voltage reaches the charge limit voltage 12.3V.
- (step C) When the battery voltage V reaches the charge limit voltage 12.3V, the time measuring ends. When the charge start voltage is the discharge cut-off voltage 8.25V, the measured time t is used for degradation estimation.
- (step D) When the charge start voltage is higher than 8.25V, the measured time is converted into the CC mode charge time required for the battery voltage to change from 8.25V to 12.3V by comparing measured data with data of voltage change with respect to time which is stored beforehand. The converted time t is used for degradation estimation. The time t is substituted into the equation (8) so that the estimated specific capacity Ce/Co is calculated.
- (step E) The calculation result is displayed on the LCD and the LED. According to the estimated specific capacity, one of red, yellow and green LEDs illuminates. At the same time, a numeric value is displayed on the LCD. The value is displayed on the LCD for 30 seconds and the LED illuminates while the charger is connected to the utility power source.
- By using this charger, a used battery of the same type was charged. The degradation estimation result was displayed 15.7 hours after the start of charge. “62.0%” was displayed on the LCD as the estimated specific capacity and the yellow LED illuminated.
- Then, the charged battery was mounted in the battery charge and discharge automatic test apparatus so that constant current discharge was performed wherein the discharge current was set to be 1350 mA(1.0 CmA) and the discharge cut-off voltage was set to be 8.25V. The discharge capacity was 860.0 mAh according to this test. This value is equivalent to 63.7% as specific capacity, which revealed that the error of capacity estimation was about 1.7%.
- Accordingly, it becomes evident that the charger having capabilities of the present invention can estimate degradation in high accuracy.
- A Li-ion battery which is mounted in a laptop computer was manufactured. The configuration is the same as that shown in FIG. 3. The Li-ion battery has a capability of performing the CC-CV charge mode charge on condition that the charge limit voltage is 12.3V, charge current is 45 mA(0.033 CmA) and the total charge period is 3 days. The battery includes three cylindrical Li-ion cells (nominal capacity is 1350 mAh) 12-1, 12-2, and 12-3 which are connected in series. The equation (8) and the basic data of change in charge voltage with respect to time as described in the example 2-4 are stored in the IC for protection such that the time of CC mode charging from 8.25V to 12.3V can be calculated even when the battery voltage at the charge start time is higher than the discharge cutoff voltage 8.25V.
- In addition, a program is stored in a memory in the
IC 13 for protection. According to this program, following process is performed. The voltage across the cells is monitored. Time measuring is started from the time when the charge voltage becomes a voltage which is higher than a charge start voltage Vs and is nearest to a value in 8.25V, 9.40.V, 10.55V, or 11.70V, wherein the charge start voltage Vs which is determined beforehand is equal to or higher than the discharge cut-off voltage Vd and lower than the charge limit voltage Vc. Then, an elapsed time t″ until the charge voltage reaches the charge limit voltage 12.3V is measured. After that, the time t″ is converted into the CC mode charge time t required for the voltage to change from 8.25V to 12.3V. The time t is substituted into the equation (8) so that the estimated specific capacity Ce/Co is calculated. - The battery is configured such that the result is output to the body of the laptop computer in order to be displayed on an LCD of the laptop computer via the
terminal 19. - On the LCD, a numerical value indicating the estimation result is displayed as % and a bar in which a part of the bar corresponding to the % value ratio is colored is displayed.
- A command for doing degradation estimation is provided from the body of the laptop computer concurrently with the start of charge. Procedures for performing the degradation estimation are the same as those shown in FIG. 16 except for the result to be sent to the body since the result is displayed on the display of the laptop computer.
- The battery was mounted in the laptop computer and used for one hour. After that, charge of the battery was started by connecting the computer to the utility power source. The estimation result of the battery was displayed as 73% after the start of the charge. After checking that a sign of charge completion was displayed, the laptop computer was powered off and the battery was removed from the laptop computer. Then, the battery was connected to the battery charge and discharge automatic test apparatus by using proper codes and the discharge capacity was measured by discharging the battery at 1350 mA(1.0 CmA) to 8.25V. As a result, the discharge capacity was 1093.5 mAh, which means that the specific capacity was 81.0%. Thus, the error of estimation was −8.0%.
- Therefore, it became evident that the degradation estimation capability of the battery of the present invention can provide estimation result with high accuracy.
- Third Embodiment
- In the following, a third embodiment will be described. In the third embodiment, the capacity estimation method and the degradation estimation method using the current value after a lapse of a predetermined time in the constant voltage mode (in the following, the constant voltage mode will be called as CV mode) and the time taken for charge current to decrease to a predetermined current will be described, wherein ½ can be used as the predetermined time and 5 minutes can be used as the predetermined current. In addition, the Li-ion battery and apparatuses which include these capabilities will be described.
- Outline of the Third Embodiment
- In the third embodiment, the capacity estimation method and the degradation estimation method, a Li-ion battery and apparatuses which can estimate capacity and degradation according to these methods will be described. In these methods, charge of a Li-ion cell or a Li-ion battery is performed in which the CC-CV charge method is used. As mentioned before, in the constant current and constant voltage (CC-CV) method, the Li-ion cell or the Li-ion battery is charged at a constant current until the cell voltage becomes a predetermined charge limit voltage, after that, the Li-ion cell or the Li-ion battery is charged while the voltage is kept constant.
- For estimating capacity and degradation according to methods of the present embodiment, after the charge mode is changed to the CV mode from the constant current mode (in the following, the constant current mode will be called as CC mode), required time for the charge current to decrease to a value, for example ½ of the initial current of the CV mode, is measured. Or, the charge voltage after a lapse of a predetermined time, for example 5 minuets, since the CV mode charge starts is measured. The measured time or voltage is used for the estimation.
- In the following, the capacity estimation method and the degradation estimation method of the present invention will be described more precisely.
- FIG. 17 shows change of the cell voltage V and the charge current Ic with respect to time when the Li-ion cell is charged by the CC-CV charge method.
- In FIG. 17, when the Li-ion cell or the Li-ion battery (these will be collectively called Li-ion cell in the following) is charged by the CC-CV charge method, first, in the CC mode, the Li-ion cell is charged at a constant charge current Ic0 until the cell voltage reaches a predetermined charge limit voltage Vc, that is, from the time tcs to t 0. After that, in the CV mode, the Li-ion cell is charged while the cell voltage is kept constant in which the charge current Ic decreases with time.
- Normally, the charge limit voltage Vc is from 4.1V/cell to 4.2V/cell (/cell means per once cell), the charge current is from 0.033 CmA to 1.0 CmA, the discharge cut-off voltage is from 2.75V/cell to 3.0V/cell
- The inventors repeated charge and discharge cycle several times in which each cycle included one charge process and one discharge process. In the charge process, the Li-ion cell was charged at the constant current Ic0 until the cell voltage reached the predetermined charge limit voltage Vc. In the discharge process, the Li-ion cell after the charge process was discharged, which corresponds to a process in which the cell is used for a power source. Then, the inventors conducted a close study of correlations between the discharge capacity Cd (will be called capacity in the following) which was obtained by integrating discharge current with respect to time and variations of charge current in the CV mode (will be called CV charge in the following). As a result, the inventors discovered that decreasing pattern of charge current in the CV charge varied as the charge and discharge cycle was repeated. The characteristics of the variation of the charge current decreasing pattern are shown in FIG. 18.
- FIG. 18 shows variations of the charge current in the CV charge with time per one cycle. In FIG. 18, the charge current decreases with time in any cycle, and, the decreasing speed simply descends until 40th cycle. However, in cycles after the 40th cycle, decreasing of charge current is faster than that of 40th cycle in initial stage of CV charge process, after the initial stage, decreasing of charge current becomes slower with time. That is, as shown in FIG. 18, the decreasing pattern in a cycle after the 40th cycle is different from that before the 40th cycle.
- FIG. 19 shows relationships between elapsed time since the CV charge starts until the charge current becomes half and specific capacity percentage Cr=100×(C/Co), that is, ratio of the cell capacity C to the nominal capacity, in which the time at which CV current becomes half is shown as t ½.
- As shown FIG. 19, as the specific capacity Cr decreases as the number of repetitions of the cycle increases, the elapsed time t ½ for the current to decrease to half increases. However, in the neighborhood where the specific capacity Cr becomes 85(%), the time t½ starts to decrease as the specific capacity Cr decreases. This trend of variation forms symmetric shape with respect to a line (indicated by dotted line in the figure) passing through the cusp and indicating Cr=constant, wherein the cusp is a point at which the gradient of a curve changes discontiguously and corresponds to the peak of t½. In addition, this variation trend is approximated into two lines which are symmetric with respect to the above mentioned dotted line. When t½ increases or does not change as the number -of repetitions of the cycle increases, the trend can be approximated into an equation
- Cr=-At½+B (18′),
- wherein A and B are positive constants. When t ½ decreases as the number of repetitions of the cycle increases, the trend can be approximated into an equation
- Cr=+At½+B (19′),
- wherein B′ is a positive constant.
- Since the absolute values are the same and signs are opposite as for the coefficient −A of t ½ in the equation (18 ) and the coefficient +A of t½ in the equation (19 ), an equation B′=2Cc-B can be obtained wherein Cc represents the specific capacity Cr at the cusp.
- FIG. 20 shows relationship between charge current I 5min at the instant when a predetermined time (5 minutes in the figure) elapses since CV charge starts and the specific capacity Cr.
- As shown FIG. 20, as the specific capacity Cr decreases as the number of repetitions of the cycle increases, the charge current I 5min increases linearly. Like the case shown in FIG. 19, in the neighborhood where the specific capacity Cr becomes 85(%), the charge current I5min starts to decrease linearly as the specific capacity Cr decreases. Like the case shown in FIG. 19, the trend of variation forms symmetric shape with respect to a line (indicated by dotted line in the figure) passing through the cusp corresponding to the peak of I5min and indicating Cr=constant.
- This variation trend is approximated into two lines which are symmetric with respect to the above mentioned line. When I 5min increases or does not change as the number of repetitions of the cycle increases, the trend can be approximated into an equation
- Cr=−MI5min+N (20′),
- wherein M and N are positive constants. When I 5min decreases as the number of repetitions of the cycle increases, the trend can be approximated into an equation
- Cr=+MI5min+N (21′),
- wherein N′ is a positive constant.
- Since the absolute values are the same and signs are opposite as for the coefficient −M of I 5min in the equation (20′) and the coefficient +M of I5min in the equation (21′), an equation N′=2Cc-N can be obtained wherein Cc represents the specific capacity Cr at the cusp.
- First Method for Capacity Estimation and Degradation Estimation in the Third Embodiment
- In the first method for capacity estimation and degradation estimation of the Li-ion cell according to the present invention, capacity estimation and degradation estimation are performed by using equations generalized from the equations (18′) and (19′).
- More specifically, as shown in FIG. 17, in the CC-CV charge, the time t α elapsed until the charge current Ic becomes α times of Ic0 (αIc0) since the charge mode is changed to the CV mode when the cell voltage V reaches the charge limit voltage Vc is monitored, wherein α is a constant and 0<α<1. In the early stage in using the cell, that is, when the number n of repetitions of charge and discharge cycle is relatively small so that tα increases or does not change as n increases, the specific capacity Cr is estimated by using an equation
- Cr=−Atα+B (18)
- which is a linear function of t α, wherein A and B are positive constants. When the number n of repetitions of charge and discharge cycle increases so that tα decreases as n increases, the specific capacity Cr is estimated by-using an equation
- Cr=+Atα+B′ (19)
- which is a linear function of t α, wherein B′ is positive constants. By using the estimated value, the nominal capacity Co and an equation Ce=(Cr/100)×Co, the capacity Ce of the Li-ion cell which is the target of the capacity estimation can be estimated.
- When the estimated capacity Ce is smaller than a predetermined value, the Li-ion cell is estimated to be degraded.
- In order to make this method effective, it is necessary that the constant α satisfies 0<α<1. In addition, there is a favorable range of α in order to perform accurate estimation. As is evident from FIG. 19, ½ is within the favorable range of α.
- Second Method for Capacity Estimation and Degradation Estimation in the Third Embodiment)
- In the second method for capacity estimation and degradation estimation of the Li-ion cell according to the present invention, capacity estimation and degradation estimation are performed by using equations generalized from the equations (20′) and (21′).
- More specifically, as shown in FIG. 17, in the CC-CV charge, the charge current I tm at the time when a predetermined time tm elapses since the charge mode is changed to the CV mode when the cell voltage V reaches the charge limit voltage Vc is measured, wherein 0<tm≦0.8Co/Ic0 and Co is the nominal capacity of the cell. In the early stage in using the cell, that is, when the number n of repetitions of charge and discharge cycle is relatively small so that Itm increases or does not change as n increases, the specific capacity Cr is estimated by using an equation
- Cr=−MItm+N (20)
- which is a linear function of I tm, wherein M and N are positive constants. After the number n of repetitions of charge and discharge cycle increases, and, then, when Itm decreases as n increases, the specific capacity Cr is estimated by using an equation
- Cr=+MItm+N′ (21)
- which is a linear function of I tm, wherein N′ is positive constants. By using the estimated value, the nominal capacity Co and an equation Ce=(Cr/100)×Co, the capacity Ce of the Li-ion cell which is the target of the capacity estimation can be estimated.
- When the estimated capacity Ce is smaller than a predetermined value, the Li-ion cell is estimated to be degraded.
- There is a favorable range of tm in order to perform accurate estimation. As is evident from FIG. 20, 5 minute is within the favorable range of tm. As will be described in following examples, for example, in the example 3-5, the favorable range is from 1 minute to 15 minute. As mentioned above, tm should satisfy an
inequality 0<tm≦0.8 Co/Ic0. As described later, the maximum value of Ic0 is 1.0 CmA. Even when Ic0 is the maximum, the inequality becomes 0<tm≦48 minutes. Thus, the above mentioned favorable range of tm satisfies this inequality. - In either of the first and second methods, there are two equations used for performing capacity estimation. Thus, judgment as to which equation should be used is necessary. The judgment is performed according to whether t α increases, does not change or decreases by comparing tα with that of previous charge and discharge cycle. The judgment is also performed according to whether Itm increases, does not change or decreases by comparing Itm with that of previous charge and discharge cycle. If it is insured that increase, unchanged and increase of tα compared with that of previous cycle agree with increase, unchanged and increase of Itm compared with that of previous cycle, the judgement can be performed by monitoring one of tα and Itm.
- There may be cases where, due to a trouble of the apparatus or something, even when t α (or Itm) decreases comparing with that of the previous cycle, the state goes back such that tα (or Itm) increases again. In such a case, the equation (18) (or (20) ) is used again.
- As mentioned above, as for decrease of charge current in the CV charge mode, t α, for example t½ becomes longer and Itm becomes larger as the number of repetitions of the charge and discharge cycle increases, and, tα and Itm become smaller after a number of repetitions of the cycle. This reason is not necessarily clear, however, it can be interpreted as follows.
- In the Li-ion cell, metal oxide of cathode active material is dissolved in the electrolyte and partially deposited on the anode. And, electrolyte is decomposed by reacting with Li + ion and the product generates a passive film on the anode surface. As a result, ohmic resistance and charge-transfer resistance increase so that deintercalation of Li+ ions from the cathode active material and diffusion of intercalated Li+ ions in anode solid delays. Thus, decrease in CV charge current becomes slow. However, after a predetermined number of repetitions of charge and discharge cycle, the number of Li intercalation sites in the cathode and anode active materials decreases due to growth of surface film, collapse of active material crystal and the like. As a result, charge current per the intercalation site increases so that rate of decrease in charge current in the early stage of CV charge becomes high comparing with previous cycles. After the stage, since ohmic resistance and charge-transfer resistance further increase, rate of decrease in charge current becomes lower than the previous cycles.
- In order to make the equations (18), (19), (20) and (21) effective for capacity estimation and degradation estimation of Li-ion cell, the Li-ion cell needs to be charged by current from 0.033 CmA to 1.0 CmA. When the current is smaller than 0.033 CmA, charge is not fully performed and an effect of self-discharge can not be neglected so that the specific capacity calculated by the equations (18), (19), (20) and (21) becomes different from an actual specific capacity, which is not favorable for capacity estimation and degradation estimation. When the charge current is larger than 1.0 CmA, the necessary time for charge is short so that measured time may include large error and variations of charge time due to degradation may differ, which is also not favorable for capacity estimation and degradation estimation of the present invention. Thus, charge current values which are applied to almost all apparatuses mounting the Li-ion cell and chargers are within the above mentioned range.
- Apparatuses and chargers which adopt a current value which is out of the range are used only for very limited use such as in a case when very high rate charge is required in an emergency. These apparatuses and chargers hardly requires the capacity estimation method of the present invention.
- The equations (18), (19), (20) and (21) represent relationship between the necessary time t α for the charge current to become a times from the start of the CV mode charge in a charge condition of an apparatus using Li-ion cell to which the equations are applied and the specific capacity Cr under the condition, or, represent relationship between the charge current Itm after a lapse of a predetermined time from the start of CV charge and the specific capacity Cr.
- When the charge current at the start of the CV mode charge for obtaining the equations (18) and (20) is different from the charge current at the start of the CV mode charge of apparatuses mounting the cell or chargers, following processes need to be performed (the equations (19) and (21) can be prepared based on the specific capacity at the cusp and the equations (18) and (20)).
- That is, the necessary time t α for the charge current to become α times from the start of the CV mode charge or the charge current Itm after a lapse of a predetermined time from the start of CV charge is obtained under each charge condition beforehand. Then, after obtaining a ratio te/tf wherein the time te is under the condition for preparing the equation (18) and the time tf is under the condition which corresponds to the apparatus or the charger, tα is multiplied by the ratio te/tf for conversion, or, after obtaining a ratio Icf/Ic wherein the charge current Ic is under the condition for preparing the equation (20) and the charge current Icf is under the condition which corresponds to the apparatus or the charger, Itm is multiplied by the ratio Icf/Ic for conversion.
- Because, the smaller the current value is, the larger the charge ratio in the CC mode charge (ratio of the CC mode charge to full charge period) is. Thus, charge time in the CV mode changes depending on the charge ratio in the CC mode charge, in addition, necessary time for charge current to decrease to half is affected. Since the effect varies according to cell size, cell shape, manufacturer, cell component material and the like, it is necessary to grasp effects of the current value by performing experiments.
- As mentioned before, it is appropriate that the charge current I tm in the equations (20) and (21) used for capacity estimation and degradation estimation of the Li-ion cell is monitored after a laps of the time tm from 1 minute to 15 minuets since the CV mode charge starts. When tm is shorter than 1 minute, variation of the charge current is very susceptible to the state in the cell so that error may occur in measuring current. When tm is longer than 15 minutes, the relationship between the charge current Itm and the specific capacity Cr hardly become the symmetric shape with respect to the cusp so that error in estimation becomes large, which is not favorable.
- Method of Determining Constants A, B, B′, M, N and N′)
- For preparing the equations (18) and (20), it is necessary to determine the constants A and B in the equation (18) and the constants M and N in the equation (20). For this purpose, it is most appropriate to determine the constants A, B, M and N by using a cell or a battery which is the same kind and the same nominal capacity as the Li-ion cell or the battery which is the target of the capacity estimation. Because, in commercial Li-ion cells, many kinds of cathode active materials, anode carbons and electrolytes are used so that initial charge behaviors as well as variations of charge voltage behaviors due to cell degradation differ.
- In this embodiment, a method of preparing the equations which can be realized in a very short time will be also proposed in order to generate the equations in which the constants A, B, M and N are determined.
- That is, the method includes the steps of:
- repeating a charge and discharge cycle-equal to or more than 5 times for the same kind of cell as Li-ion cell which is a target of capacity estimation, wherein the same charge limit voltage Vc, CC mode charge current Ic0, discharge cut-off voltage Vd as those of Li-ion cell or battery which is a target of capacity estimation by equations (18) and (20) are set, charge period per one cycle is from 3 hours to 10 days or from 3 days to 10 days favorably, discharge current Id is from 0.2 CmA to 2.0 CmA, ambient temperature is from 0° C. to 45° C. or from 15° C. to 30° C. which is more favorable;
- obtaining an elapsed time t α from the instant when charge condition is changed from a CC mode to a CV mode to the instant when charge current becomes α (0<α<1) times of charge current Ic0 in the CC mode;
- obtaining a charge current I tm after a lapse of a predetermined time tm from the instant when charge condition is changed from a CC mode to a CV mode, wherein tm is from one minutes to 15 minutes;
- obtaining specific capacity percentage Cr(Cr=100×(C/Co)) which is a ratio of discharge capacity C (obtained by integrating discharge current with respect to time) to the nominal capacity Co;
- recording t α and Cr obtained in nth cycle (n is a positive integer) as functions of n tα(n) and Cr(n);
- determining the constants A, B and B′ such that the equation (18) approximately represents correlation between t α(n) and Cr(n) when assuming that tα=tα(n) and Cr=Cr(n);
- recording I tm and Cr obtained in nth cycle (n is a positive integer) as functions of n which are Itm(n) and Cr(n); and
- determining the constants M, N and N′ such that the equation (20) approximately represents correlation between I tm(n) and Cr(n) when assuming that Itm=Itm(n) and Cr=Cr(n).
- In the method of determining the constants, as for the equation (18), it is favorable that the charge and discharge cycle is repeated equal to or more than 6 times, and, data of the necessary time t α for the charge current to decrease to a times of Ic0 from the start of the CV mode charge is used wherein the data is obtained in the cycles after the 4th cycle.
- In addition, as for determining the constants B′ and N′ in the equation (19) and (21), the same method as mentioned above can be used by increasing the number of repetitions of the charge and discharge cycle for bringing about a state in which t α(n) or Itm(n) decreases as n increases. When the specific capacity Cr at the time when a state in which tα(n) or Itm(n) increases as n increases changes to a state in which tα(n) or Itm(n) decreases as n increases is obtained, that is, when the specific capacity Cc at the cusp in which tα(n) or Itm(n) is the maximum is obtained, B′ and N′ are determined by equations B′=2Cc-B and N′=2Cc-N.
- The reason why the experiment is performed in temperatures from 0° C. to 45° C. is that Li-ion cells are normally used in temperatures in the range. Thus, accurate degradation estimation can be performed by grasping relationship between the necessary time t α and the specific capacity Cr which reflect progress of cell degradation in the range of temperatures. In addition, it is more favorable to perform the experiment in temperatures from 15° C. to 30° C. since relationship between the necessary time tα and the specific capacity Cr can be grasped reflecting more real degradation since almost all temperature conditions for actual use are within this range.
- The charge period per one cycle is set to be from 3 hours to 10 days. Accordingly, cell degradation per cycle progresses properly so that data for preparing the equation (18) or (20) accurately can be obtained effectively. Particularly, it is favorable that the charge period is set to be from 3 days to 10 days since, by using this range, capacity decrease can be recognized clearly so that data for preparing the equation (18) or (20) can be collected effectively, in addition, an equation by which accurate estimation is realized can be obtained as shown in an example 3-2.
- When the charge period is shorter than 3 hours, the progress of degradation of the Li-ion cell becomes slow so that several hundred cycles are required for obtaining data for preparing the equation (18) or (20) in which accurate estimation can be performed. As a result, large amount of time may be consumed. In addition, in some cases, charge ends insufficiently so that it becomes impossible to grasp proper degradation and characteristics since degradation and insufficient charge are mixed. These are unfavorable.
- When the charge period per one cycle is longer than 10 days, elapsed time per one cycle becomes long so that it takes much time to obtain necessary data, which is also not favorable.
- The discharge current in the charge and discharge cycle experiment is set to be from 0.2 CmA to 2.0 CmA. When the lower limit of the charge current is change to 1.0 CmA, that is, when the charge current is set to be from 1.0 CmA to 2.0 CmA, data can be obtained more effectively. It is not favorable that the charge current is smaller than 0.2 CmA since it take much time to be discharge completely. In addition, when the discharge current is larger than 2.0 CmA, the time required for the discharge becomes so short that measured values of discharge capacity C may vary, in addition, the capacity C decreases suddenly when degradation progresses. Thus, it is not favorable that it becomes impossible to generate the equation (18) and (20) accurately.
- When the charge and discharge cycle experiment is performed, a rest of a predetermined time can be included between charge and discharge as necessary due to limitation of settings of the apparatus.
- More particularly, in order to obtain the constants A and B in the equation (18), the necessary time t α for the charge current to decrease to a times (0<α<1) from the time when the CC mode changes to the CV mode and specific capacity percentage Cr which is a ratio of the discharge capacity Cd to the nominal capacity Co are measured for each charge and discharge cycle, wherein the discharge capacity Cd is obtained by integrating discharge current with respect to time. Then, relationship between the measured time tα and the specific capacity Cr is plotted. Then, the constants A and B are determined such that the equation (18) approximates the relationship accurately.
- The reason why t α and Cr of cycles after the 4th cycle are adopted for determining the constants A and B of the equation (18) is as follows. In many cases, capacity variation until third cycle from the time when the charge and discharge cycle experiment starts is different from that after the cycle due to decomposition reaction on anode carbon which is impurity in the electrolyte. Thus, when data until third cycle is used, an equation in which estimation error is large may be prepared. It is not favorable.
- As for above mentioned charge and discharge cycle experiment, more than 5 cycles are performed in order to obtain data necessary for achieving high accuracy in degradation estimation such that error of estimation result becomes within ±20% of real capacity.
- When only data of only 4th cycle is used, the constants A and B can not be determined so that the equation (18) can not be prepared. It is favorable to use data of equal to or more than 6 cycles for preparing the equation (18) which can perform capacity estimation and degradation estimation more accurately.
- In addition, in the charge and discharge cycle experiment for preparing the equation (20), the charge current I tm after a lapse of a predetermined time tm ranging from 1 minute to 15 minutes from the instant when the CC mode changes to the CV mode and specific capacity percentage Cr which is a ratio of the discharge capacity Cd to the nominal capacity Co are measured for each charge and discharge cycle, wherein the discharge capacity Cd is obtained by integrating discharge current with respect to time. Then, relationship between the measured charge current Itm and the specific capacity Cr are plotted. Then, the constants M and N are determined.
- As for above mentioned charge and discharge cycle experiment, equal to or more than 5 cycles are performed in order to obtain data necessary for achieving high accuracy in degradation estimation such that error of estimation result becomes within ±20% of real capacity.
- The capacity estimation method and the degradation estimation method for the Li-ion cell using the equations (18), (19), (20) and (21) can be applied to various apparatuses which have a function for charging mounted cells by the CC-CV charge method wherein the apparatuses mount the Li-ion cells as a power source or a backup power source.
- As the apparatuses to which the capacity estimation method and the degradation estimation method are applied, for example, the apparatus described in the first embodiment with reference to FIG. 2 can be used. In the configuration shown in FIG. 2, the equations (18′) and (19′) are input in an available memory in the
CPU 7 and the like beforehand, or, in an IC memory which is added as necessary. TheCPU 7 provide instructions for measuring the time t½ for the charge current to decrease to half from the instant when the charge mode changes from the CC mode to the CV mode. In addition, theCPU 7 receives and stores the time t½ measured by thecontrol part 5. TheCPU 7 substitute the time t½ into the equation (18′) or (19′) to perform capacity estimation and degradation estimation according to the first method of capacity estimation and degradation estimation and calculate the result. - The result is stored in the
memory 8 as necessary. The result of degradation estimation is applied to the body of the apparatus via theline 10 such as a system management bus. The body of the apparatus displays the estimation result to a display part of the apparatus and sounds an alert by using a beep as necessary. - In this way, the apparatus which includes capabilities for performing the capacity estimation method and the degradation estimation method for the Li-ion cell according to the present invention. For example, as in the above mentioned case, the Li-ion cell power source apparatus which includes capacity estimation capability and degradation estimation capability can be realized. The configuration is not limited to the above mentioned one as long as the capacity estimation and the degradation estimation of the Li-ion cell can be performed according to the present invention. For example, the Li-ion cell power source apparatus which performs capacity estimation and degradation estimation by using the equations (18) and (19) or equations (20) and (21) can be realized by modifying calculation way in the
CPU 7 and measurement targets in thecontrol part 5 in the configuration shown in FIG. 2. - In addition, the capacity estimation method and the degradation estimation method for the Li-ion cell in the third embodiment can be also applied to a battery by providing a control microprocessor and additional memory as necessary. An example of such a battery is shown in FIG. 3. As for this embodiment, in the configuration shown in FIG. 3, a timer is provided in the
IC 13 for protection of safety mechanism and the equations (18′) and (19 ) are input in an available memory. TheIC 13 for protection monitors the voltage across the Li-ion cells 12-1, 12-2, and 12-3. The time t½ for the charge current to decrease to half from the instant when the charge mode changes from the CC mode to the CV mode is counted and stored. Then, the time t½ is substituted into the equations (18′) and (19′) to calculate the specific capacity Cr. An additional IC can be provided other than theIC 13 for protection at a proper position in the battery as necessary. - The result of degradation estimation is output to the body of the apparatus which mounts the
battery 11. The body of the apparatus displays the estimation result to a display or sounds an alert by using a beep. - In this way, the Li-ion battery which includes the degradation estimation capability of the present invention can be realized from an existing Li-ion battery with a minimum modification. The configuration is not limited to the above mentioned one as long as the capacity estimation and the degradation estimation of the Li-ion cell can be performed according to the present invention. For example, the Li-ion cell battery which performs capacity estimation and degradation estimation by using the equations (18) and (19) or equations (20) and (21) can be realized by modifying calculation way in the IC for protection and measurement targets for performing capacity estimation and degradation estimation of the cell.
- Like the embodiments described so far, the capacity estimation method and the degradation estimation method and the Li-ion battery which includes the capacity estimation capability and the degradation estimation capability of the present invention can be applied to apparatuses for which high reliability is required. By applying the present invention to the apparatuses, degradation status of cells can be grasped properly and the cells can be exchanged in a timely fashion so that troubles of the apparatuses can be avoided. There is no problem in that any apparatus which use Li-ion cells adopts the degradation estimation method or the Li-ion battery which has the degradation estimation capability. Accordingly, cells can be exchanged with minimum waste so that the present invention can be used very advantageously.
- In the following, the capacity estimation method, the degradation estimation method, the capacity estimation apparatus and the degradation estimation apparatus for the Li-ion cell and the Li-ion battery will be described in more detail. However, the present invention is not limited to the following examples.
- An experiment was performed in which a prismatic Li-ion cell (the nominal capacity was 600 mAh) was placed in an oven at a constant temperature of 25° C. and connected to a cell charge and discharge automatic test apparatus which has data collection and data storing capability in order to obtain an equation for the Li-ion cell. In the experiment, the test cell was cycled 10 times by discharging at 600 mA (1.0 CmA) to 2.75V and charging in CC-CV mode at 600 mA (1.0 CmA) to 4.1V for 7 days with intervals of one hour between charge and discharge.
- In each cycle of charge and discharge, an elapsed time t ½ (hr) from the start of the constant voltage (CV) mode charge until the charge current decreases to ½ of that at the start time and a specific capacity percentage Cr(%) which is a ratio of discharge capacity C to the nominal capacity Co were measured, wherein the discharge capacity C was calculated by integrating the discharge current with respect to time, and Cr=100×(C/Co).
- A following equation (22) was obtained from relationship between the time t ½ (hr) and the specific capacity Cr which was obtained from 4th cycle till 10th cycle.
- Cr=−33.7t½+101 (22)
- Another experiment was performed as follows.
- In this experiment, a used prismatic Li-ion cell (the nominal capacity was 600 mAh) was used. The used cell was cycled by discharging at 600 mA (1.0 CmA) to 2.75V and charging in CC-CV mode at 600 mA (1.0 CmA) to 4.1V for 3 hours with intervals of 10 minutes between charge and discharge.
- In each cycle of charge and discharge, the elapsed time t ½ (hr) from the instant when the CV mode charge started to the instant when the charge current decreased to ½ of that at the start time and the specific capacity percentage Cr(%) which was a ratio of discharge capacity C to the nominal capacity 600 mAh were measured and recorded, wherein the discharge capacity C was calculated by integrating the discharge current with respect to time.
- As the specific capacity Cr decreased, the time t 1/2 increased. However, from 9th cycle, as the specific capacity Cr decreased, the time t½ decreased. Therefore, the relationship between the time t½ and the specific capacity Cr from the 9th cycle can be approximated by the equation
- Cr=At½+B′ (19′).
- Thus, it is necessary to determine the constants A and B′ in the equation (19′). The constant A is the same as A, which is 33.7(1/hr), in the equation (22). The constant B′ can be obtained as B′=70.67(%) by using Cc=85.835(%) and B′=2Cc-B, wherein Cc=85.835 is obtained as Cr by substituting t ½ at the 9th cycle, which is 0.45(hr), into the equation (22). Accordingly, the equation (19′) becomes the following equation (23).
- Cr=33.7t½+70.67 (23)
- Validity of the equations (22) and (23) obtained like this was evaluated. The result is shown in FIG. 21.
- FIG. 21 shows relationship between the time t ½ and the specific capacity Cr. In the figure, 21-1 indicates a line which represents the equation (22), 21-2 indicates data (measurement point) of the 9th cycle and 21-3 indicates a line which represents the equation (23).
- In addition, in FIG. 21, 21-4 and 21-5 indicate lines which represent ±10% (that is, error of ±10%) of the estimated capacity obtained by the equation (22). 21-6 and 21-7 are lines which represent ±10% of the estimated capacity obtained by the equation (23).
- As shown in FIG. 21, every point of the measured data is within the error of ±10%. In addition, these points are very close to the lines 21-1 and 21-3 which represent the equations (22) and (23). This reveals that the capacity estimation method and the degradation estimation method of the present invention provides accurate results of capacity estimation and degradation estimation.
- An experiment was performed in which 6 prismatic Li-ion cells (the nominal capacity was 600 mAh) were placed in an oven at a constant temperature of 25° C. and each of the cells was separately connected to a cell charge and discharge automatic test apparatus which has data collection and data storing capability in order to obtain an equation for the Li-ion cell. In the experiment, the 6 test cells were cycled 10 times by discharging at 600 mA (1.0 CmA) to 2.75V and charging in CC-CV mode at 600 mA (1.0 CmA) to 4.1V with intervals of one hour between charge and discharge. The charge period for the 6 cells was 2 hours, 3 hours, 3 days, 7 days, 10 days, and 11 days, respectively.
- In each cycle of charge and discharge, the elapsed time t ½ (hr) from the start of the CV mode charge to the instant when the charge current decreased to ½ of that at the CV mode charge start time and the specific capacity Cr(%) which was a ratio of discharge capacity C to the nominal capacity Co were measured, wherein the discharge capacity C was calculated by integrating the discharge current with respect to time.
- Equations I shown in FIG. 22 were obtained from data of the time t ½ (hr) and the specific capacity Cr which was obtained from 4th cycle till 10th cycle. In this figure, “t” is used as “t½” and “C” is used as “Cr”. In addition, symbols shown in FIG. 23 which represent measurement points used for obtaining the equations I are indicated.
- Another experiment was performed as follows.
- In this experiment, a used prismatic Li-ion cell (the nominal capacity was 600 mAh) was used. The used cell was cycled 45 times by discharging at 600 mA (1.0 CmA) to 2.75V and charging in CC-CV mode at 600 mA (1.0 CmA) to 4.1V for 3 hours with intervals of 10 minutes between charge and discharge. The test was done at ambient temperature.
- In each cycle of charge and discharge, the elapsed time t ½ (hr) from the instant when the CV mode charge started to the instant when the charge current decreased to ½ of that at the CV mode start time and the specific capacity percentage Cr(%) which was a ratio of discharge capacity C to the nominal capacity 600 mAh were recorded. Then, the validity of the equations I shown in FIG. 22 was evaluated.
- In this experiment, the time t ½ for the CV charge current to decrease to half at 30th cycle indicated the maximum value 0.455. After that, the time t½ decreased as the number of repetition increased. Equations II corresponding to the equations I were prepared by using the maximum value of the time t½, the specific capacity Cc=91.8% and the equation B′=2Cc-B. The validity of the equations II was also evaluated.
- FIG. 23 shows relationship between the time t ½ and the specific capacity Cr. In the figure, points of measurement data until 45th cycle are indicated by closed circles (gray circles).
- In addition, in FIG. 23, points of experiment data for preparing the equations I shown in FIG. 22 and lines representing the equations I are shown in which the points of experiment data are indicated by symbols shown in FIG. 22. 23-1 indicates a line which represents the equation I prepared by data of 2 hour charge period, 23-2 indicates a line which represents the equation I prepared by data of 3 hour charge period, 23-3 indicates a line which represents the equation I prepared by data of 3 day charge period, 23-4 indicates a line which represents the equation I prepared by data of 7 day charge period, 23-5 indicates a line which represents the equation I prepared by data of 10 day charge period, 23-6 indicates a line which represents the equation I prepared by data of 11 day charge period.
- In addition, in FIG. 23, 23-7 indicates a measurement point (corresponding to the cusp) in which the time t½ is the maximum, and lines representing the equations II which were prepared by using the maximum value are shown. 23-8 indicates a line which represents the equation II prepared by data of 2 hour charge period, 23-9 indicates a line which represents the equation II prepared by data of 3 hour charge period, 23-10 indicates a line which represents the equation II prepared by data of 3 day charge period, 23-11 indicates a line which represents the equation II prepared by data of 7 day charge period, 23-12 indicates a line which represents the equation II prepared by data of 10 day charge period, 23-12 indicates a line which represents the equation II prepared by data of 11 day charge period,
- In addition, the estimated specific capacity was calculated by substituting the time t ½ into each equation I and maximum error between the estimated specific capacity and actual measurement specific capacity was obtained. The maximum error for each equation I is shown in FIG. 22. As shown in FIG. 22, when the charge period was 7 days, the maximum error was minimum. In addition, estimated specific capacity was calculated from the equation II when the time t½ was 0.1 hr and difference in the estimated specific capacity with reference to the equation II corresponding to 7 day charge period is shown as maximum error for each equation II in FIG. 22.
- As shown in FIGS. 22 and 23, for each of the specific capacities obtained by equations I corresponding to the charge periods ranging from 3 hours to 10 days, the error is within ±10% which is a good estimation result. Especially, as shown in FIG. 22, when the charge period is set from 3 days to 10 days, the estimation error becomes within ±5%. Thus, it is revealed that estimation of very high accuracy can be performed.
- Also, as for the equations II, when the charge period is set to be from 3 days to 10 days, the estimation error becomes within ±10%. Thus, it is revealed that estimation of high accuracy can be performed.
- On the other hand, according to equations I and II prepared by experiments in which the charge period was set to be 2 hours or 11 days, it is revealed that accurate degradation estimation is difficult.
- An experiment was performed in which 4 prismatic Li-ion cells (the nominal capacity was 600 mAh) were placed in ambient temperature and each of the cells was-separately connected to a cell charge and discharge automatic test apparatus which has data collection and data storing capability in order to obtain equations for the Li-ion cell. In the experiment, the 4 test cells were cycled 10 times by discharging at 600 mA (1.0 CmA) to 2.75V and charging in CC-CV mode at 600 mA (1.0 CmA) to 4.1V for 7 days with intervals of one hour between charge and discharge.
- In each cycle of charge and discharge, the elapsed time t ½ (hr) from the start of the constant voltage (CV) mode charge until the charge current decreases to ½ of that at the CV mode charge start time and the specific capacity Cr(%) which is a ratio of discharge capacity C to the nominal capacity Co were measured.
- Four equations were obtained from the time t ½ and the specific capacity Cr from first cycle till 4th cycle, the time t½ and the specific capacity Cr of 4th and 5th cycles, the time t½ and the specific capacity Cr from 4th cycle till 6th cycle, the time t½ and the specific capacity Cr from first cycle till 10th cycle, respectively.
- The specific capacities calculated by the equations and actual measurement specific capacities were compared in which actual measurement data for the used prismatic Li-ion cell (the nominal capacity was 600 mAh) used in the example 3-2 was used, wherein the actual measurement data was data of the elapsed time t ½ (hr) from the start of the constant voltage (CV) mode until the charge current decreases to half and the specific capacity Cr which was a ratio of discharge capacity C to the nominal capacity 600 mAh for 45 cycles.
- The result is shown in FIG. 24.
- FIG. 24 shows the relationship between the necessary time t ½(hr) from the start of the CV charge mode until the charge current decreases to half and the specific capacity Cr. In the figure, the closed circles (gray circles) indicate actual measurement data for the used prismatic cell obtained in the example 3-2, 24-1 indicates a line which represents the equation prepared by measurement data from first cycle to 4th cycle, 24-2 indicates a line which represents the equation prepared by measurement data of 4th cycle and 5th cycle, 24-3 indicates a line which represents the equation prepared by measurement data from 4th cycle to 6th cycle, 24-4 indicates a line which represents the equation prepared by measurement data from 4th cycle to 10th cycle. In the right side of FIG. 24, symbols of measurement data which were used for obtaining the equations and cycles corresponding to the symbols are shown.
- As is evident from FIG. 24, according to the method of preparing the equation of the present invention, accurate estimation becomes possible. That is, the maximum error of the specific capacity calculated by the equation prepared from data of 4th cycle and 5th cycle against actual measurement data is 3.2%, the maximum error of the specific capacity calculated by the equation prepared from data from 4th cycle till 6th cycle against actual measurement data is 5.4%, the maximum error of the specific capacity calculated by the equation prepared from data from 4th cycle till 10th cycle against actual measurement data is 2.1%, which shows good estimation accuracy.
- On the other hand, the maximum error of the specific capacity calculated by the equation prepared from data from first cycle till 4th cycle against actual measurement data is 43.5%, which is not favorable since it exceeds ±20%.
- An experiment was performed in which 5 prismatic Li-ion cells (the nominal capacity was 600 mAh) were placed in an oven at a constant temperature of 5° C. and each of the cells was separately connected to a cell charge and discharge automatic test apparatus which has data collection and data storing capability in order to obtain equations for the Li-ion cell. In the experiment, the 5 test cells were cycled 10 times by discharging at 600 mA (1.0 CmA) to 2.75V and charging in CC-CV mode at 600 mA (1.0 CmA) to 4.1V for 7 days with intervals of one hour between charge and discharge.
- In each cycle of charge and discharge, the charge current I 5min (expressed in the unit of 1.0 CmA) after a lapse of 5 minutes from the start of the CV mode charge and the specific capacity Cr(%) which was a ratio of discharge capacity C to the nominal capacity were measured.
- A following equation (24) was obtained from data of the charge current I 5min (CmA) after a lapse of 5 minutes from the start of the CV mode charge and the specific capacity Cr(%) obtained by the cycles from 4th cycle to 10th cycle.
- Cr=−58.6I5min+143 (24)
- The specific capacities calculated by the equations and actual measurement specific capacities were compared in which actual measurement data for the used prismatic Li-ion cell (the nominal capacity was 600 mAh) used in the example 3-2 for 45 cycles was used as the actual measurement specific capacities, wherein the actual measurement data was the charge current I 5min (CmA) after a lapse of 5 minutes from the start of the CV mode charge and the specific capacity Cr(%) which was a ratio of discharge capacity C to the nominal capacity 600 mAh for 45 cycles.
- In addition, I 5min indicates the maximum value at 30th cycle. After that, I5min decreased as the number of repetitions of the cycle increased. Thus, an equation
- Cr=58.6I5min+40.5 (25)
- was prepared from the capacity Cc=91.8(%) at the time when I 5min was the maximum and the equation N′ =2Cc-N, wherein the equation (25) is applied to data of cycles after the 30th cycle. Then, the specific capacities calculated by this equation and actual measurement specific capacities were compared.
- The result is shown in FIG. 25.
- FIG. 25 shows the relationship between the charge current I 5min (CmA) after a lapse of 5 minutes from the start of the CV mode charge and the specific capacity Cr(%). In the figure, the closed circles (gray circles) indicate actual measurement data for the used prismatic cell. Closed (black) rectangles indicate measurement data points obtained by cycles for preparing the equations (24) and (25). In the figure, 25-1 indicates a line which represents the equation (24), 25-3 indicates a line which represents the equation (25) which was prepared by deciding the constants from the cusp 25-2 (a point in which I5min takes the maximum value) in measurement data.
- As shown in FIG. 25, every point of the measured data is within the error of ±20%. This reveals that the capacity estimation method and the degradation estimation method of the present invention provides accurate results of capacity estimation and degradation estimation.
- An experiment was performed in which 6 prismatic Li-ion cells (the nominal capacity was 600 mAh) were placed in an oven at a constant temperature of 25° C. and each of the cells was separately connected to a cell charge and discharge automatic test apparatus which has data collection and data storing capability in order to obtain equations for the Li-ion cell. In the experiment, the 6 test cells were cycled 10 times by discharging at 600 mA (1.0 CmA) to 2.75V and charging in CC-CV mode at 600 mA (1./0 CmA) to 4.1V for 7 days with intervals of one hour between charge and discharge.
- In each cycle of charge and discharge, the charge current I 30sec, I1min, I5min, I15min, and I20min (1.0 CmA) after a lapse of 30 seconds, 1 minute, 5 minutes, 15 minutes, and 20 minutes respectively from the start of the CV mode charge and the specific capacity Cr(%) which was a ratio of discharge capacity C to the nominal capacity were measured.
- The result is shown in FIG. 26.
- FIG. 26 shows measurement data obtained by the experiment and lines representing equations prepared from the charge currents (I 30sec, I1min, I5min, I15min, and I20min) from 4th cycle till 10th cycle and the specific capacities Cr. In the figure, 26-1 indicates a line prepared from the charge current I30sec after 30 seconds from the start of CV charge, 26-2 indicates a line prepared from the charge current I1min after 1 minute from the start of CV charge, 26-3 indicates a line prepared from the charge current I5min after 5 minute from the start of CV charge, 26-4 indicates a line prepared from the charge current I15min after 15 minute from the start of CV charge, 26-5 indicates a line prepared from the charge current I20min after 20 minute from the start of CV charge. In addition, in the right side of the figure, the lapse time from the start of the CV charge to the charge current measuring time, and the corresponding measurement data symbols are shown.
- As shown in FIG. 26, when the specific capacity is 91.8%, the charge current becomes maximum and the charge current decreases as the number of repetitions of the cycle increases after the cycle corresponding to the maximum specific capacity. Thus, the point corresponding to the maximum specific capacity is a cusp.
- Other equations were prepared in which signs of the above mentioned equations were reversed with respect to the value at the cusp. The prepared equations are indicated by 26-6, 26-7, 26-8, 26-9, and 26-10 in which the lapse time is 30 seconds, 1 minute, 5 minutes, 15 minutes, and 20 minutes, respectively.
- As is evident from FIG. 26, good capacity estimation and good degradation estimation can be performed when lapse times ranging from 1 minute to 15 minutes are used. On the other hand, it is not favorable that the lapse time is larger than 20 minutes since error becomes large after the cusp. In addition, when the lapse time is 30 seconds, whole consistency between the equations and the measurement data is good, however, the charge current values varies vary much. Thus, error of capacity estimation may become large by using the varied current values, which is not favorable.
- As is evident from the explanation of the examples 3-1 to 3-5, according to the present invention, the accurate capacity estimation method and the accurate degradation estimation method can be provided.
- In this example, a charger which charges a battery by using the CC-CV charge method was manufactured and will be shown. The battery includes three prismatic Li-ion cells (nominal capacity of each is 600 mAh) which are connected in series. In the CC-CV charge method used by the charger for charging the battery, the charge limit voltage is 12.3V, the charge current is 600 mA(1.0 CmA) and charge-end current which is a threshold for ending charge is 60 mA(0.05 CmA). The charger has capabilities for performing capacity estimation and degradation estimation in which cell life estimation criterion Ck is 360 mAh(60% of the nominal capacity) according to the present invention. That is, the charger includes the degradation estimation apparatus for the Li-ion cell of the present invention. The configuration of the battery is the same as that shown in FIG. 11.
- Next, the procedures for degradation estimation of the charger will be described with reference to FIGS. 27 and 28 (FIG. 28 is continuation of FIG. 27).
- (step A) The CC charge is started by placing the battery in the charger so that the battery voltage is monitored. The charge mode is changed to the CV mode at the time when the battery voltage reaches the charge limit voltage 12.3V(4.1V/cell). Then, when total charge capacity exceeds three times of the nominal capacity, time measuring for capacity estimation and degradation estimation is started. At the same time, the charge current is monitored.
- (step B) When the charge
current reaches 300 mA(0.5 CmA), the time measuring ends. The elapsed time t½(hr) from the instant when the charge voltage reaches the charge limit voltage to the instant when the chargecurrent reaches 300 mA is recorded. - (step C) The elapsed time t ½(hr) is substituted into the equation Cr=−33.7t½+101 (22) so that the specific capacity Cr (%) is calculated. When the elapsed time t½b of previous cycle is recorded and t½<t½b is satisfied and when this inequality is satisfied for the first time, the specific capacity Cr(%) (this is indicated by Cb) is obtained by substituting t½b into the equation (22). In other cases, the specific capacity Cr(%) is obtained by substituting t½ into the equation Cr=33.7t½+N′ (23′) (N′ is a positive constant) instead of the equation (22). The constant N′ can be obtained by substituting the maximum t½ and the specific capacity Cr (the above mentioned Cb) at the point of the cusp into the equation (23′). This method of obtaining the constant N′ is equivalent to the method of using the equation N′=2Cc-N. In FIG. 28 (continuation of FIG. 27), N′ is represented as simply N.
- (step D) The calculation result is displayed on the LCD and the LED. According to the estimated specific capacity, one of red, yellow and green LEDs illuminates. At the same time, a numeric value is displayed on the LCD. The value is displayed on the LCD for 30 seconds and the LED illuminates while the charger is connected to the utility power source.
- The capacity estimation and degradation estimation of the present invention is performed in the following way.
- A program including the equation (22) prepared in the example 3-1 and the steps shown in FIGS. 27 and 28 are stored in the charge be
control microprocessor 30 beforehand. While monitoring of the battery voltage and the charge current, the internal timer measures the time t½ elapsed from the time the battery voltage reaches 12.3 V, that is, from the time the charge mode changes from the CC mode to the CV mode until the charge current decreases to ½ (300 mA). Then, capacity estimation and degradation estimation of the Li-ion battery is performed by applying the time t½ to the equation (22) or (23′) so that the estimated capacity and the result of degradation estimation are displayed on thedisplay part 32. - The charger of this embodiment displays a timer on the LCD such that the charge time of the battery can be recognized.
- By using this charger, a used battery of the same type was placed in this charger and was charged. The degradation estimation result was displayed 27 minutes after the time when the charge mode was changed from the CC mode to the CV mode. The charge completed 3 hours and 6 minutes after the time of the mode change. “86%” was displayed on the LCD as the estimated specific capacity and the green LED illuminated.
- Then, the charged battery was mounted in the battery charge and discharge automatic test apparatus so that constant current discharge was performed wherein the discharge current was set to be 600 mA(1.0 CmA) and the discharge cut-off voltage was set to be 8.25V. The discharge capacity was 534 mAh according to this test. This value is equivalent to 89% as specific capacity, which revealed that the error of capacity estimation was about 3%.
- Accordingly, it becomes evident that the charger having capabilities of capacity estimation and degradation estimation of the present invention can estimate capacity with high accuracy, thus, can estimate degradation with high accuracy. In this embodiment, the charge control microprocessor forms the degradation estimation apparatus of the Li-ion battery of the present invention.
- As is evident from the above description, according to the present invention, an degradation estimation apparatus which can perform the degradation estimation of the Li-ion battery with high accuracy.
- A Li-ion battery which can be mounted in a portable information terminal was manufactured. The configuration is the same as that shown in FIG. 3. The Li-ion battery has a capability of performing the CC-CV method charge on condition that the charge limit voltage is 12.3V, charge current is 600 mA(1.0 CmA) and the charge end current is 60 mA. The battery includes three prismatic Li-ion cells (nominal capacity is 600 mAh) 12-1, 12-2, and 12-3 which are connected in series. The equation (22) is stored in the IC for protection beforehand.
- In addition, a program is stored in a memory in the
IC 13 for protection. According to this program, following process is performed. The voltage across the cells 12-1, 12-2, and 12-3 is monitored by Vcc and Vss. The charge voltage is monitored and the elapsed time t½ from the time when the voltage becomes the charge limit voltage 12.3V(4.1V/cell), that is, from the time when the charge mode changes from the CC mode to the CV mode to the time the charge current decreases to ½ (300 mA(0.5 CmA)) is measured. According to the procedure shown in FIGS. 27 and 28 except for steps of displaying, the time t½ is substituted into the equation (22). Or, when t½ becomes smaller than t½b of previous cycle, the equation (23′) described in the example 3-6 is prepared and t½ is substituted into the equation (23′). Then, the specific capacity Cr is calculated. - The battery is configured such that the result is output to the body of the portable terminal in order to be displayed on an LCD of the portable terminal via the
terminal 19. - On the LCD, a numerical value indicating the degradation estimation result is displayed as % and a bar in which a part of the bar corresponding to the % value ratio is-colored is displayed.
- A command for doing degradation estimation is provided from the body of the portable terminal concurrently with the start of charge. Procedures for performing the degradation estimation are the same as those shown in FIGS. 27 and 28 except for the result to be sent to the body since the result is displayed on the display of the portable terminal.
- The battery was mounted in the portable information terminal and used for one hour. After that, charge of the battery was started by connecting the terminal to the utility power source. The estimated specific capacity of the battery was displayed as 86% after the start of the charge. After checking that a sign of charge completion was displayed, the information terminal was powered off and the battery was removed from the terminal. Then, the battery was connected to the battery charge and discharge automatic test apparatus by using proper codes and the discharge capacity was measured by discharging the battery at 600 mA(1.0 CmA) to 8.25V(2.75V/cell). As a result, the discharge capacity was 501 mAh, which means that the specific capacity was 83.5%.
- Thus, the error of estimation was −2.5%, which means estimation was performed accurately. This battery is also the Li-ion battery which includes the degradation estimation capability of the present invention. Since degradation estimation by the degradation estimation capability is performed on the basis of the capacity estimation capability having high accuracy, this battery can be the to be a Li-ion battery having accurate degradation estimation capability.
- In the third embodiment, the charge current after a lapse of a time in the CV charge mode may not indicate the maximum value with respect to -capacity variation depending on the charge current, the discharge current, cell use period and the like, or, the time for the charge current to become half may not indicate the maximum value. In the following, simpler capacity estimation methods and degradation estimation methods for such cases will be described as the fourth embodiment and the fifth embodiment in the following.
- Fourth Embodiment
- In the following, fourth embodiment will be described. In the fourth embodiment, current value after a lapse of a predetermined time in the CV mode is used.
- FIG. 29 is a figure similar to FIG. 17. As described in the third embodiment, in the case where a Li-ion cell is charged by the constant current and constant voltage charge method (in the following, the constant current and constant voltage charge method will be called as the CC-CV charge method), the current It obtained after a lapse of a predetermined time t from the time when the charge mode is changed from the constant current mode (in the following, the constant current mode will be called as the CC mode) to the constant voltage mode (in the following, the constant voltage mode will be called as the CV mode) is constant if the capacity of the cell is constant. However, when the time t is within a range, the current It increases as the capacity decreases. By using such a correlation between decrease of capacity and increase of current, capacity estimation and degradation estimation are performed. In the following, outline of the fourth embodiment will be described.
- Outline of the Fourth Embodiment
- In this embodiment, capacity is estimated by the method including the steps of:
- obtaining, when the Li-ion cell is charged by a CC-CV charge method, a charge current after a lapse of a predetermined time from the instant when charge condition is changed from a CC mode to a CV mode; and
- calculating an estimated capacity of the Li-ion cell by using the charge current.
- In order to enable this estimation, it is necessary to obtain correlation between the capacity of the cell and the charge current beforehand by performing following experiment.
- A plurality of Li-ion cells which are same kind as a Li-ion cell which is target of capacity estimation are prepared in which a plurality of the Li-ion cells have different capacities due to repetition of use. By using the Li-ion cells, charge and discharge cycle is repeated in which the charge current at the above mentioned time is measured. From the result, correlation between the capacity of the cell and the charge current is obtained.
- The correlation is not necessarily represented as an analytic equation. For example, it may be represented as a line graph in which measured values in a correlation diagram are connected by lines.
- When linear relationship (a linear equation) is adopted as representation of the correlation, there is a favorable range in the time t. As described in the example 4-2 later (especially FIG. 32), the favorable range such that error becomes small is from 30 seconds to 30 minutes. The more favorable range is from 30 seconds to 20 minutes.
- When the predetermined time t is from 30 seconds to 30 minutes, a following equation (26) which represents linear relationship between the estimated capacity Ce and the charge current It can be obtained,
- Ce/Co=−a×It+b (26)
- wherein Co is the nominal capacity of the Li-ion cell, a and b are constants determined by the Li-ion cell and the time t). As described in the example 4-2 later (especially FIG. 32), the favorable range such that error becomes small is from 30 seconds to 30 minutes. The more favorable range is from 30 seconds to 20 minutes.
- When the time is shorter than 30 seconds after the start of the CV mode, variation of charge current may become large, thus, accurate capacity estimation can not be necessarily performed. When the time is longer than 30 minutes, relationship between the charge current and the capacity varies so that the relationship does not become linear and equation becomes complex.
- Monitoring for obtaining the current It is performed several times per 10μ second for example and an intermediate value or a mean value is selected. This monitoring method is favorable since improper recognition due to noise can be avoided. However, monitoring method is not limited to this as long as the capacity estimation method of the present invention is possible.
- The estimation capacity Ce of the cell is calculated by the equation (26) by using the current It. For this purpose, it is necessary to determine a and b. In order to determine a and b, a following method can be used for example.
- For estimating degradation of the cell from the estimated capacity Ce, degradation degree Deg(%) is calculated by an equation
- Deg(%)=100×(1-Ce/Co) (29)
- including the nominal capacity Co. Then, when the degradation degree Deg(%) becomes larger than a predetermined limit value, the cell can be estimated as degraded.
- The constants a and b in the equation (26) can be calculated by equations (27) and (28)
- a=d×t e (27)
- b=f×t h (28)
- wherein d, e, f, and h are constants determined by the Li-ion cell and 0<d, e<0, 0<f, and h<0.
- The constants d, e, f, and h can be obtained by the following method for example.
- Obtaining values of d, e, f, and h in many cases, it was revealed that
- 1.4≦d≦2.2
- −0.7≦e≦−0.3
- 1.4≦f≦2.2
- −0.25≦h≦−0.15
- are satisfied wherein the unit of It is A and the unit of t is minute.
- In the equation (26), the charge current It decreases monotonously as the time t increases.
- The reason why the coefficients a and b become functions of the measured time t is the following.
- It is known that the charge current depends on diffusion of intercalated Li into inner site of active material when charge of the CV mode is performed. If the diffusion of intercalated Li into inner site of active material follows Fick's first law, the current I with respect to the time t after the start of the CV mode can be represented by
- I=KnF[(Δc)/t½]
- wherein K is a constant, Δc is a value corresponding to concentration gradient of Li in solid, n is electrochemical equivalent, F is Faraday constant.
- However, in actuality, since various factors exist, the function may become more complex. Considering the effect of the diffusion within solid, the constants a and b in the degradation estimation equation (26) in this embodiment become high-order functions with respect to the measured time t such that the capacity Ce of the estimation target cell can be obtained by measuring the current value It after a lapse of the time t satisfying 0.5≦t≦30, wherein the capacity Ce does not depend on the measured time t.
- When constants which do not satisfy the above mentioned condition are used, there are cases where the charge current It takes a minus value within very short time such as one minutes or the charge current It takes a maximum value at a time within the elapsed time t. Thus, charge current variation of the Li-ion cell can not always be represented as a concrete equation in such cases.
- The estimated capacity Ce shown in the equation (26) is a capacity when complete discharge is carried out in which the complete discharge is to discharge the cell from the full charge state to a predetermined lower limit voltage. The estimated capacity Ce is not a discharge capacity when the cell is discharged halfway.
- The constants a and b in the equation (26) or the constants d, e, f, and h in the equations (27) and (28) are determined in the following way for example.
- That is, the positive constants d, e, f, and h are determined by steps of:
- repeating a charge and discharge cycle at least equal to or more than 5 times by using a Li-ion cell which is a capacity estimation target or the same kind of Li-ion cell as the Li-ion cell, wherein the charge and discharge cycle includes a charge period from 3 hours to one month in which charge is performed by a CC-CV charge method, a discharge period, a rest period provided between the charge period and the discharge period as necessary;
- obtaining, in each cycle, charge currents It ni after a lapse of times tni which are between 30 seconds and 30 minutes from the instant when charge condition is changed from a CC mode to a CV mode, wherein n is a number which is assigned to each cycle and i is a number assigned to each time tni in each cycle;
- obtaining discharge capacity Cn in each cycle;
- recording t ni, Itni, and Cn;
- determining the constants a and b in the equation (26) and d, e, f, and h in equations (27), (28) by using the time t ni, the charge current Itni and the discharge capacity Cn.
- Successive approximation method or least square approximation method or the like can be used for determining the constants.
- As an example, a following charge and discharge cycle can be used in which the Li-ion cell of the target of capacity estimation or the same kind of Li-ion cell is used, the charge current is a value such that the charge ratio becomes from 0.5 C to 2 C, or, the charge period is from 3 hours to one month for the CC-CV charge method using charge limit voltage which is recommended as charge condition or which is determined by a charger or an apparatus mounting the cell, and the discharge current is a value such that the discharge ratio becomes from 0.2 C to 2 C, or, the discharge period is determined by using discharge cut-off voltage which is recommended as discharge condition or which is determined by a charger or an apparatus mounting the cell. In addition, the charge and discharge cycle includes a rest between the charge period and the discharge period as necessary.
- When the charge current is larger than 2 C which exceeds a normally used current, the cell is damaged and an accurate degradation equation can not be obtained. It is not favorable that the charge current is smaller than 0.5 C since it takes to much time to preparing the degradation equation.
- When the charge period for each cycle is shorter than 3 hours, the charge may become insufficient if the Li-ion cell is degraded. Thus, a degradation equation in which accurate degradation estimation is difficult may be provided, which is not favorable.
- It is not favorable that the charge period is longer than one month since it takes much time to prepare the degradation equation.
- The charge and discharge cycle is repeated at least 5 times in order to determine coefficients of the degradation equation. Since the degradation equation (26) of the present invention is a linear function, the coefficients can be determined by using data of at least two cycles. However, in actuality, when using data of equal to or smaller than 4 cycles, estimation error exceeds ±20% due to error of reading current values. Thus, in order to secure degradation estimation accuracy within ±20%, it is favorable to obtain data of at least 5 cycles.
- In addition, in each cycle after or at third cycle in which data is obtained, when the current value It is measured at only two points of times elapsed after the instant of the change of charge mode from CC mode to CV mode, it becomes difficult to determine the coefficients d, e, f, and h describing the constants a and b.
- It is favorable that the equation (26) is prepared at temperatures between 10° C. and 45° C. When the temperature is lower than 10° C., the relationship between the capacity Ct and the charge current It does not become linear as the equation (26). The temperature higher than 45° C. does not suit the range of use temperature of the Li-ion cell. In addition, it is favorable that the capacity estimation is performed at temperatures within ±10° C. of the temperate at which the equation (26) is prepared, and between 10° C. and 45° C. When the capacity estimation is performed at a
temperature 10° C. or more higher, or, 10° C. or more lower than the temperature at which the equation is obtained, it becomes difficult to estimation capacity accurately since charge current values become different. - The above method can be applied to a Li-ion battery shown in FIG. 3 for example. The Li-ion battery includes a safety securing part which has an IC, a memory for storing numeric data used for calculating an estimated capacity of the Li-ion battery in the IC or an IC added to the IC, and a circuit for calculating the estimated capacity by using the numeric data and charge current while charging the Li-ion battery.
- In such a Li-ion battery, when Li-ion cells in the battery are charged, an estimated capacity value of the cells is calculated. The value can be read via an external connection terminal of the IC, or, a part for outputting an alarm can be provided in the battery in which the part outputs the alarm which represents capacity degradation when the estimated capacity becomes smaller than a predetermined capacity. As the alarm, displaying characters or an image, or sounding beep tones or a voice can be used.
- In addition, for calculating an estimated capacity of the Li-ion cell from the charge current during charge and other values, the above mentioned capacity estimation method for the Li-ion cell can be used.
- As is evident from the above descriptions, the capacity estimation method for the Li-ion cell of the present invention is a simple method and degradation of the Li-ion cell can be performed easily and simply by using this method. Thus, remarkable effect can be obtained in actual use.
- In addition, according to the Li-ion battery of the present invention, the capacity of the cells in the battery can be estimated only by using then battery. Accordingly, capacity degradation of the cells can be estimated automatically. Thus, remarkable effect can be obtained in actual use.
- In the following, an example is shown in which the capacity estimation method for the Li-ion cell according to the present invention is concretely performed.
- FIG. 30 shows a configuration of a charge control circuit which performs the above mentioned method. In this figure, 41 indicates the charge control circuit, 42 indicates Li-ion cells which are the target of estimation, 43 indicates a charge control microprocessor, 44 indicates a power source microprocessor, 45 indicates a switch, 46 indicates a thermistor, 47 indicates an abnormal output detection terminal, 48 indicates a cell connection plus terminal, 49 indicates a cell connection minus terminal, 50 indicates a power source connection plus terminal, 51 indicates a power source connection minus terminal.
- In order to realize the capacity estimation method of the present invention, it is necessary to measure time by a timer and to measure the charge current It. The timer is originally included in the
charge control microprocessor 43, and the charge current It can be monitored by using the abnormaloutput detection terminal 47. Thus, without any additional parts, the capacity estimation of the present invention can be performed in which calculation of the equations (26), (27) or (28) is performed by using an available memory in thecharge control microprocessor 43. The circuit is not limited to this configuration as long as the capacity estimation can be performed. - While the capacity estimation method of the present invention can be performed by adding additional capability to the body of the apparatus as mentioned above, the capability can also be provided in the safety mechanism of the battery such as shown in FIG. 3.
- Accordingly, it becomes possible to provide the Li-ion battery which includes means of performing capacity estimation according to the present invention by modifying an existing Li-ion battery minimally. The configuration is not limited to that of the above mentioned Li-ion battery as long as the capacity estimation of the present invention is performed.
- The degradation estimation method and the Li-ion battery which includes the capacity estimation capability of the present invention can be applied to apparatuses for which high reliability is required. By applying the present invention to the apparatuses, degradation status of cells can be grasped properly and the cells can be exchanged in a timely fashion so that troubles of the apparatuses can be avoided. There is no problem in that any apparatuses which mount Li-ion cells adopts the capacity estimation method or the Li-ion battery which has the degradation estimation capability. Accordingly, cells can be exchanged with minimum waste so that the present invention can be used very advantageously.
- Examples in the Forth Embodiment
- In the following, the capacity estimation method of the present invention for the Li-ion cell will be described by using more concrete examples. However, the present invention is not limited to the examples.
- An experiment was performed in which a prismatic Li-ion cell (the nominal capacity was 600 mAh) was connected to a cell charge and discharge automatic test apparatus which has data collection and data storing capability in order to obtain equations for the Li-ion cell. In the experiment, the test cell was cycled 10 times by discharging at 600 mA (1.0 CmA) to 2.75V and charging in CC-CV mode at 600 mA (1.0 CmA) to 4.1V for 3 hours with intervals of one hour between charge and discharge.
- In each cycle of charge and discharge, the charge currents It (A) after a lapse of times t (minute) from the time when the mode changed from the CC mode to the CV mode and the discharge capacity were measured, wherein the times t were from 30 seconds to 30 minutes.
- As a result, the coefficient a was obtained as
- a=1.92×t−0.5 (30),
- the coefficient b was obtained as
- b=1.92×t−0.2 (31).
- Accordingly, the equation
- Ce/Co=−a×It+b (32)
- was obtained wherein Co is the nominal capacity of the cell.
- When the equations (30) and (31) were prepared by using data of initial 5 cycles, the same values as the above shown constants were obtained However, when using data of only initial 4 cycles, variation of data became large so that the equations could not be obtained.
- When the experiment was performed in which only the charge period was changed to 2 hours in the above mentioned charge condition, relationship between the charge current It and the discharge capacity did not become linear so that the equation (32) could not be obtained.
- Another experiment was performed as follows.
- In this experiment, a used prismatic Li-ion cell (the nominal capacity was 600 mAh) was used. The cell was cycled by discharging at 600 mA (1.0 CmA) to 2.75V and charging in CC-CV mode at 600 mA (1.0 CmA) to 4.1V for 7 days (168 hours) with intervals of one hour between charge and discharge.
- In each cycle of charge and discharge, the capacity Cn and the charge current It after a lapse of a time t from the instant when the mode was changed to the CV mode were measured. Then, the validity of the equation (32) was evaluated.
- The result is shown in FIG. 31. FIG. 31 shows relationship between the ratio (Cn/Co) of the discharge capacity (Cn) to the nominal capacity (Co) and the charge current It after a lapse of 5 minutes from the start of CV mode charge in which the ratio Cn/Co is indicated as nominal capacity ratio Cm in FIG. 31 and It is indicated as I 5. In addition, a criterion of degradation degree which is obtained from the measured capacity Cn and the nominal capacity Co is also shown in FIG. 31. The solid line in the figure indicates the equation (32).
- Since t=5, a of (30) is 0.86, b of (31) is 1.39. Thus, the capacity estimation equation becomes
- C5=−0.86×I5+1.39 (33)
- wherein Ce/Co is indicated as C 5.
- The two dotted lines in FIG. 31 indicate estimated capacities corresponding to ±5% of the estimated capacity C 5 obtained by the degradation equation (33), in which error is obtained by
- Err(%)=100×(C5-Cm) (34)
- wherein Cm is the actual capacity.
- As is evident from the result shown in FIG. 31, according to the capacity estimation method of the present invention, degradation state of the Li-ion cell can be estimated very accurately such that the error become within ±5%.
- An experiment was performed in which the same kind of prismatic Li-ion cells (the nominal capacity was 600 mAh) as used in the example 4-1 which was used in a cellular phone was collected and connected to a cell charge and discharge automatic test apparatus which has data collection and data storing capability in order to obtain equations for the Li-ion cell. In the experiment, the test cell was cycled twice by discharging at 600 mA (1.0 CmA) to 2.75V and charging in CC-CV mode at 600 mA (1.0 CmA) to 4.1V for 3 hours with intervals of one hour between charge and discharge.
- In the second cycle, a plurality of charge currents It (A) after a lapse of a plurality of times equal to or smaller than 35 minutes from the time when the mode changed from the CC mode to the CV mode and the discharge capacity were measured. Then, values Cm were obtained by dividing the discharge capacity by the nominal capacity Co. Then, degradation accuracy was evaluated by comparing Cm and Ce/Co which was calculated by using the equation (32) shown in the example 4-1, wherein Ce/Co (represented by Cr) is a value obtained by dividing the estimated capacity Ce by the nominal capacity Co. The estimation accuracy was evaluated by the amount of error which was calculated by
- Err(%)=100×(Cr-Cm) (34′)
- which indicated a gap between the estimated value Cr and the real measurement value Cm.
- The result is shown in FIG. 32. FIG. 32 shows relationship between a plurality of charge currents It after a lapse of each time equal to or smaller than 35 minutes from the time when the mode changed from the CC mode to the CV mode, and, each mean value of error, absolute value of maximum error and absolute value of minimum error.
- As is evident from FIG. 32, the error is within ±20% when the time after the start of the CV charge is from 0.5 minute to 30 minutes, which becomes no problem in actual use. Further, the error is within ±6% when the time is from 0.5 minute to 20 minutes, which indicates that the capacity estimation method of the present invention realizes accurate estimation.
- When the time is shorter than 0.5 minute, the estimation accuracy becomes outside of the range of ±20%, which becomes a problem in actual use since error becomes large. For example, when the time was 0.33 minute (20 seconds), according to the result on the basis of the capacity estimation equation (32) and the equation (34′) for obtaining error, the maximum error (absolute value) was 29%, the minimum error (absolute value) was 0.19% and the mean error was +26%. Therefore, it is revealed that it is not favorable that the time is shorter 0.5 minute as long as the calculation method is used.
- When the time is longer than 30 minutes, the estimation accuracy becomes outside of the range of ±20%, which becomes a problem in actual use since error becomes large.
- The reason is that, after a lapse of a time longer than 30 minutes from the start of the CV mode, relationship between the capacity and the charge current does not become linear. As an example, the result in the case when the time is 31 minutes is shown in FIG. 33 in which this data was obtained in the charge and discharge cycle experiment performed for obtaining the equations (30), (31), and (32) in the example 4-1 for reference purposes.
- FIG. 33 shows the relationship between the charge current I 31(A) and the discharge capacity Cm in which the charge current I31(A) is a value obtained after a lapse of 31 minutes from the start of the CV mode. In this figure, the solid line indicates the capacity estimation equation (32) when t=31, and the two dotted lines indicate estimated capacity C31 when error which is calculated by the equation (34′) is ±20%.
- As shown in FIG. 33, when the time is longer than 30 minutes, the relationship between the discharge capacity Cm and the charge current It does not become linear so that the relationship can not be represented by the simple capacity estimation equation of the present invention, instead, a complex high-order equation become necessary so that prices of parts and apparatuses relating to capacity estimation of the Li-ion cell may rise.
- A Li-ion battery having the same configuration shown in FIG. 3 was manufactured. The Li-ion battery includes three of the same kind of Li-ion cells (nominal capacity is 600 mAh) as those in the example 4-1, a safety securing mechanism, and an IC for protection in which a timer, the equations (30), (31), and (32) and the calculation mechanism are input beforehand.
- The
IC 13 is set such that it monitors the charge current I10(A) after a lapse of 10 minutes from the time of the change of the mode from CC to CV. It was recognized that the capacity estimation equation of the present invention for the charge current I10 was C10=−0.61×I10+1.21 (35). - The battery was placed in a cell charge and discharge automatic test apparatus which has data collection and data storing capability. The battery was cycled 15 times by discharging at 600 mA (1.0 CmA) to 2.75V and charging in CC-CV mode at 600 mA (1.0 CmA) to 4.1V for 10 days (240 hours) with intervals of one hour between charge and discharge.
- In each cycle of charge and discharge, the charge current value I 10 after a lapse of 10 minutes from the time when the mode was changed to the CV mode and the real measurement capacity Cn of discharge were measured. Then, Cn was divided by the nominal capacity Co and the result was represented as Cm.
- The result is shown in FIG. 34. FIG. 34 shows relationship between the charge current I 10 and the discharge capacity Cm. In the figure, the solid line indicates the relationship between I10 and C10 in the estimation equation (35) and the two dotted line indicate relationship between I10 and C10 when error of t=10 based on the equation (34′) is ±5%.
- As is evident from the result shown in FIG. 34, according to the Li-ion battery having the capacity estimation capability of the present invention, the error of the capacity Cm is within ±5%. Thus, according to the present invention, the Li-ion battery which realize accurate capacity estimation can be provided.
- Fifth Embodiment
- In the following, the fifth embodiment will be described. In the fifth embodiment, the capacity estimation method and the degradation estimation method using the time taken for charge current in the constant voltage mode (in the following, the constant voltage mode will be called as the CV mode) to decrease to a predetermined current will be described.
- FIG. 35 is a figure like FIG. 17.
- The capacity estimation method in this embodiment includes the steps of:
- monitoring, when the Li-ion cell is charged by a constant current and constant voltage charge method (in the following, the constant current and constant voltage charge method will be called as the CC-CV charge method), an elapsed time t from the instant when charge condition is changed from a constant current mode (in the following, the constant current mode will be called as the CC mode) to a CV mode to the instant when charge current becomes α (α is a constant, 0<α<1) times of charge current in the CC mode;
- obtaining an estimated capacity Ce of the Li-ion cell by using the elapsed time t.
- The reason why such estimation becomes possible is the same as described in the first embodiment.
- Outline of the Fifth Embodiment
- In the following, the outline of the fifth embodiment will be described.
- In the fifth embodiment, when the Li-ion cell is charged by a constant current and constant voltage method, an elapsed time t from the instant when charge condition is changed from a CC mode to a CV mode to the instant when charge current becomes α (0<α<1) times of charge current in the CC mode is obtained, and an estimated capacity Ce of the Li-ion cell by using the elapsed time t is obtained.
- In order to enable this estimation, it is necessary to obtain correlation between the estimated capacity Ce and the time t beforehand. For example, there is a following method to obtain the correlation.
- Charge and discharge cycle is repeated for the same kind of Li-ion cell as a Li-ion cell which is the target of capacity estimation. Then, correlation between the time tn of each cycle and discharge capacity which is obtained by integrating discharge current with respect to time (n is a number which is assigned to each cycle). In this case, since it is favorable that the value of the discharge capacity Cn ranges widely, it is favorable to perform the above method for a plurality of Li-ion cells which are the same kind and have different capacities when discharge capacity Cn does not range widely.
- The correlation is not necessarily represented as an analytic equation. For example, it may be represented as a line graph in which measured values in a correlation diagram are connected by lines.
- As mentioned later, when the analytic equation is adopted as representation of the correlation, there is a favorable range in the charge current Ic when the CC charge is performed.
- In addition, if relationship between the estimated capacities Ce and the number of charge is obtained by recording the estimated capacities Ce which are calculated in each charge, the life-span of the cell can be estimated, that is, it can be estimated how many times the cell can be recharged and reused before degradation. When the Li-ion cell is used by repeating charge and discharge under usage condition which is the same as or similar to that used in the estimation, accuracy of the cell lifetime estimation becomes high.
- ½ can be used as the constant α for example. The estimated capacity Ce of the Li-ion cell is calculated by the equation
- Ce/Co=At+B (36)
- by obtaining the time t when the charge current becomes ½ wherein Co is the nominal capacity of the Li-ion cell, A and B are positive constants which are determined by the Li-ion cell and the charge current Ic. By setting α to be ½, the equation (36) approximately holds. By using the equation and the time t, the estimated capacity Ce can be calculated.
- In order that the equation (36) becomes effective for capacity estimation of the cell, the favorable range of the charge current Ic is
- Co/(5 hours)≦Ic≦Co/(0.5 hour),
- wherein Co is the nominal capacity of the Li-ion cell which is the target of capacity estimation. This condition will be represented as from 0.2 CmA to 2.0 CmA in the following description.
- When the charge current Ic does not satisfy the above condition, it is not favorable to calculate the estimated capacity Ce by using the equation (36). That is, when the charge current Ic is smaller than the above limitation range, a calculated capacity by the equation (36) becomes different from an actual capacity for reasons that the cell is not fully charged, effect of self-discharge can not be neglected and the like. When the charge current Ic is larger than 1.0 CmA, since the time taken for charging cell becomes short, the measured value of the time t may includes large error and variations of charge time due to degradation becomes different to each other, also which is not favorable when performing degradation estimation.
- Thus, charge current values which are applied to almost all apparatuses mounting the Li-ion cell and chargers are within the range of the above condition. Apparatuses and chargers which adopt a current value which is out of-the range are used only for very limited use such as in a case when very high speed charge is required in an emergency. These apparatuses and chargers hardly requires the capacity estimation method of the present invention.
- The equation (36) represents relationship between the elapsed time t from the start of CV mode charge until the charge current decreases to half in a charge condition of an apparatus using Li-ion cell to which the equation is applied and an estimated specific capacity Ce/Co under the charge condition. When initial charge current value for obtaining the equation (36) is different from the initial charge current value at CV mode charge start time of the apparatus mounting the cell or the charger, following processes need to be performed.
- That is, the elapsed time t from the start of CV mode until the current becomes half is obtained under each charge condition beforehand. Then, after obtaining a ratio te/tm wherein the time te is obtained under the condition for preparing the equation (36) and the time tm is obtained under a condition which corresponds to the apparatus or the charger, a result of multiplying measured time by the ratio te/tm is substituted into the equation (36).
- Because the smaller the current value is, the larger the charge ratio in the CC mode charge (charge ratio is ratio of the CC mode charge in full charge period) is. Thus, the charge time of CV mode varies depending on the charge ratio of the CC mode, in addition, the time necessary for the current to decrease to half is effected. In addition, since the effect varies according to cell size, cell shape, manufacturer, cell component material and the like, it is necessary to grasp effects of the current value by performing experiments.
- For preparing the equation (36), it is necessary to determine the constants A and B in the equation (36). For this purpose, it is most appropriate to determine the constants A and B by using a cell or a battery which is the same kind as the Li-ion cell or battery which is the target of the capacity estimation. Because, in commercial Li-ion cells, many kinds of cathode active materials, anode carbons and electrolytes are used so that initial charge behaviors as well as variations of charge voltage behaviors due to cell degradation differ.
- Next, the method for determining the constants A and B will be described in detail.
- In the present invention, the positive constants A and B are calculated by steps of:
- repeating a charge and discharge cycle at least equal to or more than 2 times by using a Li-ion cell which is a capacity estimation target or the same kind of Li-ion cell as the Li-ion cell, wherein the charge and discharge cycle includes a charge period from 3 hours to 10 days in which charge is performed by the CC-CV charge method, a discharge period, a rest period provided between the charge period and the discharge period as necessary;
- obtaining and recording an elapsed time tn from the instant when charge condition is changed from a CC mode to a CV mode to the instant when charge current becomes α (0≦α<1) times of charge current in the CC mode and discharge capacity Cn in each cycle; and
- determining values of the constants A and B in the equation (36) from the elapsed time tn and the discharge capacity Cn.
- In the following, the determining method of the constants A and B will be described more precisely.
- An experiment is performed for a Li-ion cell or a battery. In the experiment, charge and discharge cycles are repeated equal to or more than 5 times or 6 times, which is more favorable. The charge limit voltage Vc, the charge current Ic, and the discharge cut-off voltage Vd are set to be the same as those of a Li-ion cell or a battery which is the target of capacity estimation. The charge period is set from 3 hours to 10 days or from 3 days to 10 days, which is more favorable. Discharge current is set from 0.2 CmA to 2.0 CmA and the temperature is set from 0° C. to 45° C., or from 15° C. to 30° C., which is more favorable.
- In each cycle of charge, an elapsed time tn (n is a number assigned to each cycle) from the CV mode charge start until the charge current decreases to α (0<α<1) times of the charge current of the start time and the discharge capacity Cn are recorded wherein the discharge capacity Cn is obtained by integrating the discharge current with respect to time. Then, the constants A and B are determined such that the equation (36) represents relationship between Cn/Co and t most appropriately.
- For example, an elapsed time tn from the CV mode charge start until the charge current decreases to ½ and the discharge capacity Cn are recorded. Then, the constants A and B are determined such that the equation (36) represents relationship between Cn/Co and t most appropriately.
- The reason why the experiment is performed at temperatures from 0° C. to 45° C. is that this range is a temperature range normally used for the Li-ion cell, and, it realizes more accurate capacity estimation to grasp the relationship between the time t and the specific capacity Cn/Co which reflect progress of degradation at the temperatures.
- It is more favorable that the experiment is performed at temperatures from 15° C. to 30° C. since almost all temperature conditions are within this range. Thus, the relationship between the time t and the specific capacity Cn/Co which reflect actual degradation can be grasped.
- The charge period per one cycle is set to be from 3 hours to 10 days. By setting the charge period per one cycle to be from 3 hours to 10 days, the cell degrades moderately per one cycle so that data necessary for preparing the accurate equation (36) can be obtained efficiently. Especially, when the charge period per one cycle is set to be from 3 days to 10 days, degradation of capacity associated with the charge and discharge cycle can be clearly recognized so that data necessary for preparing the accurate equation (36) can be obtained efficiently, which is more favorable.
- When the charge period is shorter than 3 hours, the Li-ion cell degrades slowly. Thus, several hundred cycles are necessary for obtaining the equation (36) accurately so that enormous time is consumed. In some cases, charge is performed insufficiently so that degradation and insufficient charge are mixed. As a result, degradation status and characteristics of the Li-ion cell can not be obtained properly, which is not favorable.
- When the charge period is longer than 10 days, the time necessary for performing one cycle becomes long so that it takes much time for obtaining necessary data, which is also not favorable.
- The discharge current value in the charge and discharge cycle is set to be from 0.2 CmA to 2.0 CmA. When the lower limit is set to be from 1.0 CmA to 2.0 CmA, data can be obtained more efficiently. When the discharge current is smaller than 0.2 CmA, it takes much time to discharge completely, which is not favorable. When the discharge current is larger than 2.0 CmA, discharge period becomes too short. Thus, measurement values of discharge capacity may vary. In addition, when degradation proceeds, the capacity may decrease abruptly so that the equation (36) can not be prepared accurately. This is not favorable.
- When the charge and discharge cycle experiment is performed, a rest is included between charge and discharge as necessary due to limitation of settings of the apparatus and the like.
- In the charge and discharge cycle experiment performed in order to obtain the equation (36), the elapsed time tn from the instant when the CC mode changes to the CV mode to the instant when the charge current decreases to α times (0<α<1) of the charge current at the time of mode change and the specific capacity Cn/Co of following discharge are measured for each charge and discharge cycle on and after the fourth cycle. Then, relationship between the measured time tn and the specific capacity Cn/Co are plotted. Then, the constants A and B of the equation (36) are determined.
- The reason why tn and Cn/Co of cycles on and after the 4th cycle are adopted for determining the constants A and B of the equation (36) is as follows. In many cases, capacity variation until third cycle from the time when the charge and discharge cycle experiment starts is different from that after the cycle due to decomposition reaction of impurity in the electrolyte on anode carbon. Thus, when data until third cycle is used, an equation in which estimation error is large may be prepared. It is not favorable.
- As for above mentioned charge and discharge cycle experiment, equal to or more than 5 cycles are performed in order to obtain data necessary for achieving high accuracy in degradation estimation such that error of estimation result becomes within ±20% of real capacity.
- When data of only 4th cycle is used, the constants A and B can not be determined so that the equation (36) can not be prepared. It is favorable to use data of equal to or more than 6 cycles for preparing the equation (36) which can perform capacity estimation and degradation estimation more accurately.
- In the following, a method for determining whether the cell degrades will be described.
- The estimated capacity Ce of the Li-ion cell is calculated, and it is judged that the Li-ion cell is degraded when the estimated capacity Ce becomes smaller than a predetermined limit capacity Cmin.
- In the above method, the estimation may be performed by comparing estimated specific capacity Ce/Co (Co is nominal capacity) and limit specific capacity Cmin/Co.
- As the limit capacity Cmin, a value of 60% of the nominal capacity is used for example (in this case, Cmin/Co=0.6).
- Next, an apparatus which can estimate degradation by using the above method will be described.
- The apparatus includes:
- means for obtaining, when the Li-ion cell is charged by a CC-CV charge method, an elapsed time t from the instant when charge condition is changed from a CC mode to a CV mode to the instant when charge current becomes α (0<α<1) times of charge current Ic in the CC mode;
- an arithmetic circuit obtaining an estimated capacity Ce of the Li-ion cell by using the elapsed time t; and
- means for outputting a signal representing that the Li-ion cell is degraded when the estimated capacity Ce (or estimated specific capacity Ce/Co) becomes smaller than a predetermined limit capacity Cmin (or limit specific capacity Cmin/Co).
- FIG. 2 shows an configuration example of this apparatus. The equation (36) of the present invention is stored in an available memory in the
CPU 7 and the like beforehand. Or, the equation (36) is stored in an memory chip which is added as necessary. TheCPU 7 provides thecell control part 3 with an instruction to measure the elapsed time t from the time when the charge mode changes from the CC mode to the CV mode until the time when the charge current decreases to half, and receives data of the time t from thecell control part 3. In addition, theCPU 7 performs calculation by substituting the time t into the equation (36) so that theCPU 7 obtains the estimated capacity Ce(or the estimated specific capacity Ce/Co). Thememory 8 stores the estimated capacity Ce(or the estimated specific capacity Ce/Co) if necessary. A result of degradation estimation based on estimated capacity (or estimated specific capacity) is applied to the body of the apparatus via theline 10 such as a system management bus. The body of the apparatus displays the estimation result to a display part of the apparatus and sounds an alert by using a beep or a voice as necessary. Accordingly, the apparatus which has the degradation estimation capability for the Li-ion cells is realized. The configuration is not limited to the above mentioned one as long as the degradation estimation of the present invention is performed. - Further, the method of this embodiment can be applied to the battery as shown in FIG. 3.
- In this embodiment, in FIG. 3, a timer is mounted in the
IC 13 for protection in the above safety mechanism and the equation (36) is stored in an available memory beforehand. TheIC 13 monitories the voltage across the Li-ion cells 12-1, 12-2, and 12-3 by using terminals Vcc and Vss and counts the elapsed time t from the time when the charge mode changes from the CC mode to the CV mode until the time when the charge current decreases to half. Then, the counted time t is substituted into the equation (36) so that the estimated capacity Ce is calculated. An additional IC can be provided at a proper position in the battery if necessary. When the estimated capacity Ce (or estimated specific capacity Ce/Co) becomes smaller than a predetermined limit capacity Cmin (or limit specific capacity Cmin/Co), a warning (by using electronic signal in this case) which represents capacity degradation is output to the body of the apparatus which mounts the battery via the terminal 19 in order to display the warning on a display or sound an alarm. - When the body of the apparatus does not have any means of warning of degradation, it is favorable that the battery itself includes means of outputting the warning, for example, by displaying characters or an image, or sounding beep tones or a voice. Such a battery can be realized by applying the present invention and conventional technologies.
- Accordingly, it becomes possible to provide the Li-ion battery which includes means of performing degradation estimation according to the present invention by modifying an existing Li-ion battery minimally. The configuration is not limited to that of the above mentioned Li-ion battery as long as the degradation estimation of the present invention is performed.
- Also in this embodiment, the degradation estimation method and the Li-ion battery which includes the degradation estimation capability of the present invention can be applied to apparatuses for which high reliability is required. By applying the present invention to the apparatuses, degradation status of cells can be grasped properly and the cells can be exchanged in a timely fashion so that troubles of the apparatuses can be avoided. However, there is no problem when any apparatus which uses Li-ion cells adopts the degradation estimation method or the Li-ion battery which has the degradation estimation capability. In addition, cells can be exchanged with minimum waste so that the present invention can be used very advantageously.
- Examples in the Fifth Embodiment
- In the following, the capacity estimation method, the degradation estimation method and a degradation estimation apparatus for the Li-ion cell and the Li-ion battery will be described in more detail. However, the present invention is not limited to the following examples.
- An experiment was performed in which a prismatic Li-ion cell (the nominal capacity was 600 mAh) was placed in an oven at a constant temperature of 25° C. and connected to a cell charge and discharge automatic test apparatus which has data collection and data storing capability in order to obtain an equation for the Li-ion cell. In the experiment, the test cell was cycled 10 times by discharging at 600 mA (1.0 CmA) to 2.75V and charging in CC-CV mode at 600 mA (1.0 CmA) to 4.1V for 7 days with intervals of one hour between charge and discharge.
- In each cycle of charge and discharge, an elapsed time tn from the start of the constant voltage (CV) mode charge to the time when the charge current decreases to ½ of that at the start time and the specific capacity Cn/Co which was a ratio of discharge capacity Cn to the nominal capacity Co were measured, wherein the discharge capacity Cn was calculated by integrating the discharge current with respect to time and n is a number which is assigned to each cycle.
- A following equation (37) was obtained from relationship between the time tn and the specific capacity Cn/Co which was obtained from 4th cycle till 10th cycle.
- Ce/Co=0.714t+0.349 (37)
- Strictly speaking, “t” in this equation (37) should be represented as (t/1 hour), that is, should be represented as a dimensionless number. However, in the equation (37), it is represented as simply t for the sake of convenience. The same goes for following equations.
- Another experiment was performed as follows.
- In this experiment, a used prismatic Li-ion cell (the nominal capacity was 1300 mAh) was used. The cell was cycled 3 times by discharging at 1300 mA (1.0 CmA) to 2.75V and charging in CC-CV mode at 1300 mA (1.0 CmA) to 4.1V for 3 hours with intervals of 10 minutes between charge and discharge.
- In each cycle of charge and discharge, the elapsed time tn from the start of the CV mode charge until the charge current decreases to ½ of that at the start time and the specific capacity Cn/Co were recorded. Then, validity of the equation (37) was evaluated.
- The result is shown in FIG. 36.
- FIG. 36 shows relationship between the time tn obtained in the cycles and the specific capacity Cn/Co. In this figure, data till third cycle is plotted. 36-A indicates a line which represents the equation (37). In addition, 36-B indicates a
line representing values 20% higher than values of the equation (37) (that is, error of +20%), and, 36-C indicates aline representing values 20% lower than values of the equation (37) (that is, error of −20%). - As shown in FIG. 36, every point of the measured data is within the error of ±20%. In addition, these points are very close to the line 36-A which represents the equation (37). This reveals that accurate degradation estimation result can be provided.
- An experiment was performed in which 6 prismatic Li-ion cells (the nominal capacity was 600 mAh) were placed in an oven at a constant temperature of 25° C. and each of the cells was separately connected to a cell charge and discharge automatic test apparatus which has data collection and data storing capability in order to obtain equations for the Li-ion cells. In the experiment, the test cell was cycled 10 times by discharging at 600 mA (1.0 CmA) to 2.75V and charging in CC-CV mode at 600 mA (1.0 CmA) to 4.1V with intervals of one hour between charge and discharge. The charge periods for the cells were 2 hours, 3 hours, 3 days, 7 days, 10 days, and 11 days, respectively.
- In each cycle of charge and discharge, the elapsed time tn from the start of the CV mode until the charge current decreases to ½ of that at the CV mode charge start time and the specific capacity Cn/Co were measured.
- Equations shown in FIG. 37 were obtained from data of the time tn and the specific capacity Cn/Co which was obtained from 4th cycle till 10th cycle.
- Another experiment was performed as follows.
- In this experiment, a used prismatic Li-ion cell (the nominal capacity was 1300 mAh) was used. The cell was cycled 3 times by discharging at 1300 mA (1.0 CmA) to 2.75V and charging in CC-CV mode at 1300 mA (1.0 CmA) to 4.1V for 3 hours with intervals of 10 minutes between charge and discharge.
- In each cycle of charge and discharge, the elapsed time tn from the start of the CV mode charge until the charge current decreases to ½ of that at the CV mode start time and the specific capacity percentage Cn/Co were recorded. Then, the validity of the equation (37) was evaluated.
- FIG. 38 shows the result.
- FIG. 38 shows relationship between the time tn and the specific capacity Cn/Co. In the figure, 38-A shows measurement data till the third cycle.
- In addition, in FIG. 38, points of experiment data for preparing the equations shown in FIG. 37 and lines representing the equations are shown. 38-B indicates a line which represents the equation prepared by data of 2 hour charge period, 38-C indicates a line which represents the equation prepared by data of 3 hour charge period, 38-D indicates a line which represents the equation prepared by data of 3 day charge period, 38-E indicates a line which represents the equation prepared by data of 7 day charge period, 38-F indicates a line which represents the equation prepared by data of 10 day charge period, 38-G indicates a line which represents the equation prepared by data of 11 day charge period.
- In addition, error between the estimated specific capacity and actual measurement specific capacity was shown in FIG. 37, wherein the estimated specific capacity was calculated by substituting the time t necessary for the CV charge current to decrease to half into each equation.
- As shown in FIG. 38, for each of the specific capacities obtained by equations corresponding to the charge period ranging from 3 hours to 10 days, the error is within ±20% which is a good estimation result. Especially, as shown in FIG. 37, when the charge period is set from 3 days to 10 days, the estimation error becomes within ±10%. Thus, it is revealed that estimation of very high accuracy can be performed.
- On the other hand, according to equations prepared by experiments in which the charge period was set to be 2 hours or 11 days, estimation error exceeds ±20% so that it is revealed that accurate degradation estimation is difficult.
- An experiment was performed in which 6 prismatic Li-ion cells (the nominal capacity was 600 mAh) were placed in an oven at a constant temperature of 45° C. and each of the cells was separately connected to a cell charge and discharge automatic test apparatus which has data collection and data storing capability in order to obtain equations for the Li-ion cells. In the experiment, the test cell was cycled 10 times by discharging at 600 mA (1.0 CmA) to 2.75V and charging in CC-CV mode at 600 mA (1.0 CmA) to 4.1V for 7 days with intervals of one hour between charge and discharge.
- In each cycle of charge and discharge, the elapsed time tn from the start of the CV mode charge until the charge current decreases to ½ of that at the CV mode charge start time and the specific capacity Cn/Co were measured.
- Four equations were obtained, from the time tn and the specific capacity Cn/Co of all cycles, the time tn and the specific capacity Cn/Co of 4th and 5th cycles, the time tn and the specific capacity Cn/Co from 4th cycle till 6th cycle, the time tn and the specific capacity Cn/Co from 4th cycle till 10th cycle, respectively.
- The specific capacities calculated by the equations and actual measurement specific capacities were compared by using data of the elapsed time tn from the start of the CV mode until the charge current decreases to half and the specific capacity Cn/Co for three cycles of the used prismatic Li-ion cell (the nominal capacity was 600 mAh) used in the example 5-2.
- The result is shown in FIG. 39.
- FIG. 39 shows the relationship between the elapsed time tn from the start of the CV charge mode until the charge current decreases to half and the specific capacity Cn/Co. In the figure, 39-A indicates measurement data of the used prismatic cell measured in the example 5-2, 39-B indicates a line which represents the equation prepared by measurement data of all cycles, 39-C indicates a line which represents the equation prepared by measurement data of 4th cycle and 5th cycle, 39-D indicates a line which represents the equation prepared by measurement data from 4th cycle to 6th cycle, 39-E indicates a line which represents the equation prepared by measurement data from 4th cycle to 10th cycle.
- As is evident from FIG. 39, according to the method of preparing the equation of the present invention, accurate estimation becomes possible. That is, the maximum error (absolute value) of the specific capacity calculated by the equation prepared from data of 4th cycle and 5th cycle against actual measurement data is 6.1%, the maximum error (absolute value) of the specific capacity calculated by the equation prepared from data from 4th cycle till 6th cycle against actual measurement data is 2.7%, the maximum error (absolute value) of the specific capacity calculated by the equation prepared from data from 4th cycle till 10th cycle against actual measurement data is 2.5%, which shows good estimation accuracy.
- On the other hand, the maximum error of the specific capacity calculated by the equation prepared from data of all cycles (from first cycle till 10th cycle) against actual measurement data is 20.4%, which is not favorable since it exceeds ±20%.
- An experiment was performed in which 5 prismatic Li-ion cells (the nominal capacity was 600 mAh) were placed in an oven at a constant temperature of 5° C. and each of the cells was separately connected to a cell charge and discharge automatic test apparatus which has data collection and data storing capability in order to obtain equations for the Li-ion cell. In the experiment, the 5 test cells were cycled 10 times by discharging at 600 mA (1.0 CmA) to 2.75 V and charging in CC-CV mode to 4.1 V for 7 days with intervals of one hour between charge and discharge. Charge current was 90 mA (0.15 CmA), 120 mA (0.2 CmA), 600 mA (1.0 CmA), 1200 mA (2.0 CmA), and 1500 mA (2.5 CmA), respectively.
- In each cycle of charge and discharge, the elapsed time tn from the start of the CV mode charge until the charge current decreases to ½ of that at the CV mode charge start time and the specific capacity Cn/Co were measured.
- Five equations were obtained from the time tn and the specific capacity Cn/Co of cycles from 4th cycle till 10th cycle.
- The specific capacities calculated by the five equations and actual measurement specific capacities were compared by using data of the elapsed time tn from the start of the CV mode until the charge current decreases to half and the specific capacity Cn/Co for three cycles for the used prismatic Li-ion cell (the nominal capacity was 600 mAh) used in the example 5-2.
- The result is shown in FIG. 40.
- FIG. 40 shows the relationship between the elapsed time tn from the start of the CV charge mode to the instant when the charge current decreases to half and the specific capacity Cn/Co. In the figure, 40-A indicates measurement data of the used prismatic cell measured in the example 5-2, 40-B indicates a line which represents the equation prepared by measurement data of experiment of 0.15 CmA charge current, 40-C indicates a line which represents the equation prepared by measurement data of experiment of 0.2 CmA charge current, 40-D indicates a line which represents the equation prepared by measurement data of experiment of 1.0 CmA charge current, 40-E indicates a line which represents the equation prepared by measurement data of experiment of 2.0 CmA charge current, and 40-F indicates a line which represents the equation prepared by measurement data of experiment of 2.5 CmA charge current.
- As is evident from FIG. 40, according to the method of preparing the equation of the present invention, accurate estimation becomes possible. That is, the maximum errors (absolute value) of the specific capacities calculated by the equations prepared from data of 0.2 CmA, 1.0 CmA, and 2.0 CmA charge currents are 7.9%, 6.1%, and 5.1%, respectively, which shows good estimation accuracy.
- On the other hand, the maximum errors (absolute value) of the specific capacities calculated by the equations prepared from data of 0.15 CmA and 2.5 CmA are 20.6% and 27.4%, respectively, which is not favorable since it exceeds ±20%.
- An experiment was performed in which 6 prismatic Li-ion cells (the nominal capacity was 600 mAh) were placed in each oven set at constant temperatures of −5° C., 0° C., 15° C., 30° C., 45° C., and 50° C. respectively and each of the cells was separately connected to a cell charge and discharge automatic test apparatus which has data collection and data storing capability in order to obtain equations for the Li-ion cell. In the experiment, the 6 test cells were cycled 10 times by discharging at 600 mA (1.0 CmA) to 2.75 V and charging in CC-CV mode to 4.1V for 7 days with intervals of one hour between charge and discharge.
- In each cycle of charge and discharge, the elapsed time tn from the start of the CV mode charge to the time when the charge current decreases to ½ of that at the CV mode charge start time and the specific capacity Cn/Co were measured.
- Six equations were obtained from the time tn and the specific capacity Cn/Co of cycles from 4th cycle till 10th cycle.
- The specific capacities calculated by the six equations and actual measurement specific capacities were compared by using data of the elapsed time tn from the start of the CV mode until the charge current decreases to half and the specific capacity Cn/Co for three cycles for the used prismatic Li-ion cell (the nominal capacity was 1300 mAh) used in the example 5-2.
- The result is shown in FIG. 41.
- FIG. 41 shows the relationship between the elapsed time tn from the start of the CV charge mode until the charge current decreases to half and the specific capacity Cn/Co. In the figure, 41-A indicates measurement data of the used prismatic cell measured in the example 5-2, 41-B indicates a line which represents the equation prepared by measurement data of experiment at −5° C., 41-C indicates a line which represents the equation prepared by measurement data of experiment at 0° C., 41-D indicates a line which represents the equation prepared by measurement data of experiment at 15° C., 41-E indicates a line which represents the equation prepared by measurement data of experiment at 30° C., 41-F indicates a line which represents the equation prepared by measurement data of experiment at 45° C. and 41-G indicates a line which represents the equation prepared by measurement data of experiment at 50° C.
- As is evident from FIG. 41, according to the method of preparing the equation of the present invention, accurate estimation becomes possible. That is, the maximum errors (absolute value) of the specific capacities calculated by the equations prepared from experiment at 0° C., 15° C., 30° C., and 45° C. against the actual measurement data are 7.1%, 4.1%, 6.4% and 6.8% respectively, which shows good estimation accuracy. Especially, when the temperature is 15° C. and 30° C., equations which provide more accurate estimation result can be prepared.
- On the other hand, the maximum errors (absolute value) of the specific capacities calculated by the equations prepared from data of −5° C. and 50° C. against the actual measurement data are 58.3% and 44.8% respectively, which is not favorable since it exceeds ±20%.
- In this example, a charger which charges a battery by using the CC-CV charge method and performs capacity and degradation estimation of the battery was manufactured and will be shown. The battery includes three prismatic Li-ion cells (nominal capacity of each is 600 mAh) which are connected in series. In the CC-CV charge method used by the charger for charging the battery, the charge limit voltage is 12.3V(2.75V/cell), the charge current is 600 mA(1.0 CmA) and the charge-end current which is a threshold for ending the charge is 30 mA(0.05 CmA).
- A configuration of this charger is the same as that shown in FIG. 11.
- The procedures for degradation estimation of this charger will be described with reference to FIG. 42.
- (step A) The charge is started by placing the battery in the charger and the battery voltage is monitored. When the battery voltage V reaches the charge limit voltage 12.3V(4.1V/cell), time measuring for degradation estimation is started. At the same time, the charge current is monitored.
- (step B) When the charge reaches 300 mA(0.5 CmA), the time measuring ends. Then, the elapsed time t from the time when the charge voltage reaches the charge limit voltage until the
current reaches 300 mA is recorded. - (step C) The time t is substituted into the equation (37) so that the estimated specific capacity Ce/Co is calculated.
- (step D) The calculation result is displayed on the LCD and the LED. According to the estimated specific capacity, one of red, yellow and green LEDs illuminates. At the same time, a numeric value is displayed on the LCD. The value is displayed on the LCD for 30 seconds and the LED illuminates while the charger is connected to the utility power source.
- The capacity estimation and degradation estimation of the present invention is performed in the following way.
- A program including the equation (37) prepared in the example 5-1 and the steps shown in FIG. 42 is stored in the
charge control microprocessor 30 beforehand. While monitoring of the battery voltage and the charge current, the internal timer measures the time t elapsed from the time when the battery voltage reaches 12.3 V, that is, from the time the charge mode changes from the CC mode to the CV mode until the charge current decreases to ½ (300 mA). Then, capacity estimation and degradation estimation of the Li-ion battery is performed by applying the time t to the equation (37) so that the estimated capacity and the result of degradation estimation are displayed on thedisplay part 32. - The charger of this embodiment displays a timer on the LCD such that the charge time of the battery can be recognized.
- By using this charger, a used battery of the same type was placed in this charger and was charged. The degradation estimation result was displayed 48 minutes after the time when the charge mode was changed from the CC mode to the CV mode. The charge completed 4 hours and 6 minutes after the time of the mode change. “92%” was displayed on the LCD as the estimated specific capacity and the green LED illuminated.
- Then, the charged battery was mounted in the battery charge and discharge automatic test apparatus so that constant current discharge was performed wherein the discharge current was set to be 600 mA(1.0 CmA) and the discharge cut-off voltage was set to be 8.25V. As a result, the discharge capacity was 542 mAh according to this test. This value is equivalent to 90.3% as specific capacity, which revealed that the error of capacity estimation was about 1.7%.
- Accordingly, it becomes evident that the charger having capabilities of the present invention can estimate degradation accurately.
- A Li-ion battery which can be mounted in a portable information terminal was manufactured. The configuration is the same as that shown in FIG. 3. The Li-ion battery has a capability of performing the CC-CV method charge on condition that the charge limit voltage is 12.3V, charge current is 600 mA(1.0 CmA) and the charge-end current is 60 mA. The battery includes three prismatic Li-ion cells (nominal capacity is 600 mAh) 12-1, 12-2, and 12-3 which are connected in series. The equation (37) is stored in the IC for protection beforehand.
- In addition, a program is stored in a memory in the
IC 13 for protection. According to this program, following process is performed. The voltage across the cells 12-1, 12-2, and 12-3 is monitored by Vcc and Vss. The charge voltage is monitored and the elapsed time t from the time when the voltage becomes the charge limit voltage 12.3V(4.1V/cell), that is, from the time when the charge mode changes from the CC mode to the CV mode to the time when the charge current decreases to ½ (300 mA(0.5 CmA)) is measured. Then, the measured time t is substituted into the equation (37) so that the specific capacity Ce/Co is calculated. - The battery is configured such that the result is output to the body of the portable terminal in order to be displayed on an LCD of the portable terminal via the
terminal 19. - On the LCD, a numerical value indicating the degradation estimation result is displayed as % and a bar in which a part of the bar corresponding to the % value ratio is colored is displayed.
- A command for doing degradation estimation is provided from the body of the portable terminal concurrently with the start of charge. Procedures for performing the degradation estimation are the same as those shown in FIG. 42 except for the result to be sent to the body since the result is displayed on the display of the portable terminal.
- The battery was mounted in the portable information terminal and used for one hour. After that, charge of the battery was started by connecting the terminal to the utility power source. The estimated specific capacity of the battery was displayed as 75% after the start of the charge. After checking that a sign of charge completion was displayed, the information terminal was powered off and the battery was removed from the terminal. Then, the battery was connected to the battery charge and discharge automatic test apparatus by using proper codes and the discharge capacity was measured by discharging the battery on condition that the discharge current was 600 mA(1.0 CmA) and the discharge cut-off voltage was 8.25V(2.75V/cell). As a result, the discharge capacity was 472 mAh, which means that the specific capacity was 78.7%.
- Thus, the error of estimation was −3.7%, which means estimation was performed accurately.
- Sixth Embodiment
- In the following, the sixth embodiment will be described.
- The capacity estimation and degradation estimation method can be applied to various apparatuses which mount the Li-ion battery. In the sixth embodiment, examples which mount the Li-ion cell or the Li-ion battery to which the capacity estimation and degradation estimation method of the present invention are applied will be shown.
- First, an example in which the present invention is applied to an electric vehicle (EV) will be described.
- The electric vehicle in this embodiment is a pure electric vehicle (PEV) which mounts a Li-ion battery including 12 modules, 96 cells in which the rating voltage is 28.8V and the rating capacity is 100 Ah. The seating capacity of the PEV is 4 passengers and the weight is 1415 kg. The mileage per one charge (5 hour charge) is larger that 200 km. The PEV is driven only by the battery. Thus, it is important to grasp not only remaining capacity but also the life of the battery. The capacity estimation and degradation estimation methods of the present invention can be used effectively for evaluating the capacity and the life properly.
- FIG. 43 shows a configuration when the Li-ion battery in the PEV is charged by a charger. The configuration of the charger is the same as that described so far. When charging the battery, the
charger 61 is connected to theutility power 64 via thecable terminals ion battery 66 in thePEV 65 is connected to the charger viacable terminals - In the
charger 61 to which the Li-ion battery 66 is connected, alternating current from theutility power 64 is converted into direct power. Thecharge control microprocessor 74 controls charge on the basis of information from the power source microprocessor and control information on safety from thethermistor 73. Theswitch 75 is used for ending the charge. In addition, thecharge control microprocessor 74 displays charge state and safety state on thedisplay part 76 of thecharger 61 and activates an alarm. - In order to performing the capacity estimation and degradation estimation of the present invention in the PEV, a program for performing the estimation by using the equation of the present invention is stored in an available memory in the
charge control microprocessor 74 beforehand so that the specific capacity Cr(%), the degradation degree Deg(%) are calculated by applying data of voltage for charge control, current monitor, and the timer to the equation. - Terminals are provided in the charger and the
PEV 65 for connecting and disconnecting a cable for sending calculated values. The specific capacity Cr(%) and the degradation degree Deg(%) which are calculated by thecharge control microprocessor 74 are sent to a control andmonitoring microprocessor 79 in thePEV 65. The data calculated on the basis of the capacity estimation and degradation estimation method of the present invention is displayed, with information of theengine 80, on aproper display part 81 such as an instrument panel and a navigation system display, and generates an alarm. For transmitting the specific capacity Cr(%) and the degradation degree Deg(%) which are calculated by thecharge control microprocessor 74 to the control andmonitoring microprocessor 79 in thePEV 65, wireless communication instead of using the cable can be used by providing a wireless communication apparatus or a jig between the charger and the PEV. - On the basis of the specific capacity Cr(%) and the degradation degree Deg(%) which are calculated by any one of method of the capacity estimation and the degradation methods of the present invention, mileage expectancy at the time of full charge according to degradation and remaining life of the battery are displayed in the PEV 65. In addition, an alarm can be raised when the decrease of capacity or degradation degree exceeds a predetermined value.
- An example of a procedure for performing the capacity estimation and degradation estimation will be described in the following.
- The program for performing the capacity estimation and degradation estimation by using one of the equations of the present invention is stored beforehand in the
charge control microprocessor 74 in the charger. The battery voltage and current are monitored, time is measured by the internal timer so that the specific capacity Cr(%) and the degradation degree Deg(%) are calculated. The calculated values are transmitted to the control andmonitoring microprocessor 79 via a cable between thecable terminals monitoring microprocessor 79 has a program for calculating the mileage expectancy Dr(km) and the life expectancy Y(year) of the battery per one charge. Thus, the control andmonitoring microprocessor 79 calculates them by using the specific capacity Cr(%) and the degradation degree Deg(%) based on the following equations - Dr=Dr0×Cr/100 (38)
- Y=Y0×Deg/100 (39)
- wherein Dr 0 is the mileage expectancy of a new battery per one charge, and Y0 is the life expectancy of the new battery.
- The
display part 81 of thePEV 65 displays the calculated results. - FIG. 44 shows an example of the display screen. As shown in FIG. 44, remaining mileage “Rest of run” 82 and remaining life “Rest of battery life” 83 are displayed on the
display part 81 of thePEV 65. In the screen of the remainingmileage 82, numbers into which the remaining mileage is divided are shown, The mileage expectancy Dr0 of a new battery is shown as acell shape 85 by dotted lines. The mileage expectancy Dr which is calculated by the equation (38) is shown as acell shape 86 by solid lines. The battery energy which is consumed by driving the PEV is obtained by a conventional remaining time estimation method and the remaining mileage can be indicated by using acell shape 87 filled with a color in thecell shape 86 which indicates full charge state. - In the
screen 83 of the remaining battery life calculated by the equation (39), the remaining life is indicated by five cell shapes 88. When Y becomes equal to or smaller than 40%, thesecond cell 89 from the left side is shown by yellow, which is attention color, and indicates “Replace soon”. When Y becomes equal to or smaller than 20%, thecell 90 of the left side is shown by red, which is warning color, and indicates “Replace Now!”. The remaining life Y(%) is shown by filling the cells from the left side. By indicating that the filled area of the remaining life Y(%) includes error, the right end of the filled area may be cut in a slanting direction. - When there is not enough space in the
display part 79, or according to the type of PEV, the cell shapes can be omitted and only “Replace soon” and “Replace Now!” can be displayed, or only an alarm can be sounded. - FIG. 45 is a flowchart showing a procedure for displaying the remaining mileage and the remaining life of the battery by applying the capacity estimation and the degradation estimation method of the present invention to the Li-ion battery in the PEV. In the following, the procedure will be described with reference to FIG. 45.
- (step A) The Li-ion battery mounted in the PEV is charged and the specific capacity Cr(%) and the degradation degree Deg(%) are calculated by applying the capacity estimation and the degradation estimation method of present invention to the Li-ion battery in the PEV. Then, the mileage expectancy Dr(%) and the remaining life Y(%) are calculated by using equations (38) and (39).
- (step B) The mileage expectancy Dr(%) and the remaining life Y(%) obtained in the step A are displayed. That is, when the remaining life Y(%) is displayed, N is obtained such that Y is divided by 20
- N=INT(Y/20) (40)
- for displaying the remaining life in a scale of 1 to five. Then, the number N of the cells are filled from the left side. Next, a part of the cell shape which is right next to the filled cell is filled such that the ratio of the part to be filled to a cell shape is S(%)=100×(Y-20×N)/20 (41). In the case that the remaining life is not displayed, only when Y becomes equal to or smaller than 40% so that exchanging cells should be considered, it is displayed or an alarm is sounded.
- The remaining mileage Dr(%) can be displayed by the cell shape in which the length is determined by Dr(%) obtained by the equation (38).
- These displaying methods are examples for describing the embodiment and the present invention is not limited to these method.
- The capacity estimation method and the degradation estimation method can be applied to a power assist bicycle. The procedure for the power assist bicycle is the same as that for the PEV. However, as for the power assist bicycle, space for displaying data is generally limited, thus, the
part 83 of the remaining life in the display part shown n FIG. 44 can be moved to the side of the charger. - In addition, the capacity estimation method and the degradation estimation method can be applied to a hybrid electric vehicle (HEV), a solar cell generator system (SCS), a windmill generator system (WMS). For these systems, it is important to estimate the remaining life of the battery in order to determine battery exchanging time.
- FIGS. 46A and 46B show an example of a state of charge (SOC) of the battery mounted in the HEV. In FIGS. 46A and 46B, variations between the speed of the HEV and the SOC of the battery are shown, in which the lateral axis indicates the deriving distance and the vertical axis indicates the speed and the SOC in FIGS. 46A and 46B respectively.
- As shown in FIGS. 46A and 46B, in this case, different from the PEV and PAB, charge and discharge are repeated frequently in the battery while driving. Thus, it is difficult to use monitored current and voltage directly. Therefore, it is necessary to determine a charge time which is longer than a predetermined time and to convert current and voltage which are monitored in this charge time to values of general constant current and constant voltage charge method (in the following, the constant current and constant voltage charge method will be called as the CC-CV charge method) in order to apply the capacity estimation method and the degradation estimation method of the present invention.
- The method of performing estimation by using constant current charge (in the following, the constant current charge will be called as the CC charge) time is most appropriate for capacity estimation and degradation estimation of the Li-ion battery mounted in the HEV. The capacity estimation method and the degradation estimation method of the present invention can be applied in several ways. For example, after identifying a time at which the battery is charged for loner than a predetermined time, preferably for 30 seconds, and, then, capacity estimation and degradation estimation is performed by using charge current and voltage in the time. When the charge period is shorter than 30 seconds, the time for monitoring is not enough so that effective date can not be obtained. In addition, since charge amount is small, estimation error may become large.
- Monitoring of charge voltage is performed equal to or more than at least three times in 10 seconds. Then, a mean value of monitored voltages is obtained. Obtaining the mean voltage is performed a plurality of times at intervals of equal to or longer than at least 10 seconds. Accordingly, data of voltage variation in the cc charge can be obtained.
- As for charge current, when the system has a mechanism for controlling charge current such that the charge current becomes constant, the constant charge current is used. When the charge current is limited to a predetermined range of value, or when the charge current is not controlled at all, a following method can be used as an example.
- That is, monitoring of the charge current is performed equal to or more than three times in 10 seconds. Then, a mean value of the monitored currents is obtained. Obtaining the mean current is performed a plurality of times at intervals of equal to or longer than at least 10 seconds. When the error of the obtained mean currents is smaller than 5%, the charge becomes CC charge. In addition, when discharge is not included in the interval of obtaining the mean current and the interval is equal to or longer than 30 seconds, the charge mode is regarded as in the CC charge mode. Then, the obtained mean current and the charge time t are used for capacity estimation and degradation estimation. When the obtained mean current is different from the current used for determining the equation Ce/Co=At+B (42) or Ce/Co=A′×t B′ (43) (A, B, A′, and B′ are constants and Co is the nominal capacity), relationship between the CC charge current and the CC charge time is obtained beforehand as shown in FIG. 47, and, then, the relationship is applied to the control and monitoring microprocessor so that conversion factor is obtained.
- In addition, data of voltage variation in the CC charge of the battery is applied to the control and monitoring microprocessor beforehand. Then, the necessary time tcc for the charge voltage to change from the CC charge start voltage Vs to the CC charge end voltage Vc used for the equation (42) or (43) is calculated by comparing monitored voltages V1 and V2 with data shown in FIG. 48. The specific capacity Ce/Co can be obtained by substituting tcc into the equation (42) or (43).
- The degradation degree Deg(%) can be obtained by Deg(%)=100×(1-Ce/Co) (44).
- Like the PEV, the remaining life Y is calculated from the capacity and the degradation degree so that the remaining life Y can be displayed on a proper display part such as an instrument panel or a navigation system.
- For the Li-ion battery of the solar cell generator system (SCS) or the windmill generator system (WMS), the capacity estimation method and the degradation estimation method of the present invention can be used in order to display the remaining life of the battery in the same way as the HEV. However, in this case, since it is rare that the SCS or the WMS repeats charge and discharge as frequently as the HEV and the charge time per one time is longer than that of the HEV, monitoring becomes relatively easy.
- According to the present invention, it becomes possible to provide a simple method for estimating capacity of the Li-ion cell, a simple method and apparatus for estimating degradation of the Li-ion cell and a Li-ion battery which includes means of performing capacity estimation and means for warning degradation of the cell as necessary. Thus, the present invention can greatly contribute to management of the Li-ion cell.
- That is, in chargers and batteries and the like, degradation state of cells can be grasped accurately only by using monitoring capability of current and timer without adding any special parts. Thus, it becomes possible to perform management of change of Li-ion cell safely and reliably.
- In addition, as described in the sixth embodiment, the present invention can be applied to various apparatuses and can greatly contribute to ensuring reliability and enlarging application of electronic devices.
- The present invention is not limited to the specifically disclosed embodiments, and variations and modifications may be made without departing from the scope of the invention.
Claims (48)
1. A capacity estimation method for a Li-ion cell, comprising the steps of:
obtaining, when said Li-ion cell is charged by a constant current and constant voltage method, an elapsed time t from the time when charge voltage in constant current charge reaches a predetermined voltage Vs to the time when charge condition is changed from a constant current mode to a constant voltage mode; and
calculating an estimated capacity Ce of said Li-ion cell by using said elapsed time t.
2. The capacity estimation method for said Li-ion cell as claimed in , further comprising the steps of:
claim 1
obtaining said elapsed time t on condition that charge current in said constant current charge is from Co/(30 hours) to Co/(1 hour) wherein Co is a nominal capacity of said Li-ion cell; and
calculating said estimated capacity Ce by using an equation Ce/Co=A×tB and said elapsed time t wherein A and B are positive constants.
3. The capacity estimation method for said Li-ion cell as claimed in , further comprising the steps of:
claim 2
repeating a charge and discharge cycle at least equal to or more than two times by using a Li-ion cell which is a capacity estimation target or the same kind of Li-ion cell as said Li-ion cell, wherein said charge and discharge cycle includes a charge period from 3 hours to 10 days, a discharge period, a rest period which is provided as necessary between said charge period and said discharge period;
obtaining an elapsed time tn from the time when charge voltage in constant current charge reaches a predetermined voltage Vs to the time when charge condition is changed from a constant current mode to a constant voltage mode and discharge capacity Cn in each cycle; and
determining values of said constants A and B from said elapsed time tn and said discharge capacity Cn.
4. A degradation estimation method for a Li-ion cell, comprising the steps of:
obtaining, when said Li-ion cell is charged by a constant current and constant voltage method, an elapsed time t from the time when charge voltage in constant current charge reaches a predetermined voltage Vs to the time when charge condition is changed from a constant current mode to a constant voltage mode;
calculating an estimated capacity Ce of said Li-ion cell by using said elapsed time t; and
judging that said Li-ion cell is degraded when said estimated capacity Ce becomes smaller than a predetermined limit capacity Cmin.
5. The degradation estimation method for said Li-ion cell as claimed in , further comprising the step of:
claim 4
calculating said estimated capacity Ce by using an equation Ce/Co=A×tB wherein A and B are positive constants.
6. A degradation estimation apparatus for a Li-ion cell, comprising:
means for obtaining, when said Li-ion cell is charged by a constant current and constant voltage method, an elapsed time t from the time when charge voltage in constant current charge reaches a predetermined voltage Vs to the time when charge condition is changed from a constant current mode to a constant voltage mode; and
a circuit calculating an estimated capacity Ce of said Li-ion cell by using said elapsed time t; and
means for outputting a signal representing that said Li-ion cell is degraded when said estimated capacity Ce becomes smaller than a predetermined limit capacity Cmin.
7. The degradation estimation apparatus for said Li-ion cell as claimed in , wherein said estimated capacity Ce is calculated by using an equation Ce/Co=A×tB wherein A and B are positive constants.
claim 6
8. A Li-ion battery which includes a charge and discharge control part, comprising:
a memory storing numerical data used for calculating an estimated capacity Ce of Li-ion cells in said Li-ion battery;
means for obtaining, when said Li-ion cell is charged by a constant current and constant voltage method, an elapsed time t from the time when charge voltage in constant current charge reaches a predetermined voltage Vs to the time when charge condition is changed from a constant current mode to a constant voltage mode; and
a circuit for calculating said estimated capacity Ce of said Li-ion cells by using said elapsed time t and said numerical data.
9. The Li-ion battery as claimed in , wherein said estimated capacity Ce is calculated by using an equation Ce/Co=A×tB wherein A and B are positive constants.
claim 8
10. The Li-ion battery as claimed in , further comprising:
claim 9
means for outputting a warning representing that said Li-ion battery is degraded when said estimated capacity Ce becomes smaller than a predetermined limit capacity Cmin.
11. The Li-ion battery as claimed in , wherein said warning is any one of a warning by an electrical signal, a warning by displaying characters or an image and a warning by a beep or voice.
claim 10
12. A capacity estimation method for a Li-ion cell, comprising the steps of:
obtaining, when said Li-ion cell is charged by a constant current and constant voltage method, an elapsed time t from the time when charge voltage in constant current charge reaches a predetermined voltage Vs to the time when the charge voltage reaches a charge limit voltage Vc on condition that charge current is equal to or smaller than Co/(20 hours) wherein Co is a nominal capacity of said Li-ion cell; and
calculating an estimated specific capacity Ce/Co of said Li-ion cell by using an equation Ce/Co=At+B, wherein Ce is an estimated capacity of said Li-ion cell, and A and B are positive constants.
13. The capacity estimation method for said Li-ion cell as claimed in , further comprising the steps of:
claim 12
repeating a charge and discharge cycle at least equal to or more than three times by using the same kind of Li-ion cell as a Li-ion cell which is a target of capacity estimation, wherein said charge and discharge cycle includes a charge period from 3 days to 10 days by said constant current and constant voltage method, a discharge period, a rest period which is provided as necessary between said charge period and said discharge period, wherein charge current in said charge period is equal to or smaller than Co/(20 hours), discharge current in said discharge period is from Cot(5 hours) to Co/(0.5 hour) and a predetermined discharge cut-off voltage Vd is used in said discharge period;
obtaining an elapsed time tn from the time when charge voltage in constant current charge reaches a predetermined voltage Vs to the time when the charge voltage reaches a charge limit voltage Vc and discharge capacity Cn in each cycle; and
determining values of said constants A and B from said elapsed time tn and said discharge capacity Cn.
14. The degradation estimation method for said Li-ion cell as claimed in , wherein said estimated capacity Ce is calculated by using an equation Ce/Co=At+B wherein A and B are positive constants.
claim 4
15. A capacity estimation apparatus for a Li-ion cell, comprising:
means for obtaining, when said Li-ion cell is charged by a constant current and constant voltage method, an elapsed time t from the time when charge voltage in constant current charge reaches a predetermined voltage Vs to the time when the charge voltage reaches a charge limit voltage Vc; and
a circuit calculating an estimated specific capacity Ce/Co of said Li-ion cell by using an equation Ce/Co=At+B, wherein Ce is an estimated capacity of said Li-ion cell, Co is a nominal capacity of said Li-ion cell, and A and B are positive constants;
a circuit estimating degradation state of said Li-ion cell on the basis of said estimated specific capacity Ce/Co; and
means for displaying estimation result obtained by said circuit for estimating, or, generating an alarm which warns of degradation of said Li-ion cell.
16. A Li-ion battery which includes a charge and discharge control part, comprising:
a memory storing numerical data used for calculating an estimated specific capacity Ce/Co of Li-ion cells in said Li-ion battery, wherein Ce is an estimated capacity of said Li-ion cells and Co is a nominal capacity of said Li-ion cells;
means for obtaining an elapsed time t from the time when charge voltage in constant current charge reaches a predetermined voltage Vs to the time when the charge voltage reaches a charge limit voltage Vc when said Li-ion cell is charged by a constant current and constant voltage method; and
a circuit calculating said estimated specific capacity Ce/Co of said Li-ion cell by using an equation Ce/Co=At+B and said numerical data, wherein A and B are positive constants;
means for outputting said estimated specific capacity Ce/Co.
17. A capacity estimation method for a Li-ion cell, comprising the steps of:
obtaining, when said Li-ion cell is charged by a constant current and constant voltage method, a charge current after a lapse of a predetermined time from the time when charge condition is changed from a constant current mode to a constant voltage mode; and
calculating an estimated capacity of said Li-ion cell by using said charge current.
18. A capacity estimation method for a Li-ion cell, comprising the steps of:
obtaining, when said Li-ion cell is charged by a constant current and constant voltage method, an elapsed time t from the time when charge condition is changed from a constant current mode to a constant voltage mode to the time when charge current becomes α (0<α<1) times of charge current Ic in said constant current mode; and
calculating an estimated capacity of said Li-ion cell by using said elapsed time t.
19. A capacity estimation method for a Li-ion cell, comprising the steps of:
repeating a charge and discharge cycle a plurality of times, wherein said charge and discharge cycle includes a charge period in which said Li-ion cell is charge by a constant current and constant voltage method and a discharge period in which said charged Li-ion cell is discharged;
obtaining, when said Li-ion cell is charged by a constant current and constant voltage method, an elapsed time tα from the time when charge condition is changed from a constant current mode to a constant voltage mode to the time when charge current becomes α (0<α<1) times of charge current Ic0 in said constant current mode;
obtaining an estimated specific capacity Ce/Co by using a first equation Ce/Co=−Atα+B when said elapsed time tα increases or remains unchanged as the number of repetition of said cycle increases, wherein Ce is a specific capacity, Co is a nominal capacity and A and B are positive constants;
obtaining said estimated specific capacity Ce/Co by using a second equation Ce/Co=+Atα+B when said elapsed time tα decreases as the number of repetition of said cycle increases, wherein B′ is a positive constant; and
obtaining said estimated capacity Ce by using said estimated specific capacity Ce/Co and said nominal capacity Co.
20. The capacity estimation method for said Li-ion cell as claimed in , wherein α is ½.
claim 19
21. The capacity estimation method for said Li-ion cell as claimed in , comprising the steps of:
claim 19
repeating a charge and discharge cycle equal to or more than 5 times or 6 times which is more favorable, wherein said charge and discharge cycle includes a charge period in which the same kind of Li-ion cell- as a Li-ion cell which is a target of capacity estimation is charged by said constant current and constant voltage method and a discharge period in which said Li-ion cell is discharged until voltage of said Li-ion cell reaches a discharge cut-off voltage Vd, wherein charge period per one cycle is from 3 hours to 10 days or from 3 days to 10 days which is more favorable, discharge current is from 0.2 CmA to 2.0 CmA in which 1 CmA is a value obtained by dividing Co by one hour, ambient temperature is from 0° C. to 45° C. or from 15° C. to 30° C. which is more favorable;
obtaining said elapsed time tα and capacity of said Li-ion cell C by integrating said discharge current with respect to time in each cycle;
calculating a specific capacity C/Co in each cycle;
recording tα and C/Co obtained in nth cycle (n is a positive integer) as functions of n tα (n) and Cr(n);
determining said constants A, B and B′ such that said first equation and said second equation approximately represent correlation between tα(n) and Cr(n) when assuming that tα=tα(n) and Ce/Co=Cr(n); and
estimating capacity of said Li-ion cell which is a target of capacity estimation by using equations obtained by substituting determined values of said constants A, B and B′ into said first equation and said second equation.
22. A capacity estimation method for a Li-ion cell, comprising the steps of:
repeating a charge and discharge cycle a plurality of times, wherein said charge and discharge cycle includes a charge period in which said Li-ion cell is charged by a constant current and constant voltage method and a discharge period in which said charged Li-ion cell is discharged;
obtaining a charge current Itm after a lapse of a predetermined time tm from the time when charge condition is changed from a constant current mode to a constant voltage mode, wherein 0<tm≦0.8 Co/Ic0 is satisfied, Co is a nominal capacity of said Li-ion cell and Ic0 is charge current in said constant current mode;
obtaining an estimated specific capacity Ce/Co by using a first equation Ce/Co=−MItm+N when said charge current Itm increases or remains unchanged as the number of repetition of said cycle increases, wherein Ce is a specific capacity of said Li-ion cell and M and N are positive constants;
obtaining said estimated specific capacity Ce/Co by using a second equation Ce/Co=+MItm+N′ when said charge current Itm decreases as the number of repetition of said cycle increases, wherein N′ is a positive constant; and
obtaining said estimated capacity Ce by using said estimated specific capacity Ce/Co and said nominal capacity Co.
23. The capacity estimation method for said Li-ion cell as claimed in , said predetermined time tm is from 1 minute to 15 minutes.
claim 22
24. The capacity estimation method for said Li-ion cell as claimed in , comprising the steps of:
claim 22
repeating a charge and discharge cycle equal to or more than 5 times, wherein said charge and discharge cycle includes a charge period in which the same kind of Li-ion cell as said Li-ion cell which is a target of capacity estimation is charged by said constant current and constant voltage method and a discharge period in which said charged Li-ion cell is discharged until voltage of said Li-ion cell reaches a discharge cut-off voltage Vd, wherein charge period per one cycle is from 3 hours to 10 days, discharge current is from 0.2 CmA to 2.0 CmA in which 1 CmA is a value obtained by dividing Co by one hour, ambient temperature is from 0° C. to 45° C. or from 15° C. to 30° C. which is more favorable;
obtaining said charge current Itm and capacity of said Li-ion cell C by integrating said discharge current with respect to time in each cycle;
calculating a specific capacity C/Co in each cycle;
recording Itm and C/Co obtained in nth cycle (n is a positive integer) as functions of n which are Itm(n) and Cr(n);
determining said constants M, N and N′ such that said first equation and said second equation approximately represent correlation between Itm(n) and Cr(n) when assuming that Itm=Itm(n) and Ce/Co=Cr(n); and
estimating capacity of said Li-ion cell which is a target of capacity estimation by using equations obtained by substituting determined values of said constants M, N and N′ into said first equation and said second equation.
25. A degradation estimation method for a Li-ion cell, comprising the steps of:
repeating a charge and discharge cycle a plurality of times, wherein said charge and discharge cycle includes a charge period in which said Li-ion cell is charge by a constant current and constant voltage method and a discharge period in which said charged Li-ion cell is discharged;
obtaining, when said Li-ion cell is charged by a constant current and constant voltage method, an elapsed time tα from the time when charge condition is changed from a constant current mode to a constant voltage mode to the time when charge current becomes α (0<α<1) times of charge current Ic0 in said constant current mode;
obtaining an estimated specific capacity Ce/Co by using a first equation Ce/Co=−Atα+B when said elapsed time tα increases or remains unchanged as the number of repetition of said cycle increases, wherein Ce is a specific capacity, Co is a nominal capacity and A and B are positive constants;
obtaining said estimated specific capacity Ce/Co by using a second equation Ce/Co=+Atα+B when said elapsed time tα decreases as the number of repetition of said cycle increases, wherein B′ is a positive constant; and
obtaining said estimated capacity Ce by using said estimated specific capacity Ce/Co and said nominal capacity Co; and
judging that said Li-ion cell is degraded when said estimated capacity Ce becomes smaller than a predetermined limit capacity.
26. A degradation estimation method for a Li-ion cell, comprising the steps of:
repeating a charge and discharge cycle a plurality of times, wherein said charge and discharge cycle includes a charge period in which said Li-ion cell is charged by a constant current and constant voltage method and a discharge period in which said charged Li-ion cell is discharged;
obtaining a charge current Itm after a lapse of a predetermined time tm from the time when charge condition is changed from a constant current mode to a constant voltage mode, wherein 0<tm≦0.8Co/Ic0 is satisfied, Co is a nominal capacity of said Li-ion cell and Ic0 is charge current in said constant current mode;
obtaining an estimated specific capacity Ce/Co by using a first equation Ce/Co=-MItm+N when said charge current Itm increases or remains unchanged as the number of repetition of said cycle increases, wherein Ce is a specific capacity of said Li-ion cell and M and N are positive constants;
obtaining said estimated specific capacity Ce/Co by using a second equation Ce/Co=+MItm+N′ when said charge current Itm decreases as the number of repetition of said cycle increases, wherein N′ is a positive constant; and
obtaining said estimated capacity Ce by using said estimated specific capacity Ce/Co and said nominal capacity Co.
judging that said Li-ion cell is degraded when said estimated capacity Ce becomes smaller than a predetermined limit capacity.
27. A degradation estimation apparatus for a Li-ion cell, comprising:
a cell control part comprising:
means for repeating a charge and discharge cycle a plurality of times, wherein said charge and discharge cycle includes a charge period in which said Li-ion cell is charge by a constant current and constant voltage method and a discharge period in which said charged Li-ion cell is discharged;
means for obtaining, when said Li-ion cell is charged by a constant current and constant voltage method, an elapsed time tα from the time when charge condition is changed from a constant current mode to a constant voltage mode to the time when charge current becomes α (0<α<1) times of charge current Ic0 in said constant current mode;
a memory storing said elapsed time tα as a function tα(n) of n in the nth cycle for each cycle;
a logic circuit comprising:
means for obtaining an estimated specific capacity Ce/Co by using a first equation Ce/Co=-Atα+B when said elapsed time tα increases or remains unchanged as the number of repetition of said cycle increases, wherein Ce is a specific capacity, Co is a nominal capacity and A and B are positive constants;
means for obtaining said estimated specific capacity Ce/Co by using a second equation Ce/Co=+Atα+B when said elapsed time tα decreases as the number of repetition of said cycle increases, wherein B′ is a positive constant; and
means for obtaining said estimated capacity Ce by using said estimated specific capacity Ce/Co and said nominal capacity Co; and
means for judging that said Li-ion cell is degraded when said estimated capacity Ce becomes smaller than a predetermined limit capacity.
28. A degradation estimation apparatus for a Li-ion cell, comprising:
a cell control part comprising:
means for repeating a charge and discharge cycle a plurality of times, wherein said charge and discharge cycle includes a charge period in which said Li-ion cell is charged by a constant current and constant voltage method and a discharge period in which said charged Li-ion cell is discharged;
means for obtaining a charge current Itm after a lapse of a predetermined time tm from the time when charge condition is changed from a constant current mode to a constant voltage mode, wherein 0<tm≦0.8 Co/Ic0 is satisfied, Co is a nominal capacity of said Li-ion cell and Ic0 is charge current in said constant current mode;
a memory storing said charge current Itm as a function Itm(n) of n in the nth cycle for each cycle;
a logic circuit comprising:
means for obtaining an estimated specific capacity Ce/Co by using a first equation Ce/Co=−MItm+N when said charge current Itm increases or remains unchanged as the number of repetition of said cycle increases, wherein Ce is a specific capacity of said Li-ion cell and M and N are positive constants;
means for obtaining said estimated specific capacity Ce/Co by using a second equation Ce/Co=+MItm+N′ when said charge current Itm decreases as the number of repetition of said cycle increases, wherein N′ is a positive constant; and
means for obtaining said estimated capacity Ce by using said estimated specific capacity Ce/Co and said nominal capacity Co.
means for judging that said Li-ion cell is degraded when said estimated capacity Ce becomes smaller than a predetermined limit capacity.
29. A Li-ion battery which includes a degradation estimation function, comprising:
a measuring part, when a charge and discharge cycle is repeated a plurality of times, obtaining an elapsed time tα from the time when charge condition is changed from a constant current mode to a constant voltage mode to the time when charge current becomes α (0<α<1) times of charge current Ic0 in said constant current mode, wherein said charge and discharge cycle includes a charge period in which said Li-ion cell is charged by a constant current and constant voltage method and a discharge period in which said charged Li-ion cell is discharged;
a memory storing said elapsed time tα as a function tα(n) of n in the nth cycle for each cycle;
a logic circuit comprising:
means for obtaining an estimated specific capacity Ce/Co by using a first equation Ce/Co=-Atα+B when said elapsed time tα increases or remains unchanged as the number of repetition of said cycle increases, wherein Ce is a specific capacity, Co is a nominal capacity and A and B are positive constants;
means for obtaining said estimated specific capacity Ce/Co by using a second equation Ce/Co=+Atα+B′ when said elapsed time tα decreases as the number of repetition of said cycle increases, wherein B′ is a positive constant; and
means for obtaining said estimated capacity Ce by using said estimated specific capacity Ce/Co and said nominal capacity Co; and
means for judging that said Li-ion cell is degraded when said estimated capacity Ce becomes smaller than a predetermined limit capacity.
30. A Li-ion battery which includes a degradation estimation function, comprising:
a measuring part, when a charge and discharge cycle is repeated a plurality of times, obtaining a charge current Itm after a lapse of a predetermined time tm from the time when charge condition is changed from a constant current mode to a constant voltage mode, wherein 0<tm≦0.8 Co/Ic0 is satisfied, Co is a nominal capacity of said Li-ion cell and Ic0 is charge current in said constant current mode, wherein said charge and discharge cycle includes a charge period in which said Li-ion cell is charged by a constant current and constant voltage method and a discharge period in which said charged Li-ion cell is discharged;
a memory storing said charge current Itm as a function Itm(n) of n in the nth cycle for each cycle;
a logic circuit comprising:
means for obtaining an estimated specific capacity Ce/Co by using a first equation Ce/Co=−MItm+N when said charge current Itm increases or remains unchanged as the number of repetition of said cycle increases, wherein Ce is a specific capacity of said Li-ion cell and M and N are positive constants;
means for obtaining said estimated specific capacity Ce/Co by using a second equation Ce/Co=+MItm+N′ when said charge current Itm decreases as the number of repetition of said cycle increases, wherein N′ is a positive constant; and
means for obtaining said estimated capacity Ce by using said estimated specific capacity Ce/Co and said nominal capacity Co.
means for judging that said Li-ion cell is degraded when said estimated capacity Ce becomes smaller than a predetermined limit capacity.
31. A capacity estimation method for a Li-ion cell, comprising the steps of:
obtaining, when said Li-ion cell is charged by a constant current and constant voltage method, a charge current It after a lapse of a time t which is between 30 seconds and 30 minutes from the time when charge condition is changed from a constant current mode to a constant voltage mode; and
calculating an estimated capacity Ce of said Li-ion cell by using said charge current It and a first equation Ce/Co=−a×It+b, wherein Co is a nominal capacity of said Li-ion cell, a and b are positive constants.
32. The capacity estimation method for said Li-ion cell as claimed in , wherein said constants a and b are calculated by a second equation a=d×te and a third equation b=f×th, wherein d, e, f, and h are constants and 0<d, e<0, 0<f, and h<0 are satisfied.
claim 31
33. The capacity estimation method for said Li-ion cell as claimed in , further comprising the steps of:
claim 32
repeating a charge and discharge cycle at least equal to or more than 5 times by using a Li-ion cell which is a capacity estimation target or the same kind of Li-ion cell as said Li-ion cell, wherein said charge and discharge cycle includes a charge period from 3 hours to one month in which charge is performed by a constant current and constant voltage method, a discharge period, a rest period which is provided as necessary between said charge period and said discharge period;
obtaining, in each cycle, charge currents Itni after a lapse of times tni which are between 30 seconds and 30 minutes from the time when charge condition is changed from a constant current mode to a constant voltage mode, wherein n is a number which is assigned to each cycle and i is a number assigned to each time tni in each cycle;
obtaining discharge capacity Cn in each cycle;
determining said constants a and b in said first equation and d, e, f, and h in said first and second equations by using said time tni, said charge current Itni and said discharge capacity Cn.
34. A Li-ion battery comprising:
a memory storing numeric data used for calculating an estimated capacity of said Li-ion battery; and
a circuit for calculating said estimated capacity by using said numeric data and charge current while charging said Li-ion battery.
35. The Li-ion battery as claimed in , further comprising:
claim 34
means for outputting a warning representing that said Li-ion cell is degraded when said estimated capacity becomes smaller than a predetermined limit capacity.
36. The Li-ion battery as claimed in , wherein said warning is any one of a warning by an electrical signal, a warning by displaying characters or an image, and a warning by a beep or voice.
claim 35
37. A capacity estimation method for a Li-ion cell, comprising the steps of:
obtaining, when said Li-ion cell is charged by a constant current and constant voltage method, an elapsed time t from the time when charge condition is changed from a constant current mode to a constant voltage mode to the time when charge current becomes α (0<α<1) times of charge current in said constant current mode;
obtaining an estimated capacity Ce of said Li-ion cell by using an equation Ce/Co=At+B and said elapsed time t, wherein Co is a nominal capacity of said Li-ion cell and A and B are positive constants.
38. The capacity estimation method for said Li-ion cell as claimed in , wherein α is ½.
claim 37
39. The capacity estimation method for said Li-ion cell as claimed in , further comprising steps of:
claim 37
repeating a charge and discharge cycle at least equal to or more than 5 times by using a Li-ion cell which is a capacity estimation target or the same kind of Li-ion cell as said Li-ion cell, wherein said charge and discharge cycle includes a charge period from 3 hours to 10 days in which charge is performed by said constant current and constant voltage method and charge current in said constant current mode is from Co/5 hours to Co/0.5 hour, a discharge period, a rest period which is provided as necessary between said charge period and said discharge period;
obtaining an elapsed time tn from the time when charge condition is changed from a constant current mode to a constant voltage mode to the time when charge current becomes α (0<α<1) times of charge current in said constant current mode and discharge capacity Cn in each cycle; and
determining values of said constants A and B from said elapsed time tn and said discharge capacity Cn.
40. The capacity estimation method for said Li-ion cell as claimed in , wherein α is ½.
claim 39
41. A degradation estimation method for a Li-ion cell, comprising the steps of:
obtaining, when said Li-ion cell is charged by a constant current and constant voltage method, an elapsed time t from the time when charge condition is changed from a constant current mode to a constant voltage mode to the time when charge current becomes α (0<α<1) times of charge current in said constant current mode;
obtaining an estimated capacity Ce of said Li-ion cell by using an equation Ce/Co=At+B and said elapsed time t, wherein Co is a nominal capacity of said Li-ion cell and A and B are positive constants; and
judging that said Li-ion cell is degraded when said estimated capacity Ce becomes smaller than a predetermined limit capacity Cmin.
42. The capacity estimation method for said Li-ion cell as claimed in , wherein α is ½.
claim 41
43. A degradation estimation apparatus for a Li-ion cell, comprising:
means for obtaining, when said Li-ion cell is charged by a constant current and constant voltage method, an elapsed time t from the time when charge condition is changed from a constant current mode to a constant voltage mode to the time when charge current becomes α (0<α<1) times of charge current in said constant current mode;
a circuit obtaining an estimated capacity Ce of said Li-ion cell by using said elapsed time t; and
means for outputting a signal representing that said Li-ion cell is degraded when said estimated capacity Ce becomes smaller than a predetermined limit capacity Cmin.
44. The capacity estimation apparatus for said Li-ion cell as claimed in , wherein α is ½, and said circuit obtains said estimated capacity Ce of said Li-ion cell by using an equation Ce/Co=At+B and said elapsed time t, wherein Co is a nominal capacity of said Li-ion cell and A and B are positive constants.
claim 43
45. A Li-ion battery which includes a charge and discharge control part, comprising:
a memory storing numerical data used for calculating an estimated capacity Ce of Li-ion cells in said Li-ion battery;
means for obtaining, when said Li-ion cell is charged by a constant current and constant voltage method, an elapsed time t from the time when charge condition is changed from a constant current mode to a constant voltage mode to the time when charge current becomes α (0<α<1) times of charge current in said constant current mode;
a circuit obtaining an estimated capacity Ce of said Li-ion cell by using said elapsed time t.
46. The Li-ion battery for said Li-ion cell as claimed in , wherein α is ½, and said circuit obtains said estimated capacity Ce of said Li-ion cell by using an equation Ce/Co=At+B and said elapsed time t, wherein Co is a nominal capacity of said Li-ion cell and A and B are positive constants.
claim 45
47. The Li-ion battery as claimed in , further comprising:
claim 45
means for outputting a warning representing that said Li-ion cell is degraded when said estimated capacity Ce becomes smaller than a predetermined limit capacity Cmin.
48. The Li-ion battery as claimed in , wherein said warning is any one of a warning by an electrical signal, a warning by displaying characters or an image, and a warning by a beep or voice.
claim 47
Applications Claiming Priority (10)
| Application Number | Priority Date | Filing Date | Title |
|---|---|---|---|
| JP2000068921A JP3649643B2 (en) | 2000-03-13 | 2000-03-13 | Lithium-ion battery capacity estimation method |
| JP2000-068921 | 2000-03-13 | ||
| JP2000-100654 | 2000-04-03 | ||
| JP2000100680A JP3370047B2 (en) | 2000-04-03 | 2000-04-03 | Lithium ion battery capacity estimation method, deterioration determination method, deterioration determination device, and lithium ion battery pack |
| JP2000100654A JP3547686B2 (en) | 2000-04-03 | 2000-04-03 | Lithium ion battery capacity estimation method, deterioration determination method, deterioration determination device, and lithium ion battery pack |
| JP2000-100680 | 2000-04-03 | ||
| JP2000149902A JP3649652B2 (en) | 2000-05-22 | 2000-05-22 | Lithium ion battery capacity estimation method, deterioration determination device, and lithium ion battery pack |
| JP2000-149902 | 2000-05-22 | ||
| JP2000-361149 | 2000-11-28 | ||
| JP2000361149A JP3470098B2 (en) | 2000-11-28 | 2000-11-28 | Lithium ion battery capacity estimation method, deterioration judgment method, deterioration judgment device, and lithium ion battery pack having deterioration judgment function |
Publications (2)
| Publication Number | Publication Date |
|---|---|
| US20010022518A1 true US20010022518A1 (en) | 2001-09-20 |
| US6586940B2 US6586940B2 (en) | 2003-07-01 |
Family
ID=27531443
Family Applications (1)
| Application Number | Title | Priority Date | Filing Date |
|---|---|---|---|
| US09/804,503 Expired - Fee Related US6586940B2 (en) | 2000-03-13 | 2001-03-12 | Capacity estimation method, degradation estimation method and degradation estimation apparatus for lithium-ion cells, and lithium-ion batteries |
Country Status (3)
| Country | Link |
|---|---|
| US (1) | US6586940B2 (en) |
| KR (3) | KR100414979B1 (en) |
| TW (1) | TW510977B (en) |
Cited By (74)
| Publication number | Priority date | Publication date | Assignee | Title |
|---|---|---|---|---|
| US20030054229A1 (en) * | 2001-09-19 | 2003-03-20 | Shigefumi Odaohhara | Electrical apparatus, computer system, intelligent battery, battery diagnosis method, batter-state display method, and program |
| WO2003107470A1 (en) * | 2002-06-12 | 2003-12-24 | ソニー株式会社 | Battery pack and battery remaining power calculating method |
| WO2004113939A2 (en) * | 2003-06-23 | 2004-12-29 | Yazaki Corporation | Method and apparatus for judging deterioration of battery |
| US20050189909A1 (en) * | 2004-02-17 | 2005-09-01 | Research In Motion Limited | Method and apparatus for handling a charging state in a mobile electronic device |
| EP1615043A1 (en) * | 2003-03-31 | 2006-01-11 | Yazaki Corporation | Battery status monitoring apparatus and method |
| DE102005032507A1 (en) * | 2004-07-14 | 2006-02-16 | General Motors Corp., Detroit | Ultracapacitor service life prediction |
| US20070078615A1 (en) * | 2003-09-24 | 2007-04-05 | Gottfried Rieger | Method and device for communication with a plant |
| US20070182376A1 (en) * | 2006-02-01 | 2007-08-09 | Doyle Thomas F | Battery management |
| US20080086277A1 (en) * | 2004-11-05 | 2008-04-10 | Farhad Ahmed | Method for determining battery capacity |
| WO2008154956A1 (en) * | 2007-06-20 | 2008-12-24 | Robert Bosch Gmbh | Charging method based on battery model |
| US20090132186A1 (en) * | 2007-11-15 | 2009-05-21 | Broadcom Corporation | Method and system for reporting battery status based on current estimation |
| US20090326749A1 (en) * | 2006-08-30 | 2009-12-31 | Toyota Jidosha Kabushiki Kaisha | Degradation assessment system for power storage device, vehicle, degradation assessment method for power storage device, and computer-readable recording medium having program recorded thereon for computer to execute the degradation assessment method |
| US20100085014A1 (en) * | 2008-10-03 | 2010-04-08 | Fujitsu Limited | Battery unit, battery system, electronic device, charging control method of battery, and discharging control method of battery |
| US20100235024A1 (en) * | 2006-02-10 | 2010-09-16 | Toyota Jidosha Kabushiki Kaisha | Hybrid vehicle battery life evaluating apparatus |
| US20110077880A1 (en) * | 2009-09-30 | 2011-03-31 | Battelle Energy Alliance, Llc | Systems, methods and computer readable media for estimating capacity loss in rechargeable electrochemical cell |
| CN102193069A (en) * | 2010-02-22 | 2011-09-21 | 丰田自动车株式会社 | Determination system and determination method for determining whether metal lithium is precipitated in a lithium ion secondary battery, and vehicle equipped with the determination system |
| CN102213747A (en) * | 2010-04-09 | 2011-10-12 | 深圳市比克电池有限公司 | Method for predicting cycle life of lithium ion battery |
| WO2011153057A1 (en) * | 2010-06-03 | 2011-12-08 | Battelle Energy Alliance, Llc | Systems, methods and computer readable media for modeling cell performance fade of rechargeable electrochemical devices |
| EP2439551A1 (en) * | 2010-10-05 | 2012-04-11 | IPS Integrated Power Solutions AG | Method of determining battery status information |
| US20120096885A1 (en) * | 2010-10-25 | 2012-04-26 | Green Power Industrial Limited | Solar powered vehicle air-conditioning system |
| CN102479980A (en) * | 2010-11-30 | 2012-05-30 | 通用汽车环球科技运作有限责任公司 | Algorithm for determining capacity of battery while in service |
| CN102788957A (en) * | 2011-05-20 | 2012-11-21 | 镇江恒驰科技有限公司 | Estimating method of charge state of power battery |
| US20120299556A1 (en) * | 2010-06-18 | 2012-11-29 | Tomoyasu Ishikawa | Deterioration degree determining apparatus |
| CN102809730A (en) * | 2011-06-03 | 2012-12-05 | 株式会社杰士汤浅国际 | Condition determination device, electric storage device, and condition determination method |
| US8346495B2 (en) | 2010-04-22 | 2013-01-01 | Battelle Energy Alliance, Llc | Systems, methods and computer-readable media to model kinetic performance of rechargeable electrochemical devices |
| FR2977678A1 (en) * | 2011-07-07 | 2013-01-11 | Commissariat Energie Atomique | Method for diagnosing battery, involves charging battery to reach predetermined maximum voltage for specific time in phase, and calculating state of health of battery from measured time and charging time |
| DE102012007126A1 (en) | 2012-04-07 | 2013-10-10 | Volkswagen Aktiengesellschaft | Method and system for controlling the charging process of an electrical energy storage device, in particular in a vehicle |
| CN103399276A (en) * | 2013-07-25 | 2013-11-20 | 哈尔滨工业大学 | Lithium-ion battery capacity estimation and residual cycling life prediction method |
| CN103439666A (en) * | 2013-09-02 | 2013-12-11 | 北京航空航天大学 | Geometric method for evaluating capacity recession of lithium ion battery |
| CN103560280A (en) * | 2013-10-11 | 2014-02-05 | 深圳华粤宝电池有限公司 | Chemical synthetic method of lithium ion battery |
| US20140062412A1 (en) * | 2012-08-30 | 2014-03-06 | General Electric Company | Method of charging an electrochemical cell |
| CN103823188A (en) * | 2014-02-25 | 2014-05-28 | 宁德时代新能源科技有限公司 | Lithium-ion battery pack health state assessment method |
| US20140159643A1 (en) * | 2012-12-12 | 2014-06-12 | General Electric Company | Systems and Methods for Controlling Battery Charging |
| US20140203781A1 (en) * | 2013-01-22 | 2014-07-24 | Samsung Sdi Co., Ltd. | Battery pack and charging method thereof |
| US20140253039A1 (en) * | 2013-03-08 | 2014-09-11 | Texas Instruments Incorporated | Battery charger |
| US20150002078A1 (en) * | 2013-06-26 | 2015-01-01 | Samsung Electronics Co., Ltd. | Control circuit for reducing charging time and method thereof |
| US20150046109A1 (en) * | 2012-04-23 | 2015-02-12 | Hitachi, Ltd. | Battery system maintenance management system and method |
| FR3011393A1 (en) * | 2013-10-01 | 2015-04-03 | Centre Nat Rech Scient | METHOD AND APPARATUS FOR EVALUATING THE HEALTH CONDITION OF A LITHIUM BATTERY |
| CN104698384A (en) * | 2013-12-05 | 2015-06-10 | 现代自动车株式会社 | Determining apparatus of battery deterioratiion for electric vehicle and method thereof |
| WO2015128709A1 (en) * | 2014-02-27 | 2015-09-03 | Toyota Jidosha Kabushiki Kaisha | Vehicle charge control device |
| US20160116544A1 (en) * | 2014-10-24 | 2016-04-28 | Texas Instruments Incorporated | Battery capacity monitor |
| CN105633472A (en) * | 2015-12-30 | 2016-06-01 | 山东精工电子科技有限公司 | Self-discharge rate consistency matching and screening method for lithium-ion battery |
| CN105896579A (en) * | 2016-04-26 | 2016-08-24 | 西南交通大学 | Charging pile planning method considering overvoltage caused by electric vehicle tripping due to voltage sag of distribution network |
| US20160356858A1 (en) * | 2014-02-19 | 2016-12-08 | Nissan Motor Co., Ltd. | Impedance measuring device and control method for impedance measuring device |
| CN106384853A (en) * | 2016-11-24 | 2017-02-08 | 山东精工电子科技有限公司 | Lithium ion battery stepped formation and consistency screening method |
| US20170045588A1 (en) * | 2014-02-19 | 2017-02-16 | Nissan Motor Co., Ltd. | Impedance measuring device and control method for impedance measuring device |
| CN106483462A (en) * | 2015-08-28 | 2017-03-08 | 炬芯(珠海)科技有限公司 | A kind of measuring method of battery charge and device |
| WO2017050945A1 (en) * | 2015-09-25 | 2017-03-30 | Commissariat A L'energie Atomique Et Aux Energies Alternatives | Method for estimating an indicator of the state of health of a lithium battery and associated estimating device |
| US9625532B2 (en) | 2011-10-10 | 2017-04-18 | Battelle Energy Alliance, Llc | Method, system, and computer-readable medium for determining performance characteristics of an object undergoing one or more arbitrary aging conditions |
| US20170123013A1 (en) * | 2012-11-30 | 2017-05-04 | Gs Yuasa International Ltd. | Post-deterioration performance estimating apparatus and post-deterioration performance estimating method for energy storage device, and energy storage system |
| CN106772113A (en) * | 2017-03-29 | 2017-05-31 | 四川长虹电器股份有限公司 | A kind of method that degree of aging is judged based on accumulator voltage change |
| US20170227607A1 (en) * | 2016-02-04 | 2017-08-10 | Mediatek Inc. | Schemes capable of efficiently and accurately estimating and/or predicting available battery capacity and battery aging factor |
| US20170244255A1 (en) * | 2016-02-23 | 2017-08-24 | Dongguan Amperex Technology Limited | Method for charging a lithium ion battery |
| US9947971B2 (en) | 2014-02-17 | 2018-04-17 | Toyota Jidosha Kabushiki Kaisha | Battery system |
| EP3324197A1 (en) * | 2016-11-22 | 2018-05-23 | Commissariat à l'Energie Atomique et aux Energies Alternatives | Method for determining the state of health of a battery cell |
| CN108333516A (en) * | 2017-01-17 | 2018-07-27 | 盈正豫顺电子股份有限公司 | Battery state testing method and system |
| US10086823B2 (en) * | 2014-04-09 | 2018-10-02 | Toyota Jidosha Kabushiki Kaisha | Vehicle on which traveling motor is mounted |
| CN109425832A (en) * | 2017-08-31 | 2019-03-05 | 加百裕工业股份有限公司 | Using the lithium battery capacity check method of compensation calculation method |
| CN111965555A (en) * | 2020-09-18 | 2020-11-20 | 重庆长安新能源汽车科技有限公司 | Parallel connection group screening method for single batteries |
| WO2021006860A1 (en) * | 2019-07-05 | 2021-01-14 | General Electric Company | Method and apparatus for estimating a state of health of a battery |
| US10908223B2 (en) * | 2018-03-20 | 2021-02-02 | Kabushiki Kaisha Toshiba | Battery safety evaluation apparatus, battery safety evaluation method, non-transitory storage medium, control circuit, and power storage system |
| US10942221B2 (en) | 2016-02-04 | 2021-03-09 | Mediatek Inc. | Method and apparatus capable of accurately estimating/determining power percentage of battery based on confidence levels determined from resultant information of multiple different fuel gauge operations and/or information of battery history, aging factor, sleep time, or battery temperature |
| US10957946B2 (en) | 2019-08-13 | 2021-03-23 | International Business Machines Corporation | Capacity degradation analysis for batteries |
| US10955482B2 (en) * | 2016-10-09 | 2021-03-23 | Goertek Technology Co., Ltd. | Method and device for acquiring battery power level and electronic device |
| CN113646651A (en) * | 2019-03-18 | 2021-11-12 | 株式会社Lg新能源 | Battery management apparatus |
| CN114114014A (en) * | 2020-08-25 | 2022-03-01 | 奥迪股份公司 | Method for determining the capacity of a lithium ion battery by means of a salient point |
| CN114325415A (en) * | 2021-12-31 | 2022-04-12 | 杭叉集团股份有限公司 | Method, device and medium for verifying electric quantity of lithium battery |
| US11340305B2 (en) | 2018-02-09 | 2022-05-24 | Lg Energy Solution, Ltd. | Apparatus and method for estimating state of secondary battery |
| US11349327B2 (en) * | 2019-05-15 | 2022-05-31 | Sk Innovation Co., Ltd. | Apparatus and control method for battery management system |
| US11374424B2 (en) * | 2019-02-01 | 2022-06-28 | Sk Innovation Co., Ltd. | Battery management system |
| US11527900B2 (en) * | 2019-04-18 | 2022-12-13 | Lg Display Co., Ltd. | Apparatus and method for managing a battery based on degradation determination |
| US11679676B2 (en) | 2019-08-30 | 2023-06-20 | Toyota Jidosha Kabushiki Kaisha | Display system and vehicle including the same, and method of showing state of secondary battery |
| CN117458010A (en) * | 2023-12-20 | 2024-01-26 | 超耐斯(深圳)新能源集团有限公司 | Lithium battery energy storage monitoring system based on data analysis |
| CN117452235A (en) * | 2023-12-22 | 2024-01-26 | 南昌大学 | Lithium ion battery electrolyte leakage early warning method and system |
Families Citing this family (26)
| Publication number | Priority date | Publication date | Assignee | Title |
|---|---|---|---|---|
| CA2392182C (en) * | 2001-07-05 | 2008-11-04 | Research In Motion Limited | System and method for battery capacity reporting |
| GB2416617B (en) * | 2004-07-24 | 2008-08-06 | Ford Motor Co | A voice warning system for a vehicle |
| KR100709864B1 (en) * | 2005-12-23 | 2007-04-23 | 삼성에스디아이 주식회사 | Battery pack having predicted life cycle display function |
| JP5109304B2 (en) * | 2006-08-03 | 2012-12-26 | 日産自動車株式会社 | Battery remaining capacity detection device |
| KR100903489B1 (en) * | 2007-04-30 | 2009-06-18 | 삼성에스디아이 주식회사 | Method of testing cycle life of lithium rechargeable battery |
| US8222868B2 (en) * | 2008-04-02 | 2012-07-17 | Techtronic Power Tools Technology Limited | Battery tester for rechargeable power tool batteries |
| US9853488B2 (en) | 2008-07-11 | 2017-12-26 | Charge Fusion Technologies, Llc | Systems and methods for electric vehicle charging and power management |
| JP5206879B2 (en) * | 2009-09-09 | 2013-06-12 | トヨタ自動車株式会社 | Power supply system for vehicle and control method thereof |
| US20110258126A1 (en) * | 2010-04-14 | 2011-10-20 | Lg Chem, Ltd. | Systems and methods for determining a warranty obligation of a supplier to an original equipment manufacturer for a vehicle battery pack |
| FR2963167B1 (en) * | 2010-07-20 | 2013-03-08 | Peugeot Citroen Automobiles Sa | DEVICE AND METHOD FOR COOLING A MEANS FOR STORING ELECTRIC ENERGY |
| JP5890513B2 (en) * | 2012-02-27 | 2016-03-22 | 京セラ株式会社 | Control device, control system, and storage battery control method |
| CN103427125B (en) * | 2012-05-15 | 2016-04-13 | 清华大学 | The round-robin method of sulfenyl polymer Li-ion battery |
| US9707854B2 (en) * | 2013-06-18 | 2017-07-18 | Atieva, Inc. | Series booster pack for battery system capacity recovery |
| TWI534447B (en) * | 2015-04-01 | 2016-05-21 | 致茂電子股份有限公司 | System and method for automatic calibration and verification |
| JP6441188B2 (en) * | 2015-09-01 | 2018-12-19 | 日立オートモティブシステムズ株式会社 | Battery management device, battery system, and hybrid vehicle control system |
| JP6520654B2 (en) * | 2015-11-12 | 2019-05-29 | 株式会社豊田自動織機 | Method of detecting the degree of deterioration of lead battery and method of controlling charging of lead battery |
| KR101894131B1 (en) * | 2015-12-18 | 2018-08-31 | 주식회사 엘지화학 | Method for testing cycle life of positive electrode active material for secondary battery |
| US10830823B2 (en) * | 2016-04-01 | 2020-11-10 | Gs Yuasa International Ltd. | Estimation device and estimation method |
| KR101866073B1 (en) * | 2016-10-19 | 2018-06-08 | 현대자동차주식회사 | Method for predicting State of Health of Battery |
| KR20180047405A (en) | 2016-10-31 | 2018-05-10 | 삼성전자주식회사 | Mobile X RAY APPARATUS AND OPERATION METHOD OF THE SAME |
| TWI639421B (en) * | 2016-11-10 | 2018-11-01 | 睿傳數據股份有限公司 | Smart bedside card and its control management system |
| KR20190073253A (en) * | 2017-12-18 | 2019-06-26 | 삼성전자주식회사 | Method and apparatus for estimating state of battery |
| US10666067B2 (en) * | 2018-06-19 | 2020-05-26 | Starkey Laboratories, Inc. | Portable charging unit with accelerated charging for hearing assistance devices |
| JP7243123B2 (en) * | 2018-10-19 | 2023-03-22 | トヨタ自動車株式会社 | vehicle |
| CN112379293B (en) * | 2019-06-24 | 2022-09-23 | 宁德时代新能源科技股份有限公司 | Charge state correction method and device |
| CN112964994A (en) * | 2021-02-01 | 2021-06-15 | 惠州亿纬锂能股份有限公司 | Method and device for measuring maximum current of battery |
Family Cites Families (14)
| Publication number | Priority date | Publication date | Assignee | Title |
|---|---|---|---|---|
| CH471695A (en) | 1968-04-09 | 1969-04-30 | Fischer Ag Georg | Rim attachment |
| US5187424A (en) | 1989-10-14 | 1993-02-16 | Mercedes-Benz Ag | Process for determining the state of a battery |
| DE3934353A1 (en) | 1989-10-14 | 1991-04-25 | Daimler Benz Ag | METHOD FOR DETERMINING THE CONDITION OF A BATTERY |
| US5172044A (en) | 1990-02-27 | 1992-12-15 | Sony Corporation | Multi-rate constant voltage battery charger with display |
| DE4402716C2 (en) | 1994-01-29 | 1996-08-29 | Ibm | Estimation of the lifespan and capacity of an energy storage device |
| JPH08136629A (en) | 1994-11-11 | 1996-05-31 | Kyushu Electric Power Co Inc | Device for diagnosing service life of battery |
| KR970024434A (en) | 1995-10-12 | 1997-05-30 | 김광호 | Combined Battery Charger and Control Method |
| JPH09219221A (en) | 1996-02-09 | 1997-08-19 | Nissan Motor Co Ltd | Battery life estimating method and its device |
| JP2780700B2 (en) | 1996-04-15 | 1998-07-30 | 日本電気株式会社 | Rechargeable battery charger |
| JP3692617B2 (en) | 1996-05-27 | 2005-09-07 | ソニー株式会社 | Charging time calculation method and battery pack |
| JP3659772B2 (en) | 1997-08-07 | 2005-06-15 | 三菱自動車工業株式会社 | Battery deterioration judgment device |
| JP3460567B2 (en) | 1998-01-19 | 2003-10-27 | 松下電器産業株式会社 | Secondary battery deterioration detection method and charger equipped with deterioration detection function |
| JPH11329512A (en) | 1998-05-20 | 1999-11-30 | Fuji Photo Film Co Ltd | Secondary battery capacity deterioration judging method and its judging device |
| US6191559B1 (en) * | 2000-01-11 | 2001-02-20 | Lucent Technologies, Inc. | Battery capacity calculator and method of calculating battery capacity |
-
2001
- 2001-03-12 TW TW090105739A patent/TW510977B/en active
- 2001-03-12 KR KR10-2001-0012675A patent/KR100414979B1/en not_active IP Right Cessation
- 2001-03-12 US US09/804,503 patent/US6586940B2/en not_active Expired - Fee Related
-
2003
- 2003-04-17 KR KR10-2003-0024355A patent/KR100402309B1/en not_active IP Right Cessation
- 2003-04-17 KR KR10-2003-0024354A patent/KR100440676B1/en not_active IP Right Cessation
Cited By (123)
| Publication number | Priority date | Publication date | Assignee | Title |
|---|---|---|---|---|
| US7663374B2 (en) * | 2001-09-19 | 2010-02-16 | Lenovo (Singapore) Pte. Ltd. | Electrical apparatus, computer system, intelligent battery, battery diagnosis method, batter-state display method, and program |
| US20030054229A1 (en) * | 2001-09-19 | 2003-03-20 | Shigefumi Odaohhara | Electrical apparatus, computer system, intelligent battery, battery diagnosis method, batter-state display method, and program |
| WO2003107470A1 (en) * | 2002-06-12 | 2003-12-24 | ソニー株式会社 | Battery pack and battery remaining power calculating method |
| US20040212349A1 (en) * | 2002-06-12 | 2004-10-28 | Yukio Tsuchiya | Battery pack and battery remaining power calculating method |
| US6972545B2 (en) | 2002-06-12 | 2005-12-06 | Sony Corporation | Battery pack and battery remaining power calculating method |
| EP1615043A4 (en) * | 2003-03-31 | 2006-08-09 | Yazaki Corp | Battery status monitoring apparatus and method |
| US20060273763A1 (en) * | 2003-03-31 | 2006-12-07 | Yazaki Corporation | Battery status monitoring apparatus and method |
| EP1615043A1 (en) * | 2003-03-31 | 2006-01-11 | Yazaki Corporation | Battery status monitoring apparatus and method |
| US20070096743A1 (en) * | 2003-06-23 | 2007-05-03 | Yazaki Corporation | Method and apparatus for judging deterioration of battery |
| WO2004113939A2 (en) * | 2003-06-23 | 2004-12-29 | Yazaki Corporation | Method and apparatus for judging deterioration of battery |
| WO2004113939A3 (en) * | 2003-06-23 | 2005-03-03 | Yazaki Corp | Method and apparatus for judging deterioration of battery |
| US7424378B2 (en) * | 2003-09-24 | 2008-09-09 | Siemens Aktiengesellschaft | Method and device for communication with a plant |
| US20070078615A1 (en) * | 2003-09-24 | 2007-04-05 | Gottfried Rieger | Method and device for communication with a plant |
| US20050189909A1 (en) * | 2004-02-17 | 2005-09-01 | Research In Motion Limited | Method and apparatus for handling a charging state in a mobile electronic device |
| DE102005032507B4 (en) * | 2004-07-14 | 2009-04-16 | General Motors Corp., Detroit | Ultracapacitor service life prediction |
| DE102005032507A1 (en) * | 2004-07-14 | 2006-02-16 | General Motors Corp., Detroit | Ultracapacitor service life prediction |
| US20080086277A1 (en) * | 2004-11-05 | 2008-04-10 | Farhad Ahmed | Method for determining battery capacity |
| US8589098B2 (en) * | 2004-11-05 | 2013-11-19 | Blackberry Limited | Method for determining battery capacity |
| US20120316816A1 (en) * | 2004-11-05 | 2012-12-13 | Research In Motion Limited | Method for determining battery capacity |
| US8010305B2 (en) * | 2004-11-05 | 2011-08-30 | Research In Motion Limited | Method for determining battery capacity |
| US7676335B2 (en) * | 2004-11-05 | 2010-03-09 | Research In Motion Limited | Method for determining battery capacity |
| US8271217B2 (en) * | 2004-11-05 | 2012-09-18 | Research In Motion Limited | Method for determining battery capacity |
| US20100117657A1 (en) * | 2004-11-05 | 2010-05-13 | Research In Motion Limited | Method For Determining Battery Capacity |
| US20070182376A1 (en) * | 2006-02-01 | 2007-08-09 | Doyle Thomas F | Battery management |
| US7595642B2 (en) * | 2006-02-01 | 2009-09-29 | Qualcomm Incorporated | Battery management system for determining battery charge sufficiency for a task |
| US20100235024A1 (en) * | 2006-02-10 | 2010-09-16 | Toyota Jidosha Kabushiki Kaisha | Hybrid vehicle battery life evaluating apparatus |
| US8676482B2 (en) * | 2006-02-10 | 2014-03-18 | Toyota Jidosha Kabushiki Kaisha | Hybrid vehicle battery life evaluating apparatus |
| US20090326749A1 (en) * | 2006-08-30 | 2009-12-31 | Toyota Jidosha Kabushiki Kaisha | Degradation assessment system for power storage device, vehicle, degradation assessment method for power storage device, and computer-readable recording medium having program recorded thereon for computer to execute the degradation assessment method |
| WO2008154956A1 (en) * | 2007-06-20 | 2008-12-24 | Robert Bosch Gmbh | Charging method based on battery model |
| US20090132186A1 (en) * | 2007-11-15 | 2009-05-21 | Broadcom Corporation | Method and system for reporting battery status based on current estimation |
| US8405357B2 (en) * | 2008-10-03 | 2013-03-26 | Fujitsu Limited | Battery unit, battery system, electronic device, charging control method of battery, and discharging control method of battery |
| US20100085014A1 (en) * | 2008-10-03 | 2010-04-08 | Fujitsu Limited | Battery unit, battery system, electronic device, charging control method of battery, and discharging control method of battery |
| US8467984B2 (en) | 2009-09-30 | 2013-06-18 | Battelle Energy Alliance, Llc | Systems, methods and computer readable media for estimating capacity loss in rechargeable electrochemical cells |
| US20110077880A1 (en) * | 2009-09-30 | 2011-03-31 | Battelle Energy Alliance, Llc | Systems, methods and computer readable media for estimating capacity loss in rechargeable electrochemical cell |
| CN102193069A (en) * | 2010-02-22 | 2011-09-21 | 丰田自动车株式会社 | Determination system and determination method for determining whether metal lithium is precipitated in a lithium ion secondary battery, and vehicle equipped with the determination system |
| CN102213747A (en) * | 2010-04-09 | 2011-10-12 | 深圳市比克电池有限公司 | Method for predicting cycle life of lithium ion battery |
| US8346495B2 (en) | 2010-04-22 | 2013-01-01 | Battelle Energy Alliance, Llc | Systems, methods and computer-readable media to model kinetic performance of rechargeable electrochemical devices |
| WO2011153057A1 (en) * | 2010-06-03 | 2011-12-08 | Battelle Energy Alliance, Llc | Systems, methods and computer readable media for modeling cell performance fade of rechargeable electrochemical devices |
| US8521497B2 (en) | 2010-06-03 | 2013-08-27 | Battelle Energy Alliance, Llc | Systems, methods and computer-readable media for modeling cell performance fade of rechargeable electrochemical devices |
| US20120299556A1 (en) * | 2010-06-18 | 2012-11-29 | Tomoyasu Ishikawa | Deterioration degree determining apparatus |
| EP2439551A1 (en) * | 2010-10-05 | 2012-04-11 | IPS Integrated Power Solutions AG | Method of determining battery status information |
| US20120096885A1 (en) * | 2010-10-25 | 2012-04-26 | Green Power Industrial Limited | Solar powered vehicle air-conditioning system |
| CN102479980A (en) * | 2010-11-30 | 2012-05-30 | 通用汽车环球科技运作有限责任公司 | Algorithm for determining capacity of battery while in service |
| CN102788957A (en) * | 2011-05-20 | 2012-11-21 | 镇江恒驰科技有限公司 | Estimating method of charge state of power battery |
| EP2530478A3 (en) * | 2011-06-03 | 2013-04-03 | GS Yuasa International Ltd. | Electric storage device, condition determination device, electrically chargeable device, and method of determining electric storage device condition |
| KR20120135075A (en) * | 2011-06-03 | 2012-12-12 | 가부시키가이샤 지에스 유아사 | State judging device, battery apparatus, state judging method |
| CN102809730A (en) * | 2011-06-03 | 2012-12-05 | 株式会社杰士汤浅国际 | Condition determination device, electric storage device, and condition determination method |
| KR101895619B1 (en) | 2011-06-03 | 2018-09-05 | 가부시키가이샤 지에스 유아사 | State judging device, battery apparatus, state judging method |
| US9018897B2 (en) | 2011-06-03 | 2015-04-28 | Gs Yuasa International Ltd. | Electric storage device condition determination device, electrically chargeable device, and method of determining electric storage device condition |
| FR2977678A1 (en) * | 2011-07-07 | 2013-01-11 | Commissariat Energie Atomique | Method for diagnosing battery, involves charging battery to reach predetermined maximum voltage for specific time in phase, and calculating state of health of battery from measured time and charging time |
| US9625532B2 (en) | 2011-10-10 | 2017-04-18 | Battelle Energy Alliance, Llc | Method, system, and computer-readable medium for determining performance characteristics of an object undergoing one or more arbitrary aging conditions |
| DE102012007126A1 (en) | 2012-04-07 | 2013-10-10 | Volkswagen Aktiengesellschaft | Method and system for controlling the charging process of an electrical energy storage device, in particular in a vehicle |
| WO2013149770A2 (en) | 2012-04-07 | 2013-10-10 | Volkswagen Aktiengesellschaft | Method and system for controlling the charging process of an electrical energy accumulator, particularly in a vehicle |
| US20150046109A1 (en) * | 2012-04-23 | 2015-02-12 | Hitachi, Ltd. | Battery system maintenance management system and method |
| US8988047B2 (en) * | 2012-08-30 | 2015-03-24 | General Electric Company | Method of charging an electrochemical cell |
| US20140062412A1 (en) * | 2012-08-30 | 2014-03-06 | General Electric Company | Method of charging an electrochemical cell |
| US10371757B2 (en) * | 2012-11-30 | 2019-08-06 | Gs Yuasa International Ltd. | Post-deterioration performance estimating apparatus and post-deterioration performance estimating method for energy storage device, and energy storage system |
| US20170123013A1 (en) * | 2012-11-30 | 2017-05-04 | Gs Yuasa International Ltd. | Post-deterioration performance estimating apparatus and post-deterioration performance estimating method for energy storage device, and energy storage system |
| US20140159643A1 (en) * | 2012-12-12 | 2014-06-12 | General Electric Company | Systems and Methods for Controlling Battery Charging |
| US9431846B2 (en) * | 2012-12-12 | 2016-08-30 | General Electric Company | Systems and methods for controlling battery charging |
| US9627920B2 (en) * | 2013-01-22 | 2017-04-18 | Samsung Sdi Co., Ltd. | Battery pack and charging method thereof |
| US20140203781A1 (en) * | 2013-01-22 | 2014-07-24 | Samsung Sdi Co., Ltd. | Battery pack and charging method thereof |
| CN105027382A (en) * | 2013-03-08 | 2015-11-04 | 德克萨斯仪器股份有限公司 | Battery charger |
| US10707689B2 (en) * | 2013-03-08 | 2020-07-07 | Texas Instruments Incorporated | Battery charger |
| US10044214B2 (en) * | 2013-03-08 | 2018-08-07 | Texas Instruments Incorporated | Battery charger |
| US20140253039A1 (en) * | 2013-03-08 | 2014-09-11 | Texas Instruments Incorporated | Battery charger |
| US20150002078A1 (en) * | 2013-06-26 | 2015-01-01 | Samsung Electronics Co., Ltd. | Control circuit for reducing charging time and method thereof |
| US9660475B2 (en) * | 2013-06-26 | 2017-05-23 | Samsung Electronics Co., Ltd. | Control circuit for reducing charging time and method thereof |
| CN103399276A (en) * | 2013-07-25 | 2013-11-20 | 哈尔滨工业大学 | Lithium-ion battery capacity estimation and residual cycling life prediction method |
| CN103439666A (en) * | 2013-09-02 | 2013-12-11 | 北京航空航天大学 | Geometric method for evaluating capacity recession of lithium ion battery |
| US10036781B2 (en) * | 2013-10-01 | 2018-07-31 | Centre National De La Recherche Scientifique | Method and apparatus for evaluating the state of health of a lithium battery |
| US20160245876A1 (en) * | 2013-10-01 | 2016-08-25 | Centre National De La Recherche Scientifique | Method and apparatus for evaluating the state of health of a lithium battery |
| WO2015049300A1 (en) | 2013-10-01 | 2015-04-09 | Centre National De La Recherche Scientifique | Method and apparatus for evaluating the state of health of a lithium battery |
| FR3011393A1 (en) * | 2013-10-01 | 2015-04-03 | Centre Nat Rech Scient | METHOD AND APPARATUS FOR EVALUATING THE HEALTH CONDITION OF A LITHIUM BATTERY |
| CN103560280A (en) * | 2013-10-11 | 2014-02-05 | 深圳华粤宝电池有限公司 | Chemical synthetic method of lithium ion battery |
| CN104698384A (en) * | 2013-12-05 | 2015-06-10 | 现代自动车株式会社 | Determining apparatus of battery deterioratiion for electric vehicle and method thereof |
| EP2889633A3 (en) * | 2013-12-05 | 2015-10-21 | Hyundai Motor Company | Battery deterioration determining apparatus for electric vehicle and method thereof |
| US9947971B2 (en) | 2014-02-17 | 2018-04-17 | Toyota Jidosha Kabushiki Kaisha | Battery system |
| US9791518B2 (en) * | 2014-02-19 | 2017-10-17 | Nissan Motor Co., Ltd. | Impedance measuring device and control method for impedance measuring device |
| US20160356858A1 (en) * | 2014-02-19 | 2016-12-08 | Nissan Motor Co., Ltd. | Impedance measuring device and control method for impedance measuring device |
| US9817075B2 (en) * | 2014-02-19 | 2017-11-14 | Nissan Motor Co., Ltd. | Impedance measuring device and control method for impedance measuring device |
| US20170045588A1 (en) * | 2014-02-19 | 2017-02-16 | Nissan Motor Co., Ltd. | Impedance measuring device and control method for impedance measuring device |
| CN103823188A (en) * | 2014-02-25 | 2014-05-28 | 宁德时代新能源科技有限公司 | Lithium-ion battery pack health state assessment method |
| WO2015128709A1 (en) * | 2014-02-27 | 2015-09-03 | Toyota Jidosha Kabushiki Kaisha | Vehicle charge control device |
| US20160355098A1 (en) * | 2014-02-27 | 2016-12-08 | Toyota Jidosha Kabushiki Kaisha | Vehicle charge control device |
| US10525834B2 (en) * | 2014-02-27 | 2020-01-07 | Toyota Jidosha Kabushiki Kaisha | Vehicle charge control device to correct a state of charge |
| CN106029434A (en) * | 2014-02-27 | 2016-10-12 | 丰田自动车株式会社 | Vehicle charge control device |
| US10086823B2 (en) * | 2014-04-09 | 2018-10-02 | Toyota Jidosha Kabushiki Kaisha | Vehicle on which traveling motor is mounted |
| US10557890B2 (en) | 2014-10-24 | 2020-02-11 | Texas Instruments Incorporated | Battery capacity monitor |
| US10209316B2 (en) * | 2014-10-24 | 2019-02-19 | Texas Instruments Incorporated | Dynamic rechargeable battery capacity monitor |
| US20160116544A1 (en) * | 2014-10-24 | 2016-04-28 | Texas Instruments Incorporated | Battery capacity monitor |
| CN106483462A (en) * | 2015-08-28 | 2017-03-08 | 炬芯(珠海)科技有限公司 | A kind of measuring method of battery charge and device |
| FR3041765A1 (en) * | 2015-09-25 | 2017-03-31 | Commissariat Energie Atomique | METHOD FOR ESTIMATING A HEALTH STATUS INDICATOR OF A LITHIUM BATTERY AND ASSOCIATED ESTIMATION DEVICE |
| WO2017050945A1 (en) * | 2015-09-25 | 2017-03-30 | Commissariat A L'energie Atomique Et Aux Energies Alternatives | Method for estimating an indicator of the state of health of a lithium battery and associated estimating device |
| CN105633472A (en) * | 2015-12-30 | 2016-06-01 | 山东精工电子科技有限公司 | Self-discharge rate consistency matching and screening method for lithium-ion battery |
| US20170227607A1 (en) * | 2016-02-04 | 2017-08-10 | Mediatek Inc. | Schemes capable of efficiently and accurately estimating and/or predicting available battery capacity and battery aging factor |
| US10942221B2 (en) | 2016-02-04 | 2021-03-09 | Mediatek Inc. | Method and apparatus capable of accurately estimating/determining power percentage of battery based on confidence levels determined from resultant information of multiple different fuel gauge operations and/or information of battery history, aging factor, sleep time, or battery temperature |
| US20170244255A1 (en) * | 2016-02-23 | 2017-08-24 | Dongguan Amperex Technology Limited | Method for charging a lithium ion battery |
| US10164456B2 (en) * | 2016-02-23 | 2018-12-25 | Dongguan Amperex Technology Limited | Method for charging a lithium ion battery |
| CN105896579A (en) * | 2016-04-26 | 2016-08-24 | 西南交通大学 | Charging pile planning method considering overvoltage caused by electric vehicle tripping due to voltage sag of distribution network |
| US10955482B2 (en) * | 2016-10-09 | 2021-03-23 | Goertek Technology Co., Ltd. | Method and device for acquiring battery power level and electronic device |
| FR3059106A1 (en) * | 2016-11-22 | 2018-05-25 | Commissariat A L'energie Atomique Et Aux Energies Alternatives | METHOD FOR DETERMINING THE HEALTH STATUS OF A BATTERY CELL |
| EP3324197A1 (en) * | 2016-11-22 | 2018-05-23 | Commissariat à l'Energie Atomique et aux Energies Alternatives | Method for determining the state of health of a battery cell |
| CN106384853A (en) * | 2016-11-24 | 2017-02-08 | 山东精工电子科技有限公司 | Lithium ion battery stepped formation and consistency screening method |
| CN108333516A (en) * | 2017-01-17 | 2018-07-27 | 盈正豫顺电子股份有限公司 | Battery state testing method and system |
| CN106772113A (en) * | 2017-03-29 | 2017-05-31 | 四川长虹电器股份有限公司 | A kind of method that degree of aging is judged based on accumulator voltage change |
| CN109425832A (en) * | 2017-08-31 | 2019-03-05 | 加百裕工业股份有限公司 | Using the lithium battery capacity check method of compensation calculation method |
| US11340305B2 (en) | 2018-02-09 | 2022-05-24 | Lg Energy Solution, Ltd. | Apparatus and method for estimating state of secondary battery |
| US10908223B2 (en) * | 2018-03-20 | 2021-02-02 | Kabushiki Kaisha Toshiba | Battery safety evaluation apparatus, battery safety evaluation method, non-transitory storage medium, control circuit, and power storage system |
| US11374424B2 (en) * | 2019-02-01 | 2022-06-28 | Sk Innovation Co., Ltd. | Battery management system |
| CN113646651A (en) * | 2019-03-18 | 2021-11-12 | 株式会社Lg新能源 | Battery management apparatus |
| US11527900B2 (en) * | 2019-04-18 | 2022-12-13 | Lg Display Co., Ltd. | Apparatus and method for managing a battery based on degradation determination |
| US11349327B2 (en) * | 2019-05-15 | 2022-05-31 | Sk Innovation Co., Ltd. | Apparatus and control method for battery management system |
| WO2021006860A1 (en) * | 2019-07-05 | 2021-01-14 | General Electric Company | Method and apparatus for estimating a state of health of a battery |
| US10957946B2 (en) | 2019-08-13 | 2021-03-23 | International Business Machines Corporation | Capacity degradation analysis for batteries |
| US11679676B2 (en) | 2019-08-30 | 2023-06-20 | Toyota Jidosha Kabushiki Kaisha | Display system and vehicle including the same, and method of showing state of secondary battery |
| US20220065938A1 (en) * | 2020-08-25 | 2022-03-03 | Audi Ag | Method for determining the capacity of li-ion cells with the aid of distinct points |
| CN114114014A (en) * | 2020-08-25 | 2022-03-01 | 奥迪股份公司 | Method for determining the capacity of a lithium ion battery by means of a salient point |
| US11714135B2 (en) * | 2020-08-25 | 2023-08-01 | Audi Ag | Method for determining the capacity of Li-ion cells with the aid of distinct points |
| CN111965555A (en) * | 2020-09-18 | 2020-11-20 | 重庆长安新能源汽车科技有限公司 | Parallel connection group screening method for single batteries |
| CN114325415A (en) * | 2021-12-31 | 2022-04-12 | 杭叉集团股份有限公司 | Method, device and medium for verifying electric quantity of lithium battery |
| CN117458010A (en) * | 2023-12-20 | 2024-01-26 | 超耐斯(深圳)新能源集团有限公司 | Lithium battery energy storage monitoring system based on data analysis |
| CN117452235A (en) * | 2023-12-22 | 2024-01-26 | 南昌大学 | Lithium ion battery electrolyte leakage early warning method and system |
Also Published As
| Publication number | Publication date |
|---|---|
| KR20030051458A (en) | 2003-06-25 |
| KR100414979B1 (en) | 2004-01-14 |
| KR20010091990A (en) | 2001-10-23 |
| KR20030051457A (en) | 2003-06-25 |
| TW510977B (en) | 2002-11-21 |
| KR100402309B1 (en) | 2003-10-22 |
| US6586940B2 (en) | 2003-07-01 |
| KR100440676B1 (en) | 2004-07-19 |
Similar Documents
| Publication | Publication Date | Title |
|---|---|---|
| US6586940B2 (en) | Capacity estimation method, degradation estimation method and degradation estimation apparatus for lithium-ion cells, and lithium-ion batteries | |
| JP4001708B2 (en) | Replacing the secondary battery | |
| EP2587621B1 (en) | Power storage unit control circuit and power storage apparatus | |
| US7928736B2 (en) | Method of estimating state of charge for battery and battery management system using the same | |
| US9411019B2 (en) | Method and system for estimating state of health of battery set | |
| US20130207592A1 (en) | Battery Charger and Battery Charge Method | |
| JP2003132955A (en) | Charging and discharging method of nonaqueous electrolyte secondary battery | |
| CN105759213A (en) | Method for measuring storage battery residual capacity SOC | |
| CN111175653A (en) | Method for identifying and prejudging capacity 'water-jumping' fault of ternary battery | |
| CN102122733A (en) | Battery management method and electronic device | |
| JP2003059544A5 (en) | ||
| JPH07107675A (en) | Method and apparatus for quick charging of secondary battery | |
| CN109143101A (en) | A kind of automobile storage battery status monitoring warning system and method | |
| JP3649652B2 (en) | Lithium ion battery capacity estimation method, deterioration determination device, and lithium ion battery pack | |
| JP3470098B2 (en) | Lithium ion battery capacity estimation method, deterioration judgment method, deterioration judgment device, and lithium ion battery pack having deterioration judgment function | |
| JP3370047B2 (en) | Lithium ion battery capacity estimation method, deterioration determination method, deterioration determination device, and lithium ion battery pack | |
| CN114158276A (en) | Method of detecting lithium plating and method and apparatus for managing battery by using the same | |
| JP3683753B2 (en) | Secondary battery automatic test method | |
| CN103051005A (en) | Battery charging and discharging management system and method | |
| JP3649643B2 (en) | Lithium-ion battery capacity estimation method | |
| US20230398902A1 (en) | Method for charging traction battery and battery management system | |
| JP3547686B2 (en) | Lithium ion battery capacity estimation method, deterioration determination method, deterioration determination device, and lithium ion battery pack | |
| WO2021150551A1 (en) | System and method for estimating battery state of health | |
| Pop et al. | State-of-the-art of battery state-of-charge determination | |
| WO2023159708A1 (en) | Control method for normally-electrically charged self-maintenance of battery, and normally-electrically charged self-maintenance battery |
Legal Events
| Date | Code | Title | Description |
|---|---|---|---|
| AS | Assignment |
Owner name: NIPPON TELEGRAPH AND TELEPHONE CORPORATION, JAPAN Free format text: ASSIGNMENT OF ASSIGNORS INTEREST;ASSIGNORS:ASAKURA, KAORU;HIRAI, TOSHIRO;REEL/FRAME:011615/0086 Effective date: 20010301 |
|
| FPAY | Fee payment |
Year of fee payment: 4 |
|
| FPAY | Fee payment |
Year of fee payment: 8 |
|
| REMI | Maintenance fee reminder mailed | ||
| LAPS | Lapse for failure to pay maintenance fees | ||
| STCH | Information on status: patent discontinuation |
Free format text: PATENT EXPIRED DUE TO NONPAYMENT OF MAINTENANCE FEES UNDER 37 CFR 1.362 |
|
| FP | Lapsed due to failure to pay maintenance fee |
Effective date: 20150701 |