US10963893B1 - Personalized decision tree based on in-store behavior analysis - Google Patents
Personalized decision tree based on in-store behavior analysis Download PDFInfo
- Publication number
- US10963893B1 US10963893B1 US15/051,629 US201615051629A US10963893B1 US 10963893 B1 US10963893 B1 US 10963893B1 US 201615051629 A US201615051629 A US 201615051629A US 10963893 B1 US10963893 B1 US 10963893B1
- Authority
- US
- United States
- Prior art keywords
- shopper
- decision
- data
- decision tree
- behavior
- Prior art date
- Legal status (The legal status is an assumption and is not a legal conclusion. Google has not performed a legal analysis and makes no representation as to the accuracy of the status listed.)
- Active, expires
Links
Images


Classifications
-
- G—PHYSICS
- G06—COMPUTING; CALCULATING OR COUNTING
- G06Q—INFORMATION AND COMMUNICATION TECHNOLOGY [ICT] SPECIALLY ADAPTED FOR ADMINISTRATIVE, COMMERCIAL, FINANCIAL, MANAGERIAL OR SUPERVISORY PURPOSES; SYSTEMS OR METHODS SPECIALLY ADAPTED FOR ADMINISTRATIVE, COMMERCIAL, FINANCIAL, MANAGERIAL OR SUPERVISORY PURPOSES, NOT OTHERWISE PROVIDED FOR
- G06Q30/00—Commerce
- G06Q30/02—Marketing; Price estimation or determination; Fundraising
- G06Q30/0201—Market modelling; Market analysis; Collecting market data
-
- G—PHYSICS
- G06—COMPUTING; CALCULATING OR COUNTING
- G06F—ELECTRIC DIGITAL DATA PROCESSING
- G06F18/00—Pattern recognition
- G06F18/20—Analysing
- G06F18/25—Fusion techniques
- G06F18/254—Fusion techniques of classification results, e.g. of results related to same input data
- G06F18/256—Fusion techniques of classification results, e.g. of results related to same input data of results relating to different input data, e.g. multimodal recognition
-
- G06K9/00342—
-
- G06K9/00718—
-
- G—PHYSICS
- G06—COMPUTING; CALCULATING OR COUNTING
- G06V—IMAGE OR VIDEO RECOGNITION OR UNDERSTANDING
- G06V10/00—Arrangements for image or video recognition or understanding
- G06V10/70—Arrangements for image or video recognition or understanding using pattern recognition or machine learning
- G06V10/77—Processing image or video features in feature spaces; using data integration or data reduction, e.g. principal component analysis [PCA] or independent component analysis [ICA] or self-organising maps [SOM]; Blind source separation
- G06V10/80—Fusion, i.e. combining data from various sources at the sensor level, preprocessing level, feature extraction level or classification level
- G06V10/809—Fusion, i.e. combining data from various sources at the sensor level, preprocessing level, feature extraction level or classification level of classification results, e.g. where the classifiers operate on the same input data
- G06V10/811—Fusion, i.e. combining data from various sources at the sensor level, preprocessing level, feature extraction level or classification level of classification results, e.g. where the classifiers operate on the same input data the classifiers operating on different input data, e.g. multi-modal recognition
-
- G—PHYSICS
- G06—COMPUTING; CALCULATING OR COUNTING
- G06V—IMAGE OR VIDEO RECOGNITION OR UNDERSTANDING
- G06V20/00—Scenes; Scene-specific elements
- G06V20/40—Scenes; Scene-specific elements in video content
- G06V20/41—Higher-level, semantic clustering, classification or understanding of video scenes, e.g. detection, labelling or Markovian modelling of sport events or news items
-
- G—PHYSICS
- G06—COMPUTING; CALCULATING OR COUNTING
- G06V—IMAGE OR VIDEO RECOGNITION OR UNDERSTANDING
- G06V20/00—Scenes; Scene-specific elements
- G06V20/50—Context or environment of the image
- G06V20/52—Surveillance or monitoring of activities, e.g. for recognising suspicious objects
-
- G—PHYSICS
- G06—COMPUTING; CALCULATING OR COUNTING
- G06V—IMAGE OR VIDEO RECOGNITION OR UNDERSTANDING
- G06V40/00—Recognition of biometric, human-related or animal-related patterns in image or video data
- G06V40/20—Movements or behaviour, e.g. gesture recognition
-
- G—PHYSICS
- G06—COMPUTING; CALCULATING OR COUNTING
- G06V—IMAGE OR VIDEO RECOGNITION OR UNDERSTANDING
- G06V40/00—Recognition of biometric, human-related or animal-related patterns in image or video data
- G06V40/20—Movements or behaviour, e.g. gesture recognition
- G06V40/23—Recognition of whole body movements, e.g. for sport training
-
- G—PHYSICS
- G06—COMPUTING; CALCULATING OR COUNTING
- G06V—IMAGE OR VIDEO RECOGNITION OR UNDERSTANDING
- G06V20/00—Scenes; Scene-specific elements
- G06V20/40—Scenes; Scene-specific elements in video content
- G06V20/44—Event detection
Definitions
- the present invention is a method and system for determining the hierarchical purchase decision process (consumer decision trees) of an individual shopper in front of a product category (a set of products that meet the same need of the shopper), which is organized in a coordinate system either as brand or product attribute blocks, in a particular retail store and across many retail stores in a geographic area, wherein shopping consideration and the decision path of the shopper is obtained by combining behavioral data with the category layout and transactional data.
- a product category a set of products that meet the same need of the shopper
- CDT consumer decision trees
- a method and system for generating a personalized decision tree based on in-store shopper behavior analysis utilizing a plurality of sensors, and using at least a processor for the analysis comprising the steps of capturing a plurality of input images of a shopper at a retail location using a plurality of cameras, capturing a data stream from a mobile device carried by the shopper using at least a mobile signal sensor, tracking the shopper's movements through the retail location using the plurality of input images, the data stream, and a Shopper Behavior Tracker module, analyzing the behavior of the shopper using the plurality of input images, measuring decision activities of the shopper in the retail location tied to a product category based on the behavior analysis, and populating a cross-channel shopper database with a set of shopper profile data created by accumulating the decision activities of the shopper, wherein the accumulation of decision activities occurs during a plurality of shopping trips by the shopper, wherein the plurality of shopping trips by the shopper occur at a single retail
- presented is a method and system for determining the hierarchical purchase decision process (personalized decision trees) of a shopper in front of a product category (a set of products that meet the same need of shoppers) over time, which is organized in a coordinate system either as brand or product attribute blocks, in a retail store or across multiple retail stores (cross-channel).
- a product category a set of products that meet the same need of shoppers
- cross-channel a retail store or across multiple retail stores
- the hierarchical decision process is determined based on observed actual in-store purchase behavior using a set of video cameras, wireless sensors, and processor-implemented instructions for extracting the sequence and timing of each of the shopper's decision processes (multi-sensor analysis).
- the cameras can include both top-down video cameras, as well as cameras positioned at the shelf, to capture the decision process, including gaze analysis and eye tracking.
- semi-automated data annotation approaches can also be utilized to determine the sequence, timing, and shopper's point of focus in the coordinate system.
- the hierarchical decision process of a shopper in front of a category can be determined, based on spatiotemporal information using the multi-sensor analytics technology. This aggregated shopper behavior data can be combined with transaction data to provide a holistic picture of the purchase decision process.
- the hierarchical decision process obtained by clustering of shopper behavior data over time, can not only identify the sequence or order of the decisions but can also quantify the volume of shopping trips at each level in the decision process, thus determining the relative importance of each product group.
- the frequency of cross-comparisons between product groups can not only help to determine the category structure, but can also provide a deeper understanding of product distinction and substitutability between a set of products.
- the decisions of a shopper for each product group can be captured very clearly down to the product attribute level. Such in-depth understanding can provide an accurate picture of the relative importance of each product attribute, such as flavor, size, retail channel, and price, in the purchase decision process.
- the exemplary embodiment can also quantify the amount of time spent by a shopper for making each decision, thereby determining the relative importance or the complexity. Combining this information with the hierarchical decision process, retailers and manufacturers can evaluate whether or not the coordinate layout of the category matches the needs and the decision process of shoppers.
- the exemplary embodiment can provide further granularity by determining the hierarchical decision process of shoppers, in aggregate, by demographic groups—gender, age-range, and ethnicity—as well as by need states and occasions. Such granular understanding of the decision process for each shopper segment will help both retailers and manufacturers to customize the category layout for their key segment(s), thereby providing a more convenient and enjoyable shopping experience.
- the embodiment can capture a plurality of input images of a shopper by at least a camera in a store area.
- the plurality of input images can be processed in order to analyze the behavior of the shopper with regard to the decision activity of the shopper, over time (i.e., multiple shopping trips), tied to the category based on the behavior analysis.
- a plurality of datasets can be constructed by accumulating the decision activities over time, at the same retail location or multiple locations in a geographic area. The decision is measured based on the actual purchase behavior of the shopper, like interaction with the products and travel paths to categories, as opposed to using intercepts or panels to develop them.
- the embodiment it is an objective of the embodiment to use an automatic behavior measurement, including shopping paths and interaction with the products, to observe the decision processes and construct the decision trees of a shopper, without involving the shopper's participation and obtrusive interception. Therefore, the gathered data can reflect the true state of the shopper's actual decision made at the point of purchase.
- the embodiment can objectively capture purchase behavior from a large volume of shopping trips without intruding on the shopper's decision process, thus the gathered data is unbiased.
- the decision behavior can be an observable behavior by automatic multi-sensor analysis.
- the exhibited behavior such as the shopping path, browsing activity for a product, or interaction with a product
- the decision tree can be calculated to identify the hierarchical decision process. Based on the observed path of the shopper (trajectory) and the associated product data in the space of travel, it can be known what the person did vs. did not do.
- the observable behaviors can also be associated with the sales data of the products that are located where the shopper's behaviors are measured. Examples of the observable behaviors can include time of interaction, pre-interaction (like prior location of visit), exposure to the product display and attributes, and sensory activity behavior to make decisions.
- a semi-automated method to compute the decision tree to identify behaviors that cannot be automatically observed by the technology or to identify granular details of shopper interaction with the product, like comparing brands may be integrated.
- This semi-automated method can complement other data sources, like in-store intercepts, planograms, and point-of-sale data.
- this semi-automated method is not the preferred embodiment of the present invention, and it is another objective to use the semi-automated method only as a complementary method to the automated method in the preferred embodiment of the present invention.
- the personalized decision tree can be used to provide targeted messaging to shoppers based on the results of each shopper's calculated decision tree.
- the personalization of advertising, promotions, and other messaging can greatly enhance the value of the messages delivered since they can be customized for each individual shopper's behavior, previous purchases, channel choices, and decision process.
- the messaging can be delivered via mobile device, digital or printed signage, at the Point of Sale, or other means of message delivery.
- FIG. 1 shows an exemplary application of an embodiment in a store area.
- FIG. 2 shows an illustration representing a shopper visiting multiple stores in a geographic area.
- FIG. 3 shows an example block flow diagram illustrating an overview of the cross-channel shopper behavior tracker system for generation of the Personalized Decision Tree.
- FIG. 4 show a more detailed block flow diagram for a single retail location.
- FIG. 5 shows the data components that can comprise the Shopper Profile Data.
- FIG. 6 shows three exemplary sources of data that can be integrated together to provide a holistic picture of the shopper's decision process.
- FIG. 7 shows an example block flow diagram illustrating the personalized decision tree system with a detailed illustration of the Shopper Behavior Tracker module for a single retail location.
- FIG. 8 shows an example of a sparse camera deployment.
- FIG. 9 shows an example block flow diagram of the At-Door Shopper Detector module.
- FIG. 10 shows an example block flow diagram of the Shopper Demographics Estimator module.
- FIG. 11 shows an example block flow diagram of the Vision Tracker module.
- FIG. 12 shows an example block flow diagram of the In-Store Shopper Re-identifier module.
- FIG. 13 shows an example block flow diagram of the Mobile Tracker module.
- FIG. 14A-C show an example of person tracking and the resulting vision and Wi-Fi trajectories.
- FIG. 15 shows an example block flow diagram of the Multi-Modal Trajectory Fusion module.
- FIG. 16A-D show an example of the multi-modal trajectory fusion process for vision and Wi-Fi trajectories.
- FIG. 17 shows an example block flow diagram of the Shopper Data Association module.
- FIG. 18 shows an example block flow diagram of the Trajectory-Transaction Data Association module.
- FIG. 19 shows a preferred embodiment of a method to associate transaction log data with a fused trajectory.
- FIG. 20 shows an example block flow diagram of the Revisiting and Cross-visiting Shopper Identifier module.
- FIG. 21 shows exemplary processes for the measurement of a shopper's decisions with regard to product categories, in which computer vision-based behavior analysis and segmentation measurement are associated.
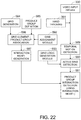
- FIG. 22 shows an exemplary setup phase and interaction detection process for the subcategories in a category, where the subcategories are defined at the product group level.
- FIG. 23 shows an exemplary view from a top-down camera, where the shopper's movements through a store area are observed based on the tracking information.
- FIG. 24 shows an exemplary application of spatiotemporal criteria that can be used to differentiate between a premeditated purchase and an impulse purchase.
- FIG. 25 shows an exemplary grid structure.
- FIG. 26 shows exemplary interaction and purchase detection based on the grid structure.
- FIG. 27 shows an exemplary planogram data of an aisle and a shopping track with regard to the process of developing a decision tree.
- FIG. 28 shows an exemplary process of segmentation based on purchasing behavior.
- FIG. 29A-B shows a part of an exemplary decision tree and process of segmentation based on shopping and purchasing behavior.
- FIG. 30 shows another exemplary decision tree and process of segmentation based on shopping behavior.
- FIG. 31 shows another exemplary decision tree and process of segmentation in consideration of brands.
- FIG. 32 shows exemplary processes in generating a decision tree based on category correlation.
- FIG. 33 shows exemplary categories and the process of detecting the stopping sequences of shoppers in relation to the predefined categories.
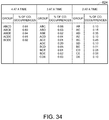
- FIG. 34 shows an exemplary table for correlated stopping sequences of a shopper based on co-occurrences.
- FIG. 35 shows an exemplary table for the ranked group of categories based on the correlation.
- FIG. 36 shows an exemplary decision tree that was constructed after applying a threshold to the correlations of a group of categories.
- FIG. 37 shows an exemplary grouping of paths in a decision tree.
- FIG. 38 shows an exemplary scheme of dominant path calculation and a level of decision steps calculation.
- FIG. 39 shows an exemplary scheme of matching a planogram with decision trees.
- FIG. 40 shows an exemplary scheme for the decision tree merge process.
- FIG. 41 shows an exemplary network of a plurality of means for control and processing, a plurality of APs, and a plurality of cameras that can used to build a consumer decision tree.
- FIG. 42 shows an example computing device illustration.
- FIG. 1 shows an exemplary application of an embodiment of the present invention in a store area.
- the personalized decision tree provides a clear understanding of the decision process of an individual shopper, over time, in front of a product category, thus helping to identify opportunities for improving the shopping experience and increasing the number of purchases by that shopper for the category and store.
- the exemplary embodiment overcomes the limitations of the conventional approaches by unobtrusively capturing the actual purchase behavior of a shopper over a large number of visits, in front of the category, providing objectivity and precision not achievable through other data collection methods.
- the hierarchical purchase decision process (personalized decision trees) of shoppers in front of a product category (a set of products that meet the same need of consumers) in a retail store (or set of stores in a geographic area), over time, can be determined.
- the product category can be organized in a coordinate system either as brand or as product attribute blocks.
- Shopping consideration and the decision path of the shopper can be obtained by combining behavioral data with the category layout and transactional data.
- the hierarchical decision process can be determined based on observed actual in-store purchase behavior, i.e., in-store observation of shopper behavior, using a set of video cameras 102 and 104 A-D, wireless sensors 106 A-C, and computational processing for extracting the sequence and timing of the shopper's decision process.
- the embodiment can include the usage of both top-down video cameras 104 A-D, as well as cameras positioned at the shelf 102 , to capture the decision process, including gaze analysis and eye tracking 395 .
- the embodiment can capture a plurality of input images of the shopper by at least a camera 102 or 104 A-D in the vicinity of the product category.
- the cameras can comprise digital or analog cameras, covering the area of interest in the vicinity of the product category.
- the input images can be automatically analyzed in order to determine the behavior patterns and demographics of the shopper with regard to the decision activity.
- a plurality of datasets can be constructed by accumulating the decision activities of the shopper over multiple trips to the same retail location, or across shopping trips to multiple retail locations.
- the decision can be analyzed based on the actual purchase behavior of the shopper, like interaction with the products and travel paths to categories, as opposed to using in-store intercepts or household panels to develop them.
- an automatic behavior measurement can be used, including shopping paths and interaction with the products, to observe the decision processes and construct the decision trees of the shopper, without shopper participation and obtrusive interception. Therefore, the gathered data can reflect the actual behavior of the shopper at the point of purchase. A large amount of statistical data can be objectively captured over multiple shopping trips and at multiple retail locations, thus the gathered data is unbiased.
- the decision behavior can be an observable behavior by automatic multi-sensor analysis.
- the exhibited behavior such as the shopping path, browsing activity for a product, or interaction with a product
- the decision tree can be calculated to identify the hierarchical decision process. Based on the observed path of the shopper and the associated product data in the space of travel, it can be known what the person did vs. did not do.
- the observable behaviors can also be associated with the sales data for the products at the location where the shopper's behaviors are measured. Other examples of observable behaviors can include time of interaction, pre-interaction (like prior location of visit), exposure to the product display and attributes, and sensory activity behavior to make decisions. Further, the shopper's choice of retail location (retail channel) can also be recorded as an observable behavior.
- a semi-automated method can be integrated to compute the decision tree to identify behaviors that cannot be automatically observed by the technology or to identify granular details of shopper interaction with the product, like comparing brands.
- This semi-automated method can complement other data sources like in-store intercepts, planograms, and point of sale data.
- the semi-automated method can also comprise a method to construct parts of a decision tree that cannot be visually or automatically observed.
- the semi-automated data annotation approaches can be utilized to determine the sequence, timing, and shopper's point of focus in the coordinate system.
- the system can determine the hierarchical decision process of the shopper in front of a category based on spatiotemporal information using the multi-sensor analytics technology. This aggregated shopper behavior data will be combined with transactional data to provide a holistic picture of the purchase decision process in the store, and across multiple retail locations.
- the hierarchical decision process which can be obtained by the clustering of shopper behavior data over time, can not only identify the sequence or order of the decision, but also can quantify the volume of shopping trips at each level in the decision process, and thus can determine the relative importance of each product group. Further, since channel information can also be tracked (i.e., tracking shopper behavior across multiple retail locations in a geographic area), the relative importance of each shopping channel can also be determined.
- the decisions of the shopper for each product group can be captured very clearly, down to the product attribute level.
- Such in-depth understanding can provide an accurate picture of the relative importance of each product attribute, such as flavor, size, and price, in the purchase decision process.
- the attributes comprise brand, product type, size, flavor, price, and retail channel.
- the sequence, timing, and the area of focus can be associated on the coordinate system to arrive at the hierarchical decision process. For example, if the category in the coordinate system is organized by a product attribute, such as flavor, the attributes can be mapped with the behavior, using the spatiotemporal information and the percentage of trips where the shopper first looked at flavor and then started comparing brands with the flavor attribute within the category, thus providing a measurement.
- the results of the calculated personalized decision tree can be used to provide targeted messaging to shoppers based on the results of each shopper's calculated decision tree.
- the personalization of advertising, promotions, and other messaging can greatly enhance the value of the messages delivered since they can be customized for each individual shopper's behavior, previous purchases, channel choices, and decision process.
- the messaging can be delivered via a mobile device carried by the shopper 108 , digital or printed signage, at the Point of Sale, or other means of message delivery.
- An exemplary embodiment can also quantify the amount of time spent by the shopper for making each decision, thereby determining the relative importance or the complexity among the shopping decisions. Combining this information with the hierarchical decision process, retailers and manufacturers can evaluate whether or not the coordinate layout of the category matches the needs and the decision process of the shopper.
- an exemplary embodiment can provide further granularity by determining the hierarchical decision process of the shoppers by demographic groups as well as by need states and occasions.
- the attributes for the demographic groups comprise gender, age range, and ethnicity.
- Such granular understanding of the decision process for each shopper segment can help both retailers and manufacturers to customize the category layout for their key segment(s), thereby providing a more convenient and enjoyable shopping experience.
- FIG. 2 shows an exemplary illustration of a shopper 202 who visits multiple retail locations 204 A-E in a geographic area 200 .
- the geographic area can be a town, city, region, county, statistical area, or reflect a wider area such as a metropolis, multi-city, state, or multi-state area.
- the preferred embodiment can track the shopper's behavior as she visits one or many of the locations, and with the aggregated results of the shopping trips contributing to the determination of the personalized decision tree.
- FIG. 3 provides an overview of an exemplary embodiment of the multi-channel shopper behavior tracker system.
- the Shopper Behavior Trackers for each retail location 304 , 305 , and 306 can track a shopper from the moment they enter the store to the time they exit. They can identify visual features and estimate demographic information for the shopper, track the shopper's trajectory throughout the store, and associate all of that data with Point of Sale information. This single-channel tracking can be done for multiple retail locations in a geographic area, or across many areas, as illustrated by the presence of n Shopper Behavior Trackers, with n being the number of retail locations where shoppers are tracked by the system. Data created by Shopper Behavior Trackers at each location can be aggregated in the Cross-channel Shopper DB 280 and used for the determination of the personalized decision tree 282 .
- FIG. 4 provides a more detailed view of the types of data that can be processed by the Shopper Behavior Tracker 306 module, as illustrated for a single retail location.
- the Shopper Behavior Tracker 306 module can create and collect data from three sources: In-store Behavior Data 604 , Store Layout & Category Planogram data 605 , and Point-of-Sales Data 606 .
- the data for a particular shopping trip at a particular retail location can be stored in the In-Store Shopper DB 220 .
- Data for the shopper across multiple trips and/or retail locations can be stored in the Cross-channel Shopper DB 280 , and processed by the personalized decision tree 282 .
- FIG. 5 illustrates the Shopper Profile Data (SPD) 300 that can consist of a set of different types of information we collect and analyze from the shopper to enable the tracking of shopper behavior across multiple channels.
- the SPD can further comprise three classes of data: Shopper ID Vector (SIV) 301 , Shopper Segment Data (SSD) 302 , and Shopper Behavior Dataset (SBD) 303 .
- SIV Shopper ID Vector
- SSD Shopper Segment Data
- SBD Shopper Behavior Dataset
- the Shopper ID Vector (SIV) 301 can refer to as a set of unique features that allow us to recognize a shopper among others. That includes a set of features that are unique over either long-term or short-term.
- the features of a shopper that are unique for a long-term basis can include the face features and the MAC address of the radios of the mobile devices that the shopper carries.
- Such long-term unique features can be referred to as the Global ID Vector.
- the features that are unique only for a short-term basis i.e., unique only during a single trip to a particular store
- Such short-term unique features can be referred to as the Local ID Vector.
- the Shopper Segment Data (SSD) 302 can be referred to as a set of features that can characterize a shopper so as to allow the shopper to be classified into a segment in the population.
- the SSD can be further bifurcated into the physical and behavioral segment data.
- the physical segment data can be extracted based on the physical characteristics of a shopper, including height, obesity, and demographics such as gender, age, and ethnicity.
- the behavioral segment data can describe a shopper's preference, tendency, and style in shopping, including brand loyalty, organic food preference, etc.
- the behavioral segment data is supposed to be derived from a set of measurements about the shopper, which is collected in the Shopper Behavior Dataset.
- the SSD is where the personalized decision tree for the shopper can exist.
- the Shopper Behavior Dataset (SBD) 303 can be a storage of all raw measurements and low-level metrics for a shopper.
- the low-level metrics which can be called Shopper Metrics, can include per-week and per-month frequency of shopping visits to a store or to all stores, per-category and per-store time spent, per-category and per-store money spent, etc.
- the raw measurements for a shopper can be collected as a list of TripVector, where a TripVector of a shopper can be a collection of physical and contextual attributes of a shopper's single trip to a store and the Point-of-Sale (PoS) data.
- TripVector Point-of-Sale
- the physical attributes can describe the shopper's physical states, consisting of (1) a trajectory of a shopper, described by a tuple (t, x, y) and (2) the physical states of the shopper including gesture, head orientation, mobile device usage mode, etc.
- the contextual attributes can describe any interactions made between a shopper and the surrounding marketing elements of a store such as displays and items, for example, visual attention, physical contact, and more high-level various shopping actions including comparing products, reading labels, waiting in a line, etc.
- PoS data can include items purchased during the trip to the store.
- the TripVector can also include identification of the particular retail location where the visit occurs.
- FIG. 6 shows the conceptual integration of three exemplary data sources.
- data from multiple sources can be combined.
- the data sources can comprise data from the proprietary measurement platform, such as in-store behavior data 604 , detailed information of the store layout and category planogram 605 , and transaction (Point-of-Sale) data 606 .
- a goal of utilizing multiple data sources can be to provide a holistic view of the hierarchical decision process the shopper in a category. This consolidated view can provide a clear understanding of the shopping consideration and the decision path of the shopper.
- the key is to primarily utilize the data from the actual observation of physical interaction.
- In-store behavior data 604 from the platform can include identifying the types of interaction with the products, their shopping sequence, and the amount of time spent making a decision. In an embodiment, when aggregated across multiple shoppers, these metrics can be broken down by demographic groups—gender, age range, and ethnicity—to provide a clear understanding of the similarities and differences in the decision-making process of various shopper segments.
- the platform can capture the actual shopping behavior in a store by a predefined resolution, for example, 1 foot resolution, in images of 15 frames per second.
- the data for the store layout and category planogram 605 can include a detailed store map showing fixture layout, aisles, displays, etc. The category layout can be based on the way the products are placed on the store shelves.
- the Point-of-Sale (POS) Data 606 can include transaction data by baskets and by time period.
- FIG. 7 provides a more detailed view of shopper tracking using the Shopper Behavior Tracker 306 module, in the context of the system, as illustrated for a single example retail location.
- the At-Door Shopper Detector 210 utilizing the Visual Feature Extractor 211 and Shopper Demographics Estimator 212 modules
- the module can detect the face of the shopper as well as other body features.
- the detected face features can then be used to estimate demographics information about the shopper such as gender, age, and ethnicity. This data can then be added to the shopper profile data and stored in the In-Store Shopper DB 220 .
- the Multi-modal Shopper Tracker 230 (utilizing the Vision Tracker 231 and Mobile Tracker 232 ) can also detect and track the shopper from the time the store is entered and as the shopper travels the store.
- the Vision Tracker 231 and Mobile Tracker 232 can use vision and mobile data, respectively, to produce shopper trajectories that represent the shopper's entire trip through the store.
- the Vision Tracker 231 can provide an accurate track as the shopper moves through a location, however, a number of issues (such as background clutter and non-overlapping camera coverage) can cause discontinuities in the trajectory.
- the discontinuities can be rectified algorithmically (for example, by re-identifying a shopper with shopper profile data already existing in the database) and augmented using mobile data.
- the Mobile Tracker 232 can isolate individual mobile device tracks using the unique MAC address of each tracked device, and use methods such as translateration to localize the device. While localization accuracy can be limited using the wireless modality, the track is persistent. Data from each modality can be stored separately as shopper profile data in the In-store Shopper DB 220 .
- the Multi-modal Shopper Data Associator 248 can use data from the In-store Shopper DB 220 and the Point-of-Sale (PoS) DB 250 to fuse shopper trajectories collected via multiple sensing modalities (utilizing the Multi-modal Trajectory Fusion 249 module), can associate the appropriate shopper data (utilizing the Shopper Data Association 242 module), and can perform Trajectory-Transaction Data Association 243 .
- the Multi-modal Trajectory Fusion 249 module can fuse associated trajectories from each tracking modality to generate a more accurate and continuous track. Remaining discontinuities can then be interpolated, and the resulting track stored as shopper profile data in the In-Store Shopper DB 220 .
- the Shopper Data Association 242 module can then merge the fused trajectory with face and body feature data as well as demographics data obtained by the At-Door Shopper Detector 210 process. This associated data can form new shopper profile data that can be stored in the In-Store Shopper DB 220 .
- the Trajectory-Transaction Data Association 243 module can then associate the new shopper profile data with transaction (also called Point of Sale or PoS) data from the PoS DB 250 . So, while the trajectory can indicate where the shopper has traveled through a store, the association with transaction data can indicate what items were actually purchased during the trip.
- transaction also called Point of Sale or PoS
- a personalized decision tree can be dependent on the population of the Cross-channel Shopper DB 280 with shopper profile data that is aggregated for the shopper over time (i.e., multiple shopping trips, at the same retail location or multiple locations).
- the Revisiting and Cross-visiting Shopper Identifier 260 can then be used to analyze an instance of shopper profile data to identify whether the shopper has visited the same (revisit) or any other retail location (cross-visit) previously. If the shopper has visited one of the n retail locations before, then records for that shopper can be updated in the Cross-channel Shopper DB 280 .
- a new shopper can have new shopper profile data created in the Cross-channel Shopper DB 280 .
- FIG. 8 shows a sparse configuration camera deployment.
- cameras 401 A-F can capture non-overlapping portions of the retail store, and other cameras can be installed around the entrance and exit 402 A-B and 403 A-B.
- the cameras 401 A-F, 402 A-B, and 403 A-B can be configured to capture a constant stream of images. Any of the cameras can also be positioned and/or configured for both top-down observation of shoppers or at shelf level.
- FIG. 9 shows an example of the At-Door Shopper Detector 210 .
- the Person Tracker 510 module can search the image to find and track any person using a single or combined features like Histogram of Oriented Gradient (HOG), color histogram, moving blobs, etc.
- HOG Histogram of Oriented Gradient
- the Face Detector 523 module can search to find a human face. The detection of a face can imply there is shopper present.
- the shopper's shopper profile data can be created in the In-store Shopper DB 220 .
- SPD- 1 shopper profile data created can be labeled as SPD- 1 since there are multiple modules that can create a shopper profile data. To distinguish such different shopper profile data, they can be labeled with different numbers.
- the detected face can then be added to the corresponding SPD- 1 as a part of the Global ID Vector whether or not the SPD- 1 is just created or already exists.
- the Body Feature Extractor 521 can also estimate the area of the shopper's upper and lower body using the Shopper Shape Predictor 522 based on the detected face location as a part of the Visual Feature Extractor 211 . Then the Body Feature Extractor 521 can extract the body features of the shopper from the estimated shopper body area in the input image. The extracted body features can be added to the corresponding SPD- 1 as a part of the Local ID Vector.
- the Shopper Demographics Estimator 212 can estimate the gender, age group, and ethnicity of the shopper based on the multiple faces and return back the estimation results with corresponding confidence level. The details of the Shopper Demographics Estimator 212 module will be further elaborated in the following section.
- the estimated demographics results can be updated into the physical segment data in the corresponding SPD- 1 , stored in the In-store Shopper DB 220 .
- FIG. 10 shows an example block flow diagram for the Shopper Demographics Estimator 212 .
- the Shopper Demographics Estimator 212 can result in three labels of demographics in terms of gender, age group, and ethnicity. For each label, it can have its own confidence value indicating how accurate the label output is.
- the Shopper Demographics Estimator 212 can have a major role to estimate the class label with a confidence value. This value can be used for aggregating the estimate of multiple face images with the same shopper ID by, for example, the weighted voting scheme.
- the Shopper Demographics Estimator 212 can consist of three processes: Face Normalization 611 , Feature Extraction 612 , and classification in association with each demographics category such as gender (via the Gender Classifier 614 ), age group (via the Age Group Classifier 616 ), and ethnicity (via the Ethnicity Classifier 618 ). Exemplary details of each process is described as follows.
- the Face Normalization 611 can be a process for normalizing the scale and rotation of a facial image to the fixed size and frontal angle. Like a preprocessor, this step can be necessary to associate an input image to the classifier model which is pre-trained with a fixed size and angle.
- the scale and rotation parameters can be estimated by Neural Network which is trained from various poses and scales generated offline.
- a proper feature such as gray-scaled intensity vector, color histogram, or local binary pattern, can be extracted from the normalized face using the Feature Extraction 612 module.
- the extracted feature can be given for an input of each demographics classifiers.
- classification for each category can be done by help of the pre-trained model (utilizing the Trained Gender Model 613 , Trained Age Group Model 615 , and Trained Race Model 617 ) such as the Support Vector Machine which can provide the optimal decision boundary in the feature space.
- the final decision can be determined based on a confidence value that is computed on the closeness to the decision boundary in the feature space. Likewise, the confidence value can be decreased as the input is getting closer to the decision boundary.
- the weighted voting can be straightforwardly applied to determine the final demographics labels.
- the output of the Shopper Demographics Estimator 212 can be saved in the In-Store Shopper DB 220 as updated shopper profile data (SPD- 1 ).
- a face fusion-based approach may be employed before determining the final demographics label, which fuses multiple faces into a single representative face by, for example, averaging the faces.
- FIG. 11 shows an exemplary embodiment for the vision-based tracking 231 method.
- the image stream 700 from deployed cameras 104 A-D can be given to the Object Detector 711 module.
- the Object Detector 711 can then detect any blobs that constitute foreground activity and can create a list of foreground blobs.
- An embodiment of the object detector could be using a background subtraction algorithm.
- the Shopper Tracker 712 can update the list of the existing shopper tracks (which includes time and estimated locations of the shoppers) for the new image frame.
- each tracker for an existing shopper can make a prediction on the shopper location for the new image frame.
- the Shopper Shape Predictor 713 can first predict the shape of the shopper based on the predicted shopper location and the pre-learned camera calibration parameters.
- the camera calibration parameters can be used to back-project the shopper shape onto the camera image plane.
- a search window around the predicted shopper shape can be defined, and the location of the target in the search window can be determined by finding the best matching regions to the existing target feature.
- a mean-shift tracker with HSV-based color histogram can be used to find the precise location of the updated target.
- the new target location can be used to update the target states of the tracker and thus to update the corresponding shopper profile data (SPD- 2 ) in the In-store Shopper DB 220 .
- Any blob detected in the Object Detector 711 that overlaps with the updated target tracks can be considered existing target activity and excluded from considering newly detected targets. For any remaining blob, it can run the Person Detector 714 to confirm the newly detected blob is a shopper blob.
- the Shopper Shape Predictor 715 can be used to generate a predicted shopper shape on the camera image plane at the blob location on the image using the pre-learned camera calibration parameters. A potential shopper around the detected blob can be found using the predicted shopper shape mask.
- the body features of the found shopper region can then be extracted based on the predicted shopper shape on the camera image plane and can be determined using a classifier if the blob is a human blob. If so, then a new shopper profile data can be created.
- the cameras may collaborate together to fuse the measurements about the same shopper from different cameras by exchanging the measurements, including the location and the extracted visual features.
- Such collaborative multi-camera tracking could generate a single and merged trajectory for a shopper over the multiple cameras with the same shopper profile data (SPD- 2 ). This can be made possible by using the pre-learned camera calibration information that enables the back-projection of the same physical points onto different cameras.
- the shopper tracking information estimated from a camera can be handed over to the tracker that runs on another camera's images (e.g., a cluster head camera).
- a trajectory fusion-based multi-camera tracking approach may be employed, which combines multiple trajectories about the same shopper that is created individually from different cameras.
- the In-store Shopper Re-identifier 716 then can compare the newly created shopper profile data (SPD- 2 ) with the existing shopper profile data (SPD- 2 ) stored in the In-store Shopper DB 220 to see if there is any existing shopper profile data (SPD- 2 ) that has the matching body features. If the newly created shopper profile data (SPD- 2 ) matches existing shopper profile data (SPD- 2 ), then it can retrieve the existing shopper profile data from the In-store Shopper DB 220 .
- the newly created shopper profile data (SPD- 2 ) does not match to any existing shopper profile data (SPD- 2 ), it can create a new shopper profile data (SPD- 2 ) in the In-store Shopper DB 220 and also can instantiate a new target tracking instance in the Shopper Tracker 712 .
- FIG. 12 shows a diagram of the In-store Shopper Re-identifier 716 .
- the In-store Shopper Re-identifier 716 can search for a matching shopper profile data from the In-store Shopper DB 220 . Identifying the corresponding shopper profile data from the In-store Shopper DB 220 can be carried out by the Shopper Recognizer 801 using a classification algorithm.
- An embodiment of the Shopper Recognizer 801 can include the visual feature representation of the human blob and classification algorithm. The visual features should be invariant to the variations in the appearance and motion of the targets in different view in order to handle the case of random target movement and pose change.
- Such visual features can include color histogram, edges, textures, interest point descriptors, and image patches.
- Classification algorithms can include support vector machine (SVM), cascade classifier, deep-learning based neural networks, etc. If an existing shopper profile data is found, then it can be retrieved from the In-store Shopper DB 220 , and merged with the new shopper profile data using the Shopper Profile Merger 803 . If there is no matching shopper profile data, then a new temporary shopper profile data (SPD- 2 ) can be created by the Shopper Profile Creator 802 , and stored in the In-store Shopper DB 220 .
- SPD- 2 temporary shopper profile data
- FIG. 1 shows an exemplary embodiment for Wi-Fi sensor deployment.
- a set of Wi-Fi signal sensors 106 A-C which will also be referred to as access points or simply APs, can be deployed in an area of interest where the sensing range of the set of APs 106 A-C can cover the area with a certain sensing density p, where the sensing density p is defined as the level of overlap of the sensing range of the APs 106 A-C of the area. If an area is covered by APs 106 A-C with a density p, then it can mean that any point in the area is covered by at least p number of APs at any time.
- the value of p can be determined differently depending on the employed algorithms and environments. For example, for trilateration based Wi-Fi device localization schemes, p could be at least three while for triangulation based ones, p could be at least two. In a preferred embodiment where trilateration can be used as a localization method, the APs 106 A-C are usually deployed with the value of p being four, which is empirically determined to be a balanced tradeoff between cost and robustness.
- the deployed APs 106 A-C can be calibrated in terms of Received Signal Strength-to-distance, RSS-to-distance, or radio fingerprint-to-location mapping. Both RSS-to-distance and radio fingerprint-to-location mapping are methods well-known in the art.
- FIG. 11 shows an exemplary block flow diagram of the Mobile Tracker 232 module.
- localization 920 can be calculated using an RSS-to-distance mapping 921 . Due to the wireless signal propagation characteristics, the power of the signal decreases as the source of the signal gets farther. The relationship between the RSS and the distance from the source can be estimated by constructing a mapping function based on a set of ground truth measurements. Using the RSS-to-Distance Mapping 921 function, a trilateration-based localization 922 can be performed if there are at least three RSS measurements available for a person at a given time instant.
- the RSS-to-Distance Mapping 921 may be learned without any prior data if a self-calibration method is employed, which takes advantage of already-known locations of APs and their signals that are stored in a Database 923 .
- a radio fingerprint for an area of interest can be generated using a set of measurements from multiple APs for a Wi-Fi source at known positions. The radio fingerprint-to-location mapping can be used to localize a source of Wi-Fi signals.
- a computing machine and APs 106 A-C can track the mobile signals 902 A-B of persons of interest in the Mobile Tracker 232 module. Given N number of APs 106 A-C deployed in an area of interest with a certain density p, each AP can be constantly searching for wireless signals 902 A-B of interest in a certain channel or multiple channels simultaneously if equipped with multiple radios. The AP with a single radio may hop over different channels to detect such wireless signals 902 A-B that could be transmitted from mobile devices present in the area. APs 106 A-C can search for wireless signals 902 A-B because mobile devices are likely to look for an AP for potential connection that may be initiated in the near future if the user of the mobile device attempts to use a wireless connection.
- Most mobile devices 108 usually perform a type of AP discovery process if the wireless transmitter is turned on.
- the mobile devices tend to transmit a short packet periodically (i.e., Probe Request in the 802.11 standard) with a certain time interval between transmissions to discover accessible APs nearby.
- the time interval depends on (1) the type of the operating system (OS) of the mobile device (e.g., iOS, Android, etc.), (2) the applications that are currently running actively or in background, and (3) the current state of the mobile device, for example, whether the display of the mobile device is on or off.
- OS operating system
- the OS puts the device in an active state, resulting in the interval getting shorter and transmission rate being increasing. If the display is off, then the OS would gradually putting the device into a sleep state through multiple stages.
- a subset of APs 106 A-C can detect the packet around the mobile device if the APs happen to be listening at the same or an adjacent channel.
- the APs 106 A-C at an adjacent channel may be able to detect the packet since a Wi-Fi channel spectrum spans wider than the frequency width allocated for a channel.
- a data collection 910 process can occur where the PHY layer and MAC layer information of the packet can be retrieved which can include the Received Signal Strength (RSS) 911 , MAC address 912 , and a timestamp 913 of the packet transmission of the sender.
- RSS Received Signal Strength
- the value of the RSS may be available in terms of the RSS Indicator (RSSI), and this value may vary significantly even during a short time period due to various signal distortions and interferences. To reduce such noise and variation the RSS values can undergo a noise reduction process during a set of consecutive receptions.
- the unique MAC address 912 or ID of mobile devices 108 can be used to filter and aggregate the measurements separately for each individual mobile device.
- the values of the RSS readings can be converted to a real-world distance from each AP 106 A-C by utilizing the pre-learned RSS-to-Distance Mapping 921 function for each AP 106 A-C, which could be stored in a database 923 . If there are distance measurements from at least three different APs 106 A-C available, then a single location can be estimated by employing a trilateration-based approach 922 .
- the estimated current location can then be fed into a tracker (e.g., Kalman filter and Particle filter) with the unique ID, the MAC address 912 , so that the optimal current location and thus trajectory can be estimated in a stochastic framework in the mobile Device Tracker 930 module.
- the trajectory can then be stored in the In-store Shopper DB 220 as shopper profile data (SPD- 3 ) with the specific MAC address.
- FIG. 14A-C show an example of the tracking results from vision-based tracking and mobile signal based tracking.
- FIG. 14A shows an example of person being tracked with her mobile device by vision and Wi-Fi sensors as described in FIG. 1 .
- FIG. 14B reveals an example of tracking said person through vision sensors.
- the vision tracking can yield many trajectory fragments. Due to the dynamic nature of visual features of the same person in different environmental conditions, it is highly likely that the trajectories of the single person that are generated using vision-based tracking (which will be referred to as the vision-based trajectories or simply VTs) are possibly fragmented into multiple segments of partial trajectories due to potential tracking failures. In case of multiple persons in the same area, it is usually challenging to determine which VTs correspond to which persons.
- vision-based trajectories which will be referred to as the vision-based trajectories or simply VTs
- FIG. 14C shows an example of tracking said person using Wi-Fi sensors.
- the resulting trajectory is consistent and unbroken.
- Wi-Fi based trajectories which will be referred to as the Wi-Fi based trajectories or simply WTs
- WTs Wi-Fi based trajectories
- FIG. 15 shows an exemplary embodiment of the Multi-modal Trajectory Fusion 249 process.
- the Mobile Tracker 232 module may detect when a person carrying a mobile device 108 with its wireless transmitter turned on (which will be referred to as a mobile-carrying person) enters the area by detecting radio traffic from a new source and/or by confirming that the source of radio traffic enters a region of interest.
- the system can track the mobile-carrying person within the region of interest (e.g., the retail space of a mall).
- the Mobile Tracker 232 module can also detect the exit of the mobile-carrying person by detecting an event in which the period that the radio traffic is absent is longer than a threshold of time and/or the source of the radio traffic exits the region of interest.
- the trajectory in between the entrance and exit of the mobile-carrying person can be inherently complete and unique due to the uniqueness of the MAC address of the mobile device.
- any person who enters the area where a set of cameras are deployed may be tracked by each individual camera 104 A-D or by the multiple cameras 104 A-D collaboratively possibly while forming a cluster among them in the Vision Tracker 231 module.
- a person can be persistently tracked with a certain level of uncertainty if there are no significant visually similar objects in the same field of view of the cameras resulting in a longer trajectory or more persistent tracking. Whenever a tracking failure occurs due to cluttered background or visually similar irrelevant objects, the trajectory may be discontinued, and the tracking may be reinitiated.
- the tracking results can then be stored in the In-Store Shopper DB 220 .
- the tracking results may be in the form of a tuple of (x, y, t) with associated uncertainty or in the form of a blob data with its timestamp and visual feature vector.
- the system can identify and retrieve from a database the vision-based trajectories of persons (i.e., VTs as defined earlier, stored as SPD- 2 ), using the Vision Trajectory Retrieval 1140 module, that are generated during when the WT is generated. These VTs can form the pool of the candidates that potentially correspond to the WT.
- VTs can form the pool of the candidates that potentially correspond to the WT.
- a set of VTs can be identified among the pool of the candidates by comparing the distance statistics of the VTs to the WT of the mobile-carrying person and also comparing the motion dynamics including direction and speed. This process assumes that the WT is an approximate of the actual trajectory of the mobile-carrying person and makes use of the WT as an anchor.
- the unique ID of the WT can be assigned to the set of VTs, creating a new shopper profile data (SPD- 4 ) that combines the matching VTs (SPD- 2 ) and the WT (SPD- 3 ).
- FIG. 16A-D show a detailed example of the Mobile and Vision Trajectory Association 1150 .
- a set of potential VT candidates can be overlaid on the WT, which is represented by the dashed line.
- FIG. 16B shows an example of an initial matching process between the VT candidates and the WT.
- FIG. 16C shows an example of the matched VTs and the WT, which are then assigned to each other with a unique identification, resulting in the exemplary trajectories shown in FIG. 16D .
- the VTs in SPD- 4 with the assigned unique ID can then be used as the primary source to reconstruct the trajectory of the mobile-carrying person since they can be more accurate than the WT.
- the identified VTs (which are actually a set of fragmented VTs for a single person) can then be combined together to generate a single trajectory in case there are multiple vision measurements for the same target at the same time instance.
- a Kalman or Particle filter may be used to combine multiple measurements. This process of integrating multiple VTs to reconstruct a single trajectory can be called Vision Trajectory Fusion 1160 .
- Vision measurements may not be available for longer than a threshold due to various reasons because, for example, (1) some of the correct vision measurements may be discarded in the ID association process, (2) some of the cameras may not be operated correctly, (3) the background may be changed abruptly, (4) some regions are not covered by any camera, etc.
- the combined trajectory that is constructed only from the vision measurements may have missing segments in the middle.
- the missing segments can be reconstructed by retrieving the missing segment from the WT stored in the database since the WT has the complete trajectory information although its accuracy may be relatively low. This process can be called Trajectory Interpolation 1170 .
- the exact segments in the WT corresponding to the missing segments can be identified.
- the found segments in the WT can be excerpted and used to interpolate the missing parts of the combined trajectory resulting in a single and complete final trajectory (which will be referred to as the fused trajectory or simply FT). It can be made possible since in nature the WT is a complete trajectory of the person albeit with a low resolution.
- the above Trajectory Interpolation 1170 process assumed that a Wi-Fi trajectory (i.e., WT) can be generated with a low sampling frequency, yet it may be the case that there are multiple long periods of time where no Wi-Fi measurements are received.
- the pattern of Wi-Fi signal emission from a mobile device is a burst of multiple packets often followed by a long period of sleep due to the energy conservation schemes in the operating system of the mobile device.
- such missing holes may be estimated and interpolated by taking into account both the store layout and the other shoppers' trajectories in a database by inferring the most probable path taken using a learning machine and based on the other shoppers who followed the similar path of the shopper that are actually measured before and after the missing parts of the trajectory.
- the final trajectory may be further refined taking into account the store floor plan and layout that describes the occupancy map of the fixtures and other facilities/equipment where shopper trajectories must not exist.
- a shopper trajectory may be modified in such a way that it detours such obstacles with a shortest trip distance. If there are multiple such detours are available which has similar trip distances, the past history of other shoppers may be utilized to estimate more preferred and likely path that the shopper may take.
- This process can be called Trajectory Refinement 1180 .
- the results of this process can be new shopper profile data (SPD- 4 ), which can then be used to update the In-store Shopper DB 220 .
- FIG. 17 shows an example of the Shopper Data Association 242 module.
- This process can merge the shopper profile data (SPD- 1 ) from the At-Door Shopper Detector 210 with the shopper profile data (SPD- 4 ) from the Multi-modal Trajectory Fusion 249 process creating a new shopper profile data (SPD- 5 ) that can be stored in the In-Store Shopper DB 220 .
- the Shopper Matching 1341 step can retrieve a set of shopper profile data (SPD- 1 ) from the In-Store Shopper DB 220 that were created at about the same time when the shopper corresponding to the SPD- 4 entered or exited the retail space.
- the similarity of the visual features (for example, but not limited to, face and body features) and other available shopper data (for example, but not limited to, existing estimated demographics data) between them can then be computed during the Shopper Matching 1341 step.
- the similarity computation can be performed using any number of algorithms that would be well-known by one skilled in the art, including color histogram-based matching, texture-based matching, etc.
- the best matching i.e., most similar
- At-Door Shopper Detector 210 data instance can be identified.
- the Shopper Profile Data Merging 1342 step can then combine the identified shopper profile data (i.e., the matching pair of SPD- 1 and SPD- 4 ) to create a new shopper profile data (SPD- 5 ) that can be stored in the In-Store Shopper DB 220 .
- FIG. 18 shows an example block flow diagram of the Trajectory-Transaction Data Association 243 module.
- the exemplary embodiment can associate the given trajectory with Point of Sale (PoS) data (which is also called transaction data or simply T-log data) that can contain a list of items purchased by the shopper.
- PoS Point of Sale
- Such association process (which can be referred to as Trajectory-Transaction Data Association 243 or simply TT Association) can enable further analysis on the shopping pattern and buying behavior analysis.
- the T-log data of the shopper can tell us what items the shopper actually purchased after a series of exposures to various marketing elements.
- the T-log data can be crucial to understand what products wins and fails among the competition in the shelf and the final decisions that the shopper made through a course of decision process.
- FIG. 18 shows the PoS Item Localizer 1410 , which can accept as inputs the Store Layout 1402 and Planogram 1401 data, in addition to the transaction data from the PoS DB 250 .
- the PoS Item Localizer 1410 retrieves a set of transaction data that are generated about at the same time that a tracked shopper exited the store.
- the categories of the items in the retrieved transaction data can be identified using a pre-learned Item-Category Mapping 1411 table.
- the location of the identified categories of the items in the store can then be mapped using the store layout and planogram information (i.e., Category-Store Map Mapping 1412 ), revealing the location of the items that were picked by the shopper.
- T-log data in shopper behavior analysis as well as the trajectory data, it can be a challenging problem to correctly associate a T-log data with the trajectory of a shopper who made the transaction due to the lack of a consistent ID between T-log data and the trajectory.
- T-log data Given the list of items purchased and the timestamp that the transaction is made, however, it may be possible to find the best corresponding pair between a given shopper trajectory and a set of candidate T-log data.
- the PoS-to-Trajectory Matching 1430 module that describes how to find such best pair under the assumption that the entire store is covered by both vision and Wi-Fi sensors with a certain density for the system to be able to track shoppers in both modalities.
- the output of this module can be shopper profile data (SPD- 5 ) that has been updated with the corresponding T-log data.
- FIG. 19 illustrates an example of the Trajectory-Transaction Data Association (or TT Association).
- the problem of TT Association is defined as the following:
- a metric that represent the matching likelihood between the given trajectory and the T-log data needs to be defined.
- the present invention can define a metric that measures the probability that a given item I i in a given T-log data T j is picked up along the trajectory, which is called P(I i
- the shopping fixation can refer to an event where there is a change of shopper's behavior, and the shopper's behavior appears to be triggered by a retail element.
- Shopping fixation can be determined based on the motion dynamics of a shopper. If the shopper's motion gets slower and made a U-turn or stopped, then we can assume some item caught the shopper's attention, resulting in a shopping fixation 1502 A-C at the point while converting a passer-by into a shopper.
- T j ) can be computed only from the closest shopping fixation 1502 A-C (not a just closest point) in the trajectory to the item of interest I i 1504 .
- T j ) may be defined as the following: if at least a shopping fixation (which will be referred to as S) exists within a visible and reachable range r from the item, then P(I i
- T j ) ⁇ 1 , ⁇ S ⁇ r 0 , Otherwise
- T j ) may be defined to make P i robust to potential errors in shopping fixation detection and shopper tracking. To accommodate such errors, P(I i
- T j ) can be replaced by a distance metric d i j that represents the distance from the item I i 1504 to the closest shopping fixation 1502 A in the trajectory T j .
- D j the overall distance metric D j like the following:
- the present invention can iterate this process over all trajectory candidates and find the one with minimum distance or maximum probability for the given T-log data.
- the present invention Given the complete trajectory and its associated T-log data of a shopper with a unique ID assigned by solving the TT Association problem, the present invention has outlined a full understanding of (1) how the shopper navigates through the store, (2) what part of the aisle or category caught the attention of the shopper, and (3) what items the shopper actually purchased.
- FIG. 20 shows an example of the Revisiting and Cross-visiting Shopper Identifier 260 process.
- This process can accept as input the result of the Multi-modal Shopper Data Associator 248 (SPD- 5 ) and can determine whether a shopper already exists in the Cross-channel Shopper DB 280 .
- SPD- 5 Multi-modal Shopper Data Associator 248
- the Shopper Recognizer 2321 module can use the shopper profile data (SPD- 5 ) for the newly identified shopper to search the Cross-channel Shopper DB 280 looking to find whether this shopper profile data (SPD- 5 ) matches existing shopper profile data (SPD- 6 ) in the Cross-channel Shopper DB 280 .
- SPD- 5 shopper profile data
- SPD- 6 existing shopper profile data
- SPD- 6 could have been generated at any of the other locations where the system is tracking shopper behavior.
- the matching process in the Shopper Recognizer 2321 can be carried out based on the Shopper ID Vector (SIV) 301 of each shopper's profile data. More specifically, the Global ID Vector can be utilized since they are meant to be unique over time and space.
- the MAC address of radios in the mobile devices of the shoppers can clearly be the most unique identifier, so that may be used to find the match among the Cross-channel Shopper DB 280 .
- face features may be used as well to find the match using a face recognition algorithm in case the MAC address obtained may not be considered reliable enough due to the increasing number of applications and operating systems that use a randomized MAC address for the cases when data communication is not necessary.
- the Shopper Profile Merger 2323 can retrieve the existing shopper profile data (SPD- 6 ) and can merge it with the input shopper profile data, updating the existing shopper profile data (SPD- 6 ) with the new measurements in SPD- 5 . If a match is not found exceeding a predetermined threshold, then a new instance of shopper profile data (SPD- 6 ) can be created in the Cross-channel Shopper DB 280 , using the Shopper Profile Creator 2322 .
- FIG. 21 shows exemplary processes for the measurement of the shopper's decisions with regard to product categories, in which computer vision-based behavior analysis and segmentation measurement, i.e., demographics measurement and impression analysis, can be associated in an exemplary embodiment.
- computer vision-based behavior analysis and segmentation measurement i.e., demographics measurement and impression analysis
- the exemplary embodiment can identify various variables for the interaction stages of the person with regard to a set of product categories, as observed decision processes in a store area.
- the variables can include behavioral measurement, segment information, such as demographics, and impression level.
- the variables can show which sequences of nodes or decision paths the shopper made during a measurement period.
- the video-based analysis can be processed automatically.
- another exemplary embodiment can process the video-based analysis semi-automatically, where a semi-automatic annotation tool is used in combination with automatic behavior analysis, demographic analysis, and impression analysis.
- the present invention can utilize an efficient video annotation tool, such as that disclosed in U.S. Pat. No. 8,665,333 to Sharma, et al., as the semi-automatic annotation tool.
- the exemplary embodiment can organize the sequence of decision paths in relation to each demographic segment.
- the demographic segments can include age range, gender, and ethnicity, and the demographic segmentation can be used to identify any typical shopping pattern of specific shopper segments, if they exist.
- the exemplary embodiment can also organize the measurement of decision patterns based on other segmentation approaches, such as trip type analysis of the shopper.
- the trip type includes shopping patterns of the shopper.
- the exemplary embodiment can evaluate the engagement process of the shopper with each category, in granular detail.
- the granular detail can comprise the behavior of reading labels, comparing products, sniffing products, and other physical interactions with the products.
- the primary behavior can be the purchase behavior of the shopper. Therefore, the shopper's purchase behaviors in association with the product attributes are primarily measured and used to construct the decision tree.
- the exemplary embodiment can detect 717 and track 718 a shopper, using input from the mobile sensors 706 and video sensors 708 .
- the trajectories of the shopper tracks can be joined from a video of one of the cameras 104 A-D to another video of one of the cameras 104 A-D while the shopper appears and disappears between the fields-of-view among the cameras, along with tracks formed using mobile APs 106 A-C.
- the exemplary embodiment can perform the path analysis 470 of the particular shopper.
- the path analysis 470 can be used as one of the ways to process the behavior analysis 480 of the shopper and obtain useful information about the shopper's behavior, such as engagement behavior with a product.
- the interaction of the shopper 245 can also be detected based on the behavior analysis as discussed later with regard to FIG. 26 .
- FIG. 22 also shows details of an exemplary interaction detection 245 process.
- the exemplary embodiment can also process segmentation 800 of the shopper, based on the images of the shopper in the video.
- Demographic classification 814 is an exemplary segmentation 800 of the shopper.
- the segmentation 800 and behavior analysis 480 data can be used to calculate the values for the predefined variables 241 , such as the first-stop counter and the demographic class counter.
- the measurements can be sent to the module for the association of measurements and analyses 244 .
- the personalized decision tree construction module 282 constructs a personalized decision tree (PDT) based on the measurements and analyses.
- the tree construction and tree management processes such as insertion and deletion of nodes, follow well-known data structure management processes.
- impression analysis 240 can be carried on images of the shopper for measurement as a part of the behavior pattern of the shopper while making shopping decisions.
- the impression measurement module can count and measure the impression length.
- the impression measurement module can also process a deeper impression analysis in correlation with other parameters, such as the duration of viewing time for a particular product category per demographic segmentation.
- the present invention can utilize any well-known impression measurement method.
- U.S. patent application Ser. No. 11/818,554 of Sharma, et al., (hereinafter Sharma Ser. No. 11/818,554) disclosed details of a system for measuring the impression level through the viewership of people.
- An exemplary embodiment of the present invention can utilize Sharma Ser. No. 11/818,554 for the impression measurement in the impression analysis 240 , especially utilizing the 3D facial pose estimation 534 .
- the impression analysis 240 module can also utilize other variables to measure the deeper level of impression.
- the other variables can comprise the relationship of the category with the surrounding categories, demographic segmentation, and temporal attributes. For example, a more than average number of impression counts for a category in relation to a specific demographic group may indicate that the category had an unusual influence in the decision-making process by the specific demographic group in a particularly meaningful pattern.
- the impression count data can be analyzed to measure the impact on the decision-making process by each predefined demographic group in relation to the particular category.
- the measured data and constructed decision tree can be stored in the Cross-channel Shopper DB 280 .
- the analysis of the measured data can be further facilitated by applying a set of predefined rules 983 in a rule base 982 .
- the analysis of the measured data can be further facilitated by applying a set of predefined rules 983 for the decision tree construction in a rule base 982 through a rule application logic module.
- the rule application logic module can enable a dynamic rule application, rather than relying on an ad hoc solution or static hard-code in translating the measured data.
- An exemplary rule application logic module can be implemented utilizing the information unit verification technologies in U.S. Pat. No. 7,904,477 to Jung, et al.
- the rule application logic module can enable the adjustment in the analysis of shopping decision measurement, the construction of the decision tree, and processes related to the decision tree, to be done in a structured and dynamic way.
- the exemplary analysis formula and statistical model can be dynamically adjusted based on the rule application logic module.
- the rule application logic module can further construct the criteria based on a combination of a set of predefined rules, in which the analysis of the data can be performed in further detail.
- the rule application logic module can further define domain-specific criteria for the decision tree construction.
- the rule application logic module can facilitate the process of producing a unified and standardized decision tree construction, by normalizing the variance within the predefined thresholds. For example, if a measurement is skewed due to less desirable environmental factors, the differences can be adjusted by applying normalization offset values to the differences within predefined thresholds using the rule application logic module. Then, the analysis can take this into consideration at the final analysis of the decision tree construction.
- the application of the rule application logic module can differentiate the levels of measurement and analysis of the decision tree construction, where a first set of criteria is applied throughout the preliminary data, and a second set of criteria is applied to the next level of data for a complicated analysis, in order to serve the specific needs of the complicated analysis.
- An exemplary first set of criteria can typically comprise common criteria throughout all of the data, and the second set of criteria is typically different from the first set of criteria.
- FIG. 22 shows an exemplary setup phase and interaction detection process for the subcategories in a category, where the subcategories are defined at the product group level.
- an exemplary category can be divided into subcategories in association with the product groups on shelves in a category, based on the product group definition.
- the shopping behavior analysis relies on the shopper's interactions with the product groups on shelves and the association of the product group with the grid element, such as the “grid element—product group association” 586 .
- the products in product groups can be grouped based on the same kind of predefined attributes.
- one or more cameras can be used to detect the shopper's presence in the vicinity of a plurality of subcategories, defined at the product group level, i.e., based on the attributes. Then, a second group of one or more cameras can be used to detect the shopper's interaction with the product groups in association with the subcategories on shelves.
- An exemplary setup phase and interaction detection 245 process for the subcategories, i.e., product groups, is discussed as follows.
- Product group interaction detection can be achieved by building a model through an interaction model generation 587 process, during the setup phase, and using output from computer vision algorithms in conjunction with that model to detect the interaction of the shopper with any defined product group, such as the product group definition 585 .
- a polygon can be drawn around the shelf or shelves of interest.
- the grid generation 584 module can then divide the region into logical grid elements in a grid 580 (shown in FIG. 25 ) by taking the perspective distortion due to the camera view into account.
- the grid elements can have IDs, i.e., grid element IDs, which start at a certain number, such as zero or one, on the top left corner, and progressively scan the grid elements to the bottom right.
- regions on the shelf that make up a product group can be marked by drawing polygons around the corresponding regions.
- the grid assignment module 592 can match all of the grid elements that match each product group by checking for intersection of the grid element with the regions. Then, the grid logic generation module 593 can use the perspective projection of the camera and generate a look up table for deciding which region to pick when more than one grid element is active. Active grid elements can be those that have temporal motion in them. When more than one grid element is active, the grid element IDs can be arranged in increasing order, and the lowest ID can be used to look up the region to select.
- the video from the camera 330 can be processed by a module that detects temporal motion, such as the temporal motion detection 589 , at every pixel in the image.
- the grid elements that have a minimum threshold of pixel with motion can be marked as active grid elements at the active grid detection 590 process.
- the look up logic module can be used to determine which region is being interacted with to find the right product group at the product group interaction detection 591 process.
- the temporal motion can be calculated based on a frame differencing method.
- any reliable hand tracking 381 method can also replace the temporal motion detection for detecting the interaction of the shopper with the grid elements for a category, i.e., a product group.
- the exemplary embodiment can detect a plurality of interactions of the shopper with subcategories in the category, especially at the product group level, and the accumulated detection data can provide important information for the category analyses that are described above.
- an exemplary category can be further divided into multiple subcategories based on the sub-regions that are associated with certain types of the products in the sub-regions in the category.
- the shopping behavior analysis can be based on the path analysis of the shopper.
- FIG. 23 shows an exemplary view from a top-down position, where the shoppers' movements through a store area can be observed based on the multi-sensor tracking information.
- the first stop count and measurement for the duration of dwell time can be used for analyzing the shoppers' shopping movements.
- a floor coordinate system can be used.
- a (x, y) coordinate system can be applied to a target store area, such as an area adjacent to a shelf 181 .
- the area can be further divided into a set of sub-areas that are associated with the categories.
- the input images can be analyzed from the top-down means for capturing images, and increases the traffic count for the category in which the associated area is visited by the shoppers in the first-stop detection process.
- a “physical space bounding box for category 1” 161 , a “physical space bounding box for category 2” 162 , a “physical space bounding box for category 3” 163 , and a “physical space bounding box for category 4” 164 can be predefined, and the exemplary embodiment processes tracking 420 of each person in the vicinity of a category.
- the traffic count can be increased for the first-stop detection of the category that is associated with the particular bounding box.
- a pair of temporal thresholds i.e., a lower limit and an upper limit
- a pair of temporal thresholds can be set up for a certain type of interaction behavior with a product. If the coordinate, i.e., (Xi,Yi,Ti) 444 , of the person stays in one of the bounding boxes for longer than a lower limit threshold time and less than or equal to an upper limit threshold time, then the count can be increased for the interaction with a product of the category that is associated with the particular bounding box.
- One or more top-down view cameras can be installed in such a way that their fields-of-view can cover the predefined physical space bounding boxes.
- one physical space bounding box can be assigned to each vertical column, called “category block,” of the shelf space, and it can be assumed that one category is associated with each of the physical space bounding boxes per the vertical column in the exemplary embodiment in FIG. 23 .
- there can be multiple categories in one vertical column of the shelf space and the situation of multiple categories can be resolved in one column of the shelf space in coordination with using the frontal-view images from the second means for capturing images.
- the frontal-view images can provide information about which category the shopper intended to make the first-stop, e.g., viewership information about the specific category that the shopper looked at for certain duration of time, thus increasing the correct first-stop counter.
- An example of using the frontal-view images from the second camera, along with hand tracking to detect the interaction of the shopper, will be shown later.
- a semi-automatic method can also be used to resolve the situation of multiple categories in one column of the shelf space.
- FIG. 24 shows an exemplary embodiment application of spatiotemporal criteria that can be used to differentiate between a premeditated purchase and an impulse purchase 247 .
- the exemplary embodiment can measure a premeditated decision compared to an impulse or extemporaneous decision, based on the observation of the outlier behavior pattern in the decision tree. For example, shoppers who frequently purchase from a product category in a particular store become more knowledgeable about the location of products in the category, i.e., develop familiarity with the category layout. Also, if they are loyal to a particular brand/product type within the category, their decision process in the store is very quick. Therefore, their shopping activity and path could show a repetitive pattern of the decision-making process for the particular product category compared to other product categories.
- FIG. 30 shows an example of a decision tree that identifies premeditated and impulse purchase decisions, based on the in-store behavior of the shopper.
- the accumulation of the decision processes, and accordingly the corresponding decision paths in the decision tree, for the particular product category can be classified as a norm, i.e., a premeditated decision pattern.
- a norm i.e., a premeditated decision pattern.
- the repetitive pattern of shopping (trip) paths 468 can be regarded as the norm for the decision paths.
- Any irregular and occasional decision pattern and the corresponding irregular shopping path 469 which is outside of the norm, may be regarded as an impulse or extemporaneous decision.
- FIG. 25 shows an exemplary grid structure and processing 594 .
- the products can be organized in a coordinate system, e.g., (y, z) coordinates, according to predefined attributes for the products. Examples of attributes comprise brand, product type, size, flavor, and price.
- attributes comprise brand, product type, size, flavor, and price.
- the products with the same attribute can be grouped as a product group, forming a product attribute block.
- a grid structure 580 can be constructed on top of the coordinate system, and an attribute of a product group can be mapped to at least a grid element by associating the grid element with the product group and its attribute 586 .
- the size of each grid element can be adjusted according to the size of the shelf space and the product size.
- the mapping of the grid elements to product attribute blocks does not have to be one-to-one mapping.
- Multiple grid elements can be associated with a product group when the occupied space by the product group requires more than one grid element.
- a measurement of which attributes in the attribute block are chosen can be made.
- the exemplary embodiment can also measure the sequence of the chosen attributes as a sequence of decisions that are made by the shopper.
- the sequences of decisions made by the shopper can be accumulated over a period of time (multiple shopping trips) to construct the decision tree for the shopper during the time period.
- the sequence of decisions can be a decision path from a node to the next node, and a sequence of decisions at this level can show the end-to-end decisions made by the shopper.
- One of the core benefits of the exemplary embodiment is the ability to infer the sequence of decisions from the sequence of attributes for the products with which the shopper interacts in an arrangement of attributes, based on the video analytics.
- FIG. 26 shows an exemplary interaction and purchase detection based on the grid structure viewed from a top-down camera.
- the exemplary embodiment can analyze the input images from the top-down cameras, and can increase the interaction count if the shopper interacts with a product in the category at the interaction detection 245 process.
- the exemplary embodiment can also increase the purchase count for the category, if the shopper makes a purchase at the purchase detection process 246 .
- a “shelf space bounding box for category 1” 166 and a “shelf space bounding box for category 2” 167 can be predefined in the camera view 340 , and the exemplary embodiment can detect and track the hand movement 381 of the shopper. If the coordinate, i.e., (Xi,Yi,Ti) 444 , of the shopper stays in one of the bounding boxes for longer than a threshold time, the interaction count of the category that is associated with the particular bounding box can be increased. Multiple thresholds can also be used to further differentiate the level of engagement.
- the purchase detection 246 process can utilize a background subtraction algorithm in the bounding boxes to detect the presence and/or absence of the product belonging to a category. When a product's absence is detected, the purchase count can be increased for the particular product category.
- a semi-automatic annotation method can also be used for the purchase detection 246 process.
- FIG. 27 shows an exemplary planogram data of an aisle and a shopping track with regard to the process of developing a decision tree.
- the shopper trip data can be aggregated into a data structure, consisting of each decision and sequence of decisions for each shopping trip.
- the store location representing various product attributes, such as brand, size, price, and features, can be mapped based on the way the products are placed on the shelves in the store, as shown in the exemplary planogram 605 .
- a shopping consideration set and decision path for the shopper can be generated by combining the two datasets. This can provide a clear understanding of not only the sequence or the order in which the attributes are considered, but also the cross-comparisons between various product groups.
- the tree structure can be developed through hierarchical clustering of the shopper trip data. The frequency of cross comparisons determines the grouping of the attributes, and the order of the decisions can determine the depth of the nodes in the tree.
- FIG. 28 shows an exemplary process of segmentation based on purchasing behavior.
- This bubble chart 635 illustration in FIG. 28 provides an example where shopping trips can be segmented based on type and the categories purchased.
- Each column of the bubble chart can represent a product category.
- the rows can represent trip types that are segmented based on occasions.
- Each number in the chart can show the percent of shopping trips of a particular category that belong to a specific occasion, thus helping to understand the contribution of each occasion to a category's sales.
- FIG. 29A and FIG. 29B show an exemplary decision tree and process of segmentation based on shopping and purchasing behavior.
- This illustration shows an example where shopping trips can be segmented based on both shopping behavior as well as purchase behavior based on transaction data. Constraints placed on the POS data, e.g., co-occurrence of salty snacks and beverages, helps to identify the “shopper's mission” in the store. Further, in this example, shopping trips are segmented by placing constraints on the associated shopping behavior, like which two categories were shopped together.
- the hierarchical decision process for the “Snacks” category can be built in this exemplary decision tree.
- the sub-node “Candy/Cookies & Crackers/Salty Snacks/Bars/Cereal” 292 can indicate that these subcategories were shopped or considered together while making a purchase decision.
- the representation in the node for “Snacks” 291 can show the total snack purchases in this example.
- FIG. 30 shows another exemplary decision tree 252 and process of segmentation based on shopping behavior.
- This illustration shows an example where shopping trips can be segmented based on the shopping behavior in a category, like “grab and go” and “only scanned products,” using automated video analysis along with proprietary advanced data annotation techniques.
- Such in-depth segmentation can provide insights into the nature and complexity of the in-store decision process in a category.
- Each shopping behavior can be identified based on the application of spatiotemporal criteria to the shopping paths of the shopper.
- a set of shopping interaction areas can be predefined for a group of categories. If a shopping path of the shopper stays in the vicinity of a category, the sequence of the coordinates of the path can be examined to determine whether they belong to the interaction area of the category, and it can then be determined whether the shopping path is visiting the associated category.
- a shopping interaction area can be set with a predefined minimum temporal threshold and a predefined maximum temporal threshold for the shopping interaction types, e.g., “grab and go”.
- the shopping path of the shopper i.e., the sequence of coordinates in the shopping interaction area
- the shopping interaction can be classified as the “grab and go” shopping interaction.
- the temporal thresholds can be decided based on statistically gathered data in the particular category area, such as the mean temporal value of the particular shopping behavior during a typical period of time.
- FIG. 31 shows another exemplary decision tree 253 and process of segmentation in consideration of brands.
- FIG. 32 shows exemplary processes in generating a decision tree based on category correlation.
- the process of generating a decision tree can consist of:
- FIG. 33-36 show details of each exemplary process for developing a decision tree, shown in FIG. 32 .
- FIG. 33 shows exemplary categories and process for detecting the stopping sequences of the shopper in relation to the predefined categories.
- a store area can be divided into multiple categories based on the regions that are associated with certain types of products.
- the shopping behavior analysis can be based on the analysis of the shopping paths of the shopper.
- categories in a store can be set up as follows: “category A at location L1 represented by polygon 1,” “category B at location L2 represented by polygon 2,” “category C at location L3 represented by polygon 3,” “category D at location L4 represented by polygon 4,” “category E at location L5 represented by polygon 5,” and so on, as shown in 621 .
- the embodiment can detect and utilize the paths of the shopper in the store to measure how the shopper made the shopping movement.
- the sequences of coordinates for each shopping trip i.e., shopping trip 1 path—(x11, y11, t1), (x12, y12m t2), . . . , (x1n, y1 n, tn), shopping trip 2 path—(x21, y21, t1), (x22, y22m t2), . . . , (x2n, y2n, tn), shopping trip K path—(xk1, yk1, t1), (xk2, yk2m t2), . . . , (xkn, ykn, tn), and so on, can be measured.
- the sequences of coordinates show in which categories the shopper made the shopping movement. For example, if the shopper stopped and stayed in a category for longer than a predefined temporal threshold, i.e., (xi, yi, ti) is within a category polygon for longer than a temporal threshold, “Threshold Ti ”, the event can be registered as a shopping movement in that category.
- a predefined temporal threshold i.e., (xi, yi, ti) is within a category polygon for longer than a temporal threshold, “Threshold Ti ”
- the embodiment can detect the stopping sequences of the shopper in relation to the predefined categories.
- the stopping sequence of the shopper in the store can be as follows: Shopping Trip 1 Sequence—ACEA, Shopping Trip 2 Sequence—CDE, . . . , Shopping Trip K Sequence—AC, and so on.
- FIG. 34 shows an exemplary table for correlated stopping sequences of the shopper during shopping trips based on co-occurrences.
- the next process can be to find out the correlations among the stopping sequences.
- One exemplary method of finding the correlations can be to count the number of co-occurrences and find the relative ratio of the co-occurrences compared to other possible combinations of category co-occurrences, when the categories are shopped together.
- the categories can be grouped 4 at a time, 3 at a time, or 2 at a time, when the group of categories appear in the shopping paths of the shopper.
- the percentage of co-occurrences for the group of categories, “ABCD”, is 0.01, i.e. 1%, among all other possible combinations of the “4” categories in the measured area.
- FIG. 35 shows an exemplary table 625 for the ranked group of categories based on the correlation.
- the group of categories can be ranked based on the correlation. As shown in 625 , the group of 4 categories can be ranked as follows: “ABDE”, “ABCE”, “BCDE”, “ABCD”, and “ACDF”, in the order of a higher ratio for the co-occurrences.
- FIG. 36 shows an exemplary decision tree 254 that could be constructed after applying a threshold to the correlations of a group of categories.
- the next step can be to find non-overlapping categories to create a tree based on threshold values for each set of correlations.
- the tree can start with a node that shows all of the possible categories initially. According to the definition for the thresholds, there is no valid correlation for 4 categories at a time. However, “ADE” can be a valid group from 3 categories at a time, which means it can become a second level group in the exemplary tree 254 . Similarly, “BC” and “AD” can be valid correlations from 2 categories at a time. Since “BC” is not part of a top level group from 4 categories or 3 categories at a time, “BC” can become a second level group, whereas, since “AD” is part of the second level group “ADE,” “AD” can become a third level group under “ADE.”
- FIG. 37 shows an exemplary grouping of paths in a decision tree.
- the exemplary embodiment can construct a hierarchical decision tree structure 259 , which comprises nodes and edges, based on the observed decision-making.
- the decision tree can be an end-to-end tree in the sense that a set of nodes from the starting node to the ending node can show a sequence of meaningful decision processes as predefined for the measurement area.
- the decision tree is an acyclic rooted tree that can have the following properties:
- the tree does not need to be a binary tree in the present invention, although a binary tree may be used in many cases.
- the height (i.e., the largest depth) of the tree, the maximum degree (i.e., the number of children) of a node, and the maximum number of nodes in the tree can be predefined based on the type of nodes.
- the maximum number of nodes in a decision tree can be limited according to the maximum level of interaction and the predefined number of product categories that are used to measure the decision process and are the targets of interest.
- the maximum degree of a node can be dependent on the maximum number of subcategories in an example.
- h is the maximum height of the decision tree
- n i is the predefined maximum number of leaves per node at depth “i”, where the number of leaves is dependent on the number of attributes for the sub-nodes, such as product subcategories or product groups, at the node.
- nodes can vary, and the nodes can be arranged in a particular hierarchy.
- the nodes can represent
- the number of nodes in a decision tree can also be predefined with a fixed number.
- An edge represents the transition of the decision.
- a purchase action may be located in the nodes at the lowest level of the exemplary decision tree.
- the nodes can represent the attributes of products
- the consumers' hierarchical decision process in a category can be measured.
- Each category can consist of several products which have attributes.
- the attributes can be defined as a set of product information that comprises brand, product type, size, flavor, retail channel, and price.
- the products can be arranged in a particular category layout of attribute blocks, e.g., brand blocks.
- a grid can be used as a basis for an exemplary category layout.
- the exemplary embodiment can measure the selection process in the category layout, such as product, brand, and size of product package, based on spatial and temporal observation using video analytics.
- the decisions can be represented based on the selected or interacted attributes, and decision trees can be constructed based on the observed decisions.
- the decision trees can be very useful for retailers to manage categories in an efficient way.
- the category management comprises planogram/layout design, sku rationalization, assortment of categories, and efficient space allocation.
- the count for each of the decisions can be increased whenever the shopper makes a decision along the path. If a decision path does not exist in the already existing tree, a new decision path can be constructed by adding or inserting a node to the tree.
- the insertion process can follow a well-known insertion process for a data structure. For example, a linked list data structure can be used to construct the decision tree, and an insertion of a path can be processed through adding a new pointer to a sub-linked list.
- certain sets of paths in a decision tree may be grouped together for a deeper understanding of the decision process, e.g., “a set of decision paths 1” 286 and “another set of decision paths 2” 287 .
- a set of multiple outcomes can be grouped based on a time-of-day to find what kinds of decision processes were prevalent during the time-of-day.
- the temporal information adds another dimension of understanding the shopper decisions, in addition to the attributes that are already represented in the nodes of the decision tree.
- the decision tree can have a default node for insignificant behavior or no decision, such as passing by activity.
- FIG. 38 shows an exemplary scheme of dominant path calculation and level of decision steps calculation.
- the personalized decision trees can be made more actionable by quantifying a percentage of shopping trips for each node.
- the exemplary embodiment can calculate which decision was made the majority of the time, based on a large number of gathered samples.
- the embodiment can also calculate a dominant path 289 among the decision paths on the decision tree, although the dominant path 289 may not be the majority.
- the determination of the majority path and the dominant path 289 can be based on counts of shopping trips where that path was chosen. For example, a voting process can be used to determine a dominant path 289 . In the exemplary tree in 261 , a dominant path 289 is determined, although the path is not the majority path.
- Aggregation of a large number of decision processes can show the statistical decision pattern among the shopping trips for a particular category or product in the measured location or locations. For example, based on the large number of samples of observed decision processes, it can be calculated which decision was made during the majority of shopping trips.
- the exemplary embodiment can also measure different levels of decision steps that are reflected in the various lengths of the paths in the decision tree. For example, in the case 1 shown in decision tree 262 , the path 284 has a longer decision path with more steps than the path 281 , which indicates the decision process for the product attribute in the last node, i.e. the leaf, in path 284 took more steps than the decision process for the product attribute in the last node in path 281 .
- the paths are not required to have the same depth, so the lengths of the decision paths can vary depending on the shopping decision process. However, the largest depth of a decision path can be predefined, thus the height of the tree can have a fixed maximum size in this example.
- the average time for making a decision can be calculated based on the level of decision steps.
- the relationship between the shopping time and the decision process can be analyzed. For example, if the average shopping time for a particular sequence of attributes is prolonged compared to other shopping times for other sequences in the decision tree, the components of the particular sequence of attributes may need to be adjusted, depending on the goal for the category to which the attributes belong.
- the products in the category may be rearranged to shorten the shopping path and facilitate the shopping experience of the shopper, if the reduction of the shopping time is a goal of the store manager in this particular exemplary situation.
- the products for the revised decision tree 263 have been rearranged from the previous decision tree 262 .
- the path 283 now has the same length of decision steps as the path 281 , which indicates the decision steps for the product attribute in the last node in the path 284 in the previous decision tree have been reduced after rearranging the products.
- FIG. 39 shows an exemplary scheme of matching a planogram with decision trees.
- the results from the exemplary embodiment can be used to assist in developing a planogram that matches the decision process of the shopper as well as their needs.
- the planogram can be optimized based on the information of the matched decision process.
- highly-correlated products based on the decision statistics can be placed together in the planogram in an exemplary design.
- the decision paths in a decision tree 264 could show that two products in the relevant nodes are highly correlated based on a high frequency of the decision processes.
- the category layout of the planogram can reflect the correlation by placing the products together, as the correlation can be inferred from the path statistics of the decision tree.
- the pattern of the decision paths in a decision tree 266 is different from the pattern of the decision paths in another decision tree 267 in comparing two different shelf sets.
- the middle node 297 at depth 1 in the decision tree 267 shows “degree 3”, i.e., three children, while the leftmost node 296 in the decision tree 266 shows “degree 2”, i.e., two children. This indicates that the shopper made the shopping decision for the three products in the shelf that is associated with the decision tree 267 while they make the shopping decision for the two products in the other shelf that is associated with the decision tree 266 .
- the store manager can assess which planogram design is more suitable for the goal of the two shelf sets that are associated with the decision trees.
- the results also help in developing product assortments, based on an understanding of the hierarchy of category decisions, and ensuring the proper allocation of space.
- price elasticity can be superimposed on behavior, based on point-of-sale data from several price points.
- Price elasticity of demand is the measure of the sensitivity of quantity demanded in relation to changes in price. In other words, it is a measure of how shoppers react to change in price while purchasing a product.
- the exemplary embodiment can take into account a longer time period that involves several price points for the category, in order to normalize the impact of price promotions on shopper behavior.
- the longer time period can help to neutralize the impact of price promotions, in an attempt to provide a clear understanding of the importance of all other product attributes, like flavor and package size, in the purchase decision process for the category.
- FIG. 40 shows an exemplary scheme for the decision tree merge process.
- multiple decision trees can be grouped together or merged, in order to analyze the decision process from a different perspective. For example, multiple decision trees can be constructed for different times-of-day for the target location for the shopper decision observation over a predefined period of time. In another example, multiple decision trees can be constructed for different retail locations (retail channels) visited by the shopper. Then, the results of multiple trees can be merged to show the overall decision processes of the shopper during the period.
- one or more sub-trees can be constructed for the decision paths in subcategories.
- the one or more sub-trees e.g., 268 and 269
- This process can be useful when there are many category levels, and each category itself contains highly-complicated subcategories. In essence, this can be a “divide-and-conquer” strategy to divide a category into multiple subcategories, construct the decision trees for the subcategories, and merge them later for a complete view of the decision process in the category.
- FIG. 41 shows an exemplary network of a plurality of means for control and processing, a plurality of cameras, and a plurality of mobile signal access points (APs) that can be used to build a personalized decision tree, where the network further can consist of a plurality of first means for control and processing and a plurality of second means for control and processing, which can communicate with each other to synchronize the time-stamped lists of measurements among a plurality of video streams captured by the cameras and mobile signals captured by the APs in the measured locations.
- APs mobile signal access points
- the exemplary embodiment can be an apparatus for building a personalized decision tree based on in-store visual observation for behavior patterns and demographics of the shoppers that shop in a store area.
- the apparatus can comprise cameras for capturing a plurality of input images of the shoppers, e.g., first set of cameras 104 A-D and second set of cameras 102 , in the vicinity of the measurement area, a set of APs 106 A-C, and means for processing the plurality of input images, e.g., first means for control and processing 107 or second means for control and processing 110 , in order to measure the behavior patterns and demographics of each shopper in the measurement area.
- the apparatus can also comprise means for aggregating the measurements for the behavior patterns and demographics of the shopper.
- the behavior patterns can comprise interaction with the categories and purchase of products in the store area.
- the first means for control and processing 107 or second means for control and processing 110 may be used as the exemplary embodiment of these means for aggregating the measurements.
- a plurality of cameras 102 and 104 A-D can be connected to the means for video interface in a means for control and processing, e.g., a first means for control and processing 107 .
- the sensors can be placed in a distributed architecture to facilitate the measurement of the response data. If the distance between the plurality of cameras is greater than a means for control and processing can handle, the plurality cameras can be connected to multiple means for video interface.
- a plurality of cameras 111 and 112 can be connected to the means for video interface in a first means for control and processing 107 that is different from the first means for control and processing 107 of another plurality of cameras 115 and 116 .
- the plurality of APs 106 A-C can be connected to the plurality of means for control and processing via wireless or wired interface.
- the plurality of means for control and processing can be connected in a local area network and communicate with each other.
- the first set of cameras 104 A-D can be installed where the field-of-view can cover the traffic of the shoppers in the measured location and the second set of cameras 102 can be installed in an area in which the frontal view of the people can be captured.
- the cameras can be connected to the video interface through cables or via a wireless network connection.
- the digitized video data from the video interface and mobile signal data from the APs can be transferred to the means for control and processing that executes computer vision and mobile tracking algorithms on the data.
- the means for control and processing can have internal means for storing data or external means for storing data.
- the cameras can comprise an analog camera, digital camera, wireless camera, USB camera, or Firewire camera.
- the means for video interface which can comprise a video frame grabber, USB interface, Ethernet interface, wireless interface, Firewire interface, or other commonly-used video interface, are typically included in the same enclosure as the means for control and processing.
- the means for control and processing can be a general purpose personal computer, such as a Pentium 4 PC, or a dedicated hardware, such as an FPGA-based implementation of a device, which can carry out the required computation.
- the means for control and processing, as well as the means for video interface, can be placed locally or remotely, as long as the connection to the cameras and APs can be established.
- the internal means for storing data can be placed within the same enclosure as the means for control and processing.
- the external means for storing data such as a network storage driver or internal hard disk drives contained in a remote computer, can be placed locally or remotely, as long as a means for transferring data is available.
- the exemplary embodiment can generate time-stamped measurements in accordance with the behavior analysis and segmentation, utilizing a time server 109 .
- the exemplary time server 109 can maintain a synchronized time in the network of means for control and processing.
- a first means for control and processing 107 can act as a server, and a plurality of second means for control and processing 110 can act as clients.
- the server can run its own local clock or be connected to a global time server 109 for the synchronization utilizing a time synchronization protocol, such as the Network Time Protocol (NTP).
- NTP Network Time Protocol
- the time-stamped measurements can facilitate the synchronized analysis, calculation, and utilization of the measurements.
- the number of cameras and APs per a means for control and processing can vary, depending on the system configuration in the physical space. However, each means for control and processing can know the identification of the associated plurality of cameras that are assigned to the selected locations in a store area and the area covered by the cameras.
- the set of cameras utilized for the present invention can be ordinary surveillance cameras, high-definition cameras, low-cost surveillance cameras, infrared cameras, or other image detection devices.
- One example embodiment of the present invention has the cameras configured as to be installed in the ceiling of a retail location, but one skilled in the art would understand that the cameras could be installed in other locations, such as the walls of the location, behind a mirror, on or associated with a commercial display, aisle and shelf hardware, or railing.
- the access points 106 A-C can be located in plain view of customers in a retail location, but also out of sight in a ceiling or other fixture.
- the AP can be a consumer AP device, commercial AP device, beacon device, or any other device capable of operating as an access point for Wi-Fi, Bluetooth, or other wireless modality.
- Both the cameras and AP hardware can be connected by a wired network, including, but not limited to, an Ethernet based network.
- the cameras and AP hardware can be connected by a wireless network, including, but not limited to, a Wi-Fi network, Bluetooth network, nearfield communications (NFC) network, or other type of wireless network.
- a wired or wireless network can be controlled by a central server or each device can operate as an independent, “Internet of things” device.
- the network can be connected to the Internet to transfer data, including, but not limited to, raw data and processed data and analytics, to a remote location.
- the computing hardware utilized to implement the processes and modules used in the present invention can be configured and controlled via a user-input device, including, but not limited to, a keyboard, mouse, trackpad, trackball, or remote control. Additionally, the hardware can be configured and controlled via remote access through a secure Internet connection. Any data captured and created, including both raw data and processed data and analytics, by the system can be output to a user using a display, printout, or transmitted to a remote location for further analysis.
- FIG. 42 shows an example of a generic computer device or a generic mobile computer device, which may be used to implement the processes and modules of the present invention.
- the computer devices can include many forms of devices, such as desktops, workstations, servers, laptops, personal computers, personal digital assistants, single board computers such as the Raspberry Pi, and other computing devices.
- Mobile computing devices can include cellular telephones, smartphones, personal digital assistants, or other mobile devices. It should be understood that the computing devices and mobile computing devices listed are exemplary, and not intended to limit the implementation of the processes and modules disclosed in the present invention.
- the computing device 2700 includes a processor 2710 , memory 2720 (such as Random Access Memory or RAM), storage 2730 (such as a hard disk drive), input device 2740 (such as a keyboard, trackball, trackpad, or mouse), and output device 2750 (such as a CRT, LCD, or other type of display device, and an auditory device such as speakers).
- memory 2720 such as Random Access Memory or RAM
- storage 2730 such as a hard disk drive
- input device 2740 such as a keyboard, trackball, trackpad, or mouse
- output device 2750 such as a CRT, LCD, or other type of display device, and an auditory device such as speakers.
Abstract
A method and system for determining the hierarchical purchase decision process of a shopper in front of a product category in a retail store. Shopping consideration and the decision path the shopper can be obtained by combining behavior data with the category layout and transaction data. The hierarchical decision process can be determined based on observed actual in-store purchase behavior using a set of video cameras and processor implemented instructions for extracting the sequence and timing of the shopper's decision process. The hierarchical decision process, obtained by the clustering of shopper behavior data over multiple shopping trips, can not only identify the sequence of the decision, but can also quantify the volume of shopping trips at each level in the decision process and the amount of time spent by the shopper for making each decision. The decisions of the shopper for each product group can be captured down to the product attribute level. Such in-depth understanding can provide a picture of the relative importance of each product attribute in the purchase decision process, and can help retailers personalize targeted messaging to the shopper.
Description
The present invention is a method and system for determining the hierarchical purchase decision process (consumer decision trees) of an individual shopper in front of a product category (a set of products that meet the same need of the shopper), which is organized in a coordinate system either as brand or product attribute blocks, in a particular retail store and across many retail stores in a geographic area, wherein shopping consideration and the decision path of the shopper is obtained by combining behavioral data with the category layout and transactional data.
Manufacturers have been developing consumer decision trees (CDT) for several years. Traditional approaches for developing CDTs—household panel purchase data, ethnography, and shop-alongs—have clear drawbacks, since they are either based on the consumer's interpretation of the purchase decision process or a human observer's point of view on the decision process, providing limited understanding of the actual behavior. Therefore a need exists to address these limitations by unobtrusively capturing actual purchase behavior in front of the category from massive samples of shoppers—all consumers who shop the category in a specific time period—providing objectivity and precision not achievable through other data collection methods. Further, while marketing to a particular group of shoppers based on aggregated behavior is useful, there is a need to refine the targeting of messages to a particular shopper, requiring personalized decision trees (PDT). In this way the message can be delivered to the shopper based on that particular shopper's behavior, previous purchases, channel choices, and decision process.
A method and system for generating a personalized decision tree based on in-store shopper behavior analysis utilizing a plurality of sensors, and using at least a processor for the analysis comprising the steps of capturing a plurality of input images of a shopper at a retail location using a plurality of cameras, capturing a data stream from a mobile device carried by the shopper using at least a mobile signal sensor, tracking the shopper's movements through the retail location using the plurality of input images, the data stream, and a Shopper Behavior Tracker module, analyzing the behavior of the shopper using the plurality of input images, measuring decision activities of the shopper in the retail location tied to a product category based on the behavior analysis, and populating a cross-channel shopper database with a set of shopper profile data created by accumulating the decision activities of the shopper, wherein the accumulation of decision activities occurs during a plurality of shopping trips by the shopper, wherein the plurality of shopping trips by the shopper occur at a single retail location or across multiple retail locations in a geographic area, constructing the personalized decision tree using a Personalized Decision Tree Construction module, and wherein the decision activities of the shopper are measured based on the purchase behavior of the shopper comprising interaction with a plurality of products and travel paths to a plurality of product categories.
In an exemplary embodiment, presented is a method and system for determining the hierarchical purchase decision process (personalized decision trees) of a shopper in front of a product category (a set of products that meet the same need of shoppers) over time, which is organized in a coordinate system either as brand or product attribute blocks, in a retail store or across multiple retail stores (cross-channel). Shopping consideration and the decision path of the shopper is obtained by combining longitudinal behavior data with the category layout and transaction data.
The hierarchical decision process is determined based on observed actual in-store purchase behavior using a set of video cameras, wireless sensors, and processor-implemented instructions for extracting the sequence and timing of each of the shopper's decision processes (multi-sensor analysis). The cameras can include both top-down video cameras, as well as cameras positioned at the shelf, to capture the decision process, including gaze analysis and eye tracking.
In another exemplary embodiment, semi-automated data annotation approaches can also be utilized to determine the sequence, timing, and shopper's point of focus in the coordinate system. Overall, the hierarchical decision process of a shopper in front of a category can be determined, based on spatiotemporal information using the multi-sensor analytics technology. This aggregated shopper behavior data can be combined with transaction data to provide a holistic picture of the purchase decision process.
The hierarchical decision process, obtained by clustering of shopper behavior data over time, can not only identify the sequence or order of the decisions but can also quantify the volume of shopping trips at each level in the decision process, thus determining the relative importance of each product group. The frequency of cross-comparisons between product groups can not only help to determine the category structure, but can also provide a deeper understanding of product distinction and substitutability between a set of products. Moreover, the decisions of a shopper for each product group can be captured very clearly down to the product attribute level. Such in-depth understanding can provide an accurate picture of the relative importance of each product attribute, such as flavor, size, retail channel, and price, in the purchase decision process.
The exemplary embodiment can also quantify the amount of time spent by a shopper for making each decision, thereby determining the relative importance or the complexity. Combining this information with the hierarchical decision process, retailers and manufacturers can evaluate whether or not the coordinate layout of the category matches the needs and the decision process of shoppers.
The exemplary embodiment can provide further granularity by determining the hierarchical decision process of shoppers, in aggregate, by demographic groups—gender, age-range, and ethnicity—as well as by need states and occasions. Such granular understanding of the decision process for each shopper segment will help both retailers and manufacturers to customize the category layout for their key segment(s), thereby providing a more convenient and enjoyable shopping experience.
Therefore, in a preferred embodiment, it is an objective to build a personalized decision tree based on the observation of in-store behavior by measuring a set of shopper behavior metrics. The embodiment can capture a plurality of input images of a shopper by at least a camera in a store area. The plurality of input images can be processed in order to analyze the behavior of the shopper with regard to the decision activity of the shopper, over time (i.e., multiple shopping trips), tied to the category based on the behavior analysis. A plurality of datasets can be constructed by accumulating the decision activities over time, at the same retail location or multiple locations in a geographic area. The decision is measured based on the actual purchase behavior of the shopper, like interaction with the products and travel paths to categories, as opposed to using intercepts or panels to develop them.
In another preferred embodiment, it is an objective of the embodiment to use an automatic behavior measurement, including shopping paths and interaction with the products, to observe the decision processes and construct the decision trees of a shopper, without involving the shopper's participation and obtrusive interception. Therefore, the gathered data can reflect the true state of the shopper's actual decision made at the point of purchase. The embodiment can objectively capture purchase behavior from a large volume of shopping trips without intruding on the shopper's decision process, thus the gathered data is unbiased.
In the preferred embodiment, the decision behavior can be an observable behavior by automatic multi-sensor analysis. Using the exhibited behavior, such as the shopping path, browsing activity for a product, or interaction with a product, the decision tree can be calculated to identify the hierarchical decision process. Based on the observed path of the shopper (trajectory) and the associated product data in the space of travel, it can be known what the person did vs. did not do. In addition, the observable behaviors can also be associated with the sales data of the products that are located where the shopper's behaviors are measured. Examples of the observable behaviors can include time of interaction, pre-interaction (like prior location of visit), exposure to the product display and attributes, and sensory activity behavior to make decisions.
In another exemplary embodiment, a semi-automated method to compute the decision tree to identify behaviors that cannot be automatically observed by the technology or to identify granular details of shopper interaction with the product, like comparing brands, may be integrated. This semi-automated method can complement other data sources, like in-store intercepts, planograms, and point-of-sale data. However, it is important to note that this semi-automated method is not the preferred embodiment of the present invention, and it is another objective to use the semi-automated method only as a complementary method to the automated method in the preferred embodiment of the present invention.
The personalized decision tree can be used to provide targeted messaging to shoppers based on the results of each shopper's calculated decision tree. The personalization of advertising, promotions, and other messaging can greatly enhance the value of the messages delivered since they can be customized for each individual shopper's behavior, previous purchases, channel choices, and decision process. The messaging can be delivered via mobile device, digital or printed signage, at the Point of Sale, or other means of message delivery.
It is important for the manufacturers and retailers to understand the decision processes of shoppers. For example, it is important not only to understand the pack size and type of the snack that is purchased, but also to understand what the decision process is; in other words, how it is purchased. The personalized decision tree provides a clear understanding of the decision process of an individual shopper, over time, in front of a product category, thus helping to identify opportunities for improving the shopping experience and increasing the number of purchases by that shopper for the category and store. Conventional approaches for developing decision trees—household panel purchase data, ethnography, and shop-alongs—have clear drawbacks, since they are either based on the shopper's interpretation of the purchase decision process or a human observer's point of view on the decision process, providing limited understanding of the actual behavior.
The exemplary embodiment overcomes the limitations of the conventional approaches by unobtrusively capturing the actual purchase behavior of a shopper over a large number of visits, in front of the category, providing objectivity and precision not achievable through other data collection methods.
In an exemplary embodiment, the hierarchical purchase decision process (personalized decision trees) of shoppers in front of a product category (a set of products that meet the same need of consumers) in a retail store (or set of stores in a geographic area), over time, can be determined. The product category can be organized in a coordinate system either as brand or as product attribute blocks. Shopping consideration and the decision path of the shopper can be obtained by combining behavioral data with the category layout and transactional data.
The hierarchical decision process can be determined based on observed actual in-store purchase behavior, i.e., in-store observation of shopper behavior, using a set of video cameras 102 and 104A-D, wireless sensors 106A-C, and computational processing for extracting the sequence and timing of the shopper's decision process. The embodiment can include the usage of both top-down video cameras 104A-D, as well as cameras positioned at the shelf 102, to capture the decision process, including gaze analysis and eye tracking 395. The embodiment can capture a plurality of input images of the shopper by at least a camera 102 or 104A-D in the vicinity of the product category. The cameras can comprise digital or analog cameras, covering the area of interest in the vicinity of the product category. The input images can be automatically analyzed in order to determine the behavior patterns and demographics of the shopper with regard to the decision activity. A plurality of datasets can be constructed by accumulating the decision activities of the shopper over multiple trips to the same retail location, or across shopping trips to multiple retail locations. The decision can be analyzed based on the actual purchase behavior of the shopper, like interaction with the products and travel paths to categories, as opposed to using in-store intercepts or household panels to develop them.
In a preferred embodiment, in contrast to the conventional method, an automatic behavior measurement can be used, including shopping paths and interaction with the products, to observe the decision processes and construct the decision trees of the shopper, without shopper participation and obtrusive interception. Therefore, the gathered data can reflect the actual behavior of the shopper at the point of purchase. A large amount of statistical data can be objectively captured over multiple shopping trips and at multiple retail locations, thus the gathered data is unbiased.
In a preferred embodiment, the decision behavior can be an observable behavior by automatic multi-sensor analysis. Using the exhibited behavior, such as the shopping path, browsing activity for a product, or interaction with a product, the decision tree can be calculated to identify the hierarchical decision process. Based on the observed path of the shopper and the associated product data in the space of travel, it can be known what the person did vs. did not do. In addition, the observable behaviors can also be associated with the sales data for the products at the location where the shopper's behaviors are measured. Other examples of observable behaviors can include time of interaction, pre-interaction (like prior location of visit), exposure to the product display and attributes, and sensory activity behavior to make decisions. Further, the shopper's choice of retail location (retail channel) can also be recorded as an observable behavior.
In another exemplary embodiment, a semi-automated method can be integrated to compute the decision tree to identify behaviors that cannot be automatically observed by the technology or to identify granular details of shopper interaction with the product, like comparing brands. This semi-automated method can complement other data sources like in-store intercepts, planograms, and point of sale data. The semi-automated method can also comprise a method to construct parts of a decision tree that cannot be visually or automatically observed. For example, the semi-automated data annotation approaches can be utilized to determine the sequence, timing, and shopper's point of focus in the coordinate system.
Overall, the system can determine the hierarchical decision process of the shopper in front of a category based on spatiotemporal information using the multi-sensor analytics technology. This aggregated shopper behavior data will be combined with transactional data to provide a holistic picture of the purchase decision process in the store, and across multiple retail locations.
The hierarchical decision process, which can be obtained by the clustering of shopper behavior data over time, can not only identify the sequence or order of the decision, but also can quantify the volume of shopping trips at each level in the decision process, and thus can determine the relative importance of each product group. Further, since channel information can also be tracked (i.e., tracking shopper behavior across multiple retail locations in a geographic area), the relative importance of each shopping channel can also be determined.
The frequency of cross-comparisons between product groups not only can help to determine the category structure, but also can provide a deeper understanding of product distinction and substitutability between a set of products.
Moreover, the decisions of the shopper for each product group can be captured very clearly, down to the product attribute level. Such in-depth understanding can provide an accurate picture of the relative importance of each product attribute, such as flavor, size, and price, in the purchase decision process. The attributes comprise brand, product type, size, flavor, price, and retail channel. The sequence, timing, and the area of focus can be associated on the coordinate system to arrive at the hierarchical decision process. For example, if the category in the coordinate system is organized by a product attribute, such as flavor, the attributes can be mapped with the behavior, using the spatiotemporal information and the percentage of trips where the shopper first looked at flavor and then started comparing brands with the flavor attribute within the category, thus providing a measurement.
The results of the calculated personalized decision tree can be used to provide targeted messaging to shoppers based on the results of each shopper's calculated decision tree. The personalization of advertising, promotions, and other messaging can greatly enhance the value of the messages delivered since they can be customized for each individual shopper's behavior, previous purchases, channel choices, and decision process. The messaging can be delivered via a mobile device carried by the shopper 108, digital or printed signage, at the Point of Sale, or other means of message delivery.
An exemplary embodiment can also quantify the amount of time spent by the shopper for making each decision, thereby determining the relative importance or the complexity among the shopping decisions. Combining this information with the hierarchical decision process, retailers and manufacturers can evaluate whether or not the coordinate layout of the category matches the needs and the decision process of the shopper.
Since individual behavior over time can be tracked for multiple shoppers, an exemplary embodiment can provide further granularity by determining the hierarchical decision process of the shoppers by demographic groups as well as by need states and occasions. The attributes for the demographic groups comprise gender, age range, and ethnicity. Such granular understanding of the decision process for each shopper segment can help both retailers and manufacturers to customize the category layout for their key segment(s), thereby providing a more convenient and enjoyable shopping experience.
The Shopper ID Vector (SIV) 301 can refer to as a set of unique features that allow us to recognize a shopper among others. That includes a set of features that are unique over either long-term or short-term. The features of a shopper that are unique for a long-term basis (i.e., unique in multiple visits to stores over time) can include the face features and the MAC address of the radios of the mobile devices that the shopper carries. Such long-term unique features can be referred to as the Global ID Vector. The features that are unique only for a short-term basis (i.e., unique only during a single trip to a particular store) can include the body features such as body appearance. Such short-term unique features can be referred to as the Local ID Vector.
The Shopper Segment Data (SSD) 302 can be referred to as a set of features that can characterize a shopper so as to allow the shopper to be classified into a segment in the population. The SSD can be further bifurcated into the physical and behavioral segment data. The physical segment data can be extracted based on the physical characteristics of a shopper, including height, obesity, and demographics such as gender, age, and ethnicity. The behavioral segment data can describe a shopper's preference, tendency, and style in shopping, including brand loyalty, organic food preference, etc. The behavioral segment data is supposed to be derived from a set of measurements about the shopper, which is collected in the Shopper Behavior Dataset. The SSD is where the personalized decision tree for the shopper can exist.
The Shopper Behavior Dataset (SBD) 303 can be a storage of all raw measurements and low-level metrics for a shopper. The low-level metrics, which can be called Shopper Metrics, can include per-week and per-month frequency of shopping visits to a store or to all stores, per-category and per-store time spent, per-category and per-store money spent, etc. The raw measurements for a shopper can be collected as a list of TripVector, where a TripVector of a shopper can be a collection of physical and contextual attributes of a shopper's single trip to a store and the Point-of-Sale (PoS) data. The physical attributes can describe the shopper's physical states, consisting of (1) a trajectory of a shopper, described by a tuple (t, x, y) and (2) the physical states of the shopper including gesture, head orientation, mobile device usage mode, etc. The contextual attributes can describe any interactions made between a shopper and the surrounding marketing elements of a store such as displays and items, for example, visual attention, physical contact, and more high-level various shopping actions including comparing products, reading labels, waiting in a line, etc. PoS data can include items purchased during the trip to the store. The TripVector can also include identification of the particular retail location where the visit occurs.
In an exemplary embodiment, data from multiple sources can be combined. For example, the data sources can comprise data from the proprietary measurement platform, such as in-store behavior data 604, detailed information of the store layout and category planogram 605, and transaction (Point-of-Sale) data 606. A goal of utilizing multiple data sources can be to provide a holistic view of the hierarchical decision process the shopper in a category. This consolidated view can provide a clear understanding of the shopping consideration and the decision path of the shopper. However, as noted earlier, the key is to primarily utilize the data from the actual observation of physical interaction.
In-store behavior data 604 from the platform can include identifying the types of interaction with the products, their shopping sequence, and the amount of time spent making a decision. In an embodiment, when aggregated across multiple shoppers, these metrics can be broken down by demographic groups—gender, age range, and ethnicity—to provide a clear understanding of the similarities and differences in the decision-making process of various shopper segments. The platform can capture the actual shopping behavior in a store by a predefined resolution, for example, 1 foot resolution, in images of 15 frames per second. The data for the store layout and category planogram 605 can include a detailed store map showing fixture layout, aisles, displays, etc. The category layout can be based on the way the products are placed on the store shelves. The Point-of-Sale (POS) Data 606 can include transaction data by baskets and by time period.
The Multi-modal Shopper Tracker 230 (utilizing the Vision Tracker 231 and Mobile Tracker 232) can also detect and track the shopper from the time the store is entered and as the shopper travels the store. The Vision Tracker 231 and Mobile Tracker 232 can use vision and mobile data, respectively, to produce shopper trajectories that represent the shopper's entire trip through the store. The Vision Tracker 231 can provide an accurate track as the shopper moves through a location, however, a number of issues (such as background clutter and non-overlapping camera coverage) can cause discontinuities in the trajectory. The discontinuities can be rectified algorithmically (for example, by re-identifying a shopper with shopper profile data already existing in the database) and augmented using mobile data. The Mobile Tracker 232 can isolate individual mobile device tracks using the unique MAC address of each tracked device, and use methods such as translateration to localize the device. While localization accuracy can be limited using the wireless modality, the track is persistent. Data from each modality can be stored separately as shopper profile data in the In-store Shopper DB 220.
The Multi-modal Shopper Data Associator 248 can use data from the In-store Shopper DB 220 and the Point-of-Sale (PoS) DB 250 to fuse shopper trajectories collected via multiple sensing modalities (utilizing the Multi-modal Trajectory Fusion 249 module), can associate the appropriate shopper data (utilizing the Shopper Data Association 242 module), and can perform Trajectory-Transaction Data Association 243. The Multi-modal Trajectory Fusion 249 module can fuse associated trajectories from each tracking modality to generate a more accurate and continuous track. Remaining discontinuities can then be interpolated, and the resulting track stored as shopper profile data in the In-Store Shopper DB 220.
The Shopper Data Association 242 module can then merge the fused trajectory with face and body feature data as well as demographics data obtained by the At-Door Shopper Detector 210 process. This associated data can form new shopper profile data that can be stored in the In-Store Shopper DB 220. The Trajectory-Transaction Data Association 243 module can then associate the new shopper profile data with transaction (also called Point of Sale or PoS) data from the PoS DB 250. So, while the trajectory can indicate where the shopper has traveled through a store, the association with transaction data can indicate what items were actually purchased during the trip.
Creation of a personalized decision tree can be dependent on the population of the Cross-channel Shopper DB 280 with shopper profile data that is aggregated for the shopper over time (i.e., multiple shopping trips, at the same retail location or multiple locations). The Revisiting and Cross-visiting Shopper Identifier 260 can then be used to analyze an instance of shopper profile data to identify whether the shopper has visited the same (revisit) or any other retail location (cross-visit) previously. If the shopper has visited one of the n retail locations before, then records for that shopper can be updated in the Cross-channel Shopper DB 280. A new shopper can have new shopper profile data created in the Cross-channel Shopper DB 280.
Once the tracking for a shopper in this module is completed, then all of the detected faces in the SPD-1 can be fed into the Shopper Demographics Estimator 212. The Shopper Demographics Estimator 212 can estimate the gender, age group, and ethnicity of the shopper based on the multiple faces and return back the estimation results with corresponding confidence level. The details of the Shopper Demographics Estimator 212 module will be further elaborated in the following section. The estimated demographics results can be updated into the physical segment data in the corresponding SPD-1, stored in the In-store Shopper DB 220.
For every face image, the Shopper Demographics Estimator 212 can have a major role to estimate the class label with a confidence value. This value can be used for aggregating the estimate of multiple face images with the same shopper ID by, for example, the weighted voting scheme.
The Shopper Demographics Estimator 212 can consist of three processes: Face Normalization 611, Feature Extraction 612, and classification in association with each demographics category such as gender (via the Gender Classifier 614), age group (via the Age Group Classifier 616), and ethnicity (via the Ethnicity Classifier 618). Exemplary details of each process is described as follows.
The Face Normalization 611 can be a process for normalizing the scale and rotation of a facial image to the fixed size and frontal angle. Like a preprocessor, this step can be necessary to associate an input image to the classifier model which is pre-trained with a fixed size and angle. For example, the scale and rotation parameters can be estimated by Neural Network which is trained from various poses and scales generated offline.
Next in the process, a proper feature, such as gray-scaled intensity vector, color histogram, or local binary pattern, can be extracted from the normalized face using the Feature Extraction 612 module. The extracted feature can be given for an input of each demographics classifiers.
Then, classification for each category can be done by help of the pre-trained model (utilizing the Trained Gender Model 613, Trained Age Group Model 615, and Trained Race Model 617) such as the Support Vector Machine which can provide the optimal decision boundary in the feature space. In this case, the final decision can be determined based on a confidence value that is computed on the closeness to the decision boundary in the feature space. Likewise, the confidence value can be decreased as the input is getting closer to the decision boundary.
Lastly, if multiple faces are available to a tracked shopper, the weighted voting can be straightforwardly applied to determine the final demographics labels. The output of the Shopper Demographics Estimator 212 can be saved in the In-Store Shopper DB 220 as updated shopper profile data (SPD-1). In another embodiment, a face fusion-based approach may be employed before determining the final demographics label, which fuses multiple faces into a single representative face by, for example, averaging the faces.
In a case where a same shopper is tracked by multiple cameras at the same time due to their overlapping field of view, the cameras may collaborate together to fuse the measurements about the same shopper from different cameras by exchanging the measurements, including the location and the extracted visual features. Such collaborative multi-camera tracking could generate a single and merged trajectory for a shopper over the multiple cameras with the same shopper profile data (SPD-2). This can be made possible by using the pre-learned camera calibration information that enables the back-projection of the same physical points onto different cameras. Given an assertion that different cameras are tracking the same shopper and potentially with a camera clustering algorithm, the shopper tracking information estimated from a camera (e.g., a cluster member camera) can be handed over to the tracker that runs on another camera's images (e.g., a cluster head camera). Besides such measurement fusion-based multi-camera tracking, in another embodiment, a trajectory fusion-based multi-camera tracking approach may be employed, which combines multiple trajectories about the same shopper that is created individually from different cameras.
The In-store Shopper Re-identifier 716 then can compare the newly created shopper profile data (SPD-2) with the existing shopper profile data (SPD-2) stored in the In-store Shopper DB 220 to see if there is any existing shopper profile data (SPD-2) that has the matching body features. If the newly created shopper profile data (SPD-2) matches existing shopper profile data (SPD-2), then it can retrieve the existing shopper profile data from the In-store Shopper DB 220. If the newly created shopper profile data (SPD-2) does not match to any existing shopper profile data (SPD-2), it can create a new shopper profile data (SPD-2) in the In-store Shopper DB 220 and also can instantiate a new target tracking instance in the Shopper Tracker 712.
The deployed APs 106 A-C can be calibrated in terms of Received Signal Strength-to-distance, RSS-to-distance, or radio fingerprint-to-location mapping. Both RSS-to-distance and radio fingerprint-to-location mapping are methods well-known in the art.
A computing machine and APs 106 A-C can track the mobile signals 902 A-B of persons of interest in the Mobile Tracker 232 module. Given N number of APs 106 A-C deployed in an area of interest with a certain density p, each AP can be constantly searching for wireless signals 902 A-B of interest in a certain channel or multiple channels simultaneously if equipped with multiple radios. The AP with a single radio may hop over different channels to detect such wireless signals 902 A-B that could be transmitted from mobile devices present in the area. APs 106 A-C can search for wireless signals 902 A-B because mobile devices are likely to look for an AP for potential connection that may be initiated in the near future if the user of the mobile device attempts to use a wireless connection.
To get and maintain a list of nearby APs 106 A-C, most mobile devices 108 usually perform a type of AP discovery process if the wireless transmitter is turned on. The mobile devices tend to transmit a short packet periodically (i.e., Probe Request in the 802.11 standard) with a certain time interval between transmissions to discover accessible APs nearby. The time interval depends on (1) the type of the operating system (OS) of the mobile device (e.g., iOS, Android, etc.), (2) the applications that are currently running actively or in background, and (3) the current state of the mobile device, for example, whether the display of the mobile device is on or off. In general, if the display of a mobile device is on, then the OS puts the device in an active state, resulting in the interval getting shorter and transmission rate being increasing. If the display is off, then the OS would gradually putting the device into a sleep state through multiple stages.
Once a packet is transmitted from a mobile device 108 via wireless communications or mobile signals 902A-B, then a subset of APs 106 A-C can detect the packet around the mobile device if the APs happen to be listening at the same or an adjacent channel. The APs 106 A-C at an adjacent channel may be able to detect the packet since a Wi-Fi channel spectrum spans wider than the frequency width allocated for a channel. When a packet is detected at an AP 106 A-C, a data collection 910 process can occur where the PHY layer and MAC layer information of the packet can be retrieved which can include the Received Signal Strength (RSS) 911, MAC address 912, and a timestamp 913 of the packet transmission of the sender. The value of the RSS may be available in terms of the RSS Indicator (RSSI), and this value may vary significantly even during a short time period due to various signal distortions and interferences. To reduce such noise and variation the RSS values can undergo a noise reduction process during a set of consecutive receptions. In case of multiple mobile devices present, the unique MAC address 912 or ID of mobile devices 108 can be used to filter and aggregate the measurements separately for each individual mobile device.
In the localization 920 method where RSS-to-Distance Mapping 921 can be used, the values of the RSS readings can be converted to a real-world distance from each AP 106 A-C by utilizing the pre-learned RSS-to-Distance Mapping 921 function for each AP 106 A-C, which could be stored in a database 923. If there are distance measurements from at least three different APs 106 A-C available, then a single location can be estimated by employing a trilateration-based approach 922. The estimated current location can then be fed into a tracker (e.g., Kalman filter and Particle filter) with the unique ID, the MAC address 912, so that the optimal current location and thus trajectory can be estimated in a stochastic framework in the mobile Device Tracker 930 module. The trajectory can then be stored in the In-store Shopper DB 220 as shopper profile data (SPD-3) with the specific MAC address.
Independent of the mobile signal-based tracking, any person who enters the area where a set of cameras are deployed may be tracked by each individual camera 104 A-D or by the multiple cameras 104 A-D collaboratively possibly while forming a cluster among them in the Vision Tracker 231 module. A person can be persistently tracked with a certain level of uncertainty if there are no significant visually similar objects in the same field of view of the cameras resulting in a longer trajectory or more persistent tracking. Whenever a tracking failure occurs due to cluttered background or visually similar irrelevant objects, the trajectory may be discontinued, and the tracking may be reinitiated. Since the re-identification of the person may or may not be successful during the entire trip of the person within the area, multiple disjointed trajectories may be created for the same person across the trajectories. The tracking results can then be stored in the In-Store Shopper DB 220. In an embodiment, the tracking results may be in the form of a tuple of (x, y, t) with associated uncertainty or in the form of a blob data with its timestamp and visual feature vector.
Once the complete Wi-Fi based trajectory of a mobile-carrying person (i.e., a WT as defined earlier, stored as SPD-3) is generated by the Mobile Tracker 232 module and retrieved from the In-Store Shopper DB 220 by the Mobile Trajectory Detection 1130 module, the system can identify and retrieve from a database the vision-based trajectories of persons (i.e., VTs as defined earlier, stored as SPD-2), using the Vision Trajectory Retrieval 1140 module, that are generated during when the WT is generated. These VTs can form the pool of the candidates that potentially correspond to the WT. Then, a set of VTs can be identified among the pool of the candidates by comparing the distance statistics of the VTs to the WT of the mobile-carrying person and also comparing the motion dynamics including direction and speed. This process assumes that the WT is an approximate of the actual trajectory of the mobile-carrying person and makes use of the WT as an anchor. Once the VTs (SPD-2) corresponding to the WT (SPD-3) is identified, then the unique ID of the WT can be assigned to the set of VTs, creating a new shopper profile data (SPD-4) that combines the matching VTs (SPD-2) and the WT (SPD-3). This process of identifying a set of VTs that corresponds to a WT can be called Mobile and Vision Trajectory Association 1150. FIG. 16A-D show a detailed example of the Mobile and Vision Trajectory Association 1150. In FIG. 16A , a set of potential VT candidates can be overlaid on the WT, which is represented by the dashed line. FIG. 16B shows an example of an initial matching process between the VT candidates and the WT. FIG. 16C shows an example of the matched VTs and the WT, which are then assigned to each other with a unique identification, resulting in the exemplary trajectories shown in FIG. 16D .
The VTs in SPD-4 with the assigned unique ID can then be used as the primary source to reconstruct the trajectory of the mobile-carrying person since they can be more accurate than the WT. The identified VTs (which are actually a set of fragmented VTs for a single person) can then be combined together to generate a single trajectory in case there are multiple vision measurements for the same target at the same time instance. In an embodiment, a Kalman or Particle filter may be used to combine multiple measurements. This process of integrating multiple VTs to reconstruct a single trajectory can be called Vision Trajectory Fusion 1160.
Vision measurements may not be available for longer than a threshold due to various reasons because, for example, (1) some of the correct vision measurements may be discarded in the ID association process, (2) some of the cameras may not be operated correctly, (3) the background may be changed abruptly, (4) some regions are not covered by any camera, etc. In such cases, the combined trajectory that is constructed only from the vision measurements may have missing segments in the middle. The missing segments can be reconstructed by retrieving the missing segment from the WT stored in the database since the WT has the complete trajectory information although its accuracy may be relatively low. This process can be called Trajectory Interpolation 1170. Since the point-to-point correspondence between WT and VTs can be found in the Mobile and Vision Trajectory Association 1150 process, the exact segments in the WT corresponding to the missing segments can be identified. The found segments in the WT can be excerpted and used to interpolate the missing parts of the combined trajectory resulting in a single and complete final trajectory (which will be referred to as the fused trajectory or simply FT). It can be made possible since in nature the WT is a complete trajectory of the person albeit with a low resolution.
The above Trajectory Interpolation 1170 process assumed that a Wi-Fi trajectory (i.e., WT) can be generated with a low sampling frequency, yet it may be the case that there are multiple long periods of time where no Wi-Fi measurements are received. In practical cases, the pattern of Wi-Fi signal emission from a mobile device is a burst of multiple packets often followed by a long period of sleep due to the energy conservation schemes in the operating system of the mobile device. Thus, it is often the case that there are multiple periods where no Wi-Fi signals are detected for longer than, for example, 30 seconds, resulting in missing holes in Wi-Fi trajectories.
In an embodiment, such missing holes may be estimated and interpolated by taking into account both the store layout and the other shoppers' trajectories in a database by inferring the most probable path taken using a learning machine and based on the other shoppers who followed the similar path of the shopper that are actually measured before and after the missing parts of the trajectory.
Once the Trajectory Fusion and Interpolation process is completed, the final trajectory may be further refined taking into account the store floor plan and layout that describes the occupancy map of the fixtures and other facilities/equipment where shopper trajectories must not exist. In an embodiment, a shopper trajectory may be modified in such a way that it detours such obstacles with a shortest trip distance. If there are multiple such detours are available which has similar trip distances, the past history of other shoppers may be utilized to estimate more preferred and likely path that the shopper may take. This process can be called Trajectory Refinement 1180. The results of this process can be new shopper profile data (SPD-4), which can then be used to update the In-store Shopper DB 220.
Upon the creation of the shopper profile data (SPD-4) from the Multi-modal Trajectory Fusion 249, the Shopper Matching 1341 step can retrieve a set of shopper profile data (SPD-1) from the In-Store Shopper DB 220 that were created at about the same time when the shopper corresponding to the SPD-4 entered or exited the retail space. Given the set of candidate matching SPD-1 to the SPD-4, the similarity of the visual features (for example, but not limited to, face and body features) and other available shopper data (for example, but not limited to, existing estimated demographics data) between them can then be computed during the Shopper Matching 1341 step. The similarity computation can be performed using any number of algorithms that would be well-known by one skilled in the art, including color histogram-based matching, texture-based matching, etc. For each instance of the shopper profile data (SPD-4) from the Multi-modal Trajectory Fusion 249 module, the best matching (i.e., most similar) At-Door Shopper Detector 210 data instance can be identified. The Shopper Profile Data Merging 1342 step can then combine the identified shopper profile data (i.e., the matching pair of SPD-1 and SPD-4) to create a new shopper profile data (SPD-5) that can be stored in the In-Store Shopper DB 220.
While the trajectory data of a shopper can indicate how the shopper navigates through a store and what marketing elements the shopper has been exposed to during the shopping trip, the T-log data of the shopper can tell us what items the shopper actually purchased after a series of exposures to various marketing elements. The T-log data can be crucial to understand what products wins and fails among the competition in the shelf and the final decisions that the shopper made through a course of decision process.
Despite the importance of T-log data in shopper behavior analysis as well as the trajectory data, it can be a challenging problem to correctly associate a T-log data with the trajectory of a shopper who made the transaction due to the lack of a consistent ID between T-log data and the trajectory. Given the list of items purchased and the timestamp that the transaction is made, however, it may be possible to find the best corresponding pair between a given shopper trajectory and a set of candidate T-log data. In this section, we present the PoS-to-Trajectory Matching 1430 module that describes how to find such best pair under the assumption that the entire store is covered by both vision and Wi-Fi sensors with a certain density for the system to be able to track shoppers in both modalities. The output of this module can be shopper profile data (SPD-5) that has been updated with the corresponding T-log data.
The problem of TT Association is defined as the following:
Given that a given complete trajectory and a set of T-log data in a similar time frame, to the present invention seeks find the best corresponding pairs between them if exist.
To find a T-log data that most likely matches with the trajectory, a metric that represent the matching likelihood between the given trajectory and the T-log data needs to be defined.
Therefore, given a single complete trajectory and a single T-log data Tj, to the present invention can compute the likelihood Pj that all of the items in Tj are picked up along this trajectory.
To compute the likelihood for all of the items to be picked up along the trajectory, the present invention can define a metric that measures the probability that a given item Ii in a given T-log data Tj is picked up along the trajectory, which is called P(Ii|Tj). Then, we can find Tj such that
where
When computing P(Ii|Tj), the present method can introduce a new term called shopping fixation. The shopping fixation can refer to an event where there is a change of shopper's behavior, and the shopper's behavior appears to be triggered by a retail element. Shopping fixation can be determined based on the motion dynamics of a shopper. If the shopper's motion gets slower and made a U-turn or stopped, then we can assume some item caught the shopper's attention, resulting in a shopping fixation 1502A-C at the point while converting a passer-by into a shopper. P(Ii|Tj) can be computed only from the closest shopping fixation 1502A-C (not a just closest point) in the trajectory to the item of interest I i 1504.
In an embodiment, P(Ii|Tj) may be defined as the following: if at least a shopping fixation (which will be referred to as S) exists within a visible and reachable range r from the item, then P(Ii|Tj) will be equal to 1 and otherwise 0 to ensure that every item is picked up along the trajectory.
In another embodiment, P(Ii|Tj) may be defined to make Pi robust to potential errors in shopping fixation detection and shopper tracking. To accommodate such errors, P(Ii|Tj) may be defined as:
where r1<r2< . . . <rK.
Instead of using a probabilistic measure, we can also solve this problem using a geometric distance statistics. In this case, the probabilistic measure P(Ii|Tj) can be replaced by a distance metric di j that represents the distance from the item Ii 1504 to the closest shopping fixation 1502A in the trajectory Tj. We can then define the overall distance metric Dj like the following:
Using these metrics between a trajectory and a T-log data, the present invention can iterate this process over all trajectory candidates and find the one with minimum distance or maximum probability for the given T-log data.
Given the complete trajectory and its associated T-log data of a shopper with a unique ID assigned by solving the TT Association problem, the present invention has outlined a full understanding of (1) how the shopper navigates through the store, (2) what part of the aisle or category caught the attention of the shopper, and (3) what items the shopper actually purchased.
The Shopper Recognizer 2321 module can use the shopper profile data (SPD-5) for the newly identified shopper to search the Cross-channel Shopper DB 280 looking to find whether this shopper profile data (SPD-5) matches existing shopper profile data (SPD-6) in the Cross-channel Shopper DB 280. In the case of a revisiting shopper, existing shopper profile data (SPD-6) could have been generated at the same retail location. In the case of a cross-visiting shopper, existing shopper profile data (SPD-6) could have been generated at any of the other locations where the system is tracking shopper behavior. The matching process in the Shopper Recognizer 2321 can be carried out based on the Shopper ID Vector (SIV) 301 of each shopper's profile data. More specifically, the Global ID Vector can be utilized since they are meant to be unique over time and space. The MAC address of radios in the mobile devices of the shoppers can clearly be the most unique identifier, so that may be used to find the match among the Cross-channel Shopper DB 280. In another embodiment, face features may be used as well to find the match using a face recognition algorithm in case the MAC address obtained may not be considered reliable enough due to the increasing number of applications and operating systems that use a randomized MAC address for the cases when data communication is not necessary.
If the current shopper profile data matches an existing shopper profile with similarity greater than a predetermined threshold, then the Shopper Profile Merger 2323 can retrieve the existing shopper profile data (SPD-6) and can merge it with the input shopper profile data, updating the existing shopper profile data (SPD-6) with the new measurements in SPD-5. If a match is not found exceeding a predetermined threshold, then a new instance of shopper profile data (SPD-6) can be created in the Cross-channel Shopper DB 280, using the Shopper Profile Creator 2322.
The exemplary embodiment can comprise modules of:
-
- automatic behavior measurement and analysis,
- automatic demographics measurement and analysis,
- impression analysis,
- semi-automatic data measurement and analysis, and
- a module for associating the measurements and analyses.
The exemplary embodiment can identify various variables for the interaction stages of the person with regard to a set of product categories, as observed decision processes in a store area. The variables can include behavioral measurement, segment information, such as demographics, and impression level. The variables can show which sequences of nodes or decision paths the shopper made during a measurement period.
In a preferred embodiment, the video-based analysis can be processed automatically. However, another exemplary embodiment can process the video-based analysis semi-automatically, where a semi-automatic annotation tool is used in combination with automatic behavior analysis, demographic analysis, and impression analysis. The present invention can utilize an efficient video annotation tool, such as that disclosed in U.S. Pat. No. 8,665,333 to Sharma, et al., as the semi-automatic annotation tool.
Furthermore, the exemplary embodiment can organize the sequence of decision paths in relation to each demographic segment. The demographic segments can include age range, gender, and ethnicity, and the demographic segmentation can be used to identify any typical shopping pattern of specific shopper segments, if they exist. The exemplary embodiment can also organize the measurement of decision patterns based on other segmentation approaches, such as trip type analysis of the shopper. The trip type includes shopping patterns of the shopper. Further, the exemplary embodiment can evaluate the engagement process of the shopper with each category, in granular detail. The granular detail can comprise the behavior of reading labels, comparing products, sniffing products, and other physical interactions with the products. However, although any type of interaction behavior may be considered for the decision process, the primary behavior can be the purchase behavior of the shopper. Therefore, the shopper's purchase behaviors in association with the product attributes are primarily measured and used to construct the decision tree.
While details of a preferred embodiment for multi-modal shopper behavior analysis was described above, a more generalized embodiment is illustrated in the Multi-modal Shopper Tracker 230 as shown in FIG. 21 . The exemplary embodiment can detect 717 and track 718 a shopper, using input from the mobile sensors 706 and video sensors 708. The trajectories of the shopper tracks can be joined from a video of one of the cameras 104A-D to another video of one of the cameras 104A-D while the shopper appears and disappears between the fields-of-view among the cameras, along with tracks formed using mobile APs 106A-C. Based on the tracking information, the exemplary embodiment can perform the path analysis 470 of the particular shopper. The path analysis 470 can be used as one of the ways to process the behavior analysis 480 of the shopper and obtain useful information about the shopper's behavior, such as engagement behavior with a product. The interaction of the shopper 245 can also be detected based on the behavior analysis as discussed later with regard to FIG. 26 . FIG. 22 also shows details of an exemplary interaction detection 245 process.
The exemplary embodiment can also process segmentation 800 of the shopper, based on the images of the shopper in the video. Demographic classification 814 is an exemplary segmentation 800 of the shopper.
The segmentation 800 and behavior analysis 480 data can be used to calculate the values for the predefined variables 241, such as the first-stop counter and the demographic class counter. The measurements can be sent to the module for the association of measurements and analyses 244. The personalized decision tree construction module 282 constructs a personalized decision tree (PDT) based on the measurements and analyses. The tree construction and tree management processes, such as insertion and deletion of nodes, follow well-known data structure management processes.
In another exemplary embodiment, impression analysis 240 can be carried on images of the shopper for measurement as a part of the behavior pattern of the shopper while making shopping decisions. The impression measurement module can count and measure the impression length. The impression measurement module can also process a deeper impression analysis in correlation with other parameters, such as the duration of viewing time for a particular product category per demographic segmentation. With regard to the impression count and measurement, the present invention can utilize any well-known impression measurement method. U.S. patent application Ser. No. 11/818,554 of Sharma, et al., (hereinafter Sharma Ser. No. 11/818,554) disclosed details of a system for measuring the impression level through the viewership of people. An exemplary embodiment of the present invention can utilize Sharma Ser. No. 11/818,554 for the impression measurement in the impression analysis 240, especially utilizing the 3D facial pose estimation 534.
In an exemplary embodiment, the impression analysis 240 module can also utilize other variables to measure the deeper level of impression. The other variables can comprise the relationship of the category with the surrounding categories, demographic segmentation, and temporal attributes. For example, a more than average number of impression counts for a category in relation to a specific demographic group may indicate that the category had an unusual influence in the decision-making process by the specific demographic group in a particularly meaningful pattern. Likewise, the impression count data can be analyzed to measure the impact on the decision-making process by each predefined demographic group in relation to the particular category.
The measured data and constructed decision tree can be stored in the Cross-channel Shopper DB 280. The analysis of the measured data can be further facilitated by applying a set of predefined rules 983 in a rule base 982.
In the exemplary embodiment, the analysis of the measured data can be further facilitated by applying a set of predefined rules 983 for the decision tree construction in a rule base 982 through a rule application logic module. The rule application logic module can enable a dynamic rule application, rather than relying on an ad hoc solution or static hard-code in translating the measured data.
An exemplary rule application logic module can be implemented utilizing the information unit verification technologies in U.S. Pat. No. 7,904,477 to Jung, et al.
The rule application logic module can enable the adjustment in the analysis of shopping decision measurement, the construction of the decision tree, and processes related to the decision tree, to be done in a structured and dynamic way. The exemplary analysis formula and statistical model can be dynamically adjusted based on the rule application logic module.
The rule application logic module can further construct the criteria based on a combination of a set of predefined rules, in which the analysis of the data can be performed in further detail. The rule application logic module can further define domain-specific criteria for the decision tree construction. The rule application logic module can facilitate the process of producing a unified and standardized decision tree construction, by normalizing the variance within the predefined thresholds. For example, if a measurement is skewed due to less desirable environmental factors, the differences can be adjusted by applying normalization offset values to the differences within predefined thresholds using the rule application logic module. Then, the analysis can take this into consideration at the final analysis of the decision tree construction.
The application of the rule application logic module can differentiate the levels of measurement and analysis of the decision tree construction, where a first set of criteria is applied throughout the preliminary data, and a second set of criteria is applied to the next level of data for a complicated analysis, in order to serve the specific needs of the complicated analysis. An exemplary first set of criteria can typically comprise common criteria throughout all of the data, and the second set of criteria is typically different from the first set of criteria.
In an exemplary embodiment, an exemplary category can be divided into subcategories in association with the product groups on shelves in a category, based on the product group definition. In this example, the shopping behavior analysis relies on the shopper's interactions with the product groups on shelves and the association of the product group with the grid element, such as the “grid element—product group association” 586. The products in product groups can be grouped based on the same kind of predefined attributes.
In the exemplary embodiment, one or more cameras can be used to detect the shopper's presence in the vicinity of a plurality of subcategories, defined at the product group level, i.e., based on the attributes. Then, a second group of one or more cameras can be used to detect the shopper's interaction with the product groups in association with the subcategories on shelves.
An exemplary setup phase and interaction detection 245 process for the subcategories, i.e., product groups, is discussed as follows. Product group interaction detection can be achieved by building a model through an interaction model generation 587 process, during the setup phase, and using output from computer vision algorithms in conjunction with that model to detect the interaction of the shopper with any defined product group, such as the product group definition 585.
During the setup phase, a polygon can be drawn around the shelf or shelves of interest. The grid generation 584 module can then divide the region into logical grid elements in a grid 580 (shown in FIG. 25 ) by taking the perspective distortion due to the camera view into account. In an exemplary embodiment, the grid elements can have IDs, i.e., grid element IDs, which start at a certain number, such as zero or one, on the top left corner, and progressively scan the grid elements to the bottom right. During the setup phase, regions on the shelf that make up a product group can be marked by drawing polygons around the corresponding regions.
Once this is done, the grid assignment module 592 can match all of the grid elements that match each product group by checking for intersection of the grid element with the regions. Then, the grid logic generation module 593 can use the perspective projection of the camera and generate a look up table for deciding which region to pick when more than one grid element is active. Active grid elements can be those that have temporal motion in them. When more than one grid element is active, the grid element IDs can be arranged in increasing order, and the lowest ID can be used to look up the region to select.
Once the setup is finished, the video from the camera 330 can be processed by a module that detects temporal motion, such as the temporal motion detection 589, at every pixel in the image. The grid elements that have a minimum threshold of pixel with motion can be marked as active grid elements at the active grid detection 590 process. The look up logic module can be used to determine which region is being interacted with to find the right product group at the product group interaction detection 591 process.
The temporal motion can be calculated based on a frame differencing method. In another exemplary embodiment, any reliable hand tracking 381 method can also replace the temporal motion detection for detecting the interaction of the shopper with the grid elements for a category, i.e., a product group.
Based on the described processes for the product group interaction detection process for a product group above, the exemplary embodiment can detect a plurality of interactions of the shopper with subcategories in the category, especially at the product group level, and the accumulated detection data can provide important information for the category analyses that are described above.
In another exemplary embodiment, an exemplary category can be further divided into multiple subcategories based on the sub-regions that are associated with certain types of the products in the sub-regions in the category. In this example, the shopping behavior analysis can be based on the path analysis of the shopper.
The first stop count and measurement for the duration of dwell time can be used for analyzing the shoppers' shopping movements. A floor coordinate system can be used. For example, a (x, y) coordinate system can be applied to a target store area, such as an area adjacent to a shelf 181. The area can be further divided into a set of sub-areas that are associated with the categories.
In the exemplary embodiment shown in FIG. 23 , the input images can be analyzed from the top-down means for capturing images, and increases the traffic count for the category in which the associated area is visited by the shoppers in the first-stop detection process. For example, in the exemplary embodiment, a “physical space bounding box for category 1” 161, a “physical space bounding box for category 2” 162, a “physical space bounding box for category 3” 163, and a “physical space bounding box for category 4” 164 can be predefined, and the exemplary embodiment processes tracking 420 of each person in the vicinity of a category. If the coordinate, i.e., (Xi,Yi,Ti) 444, of a person stays in one of the bounding boxes for longer than a threshold time as a first-stop, then the traffic count can be increased for the first-stop detection of the category that is associated with the particular bounding box.
Furthermore, another set of thresholds can be utilized for a different type of shopping behavior. For example, a pair of temporal thresholds, i.e., a lower limit and an upper limit, can be set up for a certain type of interaction behavior with a product. If the coordinate, i.e., (Xi,Yi,Ti) 444, of the person stays in one of the bounding boxes for longer than a lower limit threshold time and less than or equal to an upper limit threshold time, then the count can be increased for the interaction with a product of the category that is associated with the particular bounding box.
One or more top-down view cameras can be installed in such a way that their fields-of-view can cover the predefined physical space bounding boxes. For the simplicity of explanation, one physical space bounding box can be assigned to each vertical column, called “category block,” of the shelf space, and it can be assumed that one category is associated with each of the physical space bounding boxes per the vertical column in the exemplary embodiment in FIG. 23 . However, there can be multiple categories in one vertical column of the shelf space, and the situation of multiple categories can be resolved in one column of the shelf space in coordination with using the frontal-view images from the second means for capturing images. The frontal-view images can provide information about which category the shopper intended to make the first-stop, e.g., viewership information about the specific category that the shopper looked at for certain duration of time, thus increasing the correct first-stop counter. An example of using the frontal-view images from the second camera, along with hand tracking to detect the interaction of the shopper, will be shown later. Further, in an alternative embodiment, a semi-automatic method can also be used to resolve the situation of multiple categories in one column of the shelf space.
The exemplary embodiment can measure a premeditated decision compared to an impulse or extemporaneous decision, based on the observation of the outlier behavior pattern in the decision tree. For example, shoppers who frequently purchase from a product category in a particular store become more knowledgeable about the location of products in the category, i.e., develop familiarity with the category layout. Also, if they are loyal to a particular brand/product type within the category, their decision process in the store is very quick. Therefore, their shopping activity and path could show a repetitive pattern of the decision-making process for the particular product category compared to other product categories. FIG. 30 (discussed later) shows an example of a decision tree that identifies premeditated and impulse purchase decisions, based on the in-store behavior of the shopper. The accumulation of the decision processes, and accordingly the corresponding decision paths in the decision tree, for the particular product category can be classified as a norm, i.e., a premeditated decision pattern. For example, the repetitive pattern of shopping (trip) paths 468 can be regarded as the norm for the decision paths. Any irregular and occasional decision pattern and the corresponding irregular shopping path 469, which is outside of the norm, may be regarded as an impulse or extemporaneous decision.
Shopping decisions can be determined based on the observation of:
-
- 1) the first-stop the shopper made and the associated product sale data, or
- 2) the shopper's interaction with the products and the associated product sale data.
With regard to the shopper's interaction with the products, the products can be organized in a coordinate system, e.g., (y, z) coordinates, according to predefined attributes for the products. Examples of attributes comprise brand, product type, size, flavor, and price. The products with the same attribute can be grouped as a product group, forming a product attribute block. A grid structure 580 can be constructed on top of the coordinate system, and an attribute of a product group can be mapped to at least a grid element by associating the grid element with the product group and its attribute 586. When the grid elements are mapped to product attribute blocks, the size of each grid element can be adjusted according to the size of the shelf space and the product size. The mapping of the grid elements to product attribute blocks does not have to be one-to-one mapping. Multiple grid elements can be associated with a product group when the occupied space by the product group requires more than one grid element. When the shopper makes decisions and interaction movements, a measurement of which attributes in the attribute block are chosen can be made.
The exemplary embodiment can also measure the sequence of the chosen attributes as a sequence of decisions that are made by the shopper. The sequences of decisions made by the shopper can be accumulated over a period of time (multiple shopping trips) to construct the decision tree for the shopper during the time period. The sequence of decisions can be a decision path from a node to the next node, and a sequence of decisions at this level can show the end-to-end decisions made by the shopper. One of the core benefits of the exemplary embodiment is the ability to infer the sequence of decisions from the sequence of attributes for the products with which the shopper interacts in an arrangement of attributes, based on the video analytics.
The exemplary embodiment can analyze the input images from the top-down cameras, and can increase the interaction count if the shopper interacts with a product in the category at the interaction detection 245 process. The exemplary embodiment can also increase the purchase count for the category, if the shopper makes a purchase at the purchase detection process 246.
For example, a “shelf space bounding box for category 1” 166 and a “shelf space bounding box for category 2” 167 can be predefined in the camera view 340, and the exemplary embodiment can detect and track the hand movement 381 of the shopper. If the coordinate, i.e., (Xi,Yi,Ti) 444, of the shopper stays in one of the bounding boxes for longer than a threshold time, the interaction count of the category that is associated with the particular bounding box can be increased. Multiple thresholds can also be used to further differentiate the level of engagement.
The purchase detection 246 process can utilize a background subtraction algorithm in the bounding boxes to detect the presence and/or absence of the product belonging to a category. When a product's absence is detected, the purchase count can be increased for the particular product category. In addition, in an exemplary embodiment, a semi-automatic annotation method can also be used for the purchase detection 246 process.
The shopper trip data, such as 460, can be aggregated into a data structure, consisting of each decision and sequence of decisions for each shopping trip. The store location representing various product attributes, such as brand, size, price, and features, can be mapped based on the way the products are placed on the shelves in the store, as shown in the exemplary planogram 605. A shopping consideration set and decision path for the shopper can be generated by combining the two datasets. This can provide a clear understanding of not only the sequence or the order in which the attributes are considered, but also the cross-comparisons between various product groups. The tree structure can be developed through hierarchical clustering of the shopper trip data. The frequency of cross comparisons determines the grouping of the attributes, and the order of the decisions can determine the depth of the nodes in the tree.
This bubble chart 635 illustration in FIG. 28 provides an example where shopping trips can be segmented based on type and the categories purchased. Each column of the bubble chart can represent a product category. The rows can represent trip types that are segmented based on occasions. Each number in the chart can show the percent of shopping trips of a particular category that belong to a specific occasion, thus helping to understand the contribution of each occasion to a category's sales.
This illustration shows an example where shopping trips can be segmented based on both shopping behavior as well as purchase behavior based on transaction data. Constraints placed on the POS data, e.g., co-occurrence of salty snacks and beverages, helps to identify the “shopper's mission” in the store. Further, in this example, shopping trips are segmented by placing constraints on the associated shopping behavior, like which two categories were shopped together.
Based on the shopper behavior data and the transaction data, the hierarchical decision process for the “Snacks” category can be built in this exemplary decision tree. For example, the sub-node “Candy/Cookies & Crackers/Salty Snacks/Bars/Cereal” 292 can indicate that these subcategories were shopped or considered together while making a purchase decision. The representation in the node for “Snacks” 291 can show the total snack purchases in this example. Of the total snack purchases in the node for “Snacks” 291, in 48% of the shopping trips, i.e., as represented in another node for “Candy/Cookies & Crackers/Salty Snacks/Bars/Cereal” 292, the shopper purchased at least one of the subcategories from this group. The percentages for all of the groups in the node for “Candy/Cookies & Crackers/Salty Snacks/Bars/Cereal” 292 may not add up to 100% due to rounding.
This illustration shows an example where shopping trips can be segmented based on the shopping behavior in a category, like “grab and go” and “only scanned products,” using automated video analysis along with proprietary advanced data annotation techniques. Such in-depth segmentation can provide insights into the nature and complexity of the in-store decision process in a category.
Each shopping behavior can be identified based on the application of spatiotemporal criteria to the shopping paths of the shopper. For example, a set of shopping interaction areas can be predefined for a group of categories. If a shopping path of the shopper stays in the vicinity of a category, the sequence of the coordinates of the path can be examined to determine whether they belong to the interaction area of the category, and it can then be determined whether the shopping path is visiting the associated category. For example, a shopping interaction area can be set with a predefined minimum temporal threshold and a predefined maximum temporal threshold for the shopping interaction types, e.g., “grab and go”. If the shopping path of the shopper, i.e., the sequence of coordinates in the shopping interaction area, stays for longer than the predefined minimum temporal threshold and less than the predefined maximum temporal threshold for a shopping interaction type, such as the “grab and go”, the shopping interaction can be classified as the “grab and go” shopping interaction. The temporal thresholds can be decided based on statistically gathered data in the particular category area, such as the mean temporal value of the particular shopping behavior during a typical period of time.
The illustration provides a clear example of the importance of product attributes, such as product type and brand, in the decision process of “Salty Snacks.” Package sizes are clearly a more important decision over brands for “Potato Chips/Fritos/Cheetos/Doritos and Tostitos.” Such in-depth understanding can not only help to modify the category layout to match the decision process of the shopper, but also to increase the number of purchases by providing an improved shopping experience.
In an exemplary embodiment, the process of generating a decision tree can consist of:
-
- 1) identifying categories in a
store area 233, - 2) detecting paths of the shopper in the
store area 234, - 3) measuring stopping sequence of the shopper in the
store 235, - 4) finding out the correlations when the categories are shopped together 236,
- 5) ranking the
correlations 237, and - 6) grouping non-overlapping categories to create a tree based on threshold values for each set of
correlations 238.
- 1) identifying categories in a
In an exemplary embodiment, a store area can be divided into multiple categories based on the regions that are associated with certain types of products. In this example, the shopping behavior analysis can be based on the analysis of the shopping paths of the shopper.
For example, categories in a store can be set up as follows: “category A at location L1 represented by polygon 1,” “category B at location L2 represented by polygon 2,” “category C at location L3 represented by polygon 3,” “category D at location L4 represented by polygon 4,” “category E at location L5 represented by polygon 5,” and so on, as shown in 621. Once the target categories are identified, the embodiment can detect and utilize the paths of the shopper in the store to measure how the shopper made the shopping movement. For example, as shown in 622, the sequences of coordinates for each shopping trip, i.e., shopping trip 1 path—(x11, y11, t1), (x12, y12m t2), . . . , (x1n, y1 n, tn), shopping trip 2 path—(x21, y21, t1), (x22, y22m t2), . . . , (x2n, y2n, tn), shopping trip K path—(xk1, yk1, t1), (xk2, yk2m t2), . . . , (xkn, ykn, tn), and so on, can be measured. The sequences of coordinates show in which categories the shopper made the shopping movement. For example, if the shopper stopped and stayed in a category for longer than a predefined temporal threshold, i.e., (xi, yi, ti) is within a category polygon for longer than a temporal threshold, “ThresholdTi”, the event can be registered as a shopping movement in that category.
Therefore, based on the categories that the shopper visited, the embodiment can detect the stopping sequences of the shopper in relation to the predefined categories. For example, as shown in 623, the stopping sequence of the shopper in the store can be as follows: Shopping Trip 1 Sequence—ACEA, Shopping Trip 2 Sequence—CDE, . . . , Shopping Trip K Sequence—AC, and so on.
From the stopping sequences of the shopper, across multiple shopping trips, in the store, the next process can be to find out the correlations among the stopping sequences. One exemplary method of finding the correlations can be to count the number of co-occurrences and find the relative ratio of the co-occurrences compared to other possible combinations of category co-occurrences, when the categories are shopped together. As shown in 624, the categories can be grouped 4 at a time, 3 at a time, or 2 at a time, when the group of categories appear in the shopping paths of the shopper. In this example, the percentage of co-occurrences for the group of categories, “ABCD”, is 0.01, i.e. 1%, among all other possible combinations of the “4” categories in the measured area.
After the categories are grouped based on a correlation measure, the group of categories can be ranked based on the correlation. As shown in 625, the group of 4 categories can be ranked as follows: “ABDE”, “ABCE”, “BCDE”, “ABCD”, and “ACDF”, in the order of a higher ratio for the co-occurrences.
In an exemplary embodiment, after ranking the correlations among the grouped categories, the next step can be to find non-overlapping categories to create a tree based on threshold values for each set of correlations.
In the exemplary tree 254, the threshold values can be defined and applied to the table 625, as follows:
Threshold for 4 categories at a time=0.05
Threshold for 3 categories at a time=0.15
Threshold for 2 categories at a time=0.30 (1)
Threshold for 4 categories at a time=0.05
Threshold for 3 categories at a time=0.15
Threshold for 2 categories at a time=0.30 (1)
The tree can start with a node that shows all of the possible categories initially. According to the definition for the thresholds, there is no valid correlation for 4 categories at a time. However, “ADE” can be a valid group from 3 categories at a time, which means it can become a second level group in the exemplary tree 254. Similarly, “BC” and “AD” can be valid correlations from 2 categories at a time. Since “BC” is not part of a top level group from 4 categories or 3 categories at a time, “BC” can become a second level group, whereas, since “AD” is part of the second level group “ADE,” “AD” can become a third level group under “ADE.”
The exemplary embodiment can construct a hierarchical decision tree structure 259, which comprises nodes and edges, based on the observed decision-making. The decision tree can be an end-to-end tree in the sense that a set of nodes from the starting node to the ending node can show a sequence of meaningful decision processes as predefined for the measurement area.
In the exemplary embodiment, the decision tree is an acyclic rooted tree that can have the following properties:
Any two nodes in the decision tree can be connected by a unique simple path, and
the number of edges=number of nodes−1. (2)
the number of edges=number of nodes−1. (2)
The tree does not need to be a binary tree in the present invention, although a binary tree may be used in many cases. In the exemplary embodiment, the height (i.e., the largest depth) of the tree, the maximum degree (i.e., the number of children) of a node, and the maximum number of nodes in the tree can be predefined based on the type of nodes. For example, the maximum number of nodes in a decision tree can be limited according to the maximum level of interaction and the predefined number of product categories that are used to measure the decision process and are the targets of interest. Similarly, the maximum degree of a node can be dependent on the maximum number of subcategories in an example.
In this example, the maximum number of nodes in the decision tree can be limited by:
numOfNodesmax=1+n 1 +n 1 n 2 + . . . +n 1 n 2 . . . n h-1 n h (3)
numOfNodesmax=1+n 1 +n 1 n 2 + . . . +n 1 n 2 . . . n h-1 n h (3)
where “h” is the maximum height of the decision tree, and “ni” is the predefined maximum number of leaves per node at depth “i”, where the number of leaves is dependent on the number of attributes for the sub-nodes, such as product subcategories or product groups, at the node.
The types of nodes can vary, and the nodes can be arranged in a particular hierarchy. For example, in an exemplary embodiment, the nodes can represent
-
- 1) the shopping behavior or the state-of-mind of the shopper, or
- 2) the product attributes that are selected by the shopper.
The number of nodes in a decision tree can also be predefined with a fixed number. An edge represents the transition of the decision.
In an exemplary embodiment, where the nodes can represent the shopping behavior or the state-of-mind of the shopper, a purchase action may be located in the nodes at the lowest level of the exemplary decision tree.
In another exemplary embodiment, where the nodes can represent the attributes of products, the consumers' hierarchical decision process in a category can be measured. Each category can consist of several products which have attributes. As noted earlier, the attributes can be defined as a set of product information that comprises brand, product type, size, flavor, retail channel, and price. The products can be arranged in a particular category layout of attribute blocks, e.g., brand blocks. A grid can be used as a basis for an exemplary category layout.
The exemplary embodiment can measure the selection process in the category layout, such as product, brand, and size of product package, based on spatial and temporal observation using video analytics. The decisions can be represented based on the selected or interacted attributes, and decision trees can be constructed based on the observed decisions. The decision trees can be very useful for retailers to manage categories in an efficient way. The category management comprises planogram/layout design, sku rationalization, assortment of categories, and efficient space allocation.
The count for each of the decisions can be increased whenever the shopper makes a decision along the path. If a decision path does not exist in the already existing tree, a new decision path can be constructed by adding or inserting a node to the tree. The insertion process can follow a well-known insertion process for a data structure. For example, a linked list data structure can be used to construct the decision tree, and an insertion of a path can be processed through adding a new pointer to a sub-linked list.
In FIG. 37 , certain sets of paths in a decision tree may be grouped together for a deeper understanding of the decision process, e.g., “a set of decision paths 1” 286 and “another set of decision paths 2” 287. For example, a set of multiple outcomes can be grouped based on a time-of-day to find what kinds of decision processes were prevalent during the time-of-day. In this exemplary analysis, the temporal information adds another dimension of understanding the shopper decisions, in addition to the attributes that are already represented in the nodes of the decision tree. Optionally, the decision tree can have a default node for insignificant behavior or no decision, such as passing by activity.
The personalized decision trees can be made more actionable by quantifying a percentage of shopping trips for each node. The exemplary embodiment can calculate which decision was made the majority of the time, based on a large number of gathered samples. The embodiment can also calculate a dominant path 289 among the decision paths on the decision tree, although the dominant path 289 may not be the majority. The determination of the majority path and the dominant path 289 can be based on counts of shopping trips where that path was chosen. For example, a voting process can be used to determine a dominant path 289. In the exemplary tree in 261, a dominant path 289 is determined, although the path is not the majority path.
Aggregation of a large number of decision processes can show the statistical decision pattern among the shopping trips for a particular category or product in the measured location or locations. For example, based on the large number of samples of observed decision processes, it can be calculated which decision was made during the majority of shopping trips.
The exemplary embodiment can also measure different levels of decision steps that are reflected in the various lengths of the paths in the decision tree. For example, in the case 1 shown in decision tree 262, the path 284 has a longer decision path with more steps than the path 281, which indicates the decision process for the product attribute in the last node, i.e. the leaf, in path 284 took more steps than the decision process for the product attribute in the last node in path 281. In an exemplary embodiment, the paths are not required to have the same depth, so the lengths of the decision paths can vary depending on the shopping decision process. However, the largest depth of a decision path can be predefined, thus the height of the tree can have a fixed maximum size in this example.
The average time for making a decision can be calculated based on the level of decision steps. The relationship between the shopping time and the decision process can be analyzed. For example, if the average shopping time for a particular sequence of attributes is prolonged compared to other shopping times for other sequences in the decision tree, the components of the particular sequence of attributes may need to be adjusted, depending on the goal for the category to which the attributes belong. The products in the category may be rearranged to shorten the shopping path and facilitate the shopping experience of the shopper, if the reduction of the shopping time is a goal of the store manager in this particular exemplary situation. For example, in the case 2, the products for the revised decision tree 263 have been rearranged from the previous decision tree 262. In the decision tree 263, the path 283 now has the same length of decision steps as the path 281, which indicates the decision steps for the product attribute in the last node in the path 284 in the previous decision tree have been reduced after rearranging the products.
The results from the exemplary embodiment can be used to assist in developing a planogram that matches the decision process of the shopper as well as their needs. Depending on the planogram, people navigate differently. Therefore, the planogram can be optimized based on the information of the matched decision process. For example, highly-correlated products based on the decision statistics can be placed together in the planogram in an exemplary design. For example, the decision paths in a decision tree 264 could show that two products in the relevant nodes are highly correlated based on a high frequency of the decision processes. In this case, the category layout of the planogram can reflect the correlation by placing the products together, as the correlation can be inferred from the path statistics of the decision tree.
In another example, between two different shelf sets, it can be determined which shelf more closely matches the mindset of the shopper, information that can be used for better planogram design. For example, the pattern of the decision paths in a decision tree 266 is different from the pattern of the decision paths in another decision tree 267 in comparing two different shelf sets. The middle node 297 at depth 1 in the decision tree 267 shows “degree 3”, i.e., three children, while the leftmost node 296 in the decision tree 266 shows “degree 2”, i.e., two children. This indicates that the shopper made the shopping decision for the three products in the shelf that is associated with the decision tree 267 while they make the shopping decision for the two products in the other shelf that is associated with the decision tree 266. Given the information, the store manager can assess which planogram design is more suitable for the goal of the two shelf sets that are associated with the decision trees. The results also help in developing product assortments, based on an understanding of the hierarchy of category decisions, and ensuring the proper allocation of space. In another exemplary application of the results, price elasticity can be superimposed on behavior, based on point-of-sale data from several price points. Price elasticity of demand is the measure of the sensitivity of quantity demanded in relation to changes in price. In other words, it is a measure of how shoppers react to change in price while purchasing a product.
The exemplary embodiment can take into account a longer time period that involves several price points for the category, in order to normalize the impact of price promotions on shopper behavior. The longer time period can help to neutralize the impact of price promotions, in an attempt to provide a clear understanding of the importance of all other product attributes, like flavor and package size, in the purchase decision process for the category.
In an exemplary embodiment, multiple decision trees can be grouped together or merged, in order to analyze the decision process from a different perspective. For example, multiple decision trees can be constructed for different times-of-day for the target location for the shopper decision observation over a predefined period of time. In another example, multiple decision trees can be constructed for different retail locations (retail channels) visited by the shopper. Then, the results of multiple trees can be merged to show the overall decision processes of the shopper during the period.
In another example, one or more sub-trees can be constructed for the decision paths in subcategories. The one or more sub-trees, e.g., 268 and 269, can be integrated into the super-tree, e.g., 270, for the higher level category. This process can be useful when there are many category levels, and each category itself contains highly-complicated subcategories. In essence, this can be a “divide-and-conquer” strategy to divide a category into multiple subcategories, construct the decision trees for the subcategories, and merge them later for a complete view of the decision process in the category.
The exemplary embodiment can be an apparatus for building a personalized decision tree based on in-store visual observation for behavior patterns and demographics of the shoppers that shop in a store area. The apparatus can comprise cameras for capturing a plurality of input images of the shoppers, e.g., first set of cameras 104A-D and second set of cameras 102, in the vicinity of the measurement area, a set of APs 106A-C, and means for processing the plurality of input images, e.g., first means for control and processing 107 or second means for control and processing 110, in order to measure the behavior patterns and demographics of each shopper in the measurement area. The apparatus can also comprise means for aggregating the measurements for the behavior patterns and demographics of the shopper. The behavior patterns can comprise interaction with the categories and purchase of products in the store area. The first means for control and processing 107 or second means for control and processing 110 may be used as the exemplary embodiment of these means for aggregating the measurements.
In the exemplary embodiment, a plurality of cameras 102 and 104A-D, can be connected to the means for video interface in a means for control and processing, e.g., a first means for control and processing 107.
The sensors can be placed in a distributed architecture to facilitate the measurement of the response data. If the distance between the plurality of cameras is greater than a means for control and processing can handle, the plurality cameras can be connected to multiple means for video interface.
For example, in the exemplary embodiment shown in FIG. 41 , a plurality of cameras 111 and 112, can be connected to the means for video interface in a first means for control and processing 107 that is different from the first means for control and processing 107 of another plurality of cameras 115 and 116. Likewise, the plurality of APs 106A-C can be connected to the plurality of means for control and processing via wireless or wired interface. The plurality of means for control and processing can be connected in a local area network and communicate with each other.
In an exemplary deployment of the system, the first set of cameras 104A-D can be installed where the field-of-view can cover the traffic of the shoppers in the measured location and the second set of cameras 102 can be installed in an area in which the frontal view of the people can be captured. The cameras can be connected to the video interface through cables or via a wireless network connection.
The digitized video data from the video interface and mobile signal data from the APs can be transferred to the means for control and processing that executes computer vision and mobile tracking algorithms on the data. The means for control and processing can have internal means for storing data or external means for storing data.
The cameras can comprise an analog camera, digital camera, wireless camera, USB camera, or Firewire camera. The means for video interface, which can comprise a video frame grabber, USB interface, Ethernet interface, wireless interface, Firewire interface, or other commonly-used video interface, are typically included in the same enclosure as the means for control and processing.
The means for control and processing can be a general purpose personal computer, such as a Pentium 4 PC, or a dedicated hardware, such as an FPGA-based implementation of a device, which can carry out the required computation. The means for control and processing, as well as the means for video interface, can be placed locally or remotely, as long as the connection to the cameras and APs can be established.
The internal means for storing data, such as the internal hard disk drives, can be placed within the same enclosure as the means for control and processing. The external means for storing data, such as a network storage driver or internal hard disk drives contained in a remote computer, can be placed locally or remotely, as long as a means for transferring data is available.
The exemplary embodiment can generate time-stamped measurements in accordance with the behavior analysis and segmentation, utilizing a time server 109. The exemplary time server 109 can maintain a synchronized time in the network of means for control and processing. In another exemplary embodiment, a first means for control and processing 107 can act as a server, and a plurality of second means for control and processing 110 can act as clients. The server can run its own local clock or be connected to a global time server 109 for the synchronization utilizing a time synchronization protocol, such as the Network Time Protocol (NTP). The time-stamped measurements can facilitate the synchronized analysis, calculation, and utilization of the measurements.
The number of cameras and APs per a means for control and processing can vary, depending on the system configuration in the physical space. However, each means for control and processing can know the identification of the associated plurality of cameras that are assigned to the selected locations in a store area and the area covered by the cameras.
One of ordinary skill in the art would recognize that the set of cameras utilized for the present invention, for example as illustrated in FIGS. 1 and 8 , can be ordinary surveillance cameras, high-definition cameras, low-cost surveillance cameras, infrared cameras, or other image detection devices. One example embodiment of the present invention has the cameras configured as to be installed in the ceiling of a retail location, but one skilled in the art would understand that the cameras could be installed in other locations, such as the walls of the location, behind a mirror, on or associated with a commercial display, aisle and shelf hardware, or railing.
One of ordinary skill in the art would also recognize that the access points 106A-C (APs), for example as illustrated in FIG. 1 , can be located in plain view of customers in a retail location, but also out of sight in a ceiling or other fixture. The AP can be a consumer AP device, commercial AP device, beacon device, or any other device capable of operating as an access point for Wi-Fi, Bluetooth, or other wireless modality.
Both the cameras and AP hardware can be connected by a wired network, including, but not limited to, an Ethernet based network. The cameras and AP hardware can be connected by a wireless network, including, but not limited to, a Wi-Fi network, Bluetooth network, nearfield communications (NFC) network, or other type of wireless network. A wired or wireless network can be controlled by a central server or each device can operate as an independent, “Internet of things” device. The network can be connected to the Internet to transfer data, including, but not limited to, raw data and processed data and analytics, to a remote location.
The computing hardware utilized to implement the processes and modules used in the present invention can be configured and controlled via a user-input device, including, but not limited to, a keyboard, mouse, trackpad, trackball, or remote control. Additionally, the hardware can be configured and controlled via remote access through a secure Internet connection. Any data captured and created, including both raw data and processed data and analytics, by the system can be output to a user using a display, printout, or transmitted to a remote location for further analysis.
The computing device 2700 includes a processor 2710, memory 2720 (such as Random Access Memory or RAM), storage 2730 (such as a hard disk drive), input device 2740 (such as a keyboard, trackball, trackpad, or mouse), and output device 2750 (such as a CRT, LCD, or other type of display device, and an auditory device such as speakers).
While the above description contains much specificity, these should not be construed as limitations on the scope of the invention, but as exemplifications of the presently preferred embodiments thereof. Many other ramifications and variations are possible within the teachings of the invention. Thus, the scope of the invention should be determined by the appended claims and their legal equivalents, and not by the examples given.
Claims (30)
1. A method for generating a personalized decision tree based on in-store shopper behavior analysis utilizing a plurality of sensors, and using at least a processor for the analysis comprising the steps of:
a. capturing a plurality of input images of a shopper at a retail location using a plurality of cameras,
b. capturing a data stream from a mobile device carried by the shopper using at least a mobile signal sensor,
c. tracking the shopper's movements through the retail location using the plurality of input images, the data stream, and a Shopper Behavior Tracker module, wherein the plurality of input images and the data stream are used to create a set of vision-based trajectories and Wi-Fi based trajectories, wherein segments from the set of Wi-Fi based trajectories are used to reconstruct missing segments from the set of vision-based trajectories using a Trajectory Interpolation module, and wherein the set of vision-based trajectories and Wi-Fi based trajectories are fused through a Multi-modal Trajectory Fusion module,
d. analyzing the behavior of the shopper using the plurality of input images,
e. measuring decision activities of the shopper in the retail location tied to a product category based on the behavior analysis, including associating a shopper trajectory and a shopper transaction log, computing a likelihood for a set of items picked up along the shopper trajectory, wherein the likelihood is determined using the following formula Pj=Πi-1 NP(Ii|Tj)a wherein Pj is the likelihood, Ii is a given item in a given t-log data Tj and determining a presence of a shopping fixation point, and
f. populating a cross-channel shopper database with a set of shopper profile data created by accumulating the decision activities of the shopper, wherein the accumulation of decision activities occurs during a plurality of shopping trips by the shopper, wherein the plurality of shopping trips by the shopper occur at a single retail location or across multiple retail locations in a geographic area, wherein a Shopper Recognizer module uses the set of shopper profile data to search a Cross-channel Shopper Database to determine a match with a set of existing shopper profile data of a revisiting shopper,
g. constructing the personalized decision tree using a Personalized Decision Tree Construction module, and wherein the decision activities of the shopper are measured based on the purchase behavior of the shopper comprising interaction with a plurality of products and travel paths to a plurality of product categories.
2. The method according to claim 1 , wherein the method further comprises a step of calculating which decision was made by the shopper a majority of the time based on data gathered over multiple shopping trips to a single retail location or multiple retail locations.
3. The method according to claim 1 , wherein the personalized decision tree comprises nodes and edges, wherein a node represents the state-of-mind of the shopper, wherein the number of nodes is predefined, and wherein an edge represents a transition of the decision.
4. The method according to claim 1 , wherein the capturing of input images of the shopper and tracking of the shopper movements through a retail location is performed without the knowledge of the shopper, making the gathered data unbiased.
5. The method according to claim 1 , wherein the Personalized Decision Tree Construction module further comprises calculating a dominant path among the decision paths in the personalized decision tree.
6. The method according to claim 1 , wherein the method further comprises aggregating the decision paths for the shopping trips of multiple shoppers segmented by demographic class or by need states, wherein the attributes for the demographic class comprise age, gender, and ethnicity.
7. The method according to claim 1 , wherein the method further comprises a step of counting selection activities according to the category, product, brand, size of product package made by the decision, based on spatial and temporal observation using video analytics.
8. The method according to claim 1 , wherein the method further comprises the steps of:
a. organizing products in a coordinate system according to predefined attributes,
b. measuring what attributes in an attribute block are chosen by the shopper, and
c. measuring the sequence of the chosen attributes,
wherein the attributes comprise brand, product type, size, flavor, and price.
9. The method according to claim 1 , wherein the method further comprises a step of integrating a semi-automated method to compute the decision tree to identify behaviors specific to the tracked shopper that cannot be automatically observed or to identify granular details of the specific tracked shopper's interaction with a product.
10. The method according to claim 1 , wherein the method further comprises a step of detecting a sequence of decisions that are made by the shopper, wherein the sequence of decisions is a decision path from a node to the next node, and wherein the sequence of decisions shows the end-to-end decisions made by the shopper.
11. The method according to claim 1 , wherein the method further comprises a step of measuring different levels of decision steps based on the lengths of the decision paths, wherein the average time of making a decision can be calculated based on the level of decision steps.
12. The method according to claim 1 , wherein the method further comprises a step of measuring a premeditated decision compared to an impulse decision based on the decision tree.
13. The method according to claim 1 , wherein the method further comprises a step of quantifying a percentage of shopping trips for each node.
14. The method according to claim 1 , wherein the method further comprises a step of providing targeted messaging to the shopper based on the personalized decision tree.
15. The method according to claim 1 , wherein the method further comprises a step of superimposing price elasticity on the shopper, based on the personalized decision tree.
16. A system for generating a personalized decision tree based on in-store shopper behavior analysis utilizing a plurality of sensors, and using at least a processor for the analysis comprising the steps of:
a. capturing a plurality of input images of a shopper at a retail location using a plurality of cameras,
b. capturing a data stream from a mobile device carried by the shopper using at least a mobile signal sensor,
c. tracking the shopper's movements through the retail location using the plurality of input images, the data stream, and a Shopper Behavior Tracker module, wherein the plurality of input images and the data stream are used to create a set of vision-based trajectories and Wi-Fi based trajectories, wherein segments from the set of Wi-Fi based trajectories are used to reconstruct missing segments from the set of vision-based trajectories using a Trajectory Interpolation module, and wherein the set of vision-based trajectories and Wi-Fi based trajectories are fused through a Multi-modal Trajectory Fusion module,
d. analyzing the behavior of the shopper using the plurality of input images,
e. measuring decision activities of the shopper in the retail location tied to a product category based on the behavior analysis, including associating a shopper trajectory and a shopper transaction log, computing a likelihood for a set of items picked up along the shopper trajectory, wherein the likelihood is determined using the following formula Pj=Πi-1 NP(Ii|Tj)a wherein Pj is the likelihood, Ii is a given item in a given t-log data Tj and determining a presence of a shopping fixation point, and
f. populating a cross-channel shopper database with a set of shopper profile data created by accumulating the decision activities of the shopper, wherein the accumulation of decision activities occurs during a plurality of shopping trips by the shopper, wherein the plurality of shopping trips by the shopper occur at a single retail location or across multiple retail locations in a geographic area, wherein a Shopper Recognizer module uses the set of shopper profile data to search a Cross-channel Shopper Database to determine a match with a set of existing shopper profile data of a revisiting shopper,
g. constructing the personalized decision tree using a Personalized Decision Tree Construction module, and wherein the decision activities of the shopper are measured based on the purchase behavior of the shopper comprising interaction with a plurality of products and travel paths to a plurality of product categories.
17. The system according to claim 16 , wherein the method further comprises a step of calculating which decision was made by the shopper a majority of the time based on data gathered over multiple shopping trips to a single retail location or multiple retail locations.
18. The system according to claim 16 , wherein the personalized decision tree comprises nodes and edges, wherein a node represents the state-of-mind of the shopper, wherein the number of nodes is predefined, and wherein an edge represents a transition of the decision.
19. The system according to claim 16 , wherein the capturing of input images of the shopper and tracking of the shopper movements through a retail location is performed without the knowledge of the shopper, making the gathered data unbiased.
20. The system according to claim 16 , wherein the Personalized Decision Tree Construction module further comprises calculating a dominant path among the decision paths in the personalized decision tree.
21. The system according to claim 16 , wherein the method further comprises aggregating the decision paths for the shopping trips of multiple shoppers segmented by demographic class or by need states, wherein the attributes for the demographic class comprise age, gender, and ethnicity.
22. The system according to claim 16 , wherein the method further comprises a step of counting selection activities according to the category, product, brand, size of product package made by the decision, based on spatial and temporal observation using video analytics.
23. The system according to claim 16 , wherein the method further comprises the steps of:
a. organizing products in a coordinate system according to predefined attributes,
b. measuring what attributes in an attribute block are chosen by the shopper, and
c. measuring the sequence of the chosen attributes,
wherein the attributes comprise brand, product type, size, flavor, and price.
24. The system according to claim 16 , wherein the method further comprises a step of integrating a semi-automated method to compute the decision tree to identify behaviors specific to the tracked shopper that cannot be automatically observed or to identify granular details of the specific tracked shopper's interaction with a product.
25. The system according to claim 16 , wherein the method further comprises a step of detecting a sequence of decisions that are made by the shopper, wherein the sequence of decisions is a decision path from a node to the next node, and wherein the sequence of decisions shows the end-to-end decisions made by the shopper.
26. The system according to claim 16 , wherein the method further comprises a step of measuring different levels of decision steps based on the lengths of the decision paths, wherein the average time of making a decision can be calculated based on the level of decision steps.
27. The system according to claim 16 , wherein the method further comprises a step of measuring a premeditated decision compared to an impulse decision based on the decision tree.
28. The system according to claim 16 , wherein the method further comprises a step of quantifying a percentage of shopping trips for each node.
29. The system according to claim 16 , wherein the method further comprises a step of providing targeted messaging to the shopper based on the personalized decision tree.
30. The system according to claim 16 , wherein the method further comprises a step of superimposing price elasticity on the shopper, based on the personalized decision tree.
Priority Applications (1)
| Application Number | Priority Date | Filing Date | Title |
|---|---|---|---|
| US15/051,629 US10963893B1 (en) | 2016-02-23 | 2016-02-23 | Personalized decision tree based on in-store behavior analysis |
Applications Claiming Priority (1)
| Application Number | Priority Date | Filing Date | Title |
|---|---|---|---|
| US15/051,629 US10963893B1 (en) | 2016-02-23 | 2016-02-23 | Personalized decision tree based on in-store behavior analysis |
Publications (1)
| Publication Number | Publication Date |
|---|---|
| US10963893B1 true US10963893B1 (en) | 2021-03-30 |
Family
ID=75164709
Family Applications (1)
| Application Number | Title | Priority Date | Filing Date |
|---|---|---|---|
| US15/051,629 Active 2038-04-21 US10963893B1 (en) | 2016-02-23 | 2016-02-23 | Personalized decision tree based on in-store behavior analysis |
Country Status (1)
| Country | Link |
|---|---|
| US (1) | US10963893B1 (en) |
Cited By (11)
| Publication number | Priority date | Publication date | Assignee | Title |
|---|---|---|---|---|
| US20210065217A1 (en) * | 2019-08-26 | 2021-03-04 | Grabango Co. | Dynamic product marketing through computer vision |
| CN113408337A (en) * | 2021-05-11 | 2021-09-17 | 浙江大华技术股份有限公司 | Target document gathering method, electronic device and computer storage medium |
| US20220004747A1 (en) * | 2019-07-31 | 2022-01-06 | Boe Technology Group Co., Ltd. | Multi-target pedestrian tracking method, multi-target pedestrian tracking apparatus and multi-target pedestrian tracking device |
| CN114331569A (en) * | 2022-03-07 | 2022-04-12 | 广州鹰云信息科技有限公司 | User consumption behavior analysis method and system for different scenes in business space |
| US11308547B2 (en) * | 2019-08-29 | 2022-04-19 | Ncr Corporation | Method and system for generating a store planogram and identifying a suspect customer |
| US11481805B2 (en) | 2018-01-03 | 2022-10-25 | Grabango Co. | Marketing and couponing in a retail environment using computer vision |
| US20220343743A1 (en) * | 2019-08-22 | 2022-10-27 | Nec Corporation | Display control apparatus, display control method, and program |
| US20230014580A1 (en) * | 2020-02-13 | 2023-01-19 | Guozhen Zhu | Method, apparatus, and system for map reconstruction based on wireless tracking |
| US20230056742A1 (en) * | 2021-08-17 | 2023-02-23 | Shopper Scientist Llc | In-store computerized product promotion system with product prediction model that outputs a target product message based on products selected in a current shopping session |
| US20230087497A1 (en) * | 2021-09-22 | 2023-03-23 | Fortinet, Inc. | Systems and Methods for Incorporating Passive Wireless Monitoring With Video Surveillance |
| US11810067B2 (en) | 2019-12-31 | 2023-11-07 | Grabango Co. | Digitally managed shelf space marketplace |
Citations (232)
| Publication number | Priority date | Publication date | Assignee | Title |
|---|---|---|---|---|
| US4331973A (en) | 1980-10-21 | 1982-05-25 | Iri, Inc. | Panelist response scanning system |
| US4973952A (en) | 1987-09-21 | 1990-11-27 | Information Resources, Inc. | Shopping cart display system |
| US5138638A (en) | 1991-01-11 | 1992-08-11 | Tytronix Corporation | System for determining the number of shoppers in a retail store and for processing that information to produce data for store management |
| US5305390A (en) | 1991-01-11 | 1994-04-19 | Datatec Industries Inc. | Person and object recognition system |
| US5390107A (en) | 1993-04-28 | 1995-02-14 | Datatec Industries Inc. | Checkout lane alert system and method |
| US5401946A (en) | 1991-07-22 | 1995-03-28 | Weinblatt; Lee S. | Technique for correlating purchasing behavior of a consumer to advertisements |
| US5465115A (en) | 1993-05-14 | 1995-11-07 | Rct Systems, Inc. | Video traffic monitor for retail establishments and the like |
| US5490060A (en) | 1988-02-29 | 1996-02-06 | Information Resources, Inc. | Passive data collection system for market research data |
| US5557513A (en) | 1993-04-28 | 1996-09-17 | Quadrix Corporation | Checkout lane alert system and method for stores having express checkout lanes |
| US5953055A (en) | 1996-08-08 | 1999-09-14 | Ncr Corporation | System and method for detecting and analyzing a queue |
| US5973732A (en) | 1997-02-19 | 1999-10-26 | Guthrie; Thomas C. | Object tracking system for monitoring a controlled space |
| US6061088A (en) | 1998-01-20 | 2000-05-09 | Ncr Corporation | System and method for multi-resolution background adaptation |
| EP1011060A1 (en) | 1998-12-18 | 2000-06-21 | BRAIN S.r.l. | Method for distributing personalized offers to holders of loyalty cards at the entrance of points of sale |
| US6141433A (en) | 1997-06-19 | 2000-10-31 | Ncr Corporation | System and method for segmenting image regions from a scene likely to represent particular objects in the scene |
| US6142876A (en) | 1997-08-22 | 2000-11-07 | Cumbers; Blake | Player tracking and identification system |
| US6185314B1 (en) | 1997-06-19 | 2001-02-06 | Ncr Corporation | System and method for matching image information to object model information |
| US6263088B1 (en) | 1997-06-19 | 2001-07-17 | Ncr Corporation | System and method for tracking movement of objects in a scene |
| US6295367B1 (en) | 1997-06-19 | 2001-09-25 | Emtera Corporation | System and method for tracking movement of objects in a scene using correspondence graphs |
| US20010027564A1 (en) | 1996-08-07 | 2001-10-04 | Information Resources, Inc. | Television distribution system for signal substitution |
| US20020016740A1 (en) | 1998-09-25 | 2002-02-07 | Nobuo Ogasawara | System and method for customer recognition using wireless identification and visual data transmission |
| US20030033190A1 (en) | 2001-05-09 | 2003-02-13 | Jerold Shan | On-line shopping conversion simulation module |
| US6560578B2 (en) | 1999-03-12 | 2003-05-06 | Expanse Networks, Inc. | Advertisement selection system supporting discretionary target market characteristics |
| US20030212596A1 (en) | 2002-05-13 | 2003-11-13 | Dipaolo William R. | Computer network for distribution of retail service/product promotions |
| US20040002897A1 (en) | 2002-06-27 | 2004-01-01 | Vishik Claire Svetlana | In-store (on premises) targeted marketing services for wireless customers |
| WO2004027556A2 (en) | 2002-09-20 | 2004-04-01 | Sorensen Associates Inc. | Shopping environment analysis system and method with normalization |
| US20040176995A1 (en) | 1999-10-26 | 2004-09-09 | Fusz Eugene August | Method and apparatus for anonymous data profiling |
| US6826554B2 (en) | 1998-06-29 | 2004-11-30 | Fujitsu Limited | System and method for adaptively configuring a shopping display in response to a recognized customer profile |
| US20040249848A1 (en) | 2003-06-06 | 2004-12-09 | Carlbom Ingrid Birgitta | Method and apparatus for intelligent and automatic alert management using multimedia database system |
| US20050021397A1 (en) | 2003-07-22 | 2005-01-27 | Cui Yingwei Claire | Content-targeted advertising using collected user behavior data |
| US20050096997A1 (en) | 2003-10-31 | 2005-05-05 | Vivek Jain | Targeting shoppers in an online shopping environment |
| US20050117778A1 (en) | 2003-12-01 | 2005-06-02 | Crabtree Ralph N. | Systems and methods for determining if objects are in a queue |
| US6904408B1 (en) | 2000-10-19 | 2005-06-07 | Mccarthy John | Bionet method, system and personalized web content manager responsive to browser viewers' psychological preferences, behavioral responses and physiological stress indicators |
| US20050187972A1 (en) | 2004-02-20 | 2005-08-25 | Kruger Michael W. | System and method for analyzing and correcting retail data |
| US20050246196A1 (en) | 2004-04-28 | 2005-11-03 | Didier Frantz | Real-time behavior monitoring system |
| US20060010028A1 (en) | 2003-11-14 | 2006-01-12 | Herb Sorensen | Video shopper tracking system and method |
| WO2006029681A2 (en) | 2004-09-17 | 2006-03-23 | Accenture Global Services Gmbh | Personalized marketing architecture |
| US20060069585A1 (en) | 2004-09-30 | 2006-03-30 | Paul Springfield | Method for performing retail sales analysis |
| US20060080265A1 (en) | 2004-10-13 | 2006-04-13 | Mark Hinds | Method for pricing products in a retail store |
| US20060085255A1 (en) | 2004-09-27 | 2006-04-20 | Hunter Hastings | System, method and apparatus for modeling and utilizing metrics, processes and technology in marketing applications |
| US20060089837A1 (en) | 2003-04-09 | 2006-04-27 | Roy Adar | Apparatus, system and method for dispute resolution, regulation compliance and quality management in financial institutions |
| US20060229996A1 (en) | 2005-04-11 | 2006-10-12 | I4 Licensing Llc | Consumer processing system and method |
| US20070015569A1 (en) | 2005-06-28 | 2007-01-18 | Harrah's Operating Co., Inc. | Real-time marketing at gaming machines |
| WO2007030168A1 (en) | 2005-09-02 | 2007-03-15 | Intellivid Corporation | Object tracking and alerts |
| US7225414B1 (en) | 2002-09-10 | 2007-05-29 | Videomining Corporation | Method and system for virtual touch entertainment |
| US7227976B1 (en) | 2002-07-08 | 2007-06-05 | Videomining Corporation | Method and system for real-time facial image enhancement |
| US20070138268A1 (en) | 2005-10-03 | 2007-06-21 | Tuchman Kenneth D | Virtual Retail Assistant |
| US7240027B2 (en) | 2000-04-07 | 2007-07-03 | The Procter & Gamble Company | Method and apparatus for monitoring the flow of items through a store or warehouse |
| US20070156515A1 (en) | 2005-12-29 | 2007-07-05 | Kimberly-Clark Worldwide, Inc. | Method for integrating attitudinal and behavioral data for marketing consumer products |
| US7274803B1 (en) | 2002-04-02 | 2007-09-25 | Videomining Corporation | Method and system for detecting conscious hand movement patterns and computer-generated visual feedback for facilitating human-computer interaction |
| US20070239871A1 (en) | 2006-04-11 | 2007-10-11 | Mike Kaskie | System and method for transitioning to new data services |
| US7283650B1 (en) | 2002-11-27 | 2007-10-16 | Video Mining Corporation | Method and system for printing of automatically captured facial images augmented with promotional content |
| US20070282681A1 (en) | 2006-05-31 | 2007-12-06 | Eric Shubert | Method of obtaining and using anonymous consumer purchase and demographic data |
| US20080004892A1 (en) | 2006-06-30 | 2008-01-03 | Jerry Zucker | Biometric aid for customer relations |
| US7317812B1 (en) | 2002-11-15 | 2008-01-08 | Videomining Corporation | Method and apparatus for robustly tracking objects |
| US7319479B1 (en) | 2000-09-22 | 2008-01-15 | Brickstream Corporation | System and method for multi-camera linking and analysis |
| US7319779B1 (en) | 2003-12-08 | 2008-01-15 | Videomining Corporation | Classification of humans into multiple age categories from digital images |
| US20080042836A1 (en) | 2006-08-16 | 2008-02-21 | James Christopher | System and method for tracking shopping behavior |
| US7360251B2 (en) | 2000-06-30 | 2008-04-15 | Hitwise Pty, Ltd. | Method and system for monitoring online behavior at a remote site and creating online behavior profiles |
| US7357717B1 (en) | 1997-08-22 | 2008-04-15 | Biometric Recognition, Llc | Passive biometric customer identification and tracking system |
| US20080109397A1 (en) | 2002-07-29 | 2008-05-08 | Rajeev Sharma | Automatic detection and aggregation of demographics and behavior of people |
| US20080159634A1 (en) | 2006-12-30 | 2008-07-03 | Rajeev Sharma | Method and system for automatically analyzing categories in a physical space based on the visual characterization of people |
| US20080172282A1 (en) | 2007-01-15 | 2008-07-17 | Shoppertrak Rct Corporation | Traffic based labor allocation method and system |
| US7415510B1 (en) | 1999-03-19 | 2008-08-19 | Shoppertrack Rct Corporation | System for indexing pedestrian traffic |
| US20080201198A1 (en) | 2004-09-02 | 2008-08-21 | Louviere Jordan J | Method, System and Computer Program Product for Measuring and Tracking Brand Equity |
| US20080249870A1 (en) * | 2007-04-03 | 2008-10-09 | Robert Lee Angell | Method and apparatus for decision tree based marketing and selling for a retail store |
| US20080263065A1 (en) | 2007-01-26 | 2008-10-23 | John Randall West | Data perturbation of non-unique values |
| US20080263000A1 (en) | 2007-01-26 | 2008-10-23 | John Randall West | Utilizing aggregated data |
| US20080270363A1 (en) | 2007-01-26 | 2008-10-30 | Herbert Dennis Hunt | Cluster processing of a core information matrix |
| US20080288522A1 (en) | 2007-01-26 | 2008-11-20 | Herbert Dennis Hunt | Creating and storing a data field alteration datum using an analytic platform |
| US20080288538A1 (en) | 2007-01-26 | 2008-11-20 | Herbert Dennis Hunt | Dimensional compression using an analytic platform |
| US20080288209A1 (en) | 2007-01-26 | 2008-11-20 | Herbert Dennis Hunt | Flexible projection facility within an analytic platform |
| US20080288889A1 (en) | 2004-02-20 | 2008-11-20 | Herbert Dennis Hunt | Data visualization application |
| US20080294583A1 (en) | 2007-01-26 | 2008-11-27 | Herbert Dennis Hunt | Similarity matching of a competitor's products |
| US20080294996A1 (en) | 2007-01-31 | 2008-11-27 | Herbert Dennis Hunt | Customized retailer portal within an analytic platform |
| US20080294372A1 (en) | 2007-01-26 | 2008-11-27 | Herbert Dennis Hunt | Projection facility within an analytic platform |
| US20080319829A1 (en) | 2004-02-20 | 2008-12-25 | Herbert Dennis Hunt | Bias reduction using data fusion of household panel data and transaction data |
| US20080318591A1 (en) | 2004-07-30 | 2008-12-25 | Path Intelligence Limited | Monitoring the Movement of Mobile Communication Devices |
| US20090006788A1 (en) | 2007-01-26 | 2009-01-01 | Herbert Dennis Hunt | Associating a flexible data hierarchy with an availability condition in a granting matrix |
| US20090006490A1 (en) | 2004-02-20 | 2009-01-01 | Herbert Dennis Hunt | Attribute segments and data table bias reduction |
| US20090006309A1 (en) | 2007-01-26 | 2009-01-01 | Herbert Dennis Hunt | Cluster processing of an aggregated dataset |
| US20090010490A1 (en) | 2007-07-03 | 2009-01-08 | Shoppertrak Rct Corporation | System and process for detecting, tracking and counting human objects of interest |
| US20090012971A1 (en) | 2007-01-26 | 2009-01-08 | Herbert Dennis Hunt | Similarity matching of products based on multiple classification schemes |
| US20090018996A1 (en) | 2007-01-26 | 2009-01-15 | Herbert Dennis Hunt | Cross-category view of a dataset using an analytic platform |
| US20090037412A1 (en) | 2007-07-02 | 2009-02-05 | Kristina Butvydas Bard | Qualitative search engine based on factors of consumer trust specification |
| US20090046201A1 (en) | 2007-08-14 | 2009-02-19 | Shoppertrak Rct Corporation | Holding apparatus for a camera lens |
| US7505621B1 (en) | 2003-10-24 | 2009-03-17 | Videomining Corporation | Demographic classification using image components |
| US7530489B2 (en) | 2003-09-19 | 2009-05-12 | International Business Machines Corporation | Using radio frequency identification with customer loyalty cards to detect and/or prevent theft and shoplifting |
| US20090158309A1 (en) | 2007-12-12 | 2009-06-18 | Hankyu Moon | Method and system for media audience measurement and spatial extrapolation based on site, display, crowd, and viewership characterization |
| US7551755B1 (en) | 2004-01-22 | 2009-06-23 | Fotonation Vision Limited | Classification and organization of consumer digital images using workflow, and face detection and recognition |
| US20090198507A1 (en) | 2008-02-05 | 2009-08-06 | Jazel, Llc | Behavior-based web page generation marketing system |
| US7587068B1 (en) | 2004-01-22 | 2009-09-08 | Fotonation Vision Limited | Classification database for consumer digital images |
| US7590261B1 (en) | 2003-07-31 | 2009-09-15 | Videomining Corporation | Method and system for event detection by analysis of linear feature occlusion |
| US20100020172A1 (en) | 2008-07-25 | 2010-01-28 | International Business Machines Corporation | Performing real-time analytics using a network processing solution able to directly ingest ip camera video streams |
| US7711155B1 (en) | 2003-04-14 | 2010-05-04 | Videomining Corporation | Method and system for enhancing three dimensional face modeling using demographic classification |
| US7742623B1 (en) | 2008-08-04 | 2010-06-22 | Videomining Corporation | Method and system for estimating gaze target, gaze sequence, and gaze map from video |
| US7805333B2 (en) | 2003-02-14 | 2010-09-28 | Ds-Iq, Inc. | Techniques for using loyalty cards and redeeming accumulated value |
| US7848548B1 (en) | 2007-06-11 | 2010-12-07 | Videomining Corporation | Method and system for robust demographic classification using pose independent model from sequence of face images |
| US20100331010A1 (en) * | 2009-06-30 | 2010-12-30 | Qualcomm Incorporated | Trajectory-Based Location Determination |
| WO2011005072A2 (en) | 2009-07-09 | 2011-01-13 | Mimos Bhd. | Personalized shopping list recommendation based on shopping behavior |
| US20110022312A1 (en) | 2009-07-23 | 2011-01-27 | Fmr Llc | Generating and Tracking Activity Patterns for Mobile Devices |
| US7903141B1 (en) | 2005-02-15 | 2011-03-08 | Videomining Corporation | Method and system for event detection by multi-scale image invariant analysis |
| US7904477B2 (en) | 2006-12-13 | 2011-03-08 | Videomining Corporation | Object verification enabled network (OVEN) |
| US7911482B1 (en) | 2006-01-06 | 2011-03-22 | Videomining Corporation | Method and system for efficient annotation of object trajectories in image sequences |
| US7912246B1 (en) | 2002-10-28 | 2011-03-22 | Videomining Corporation | Method and system for determining the age category of people based on facial images |
| US7921036B1 (en) | 2002-04-30 | 2011-04-05 | Videomining Corporation | Method and system for dynamically targeting content based on automatic demographics and behavior analysis |
| US7930204B1 (en) | 2006-07-25 | 2011-04-19 | Videomining Corporation | Method and system for narrowcasting based on automatic analysis of customer behavior in a retail store |
| US20110093324A1 (en) | 2009-10-19 | 2011-04-21 | Visa U.S.A. Inc. | Systems and Methods to Provide Intelligent Analytics to Cardholders and Merchants |
| US20110125551A1 (en) | 2009-11-24 | 2011-05-26 | Mark Peiser | Method and System for In-Store Media Measurement |
| US7957565B1 (en) | 2007-04-05 | 2011-06-07 | Videomining Corporation | Method and system for recognizing employees in a physical space based on automatic behavior analysis |
| US7974889B2 (en) | 2007-10-19 | 2011-07-05 | Raimbeault Sean M | Social networking interactive shopping system |
| US7974869B1 (en) | 2006-09-20 | 2011-07-05 | Videomining Corporation | Method and system for automatically measuring and forecasting the behavioral characterization of customers to help customize programming contents in a media network |
| US20110169917A1 (en) | 2010-01-11 | 2011-07-14 | Shoppertrak Rct Corporation | System And Process For Detecting, Tracking And Counting Human Objects of Interest |
| US7987111B1 (en) | 2006-10-30 | 2011-07-26 | Videomining Corporation | Method and system for characterizing physical retail spaces by determining the demographic composition of people in the physical retail spaces utilizing video image analysis |
| US8010402B1 (en) | 2002-08-12 | 2011-08-30 | Videomining Corporation | Method for augmenting transaction data with visually extracted demographics of people using computer vision |
| US8009863B1 (en) | 2008-06-30 | 2011-08-30 | Videomining Corporation | Method and system for analyzing shopping behavior using multiple sensor tracking |
| US8027521B1 (en) | 2008-03-25 | 2011-09-27 | Videomining Corporation | Method and system for robust human gender recognition using facial feature localization |
| US8027864B2 (en) | 2006-11-22 | 2011-09-27 | Proclivity Systems, Inc. | System and method for providing e-commerce consumer-based behavioral target marketing reports |
| US20110238471A1 (en) | 2010-03-24 | 2011-09-29 | John Richard Trzcinski | Generic Universal Rewards Loyalty Card |
| US20110246284A1 (en) | 2010-04-01 | 2011-10-06 | Gary Chaikin | Systems and Methods for Adding Functionality to Merchant Sales and Facilitating Data Collection. |
| US8095589B2 (en) | 2002-03-07 | 2012-01-10 | Compete, Inc. | Clickstream analysis methods and systems |
| US8098888B1 (en) | 2008-01-28 | 2012-01-17 | Videomining Corporation | Method and system for automatic analysis of the trip of people in a retail space using multiple cameras |
| US20120041767A1 (en) | 2010-08-11 | 2012-02-16 | Nike Inc. | Athletic Activity User Experience and Environment |
| US20120078700A1 (en) | 2000-04-03 | 2012-03-29 | Pugliese Iii Anthony V | System and Method for Displaying and Selling Goods and Services in a Retail Environment Employing Electronic Shopper Aids |
| US8175908B1 (en) | 2003-09-04 | 2012-05-08 | Jpmorgan Chase Bank, N.A. | Systems and methods for constructing and utilizing a merchant database derived from customer purchase transactions data |
| WO2012061574A2 (en) | 2010-11-05 | 2012-05-10 | D.L. Ryan Companies, Ltd. | Shopper tracking system and method |
| US20120150587A1 (en) | 2010-11-19 | 2012-06-14 | Kruger Michael W | Data integration and analysis |
| US20120163206A1 (en) | 2010-08-24 | 2012-06-28 | Kenneth Man-Kin Leung | Method and apparatus for analysis of user traffic within a predefined area |
| US8219438B1 (en) | 2008-06-30 | 2012-07-10 | Videomining Corporation | Method and system for measuring shopper response to products based on behavior and facial expression |
| US8254633B1 (en) | 2009-04-21 | 2012-08-28 | Videomining Corporation | Method and system for finding correspondence between face camera views and behavior camera views |
| US20120239504A1 (en) | 2011-03-15 | 2012-09-20 | Microsoft Corporation | Virtual Shopping Assistance |
| US20120254718A1 (en) | 2011-03-30 | 2012-10-04 | Narayan Madhavan Nayar | View-independent annotation of commercial data |
| US8295597B1 (en) | 2007-03-14 | 2012-10-23 | Videomining Corporation | Method and system for segmenting people in a physical space based on automatic behavior analysis |
| US8325982B1 (en) | 2009-07-23 | 2012-12-04 | Videomining Corporation | Method and system for detecting and tracking shopping carts from videos |
| US20120316936A1 (en) | 2011-06-07 | 2012-12-13 | Philip Clifford Jacobs | Integrated loyalty program infrastructure |
| US20120323682A1 (en) | 2011-06-15 | 2012-12-20 | Ebay Inc. | Systems and methods for behavioral modeling to optimize shopping cart conversion |
| US8340685B2 (en) | 2010-08-25 | 2012-12-25 | The Nielsen Company (Us), Llc | Methods, systems and apparatus to generate market segmentation data with anonymous location data |
| US20120331561A1 (en) | 2011-06-22 | 2012-12-27 | Broadstone Andrew J | Method of and Systems for Privacy Preserving Mobile Demographic Measurement of Individuals, Groups and Locations Over Time and Space |
| US20130014153A1 (en) | 2011-07-06 | 2013-01-10 | Manish Bhatia | Media content based advertising survey platform apparatuses and systems |
| US20130014485A1 (en) | 2011-07-17 | 2013-01-17 | Peter Hoang Nguyen | Apparatus for propulsion |
| US20130041837A1 (en) | 2011-08-12 | 2013-02-14 | Accenture Global Services Limited | Online Data And In-Store Data Analytical System |
| US8379937B1 (en) | 2008-09-29 | 2013-02-19 | Videomining Corporation | Method and system for robust human ethnicity recognition using image feature-based probabilistic graphical models |
| US8380558B1 (en) | 2006-12-21 | 2013-02-19 | Videomining Corporation | Method and system for analyzing shopping behavior in a store by associating RFID data with video-based behavior and segmentation data |
| US20130063556A1 (en) | 2011-09-08 | 2013-03-14 | Prism Skylabs, Inc. | Extracting depth information from video from a single camera |
| US8401248B1 (en) | 2008-12-30 | 2013-03-19 | Videomining Corporation | Method and system for measuring emotional and attentional response to dynamic digital media content |
| US8412656B1 (en) * | 2009-08-13 | 2013-04-02 | Videomining Corporation | Method and system for building a consumer decision tree in a hierarchical decision tree structure based on in-store behavior analysis |
| US20130091001A1 (en) | 2010-10-26 | 2013-04-11 | Baynote, Inc. | Behavior-Based Online Deal Transactions |
| US8433612B1 (en) | 2008-03-27 | 2013-04-30 | Videomining Corporation | Method and system for measuring packaging effectiveness using video-based analysis of in-store shopper response |
| US20130110676A1 (en) | 2011-10-31 | 2013-05-02 | Ncr Corporation | Techniques for customer identification with automated transactions |
| US8452639B2 (en) | 2006-01-20 | 2013-05-28 | International Business Machines Corporation | System and method for marketing mix optimization for brand equity management |
| US20130138498A1 (en) | 2011-11-30 | 2013-05-30 | International Business Machines Corporation | Flash sale |
| US8457466B1 (en) | 2008-09-29 | 2013-06-04 | Videomining Corporation | Videore: method and system for storing videos from multiple cameras for behavior re-mining |
| US8462996B2 (en) | 2008-05-19 | 2013-06-11 | Videomining Corporation | Method and system for measuring human response to visual stimulus based on changes in facial expression |
| US20130151311A1 (en) | 2011-11-15 | 2013-06-13 | Bradley Hopkins Smallwood | Prediction of consumer behavior data sets using panel data |
| US20130182114A1 (en) | 2012-01-17 | 2013-07-18 | Objectvideo, Inc. | System and method for monitoring a retail environment using video content analysis with depth sensing |
| US20130184887A1 (en) | 2012-01-13 | 2013-07-18 | Shoppertrak Rct Corporation | System and method for managing energy |
| US20130185645A1 (en) | 2012-01-18 | 2013-07-18 | International Business Machines Corporation | Determining repeat website users via browser uniqueness tracking |
| US20130197987A1 (en) | 2012-01-26 | 2013-08-01 | Five Stars Loyalty, Inc. | Virtual integration of a loyalty card with a point of sale system |
| US20130218677A1 (en) | 2012-02-22 | 2013-08-22 | Oracle International Corporation | Generating promotions to a targeted audience |
| US8521590B1 (en) | 2002-08-22 | 2013-08-27 | Denise Larson Hanusch | Systems and methods for assessing consumers' product brand loyalty |
| US8520906B1 (en) | 2007-09-24 | 2013-08-27 | Videomining Corporation | Method and system for age estimation based on relative ages of pairwise facial images of people |
| US20130226539A1 (en) | 2012-02-29 | 2013-08-29 | BVI Networks, Inc. | Method and system for statistical analysis of customer movement and integration with other data |
| US20130222599A1 (en) | 2012-02-29 | 2013-08-29 | George Shaw | Method and system for full path analysis |
| US20130225199A1 (en) | 2012-02-29 | 2013-08-29 | RetailNext, Inc. | Method and system for wifi-based identification of person tracks |
| US20130231180A1 (en) | 2005-09-12 | 2013-09-05 | Bally Gaming, Inc. | Networked gaming system including anonymous player biometric identification and tracking |
| US20130271598A1 (en) | 2008-07-25 | 2013-10-17 | International Business Machines Corporation | Network based real-time analytics of raw video streams |
| US8570376B1 (en) | 2008-11-19 | 2013-10-29 | Videomining Corporation | Method and system for efficient sampling of videos using spatiotemporal constraints for statistical behavior analysis |
| US8577705B1 (en) | 2008-12-30 | 2013-11-05 | Videomining Corporation | Method and system for rating the role of a product category in the performance of a store area |
| US20130293355A1 (en) | 2006-08-16 | 2013-11-07 | James Christopher | System and method for tracking shopping behavior |
| US20130311332A1 (en) | 2011-11-17 | 2013-11-21 | Sony Corporation | Customized marketing |
| US20130317916A1 (en) * | 2011-12-29 | 2013-11-28 | Intel Corporation | Location based technology for smart shopping services |
| US20130317950A1 (en) | 2012-05-23 | 2013-11-28 | International Business Machines Corporation | Customizing a three dimensional virtual store based on user shopping behavior |
| US8597111B2 (en) | 2011-06-09 | 2013-12-03 | Igt | Anonymous player tracking with mobile devices |
| US8620718B2 (en) | 2012-04-06 | 2013-12-31 | Unmetric Inc. | Industry specific brand benchmarking system based on social media strength of a brand |
| US20140019178A1 (en) | 2012-07-12 | 2014-01-16 | Natalie Kortum | Brand Health Measurement - Investment Optimization Model |
| US20140019300A1 (en) | 2012-07-16 | 2014-01-16 | The Sinclair Group, Inc. | Consumer interface device system and method for in-store navigation |
| US20140031923A1 (en) | 2012-07-25 | 2014-01-30 | Medtronic Vascular Galway Limited | Trans-Aortic Surgical Syringe-Type Device for Deployment of a Prosthetic Valve |
| US8660895B1 (en) | 2007-06-14 | 2014-02-25 | Videomining Corporation | Method and system for rating of out-of-home digital media network based on automatic measurement |
| US8665333B1 (en) | 2007-01-30 | 2014-03-04 | Videomining Corporation | Method and system for optimizing the observation and annotation of complex human behavior from video sources |
| US20140079282A1 (en) | 2011-09-23 | 2014-03-20 | Shoppertrak Rct Corporation | System And Method For Detecting, Tracking And Counting Human Objects Of Interest Using A Counting System And A Data Capture Device |
| US20140079297A1 (en) | 2012-09-17 | 2014-03-20 | Saied Tadayon | Application of Z-Webs and Z-factors to Analytics, Search Engine, Learning, Recognition, Natural Language, and Other Utilities |
| US20140095260A1 (en) | 2012-10-01 | 2014-04-03 | Cadio, Inc. | Tracking brand strength using consumer location data and consumer survey responses |
| US8694792B2 (en) | 2007-02-16 | 2014-04-08 | Honeywell International Inc. | Biometric based repeat visitor recognition system and method |
| US8706544B1 (en) | 2006-05-25 | 2014-04-22 | Videomining Corporation | Method and system for automatically measuring and forecasting the demographic characterization of customers to help customize programming contents in a media network |
| CA2823895A1 (en) | 2012-11-01 | 2014-05-01 | Boldstreet Inc. | System and method for wireless device detection, recognition and visit profiling |
| US8714457B2 (en) | 2003-04-09 | 2014-05-06 | Visible Assets, Inc. | Networked loyalty cards |
| US8739254B2 (en) | 2007-02-23 | 2014-05-27 | At&T Intellectual Property I, L.P. | Methods, systems, and products for identity verification |
| US20140164179A1 (en) | 2012-12-07 | 2014-06-12 | David Geisinger | System and method to optimize in-store customer experience |
| US20140172557A1 (en) | 2012-12-19 | 2014-06-19 | FootTrafficeker LLC | Interactive display system |
| US20140172627A1 (en) | 2009-04-20 | 2014-06-19 | 4-Tell, Inc | Next Generation Improvements in Recommendation Systems |
| US20140195302A1 (en) | 2013-01-10 | 2014-07-10 | Oracle International Corporation | Guided walkthrough provider |
| US20140195380A1 (en) | 2013-01-09 | 2014-07-10 | Nearbuy Systems, Inc. | Wireless Analytics in Physical Spaces |
| US8781502B1 (en) | 2013-02-01 | 2014-07-15 | Swirl Networks, Inc. | Systems and methods for display of supplemental content responsive to location |
| US20140201126A1 (en) | 2012-09-15 | 2014-07-17 | Lotfi A. Zadeh | Methods and Systems for Applications for Z-numbers |
| US20140210621A1 (en) | 2013-01-31 | 2014-07-31 | Wal-Mart Stores, Inc. | Theft detection system |
| US20140222503A1 (en) | 2013-02-07 | 2014-08-07 | 24/7 Customer, Inc. | Dynamic prediction of online shopper's intent using a combination of prediction models |
| US8812344B1 (en) | 2009-06-29 | 2014-08-19 | Videomining Corporation | Method and system for determining the impact of crowding on retail performance |
| US20140233852A1 (en) | 2011-12-13 | 2014-08-21 | The Nielsen Company (Us), Llc | Detecting objects in images using color histograms |
| US8830030B2 (en) | 2007-05-16 | 2014-09-09 | Opentable, Inc. | Computer based guest monitoring and identification system and method |
| US20140258939A1 (en) | 2013-03-08 | 2014-09-11 | Information Resources, Inc. | Selection of hierarchically organized items |
| US20140253732A1 (en) | 2013-03-05 | 2014-09-11 | International Business Machines Corporation | Topology determination for non-overlapping camera network |
| US20140283136A1 (en) | 2013-03-13 | 2014-09-18 | Optio Labs, Inc. | Systems and methods for securing and locating computing devices |
| US20140278967A1 (en) | 2013-03-13 | 2014-09-18 | Hewlett-Packard Development Company, L.P. | Determining target customers during marketing |
| US20140285660A1 (en) * | 2010-08-18 | 2014-09-25 | Nearbuy Systems, Inc. | Target Localization Utilizing Wireless and Camera Sensor Fusion |
| US20140294231A1 (en) | 2013-03-28 | 2014-10-02 | International Business Machines Corporation | Automatically determining field of view overlap among multiple cameras |
| US20140351835A1 (en) | 2010-12-29 | 2014-11-27 | Comcast Cable Communications, Llc | System and method for measuring longitudinal video asset viewing at a second-by-second level to understand behavior of viewers as they interact with video asset viewing devices that access a computer system through a network |
| US20140358742A1 (en) | 2013-05-31 | 2014-12-04 | Wal-Mart Stores, Inc. | Systems And Methods For Mapping In-Store Transactions To Customer Profiles |
| US20140358661A1 (en) | 2013-05-28 | 2014-12-04 | vMobo, Inc. | Location and transaction-based multi-brand loyalty service |
| US20140358640A1 (en) | 2008-12-16 | 2014-12-04 | The Nielsen Company (Us), Llc | Methods and apparatus for associating media devices with a demographic composition of a geographic area |
| US8909542B2 (en) | 2011-05-13 | 2014-12-09 | Crowdtwist, Inc. | Systems and methods for managing brand loyalty |
| US20140379524A1 (en) | 2013-06-20 | 2014-12-25 | Dassault Systemes | Shopper Helper |
| US20140379480A1 (en) | 2013-04-25 | 2014-12-25 | Readme Systems, Inc. | Systems, methods, and devices for interactive marketing with attribution using proximity sensors |
| US20150006358A1 (en) | 2013-07-01 | 2015-01-01 | Mastercard International Incorporated | Merchant aggregation through cardholder brand loyalty |
| US8930134B2 (en) | 2012-06-12 | 2015-01-06 | Sears Brands, Llc | Systems and methods for high-precision indoor positioning, navigation and shopping behavior profiling |
| US20150019373A1 (en) | 2013-07-09 | 2015-01-15 | International Business Machines Corporation | Providing a consumer advocate recommendation utilizing historic purchasing data |
| WO2015010086A2 (en) | 2013-07-19 | 2015-01-22 | eyeQ Insights | System for monitoring and analyzing behavior and uses thereof |
| US20150058049A1 (en) | 2013-08-20 | 2015-02-26 | RetailNext, Inc. | Systems and methods for identifying and analyzing a customer queue |
| US20150078658A1 (en) | 2011-12-13 | 2015-03-19 | The Nielsen Company (Us), Llc | Image comparison using color histograms |
| US20150081704A1 (en) | 2010-06-30 | 2015-03-19 | The Nielsen Company (Us), Llc | Methods and apparatus to obtain anonymous audience measurement data from network server data for particular demographic and usage profiles |
| US9003488B2 (en) | 2007-06-06 | 2015-04-07 | Datavalet Technologies | System and method for remote device recognition at public hotspots |
| US20150106190A1 (en) | 2013-10-10 | 2015-04-16 | Information Resources, Inc. | Online campaign management |
| US20150154534A1 (en) | 2013-12-02 | 2015-06-04 | Information Resources, Inc. | Virtual product hierarchies |
| US20150199627A1 (en) | 2012-09-28 | 2015-07-16 | Sqi3 Solutions Limited | Method and apparatus for optimizing a multi-dimensional space |
| US9092797B2 (en) | 2010-09-22 | 2015-07-28 | The Nielsen Company (Us), Llc | Methods and apparatus to analyze and adjust demographic information |
| US9094322B2 (en) | 2013-05-02 | 2015-07-28 | Nomi Corporation | First party cookie system and method |
| US20150220999A1 (en) | 2009-01-21 | 2015-08-06 | Truaxis, Inc. | Method and system to dynamically adjust offer spend thresholds and personalize offer criteria specific to individual users |
| US20150220951A1 (en) | 2009-01-21 | 2015-08-06 | Truaxis, Inc. | Method and system for inferring an individual cardholder's demographic data from shopping behavior and external survey data using a bayesian network |
| US9104205B1 (en) * | 2014-01-22 | 2015-08-11 | Fred Caver | Automated return shopping cart |
| US9124778B1 (en) | 2012-08-29 | 2015-09-01 | Nomi Corporation | Apparatuses and methods for disparity-based tracking and analysis of objects in a region of interest |
| US20150269609A1 (en) | 2014-03-18 | 2015-09-24 | Staples, Inc. | Clickstream Purchase Prediction Using Hidden Markov Models |
| US20150310447A1 (en) | 2014-04-28 | 2015-10-29 | RetailNext, Inc. | Methods and systems for simulating agent behavior in a virtual environment |
| US20150363798A1 (en) | 2014-06-16 | 2015-12-17 | International Business Machines Corporation | Method, computer system and computer program for estimating purchase behavior of customer in store or across stores |
| US9740977B1 (en) * | 2009-05-29 | 2017-08-22 | Videomining Corporation | Method and system for recognizing the intentions of shoppers in retail aisles based on their trajectories |
-
2016
- 2016-02-23 US US15/051,629 patent/US10963893B1/en active Active
Patent Citations (322)
| Publication number | Priority date | Publication date | Assignee | Title |
|---|---|---|---|---|
| US4331973A (en) | 1980-10-21 | 1982-05-25 | Iri, Inc. | Panelist response scanning system |
| US4973952A (en) | 1987-09-21 | 1990-11-27 | Information Resources, Inc. | Shopping cart display system |
| US5490060A (en) | 1988-02-29 | 1996-02-06 | Information Resources, Inc. | Passive data collection system for market research data |
| US5138638A (en) | 1991-01-11 | 1992-08-11 | Tytronix Corporation | System for determining the number of shoppers in a retail store and for processing that information to produce data for store management |
| US5305390A (en) | 1991-01-11 | 1994-04-19 | Datatec Industries Inc. | Person and object recognition system |
| US5401946A (en) | 1991-07-22 | 1995-03-28 | Weinblatt; Lee S. | Technique for correlating purchasing behavior of a consumer to advertisements |
| US5557513A (en) | 1993-04-28 | 1996-09-17 | Quadrix Corporation | Checkout lane alert system and method for stores having express checkout lanes |
| US5390107A (en) | 1993-04-28 | 1995-02-14 | Datatec Industries Inc. | Checkout lane alert system and method |
| US5465115A (en) | 1993-05-14 | 1995-11-07 | Rct Systems, Inc. | Video traffic monitor for retail establishments and the like |
| US6941573B1 (en) | 1996-08-07 | 2005-09-06 | Information Resources, Inc. | Television distribution system for signal substitution |
| US20010027564A1 (en) | 1996-08-07 | 2001-10-04 | Information Resources, Inc. | Television distribution system for signal substitution |
| US5953055A (en) | 1996-08-08 | 1999-09-14 | Ncr Corporation | System and method for detecting and analyzing a queue |
| US6195121B1 (en) | 1996-08-08 | 2001-02-27 | Ncr Corporation | System and method for detecting and analyzing a queue |
| US5973732A (en) | 1997-02-19 | 1999-10-26 | Guthrie; Thomas C. | Object tracking system for monitoring a controlled space |
| US6295367B1 (en) | 1997-06-19 | 2001-09-25 | Emtera Corporation | System and method for tracking movement of objects in a scene using correspondence graphs |
| US6185314B1 (en) | 1997-06-19 | 2001-02-06 | Ncr Corporation | System and method for matching image information to object model information |
| US6263088B1 (en) | 1997-06-19 | 2001-07-17 | Ncr Corporation | System and method for tracking movement of objects in a scene |
| US6141433A (en) | 1997-06-19 | 2000-10-31 | Ncr Corporation | System and method for segmenting image regions from a scene likely to represent particular objects in the scene |
| US6142876A (en) | 1997-08-22 | 2000-11-07 | Cumbers; Blake | Player tracking and identification system |
| US7357717B1 (en) | 1997-08-22 | 2008-04-15 | Biometric Recognition, Llc | Passive biometric customer identification and tracking system |
| US6061088A (en) | 1998-01-20 | 2000-05-09 | Ncr Corporation | System and method for multi-resolution background adaptation |
| US6826554B2 (en) | 1998-06-29 | 2004-11-30 | Fujitsu Limited | System and method for adaptively configuring a shopping display in response to a recognized customer profile |
| US20020016740A1 (en) | 1998-09-25 | 2002-02-07 | Nobuo Ogasawara | System and method for customer recognition using wireless identification and visual data transmission |
| EP1011060A1 (en) | 1998-12-18 | 2000-06-21 | BRAIN S.r.l. | Method for distributing personalized offers to holders of loyalty cards at the entrance of points of sale |
| US6560578B2 (en) | 1999-03-12 | 2003-05-06 | Expanse Networks, Inc. | Advertisement selection system supporting discretionary target market characteristics |
| US7415510B1 (en) | 1999-03-19 | 2008-08-19 | Shoppertrack Rct Corporation | System for indexing pedestrian traffic |
| US20040176995A1 (en) | 1999-10-26 | 2004-09-09 | Fusz Eugene August | Method and apparatus for anonymous data profiling |
| US20140372176A1 (en) | 1999-10-26 | 2014-12-18 | Fusz Digital Ltd. | Method and apparatus for anonymous data profiling |
| US20120078700A1 (en) | 2000-04-03 | 2012-03-29 | Pugliese Iii Anthony V | System and Method for Displaying and Selling Goods and Services in a Retail Environment Employing Electronic Shopper Aids |
| US7240027B2 (en) | 2000-04-07 | 2007-07-03 | The Procter & Gamble Company | Method and apparatus for monitoring the flow of items through a store or warehouse |
| US7360251B2 (en) | 2000-06-30 | 2008-04-15 | Hitwise Pty, Ltd. | Method and system for monitoring online behavior at a remote site and creating online behavior profiles |
| US7319479B1 (en) | 2000-09-22 | 2008-01-15 | Brickstream Corporation | System and method for multi-camera linking and analysis |
| US20050288954A1 (en) | 2000-10-19 | 2005-12-29 | Mccarthy John | Method, system and personalized web content manager responsive to browser viewers' psychological preferences, behavioral responses and physiological stress indicators |
| US6904408B1 (en) | 2000-10-19 | 2005-06-07 | Mccarthy John | Bionet method, system and personalized web content manager responsive to browser viewers' psychological preferences, behavioral responses and physiological stress indicators |
| US20060293921A1 (en) | 2000-10-19 | 2006-12-28 | Mccarthy John | Input device for web content manager responsive to browser viewers' psychological preferences, behavioral responses and physiological stress indicators |
| US20030033190A1 (en) | 2001-05-09 | 2003-02-13 | Jerold Shan | On-line shopping conversion simulation module |
| US8095589B2 (en) | 2002-03-07 | 2012-01-10 | Compete, Inc. | Clickstream analysis methods and systems |
| US7274803B1 (en) | 2002-04-02 | 2007-09-25 | Videomining Corporation | Method and system for detecting conscious hand movement patterns and computer-generated visual feedback for facilitating human-computer interaction |
| US7921036B1 (en) | 2002-04-30 | 2011-04-05 | Videomining Corporation | Method and system for dynamically targeting content based on automatic demographics and behavior analysis |
| US20030212596A1 (en) | 2002-05-13 | 2003-11-13 | Dipaolo William R. | Computer network for distribution of retail service/product promotions |
| US20040002897A1 (en) | 2002-06-27 | 2004-01-01 | Vishik Claire Svetlana | In-store (on premises) targeted marketing services for wireless customers |
| US7227976B1 (en) | 2002-07-08 | 2007-06-05 | Videomining Corporation | Method and system for real-time facial image enhancement |
| US20080109397A1 (en) | 2002-07-29 | 2008-05-08 | Rajeev Sharma | Automatic detection and aggregation of demographics and behavior of people |
| US8351647B2 (en) | 2002-07-29 | 2013-01-08 | Videomining Corporation | Automatic detection and aggregation of demographics and behavior of people |
| US8010402B1 (en) | 2002-08-12 | 2011-08-30 | Videomining Corporation | Method for augmenting transaction data with visually extracted demographics of people using computer vision |
| US8521590B1 (en) | 2002-08-22 | 2013-08-27 | Denise Larson Hanusch | Systems and methods for assessing consumers' product brand loyalty |
| US7225414B1 (en) | 2002-09-10 | 2007-05-29 | Videomining Corporation | Method and system for virtual touch entertainment |
| WO2004027556A2 (en) | 2002-09-20 | 2004-04-01 | Sorensen Associates Inc. | Shopping environment analysis system and method with normalization |
| US20040111454A1 (en) | 2002-09-20 | 2004-06-10 | Herb Sorensen | Shopping environment analysis system and method with normalization |
| US7606728B2 (en) | 2002-09-20 | 2009-10-20 | Sorensen Associates Inc. | Shopping environment analysis system and method with normalization |
| US7912246B1 (en) | 2002-10-28 | 2011-03-22 | Videomining Corporation | Method and system for determining the age category of people based on facial images |
| US7317812B1 (en) | 2002-11-15 | 2008-01-08 | Videomining Corporation | Method and apparatus for robustly tracking objects |
| US7283650B1 (en) | 2002-11-27 | 2007-10-16 | Video Mining Corporation | Method and system for printing of automatically captured facial images augmented with promotional content |
| US7805333B2 (en) | 2003-02-14 | 2010-09-28 | Ds-Iq, Inc. | Techniques for using loyalty cards and redeeming accumulated value |
| US8714457B2 (en) | 2003-04-09 | 2014-05-06 | Visible Assets, Inc. | Networked loyalty cards |
| US20060089837A1 (en) | 2003-04-09 | 2006-04-27 | Roy Adar | Apparatus, system and method for dispute resolution, regulation compliance and quality management in financial institutions |
| US7711155B1 (en) | 2003-04-14 | 2010-05-04 | Videomining Corporation | Method and system for enhancing three dimensional face modeling using demographic classification |
| US20040249848A1 (en) | 2003-06-06 | 2004-12-09 | Carlbom Ingrid Birgitta | Method and apparatus for intelligent and automatic alert management using multimedia database system |
| US20050021397A1 (en) | 2003-07-22 | 2005-01-27 | Cui Yingwei Claire | Content-targeted advertising using collected user behavior data |
| US7590261B1 (en) | 2003-07-31 | 2009-09-15 | Videomining Corporation | Method and system for event detection by analysis of linear feature occlusion |
| US8175908B1 (en) | 2003-09-04 | 2012-05-08 | Jpmorgan Chase Bank, N.A. | Systems and methods for constructing and utilizing a merchant database derived from customer purchase transactions data |
| US7530489B2 (en) | 2003-09-19 | 2009-05-12 | International Business Machines Corporation | Using radio frequency identification with customer loyalty cards to detect and/or prevent theft and shoplifting |
| US7505621B1 (en) | 2003-10-24 | 2009-03-17 | Videomining Corporation | Demographic classification using image components |
| US20050096997A1 (en) | 2003-10-31 | 2005-05-05 | Vivek Jain | Targeting shoppers in an online shopping environment |
| US20060010028A1 (en) | 2003-11-14 | 2006-01-12 | Herb Sorensen | Video shopper tracking system and method |
| US20090097706A1 (en) | 2003-12-01 | 2009-04-16 | Crabtree Ralph N | Systems and methods for determining if objects are in a queue |
| US7171024B2 (en) | 2003-12-01 | 2007-01-30 | Brickstream Corporation | Systems and methods for determining if objects are in a queue |
| US20050117778A1 (en) | 2003-12-01 | 2005-06-02 | Crabtree Ralph N. | Systems and methods for determining if objects are in a queue |
| US7400745B2 (en) | 2003-12-01 | 2008-07-15 | Brickstream Corporation | Systems and methods for determining if objects are in a queue |
| US7702132B2 (en) | 2003-12-01 | 2010-04-20 | Brickstream Corporation | Systems and methods for determining if objects are in a queue |
| US20070122002A1 (en) | 2003-12-01 | 2007-05-31 | Crabtree Ralph N | Systems and Methods for Determining if Objects are in a Queue |
| US7319779B1 (en) | 2003-12-08 | 2008-01-15 | Videomining Corporation | Classification of humans into multiple age categories from digital images |
| US7551755B1 (en) | 2004-01-22 | 2009-06-23 | Fotonation Vision Limited | Classification and organization of consumer digital images using workflow, and face detection and recognition |
| US7587068B1 (en) | 2004-01-22 | 2009-09-08 | Fotonation Vision Limited | Classification database for consumer digital images |
| US20080319829A1 (en) | 2004-02-20 | 2008-12-25 | Herbert Dennis Hunt | Bias reduction using data fusion of household panel data and transaction data |
| US7873529B2 (en) | 2004-02-20 | 2011-01-18 | Symphonyiri Group, Inc. | System and method for analyzing and correcting retail data |
| US20050187972A1 (en) | 2004-02-20 | 2005-08-25 | Kruger Michael W. | System and method for analyzing and correcting retail data |
| US20090006490A1 (en) | 2004-02-20 | 2009-01-01 | Herbert Dennis Hunt | Attribute segments and data table bias reduction |
| US20080288889A1 (en) | 2004-02-20 | 2008-11-20 | Herbert Dennis Hunt | Data visualization application |
| US7949639B2 (en) | 2004-02-20 | 2011-05-24 | Symphonyiri Group, Inc. | Attribute segments and data table bias reduction |
| US20050246196A1 (en) | 2004-04-28 | 2005-11-03 | Didier Frantz | Real-time behavior monitoring system |
| US9140773B2 (en) | 2004-07-30 | 2015-09-22 | Path Intelligence Limited | Monitoring the movement of mobile communication devices |
| US20080318591A1 (en) | 2004-07-30 | 2008-12-25 | Path Intelligence Limited | Monitoring the Movement of Mobile Communication Devices |
| US20080201198A1 (en) | 2004-09-02 | 2008-08-21 | Louviere Jordan J | Method, System and Computer Program Product for Measuring and Tracking Brand Equity |
| US7925549B2 (en) | 2004-09-17 | 2011-04-12 | Accenture Global Services Limited | Personalized marketing architecture |
| US20060074769A1 (en) | 2004-09-17 | 2006-04-06 | Looney Harold F | Personalized marketing architecture |
| WO2006029681A2 (en) | 2004-09-17 | 2006-03-23 | Accenture Global Services Gmbh | Personalized marketing architecture |
| US20060085255A1 (en) | 2004-09-27 | 2006-04-20 | Hunter Hastings | System, method and apparatus for modeling and utilizing metrics, processes and technology in marketing applications |
| US8214246B2 (en) | 2004-09-30 | 2012-07-03 | Dunnhumby Limited | Method for performing retail sales analysis |
| US20060069585A1 (en) | 2004-09-30 | 2006-03-30 | Paul Springfield | Method for performing retail sales analysis |
| US20060080265A1 (en) | 2004-10-13 | 2006-04-13 | Mark Hinds | Method for pricing products in a retail store |
| US7903141B1 (en) | 2005-02-15 | 2011-03-08 | Videomining Corporation | Method and system for event detection by multi-scale image invariant analysis |
| US20060229996A1 (en) | 2005-04-11 | 2006-10-12 | I4 Licensing Llc | Consumer processing system and method |
| US20110151967A1 (en) | 2005-06-28 | 2011-06-23 | David Norton | Real-Time Marketing at Gaming Machines |
| US7927213B2 (en) | 2005-06-28 | 2011-04-19 | Harrah's Operating Co., Inc. | Real-time marketing at gaming machines |
| US20070015569A1 (en) | 2005-06-28 | 2007-01-18 | Harrah's Operating Co., Inc. | Real-time marketing at gaming machines |
| US8210939B2 (en) | 2005-06-28 | 2012-07-03 | Caesars Entertainment Operating Company, Inc. | Real-time marketing at gaming machines |
| EP1943628A1 (en) | 2005-09-02 | 2008-07-16 | Intellivid Corporation | Object tracking and alerts |
| US20070182818A1 (en) | 2005-09-02 | 2007-08-09 | Buehler Christopher J | Object tracking and alerts |
| US9036028B2 (en) | 2005-09-02 | 2015-05-19 | Sensormatic Electronics, LLC | Object tracking and alerts |
| US20150244992A1 (en) | 2005-09-02 | 2015-08-27 | Sensormatic Electronics, LLC | Object tracking and alerts |
| WO2007030168A1 (en) | 2005-09-02 | 2007-03-15 | Intellivid Corporation | Object tracking and alerts |
| US20130231180A1 (en) | 2005-09-12 | 2013-09-05 | Bally Gaming, Inc. | Networked gaming system including anonymous player biometric identification and tracking |
| US7658327B2 (en) | 2005-10-03 | 2010-02-09 | Teletech Holdings, Inc. | Virtual retail assistant |
| US20070138268A1 (en) | 2005-10-03 | 2007-06-21 | Tuchman Kenneth D | Virtual Retail Assistant |
| US20070156515A1 (en) | 2005-12-29 | 2007-07-05 | Kimberly-Clark Worldwide, Inc. | Method for integrating attitudinal and behavioral data for marketing consumer products |
| US7911482B1 (en) | 2006-01-06 | 2011-03-22 | Videomining Corporation | Method and system for efficient annotation of object trajectories in image sequences |
| US8452639B2 (en) | 2006-01-20 | 2013-05-28 | International Business Machines Corporation | System and method for marketing mix optimization for brand equity management |
| US20070239871A1 (en) | 2006-04-11 | 2007-10-11 | Mike Kaskie | System and method for transitioning to new data services |
| US8706544B1 (en) | 2006-05-25 | 2014-04-22 | Videomining Corporation | Method and system for automatically measuring and forecasting the demographic characterization of customers to help customize programming contents in a media network |
| US20070282681A1 (en) | 2006-05-31 | 2007-12-06 | Eric Shubert | Method of obtaining and using anonymous consumer purchase and demographic data |
| US20080004892A1 (en) | 2006-06-30 | 2008-01-03 | Jerry Zucker | Biometric aid for customer relations |
| US7930204B1 (en) | 2006-07-25 | 2011-04-19 | Videomining Corporation | Method and system for narrowcasting based on automatic analysis of customer behavior in a retail store |
| US20080042836A1 (en) | 2006-08-16 | 2008-02-21 | James Christopher | System and method for tracking shopping behavior |
| US8441351B2 (en) | 2006-08-16 | 2013-05-14 | Insight Holding Group, Inc. | System and method for tracking shopping behaviors |
| US9111157B2 (en) | 2006-08-16 | 2015-08-18 | Insight Holding Group, Inc. | System and method for tracking shopping behavior |
| US20120249325A1 (en) | 2006-08-16 | 2012-10-04 | James Christopher | System and method for tracking shopping behaviors |
| US20130293355A1 (en) | 2006-08-16 | 2013-11-07 | James Christopher | System and method for tracking shopping behavior |
| US8207851B2 (en) | 2006-08-16 | 2012-06-26 | James Christopher | System and method for tracking shopping behavior |
| US7974869B1 (en) | 2006-09-20 | 2011-07-05 | Videomining Corporation | Method and system for automatically measuring and forecasting the behavioral characterization of customers to help customize programming contents in a media network |
| US7987111B1 (en) | 2006-10-30 | 2011-07-26 | Videomining Corporation | Method and system for characterizing physical retail spaces by determining the demographic composition of people in the physical retail spaces utilizing video image analysis |
| US20130035985A1 (en) | 2006-11-22 | 2013-02-07 | Proclivity Systems, Inc. | E-Commerce Consumer-Based Behavioral Target Marketing Reports |
| US8027864B2 (en) | 2006-11-22 | 2011-09-27 | Proclivity Systems, Inc. | System and method for providing e-commerce consumer-based behavioral target marketing reports |
| US7904477B2 (en) | 2006-12-13 | 2011-03-08 | Videomining Corporation | Object verification enabled network (OVEN) |
| US8380558B1 (en) | 2006-12-21 | 2013-02-19 | Videomining Corporation | Method and system for analyzing shopping behavior in a store by associating RFID data with video-based behavior and segmentation data |
| US8189926B2 (en) | 2006-12-30 | 2012-05-29 | Videomining Corporation | Method and system for automatically analyzing categories in a physical space based on the visual characterization of people |
| US20080159634A1 (en) | 2006-12-30 | 2008-07-03 | Rajeev Sharma | Method and system for automatically analyzing categories in a physical space based on the visual characterization of people |
| US20080172282A1 (en) | 2007-01-15 | 2008-07-17 | Shoppertrak Rct Corporation | Traffic based labor allocation method and system |
| US20120078675A1 (en) | 2007-01-15 | 2012-03-29 | Shoppertrak Rct Corporation | Traffic Based Labor Allocation Method And System |
| US7987105B2 (en) | 2007-01-15 | 2011-07-26 | Shoppertrak Rct Corporation | Traffic based labor allocation method and system |
| US8719266B2 (en) | 2007-01-26 | 2014-05-06 | Information Resources, Inc. | Data perturbation of non-unique values |
| US20080263000A1 (en) | 2007-01-26 | 2008-10-23 | John Randall West | Utilizing aggregated data |
| US20120173472A1 (en) | 2007-01-26 | 2012-07-05 | Herbert Dennis Hunt | Similarity matching of a competitor's products |
| US8504598B2 (en) | 2007-01-26 | 2013-08-06 | Information Resources, Inc. | Data perturbation of non-unique values |
| US20110137924A1 (en) | 2007-01-26 | 2011-06-09 | Herbert Dennis Hunt | Cluster processing of an aggregated dataset |
| US20080294372A1 (en) | 2007-01-26 | 2008-11-27 | Herbert Dennis Hunt | Projection facility within an analytic platform |
| US20080288522A1 (en) | 2007-01-26 | 2008-11-20 | Herbert Dennis Hunt | Creating and storing a data field alteration datum using an analytic platform |
| US20080270363A1 (en) | 2007-01-26 | 2008-10-30 | Herbert Dennis Hunt | Cluster processing of a core information matrix |
| US20090012971A1 (en) | 2007-01-26 | 2009-01-08 | Herbert Dennis Hunt | Similarity matching of products based on multiple classification schemes |
| US20140032269A1 (en) | 2007-01-26 | 2014-01-30 | Information Resources, Inc. | Data perturbation of non-unique values |
| US20080294583A1 (en) | 2007-01-26 | 2008-11-27 | Herbert Dennis Hunt | Similarity matching of a competitor's products |
| US20080288209A1 (en) | 2007-01-26 | 2008-11-20 | Herbert Dennis Hunt | Flexible projection facility within an analytic platform |
| US20090018996A1 (en) | 2007-01-26 | 2009-01-15 | Herbert Dennis Hunt | Cross-category view of a dataset using an analytic platform |
| US20090006309A1 (en) | 2007-01-26 | 2009-01-01 | Herbert Dennis Hunt | Cluster processing of an aggregated dataset |
| US20080288538A1 (en) | 2007-01-26 | 2008-11-20 | Herbert Dennis Hunt | Dimensional compression using an analytic platform |
| US20090006788A1 (en) | 2007-01-26 | 2009-01-01 | Herbert Dennis Hunt | Associating a flexible data hierarchy with an availability condition in a granting matrix |
| US8489532B2 (en) | 2007-01-26 | 2013-07-16 | Information Resources, Inc. | Similarity matching of a competitor's products |
| US8160984B2 (en) | 2007-01-26 | 2012-04-17 | Symphonyiri Group, Inc. | Similarity matching of a competitor's products |
| US20080263065A1 (en) | 2007-01-26 | 2008-10-23 | John Randall West | Data perturbation of non-unique values |
| US8665333B1 (en) | 2007-01-30 | 2014-03-04 | Videomining Corporation | Method and system for optimizing the observation and annotation of complex human behavior from video sources |
| US20080294996A1 (en) | 2007-01-31 | 2008-11-27 | Herbert Dennis Hunt | Customized retailer portal within an analytic platform |
| US8694792B2 (en) | 2007-02-16 | 2014-04-08 | Honeywell International Inc. | Biometric based repeat visitor recognition system and method |
| US8739254B2 (en) | 2007-02-23 | 2014-05-27 | At&T Intellectual Property I, L.P. | Methods, systems, and products for identity verification |
| US8295597B1 (en) | 2007-03-14 | 2012-10-23 | Videomining Corporation | Method and system for segmenting people in a physical space based on automatic behavior analysis |
| US20080249870A1 (en) * | 2007-04-03 | 2008-10-09 | Robert Lee Angell | Method and apparatus for decision tree based marketing and selling for a retail store |
| US7957565B1 (en) | 2007-04-05 | 2011-06-07 | Videomining Corporation | Method and system for recognizing employees in a physical space based on automatic behavior analysis |
| US8830030B2 (en) | 2007-05-16 | 2014-09-09 | Opentable, Inc. | Computer based guest monitoring and identification system and method |
| US9003488B2 (en) | 2007-06-06 | 2015-04-07 | Datavalet Technologies | System and method for remote device recognition at public hotspots |
| US7848548B1 (en) | 2007-06-11 | 2010-12-07 | Videomining Corporation | Method and system for robust demographic classification using pose independent model from sequence of face images |
| US8660895B1 (en) | 2007-06-14 | 2014-02-25 | Videomining Corporation | Method and system for rating of out-of-home digital media network based on automatic measurement |
| US20090037412A1 (en) | 2007-07-02 | 2009-02-05 | Kristina Butvydas Bard | Qualitative search engine based on factors of consumer trust specification |
| US20110252015A1 (en) | 2007-07-02 | 2011-10-13 | Kristina Butvydas Bard | Qualitative Search Engine Based On Factors Of Consumer Trust Specification |
| US8472672B2 (en) | 2007-07-03 | 2013-06-25 | Shoppertrak Rct Corporation | System and process for detecting, tracking and counting human objects of interest |
| US20090010490A1 (en) | 2007-07-03 | 2009-01-08 | Shoppertrak Rct Corporation | System and process for detecting, tracking and counting human objects of interest |
| US20130236058A1 (en) | 2007-07-03 | 2013-09-12 | Shoppertrak Rct Corporation | System And Process For Detecting, Tracking And Counting Human Objects Of Interest |
| US20110286633A1 (en) | 2007-07-03 | 2011-11-24 | Shoppertrak Rct Corporation | System And Method For Detecting, Tracking And Counting Human Objects of Interest |
| US20120314905A1 (en) | 2007-07-03 | 2012-12-13 | Shoppertrak Rct Corporation | System and Process for Detecting, Tracking and Counting Human Objects of Interest |
| US7965866B2 (en) | 2007-07-03 | 2011-06-21 | Shoppertrak Rct Corporation | System and process for detecting, tracking and counting human objects of interest |
| US8238607B2 (en) | 2007-07-03 | 2012-08-07 | Shoppertrak Rct Corporation | System and method for detecting, tracking and counting human objects of interest |
| US20090046201A1 (en) | 2007-08-14 | 2009-02-19 | Shoppertrak Rct Corporation | Holding apparatus for a camera lens |
| US8520906B1 (en) | 2007-09-24 | 2013-08-27 | Videomining Corporation | Method and system for age estimation based on relative ages of pairwise facial images of people |
| US7974889B2 (en) | 2007-10-19 | 2011-07-05 | Raimbeault Sean M | Social networking interactive shopping system |
| US20090158309A1 (en) | 2007-12-12 | 2009-06-18 | Hankyu Moon | Method and system for media audience measurement and spatial extrapolation based on site, display, crowd, and viewership characterization |
| US8098888B1 (en) | 2008-01-28 | 2012-01-17 | Videomining Corporation | Method and system for automatic analysis of the trip of people in a retail space using multiple cameras |
| US20090198507A1 (en) | 2008-02-05 | 2009-08-06 | Jazel, Llc | Behavior-based web page generation marketing system |
| US8027521B1 (en) | 2008-03-25 | 2011-09-27 | Videomining Corporation | Method and system for robust human gender recognition using facial feature localization |
| US8433612B1 (en) | 2008-03-27 | 2013-04-30 | Videomining Corporation | Method and system for measuring packaging effectiveness using video-based analysis of in-store shopper response |
| US8462996B2 (en) | 2008-05-19 | 2013-06-11 | Videomining Corporation | Method and system for measuring human response to visual stimulus based on changes in facial expression |
| US8219438B1 (en) | 2008-06-30 | 2012-07-10 | Videomining Corporation | Method and system for measuring shopper response to products based on behavior and facial expression |
| US8009863B1 (en) | 2008-06-30 | 2011-08-30 | Videomining Corporation | Method and system for analyzing shopping behavior using multiple sensor tracking |
| US20100020172A1 (en) | 2008-07-25 | 2010-01-28 | International Business Machines Corporation | Performing real-time analytics using a network processing solution able to directly ingest ip camera video streams |
| US20130271598A1 (en) | 2008-07-25 | 2013-10-17 | International Business Machines Corporation | Network based real-time analytics of raw video streams |
| US20150062338A1 (en) | 2008-07-25 | 2015-03-05 | International Business Machines Corporation | Network based video analytics through an application program interface (api) with metric triggered notifications |
| US8941735B2 (en) | 2008-07-25 | 2015-01-27 | International Business Machines Corporation | Network based real-time analytics of raw video streams |
| US8325228B2 (en) | 2008-07-25 | 2012-12-04 | International Business Machines Corporation | Performing real-time analytics using a network processing solution able to directly ingest IP camera video streams |
| US7742623B1 (en) | 2008-08-04 | 2010-06-22 | Videomining Corporation | Method and system for estimating gaze target, gaze sequence, and gaze map from video |
| US8457466B1 (en) | 2008-09-29 | 2013-06-04 | Videomining Corporation | Videore: method and system for storing videos from multiple cameras for behavior re-mining |
| US8379937B1 (en) | 2008-09-29 | 2013-02-19 | Videomining Corporation | Method and system for robust human ethnicity recognition using image feature-based probabilistic graphical models |
| US8570376B1 (en) | 2008-11-19 | 2013-10-29 | Videomining Corporation | Method and system for efficient sampling of videos using spatiotemporal constraints for statistical behavior analysis |
| US20140358640A1 (en) | 2008-12-16 | 2014-12-04 | The Nielsen Company (Us), Llc | Methods and apparatus for associating media devices with a demographic composition of a geographic area |
| US8401248B1 (en) | 2008-12-30 | 2013-03-19 | Videomining Corporation | Method and system for measuring emotional and attentional response to dynamic digital media content |
| US8577705B1 (en) | 2008-12-30 | 2013-11-05 | Videomining Corporation | Method and system for rating the role of a product category in the performance of a store area |
| US20150220999A1 (en) | 2009-01-21 | 2015-08-06 | Truaxis, Inc. | Method and system to dynamically adjust offer spend thresholds and personalize offer criteria specific to individual users |
| US20150220951A1 (en) | 2009-01-21 | 2015-08-06 | Truaxis, Inc. | Method and system for inferring an individual cardholder's demographic data from shopping behavior and external survey data using a bayesian network |
| US20140172627A1 (en) | 2009-04-20 | 2014-06-19 | 4-Tell, Inc | Next Generation Improvements in Recommendation Systems |
| US8254633B1 (en) | 2009-04-21 | 2012-08-28 | Videomining Corporation | Method and system for finding correspondence between face camera views and behavior camera views |
| US9740977B1 (en) * | 2009-05-29 | 2017-08-22 | Videomining Corporation | Method and system for recognizing the intentions of shoppers in retail aisles based on their trajectories |
| US8812344B1 (en) | 2009-06-29 | 2014-08-19 | Videomining Corporation | Method and system for determining the impact of crowding on retail performance |
| US20100331010A1 (en) * | 2009-06-30 | 2010-12-30 | Qualcomm Incorporated | Trajectory-Based Location Determination |
| WO2011005072A2 (en) | 2009-07-09 | 2011-01-13 | Mimos Bhd. | Personalized shopping list recommendation based on shopping behavior |
| US20110022312A1 (en) | 2009-07-23 | 2011-01-27 | Fmr Llc | Generating and Tracking Activity Patterns for Mobile Devices |
| US8325982B1 (en) | 2009-07-23 | 2012-12-04 | Videomining Corporation | Method and system for detecting and tracking shopping carts from videos |
| US8412656B1 (en) * | 2009-08-13 | 2013-04-02 | Videomining Corporation | Method and system for building a consumer decision tree in a hierarchical decision tree structure based on in-store behavior analysis |
| US20110093324A1 (en) | 2009-10-19 | 2011-04-21 | Visa U.S.A. Inc. | Systems and Methods to Provide Intelligent Analytics to Cardholders and Merchants |
| US20110125551A1 (en) | 2009-11-24 | 2011-05-26 | Mark Peiser | Method and System for In-Store Media Measurement |
| US20130314505A1 (en) | 2010-01-11 | 2013-11-28 | Shoppertrak Rct Corporation | System And Process For Detecting, Tracking And Counting Human Objects of Interest |
| US20150294482A1 (en) | 2010-01-11 | 2015-10-15 | Shoppertrak Rct Corporation | System And Process For Detecting, Tracking And Counting Human Objects Of Interest |
| US20110169917A1 (en) | 2010-01-11 | 2011-07-14 | Shoppertrak Rct Corporation | System And Process For Detecting, Tracking And Counting Human Objects of Interest |
| US20110238471A1 (en) | 2010-03-24 | 2011-09-29 | John Richard Trzcinski | Generic Universal Rewards Loyalty Card |
| US20110246284A1 (en) | 2010-04-01 | 2011-10-06 | Gary Chaikin | Systems and Methods for Adding Functionality to Merchant Sales and Facilitating Data Collection. |
| US20150081704A1 (en) | 2010-06-30 | 2015-03-19 | The Nielsen Company (Us), Llc | Methods and apparatus to obtain anonymous audience measurement data from network server data for particular demographic and usage profiles |
| US20120041767A1 (en) | 2010-08-11 | 2012-02-16 | Nike Inc. | Athletic Activity User Experience and Environment |
| US20140285660A1 (en) * | 2010-08-18 | 2014-09-25 | Nearbuy Systems, Inc. | Target Localization Utilizing Wireless and Camera Sensor Fusion |
| US20140229616A1 (en) | 2010-08-24 | 2014-08-14 | Kenneth Man-Kin Leung | Method and apparatus for analysis of user traffic within a predefined area |
| US8699370B2 (en) | 2010-08-24 | 2014-04-15 | Euclid, Inc. | Method and apparatus for analysis of user traffic within a predefined area |
| US20120163206A1 (en) | 2010-08-24 | 2012-06-28 | Kenneth Man-Kin Leung | Method and apparatus for analysis of user traffic within a predefined area |
| US8340685B2 (en) | 2010-08-25 | 2012-12-25 | The Nielsen Company (Us), Llc | Methods, systems and apparatus to generate market segmentation data with anonymous location data |
| US9092797B2 (en) | 2010-09-22 | 2015-07-28 | The Nielsen Company (Us), Llc | Methods and apparatus to analyze and adjust demographic information |
| US20130091001A1 (en) | 2010-10-26 | 2013-04-11 | Baynote, Inc. | Behavior-Based Online Deal Transactions |
| WO2012061574A2 (en) | 2010-11-05 | 2012-05-10 | D.L. Ryan Companies, Ltd. | Shopper tracking system and method |
| US8781877B2 (en) | 2010-11-19 | 2014-07-15 | Information Resources, Inc. | Data integration and analysis |
| US8589208B2 (en) | 2010-11-19 | 2013-11-19 | Information Resources, Inc. | Data integration and analysis |
| US20150012337A1 (en) | 2010-11-19 | 2015-01-08 | Information Resources, Inc. | Data integration and analysis |
| US20120150587A1 (en) | 2010-11-19 | 2012-06-14 | Kruger Michael W | Data integration and analysis |
| US20120158460A1 (en) | 2010-11-19 | 2012-06-21 | Kruger Michael W | Data integration and analysis |
| US20140351835A1 (en) | 2010-12-29 | 2014-11-27 | Comcast Cable Communications, Llc | System and method for measuring longitudinal video asset viewing at a second-by-second level to understand behavior of viewers as they interact with video asset viewing devices that access a computer system through a network |
| US20120239504A1 (en) | 2011-03-15 | 2012-09-20 | Microsoft Corporation | Virtual Shopping Assistance |
| US20120254718A1 (en) | 2011-03-30 | 2012-10-04 | Narayan Madhavan Nayar | View-independent annotation of commercial data |
| US8909542B2 (en) | 2011-05-13 | 2014-12-09 | Crowdtwist, Inc. | Systems and methods for managing brand loyalty |
| US20120316936A1 (en) | 2011-06-07 | 2012-12-13 | Philip Clifford Jacobs | Integrated loyalty program infrastructure |
| US8597111B2 (en) | 2011-06-09 | 2013-12-03 | Igt | Anonymous player tracking with mobile devices |
| US20120323682A1 (en) | 2011-06-15 | 2012-12-20 | Ebay Inc. | Systems and methods for behavioral modeling to optimize shopping cart conversion |
| US20120331561A1 (en) | 2011-06-22 | 2012-12-27 | Broadstone Andrew J | Method of and Systems for Privacy Preserving Mobile Demographic Measurement of Individuals, Groups and Locations Over Time and Space |
| US20130014146A1 (en) | 2011-07-06 | 2013-01-10 | Manish Bhatia | Mobile content tracking platform apparatuses and systems |
| US20150334469A1 (en) | 2011-07-06 | 2015-11-19 | Symphony Advanced Media | Media Content Synchronized Advertising Platform Apparatuses and Systems |
| US8955001B2 (en) | 2011-07-06 | 2015-02-10 | Symphony Advanced Media | Mobile remote media control platform apparatuses and methods |
| US20130014145A1 (en) | 2011-07-06 | 2013-01-10 | Manish Bhatia | Mobile content tracking platform methods |
| US20130014158A1 (en) | 2011-07-06 | 2013-01-10 | Manish Bhatia | Media content synchronized advertising platform methods |
| US8978086B2 (en) | 2011-07-06 | 2015-03-10 | Symphony Advanced Media | Media content based advertising survey platform apparatuses and systems |
| US20130014138A1 (en) | 2011-07-06 | 2013-01-10 | Manish Bhatia | Mobile Remote Media Control Platform Methods |
| US20130014153A1 (en) | 2011-07-06 | 2013-01-10 | Manish Bhatia | Media content based advertising survey platform apparatuses and systems |
| US20130019262A1 (en) | 2011-07-06 | 2013-01-17 | Manish Bhatia | Media content synchronized advertising platform apparatuses and systems |
| US20130019258A1 (en) | 2011-07-06 | 2013-01-17 | Manish Bhatia | Media content based advertising survey platform methods |
| US20140173641A1 (en) | 2011-07-06 | 2014-06-19 | Symphony Advanced Media | Social Content Monitoring Platform Apparatuses, Methods and Systems |
| US20140173643A1 (en) | 2011-07-06 | 2014-06-19 | Symphony Advanced Media | Mobile Content Tracking Platform Apparatuses, Methods and Systems |
| US20130014485A1 (en) | 2011-07-17 | 2013-01-17 | Peter Hoang Nguyen | Apparatus for propulsion |
| US20130041837A1 (en) | 2011-08-12 | 2013-02-14 | Accenture Global Services Limited | Online Data And In-Store Data Analytical System |
| US20130063556A1 (en) | 2011-09-08 | 2013-03-14 | Prism Skylabs, Inc. | Extracting depth information from video from a single camera |
| US20140079282A1 (en) | 2011-09-23 | 2014-03-20 | Shoppertrak Rct Corporation | System And Method For Detecting, Tracking And Counting Human Objects Of Interest Using A Counting System And A Data Capture Device |
| US9177195B2 (en) | 2011-09-23 | 2015-11-03 | Shoppertrak Rct Corporation | System and method for detecting, tracking and counting human objects of interest using a counting system and a data capture device |
| US20150221094A1 (en) | 2011-09-23 | 2015-08-06 | Shoppertrak Rct Corporation | System and method for detecting, tracking and counting human objects of interest using a counting system and a data capture device |
| US20130110676A1 (en) | 2011-10-31 | 2013-05-02 | Ncr Corporation | Techniques for customer identification with automated transactions |
| US20130151311A1 (en) | 2011-11-15 | 2013-06-13 | Bradley Hopkins Smallwood | Prediction of consumer behavior data sets using panel data |
| US8799098B2 (en) | 2011-11-17 | 2014-08-05 | Sony Corporation | Customized marketing |
| US20130311332A1 (en) | 2011-11-17 | 2013-11-21 | Sony Corporation | Customized marketing |
| US20130138498A1 (en) | 2011-11-30 | 2013-05-30 | International Business Machines Corporation | Flash sale |
| US20140233852A1 (en) | 2011-12-13 | 2014-08-21 | The Nielsen Company (Us), Llc | Detecting objects in images using color histograms |
| US20150078658A1 (en) | 2011-12-13 | 2015-03-19 | The Nielsen Company (Us), Llc | Image comparison using color histograms |
| US20130317916A1 (en) * | 2011-12-29 | 2013-11-28 | Intel Corporation | Location based technology for smart shopping services |
| US20130184887A1 (en) | 2012-01-13 | 2013-07-18 | Shoppertrak Rct Corporation | System and method for managing energy |
| US20130182904A1 (en) | 2012-01-17 | 2013-07-18 | Objectvideo, Inc. | System and method for video content analysis using depth sensing |
| US20130182114A1 (en) | 2012-01-17 | 2013-07-18 | Objectvideo, Inc. | System and method for monitoring a retail environment using video content analysis with depth sensing |
| US20130185645A1 (en) | 2012-01-18 | 2013-07-18 | International Business Machines Corporation | Determining repeat website users via browser uniqueness tracking |
| US20130197987A1 (en) | 2012-01-26 | 2013-08-01 | Five Stars Loyalty, Inc. | Virtual integration of a loyalty card with a point of sale system |
| US20130218677A1 (en) | 2012-02-22 | 2013-08-22 | Oracle International Corporation | Generating promotions to a targeted audience |
| US20130222599A1 (en) | 2012-02-29 | 2013-08-29 | George Shaw | Method and system for full path analysis |
| US8989775B2 (en) | 2012-02-29 | 2015-03-24 | RetailNext, Inc. | Method and system for WiFi-based identification of person tracks |
| US20130226539A1 (en) | 2012-02-29 | 2013-08-29 | BVI Networks, Inc. | Method and system for statistical analysis of customer movement and integration with other data |
| US20150181387A1 (en) | 2012-02-29 | 2015-06-25 | RetailNext, Inc. | Wireless-based identification of person tracks |
| US20150235237A1 (en) | 2012-02-29 | 2015-08-20 | RetailNext, Inc. | Methods and systems for excluding individuals from retail analytics |
| US20130294646A1 (en) | 2012-02-29 | 2013-11-07 | RetaiNext, Inc. | Method and system for analyzing interactions |
| US20130225199A1 (en) | 2012-02-29 | 2013-08-29 | RetailNext, Inc. | Method and system for wifi-based identification of person tracks |
| US20130226655A1 (en) | 2012-02-29 | 2013-08-29 | BVI Networks, Inc. | Method and system for statistical analysis of customer movement and integration with other data |
| US8620718B2 (en) | 2012-04-06 | 2013-12-31 | Unmetric Inc. | Industry specific brand benchmarking system based on social media strength of a brand |
| US20130317950A1 (en) | 2012-05-23 | 2013-11-28 | International Business Machines Corporation | Customizing a three dimensional virtual store based on user shopping behavior |
| US8930134B2 (en) | 2012-06-12 | 2015-01-06 | Sears Brands, Llc | Systems and methods for high-precision indoor positioning, navigation and shopping behavior profiling |
| US20140019178A1 (en) | 2012-07-12 | 2014-01-16 | Natalie Kortum | Brand Health Measurement - Investment Optimization Model |
| US20140019300A1 (en) | 2012-07-16 | 2014-01-16 | The Sinclair Group, Inc. | Consumer interface device system and method for in-store navigation |
| US20140031923A1 (en) | 2012-07-25 | 2014-01-30 | Medtronic Vascular Galway Limited | Trans-Aortic Surgical Syringe-Type Device for Deployment of a Prosthetic Valve |
| US9124778B1 (en) | 2012-08-29 | 2015-09-01 | Nomi Corporation | Apparatuses and methods for disparity-based tracking and analysis of objects in a region of interest |
| US20140201126A1 (en) | 2012-09-15 | 2014-07-17 | Lotfi A. Zadeh | Methods and Systems for Applications for Z-numbers |
| US8873813B2 (en) | 2012-09-17 | 2014-10-28 | Z Advanced Computing, Inc. | Application of Z-webs and Z-factors to analytics, search engine, learning, recognition, natural language, and other utilities |
| US20140079297A1 (en) | 2012-09-17 | 2014-03-20 | Saied Tadayon | Application of Z-Webs and Z-factors to Analytics, Search Engine, Learning, Recognition, Natural Language, and Other Utilities |
| US20150199627A1 (en) | 2012-09-28 | 2015-07-16 | Sqi3 Solutions Limited | Method and apparatus for optimizing a multi-dimensional space |
| US20140095260A1 (en) | 2012-10-01 | 2014-04-03 | Cadio, Inc. | Tracking brand strength using consumer location data and consumer survey responses |
| CA2823895A1 (en) | 2012-11-01 | 2014-05-01 | Boldstreet Inc. | System and method for wireless device detection, recognition and visit profiling |
| US20140164179A1 (en) | 2012-12-07 | 2014-06-12 | David Geisinger | System and method to optimize in-store customer experience |
| US20140172557A1 (en) | 2012-12-19 | 2014-06-19 | FootTrafficeker LLC | Interactive display system |
| US20140195380A1 (en) | 2013-01-09 | 2014-07-10 | Nearbuy Systems, Inc. | Wireless Analytics in Physical Spaces |
| US20140195302A1 (en) | 2013-01-10 | 2014-07-10 | Oracle International Corporation | Guided walkthrough provider |
| US9035771B2 (en) | 2013-01-31 | 2015-05-19 | Wal-Mart Stores, Inc. | Theft detection system |
| US20140210621A1 (en) | 2013-01-31 | 2014-07-31 | Wal-Mart Stores, Inc. | Theft detection system |
| US20140222685A1 (en) | 2013-02-01 | 2014-08-07 | Swirl Networks, Inc | Systems and methods for encrypting location broadcasts |
| US20140222573A1 (en) | 2013-02-01 | 2014-08-07 | Swirl Networks, Inc. | Systems and methods for encrypting location broadcasts |
| US20140219118A1 (en) | 2013-02-01 | 2014-08-07 | Swirl Networks, Inc. | Systems and methods for display of supplemental content responsive to location |
| US8781502B1 (en) | 2013-02-01 | 2014-07-15 | Swirl Networks, Inc. | Systems and methods for display of supplemental content responsive to location |
| US20140222503A1 (en) | 2013-02-07 | 2014-08-07 | 24/7 Customer, Inc. | Dynamic prediction of online shopper's intent using a combination of prediction models |
| US20140253732A1 (en) | 2013-03-05 | 2014-09-11 | International Business Machines Corporation | Topology determination for non-overlapping camera network |
| US20140258939A1 (en) | 2013-03-08 | 2014-09-11 | Information Resources, Inc. | Selection of hierarchically organized items |
| US20140278967A1 (en) | 2013-03-13 | 2014-09-18 | Hewlett-Packard Development Company, L.P. | Determining target customers during marketing |
| US20140283136A1 (en) | 2013-03-13 | 2014-09-18 | Optio Labs, Inc. | Systems and methods for securing and locating computing devices |
| US20140294231A1 (en) | 2013-03-28 | 2014-10-02 | International Business Machines Corporation | Automatically determining field of view overlap among multiple cameras |
| US20150055830A1 (en) | 2013-03-28 | 2015-02-26 | International Business Machines Corporation | Automatically determining field of view overlap among multiple cameras |
| US8913791B2 (en) | 2013-03-28 | 2014-12-16 | International Business Machines Corporation | Automatically determining field of view overlap among multiple cameras |
| US9165375B2 (en) | 2013-03-28 | 2015-10-20 | International Business Machines Corporation | Automatically determining field of view overlap among multiple cameras |
| US20140379480A1 (en) | 2013-04-25 | 2014-12-25 | Readme Systems, Inc. | Systems, methods, and devices for interactive marketing with attribution using proximity sensors |
| US9094322B2 (en) | 2013-05-02 | 2015-07-28 | Nomi Corporation | First party cookie system and method |
| US20140358661A1 (en) | 2013-05-28 | 2014-12-04 | vMobo, Inc. | Location and transaction-based multi-brand loyalty service |
| US20140358742A1 (en) | 2013-05-31 | 2014-12-04 | Wal-Mart Stores, Inc. | Systems And Methods For Mapping In-Store Transactions To Customer Profiles |
| US20140379524A1 (en) | 2013-06-20 | 2014-12-25 | Dassault Systemes | Shopper Helper |
| US20150006358A1 (en) | 2013-07-01 | 2015-01-01 | Mastercard International Incorporated | Merchant aggregation through cardholder brand loyalty |
| US20150019373A1 (en) | 2013-07-09 | 2015-01-15 | International Business Machines Corporation | Providing a consumer advocate recommendation utilizing historic purchasing data |
| US20150025936A1 (en) | 2013-07-19 | 2015-01-22 | eyeQ Insights | System for monitoring and analyzing behavior and uses thereof |
| WO2015010086A2 (en) | 2013-07-19 | 2015-01-22 | eyeQ Insights | System for monitoring and analyzing behavior and uses thereof |
| US20150058049A1 (en) | 2013-08-20 | 2015-02-26 | RetailNext, Inc. | Systems and methods for identifying and analyzing a customer queue |
| US20150106190A1 (en) | 2013-10-10 | 2015-04-16 | Information Resources, Inc. | Online campaign management |
| US20150154534A1 (en) | 2013-12-02 | 2015-06-04 | Information Resources, Inc. | Virtual product hierarchies |
| US20150154312A1 (en) | 2013-12-02 | 2015-06-04 | Information Resources, Inc. | Virtual product hierarchies |
| US9104205B1 (en) * | 2014-01-22 | 2015-08-11 | Fred Caver | Automated return shopping cart |
| US20150269609A1 (en) | 2014-03-18 | 2015-09-24 | Staples, Inc. | Clickstream Purchase Prediction Using Hidden Markov Models |
| US20150310447A1 (en) | 2014-04-28 | 2015-10-29 | RetailNext, Inc. | Methods and systems for simulating agent behavior in a virtual environment |
| US20150363798A1 (en) | 2014-06-16 | 2015-12-17 | International Business Machines Corporation | Method, computer system and computer program for estimating purchase behavior of customer in store or across stores |
Non-Patent Citations (6)
| Title |
|---|
| "Aerohive and Euclid Retail Analytics," Partner Solution Brief, Aerohive Networks and Euclid, 2013, 9 pages. |
| IAB, "Targeting Local Markets: An IAB Interactive Advertising Guide," http://www.iab.net/local_committee, Sep. 2010, 18 pages. |
| J. Okamura, "Global Cross Channel Retailing Report," Ebeltoft USA / Okamura Consulting, 38 pages. |
| S. Clifford and Q. Hardy, "Attention, Shoppers: Store Is Tracking Your Cell," The New York Times, http://www.nytimes.com/2013/07/15/business/attention-shopper-stores-are-tracking-your-cell.html, Jul. 14, 2013, 5 pages. |
| Verde Group, "Understanding the Multi-Channel Shopper," 6 pages. |
| Ward, et al. RFID: Frequency, standards, adoption and innovation. JISC Technology and standards Watch; May 2006; https://fokt.pw/27043728.pdf (Year: 2006). * |
Cited By (15)
| Publication number | Priority date | Publication date | Assignee | Title |
|---|---|---|---|---|
| US11481805B2 (en) | 2018-01-03 | 2022-10-25 | Grabango Co. | Marketing and couponing in a retail environment using computer vision |
| US20220004747A1 (en) * | 2019-07-31 | 2022-01-06 | Boe Technology Group Co., Ltd. | Multi-target pedestrian tracking method, multi-target pedestrian tracking apparatus and multi-target pedestrian tracking device |
| US11830273B2 (en) * | 2019-07-31 | 2023-11-28 | Boe Technology Group Co., Ltd. | Multi-target pedestrian tracking method, multi-target pedestrian tracking apparatus and multi-target pedestrian tracking device |
| US20220343743A1 (en) * | 2019-08-22 | 2022-10-27 | Nec Corporation | Display control apparatus, display control method, and program |
| US11797921B2 (en) * | 2019-08-26 | 2023-10-24 | Grabango Co. | Dynamic product marketing through computer vision |
| US20210065217A1 (en) * | 2019-08-26 | 2021-03-04 | Grabango Co. | Dynamic product marketing through computer vision |
| US11308547B2 (en) * | 2019-08-29 | 2022-04-19 | Ncr Corporation | Method and system for generating a store planogram and identifying a suspect customer |
| US11810067B2 (en) | 2019-12-31 | 2023-11-07 | Grabango Co. | Digitally managed shelf space marketplace |
| US20230014580A1 (en) * | 2020-02-13 | 2023-01-19 | Guozhen Zhu | Method, apparatus, and system for map reconstruction based on wireless tracking |
| CN113408337A (en) * | 2021-05-11 | 2021-09-17 | 浙江大华技术股份有限公司 | Target document gathering method, electronic device and computer storage medium |
| CN113408337B (en) * | 2021-05-11 | 2022-08-09 | 浙江大华技术股份有限公司 | Target document gathering method, electronic device and computer storage medium |
| US20230056742A1 (en) * | 2021-08-17 | 2023-02-23 | Shopper Scientist Llc | In-store computerized product promotion system with product prediction model that outputs a target product message based on products selected in a current shopping session |
| US20230087497A1 (en) * | 2021-09-22 | 2023-03-23 | Fortinet, Inc. | Systems and Methods for Incorporating Passive Wireless Monitoring With Video Surveillance |
| US11823538B2 (en) * | 2021-09-22 | 2023-11-21 | Fortinet, Inc. | Systems and methods for incorporating passive wireless monitoring with video surveillance |
| CN114331569A (en) * | 2022-03-07 | 2022-04-12 | 广州鹰云信息科技有限公司 | User consumption behavior analysis method and system for different scenes in business space |
Similar Documents
| Publication | Publication Date | Title |
|---|---|---|
| US10963893B1 (en) | Personalized decision tree based on in-store behavior analysis | |
| US10387896B1 (en) | At-shelf brand strength tracking and decision analytics | |
| US10262331B1 (en) | Cross-channel in-store shopper behavior analysis | |
| US10354262B1 (en) | Brand-switching analysis using longitudinal tracking of at-shelf shopper behavior | |
| US10217120B1 (en) | Method and system for in-store shopper behavior analysis with multi-modal sensor fusion | |
| US9934447B2 (en) | Object detection and classification | |
| US11393213B2 (en) | Tracking persons in an automated-checkout store | |
| US9922271B2 (en) | Object detection and classification | |
| Rallapalli et al. | Enabling physical analytics in retail stores using smart glasses | |
| US11354683B1 (en) | Method and system for creating anonymous shopper panel using multi-modal sensor fusion | |
| US11521248B2 (en) | Method and system for tracking objects in an automated-checkout store based on distributed computing | |
| US10186123B2 (en) | Complex event recognition in a sensor network | |
| Simo-Serra et al. | Single image 3D human pose estimation from noisy observations | |
| US10891741B2 (en) | Human analytics using fusion of image and depth modalities | |
| US9270952B2 (en) | Target localization utilizing wireless and camera sensor fusion | |
| US11113734B2 (en) | Generating leads using Internet of Things devices at brick-and-mortar stores | |
| WO2020214775A1 (en) | Systems and methods for deep learning-based subject persistence | |
| Hakeem et al. | Video analytics for business intelligence | |
| WO2012024516A2 (en) | Target localization utilizing wireless and camera sensor fusion | |
| Ablavsky et al. | Layered graphical models for tracking partially occluded objects | |
| Liu et al. | TAR: Enabling fine-grained targeted advertising in retail stores | |
| Liu et al. | What are customers looking at? | |
| US20130041753A1 (en) | System and Method for Identifying a Path of a Billboard Audience Group and Providing Advertising Content Based on the Path | |
| US20210264496A1 (en) | Machine learning for rapid analysis of image data via curated customer personas | |
| US10614436B1 (en) | Association of mobile device to retail transaction |
Legal Events
| Date | Code | Title | Description |
|---|---|---|---|
| STCF | Information on status: patent grant |
Free format text: PATENTED CASE |