US10635563B2 - Unsupervised method for baselining and anomaly detection in time-series data for enterprise systems - Google Patents
Unsupervised method for baselining and anomaly detection in time-series data for enterprise systems Download PDFInfo
- Publication number
- US10635563B2 US10635563B2 US15/609,938 US201715609938A US10635563B2 US 10635563 B2 US10635563 B2 US 10635563B2 US 201715609938 A US201715609938 A US 201715609938A US 10635563 B2 US10635563 B2 US 10635563B2
- Authority
- US
- United States
- Prior art keywords
- interval
- seasonal
- seasonal pattern
- time
- data
- Prior art date
- Legal status (The legal status is an assumption and is not a legal conclusion. Google has not performed a legal analysis and makes no representation as to the accuracy of the status listed.)
- Active, expires
Links
Images


Classifications
-
- G—PHYSICS
- G06—COMPUTING; CALCULATING OR COUNTING
- G06F—ELECTRIC DIGITAL DATA PROCESSING
- G06F11/00—Error detection; Error correction; Monitoring
- G06F11/30—Monitoring
- G06F11/3003—Monitoring arrangements specially adapted to the computing system or computing system component being monitored
- G06F11/3006—Monitoring arrangements specially adapted to the computing system or computing system component being monitored where the computing system is distributed, e.g. networked systems, clusters, multiprocessor systems
-
- G—PHYSICS
- G06—COMPUTING; CALCULATING OR COUNTING
- G06F—ELECTRIC DIGITAL DATA PROCESSING
- G06F11/00—Error detection; Error correction; Monitoring
- G06F11/30—Monitoring
- G06F11/34—Recording or statistical evaluation of computer activity, e.g. of down time, of input/output operation ; Recording or statistical evaluation of user activity, e.g. usability assessment
- G06F11/3409—Recording or statistical evaluation of computer activity, e.g. of down time, of input/output operation ; Recording or statistical evaluation of user activity, e.g. usability assessment for performance assessment
-
- G—PHYSICS
- G06—COMPUTING; CALCULATING OR COUNTING
- G06F—ELECTRIC DIGITAL DATA PROCESSING
- G06F11/00—Error detection; Error correction; Monitoring
-
- G—PHYSICS
- G06—COMPUTING; CALCULATING OR COUNTING
- G06F—ELECTRIC DIGITAL DATA PROCESSING
- G06F11/00—Error detection; Error correction; Monitoring
- G06F11/30—Monitoring
- G06F11/3003—Monitoring arrangements specially adapted to the computing system or computing system component being monitored
- G06F11/3034—Monitoring arrangements specially adapted to the computing system or computing system component being monitored where the computing system component is a storage system, e.g. DASD based or network based
-
- G—PHYSICS
- G06—COMPUTING; CALCULATING OR COUNTING
- G06F—ELECTRIC DIGITAL DATA PROCESSING
- G06F11/00—Error detection; Error correction; Monitoring
- G06F11/30—Monitoring
- G06F11/3065—Monitoring arrangements determined by the means or processing involved in reporting the monitored data
-
- G—PHYSICS
- G06—COMPUTING; CALCULATING OR COUNTING
- G06F—ELECTRIC DIGITAL DATA PROCESSING
- G06F11/00—Error detection; Error correction; Monitoring
- G06F11/30—Monitoring
- G06F11/32—Monitoring with visual or acoustical indication of the functioning of the machine
- G06F11/324—Display of status information
- G06F11/327—Alarm or error message display
-
- G—PHYSICS
- G06—COMPUTING; CALCULATING OR COUNTING
- G06F—ELECTRIC DIGITAL DATA PROCESSING
- G06F11/00—Error detection; Error correction; Monitoring
- G06F11/30—Monitoring
- G06F11/34—Recording or statistical evaluation of computer activity, e.g. of down time, of input/output operation ; Recording or statistical evaluation of user activity, e.g. usability assessment
- G06F11/3409—Recording or statistical evaluation of computer activity, e.g. of down time, of input/output operation ; Recording or statistical evaluation of user activity, e.g. usability assessment for performance assessment
- G06F11/3433—Recording or statistical evaluation of computer activity, e.g. of down time, of input/output operation ; Recording or statistical evaluation of user activity, e.g. usability assessment for performance assessment for load management
-
- G—PHYSICS
- G06—COMPUTING; CALCULATING OR COUNTING
- G06F—ELECTRIC DIGITAL DATA PROCESSING
- G06F11/00—Error detection; Error correction; Monitoring
- G06F11/30—Monitoring
- G06F11/34—Recording or statistical evaluation of computer activity, e.g. of down time, of input/output operation ; Recording or statistical evaluation of user activity, e.g. usability assessment
- G06F11/3452—Performance evaluation by statistical analysis
-
- G—PHYSICS
- G06—COMPUTING; CALCULATING OR COUNTING
- G06F—ELECTRIC DIGITAL DATA PROCESSING
- G06F11/00—Error detection; Error correction; Monitoring
- G06F11/30—Monitoring
- G06F11/3058—Monitoring arrangements for monitoring environmental properties or parameters of the computing system or of the computing system component, e.g. monitoring of power, currents, temperature, humidity, position, vibrations
Definitions
- the present disclosure relates to techniques for generating baselines and monitoring time-series data for anomalies.
- Anomaly detection involves systems and processes for identifying behavior that does not conform to expectations. On enterprise and cloud computing platforms, for instance, anomaly detection may provide warnings if unusual behavior is exhibited by metric data collected from system hardware and software resources. If left unaddressed, anomalous behavior may compromise system security and performance. Anomaly detection systems attempt to mitigate such performance degradation by detecting and treating anomalies as efficiently as possible.
- Anomaly detection is complicated by the significant variance in behavior from one system to the next. For example, a typical pattern of resource usage in one datacenter environment may have different patterns of highs and lows than in another datacenter environment. As a result, behavior that is anomalous in one computing environment may not be anomalous in another environment.
- Threshold-based alerting is an example approach to anomaly detection.
- a user defines the acceptable range of values, and an alarm is triggered if a monitored value falls outside the user-defined range.
- the user may define the thresholds based on specific domain knowledge of the system to supervise the anomaly detection process such that the thresholds are tailored for specific behavior exhibited by the system. This approach allows the user to inject domain knowledge into the system to supervise the anomaly detection process.
- selecting the appropriate thresholds on which to trigger alerts may be complicated based on the large number of anomalous events that may occur in large-scale systems. Adding to the complexity, system resources may exhibit trends, seasonal fluctuations, and other time-varying behaviors that evolve over time. A user may be unaware of and/or unable to keep up with normal behavioral patterns. As a result, users may be prone to selecting sub-optimal thresholds, which may result in false positive alerts that flag system normal system behavior and/or neglect other system behavior that is anomalous.
- FIG. 1 illustrates a system for performing baselining and anomaly detection in accordance with one or more embodiments
- FIG. 2 illustrates an example set of operations for monitoring a time-series signal for anomalies in accordance with one or more embodiments
- FIG. 3 illustrates an example set of operations for generating baseline models in accordance with one or more embodiments
- FIG. 4 illustrates an example baseline model generated from historical resource metric data in accordance with one or more embodiments
- FIG. 5 illustrates an example set of operations for performing anomaly detection using trained baseline models in accordance with one or more embodiments
- FIG. 6A illustrates an example evaluation of a time-series signal using a weekly baseline model in accordance with one or more embodiments
- FIG. 6B illustrates an example evaluation of a time-series signal using a daily baseline model in accordance with one or more embodiments
- FIG. 6C illustrates an example evaluation of a time-series signal using a non-seasonal baseline model in accordance with one or more embodiments
- FIG. 7 illustrates an example difference between a baseline model before and after smoothing to account for drift in measurement in accordance with one or more embodiments
- FIG. 8 illustrates an example deviation from a baseline model is classified as statistically insignificant in accordance with one or more embodiments
- FIG. 9 illustrates an example evolution of a baseline model in accordance with one or more embodiments.
- FIG. 10 illustrates an example difference in transitioning from one baseline model TO another using different approaches in accordance with one or more embodiments
- FIG. 11 illustrates an example computer system on which one or more embodiments may be implemented.
- metric data associated with hardware and/or software resources may follow seasonal patterns. For example, a typical pattern of resource usage may involve a low load on weekends and an increasing load during the weekdays that peaks around Wednesdays and Thursdays. Such seasonal behavior varies from system to system—some systems are highly predictable while other systems may be less predictable or not predictable at all.
- Baselining is a process through which historical and expected resource behavior may be modelled and analyzed.
- Baselining metric data presents challenges within large-scale computing environments.
- Measurement systems that collect metric data are generally software processes that can be and are often restarted, causing a “drift” in measurement.
- CPU central processing unit
- the measurement systems may not be able to perform direct baseline comparisons of metric data sampled at the same time on different days.
- the load on enterprise systems may vary dramatically at different times of the day or week, and unlike physical assets, the times of the day or week may be defined by the time zone of the users of the enterprise system, not the time zone of system itself.
- a baselining and anomaly detection system comprises a set of one or more machine-learning processes that automatically identify the predictability of observed resource behavior.
- the system may receive time-series data that track metrics associated with hardware and/or software resources in a target environment for examination.
- the system may analyze the received metric data to learn patterns that repeat daily, weekly, bi-weekly, monthly, on holidays and/or over some other seasonal period. Within detected seasonal patterns, the system may generate baseline models to represent expected system behavior. The system may leverage the learned behavior to generate baselines that are tailored to the specific environment under examination.
- baseline models incorporate uncertainty intervals for detected seasonal patterns.
- An uncertainty interval is a distribution of sample values that conform with a seasonal pattern. A range of values is used rather than an exact value to account for variance and/or uncertainty in the seasonal pattern.
- an anomaly may be detected based on whether a time-series signal crosses an uncertainty interval limit.
- Different uncertainty intervals may be associated with different seasonal patterns. For instance, within a detected weekly season, a baseline modelling a pattern of high sub-periods and a pattern of low sub-periods may be generated. In some cases, the high sub-periods may be more unpredictable than the low periods. To accommodate the difference, the baseline model may associate the high sub-periods with a larger uncertainty interval (i.e., a greater range of values) than the lower sub-periods. In other cases, the seasonal lows may have a larger uncertainty interval than the seasonal highs.
- the baselining and anomaly detection system uses the baseline models to monitor metric data for anomalies.
- the system may monitor a time-series signal carrying a sequence of metric values for data points that fall outside of an uncertainty interval defined by a baseline model. An alert may be triggered if at least one value falls outside the uncertainty interval to provide warning of anomalous behavior.
- a single value outside of the uncertainty interval may trigger an alert.
- small deviations may be permitted without triggering an alert.
- smoothed expectation windows and/or cumulative summing techniques may be applied during evaluation, as described further herein. The techniques may reduce false positives caused by measurement drift and reduce the volume of alerts to a more manageable level.
- the system may adapt the baseline model to newly learned seasonal behavior. For example, a baseline model may initially be trained to represent daily seasonality. As more data points are received, weekly patterns may be detected and modelled. To incorporate the newly learned seasonal patterns, the system may transition the baseline model may from a daily seasonal model to a weekly seasonal model. Thus, a baseline model may evolve and become more accurate over time.
- an unsupervised baselining and anomaly detection system is configured to operate on time series signals.
- a time series signal comprises a sequence of values that are captured over time.
- the source of the time series data and the type of information that is captured may vary from implementation to implementation.
- a time series may be collected from one or more software and/or hardware resources and capture various performance metrics of the resources from which the data was collected.
- a time series may be collected using one or more sensors that measure physical properties, such as temperature, pressure, motion, traffic flow, or other attributes of an object or environment.
- FIG. 1 illustrates an example system for automatic baselining and anomaly detection based on time-series data captured by one or more host devices.
- System 100 generally comprises hosts 110 a - n, data collector 120 , baselining and anomaly detection services 130 , data repository 140 , and clients 150 a - k.
- Components of system 100 may be implemented in one or more host machines operating within one or more clouds or other networked environments, depending on the particular implementation.
- Hosts 110 a - n represent a set of one or more network hosts and generally comprise targets 112 a - i and agents 114 a - j.
- a “target” in this context refers to a resource that serves as a source of time series data.
- a target may be a software deployment such as a database server instance, middleware instance, or some other software resource executing on a network host.
- a target may be a hardware resource, an environmental characteristic, or some other physical resource for which metrics may be measured and tracked.
- Agents 114 a - j comprise hardware and/or software logic for capturing time-series measurements from a corresponding target (or set of targets) and sending these metrics to data collector 120 .
- an agent includes a process, such as a service or daemon, that executes on a corresponding host machine and monitors one or more software and/or hardware resources that have been deployed.
- an agent may include one or more hardware sensors, such as microelectromechanical (MEMs) accelerometers, thermometers, pressure sensors, etc., that capture time-series measurements of a physical environment and/or resource.
- MEMs microelectromechanical
- FIG. 1 the number of agents and/or targets per host may vary from implementation to implementation. Multiple agents may be installed on a given host to monitor different target sources of time series data.
- an agent that resides remotely on a different host than a target may be responsible for collecting sample time-series data from the target.
- Data collector 120 includes logic for aggregating data captured by agents 114 a - j into a set of one or more time-series. Data collector 120 may store the time series data in data repository 140 and/or provide the time-series data to baselining and anomaly detection services 130 . In one or more embodiments, data collector 120 receives data from agents 114 a - j over one or more data communication networks, such as the Internet.
- Example communication protocols that may be used to transport data between the components illustrated within system 100 may include, without limitation, the hypertext transfer protocol (HTTP), simple network management protocol (SNMP), and other communication protocols of the internet protocol (IP) suite.
- HTTP hypertext transfer protocol
- SNMP simple network management protocol
- IP internet protocol
- Baselining and anomaly detection services 130 includes logic for training models that represent the behavior of a set of time-series data and evaluating the models to detect anomalous behavior.
- Baselining and anomaly detection services 130 may implement techniques described in further detail below to perform unsupervised baselining and anomaly detection on one or more time series signals originating from targets 112 a - i.
- Baselining and anomaly detection services 130 may comprise logic for generating baseline models, monitoring time series signals for anomalies, and triggering responsive actions when anomalies are detected.
- Data repository 140 includes volatile and/or non-volatile storage for storing data that is generated and/or used by baselining and anomaly detection services 130 .
- Example data that may be stored may include, without limitation, time-series data collected, seasonal pattern classifications, baseline data for one or more classified seasonal patterns, and anomaly report data.
- Data repository 140 may reside on a different host machine, such as a storage server that is physically separate from baselining and anomaly detection services 130 , or may be allocated from volatile or non-volatile storage on the same host machine.
- Clients 150 a - k represent one or more clients that may access baselining and anomaly detection services 130 to generate baselining operations and/or perform anomaly detection.
- a “client” in this context may be a human user, such as an administrator, a client program, or some other application instance.
- a client may execute locally on the same host as analytic services 130 or may execute on a different machine. If executing on a different machine, the client may communicate with baselining and anomaly detection services 130 via one or more data communication protocols according to a client-server model, such as by submitting HTTP requests invoking one or more of the services and receiving HTTP responses comprising results generated by one or more of the services.
- Baselining and anomaly detection services 130 may provide clients 150 a - k with an interface through which one or more of the provided services may be invoked.
- Example interfaces may comprise, without limitation, a graphical user interface (GUI), an application programming interface (API), a command-line interface (CLI) or some other interface that allows a user to interact with and invoke one or more of the provided services.
- GUI graphical user interface
- API application programming interface
- CLI command-line interface
- baselining and anomaly detection services 130 models system behavior from an input set of historical time-series data. Training the model may be performed without user input through unsupervised machine learning techniques.
- the unsupervised techniques may include automatically detecting seasonal patterns, approximating the behavior of each seasonal pattern, and determining a normal or other representative distribution for each seasonal pattern.
- the model may be used to evaluate whether a behavior exhibited by a system is anomalous or not. For example, the model may be evaluated against an input time-series signal that tracks a metric associated with a hardware or software resource. If the time-series signal deviates from an expected behavior by a statistically significant amount, then the model may raise a flag or other alert to notify a user about the anomalous behavior.
- the process receives a set of time-series data that includes a sequence of values captured by one or more computing devices over time.
- the time-series signal may track CPU usage, active database sessions, memory bandwidth, I/O operations, or any other metric that measures or otherwise indicates a performance of a target software or hardware resource.
- the set of time-series data may be collected from targets 112 a - i, as previously described, and provided to baselining and provided to baselining and anomaly detection services 130 for further analysis.
- the process detects two or more seasonal patterns within the set of time-series data, including a first seasonal pattern and a second seasonal pattern.
- Example seasonal patterns that may be detected may include, without limitation, seasonal highs, seasonal lows, sparse highs, sparse lows, dense highs, and dense lows.
- Techniques for detecting and classifying seasonal patterns are described in U.S. application Ser. No. 15/057,065, entitled “SYSTEM FOR DETECTING AND CHARACTERIZING SEASONS”; U.S. application Ser. No. 15/057,060, entitled “SUPERVISED METHOD FOR CLASSIFYING SEASONAL PATTERNS”; and U.S. application Ser. No. 15/057,062, entitled “UNSUPERVISED METHOD FOR CLASSIFYING SEASONAL PATTERNS”, which were previously incorporated by reference.
- the process determines, based at least in part on the set of time-series data, an interval for each detected seasonal pattern.
- a first interval may be determined for a first seasonal pattern that represents a first distribution of sample values associated with the first seasonal pattern
- a second interval may be determined for a second seasonal pattern that represents a second distribution of sample values associated with the second seasonal pattern. If there are more seasonal patterns, additional intervals may be determined independently for each remaining seasonal pattern.
- the first and second intervals are uncertainty intervals, such as a tolerance interval, within a prescribed level of confidence.
- an interval may correspond to a normal (e.g., Gaussian) or regular distribution of sample values that conform to a seasonal pattern.
- the process monitors a time-series signal for anomalies in the detected seasonal patterns. For example, if in a high season, the process may monitor data points to determine whether the behavior conforms to expected behavior. More specifically, the process may compare the data points to a corresponding interval that represents an expected distribution of values the high season. If one or more data points fall outside the range of values defined by the interval, then an anomaly may be detected. During a low seasonal period, the process may compare the data points to a different interval that represents an expected distribution for low seasons. The range of values may be larger or smaller than the interval for the high season, depending on the variation and amount of uncertainty in the seasonal patterns. Thus, different interval ranges may be used depending on whether the data point being evaluated is in a high season or a low season.
- behavior may not immediately be classified as anomalous if the data point under evaluation falls outside of the expected interval.
- the process may analyze the deviation to determine whether it is statistically significant. If the deviation is statistically significant, then the behavior may be classified as anomalous.
- the process may analyze a variety of factors to determine whether deviant behavior is statistically significant. For example, the determination may be based on the magnitude of the deviation, the trend of the deviation, and the length of time of the deviation. Examples classification techniques are described further below.
- the process generates an alert in response to detecting an anomaly in the first seasonal pattern or the second seasonal pattern.
- the alert may cause display of information regarding the detected anomaly.
- the alert may identify the metric that is being tracked that is exhibiting anomalous behavior, the time the anomalous behavior was detected, the expected seasonal behavior of the metric, such as whether it was expected to be sparse high, dense high, low, etc., the uncertainty interval of the normal distribution of the behavior, and the observed behavior that triggered the alert.
- the interval representing the normal distribution may be plotted and overlaid against the observed anomalous behavior.
- Example responsive actions may include, but are not limited to deploying additional resources to satisfy unexpected increases in resource demand (e.g., to service additional client requests), bringing resources offline due to unexpected decreases in demand or to prevent potential compromising behavior (e.g., to prevent denial of service attacks), and updating resource configurations (e.g., shifting requests from a resource experiencing unexpected overload to a more available resource).
- unexpected increases in resource demand e.g., to service additional client requests
- bringing resources offline due to unexpected decreases in demand or to prevent potential compromising behavior e.g., to prevent denial of service attacks
- updating resource configurations e.g., shifting requests from a resource experiencing unexpected overload to a more available resource.
- baselining and anomaly detection services 130 includes logic for generating baseline models based on historic time-series data.
- a baseline model in this context, is a data object or data structure that is generated, in data repository 140 , as a representation of historical and/or expected patterns.
- a baseline model may define a range of values that recur on a periodic or seasonal basis.
- a model may define a pattern of CPU utilization rates that historically occur on a seasonal basis (e.g., hourly, daily, weekly, monthly, etc.).
- Baseline models may approximate other resource behavior including, without limitation, user logons to access a resource, transactions metrics (e.g., the number of frequency of transactions occurring on a database or other transactional system), execution metrics (e.g., the number of executions per second on a host), resource calls (e.g., the number and frequency of requests to access a particular resource), CPU performance metrics (e.g., CPU utilization rates, thread counts, etc.), memory bandwidth metrics (e.g., memory usage rates, cache hit rates, etc.), I/O metrics (e.g., physical reads and writes to disk), and network metrics (e.g., packet counts, packet flow rates, etc.).
- transactions metrics e.g., the number of frequency of transactions occurring on a database or other transactional system
- execution metrics e.g., the number of executions per second on a host
- resource calls e.g., the number and frequency of requests to access a particular resource
- CPU performance metrics e.g., CPU utilization rates, thread counts, etc.
- FIG. 3 illustrates an example set of operations for generating baseline models in accordance with one or more embodiments.
- the set of operations include receiving a historical time-series dataset (Operation 310 ).
- data repository 140 and/or baseline and anomaly detection services 130 may receive resource metrics from one or more targets via data collector 120 .
- Data collector 120 may provide the metrics on-demand, periodically, or on a streaming/continuous basis, depending on the particular implementation.
- the process determines whether there are sufficient samples for a model (Operation 320 ). The determination may be made based on a comparison of the number of sample values in the historical time-series dataset to a threshold value, which may vary from implementation to implementation. In the context of hourly samples for instance, a threshold value of thirty may be set to ensure that at least thirty hours of data have been collected before training begins. However, the sample period and the threshold value may be tailored to account for other preferences and system behavior. If there are insufficient sample, then the process exits without training a model. Otherwise, the process continues according to the operations set forth below.
- the process analyzes the historical time-series dataset to detect whether any seasonal patterns exist (Operation 330 ). The analysis may depend on the amount of data points included in the historical time-series dataset. For example, if there are more than two weeks of sample values, then the process may first determine whether the resource metrics exhibit any weekly patterns. For instance, a weekly seasonal high resource usage may be detected on Wednesdays and Thursdays from 9-5 based on the historical patterns while weekly lows may occur in the late evenings and/or on weekends. If there are no weekly seasons or not enough data has been collected to detect weekly seasons, then the process may analyze the data for daily seasonal patterns. For instance, daily highs may be detected from 9 a.m.
- determining whether seasonal patterns are present is based on the correlation between different instances of a season. For example, to detect daily seasons, data may be aggregated by hourly granularity using the maximum observed value in the hour. The data may then be split into a list of time-series elements, with each element corresponding to one day and storing the maximum value for each hour of the corresponding day. The process may calculate correlations between each daily time series and calculate the lower triangular matrix of correlations. If at least a threshold (e.g., 50%) of the correlations are greater than threshold value (e.g., 0.3), then a daily pattern is detected. Otherwise, the process may determine that the correlation between different hours of the same day are not correlated closely enough to be indicative of a daily pattern. This process may be applied to other seasonal timeframes (e.g., monthly, weekly etc.) to detect whether or not a seasonal pattern is present.
- threshold value e.g. 50%
- the process extracts data points that are associated with the seasonal pattern (Operation 340 ).
- sample values are collected from multiple instances of the high season. For example, if a weekly high is detected on Tuesday from 10 a.m. to 3 p.m., then sample values across multiple weeks from the corresponding seasonal period may be collected and grouped in memory for further analysis. The data points that are extracted may vary depending on how the seasonal patterns are classified.
- an additive or multiplicative Holt-Winters model may be fit to the data points.
- the process may attempt to fit the extracted time-series data points to other seasonal models, such as seasonal autoregressive integrated moving average (ARIMA) models.
- ARIMA seasonal autoregressive integrated moving average
- the uncertainty interval that determined at Operation 350 is a tolerance interval.
- a tolerance interval is used to indicate a range where an individual forecasted value is expected to fall.
- a tolerance interval may be mathematically defined to be the range of values that will contain a threshold percentage of future samples.
- the tolerance interval may be determined based on a set of residuals, where a residual is a difference between an expected value and an observed value.
- the tolerance interval may be calculated by fitting a normal distribution of the set of residuals to the sample within a prescribed confidence (e.g., 95% or any other threshold may be used).
- the tolerance interval x ⁇ s may be computed as follows:
- the process determines whether there are any remaining seasonal patterns for which baseline models have not yet been generated (Operation 360 ). If any seasonal patterns remain, then the process returns to operation 340 to train a baseline model and uncertainty intervals using data points associated with the next seasonal pattern. For example, the process may separate data points associated with the high seasonal periods and low seasonal periods. The process may generate a baseline and associated intervals independently for each respective seasonal period using the corresponding data points.
- Example non-seasonal models that may be fit include, but are not limited to maximum concentration interval (MCI) models and non-seasonal ARIMA models.
- MCI maximum concentration interval
- ARIMA non-seasonal ARIMA models.
- the uncertainty intervals may be computed as previously described, although the intervals are not associated with seasonal patterns in this case.
- the baseline models are stored in data repository 140 (Operation 380 ).
- the trained baseline models are used to monitor and evaluate incoming time-series data for anomalies.
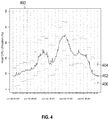
- FIG. 4 illustrates an example baseline model generated from historical resource metric data in accordance with one or more embodiments.
- Chart 400 includes baseline model 402 , which represents a daily baseline for a host CPU utilization rate on a target resource.
- An uncertainty interval is defined by upper limit 404 and lower limit 406 .
- the baseline and interval may be calculated from historical CPU utilization metrics according to the process previously described.
- Upper limit 404 and lower limit 406 may be determined independently for different seasonal patterns. For example, the daily high at 15:00 may have a wider range than the daily low at 0:00. Computing uncertainty independently for different seasonal patterns allows for a more robust baselining and anomaly detection system. Different uncertainties may be detected for different respective seasonal patterns due to the variation and distribution of values that are associated with each seasonal pattern. If the uncertainty is more predictable for one seasonal period than another seasonal period, then the different intervals may capture this characteristic when training the baseline model. As a result, the interval for high seasonal patterns may be much greater than the interval for low seasonal patterns. If a data point is associated with the high seasonal pattern, may be allowed a much wider range than a data point associated with a low seasonal pattern before an alert is triggered.
- baselining and anomaly detection services 130 includes logic for monitoring time-series data for anomalies.
- incoming time-series data may be compared against a trained baseline model to determine whether one or more data points conform to expectations. For example, CPU utilization rates for a target host may be compared to the baseline depicted in FIG. 4 . If the time-series dataset under examination does not conform, then one or more responsive actions may be taken to mitigate performance degradation and/or other problems caused by the behavior.
- FIG. 5 illustrates an example set of operations for performing anomaly detection using trained baseline models in accordance with one or more embodiments.
- the set of operations includes receiving time-series data for evaluation (Operation 502 ).
- the set of time-series data may be provided on-demand, periodically, or on a continuous/streaming basis.
- baselining and anomaly detection services 130 may monitor one or more streams of resource metrics associated with targets 112 a - i.
- the process determines whether an associated seasonal baseline is available (Operation 504 ). For example, if the monitored time-series signal includes a CPU utilization rate for a particular target, the process may search data repository 140 for a trained baseline model. As previously described, in some cases, a seasonal baseline model may not be trained if no seasonal patterns were detected in the training set of data. In this case, a trained non-seasonal baseline model may be used for evaluation instead. If no baseline models are available, then the monitoring process may exit or wait until enough time-series data has been received to generate a baseline model.
- the process continues by retrieving the upper and lower limits set by the associated non-seasonal baseline model (Operation 506 ).
- the model may define a lower limit (e.g., 30%) and upper limit (e.g., 60%) for a range of rates that conform to expected behavior defined by the non-seasonal model.
- the model may define a conforming range of transaction per second based on the training set of database transactions.
- the baseline model may similarly define a range of values that conform to expected performance patterns.
- An evaluation data point in this context is a value in the time-series data set that is under examination.
- the window may be defined as the hour the evaluation data point is in plus one collection to the left and right of the hour. For example, if the evaluation data point is a sample resource metric value captured at 9:20 a.m. on Monday, and the collection interval is every 10 minutes, then the window may be defined from 8:50 a.m. to 10:10 a.m. Other windows may be used and may vary from implementation to implementation.
- the prescribed time window acts as a smoothened expectation window that may compensate for drift measurement, as described further below.
- the process next determines the lowest and highest values of the seasonal baseline model within the prescribed window (Operation 510 ). Continuing with the preceding example, for instance, the process may determine which value defined by the baseline is the maximum and which is the minimum from 8:50 a.m. to 10:10 a.m. These values may be determined using the Holt-Winters model or other seasonal baseline models described above and are retained to analyze the evaluation data point. The remaining baseline values within the window may be discarded from further consideration. By retaining the maximum and minimum values within the prescribed window, slight differences in measurement time do not affect the result of the evaluation.
- the anomaly detection process further determines an uncertainty interval based on a seasonal pattern associated with the evaluation data point (Operation 512 ). For example, if the evaluation data point has a sample time corresponding to a high season (e.g., daily high, weekly high, etc.), then the uncertainty interval for the high season may be read from the corresponding baseline model. If the evaluation data point occurs in a different season (e.g., a daily low, weekly low, etc.), then a different uncertainty interval may be used. As previously indicated, the size of the uncertainty interval may vary from seasonal pattern to seasonal pattern based on variation and uncertainty amongst the data points.
- a seasonal pattern associated with the evaluation data point e.g., daily high, weekly high, etc.
- the process computes an upper limit and lower limit for the evaluation data point (Operation 514 ).
- the lower limit may be computed by subtracting the lowest value in the prescribed window by the uncertainty.
- the higher limit may be computed by summing the highest value in the prescribed window with the uncertainty. For example, if the lowest CPU utilization rate in a prescribed window is 40%, and the corresponding uncertainty interval for the season is ⁇ 10%, then the lower limit may be computed at 30%. If the highest value is 60%, then the upper limit may be computed as 70%.
- the limits may vary depending on the trained baseline model, seasonal patterns, and corresponding uncertainty intervals.
- the process compares the evaluation data point to determine whether the limits have been crossed (Operation 516 ).
- the process may determine whether the evaluation data point is below the lower limit or above the upper limit. If the evaluation data point falls outside the conforming range of values that are between the two limits, then the process classifies the evaluation data point as anomalous. Conversely, if the evaluation data point is within the limits, then the evaluation data point is not classified as anomalous.
- the process determines whether the deviation is statistically significant (Operation 518 ).
- the determination of whether a deviation is statistically significant may vary from implementation to implementation. In some cases, a single anomalous data point may be classified as significant and trigger a responsive action. However, in other cases, an evaluation data point may be permitted to cross the limit without automatically triggering an alert.
- the process may account for the magnitude of the deviation of the evaluation data point, the number of data points in a sequence that have crossed the limits, and/or the cumulative magnitude of deviation fort the sequence of data points. One or more of these factors may compared to threshold values. If the thresholds are exceeded, then the deviation may be classified as statistically significant. If the deviation is not statistically significant, then monitoring may continue without triggering a responsive action.
- a cumulative sum (CUSUM) control chart is used to determine whether a deviation is statistically significant.
- a CUSUM control chart is a model that may be trained to model (a) the expected mean and standard deviation of a time-series signal; (b) the size of a shift from the historical mean and standard deviation; and (c) a control limit or threshold (e.g., five standard deviations) for classifying the time-series as statistically significant.
- the process may use the CUSUM control chart to track individual and cumulative sums of residual values (e.g., the sums of the negative and positive deviations from the mean).
- the process may compare the residuals of the time-series signal being evaluated against the residuals of the historical time-series data used to train the baseline model. If a significant shift (e.g., the difference in residuals exceeds the control limit) is detected, then the process may determine that the evaluation data point is not an isolated incident but representative of a change in time-series behavior. In response, the process may classify the deviation as statistically significant.
- a significant shift e.g., the difference in residuals exceeds the control limit
- a responsive action may include, but is not limited to generating an alert, deploying additional resources to satisfy unexpected increases in resource demand (e.g., to service additional client requests), bringing resources offline due to unexpected decreases in demand or to prevent potential compromising behavior (e.g., to prevent denial of service attacks), and updating resource configurations (e.g., shifting requests from a resource experiencing unexpected overload to a more available resource).
- the responsive action may be performed to mitigate performance degradation in the computing environment caused by the anomalous behavior.
- the process further includes determining whether to continue monitoring the time-series data (Operation 522 ). Monitoring may be stopped at any point on demand, based on pre-defined time limits, or based on any other criteria.
- the process may stream or periodically receive time-series data generated by targets 112 a - i for evaluation. The process may be repeated for remaining data points in the received time-series dataset and/or as new time-series date is received to continuing evaluating resource behavior within the computing environment.
- different seasonal periods may be analyzed using different uncertainty models.
- the process may be evaluating database transactions per second in a weekly high season.
- the trained baseline model may indicate that the expected number of database transactions per second at time t 1 is 750 with an uncertainty of ⁇ 150 transactions per second. If the data point under examination at time t 1 falls outside the range of 600 to 900 transactions per second, then a responsive action may be triggered if the deviation is determined to be statistically significant.
- a second data point being evaluated may occur at a weekly low season. The process may determine from the trained model that the expected number of transactions per second for that time of the week is 100 with an uncertainty of ⁇ 50 transactions per second.
- the range may be different than in the high season on account of less variation and uncertainty in the weekly low historical time-series data.
- a responsive action may be triggered if the data point under examination at time t 2 falls outside the range of 50 to 150 transactions per second.
- the numbers used above are given for purposes of illustration and may vary depending on the historical time-series dataset and training parameters used to generated the baseline model.
- FIG. 6A illustrates an example evaluation of a time-series signal using a weekly baseline model in accordance with one or more embodiments.
- Chart 600 illustrates a historical time-series dataset used to train the baseline model.
- the training time-series dataset includes twenty-one days of sample values.
- Chart 602 depicts time-series signal 604 , which is monitored for anomalies using upper limit 606 and lower limit 608 of the trained baseline model.
- the trained baseline tracks weekly seasonal patterns including weekly highs and lows.
- the width of the baseline varies between the weekly highs and lows.
- the width of the baseline is a function of the predictability observed from the historical time-series dataset used for training.
- FIG. 6B illustrates an example evaluation of a time-series signal using a daily baseline model in accordance with one or more embodiments.
- Chart 610 illustrates a historical time-series dataset used to train the baseline model.
- the training time-series dataset includes three days of sample values.
- Chart 612 depicts time-series signal 614 , which is monitored for anomalies using upper limit 616 and lower limit 618 of the trained baseline model.
- the trained baseline tracks daily seasonal patterns including daily highs and lows.
- FIG. 6C illustrates an example evaluation of a time-series signal using a non-seasonal baseline model in accordance with one or more embodiments.
- Chart 620 illustrates a historical time-series dataset used to train the baseline model.
- the training time-series dataset of data includes five days of sample values.
- Chart 622 depicts time-series signal 624 , which is monitored for anomalies using upper limit 626 and lower limit 628 of the trained baseline model.
- no seasonal patterns were detected in the training time-series dataset.
- an MCI model is used to represent the baseline, and there is no variation in the uncertainty interval.
- FIG. 7 illustrates an example difference between a baseline model before and after smoothing to account for drift in measurement in accordance with one or more embodiments.
- Chart 700 depicts thirty days of samples used to train the baseline model.
- Chart 710 depicts a baseline that is not smoothed over a prescribed window.
- the evaluation time series signal 712 briefly crosses the upper limit of baseline 714 , which may be flagged as an anomaly. In this example, the anomaly occurs in a sparse high season and is due to measurement variability.
- Chart 720 depicts the result of smoothing the baseline over a prescribed window. Evaluation time-series signal 722 does not cross the upper limit of smoothed baseline 724 . Thus, no false flag is generated in this instance.
- FIG. 8 illustrates an example deviation from a baseline model that is classified as statistically insignificant in accordance with one or more embodiments.
- Chart 800 depicts a training time-series dataset
- chart 810 depicts an example evaluation of time-series signal 812 using a trained baseline.
- time-series signal 812 briefly crosses the upper limit 814 .
- the CUSUM of the deviation has not exceeded a threshold. Therefore, the deviation is not flagged as an anomaly in this instance. In other cases, even slight deviations may be flagged as deviations—the thresholds may be tuned based on system sensitivity.
- baseline and anomaly detection services 130 includes an interface, such as a GUI, CLI, and/or API, for presenting and responding to detected anomalies.
- a GUI interface may present an interactive visualization to a user upon detecting an anomaly.
- the interactive visualization may include a graph of time-series data, such as those depicted in FIGS. 6A, 6B, AND 6C , that displays information about the detected anomalies.
- Example information may include, but is not limited, the time the anomaly was first detected, the magnitude and duration of the anomaly, and information (e.g. hostnames, IP addresses, resource type) about the target or set of targets which triggered the alert.
- an interactive visualization may highlight a temporal region on a graph where the anomaly occurred. For example, if a time-series signal crosses an upper or lower limit of the baseline on Monday, from 2:00-4:00 p.m., this temporal region of the graph may be highlighted in red or another distinguishing color to allow the user to more easily identify the duration and magnitude of the deviation.
- an interactive visualization may allow a user to click or otherwise select temporal regions of a graph to view more details about an anomaly. For example, responsive to an anomaly being detected, an initial chart may be displayed with a temporal region being highlighted where an anomaly was detected. Additional details about the anomaly may be stored in data repository 140 without being initially displayed. Responsive to clicking on the temporal region, the system may access the additional details from data repository 140 and display them to the end user. The additional details may give more specifics about the cause of the anomaly. For instance, if CPU utilization on a target host crosses an upper limit, additional details about the demands (e.g., the number of executions, transactions, user calls, etc.) on the target host may be presented.
- the demands e.g., the number of executions, transactions, user calls, etc.
- an interactive visualization may visually depict shifts in different intervals. For example, the uncertainty interval for a high season may be displayed in one color, while the uncertainty interval for a low season may be displayed in a different color on the same graph. Additionally or alternatively, the transition point between the high and low season may be marked with a transition point, label, or other visual indicator.
- an interactive visualization may allow a user to perform one or more responsive actions when an anomaly is detected. For example, a user may shut down a host, throttle requests, or perform any of the other responsive actions previously described.
- the interactive visualization may thus help users quickly identify and respond to problematic resource behavior within a cloud or other computing environment.
- baselines are continuously or periodically updated as new time-series data is received from targets 112 a - i. Responsive to receiving new time-series data, the training process may be re-executed to adjust a previously generated baseline model. For example, the new data points may be appended to the end of the previously used training set of data. The Additive or Multiplicative Holt Winters model may then be fit to the updated training dataset.
- baseline models may become more accurate over time.
- New seasonal patterns may be learned and/or previously modelled seasonal patterns may be refined. Uncertainty intervals may also begin to narrow as seasonal patterns become more defined.
- FIG. 9 illustrates an example evolution of a baseline model in accordance with one or more embodiments.
- Chart 900 depicts a training set with five days of sample values.
- Chart 910 depicts a trained baseline model having upper limit 912 and lower limit 914 .
- Evaluation time-series data 916 briefly crosses upper limit 912 of the MCI baseline model. As more time-series data is received, seasonal patterns are extrapolated and modelled.
- Chart 920 depicts thirty-one days of sample values used to update the baseline model.
- Chart 930 depicts updated upper limit 932 and lower limit 934 of the baseline model.
- Evaluation time-series data 936 has a similar shape as evaluation time-series data 916 , but does not cross the limits of the updated baseline model. Thus, the unsupervised training process has improved the baseline model over time as more samples are received.
- a baseline model may transition between modelling seasonal patterns recurring at different seasonal periods. For example, initially, a baseline model may be trained by fitting a non-seasonal model to the training dataset. As more data points are received, daily seasonal patterns may be extrapolated, and the baseline may be updated accordingly. As even more data points are received, the updated training dataset may be fit to a weekly seasonal model. Additionally or alternatively, the baseline may be updated to represent patters of other seasonal durations (e.g., bi-weekly, monthly, semi-annually, holidays, etc.)
- training of a baseline model may be paused around potential transition points. Pausing training may help smooth the transition between different types of seasonality.
- FIG. 10 illustrates an example difference in transitioning from one baseline model using different approaches in accordance with one or more embodiments.
- Chart 1000 illustrates a training series data with ten days of sample data.
- the baseline model transitions from daily to weekly seasonality.
- Chart 1010 depicts an example baseline model that is generated without pausing training.
- evaluation dataset 1012 crosses upper limit 1014 of the baseline model. The reason for this breach is that weekdays and weekends are unbalanced.
- the training data may potentially have two weekends worth of samples but only one sample for weekdays, which biases the model toward the low end of the spectrum in the present example.
- the training set of data may be truncated to seven days until at least eleven days of training data have been received, effectively pausing training of the baseline for three or more days.
- Chart 1020 depicts the result of truncating the training set of data to seven days.
- evaluation dataset 1022 does not cross the upper limit 1024 of the baseline model.
- the baseline intervals are larger in this case until more than ten days of data are received. After this point, the risk of imbalance is mitigated, and the baseline interval may begin to narrow/improve without triggering false alerts.
- a computer network provides connectivity among a set of nodes.
- the nodes may be local to and/or remote from each other.
- the nodes are connected by a set of links. Examples of links include a coaxial cable, an unshielded twisted cable, a copper cable, an optical fiber, and a virtual link.
- a subset of nodes implements the computer network. Examples of such nodes include a switch, a router, a firewall, and a network address translator (NAT). Another subset of nodes uses the computer network.
- Such nodes may execute a client process and/or a server process.
- a client process makes a request for a computing service (such as, execution of a particular application, and/or storage of a particular amount of data).
- a server process responds by executing the requested service and/or returning corresponding data.
- a computer network may be a physical network, including physical nodes connected by physical links.
- a physical node is any digital device.
- a physical node may be a function-specific hardware device, such as a hardware switch, a hardware router, a hardware firewall, and a hardware NAT. Additionally or alternatively, a physical node may be a generic machine that is configured to execute various virtual machines and/or applications performing respective functions.
- a physical link is a physical medium connecting two or more physical nodes. Examples of links include a coaxial cable, an unshielded twisted cable, a copper cable, and an optical fiber.
- a computer network may be an overlay network.
- An overlay network is a logical network implemented on top of another network (such as, a physical network).
- Each node in an overlay network corresponds to a respective node in the underlying network.
- each node in an overlay network is associated with both an overlay address (to address to the overlay node) and an underlay address (to address the underlay node that implements the overlay node).
- An overlay node may be a digital device and/or a software process (such as, a virtual machine, an application instance, or a thread)
- a link that connects overlay nodes is implemented as a tunnel through the underlying network.
- the overlay nodes at either end of the tunnel treat the underlying multi-hop path between them as a single logical link. Tunneling is performed through encapsulation and decapsulation.
- a client may be local to and/or remote from a computer network.
- the client may access the computer network over other computer networks, such as a private network or the Internet.
- the client may communicate requests to the computer network using a communications protocol, such as Hypertext Transfer Protocol (HTTP).
- HTTP Hypertext Transfer Protocol
- the requests are communicated through an interface, such as a client interface (such as a web browser), a program interface, or an application programming interface (API).
- HTTP Hypertext Transfer Protocol
- the requests are communicated through an interface, such as a client interface (such as a web browser), a program interface, or an application programming interface (API).
- HTTP Hypertext Transfer Protocol
- API application programming interface
- a computer network provides connectivity between clients and network resources.
- Network resources include hardware and/or software configured to execute server processes. Examples of network resources include a processor, a data storage, a virtual machine, a container, and/or a software application.
- Network resources are shared amongst multiple clients. Clients request computing services from a computer network independently of each other.
- Network resources are dynamically assigned to the requests and/or clients on an on-demand basis.
- Network resources assigned to each request and/or client may be scaled up or down based on, for example, (a) the computing services requested by a particular client, (b) the aggregated computing services requested by a particular tenant, and/or (c) the aggregated computing services requested of the computer network.
- Such a computer network may be referred to as a “cloud network.”
- a service provider provides a cloud network to one or more end users.
- Various service models may be implemented by the cloud network, including but not limited to Software-as-a-Service (SaaS), Platform-as-a-Service (PaaS), and Infrastructure-as-a-Service (IaaS).
- SaaS Software-as-a-Service
- PaaS Platform-as-a-Service
- IaaS Infrastructure-as-a-Service
- SaaS a service provider provides end users the capability to use the service provider's applications, which are executing on the network resources.
- PaaS the service provider provides end users the capability to deploy custom applications onto the network resources.
- the custom applications may be created using programming languages, libraries, services, and tools supported by the service provider.
- IaaS the service provider provides end users the capability to provision processing, storage, networks, and other fundamental computing resources provided by the network resources. Any arbitrary applications, including an operating system, may be deployed on the network resources.
- various deployment models may be implemented by a computer network, including but not limited to a private cloud, a public cloud, and a hybrid cloud.
- a private cloud network resources are provisioned for exclusive use by a particular group of one or more entities (the term “entity” as used herein refers to a corporation, organization, person, or other entity).
- entity refers to a corporation, organization, person, or other entity.
- the network resources may be local to and/or remote from the premises of the particular group of entities.
- cloud resources are provisioned for multiple entities that are independent from each other (also referred to as “tenants” or “customers”).
- the computer network and the network resources thereof are accessed by clients corresponding to different tenants.
- Such a computer network may be referred to as a “multi-tenant computer network.”
- Several tenants may use a same particular network resource at different times and/or at the same time.
- the network resources may be local to and/or remote from the premises of the tenants.
- a computer network comprises a private cloud and a public cloud.
- An interface between the private cloud and the public cloud allows for data and application portability. Data stored at the private cloud and data stored at the public cloud may be exchanged through the interface.
- Applications implemented at the private cloud and applications implemented at the public cloud may have dependencies on each other. A call from an application at the private cloud to an application at the public cloud (and vice versa) may be executed through the interface.
- tenants of a multi-tenant computer network are independent of each other.
- a business or operation of one tenant may be separate from a business or operation of another tenant.
- Different tenants may demand different network requirements for the computer network. Examples of network requirements include processing speed, amount of data storage, security requirements, performance requirements, throughput requirements, latency requirements, resiliency requirements, Quality of Service (QoS) requirements, tenant isolation, and/or consistency.
- QoS Quality of Service
- tenant isolation and/or consistency.
- the same computer network may need to implement different network requirements demanded by different tenants.
- tenant isolation is implemented to ensure that the applications and/or data of different tenants are not shared with each other.
- Various tenant isolation approaches may be used.
- each tenant is associated with a tenant ID.
- Each network resource of the multi-tenant computer network is tagged with a tenant ID.
- a tenant is permitted access to a particular network resource only if the tenant and the particular network resources are associated with a same tenant ID.
- each tenant is associated with a tenant ID.
- Each application, implemented by the computer network is tagged with a tenant ID.
- each data structure and/or dataset, stored by the computer network is tagged with a tenant ID.
- a tenant is permitted access to a particular application, data structure, and/or dataset only if the tenant and the particular application, data structure, and/or dataset are associated with a same tenant ID.
- each database implemented by a multi-tenant computer network may be tagged with a tenant ID. Only a tenant associated with the corresponding tenant ID may access data of a particular database.
- each entry in a database implemented by a multi-tenant computer network may be tagged with a tenant ID. Only a tenant associated with the corresponding tenant ID may access data of a particular entry.
- the database may be shared by multiple tenants.
- a subscription list indicates which tenants have authorization to access which applications. For each application, a list of tenant IDs of tenants authorized to access the application is stored. A tenant is permitted access to a particular application only if the tenant ID of the tenant is included in the subscription list corresponding to the particular application.
- network resources such as digital devices, virtual machines, application instances, and threads
- packets from any source device in a tenant overlay network may only be transmitted to other devices within the same tenant overlay network.
- Encapsulation tunnels are used to prohibit any transmissions from a source device on a tenant overlay network to devices in other tenant overlay networks.
- the packets, received from the source device are encapsulated within an outer packet.
- the outer packet is transmitted from a first encapsulation tunnel endpoint (in communication with the source device in the tenant overlay network) to a second encapsulation tunnel endpoint (in communication with the destination device in the tenant overlay network).
- the second encapsulation tunnel endpoint decapsulates the outer packet to obtain the original packet transmitted by the source device.
- the original packet is transmitted from the second encapsulation tunnel endpoint to the destination device in the same particular overlay network.
- microservice in this context refers to software logic designed to be independently deployable, having endpoints that may be logically coupled to other microservices to build a variety of applications.
- Applications built using microservices are distinct from monolithic applications, which are designed as a single fixed unit and generally comprise a single logical executable. With microservice applications, different microservices are independently deployable as separate executables.
- Microservices may communicate using HyperText Transfer Protocol (HTTP) messages and/or according to other communication protocols via API endpoints. Microservices may be managed and updated separately, written in different languages, and be executed independently from other microservices.
- HTTP HyperText Transfer Protocol
- Microservices provide flexibility in managing and building applications. Different applications may be built by connecting different sets of microservices without changing the source code of the microservices. Thus, the microservices act as logical building blocks that may be arranged in a variety of ways to build different applications. Microservices may provide monitoring services that notify a microservices manager (such as If-This-Then-That (IFTTT), Zapier, or Oracle Self-Service Automation (OSSA)) when trigger events from a set of trigger events exposed to the microservices manager occur.
- a microservices manager such as If-This-Then-That (IFTTT), Zapier, or Oracle Self-Service Automation (OSSA)
- Microservices exposed for an application may alternatively or additionally provide action services that perform an action in the application (controllable and configurable via the microservices manager by passing in values, connecting the actions to other triggers and/or data passed along from other actions in the microservices manager) based on data received from the microservices manager.
- the microservice triggers and/or actions may be chained together to form recipes of actions that occur in optionally different applications that are otherwise unaware of or have no control or dependency on each other.
- These managed applications may be authenticated or plugged in to the microservices manager, for example, with user-supplied application credentials to the manager, without requiring reauthentication each time the managed application is used alone or in combination with other applications.
- microservices may be connected via a GUI.
- microservices may be displayed as logical blocks within a window, frame, other element of a GUI.
- a user may drag and drop microservices into an area of the GUI used to build an application.
- the user may connect the output of one microservice into the input of another microservice using directed arrows or any other GUI element.
- the application builder may run verification tests to confirm that the output and inputs are compatible (e.g., by checking the datatypes, size restrictions, etc.)
- a microservice may trigger a notification (into the microservices manager for optional use by other plugged in applications, herein referred to as the “target” microservice) based on the above techniques and/or may be represented as a GUI block and connected to one or more other microservices.
- the trigger condition may include absolute or relative thresholds for values, and/or absolute or relative thresholds for the amount or duration of data to analyze, such that the trigger to the microservices manager occurs whenever a plugged-in microservice application detects that a threshold is crossed. For example, a user may request a trigger into the microservices manager when the microservice application detects a value has crossed a triggering threshold.
- the trigger when satisfied, might output data for consumption by the target microservice.
- the trigger when satisfied, outputs a binary value indicating the trigger has been satisfied, or outputs the name of the field or other context information for which the trigger condition was satisfied.
- the target microservice may be connected to one or more other microservices such that an alert is input to the other microservices.
- Other microservices may perform responsive actions based on the above techniques, including, but not limited to, deploying additional resources, adjusting system configurations, and/or generating GUIs.
- a plugged-in microservice application may expose actions to the microservices manager.
- the exposed actions may receive, as input, data or an identification of a data object or location of data, that causes data to be moved into a data cloud.
- the exposed actions may receive, as input, a request to increase or decrease existing alert thresholds.
- the input might identify existing in-application alert thresholds and whether to increase or decrease, or delete the threshold. Additionally or alternatively, the input might request the microservice application to create new in-application alert thresholds.
- the in-application alerts may trigger alerts to the user while logged into the application, or may trigger alerts to the user using default or user-selected alert mechanisms available within the microservice application itself, rather than through other applications plugged into the microservices manager.
- the microservice application may generate and provide an output based on input that identifies, locates, or provides historical data, and defines the extent or scope of the requested output.
- the action when triggered, causes the microservice application to provide, store, or display the output, for example, as a data model or as aggregate data that describes a data model.
- the techniques described herein are implemented by one or more special-purpose computing devices.
- the special-purpose computing devices may be hard-wired to perform the techniques, or may include digital electronic devices such as one or more application-specific integrated circuits (ASICs) or field programmable gate arrays (FPGAs) that are persistently programmed to perform the techniques, or may include one or more general purpose hardware processors programmed to perform the techniques pursuant to program instructions in firmware, memory, other storage, or a combination.
- ASICs application-specific integrated circuits
- FPGAs field programmable gate arrays
- Such special-purpose computing devices may also combine custom hard-wired logic, ASICs, or FPGAs with custom programming to accomplish the techniques.
- the special-purpose computing devices may be desktop computer systems, portable computer systems, handheld devices, networking devices or any other device that incorporates hard-wired and/or program logic to implement the techniques.
- FIG. 11 is a block diagram that illustrates computer system 1100 upon which one or more embodiments may be implemented.
- Computer system 1100 includes bus 1102 or other communication mechanism for communicating information, and hardware processor 1104 coupled with bus 1102 for processing information.
- Hardware processor 1104 may be, for example, a general purpose microprocessor.
- Computer system 1100 also includes main memory 1106 , such as a random access memory (RAM) or other dynamic storage device, coupled to bus 1102 for storing information and instructions to be executed by processor 1104 .
- Main memory 1106 also may be used for storing temporary variables or other intermediate information during execution of instructions to be executed by processor 1104 .
- Such instructions when stored in non-transitory storage media accessible to processor 1104 , render computer system 1100 into a special-purpose machine that is customized to perform the operations specified in the instructions.
- Computer system 1100 further includes read only memory (ROM) 1108 or other static storage device coupled to bus 1102 for storing static information and instructions for processor 1104 .
- Storage device 1110 such as a magnetic disk or optical disk, is provided and coupled to bus 1102 for storing information and instructions.
- Computer system 1100 may be coupled via bus 1102 to display 1112 , such as a cathode ray tube (CRT), liquid crystal display (LCD), or light-emitting diode (LED), for displaying information to a computer user.
- Display 1112 such as a cathode ray tube (CRT), liquid crystal display (LCD), or light-emitting diode (LED), for displaying information to a computer user.
- Input device 1114 which may include physical and/or touchscreen based alphanumeric keys, is coupled to bus 1102 for communicating information and command selections to processor 1104 .
- cursor control 1116 is Another type of user input device.
- cursor control 1116 such as a mouse, a trackball, or cursor direction keys for communicating direction information and command selections to processor 1104 and for controlling cursor movement on display 1112 .
- This input device typically has two degrees of freedom in two axes, a first axis (e.g., x) and a second axis (
- Computer system 1100 may implement the techniques described herein using customized hard-wired logic, one or more ASICs or FPGAs, firmware and/or program logic which in combination with the computer system causes or programs computer system 1100 to be a special-purpose machine. According to one embodiment, the techniques herein are performed by computer system 1100 in response to processor 1104 executing one or more sequences of one or more instructions contained in main memory 1106 . Such instructions may be read into main memory 1106 from another storage medium, such as storage device 1110 . Execution of the sequences of instructions contained in main memory 1106 causes processor 1104 to perform the process steps described herein. In alternative embodiments, hard-wired circuitry may be used in place of or in combination with software instructions.
- Non-volatile media includes, for example, optical or magnetic disks, such as storage device 1110 .
- Volatile media includes dynamic memory, such as main memory 1106 .
- Common forms of storage media include, for example, a floppy disk, a flexible disk, hard disk, solid state drive, magnetic tape, or any other magnetic data storage medium, a CD-ROM, any other optical data storage medium, any physical medium with patterns of holes, a RAM, a PROM, and EPROM, a FLASH-EPROM, NVRAM, any other memory chip or cartridge.
- Storage media is distinct from but may be used in conjunction with transmission media.
- Transmission media participates in transferring information between storage media.
- transmission media includes coaxial cables, copper wire and fiber optics, including the wires that comprise bus 1102 .
- transmission media can also take the form of acoustic or light waves, such as those generated during radio-wave and infra-red data communications.
- Various forms of media may be involved in carrying one or more sequences of one or more instructions to processor 1104 for execution.
- the instructions may initially be carried on a magnetic disk or solid state drive of a remote computer.
- the remote computer can load the instructions into its dynamic memory and send the instructions over a telephone line using a modem.
- a modem local to computer system 1100 can receive the data on the telephone line and use an infra-red transmitter to convert the data to an infra-red signal.
- An infra-red detector can receive the data carried in the infra-red signal and appropriate circuitry can place the data on bus 1102 .
- Bus 1102 carries the data to main memory 1106 , from which processor 1104 retrieves and executes the instructions.
- the instructions received by main memory 1106 may optionally be stored on storage device 1110 either before or after execution by processor 1104 .
- Computer system 1100 also includes a communication interface 1118 coupled to bus 1102 .
- Communication interface 1118 provides a two-way data communication coupling to a network link 1120 that is connected to local network 1122 .
- communication interface 1118 may be an integrated services digital network (ISDN) card, cable modem, satellite modem, or a modem to provide a data communication connection to a corresponding type of telephone line.
- ISDN integrated services digital network
- communication interface 1118 may be a local area network (LAN) card to provide a data communication connection to a compatible LAN.
- LAN local area network
- Wireless links may also be implemented.
- communication interface 1118 sends and receives electrical, electromagnetic or optical signals that carry digital data streams representing various types of information.
- Network link 1120 typically provides data communication through one or more networks to other data devices.
- network link 1120 may provide a connection through local network 1122 to host computer 1124 or to data equipment operated by Internet Service Provider (ISP) 1126 .
- ISP 1126 in turn provides data communication services through the world wide packet data communication network now commonly referred to as the “Internet” 1128 .
- Internet 1128 uses electrical, electromagnetic or optical signals that carry digital data streams.
- the signals through the various networks and the signals on network link 1120 and through communication interface 1118 , which carry the digital data to and from computer system 1100 are example forms of transmission media.
- Computer system 1100 can send messages and receive data, including program code, through the network(s), network link 1120 and communication interface 1118 .
- server 1130 might transmit a requested code for an application program through Internet 1128 , ISP 1126 , local network 1122 and communication interface 1118 .
- the received code may be executed by processor 1104 as it is received, and/or stored in storage device 1110 , or other non-volatile storage for later execution.
- Embodiments are directed to a system with one or more devices that include a hardware processor and that are configured to perform any of the operations described herein and/or recited in any of the claims below.
- a non-transitory computer readable storage medium comprises instructions which, when executed by one or more hardware processors, causes performance of any of the operations described herein and/or recited in any of the claims. Any combination of the features and functionalities described herein may be used in accordance with one or more embodiments.
- embodiments have been described with reference to numerous specific details that may vary from implementation to implementation. The specification and drawings are, accordingly, to be regarded in an illustrative rather than a restrictive sense. The sole and exclusive indicator of the scope of the invention, and what is intended by the applicants to be the scope of the invention, is the literal and equivalent scope of the set of claims that issue from this application, in the specific form in which such claims issue, including any subsequent correction.
Abstract
Description
-
- 1. GENERAL OVERVIEW
- 2. ARCHITECTURAL AND FUNCTIONAL OVERVIEW
- 3. UNSUPERVISED BASELINE MODELLING OF RESOURCE BEHAVIOR
- 4. UNSUPERVISED MONITORING AND ANOMALY DETECTION
- 5. BASELINE UPDATES AND TRANSITIONS
- 6. COMPUTER NETWORKS AND CLOUD NETWORKS
- 7. MICROSERVICE APPLICATIONS
- 8. HARDWARE OVERVIEW
- 9. MISCELLANEOUS; EXTENSIONS
L t=α(X t −S t−p)+(1−α)(L t−1 +T t−1) (1)
T t=γ(L t −L t−1)+(1−γ)T t−1 (2)
S t=δ(X t −L t)+(1−δ)S t−p (3)
where Xt, Lt, Tt, and St denote the observed level, local mean level, trend, and seasonal index at time t, respectively. Parameters α, γ, δ denote smoothing parameters for updating the mean level, trend, and seasonal index, respectively, and p denotes the duration of the seasonal pattern. An expected value at future time t+k may be given as follows:
F t+k =L t +k T t +S t+k−p (4)
The Multiplicative Holt-Winters models is given by the following formulas:
L t=α(X t /S t−p)+(1−α)(L t−1 +T t−1) (5)
T t=γ(L t −L t−1)+(1−γ)T t−1 (6)
S t=δ(X t /L t)+(1−δ)S t−p (7)
where, as before, Xt, Lt, Tt, and St denote the observed level, local mean level, trend, and seasonal index of the correlation time series at time t, respectively. An expected value at time t+k is then given by the following formula:
F t+k=(L t +k T t)S t+k−p (8)
In other embodiments, the process may attempt to fit the extracted time-series data points to other seasonal models, such as seasonal autoregressive integrated moving average (ARIMA) models.
where
Claims (20)
Priority Applications (3)
| Application Number | Priority Date | Filing Date | Title |
|---|---|---|---|
| US15/609,938 US10635563B2 (en) | 2016-08-04 | 2017-05-31 | Unsupervised method for baselining and anomaly detection in time-series data for enterprise systems |
| US16/524,007 US11082439B2 (en) | 2016-08-04 | 2019-07-27 | Unsupervised method for baselining and anomaly detection in time-series data for enterprise systems |
| US17/356,186 US20210320939A1 (en) | 2016-08-04 | 2021-06-23 | Unsupervised method for baselining and anomaly detection in time-series data for enterprise systems |
Applications Claiming Priority (2)
| Application Number | Priority Date | Filing Date | Title |
|---|---|---|---|
| US201662370880P | 2016-08-04 | 2016-08-04 | |
| US15/609,938 US10635563B2 (en) | 2016-08-04 | 2017-05-31 | Unsupervised method for baselining and anomaly detection in time-series data for enterprise systems |
Related Child Applications (1)
| Application Number | Title | Priority Date | Filing Date |
|---|---|---|---|
| US16/524,007 Continuation-In-Part US11082439B2 (en) | 2016-08-04 | 2019-07-27 | Unsupervised method for baselining and anomaly detection in time-series data for enterprise systems |
Publications (2)
| Publication Number | Publication Date |
|---|---|
| US20180039555A1 US20180039555A1 (en) | 2018-02-08 |
| US10635563B2 true US10635563B2 (en) | 2020-04-28 |
Family
ID=61071987
Family Applications (1)
| Application Number | Title | Priority Date | Filing Date |
|---|---|---|---|
| US15/609,938 Active 2037-11-16 US10635563B2 (en) | 2016-08-04 | 2017-05-31 | Unsupervised method for baselining and anomaly detection in time-series data for enterprise systems |
Country Status (1)
| Country | Link |
|---|---|
| US (1) | US10635563B2 (en) |
Cited By (6)
| Publication number | Priority date | Publication date | Assignee | Title |
|---|---|---|---|---|
| US10990891B1 (en) * | 2017-09-07 | 2021-04-27 | Amazon Technologies, Inc. | Predictive modeling for aggregated metrics |
| US20210406148A1 (en) * | 2020-06-30 | 2021-12-30 | Salesforce.Com, Inc. | Anomaly detection and root cause analysis in a multi-tenant environment |
| US11363049B1 (en) | 2021-03-25 | 2022-06-14 | Bank Of America Corporation | Information security system and method for anomaly detection in data transmission |
| US20220335347A1 (en) * | 2021-04-15 | 2022-10-20 | Business Objects Software Ltd | Time-series anomaly prediction and alert |
| US11635983B2 (en) | 2021-04-13 | 2023-04-25 | Hewlett Packard Enterprise Development Lp | Pre-trained software containers for datacenter analysis |
| EP4276627A1 (en) | 2022-05-12 | 2023-11-15 | Bull SAS | Iterative method for monitoring a computing device |
Families Citing this family (55)
| Publication number | Priority date | Publication date | Assignee | Title |
|---|---|---|---|---|
| US10699211B2 (en) | 2016-02-29 | 2020-06-30 | Oracle International Corporation | Supervised method for classifying seasonal patterns |
| US11113852B2 (en) | 2016-02-29 | 2021-09-07 | Oracle International Corporation | Systems and methods for trending patterns within time-series data |
| US10331802B2 (en) | 2016-02-29 | 2019-06-25 | Oracle International Corporation | System for detecting and characterizing seasons |
| US10885461B2 (en) | 2016-02-29 | 2021-01-05 | Oracle International Corporation | Unsupervised method for classifying seasonal patterns |
| US10325386B2 (en) * | 2016-03-31 | 2019-06-18 | Ca, Inc. | Visual generation of an anomaly detection image |
| US10198339B2 (en) | 2016-05-16 | 2019-02-05 | Oracle International Corporation | Correlation-based analytic for time-series data |
| US11082439B2 (en) | 2016-08-04 | 2021-08-03 | Oracle International Corporation | Unsupervised method for baselining and anomaly detection in time-series data for enterprise systems |
| US10484102B2 (en) | 2016-09-02 | 2019-11-19 | Qualcomm Incorporated | Signaling mechanism to enable local operation for multi-antenna wireless communication systems |
| CN107846295B (en) * | 2016-09-19 | 2020-06-26 | 华为技术有限公司 | Microservice configuration device and method |
| US10395016B2 (en) * | 2017-01-24 | 2019-08-27 | International Business Machines Corporation | Communication pattern recognition |
| US11093136B2 (en) * | 2017-02-01 | 2021-08-17 | Hewlett-Packard Development Company, L.P. | Performance threshold |
| US10949436B2 (en) | 2017-02-24 | 2021-03-16 | Oracle International Corporation | Optimization for scalable analytics using time series models |
| US10915830B2 (en) | 2017-02-24 | 2021-02-09 | Oracle International Corporation | Multiscale method for predictive alerting |
| US10817803B2 (en) | 2017-06-02 | 2020-10-27 | Oracle International Corporation | Data driven methods and systems for what if analysis |
| US10484410B2 (en) * | 2017-07-19 | 2019-11-19 | Cisco Technology, Inc. | Anomaly detection for micro-service communications |
| US10909022B2 (en) * | 2017-09-12 | 2021-02-02 | Facebook, Inc. | Systems and methods for identifying and tracking application performance incidents |
| US11036715B2 (en) * | 2018-01-29 | 2021-06-15 | Microsoft Technology Licensing, Llc | Combination of techniques to detect anomalies in multi-dimensional time series |
| US10187326B1 (en) | 2018-02-22 | 2019-01-22 | Capital One Services, Llc | Real-time analysis of multidimensional time series data to identify an operational anomaly |
| US11108795B2 (en) * | 2018-05-25 | 2021-08-31 | At&T Intellectual Property I, L.P. | Intrusion detection using robust singular value decomposition |
| US10963346B2 (en) | 2018-06-05 | 2021-03-30 | Oracle International Corporation | Scalable methods and systems for approximating statistical distributions |
| US10997517B2 (en) | 2018-06-05 | 2021-05-04 | Oracle International Corporation | Methods and systems for aggregating distribution approximations |
| US11095728B2 (en) * | 2018-06-21 | 2021-08-17 | Disney Enterprises, Inc. | Techniques for automatically interpreting metric values to evaluate the health of a computer-based service |
| CN109684179B (en) * | 2018-09-03 | 2022-05-17 | 平安科技(深圳)有限公司 | Early warning method, device, equipment and storage medium for system fault |
| US11138090B2 (en) | 2018-10-23 | 2021-10-05 | Oracle International Corporation | Systems and methods for forecasting time series with variable seasonality |
| US11055162B2 (en) * | 2018-10-31 | 2021-07-06 | Salesforce.Com, Inc. | Database system performance degradation detection |
| CN111197480B (en) * | 2018-10-31 | 2023-05-23 | 北京国双科技有限公司 | Information processing method and related equipment |
| US11388040B2 (en) | 2018-10-31 | 2022-07-12 | EXFO Solutions SAS | Automatic root cause diagnosis in networks |
| CN109684163A (en) * | 2018-11-14 | 2019-04-26 | 合肥市航嘉电子技术有限公司 | A kind of computer hardware thermal overload from alarm system |
| US11792215B1 (en) * | 2018-12-04 | 2023-10-17 | Amazon Technologies, Inc. | Anomaly detection system for a data monitoring service |
| US11645293B2 (en) | 2018-12-11 | 2023-05-09 | EXFO Solutions SAS | Anomaly detection in big data time series analysis |
| EP3871120A1 (en) * | 2018-12-17 | 2021-09-01 | Huawei Technologies Co., Ltd. | Apparatus and method for detecting an anomaly among successive events and computer program product therefor |
| US11093310B2 (en) * | 2018-12-31 | 2021-08-17 | Paypal, Inc. | Flow based pattern intelligent monitoring system |
| US10901375B2 (en) * | 2019-01-31 | 2021-01-26 | Morgan Stanley Services Group Inc. | Chaotic system anomaly response by artificial intelligence |
| US10855548B2 (en) * | 2019-02-15 | 2020-12-01 | Oracle International Corporation | Systems and methods for automatically detecting, summarizing, and responding to anomalies |
| US11533326B2 (en) | 2019-05-01 | 2022-12-20 | Oracle International Corporation | Systems and methods for multivariate anomaly detection in software monitoring |
| EP3739513A1 (en) | 2019-05-13 | 2020-11-18 | Fujitsu Limited | Surface defect identification method and apparatus |
| US11537940B2 (en) | 2019-05-13 | 2022-12-27 | Oracle International Corporation | Systems and methods for unsupervised anomaly detection using non-parametric tolerance intervals over a sliding window of t-digests |
| US20200379867A1 (en) * | 2019-05-31 | 2020-12-03 | Microsoft Technology Licensing, Llc | Anomalous computing resource usage detection based on seasonality-based dynamic thresholds |
| US20210026698A1 (en) * | 2019-07-26 | 2021-01-28 | Microsoft Technology Licensing, Llc | Confidence approximation-based dynamic thresholds for anomalous computing resource usage detection |
| US11887015B2 (en) | 2019-09-13 | 2024-01-30 | Oracle International Corporation | Automatically-generated labels for time series data and numerical lists to use in analytic and machine learning systems |
| US11586706B2 (en) * | 2019-09-16 | 2023-02-21 | Oracle International Corporation | Time-series analysis for forecasting computational workloads |
| US11526790B2 (en) | 2019-09-27 | 2022-12-13 | Oracle International Corporation | Univariate anomaly detection in a sensor network |
| US11060885B2 (en) | 2019-09-30 | 2021-07-13 | Oracle International Corporation | Univariate anomaly detection in a sensor network |
| WO2021155576A1 (en) * | 2020-02-07 | 2021-08-12 | Alibaba Group Holding Limited | Automatic parameter tuning for anomaly detection system |
| EP3866395A1 (en) | 2020-02-12 | 2021-08-18 | EXFO Solutions SAS | Method and system for determining root-cause diagnosis of events occurring during the operation of a communication network |
| US11216247B2 (en) | 2020-03-02 | 2022-01-04 | Oracle International Corporation | Automatic asset anomaly detection in a multi-sensor network |
| WO2022018466A1 (en) | 2020-07-22 | 2022-01-27 | Citrix Systems, Inc. | Determining server utilization using upper bound values |
| US11762956B2 (en) | 2021-02-05 | 2023-09-19 | Oracle International Corporation | Adaptive pattern recognition for a sensor network |
| KR20240008374A (en) * | 2021-05-25 | 2024-01-18 | 구글 엘엘씨 | Machine learning time series anomaly detection |
| US11575586B2 (en) * | 2021-06-23 | 2023-02-07 | Microsoft Technology Licensing, Llc | End-to-end service level metric approximation |
| US20230032678A1 (en) * | 2021-07-29 | 2023-02-02 | Micro Focus Llc | Abnormality detection in log entry collection |
| US11601325B2 (en) * | 2021-07-30 | 2023-03-07 | Microsoft Technology Licensing, Llc | Method and system for evaluating peer groups for comparative anomaly |
| CN113592116B (en) * | 2021-09-28 | 2022-03-01 | 阿里云计算有限公司 | Equipment state analysis method, device, equipment and storage medium |
| US20230169606A1 (en) * | 2021-12-01 | 2023-06-01 | Jpmorgan Chase Bank, N.A. | Systems and methods for data aggregation and post processing using microservices |
| US20230325092A1 (en) * | 2022-04-11 | 2023-10-12 | Dell Products, L.P. | Data Automation and Predictive Modeling for Planning and Procuring Solid State Drive Replacments |
Citations (137)
| Publication number | Priority date | Publication date | Assignee | Title |
|---|---|---|---|---|
| US6298063B1 (en) | 1995-11-03 | 2001-10-02 | Cisco Technology, Inc. | System and method for providing backup machines for implementing multiple IP addresses on multiple ports |
| US20020019860A1 (en) | 2000-08-02 | 2002-02-14 | Lee Gene F. | Method and apparatus for distributed administration of thin client architecture |
| US20020092004A1 (en) | 2000-07-26 | 2002-07-11 | Lee John Michael | Methods and systems for automatically generating software applications |
| US20020183972A1 (en) | 2001-06-01 | 2002-12-05 | Enck Brent A. | Adaptive performance data measurement and collections |
| US20020188650A1 (en) | 2001-06-07 | 2002-12-12 | Intel Corporation | Fault-tolerant system and methods with trusted message acknowledgement |
| US6597777B1 (en) | 1999-06-29 | 2003-07-22 | Lucent Technologies Inc. | Method and apparatus for detecting service anomalies in transaction-oriented networks |
| US20030149603A1 (en) | 2002-01-18 | 2003-08-07 | Bruce Ferguson | System and method for operating a non-linear model with missing data for use in electronic commerce |
| US6643613B2 (en) | 2001-07-03 | 2003-11-04 | Altaworks Corporation | System and method for monitoring performance metrics |
| US20030224344A1 (en) | 2000-03-27 | 2003-12-04 | Ron Shamir | Method and system for clustering data |
| US20040088406A1 (en) | 2002-10-31 | 2004-05-06 | International Business Machines Corporation | Method and apparatus for determining time varying thresholds for monitored metrics |
| US20050119982A1 (en) | 2002-05-10 | 2005-06-02 | Masato Ito | Information processing apparatus and method |
| US20050132030A1 (en) | 2003-12-10 | 2005-06-16 | Aventail Corporation | Network appliance |
| US20050159927A1 (en) | 2004-01-20 | 2005-07-21 | International Business Machines Corporation | Remote enterprise management of high availability systems |
| US20050193281A1 (en) | 2004-01-30 | 2005-09-01 | International Business Machines Corporation | Anomaly detection |
| US6996599B1 (en) | 2000-06-21 | 2006-02-07 | Microsoft Corporation | System and method providing multi-tier applications architecture |
| US20060087962A1 (en) | 2004-10-27 | 2006-04-27 | Anthony Golia | Fault tolerant network architecture |
| US20060212593A1 (en) | 2004-05-21 | 2006-09-21 | Bea Systems, Inc. | Dynamic service composition and orchestration |
| US20060287848A1 (en) | 2005-06-20 | 2006-12-21 | Microsoft Corporation | Language classification with random feature clustering |
| US20070011281A1 (en) | 2005-06-09 | 2007-01-11 | International Business Machines Corporation | Methods, apparatus and computer programs for automated problem solving in a distributed, collaborative environment |
| US20070150329A1 (en) | 2005-12-22 | 2007-06-28 | Canon Kabushiki Kaisha | Just-in-time workflow |
| US20070179836A1 (en) | 2005-08-10 | 2007-08-02 | American Express Travel Related Services Company, Inc. | System, method, and computer program product for increasing inventory turnover using targeted consumer offers |
| US7343375B1 (en) | 2004-03-01 | 2008-03-11 | The Directv Group, Inc. | Collection and correlation over time of private viewing usage data |
| US20080221974A1 (en) | 2007-02-22 | 2008-09-11 | Alexander Gilgur | Lazy Evaluation of Bulk Forecasts |
| US20080288089A1 (en) | 2007-05-15 | 2008-11-20 | Fisher-Rosemount Systems, Inc. | Methods and systems for batch processing and execution in a process system |
| US20090030752A1 (en) | 2007-07-27 | 2009-01-29 | General Electric Company | Fleet anomaly detection method |
| US7529991B2 (en) | 2007-01-30 | 2009-05-05 | International Business Machines Corporation | Scoring method for correlation anomalies |
| US20100027552A1 (en) | 2008-06-19 | 2010-02-04 | Servicemesh, Inc. | Cloud computing gateway, cloud computing hypervisor, and methods for implementing same |
| US20100050023A1 (en) | 2005-07-29 | 2010-02-25 | Bmc Software, Inc. | System, method and computer program product for optimized root cause analysis |
| US7672814B1 (en) | 2004-03-03 | 2010-03-02 | Emc Corporation | System and method for baseline threshold monitoring |
| US20100082697A1 (en) | 2008-10-01 | 2010-04-01 | Narain Gupta | Data model enrichment and classification using multi-model approach |
| US20100082132A1 (en) | 2008-09-29 | 2010-04-01 | Fisher-Rosemount Systems, Inc. | Recipe Command Steps and Recipe Inputs from External Logic |
| US7739284B2 (en) | 2005-04-20 | 2010-06-15 | International Business Machines Corporation | Method and apparatus for processing data streams |
| US7739143B1 (en) | 2005-03-24 | 2010-06-15 | Amazon Technologies, Inc. | Robust forecasting techniques with reduced sensitivity to anomalous data |
| US7783510B1 (en) | 2006-06-23 | 2010-08-24 | Quest Software, Inc. | Computer storage capacity forecasting system using cluster-based seasonality analysis |
| US20100257133A1 (en) | 2005-05-09 | 2010-10-07 | Crowe Keith E | Computer-Implemented System And Method For Storing Data Analysis Models |
| US20100324869A1 (en) | 2009-06-17 | 2010-12-23 | Ludmila Cherkasova | Modeling a computing entity |
| US20110022879A1 (en) | 2009-07-24 | 2011-01-27 | International Business Machines Corporation | Automated disaster recovery planning |
| US20110040575A1 (en) | 2009-08-11 | 2011-02-17 | Phillip Andrew Wright | Appliance and pair device for providing a reliable and redundant enterprise management solution |
| US20110126197A1 (en) | 2009-11-25 | 2011-05-26 | Novell, Inc. | System and method for controlling cloud and virtualized data centers in an intelligent workload management system |
| WO2011071624A2 (en) | 2009-12-12 | 2011-06-16 | Microsoft Corporation | Cloud computing monitoring and management system |
| US7987106B1 (en) | 2006-06-05 | 2011-07-26 | Turgut Aykin | System and methods for forecasting time series with multiple seasonal patterns |
| US20110213788A1 (en) | 2008-03-05 | 2011-09-01 | Quantum Intelligence, Inc. | Information fusion for multiple anomaly detection systems |
| US20110265164A1 (en) | 2010-04-26 | 2011-10-27 | Vmware, Inc. | Cloud platform architecture |
| US20120005359A1 (en) | 2010-07-01 | 2012-01-05 | Scott Wayne Seago | System and method for aggregation across cloud providers |
| US20120051369A1 (en) | 2010-08-30 | 2012-03-01 | International Business Machines Corporation | Using gathered system activity statistics to determine when to schedule a procedure |
| US20120066389A1 (en) | 2010-09-10 | 2012-03-15 | International Business Machines Corporation | Migration of logical partitions between two devices |
| US20120110583A1 (en) | 2010-10-28 | 2012-05-03 | Balko Soeren | Dynamic parallel looping in process runtime |
| US20120110462A1 (en) | 2010-10-28 | 2012-05-03 | Anand Eswaran | Providing cloud-based computing services |
| US8200454B2 (en) | 2007-07-09 | 2012-06-12 | International Business Machines Corporation | Method, data processing program and computer program product for time series analysis |
| US8229876B2 (en) | 2009-09-01 | 2012-07-24 | Oracle International Corporation | Expediting K-means cluster analysis data mining using subsample elimination preprocessing |
| US8234236B2 (en) | 2009-06-01 | 2012-07-31 | International Business Machines Corporation | System and method for efficient allocation of resources in virtualized desktop environments |
| US20120203823A1 (en) | 2011-02-09 | 2012-08-09 | Gaurav Manglik | Apparatus, systems and methods for deployment and management of distributed computing systems and applications |
| US20120240072A1 (en) | 2011-03-18 | 2012-09-20 | Serious Materials, Inc. | Intensity transform systems and methods |
| US20120254183A1 (en) | 2008-11-10 | 2012-10-04 | Google Inc. | Method and System for Clustering Data Points |
| US20120278663A1 (en) | 2010-01-08 | 2012-11-01 | Hideo Hasegawa | Operation management apparatus, operation management method, and program storage medium |
| US20120323988A1 (en) | 2011-06-16 | 2012-12-20 | Ron Barzel | Task allocation in a computer network |
| US8363961B1 (en) | 2008-10-14 | 2013-01-29 | Adobe Systems Incorporated | Clustering techniques for large, high-dimensionality data sets |
| WO2013016584A1 (en) | 2011-07-26 | 2013-01-31 | Nebula, Inc. | Systems and methods for implementing cloud computing |
| US8576964B2 (en) | 2011-08-05 | 2013-11-05 | Kabushiki Kaisha Toshiba | Radio receiver |
| US20130326202A1 (en) | 2012-05-30 | 2013-12-05 | Roi Rosenthal | Load test capacity planning |
| US20130329981A1 (en) | 2012-06-11 | 2013-12-12 | Canon Kabushiki Kaisha | Radiation imaging apparatus, radiation image processing apparatus, and image processing method |
| US8650299B1 (en) | 2010-02-03 | 2014-02-11 | Citrix Systems, Inc. | Scalable cloud computing |
| US8676964B2 (en) | 2008-07-31 | 2014-03-18 | Riverbed Technology, Inc. | Detecting outliers in network traffic time series |
| US20140095422A1 (en) | 2012-09-28 | 2014-04-03 | Dell Software Inc. | Data metric resolution prediction system and method |
| US8694969B2 (en) | 2008-07-31 | 2014-04-08 | International Business Machines Corporation | Analyzing factory processes in a software factory |
| US20140101300A1 (en) | 2012-10-10 | 2014-04-10 | Elisha J. Rosensweig | Method and apparatus for automated deployment of geographically distributed applications within a cloud |
| US8776066B2 (en) | 2009-11-30 | 2014-07-08 | International Business Machines Corporation | Managing task execution on accelerators |
| US20140215470A1 (en) | 2013-01-25 | 2014-07-31 | Alfonso Íñiguez | Parallel Processing with Proactive Solidarity Cells |
| US20140310714A1 (en) | 2013-04-11 | 2014-10-16 | Oracle International Corporation | Predictive diagnosis of sla violations in cloud services by seasonal trending and forecasting with thread intensity analytics |
| US20140325649A1 (en) | 2013-04-29 | 2014-10-30 | Telefonaktiebolaget L M Ericsson (Publ) | Method and system to dynamically detect traffic anomalies in a network |
| US8880525B2 (en) | 2012-04-02 | 2014-11-04 | Xerox Corporation | Full and semi-batch clustering |
| US20140379717A1 (en) | 2013-06-19 | 2014-12-25 | Oracle International Corporation | Tripoint arbitration for entity classification |
| US8930757B2 (en) | 2011-01-24 | 2015-01-06 | Nec Corporation | Operations management apparatus, operations management method and program |
| US20150032775A1 (en) | 2013-07-26 | 2015-01-29 | Metamarkets Group Inc. | Segment data visibility and management in a distributed database of time stamped records |
| US20150033084A1 (en) | 2013-07-28 | 2015-01-29 | OpsClarity Inc. | Organizing network performance metrics into historical anomaly dependency data |
| US8949677B1 (en) | 2012-05-23 | 2015-02-03 | Amazon Technologies, Inc. | Detecting anomalies in time series data |
| US20150040142A1 (en) | 2013-08-01 | 2015-02-05 | Dell Products L.P. | Efficient dfa generation for non-matching characters and character classes in regular expressions |
| US20150046123A1 (en) | 2012-03-14 | 2015-02-12 | Nec Corporation | Operation management apparatus, operation management method and program |
| US20150046920A1 (en) | 2013-08-12 | 2015-02-12 | Amazon Technologies, Inc. | Request processing techniques |
| US20150180734A1 (en) | 2012-07-03 | 2015-06-25 | Stephane H. Maes | Managing a cloud service |
| US20150244597A1 (en) | 2012-07-03 | 2015-08-27 | Stephane H. Maes | Managing a hybrid cloud service |
| US20150242243A1 (en) | 2014-02-21 | 2015-08-27 | International Business Machines Corporation | Processor power optimization with response time assurance |
| US20150248446A1 (en) | 2006-03-14 | 2015-09-03 | Amazon Technologies, Inc. | Method and system for collecting and analyzing time-series data |
| US20150251074A1 (en) | 2012-09-04 | 2015-09-10 | Whoop, Inc. | Automated exercise recommendations |
| US9141914B2 (en) | 2011-10-31 | 2015-09-22 | Hewlett-Packard Development Company, L.P. | System and method for ranking anomalies |
| US9147167B2 (en) | 2012-11-19 | 2015-09-29 | Oracle International Corporation | Similarity analysis with tri-point data arbitration |
| US20150296030A1 (en) | 2012-07-03 | 2015-10-15 | Stephane Maes | Managing a multitenant cloud service |
| US20150312274A1 (en) | 2014-04-25 | 2015-10-29 | Intuit Inc. | Method and system for ensuring an application conforms with security and regulatory controls prior to deployment |
| US9195563B2 (en) | 2011-03-30 | 2015-11-24 | Bmc Software, Inc. | Use of metrics selected based on lag correlation to provide leading indicators of service performance degradation |
| US9218232B2 (en) | 2011-04-13 | 2015-12-22 | Bar-Ilan University | Anomaly detection methods, devices and systems |
| US20160034328A1 (en) | 2014-07-29 | 2016-02-04 | Oracle International Corporation | Systems and methods for spatially displaced correlation for detecting value ranges of transient correlation in machine data of enterprise systems |
| US20160042289A1 (en) | 2014-08-05 | 2016-02-11 | Oracle International Corporation | Systems and methods for adaptive thresholding using maximum concentration intervals |
| CN105426411A (en) | 2015-10-31 | 2016-03-23 | 南京南瑞继保电气有限公司 | Access trend prediction based time series database cache management method |
| US20160092516A1 (en) | 2014-09-26 | 2016-03-31 | Oracle International Corporation | Metric time series correlation by outlier removal based on maximum concentration interval |
| US20160105327A9 (en) | 2010-04-15 | 2016-04-14 | Caplan Software Development S.R.L. | Automated upgrading method for capacity of it system resources |
| US9323837B2 (en) | 2008-03-05 | 2016-04-26 | Ying Zhao | Multiple domain anomaly detection system and method using fusion rule and visualization |
| US9323599B1 (en) | 2015-07-31 | 2016-04-26 | AppDynamics, Inc. | Time series metric data modeling and prediction |
| US20160139964A1 (en) | 2014-11-17 | 2016-05-19 | Mediatek Inc. | Energy Efficient Multi-Cluster System and Its Operations |
| US9355357B2 (en) | 2011-10-21 | 2016-05-31 | Hewlett Packard Enterprise Development Lp | Computing predicted data according to weighted peak preservation and time distance biasing |
| US9367382B2 (en) | 2012-01-23 | 2016-06-14 | Nec Corporation | Apparatus, method, and program product for calculating abnormality based on degree of correlation destruction |
| US20160171037A1 (en) | 2013-07-19 | 2016-06-16 | Ge Intelligent Platforms, Inc. | Model change boundary on time series data |
| US9389946B2 (en) | 2011-09-19 | 2016-07-12 | Nec Corporation | Operation management apparatus, operation management method, and program |
| US20160253381A1 (en) | 2013-10-31 | 2016-09-01 | Hewlett Packard Enterprise Development Lp | Storing time series data for a search query |
| US20160283533A1 (en) | 2015-03-26 | 2016-09-29 | Oracle International Corporation | Multi-distance clustering |
| US20160292611A1 (en) | 2014-10-09 | 2016-10-06 | Splunk Inc. | System Monitoring with Key Performance Indicators from Shared Base Search of Machine Data |
| US20160294773A1 (en) | 2015-04-03 | 2016-10-06 | Infoblox Inc. | Behavior analysis based dns tunneling detection and classification framework for network security |
| US20160299938A1 (en) | 2015-04-10 | 2016-10-13 | Tata Consultancy Services Limited | Anomaly detection system and method |
| US20160299961A1 (en) | 2014-02-04 | 2016-10-13 | David Allen Olsen | System and method for grouping segments of data sequences into clusters |
| US9471778B1 (en) | 2015-11-30 | 2016-10-18 | International Business Machines Corporation | Automatic baselining of anomalous event activity in time series data |
| US20160321588A1 (en) | 2015-05-01 | 2016-11-03 | Microsoft Corporation | Automatic demand-driven resource scaling for relational database-as-a-service |
| US9495220B2 (en) | 2012-09-28 | 2016-11-15 | Sap Se | Self-management of request-centric systems |
| US20160342909A1 (en) | 2015-05-18 | 2016-11-24 | International Business Machines Corporation | Automatic time series exploration for business intelligence analytics |
| US9507718B2 (en) | 2013-04-16 | 2016-11-29 | Facebook, Inc. | Intelligent caching |
| US9514213B2 (en) | 2013-03-15 | 2016-12-06 | Oracle International Corporation | Per-attribute data clustering using tri-point data arbitration |
| US20160357674A1 (en) | 2015-06-07 | 2016-12-08 | Cloud Physics, Inc. | Unified Online Cache Monitoring and Optimization |
| US9529630B1 (en) | 2015-01-21 | 2016-12-27 | Pivotal Software, Inc. | Cloud computing platform architecture |
| US20160378809A1 (en) | 2015-06-25 | 2016-12-29 | International Business Machines Corporation | Massive time series correlation similarity computation |
| US20170061321A1 (en) | 2015-08-31 | 2017-03-02 | Vmware, Inc. | Capacity Analysis Using Closed-System Modules |
| US9658916B2 (en) | 2013-06-25 | 2017-05-23 | Nec Corporation | System analysis device, system analysis method and system analysis program |
| US9710493B2 (en) | 2013-03-08 | 2017-07-18 | Microsoft Technology Licensing, Llc | Approximate K-means via cluster closures |
| US9727533B2 (en) | 2014-05-20 | 2017-08-08 | Facebook, Inc. | Detecting anomalies in a time series |
| US9740402B2 (en) | 2014-03-28 | 2017-08-22 | Vmware, Inc. | Migrating workloads across host computing systems based on remote cache content usage characteristics |
| US20170249564A1 (en) | 2016-02-29 | 2017-08-31 | Oracle International Corporation | Systems and methods for detecting and accommodating state changes in modelling |
| US20170262223A1 (en) | 2016-03-11 | 2017-09-14 | EMC IP Holding Company LLC | Optimized auto-tiering |
| US9779361B2 (en) | 2014-06-05 | 2017-10-03 | Mitsubishi Electric Research Laboratories, Inc. | Method for learning exemplars for anomaly detection |
| US9811394B1 (en) | 2014-10-12 | 2017-11-07 | Workato, Inc. | Application programming interface recipe cloning |
| US20170329660A1 (en) | 2016-05-16 | 2017-11-16 | Oracle International Corporation | Correlation-based analytic for time-series data |
| US20170351563A1 (en) | 2014-12-22 | 2017-12-07 | Nec Corporation | Operation management apparatus, operation management method, and storage medium |
| US20170364851A1 (en) | 2016-06-20 | 2017-12-21 | Oracle International Corporation | Seasonality validation and determination of patterns |
| US20180026907A1 (en) | 2016-07-22 | 2018-01-25 | Intel Corporation | Technologies for allocating ephemeral data storage among manged nodes |
| US20180053207A1 (en) | 2016-08-16 | 2018-02-22 | Adobe Systems Incorporated | Providing personalized alerts and anomaly summarization |
| US20180052804A1 (en) | 2015-03-26 | 2018-02-22 | Nec Corporation | Learning model generation system, method, and program |
| US20180321989A1 (en) | 2017-05-05 | 2018-11-08 | Workato, Inc. | Late Connection Binding for Bots |
| US20180330433A1 (en) | 2017-05-12 | 2018-11-15 | Connect Financial LLC | Attributing meanings to data concepts used in producing outputs |
| US20190042982A1 (en) | 2016-03-17 | 2019-02-07 | Alibaba Group Holding Limited | Automatic Multi-Threshold Feature Filtering Method and Apparatus |
| CN109359763A (en) | 2018-09-03 | 2019-02-19 | 华南理工大学 | Dairy products cold chain transportation paths planning method based on calendar variation |
| US20190065275A1 (en) | 2017-08-31 | 2019-02-28 | Oracle International Corporation | Systems and methods for providing zero down time and scalability in orchestration cloud services |
Family Cites Families (1)
| Publication number | Priority date | Publication date | Assignee | Title |
|---|---|---|---|---|
| US20030014960A1 (en) * | 2001-07-23 | 2003-01-23 | Ramgen Power Systems, Inc. | Impulse turbine for rotary ramjet engine |
-
2017
- 2017-05-31 US US15/609,938 patent/US10635563B2/en active Active
Patent Citations (149)
| Publication number | Priority date | Publication date | Assignee | Title |
|---|---|---|---|---|
| US6298063B1 (en) | 1995-11-03 | 2001-10-02 | Cisco Technology, Inc. | System and method for providing backup machines for implementing multiple IP addresses on multiple ports |
| US6597777B1 (en) | 1999-06-29 | 2003-07-22 | Lucent Technologies Inc. | Method and apparatus for detecting service anomalies in transaction-oriented networks |
| US20030224344A1 (en) | 2000-03-27 | 2003-12-04 | Ron Shamir | Method and system for clustering data |
| US6996599B1 (en) | 2000-06-21 | 2006-02-07 | Microsoft Corporation | System and method providing multi-tier applications architecture |
| US20020092004A1 (en) | 2000-07-26 | 2002-07-11 | Lee John Michael | Methods and systems for automatically generating software applications |
| US20020019860A1 (en) | 2000-08-02 | 2002-02-14 | Lee Gene F. | Method and apparatus for distributed administration of thin client architecture |
| US20020183972A1 (en) | 2001-06-01 | 2002-12-05 | Enck Brent A. | Adaptive performance data measurement and collections |
| US20020188650A1 (en) | 2001-06-07 | 2002-12-12 | Intel Corporation | Fault-tolerant system and methods with trusted message acknowledgement |
| US6643613B2 (en) | 2001-07-03 | 2003-11-04 | Altaworks Corporation | System and method for monitoring performance metrics |
| US20030149603A1 (en) | 2002-01-18 | 2003-08-07 | Bruce Ferguson | System and method for operating a non-linear model with missing data for use in electronic commerce |
| US20050119982A1 (en) | 2002-05-10 | 2005-06-02 | Masato Ito | Information processing apparatus and method |
| US20040088406A1 (en) | 2002-10-31 | 2004-05-06 | International Business Machines Corporation | Method and apparatus for determining time varying thresholds for monitored metrics |
| US20050132030A1 (en) | 2003-12-10 | 2005-06-16 | Aventail Corporation | Network appliance |
| US20050159927A1 (en) | 2004-01-20 | 2005-07-21 | International Business Machines Corporation | Remote enterprise management of high availability systems |
| US20050193281A1 (en) | 2004-01-30 | 2005-09-01 | International Business Machines Corporation | Anomaly detection |
| US7343375B1 (en) | 2004-03-01 | 2008-03-11 | The Directv Group, Inc. | Collection and correlation over time of private viewing usage data |
| US7672814B1 (en) | 2004-03-03 | 2010-03-02 | Emc Corporation | System and method for baseline threshold monitoring |
| US20060212593A1 (en) | 2004-05-21 | 2006-09-21 | Bea Systems, Inc. | Dynamic service composition and orchestration |
| JP2006129446A (en) | 2004-10-27 | 2006-05-18 | Morgan Stanley | Fault tolerant network architecture |
| US20060087962A1 (en) | 2004-10-27 | 2006-04-27 | Anthony Golia | Fault tolerant network architecture |
| US7739143B1 (en) | 2005-03-24 | 2010-06-15 | Amazon Technologies, Inc. | Robust forecasting techniques with reduced sensitivity to anomalous data |
| US20100185499A1 (en) | 2005-03-24 | 2010-07-22 | Dwarakanath Samvid H | Robust forecasting techniques with reduced sensitivity to anomalous data |
| US7739284B2 (en) | 2005-04-20 | 2010-06-15 | International Business Machines Corporation | Method and apparatus for processing data streams |
| US20100257133A1 (en) | 2005-05-09 | 2010-10-07 | Crowe Keith E | Computer-Implemented System And Method For Storing Data Analysis Models |
| US20070011281A1 (en) | 2005-06-09 | 2007-01-11 | International Business Machines Corporation | Methods, apparatus and computer programs for automated problem solving in a distributed, collaborative environment |
| US20060287848A1 (en) | 2005-06-20 | 2006-12-21 | Microsoft Corporation | Language classification with random feature clustering |
| US20100050023A1 (en) | 2005-07-29 | 2010-02-25 | Bmc Software, Inc. | System, method and computer program product for optimized root cause analysis |
| US20070179836A1 (en) | 2005-08-10 | 2007-08-02 | American Express Travel Related Services Company, Inc. | System, method, and computer program product for increasing inventory turnover using targeted consumer offers |
| US20070150329A1 (en) | 2005-12-22 | 2007-06-28 | Canon Kabushiki Kaisha | Just-in-time workflow |
| US20150248446A1 (en) | 2006-03-14 | 2015-09-03 | Amazon Technologies, Inc. | Method and system for collecting and analyzing time-series data |
| US7987106B1 (en) | 2006-06-05 | 2011-07-26 | Turgut Aykin | System and methods for forecasting time series with multiple seasonal patterns |
| US7783510B1 (en) | 2006-06-23 | 2010-08-24 | Quest Software, Inc. | Computer storage capacity forecasting system using cluster-based seasonality analysis |
| US7529991B2 (en) | 2007-01-30 | 2009-05-05 | International Business Machines Corporation | Scoring method for correlation anomalies |
| US20080221974A1 (en) | 2007-02-22 | 2008-09-11 | Alexander Gilgur | Lazy Evaluation of Bulk Forecasts |
| US20080288089A1 (en) | 2007-05-15 | 2008-11-20 | Fisher-Rosemount Systems, Inc. | Methods and systems for batch processing and execution in a process system |
| US8200454B2 (en) | 2007-07-09 | 2012-06-12 | International Business Machines Corporation | Method, data processing program and computer program product for time series analysis |
| US20090030752A1 (en) | 2007-07-27 | 2009-01-29 | General Electric Company | Fleet anomaly detection method |
| US20110213788A1 (en) | 2008-03-05 | 2011-09-01 | Quantum Intelligence, Inc. | Information fusion for multiple anomaly detection systems |
| US9323837B2 (en) | 2008-03-05 | 2016-04-26 | Ying Zhao | Multiple domain anomaly detection system and method using fusion rule and visualization |
| US20100027552A1 (en) | 2008-06-19 | 2010-02-04 | Servicemesh, Inc. | Cloud computing gateway, cloud computing hypervisor, and methods for implementing same |
| US8694969B2 (en) | 2008-07-31 | 2014-04-08 | International Business Machines Corporation | Analyzing factory processes in a software factory |
| US8676964B2 (en) | 2008-07-31 | 2014-03-18 | Riverbed Technology, Inc. | Detecting outliers in network traffic time series |
| US20100082132A1 (en) | 2008-09-29 | 2010-04-01 | Fisher-Rosemount Systems, Inc. | Recipe Command Steps and Recipe Inputs from External Logic |
| US20100082697A1 (en) | 2008-10-01 | 2010-04-01 | Narain Gupta | Data model enrichment and classification using multi-model approach |
| US8363961B1 (en) | 2008-10-14 | 2013-01-29 | Adobe Systems Incorporated | Clustering techniques for large, high-dimensionality data sets |
| US20140067757A1 (en) | 2008-11-10 | 2014-03-06 | Google Inc. | Method and System for Clustering Data Points |
| US20120254183A1 (en) | 2008-11-10 | 2012-10-04 | Google Inc. | Method and System for Clustering Data Points |
| US8234236B2 (en) | 2009-06-01 | 2012-07-31 | International Business Machines Corporation | System and method for efficient allocation of resources in virtualized desktop environments |
| US20100324869A1 (en) | 2009-06-17 | 2010-12-23 | Ludmila Cherkasova | Modeling a computing entity |
| US20110022879A1 (en) | 2009-07-24 | 2011-01-27 | International Business Machines Corporation | Automated disaster recovery planning |
| US20110040575A1 (en) | 2009-08-11 | 2011-02-17 | Phillip Andrew Wright | Appliance and pair device for providing a reliable and redundant enterprise management solution |
| US8229876B2 (en) | 2009-09-01 | 2012-07-24 | Oracle International Corporation | Expediting K-means cluster analysis data mining using subsample elimination preprocessing |
| US20110126275A1 (en) | 2009-11-25 | 2011-05-26 | Novell, Inc. | System and method for discovery enrichment in an intelligent workload management system |
| US20110125894A1 (en) | 2009-11-25 | 2011-05-26 | Novell, Inc. | System and method for intelligent workload management |
| US20110126197A1 (en) | 2009-11-25 | 2011-05-26 | Novell, Inc. | System and method for controlling cloud and virtualized data centers in an intelligent workload management system |
| US8776066B2 (en) | 2009-11-30 | 2014-07-08 | International Business Machines Corporation | Managing task execution on accelerators |
| WO2011071624A2 (en) | 2009-12-12 | 2011-06-16 | Microsoft Corporation | Cloud computing monitoring and management system |
| US20120278663A1 (en) | 2010-01-08 | 2012-11-01 | Hideo Hasegawa | Operation management apparatus, operation management method, and program storage medium |
| US8650299B1 (en) | 2010-02-03 | 2014-02-11 | Citrix Systems, Inc. | Scalable cloud computing |
| US20160105327A9 (en) | 2010-04-15 | 2016-04-14 | Caplan Software Development S.R.L. | Automated upgrading method for capacity of it system resources |
| US20110265164A1 (en) | 2010-04-26 | 2011-10-27 | Vmware, Inc. | Cloud platform architecture |
| US20120005359A1 (en) | 2010-07-01 | 2012-01-05 | Scott Wayne Seago | System and method for aggregation across cloud providers |
| US20120051369A1 (en) | 2010-08-30 | 2012-03-01 | International Business Machines Corporation | Using gathered system activity statistics to determine when to schedule a procedure |
| US20120066389A1 (en) | 2010-09-10 | 2012-03-15 | International Business Machines Corporation | Migration of logical partitions between two devices |
| US20120110462A1 (en) | 2010-10-28 | 2012-05-03 | Anand Eswaran | Providing cloud-based computing services |
| US20120110583A1 (en) | 2010-10-28 | 2012-05-03 | Balko Soeren | Dynamic parallel looping in process runtime |
| US8930757B2 (en) | 2011-01-24 | 2015-01-06 | Nec Corporation | Operations management apparatus, operations management method and program |
| US20120203823A1 (en) | 2011-02-09 | 2012-08-09 | Gaurav Manglik | Apparatus, systems and methods for deployment and management of distributed computing systems and applications |
| US20120240072A1 (en) | 2011-03-18 | 2012-09-20 | Serious Materials, Inc. | Intensity transform systems and methods |
| US9195563B2 (en) | 2011-03-30 | 2015-11-24 | Bmc Software, Inc. | Use of metrics selected based on lag correlation to provide leading indicators of service performance degradation |
| US9218232B2 (en) | 2011-04-13 | 2015-12-22 | Bar-Ilan University | Anomaly detection methods, devices and systems |
| US20120323988A1 (en) | 2011-06-16 | 2012-12-20 | Ron Barzel | Task allocation in a computer network |
| WO2013016584A1 (en) | 2011-07-26 | 2013-01-31 | Nebula, Inc. | Systems and methods for implementing cloud computing |
| US8576964B2 (en) | 2011-08-05 | 2013-11-05 | Kabushiki Kaisha Toshiba | Radio receiver |
| US9389946B2 (en) | 2011-09-19 | 2016-07-12 | Nec Corporation | Operation management apparatus, operation management method, and program |
| US9355357B2 (en) | 2011-10-21 | 2016-05-31 | Hewlett Packard Enterprise Development Lp | Computing predicted data according to weighted peak preservation and time distance biasing |
| US9141914B2 (en) | 2011-10-31 | 2015-09-22 | Hewlett-Packard Development Company, L.P. | System and method for ranking anomalies |
| US9367382B2 (en) | 2012-01-23 | 2016-06-14 | Nec Corporation | Apparatus, method, and program product for calculating abnormality based on degree of correlation destruction |
| US20150046123A1 (en) | 2012-03-14 | 2015-02-12 | Nec Corporation | Operation management apparatus, operation management method and program |
| US8880525B2 (en) | 2012-04-02 | 2014-11-04 | Xerox Corporation | Full and semi-batch clustering |
| US8949677B1 (en) | 2012-05-23 | 2015-02-03 | Amazon Technologies, Inc. | Detecting anomalies in time series data |
| US20130326202A1 (en) | 2012-05-30 | 2013-12-05 | Roi Rosenthal | Load test capacity planning |
| US20130329981A1 (en) | 2012-06-11 | 2013-12-12 | Canon Kabushiki Kaisha | Radiation imaging apparatus, radiation image processing apparatus, and image processing method |
| US20150180734A1 (en) | 2012-07-03 | 2015-06-25 | Stephane H. Maes | Managing a cloud service |
| US20150244597A1 (en) | 2012-07-03 | 2015-08-27 | Stephane H. Maes | Managing a hybrid cloud service |
| US20150296030A1 (en) | 2012-07-03 | 2015-10-15 | Stephane Maes | Managing a multitenant cloud service |
| US20150251074A1 (en) | 2012-09-04 | 2015-09-10 | Whoop, Inc. | Automated exercise recommendations |
| US9495220B2 (en) | 2012-09-28 | 2016-11-15 | Sap Se | Self-management of request-centric systems |
| US20140095422A1 (en) | 2012-09-28 | 2014-04-03 | Dell Software Inc. | Data metric resolution prediction system and method |
| US20140101300A1 (en) | 2012-10-10 | 2014-04-10 | Elisha J. Rosensweig | Method and apparatus for automated deployment of geographically distributed applications within a cloud |
| US9147167B2 (en) | 2012-11-19 | 2015-09-29 | Oracle International Corporation | Similarity analysis with tri-point data arbitration |
| US20140215470A1 (en) | 2013-01-25 | 2014-07-31 | Alfonso Íñiguez | Parallel Processing with Proactive Solidarity Cells |
| US9710493B2 (en) | 2013-03-08 | 2017-07-18 | Microsoft Technology Licensing, Llc | Approximate K-means via cluster closures |
| US9514213B2 (en) | 2013-03-15 | 2016-12-06 | Oracle International Corporation | Per-attribute data clustering using tri-point data arbitration |
| US20140310235A1 (en) | 2013-04-11 | 2014-10-16 | Oracle International Corporation | Seasonal trending, forecasting, anomaly detection, and endpoint prediction of java heap usage |
| US9692662B2 (en) | 2013-04-11 | 2017-06-27 | Oracle International Corporation | Predictive diagnosis of SLA violations in cloud services by seasonal trending and forecasting with thread intensity analytics |
| US20140310714A1 (en) | 2013-04-11 | 2014-10-16 | Oracle International Corporation | Predictive diagnosis of sla violations in cloud services by seasonal trending and forecasting with thread intensity analytics |
| US9330119B2 (en) | 2013-04-11 | 2016-05-03 | Oracle International Corporation | Knowledge intensive data management system for business process and case management |
| US9507718B2 (en) | 2013-04-16 | 2016-11-29 | Facebook, Inc. | Intelligent caching |
| US20140325649A1 (en) | 2013-04-29 | 2014-10-30 | Telefonaktiebolaget L M Ericsson (Publ) | Method and system to dynamically detect traffic anomalies in a network |
| US20140379717A1 (en) | 2013-06-19 | 2014-12-25 | Oracle International Corporation | Tripoint arbitration for entity classification |
| US9658916B2 (en) | 2013-06-25 | 2017-05-23 | Nec Corporation | System analysis device, system analysis method and system analysis program |
| US20160171037A1 (en) | 2013-07-19 | 2016-06-16 | Ge Intelligent Platforms, Inc. | Model change boundary on time series data |
| US20150032775A1 (en) | 2013-07-26 | 2015-01-29 | Metamarkets Group Inc. | Segment data visibility and management in a distributed database of time stamped records |
| US20150033084A1 (en) | 2013-07-28 | 2015-01-29 | OpsClarity Inc. | Organizing network performance metrics into historical anomaly dependency data |
| US20150040142A1 (en) | 2013-08-01 | 2015-02-05 | Dell Products L.P. | Efficient dfa generation for non-matching characters and character classes in regular expressions |
| US20150046920A1 (en) | 2013-08-12 | 2015-02-12 | Amazon Technologies, Inc. | Request processing techniques |
| US20160253381A1 (en) | 2013-10-31 | 2016-09-01 | Hewlett Packard Enterprise Development Lp | Storing time series data for a search query |
| US20160299961A1 (en) | 2014-02-04 | 2016-10-13 | David Allen Olsen | System and method for grouping segments of data sequences into clusters |
| US20150242243A1 (en) | 2014-02-21 | 2015-08-27 | International Business Machines Corporation | Processor power optimization with response time assurance |
| US9740402B2 (en) | 2014-03-28 | 2017-08-22 | Vmware, Inc. | Migrating workloads across host computing systems based on remote cache content usage characteristics |
| US20150312274A1 (en) | 2014-04-25 | 2015-10-29 | Intuit Inc. | Method and system for ensuring an application conforms with security and regulatory controls prior to deployment |
| US9727533B2 (en) | 2014-05-20 | 2017-08-08 | Facebook, Inc. | Detecting anomalies in a time series |
| US9779361B2 (en) | 2014-06-05 | 2017-10-03 | Mitsubishi Electric Research Laboratories, Inc. | Method for learning exemplars for anomaly detection |
| US20160034328A1 (en) | 2014-07-29 | 2016-02-04 | Oracle International Corporation | Systems and methods for spatially displaced correlation for detecting value ranges of transient correlation in machine data of enterprise systems |
| US9658910B2 (en) | 2014-07-29 | 2017-05-23 | Oracle International Corporation | Systems and methods for spatially displaced correlation for detecting value ranges of transient correlation in machine data of enterprise systems |
| US20160042289A1 (en) | 2014-08-05 | 2016-02-11 | Oracle International Corporation | Systems and methods for adaptive thresholding using maximum concentration intervals |
| US20160092516A1 (en) | 2014-09-26 | 2016-03-31 | Oracle International Corporation | Metric time series correlation by outlier removal based on maximum concentration interval |
| US20160292611A1 (en) | 2014-10-09 | 2016-10-06 | Splunk Inc. | System Monitoring with Key Performance Indicators from Shared Base Search of Machine Data |
| US9811394B1 (en) | 2014-10-12 | 2017-11-07 | Workato, Inc. | Application programming interface recipe cloning |
| US20160139964A1 (en) | 2014-11-17 | 2016-05-19 | Mediatek Inc. | Energy Efficient Multi-Cluster System and Its Operations |
| US20170351563A1 (en) | 2014-12-22 | 2017-12-07 | Nec Corporation | Operation management apparatus, operation management method, and storage medium |
| US9529630B1 (en) | 2015-01-21 | 2016-12-27 | Pivotal Software, Inc. | Cloud computing platform architecture |
| US20180052804A1 (en) | 2015-03-26 | 2018-02-22 | Nec Corporation | Learning model generation system, method, and program |
| US20160283533A1 (en) | 2015-03-26 | 2016-09-29 | Oracle International Corporation | Multi-distance clustering |
| US20160294773A1 (en) | 2015-04-03 | 2016-10-06 | Infoblox Inc. | Behavior analysis based dns tunneling detection and classification framework for network security |
| US20160299938A1 (en) | 2015-04-10 | 2016-10-13 | Tata Consultancy Services Limited | Anomaly detection system and method |
| US20160321588A1 (en) | 2015-05-01 | 2016-11-03 | Microsoft Corporation | Automatic demand-driven resource scaling for relational database-as-a-service |
| US20160342909A1 (en) | 2015-05-18 | 2016-11-24 | International Business Machines Corporation | Automatic time series exploration for business intelligence analytics |
| US20160357674A1 (en) | 2015-06-07 | 2016-12-08 | Cloud Physics, Inc. | Unified Online Cache Monitoring and Optimization |
| US20160378809A1 (en) | 2015-06-25 | 2016-12-29 | International Business Machines Corporation | Massive time series correlation similarity computation |
| US9323599B1 (en) | 2015-07-31 | 2016-04-26 | AppDynamics, Inc. | Time series metric data modeling and prediction |
| US20170061321A1 (en) | 2015-08-31 | 2017-03-02 | Vmware, Inc. | Capacity Analysis Using Closed-System Modules |
| CN105426411A (en) | 2015-10-31 | 2016-03-23 | 南京南瑞继保电气有限公司 | Access trend prediction based time series database cache management method |
| US9471778B1 (en) | 2015-11-30 | 2016-10-18 | International Business Machines Corporation | Automatic baselining of anomalous event activity in time series data |
| US20170249564A1 (en) | 2016-02-29 | 2017-08-31 | Oracle International Corporation | Systems and methods for detecting and accommodating state changes in modelling |
| US20170249649A1 (en) | 2016-02-29 | 2017-08-31 | Oracle International Corporation | Systems and methods for trending patterns within time-series data |
| US20170249648A1 (en) | 2016-02-29 | 2017-08-31 | Oracle International Corporation | Seasonal aware method for forecasting and capacity planning |
| US20170249763A1 (en) | 2016-02-29 | 2017-08-31 | Oracle International Corporation | Method for creating period profile for time-series data with recurrent patterns |
| US20170262223A1 (en) | 2016-03-11 | 2017-09-14 | EMC IP Holding Company LLC | Optimized auto-tiering |
| US20190042982A1 (en) | 2016-03-17 | 2019-02-07 | Alibaba Group Holding Limited | Automatic Multi-Threshold Feature Filtering Method and Apparatus |
| US20170329660A1 (en) | 2016-05-16 | 2017-11-16 | Oracle International Corporation | Correlation-based analytic for time-series data |
| US20170364851A1 (en) | 2016-06-20 | 2017-12-21 | Oracle International Corporation | Seasonality validation and determination of patterns |
| US20180026907A1 (en) | 2016-07-22 | 2018-01-25 | Intel Corporation | Technologies for allocating ephemeral data storage among manged nodes |
| US20180053207A1 (en) | 2016-08-16 | 2018-02-22 | Adobe Systems Incorporated | Providing personalized alerts and anomaly summarization |
| US20180321989A1 (en) | 2017-05-05 | 2018-11-08 | Workato, Inc. | Late Connection Binding for Bots |
| US20180330433A1 (en) | 2017-05-12 | 2018-11-15 | Connect Financial LLC | Attributing meanings to data concepts used in producing outputs |
| US20190065275A1 (en) | 2017-08-31 | 2019-02-28 | Oracle International Corporation | Systems and methods for providing zero down time and scalability in orchestration cloud services |
| CN109359763A (en) | 2018-09-03 | 2019-02-19 | 华南理工大学 | Dairy products cold chain transportation paths planning method based on calendar variation |
Non-Patent Citations (37)
| Title |
|---|
| "OpenStack Compute Administration Manual", Mar. 1, 2011 (Mar. 1, 2011), XP055207492, Retrieved from the Internet: URL:http://web.archive.org/web/20110708071910/http://docs.openstack.org/bexar/openstack-compute/admin/os-compute-admin-book-bexar.pdf [retrieved on Apr. 12, 2015]. |
| "OpenStack Object Storage Administrator Manual", Jun. 2, 2011 (Jun. 2, 2011), XP055207490, Retrieved from the Internet: URL:http://web.archive.org/web/20110727190919/http://docs.openstack.org/cactus/openstack-object-storage/admin/os-objectstorage-adminguide-cactus.pdf [retrieved on Aug. 12, 2015]. |
| Ahmed, Reservoir-based network traffic stream summarization for anomaly detection, Article in Pattern Analysis and Applications, Oct. 2017. |
| Alberto Zuin: "OpenNebula Setting up High Availability in OpenNebula with LVM", May 2, 2011 (May 2, 2011), XP055207701, Retrieved from the Internet: URL:http://opennebula.org/setting-up-highavailability-in-opennebula-with-lvm/ [retrieved on Aug. 13, 2015] p. 1. |
| Andrew Beekhof: "Clusters from Scratch-Apache, DRBD and GFS2 Creating Active/Passive and Active/Active Clusters on Fedora 12", Mar. 11, 2010 (Mar. 11, 2010), XP055207651, Retrieved from the Internet: URL:http://clusterlabs.org/doc/en-US/Pacemaker/1.0/pdf/Clusters from Scratch/Pacemaker-1.0-Clusters from Scratch-en-US.pdi [retrieved on Aug. 13, 2015]. |
| Andrew Beekhof: "Clusters from Scratch—Apache, DRBD and GFS2 Creating Active/Passive and Active/Active Clusters on Fedora 12", Mar. 11, 2010 (Mar. 11, 2010), XP055207651, Retrieved from the Internet: URL:http://clusterlabs.org/doc/en-US/Pacemaker/1.0/pdf/Clusters from Scratch/Pacemaker-1.0-Clusters from Scratch-en-US.pdi [retrieved on Aug. 13, 2015]. |
| Anonymous: "High Availability for the Ubuntu Enterprise Cloud (UEC)-Cloud Controller (CLC)", Feb. 19, 2011 (Feb. 19, 2011), XP055207708, Retrieved from the Internet: URL:http://blog.csdn.net/superxgl/article/details/6194473 [retrieved on Aug. 13, 2015] p. 1. |
| Anonymous: "High Availability for the Ubuntu Enterprise Cloud (UEC)—Cloud Controller (CLC)", Feb. 19, 2011 (Feb. 19, 2011), XP055207708, Retrieved from the Internet: URL:http://blog.csdn.net/superxgl/article/details/6194473 [retrieved on Aug. 13, 2015] p. 1. |
| Charapko, Gorilla-Facebook's Cache for Time Series Data, http://charap.co/gorilla-facebooks-cache-for-monitoring-data/, Jan. 11, 2017. |
| Charapko, Gorilla—Facebook's Cache for Time Series Data, http://charap.co/gorilla-facebooks-cache-for-monitoring-data/, Jan. 11, 2017. |
| Chris Bunch et al: "AppScale: Open-Source Platform-as-a-Service", Jan. 1, 2011 (Jan. 1, 2011), XP055207440, Retrieved from the Internet: URL:http://128.111.41.26/research/tech reports/reports/2011-01 .pdf [retrieved on Aug. 12, 2015] pp. 2-6. |
| Davies, David L., et al., "A Cluster Separation measure", IEEE Transactions on Pattern Analysis and Machine Intelligence, vol. PAMI-1, No. 2, Apr. 1979, pp. 224-227. |
| Dunning et al., Computing Extremely Accurate Quantiles Using t-Digests. |
| Faraz Rasheed, "A Framework for Periodic Outlier Pattern Detection in Time-Series Sequences," May 2014, IEEE. |
| Greenwald et al. "Space-efficient online computation of quantile summaries." ACM Proceedings of the 2001 SIGMOD international conference on Management of data pp. 58-66. |
| Greunen, "Forecasting Methods for Cloud Hosted Resources, a comparison," 2015, 11th International Conference on Network and Service Management (CNSM), pp. 29-35 (Year: 2015). |
| Gueyoung Jung et al: "Performance and availability aware regeneration for cloud based multitier applications", Dependable Systems and Networks (DSN), 2010 IEEE/IFIP International Conference on, IEEE, Piscataway, NJ, USA, Jun. 28, 2010 (Jun. 28, 2010), pp. 497-506. |
| Gunter et al., Log Summarization and Anomaly Detection for Troubleshooting Distributed Systems, Conference: 8th IEEE/ACM International Conference on Grid Computing (GRID 2007), Sep. 19-21, 2007, Austin, Texas, USA, Proceedings. |
| Hao et al., Visual Analytics of Anomaly Detection in Large Data Streams, Proc. SPIE 7243, Visualization and Data Analysis 2009, 10 pages. |
| Haugen et al., "Extracting Common Time Trends from Concurrent Time Series: Maximum Autocorrelation Factors with Applications", Stanford University, Oct. 20, 2015, pp. 1-38. |
| Herbst, "Self-adaptive workload classification and forecasting for proactive resource provisioning", 2014, ICPE'13, pp. 187-198 (Year: 2014). |
| Jarvis, R. A., et al., "Clustering Using a Similarity Measure Based on Shared Neighbors", IEEE Transactions on Computers, vol. C-22, No. 11, Nov. 1973, pp. 1025-1034. |
| Lin, Xuemin, et al. "Continuously maintaining quantile summaries of the most recent n elements over a data stream." IEEE, 2004. |
| Niino,Junichi, "Open Source Cloud infrastructure 'OpenStack', its History and Scheme", available online at <http://www.publickey1.jp/blog/11/openstack_1.html>, Jun. 13, 2011, 8 pages. |
| Niino,Junichi, "Open Source Cloud infrastructure ‘OpenStack’, its History and Scheme", available online at <http://www.publickey1.jp/blog/11/openstack_1.html>, Jun. 13, 2011, 8 pages. |
| NPL: Web document dated Feb. 3, 2011, Title: OpenStack Compute, Admin Manual. |
| Nurmi D et al: "The Eucalyptus Open-Source Cloud-Computing System", Cluster Computing and the Grid, 2009. CCGRID '09. 9th IEEE/ACM International Symposium on, IEEE, Piscataway, NJ, USA, May 18, 2009 (May 18, 2009), pp. 124-131. |
| Qiu, Hai, et al. "Anomaly detection using data clustering and neural networks." Neural Networks, 2008. IJCNN 2008.(IEEE World Congress on Computational Intelligence). IEEE International Joint Conference on. IEEE, 2008. |
| Slipetskyy, Rostyslav, "Security Issues in OpenStack", Master's Thesis, Technical University of Denmark, Jun. 2011, 90 pages. |
| Somlo, Gabriel, et al., "Incremental Clustering for Profile Maintenance in Information Gathering Web Agents", AGENTS '01, Montreal, Quebec, Canada, May 28-Jun. 1, 2001, pp. 262-269. |
| Szmit et al., "Usage of Modified Holt-Winters Method in the Anomaly Detection of Network Traffic: Case Studies", Journal of Computer Networks and Communications, vol. 2012, Article ID 192913, Mar. 29, 2012, pp. 1-5. |
| Taylor J W et al: "Forecasting intraday time series with multiple seasonal cycles using parsimonious seasonal exponential smoothing", OMEGA, vol. 40, No. 6, Dec. 2012 (Dec. 2012), pp. 748-757. |
| Voras et al., "Criteria for Evaluation of Open Source Cloud Computing Solutions", Proceedings of the ITI 2011 33rd international Conference on Information Technology Interfaces (ITI), US, IEEE, Jun. 27-30, 2011, 6 pages. |
| Voras I et al: "Evaluating open-source cloud computing solutions", MIPRO, 2011 Proceedings of the 34th International Convention, IEEE, May 23, 2011 (May 23, 2011), pp. 209-214. |
| Wilks, Samuel S. "Determination of sample sizes for setting tolerance limits." The Annals of Mathematical Statistics 12.1 (1941): 91-96. |
| Willy Tarreau: "HAProxy Architecture Guide", May 25, 2008 (May 25, 2008), XP055207566, Retrieved from the Internet: URL:http://www.haproxy.org/download/1.2/doc/architecture.txt [retrieved on Aug. 13, 2015] . |
| Yokoyama, Tetsuya, "Windows Server 2008, Certification Test, Part 5: Reliability", Apr. 15, 2008, pp. 124-125 along with 4 pages of English Translation. |
Cited By (6)
| Publication number | Priority date | Publication date | Assignee | Title |
|---|---|---|---|---|
| US10990891B1 (en) * | 2017-09-07 | 2021-04-27 | Amazon Technologies, Inc. | Predictive modeling for aggregated metrics |
| US20210406148A1 (en) * | 2020-06-30 | 2021-12-30 | Salesforce.Com, Inc. | Anomaly detection and root cause analysis in a multi-tenant environment |
| US11363049B1 (en) | 2021-03-25 | 2022-06-14 | Bank Of America Corporation | Information security system and method for anomaly detection in data transmission |
| US11635983B2 (en) | 2021-04-13 | 2023-04-25 | Hewlett Packard Enterprise Development Lp | Pre-trained software containers for datacenter analysis |
| US20220335347A1 (en) * | 2021-04-15 | 2022-10-20 | Business Objects Software Ltd | Time-series anomaly prediction and alert |
| EP4276627A1 (en) | 2022-05-12 | 2023-11-15 | Bull SAS | Iterative method for monitoring a computing device |
Also Published As
| Publication number | Publication date |
|---|---|
| US20180039555A1 (en) | 2018-02-08 |
Similar Documents
| Publication | Publication Date | Title |
|---|---|---|
| US11082439B2 (en) | Unsupervised method for baselining and anomaly detection in time-series data for enterprise systems | |
| US10635563B2 (en) | Unsupervised method for baselining and anomaly detection in time-series data for enterprise systems | |
| US20210073680A1 (en) | Data driven methods and systems for what if analysis | |
| US10915830B2 (en) | Multiscale method for predictive alerting | |
| US11537940B2 (en) | Systems and methods for unsupervised anomaly detection using non-parametric tolerance intervals over a sliding window of t-digests | |
| US11323471B2 (en) | Advanced cybersecurity threat mitigation using cyberphysical graphs with state changes | |
| US11080906B2 (en) | Method for creating period profile for time-series data with recurrent patterns | |
| US10855548B2 (en) | Systems and methods for automatically detecting, summarizing, and responding to anomalies | |
| US11323484B2 (en) | Privilege assurance of enterprise computer network environments | |
| US20230421593A1 (en) | System and method for comprehensive data loss prevention and compliance management | |
| US11089045B2 (en) | User and entity behavioral analysis with network topology enhancements | |
| US10432660B2 (en) | Advanced cybersecurity threat mitigation for inter-bank financial transactions | |
| US11138090B2 (en) | Systems and methods for forecasting time series with variable seasonality | |
| US9798644B2 (en) | Monitoring system performance with pattern event detection | |
| US20200125988A1 (en) | Systems and Methods For Detecting Long Term Seasons | |
| US11757920B2 (en) | User and entity behavioral analysis with network topology enhancements | |
| US20180159881A1 (en) | Automated cyber physical threat campaign analysis and attribution | |
| US20220263860A1 (en) | Advanced cybersecurity threat hunting using behavioral and deep analytics | |
| US20130086431A1 (en) | Multiple modeling paradigm for predictive analytics | |
| US10949436B2 (en) | Optimization for scalable analytics using time series models | |
| Jiang et al. | A quantitative framework for network resilience evaluation using Dynamic Bayesian Network | |
| WO2019018829A1 (en) | Advanced cybersecurity threat mitigation using behavioral and deep analytics | |
| US20220058745A1 (en) | System and method for crowdsensing-based insurance premiums | |
| US20230229659A1 (en) | Estimating query execution performance using a sampled counter | |
| EP3679506A2 (en) | Advanced cybersecurity threat mitigation for inter-bank financial transactions |
Legal Events
| Date | Code | Title | Description |
|---|---|---|---|
| AS | Assignment |
Owner name: ORACLE INTERNATIONAL CORPORATION, CALIFORNIA Free format text: ASSIGNMENT OF ASSIGNORS INTEREST;ASSIGNORS:SALUNKE, SAMPANNA SHAHAJI;GARVEY, DUSTIN;SHAFT, URI;AND OTHERS;SIGNING DATES FROM 20170526 TO 20170530;REEL/FRAME:042733/0762 |
|
| STPP | Information on status: patent application and granting procedure in general |
Free format text: DOCKETED NEW CASE - READY FOR EXAMINATION |
|
| STPP | Information on status: patent application and granting procedure in general |
Free format text: NON FINAL ACTION MAILED |
|
| STPP | Information on status: patent application and granting procedure in general |
Free format text: RESPONSE TO NON-FINAL OFFICE ACTION ENTERED AND FORWARDED TO EXAMINER |
|
| STPP | Information on status: patent application and granting procedure in general |
Free format text: NOTICE OF ALLOWANCE MAILED -- APPLICATION RECEIVED IN OFFICE OF PUBLICATIONS |
|
| STPP | Information on status: patent application and granting procedure in general |
Free format text: NOTICE OF ALLOWANCE MAILED -- APPLICATION RECEIVED IN OFFICE OF PUBLICATIONS |
|
| STPP | Information on status: patent application and granting procedure in general |
Free format text: AWAITING TC RESP, ISSUE FEE PAYMENT VERIFIED |
|
| STCF | Information on status: patent grant |
Free format text: PATENTED CASE |
|
| STPP | Information on status: patent application and granting procedure in general |
Free format text: PUBLICATIONS -- ISSUE FEE PAYMENT VERIFIED |
|
| STCF | Information on status: patent grant |
Free format text: PATENTED CASE |
|
| MAFP | Maintenance fee payment |
Free format text: PAYMENT OF MAINTENANCE FEE, 4TH YEAR, LARGE ENTITY (ORIGINAL EVENT CODE: M1551); ENTITY STATUS OF PATENT OWNER: LARGE ENTITY Year of fee payment: 4 |