US10564167B2 - Method for detecting cells - Google Patents
Method for detecting cells Download PDFInfo
- Publication number
- US10564167B2 US10564167B2 US15/510,082 US201515510082A US10564167B2 US 10564167 B2 US10564167 B2 US 10564167B2 US 201515510082 A US201515510082 A US 201515510082A US 10564167 B2 US10564167 B2 US 10564167B2
- Authority
- US
- United States
- Prior art keywords
- cell
- nucleosomes
- clutch
- clutches
- per
- Prior art date
- Legal status (The legal status is an assumption and is not a legal conclusion. Google has not performed a legal analysis and makes no representation as to the accuracy of the status listed.)
- Active, expires
Links
Images


Classifications
-
- G—PHYSICS
- G01—MEASURING; TESTING
- G01N—INVESTIGATING OR ANALYSING MATERIALS BY DETERMINING THEIR CHEMICAL OR PHYSICAL PROPERTIES
- G01N33/00—Investigating or analysing materials by specific methods not covered by groups G01N1/00 - G01N31/00
- G01N33/48—Biological material, e.g. blood, urine; Haemocytometers
- G01N33/50—Chemical analysis of biological material, e.g. blood, urine; Testing involving biospecific ligand binding methods; Immunological testing
- G01N33/68—Chemical analysis of biological material, e.g. blood, urine; Testing involving biospecific ligand binding methods; Immunological testing involving proteins, peptides or amino acids
- G01N33/6875—Nucleoproteins
-
- C—CHEMISTRY; METALLURGY
- C07—ORGANIC CHEMISTRY
- C07K—PEPTIDES
- C07K16/00—Immunoglobulins [IGs], e.g. monoclonal or polyclonal antibodies
- C07K16/18—Immunoglobulins [IGs], e.g. monoclonal or polyclonal antibodies against material from animals or humans
-
- G—PHYSICS
- G01—MEASURING; TESTING
- G01N—INVESTIGATING OR ANALYSING MATERIALS BY DETERMINING THEIR CHEMICAL OR PHYSICAL PROPERTIES
- G01N21/00—Investigating or analysing materials by the use of optical means, i.e. using sub-millimetre waves, infrared, visible or ultraviolet light
- G01N21/62—Systems in which the material investigated is excited whereby it emits light or causes a change in wavelength of the incident light
- G01N21/63—Systems in which the material investigated is excited whereby it emits light or causes a change in wavelength of the incident light optically excited
- G01N21/64—Fluorescence; Phosphorescence
- G01N21/6428—Measuring fluorescence of fluorescent products of reactions or of fluorochrome labelled reactive substances, e.g. measuring quenching effects, using measuring "optrodes"
-
- G—PHYSICS
- G01—MEASURING; TESTING
- G01N—INVESTIGATING OR ANALYSING MATERIALS BY DETERMINING THEIR CHEMICAL OR PHYSICAL PROPERTIES
- G01N21/00—Investigating or analysing materials by the use of optical means, i.e. using sub-millimetre waves, infrared, visible or ultraviolet light
- G01N21/62—Systems in which the material investigated is excited whereby it emits light or causes a change in wavelength of the incident light
- G01N21/63—Systems in which the material investigated is excited whereby it emits light or causes a change in wavelength of the incident light optically excited
- G01N21/64—Fluorescence; Phosphorescence
- G01N21/645—Specially adapted constructive features of fluorimeters
- G01N21/6456—Spatial resolved fluorescence measurements; Imaging
- G01N21/6458—Fluorescence microscopy
-
- G—PHYSICS
- G01—MEASURING; TESTING
- G01N—INVESTIGATING OR ANALYSING MATERIALS BY DETERMINING THEIR CHEMICAL OR PHYSICAL PROPERTIES
- G01N33/00—Investigating or analysing materials by specific methods not covered by groups G01N1/00 - G01N31/00
- G01N33/48—Biological material, e.g. blood, urine; Haemocytometers
- G01N33/50—Chemical analysis of biological material, e.g. blood, urine; Testing involving biospecific ligand binding methods; Immunological testing
- G01N33/53—Immunoassay; Biospecific binding assay; Materials therefor
- G01N33/569—Immunoassay; Biospecific binding assay; Materials therefor for microorganisms, e.g. protozoa, bacteria, viruses
- G01N33/56966—Animal cells
-
- G—PHYSICS
- G06—COMPUTING; CALCULATING OR COUNTING
- G06T—IMAGE DATA PROCESSING OR GENERATION, IN GENERAL
- G06T7/00—Image analysis
- G06T7/0002—Inspection of images, e.g. flaw detection
- G06T7/0012—Biomedical image inspection
-
- G—PHYSICS
- G01—MEASURING; TESTING
- G01N—INVESTIGATING OR ANALYSING MATERIALS BY DETERMINING THEIR CHEMICAL OR PHYSICAL PROPERTIES
- G01N21/00—Investigating or analysing materials by the use of optical means, i.e. using sub-millimetre waves, infrared, visible or ultraviolet light
- G01N21/62—Systems in which the material investigated is excited whereby it emits light or causes a change in wavelength of the incident light
- G01N21/63—Systems in which the material investigated is excited whereby it emits light or causes a change in wavelength of the incident light optically excited
- G01N21/64—Fluorescence; Phosphorescence
- G01N21/6428—Measuring fluorescence of fluorescent products of reactions or of fluorochrome labelled reactive substances, e.g. measuring quenching effects, using measuring "optrodes"
- G01N2021/6439—Measuring fluorescence of fluorescent products of reactions or of fluorochrome labelled reactive substances, e.g. measuring quenching effects, using measuring "optrodes" with indicators, stains, dyes, tags, labels, marks
-
- G—PHYSICS
- G01—MEASURING; TESTING
- G01N—INVESTIGATING OR ANALYSING MATERIALS BY DETERMINING THEIR CHEMICAL OR PHYSICAL PROPERTIES
- G01N2201/00—Features of devices classified in G01N21/00
- G01N2201/12—Circuits of general importance; Signal processing
-
- G—PHYSICS
- G01—MEASURING; TESTING
- G01N—INVESTIGATING OR ANALYSING MATERIALS BY DETERMINING THEIR CHEMICAL OR PHYSICAL PROPERTIES
- G01N2333/00—Assays involving biological materials from specific organisms or of a specific nature
- G01N2333/435—Assays involving biological materials from specific organisms or of a specific nature from animals; from humans
- G01N2333/46—Assays involving biological materials from specific organisms or of a specific nature from animals; from humans from vertebrates
- G01N2333/47—Assays involving proteins of known structure or function as defined in the subgroups
Definitions
- the present invention belongs to the field of methods for cell identification.
- Pluripotent stem cells have potential to differentiate into any of the three germ layers: endoderm, mesoderm, or ectoderm and provide a chance to obtain a renewable source of healthy cells and tissues to treat a wide array of diseases.
- Methods currently used to detect/isolate pluripotent cells have inherent experimental variability and low efficiency, and are (1) mechanical isolation based on morphology that requires experience, and is laborious and not efficient; (2) quantification of the endogenous expression of stem cell transcription factors (OCT4, SOX2, etc.) in live cells, which requires genome modification; (3) fluorescence-activated cell sorting (FACS)-based analysis using cell surface markers (SSEA-4, TRA-1-60, etc.), which requires use of antibody based staining that is inherently variable; and (4) more recently, a pluripotent stem cell-specific adhesion signature, which is dependent on the surface properties of cell clusters and thus interrogates the population and not individual cells. Additionally, the identification of high-grade pluripotent hiPSCs is time consuming, requiring the generation of teratomas and several additional pluripotency test.
- the invention relates to a method for detecting the chromatin state of a cell comprising
- the cell comprises smaller clutches, less densely compacted nucleosomes or less nucleosomes per clutches compared to the corresponding reference value is indicative that said cell is in an open chromatin state and wherein if the cell comprises bigger clutches, more densely compacted nucleosomes or more nucleosomes per clutches compared to the corresponding reference value is indicative that said cell is in a closed chromatin state.
- the invention in a second aspect, relates to a method for isolating a cell in an open chromatin state comprising
- the invention relates to a method for isolating a cell in a closed chromatin state comprising
- the invention in a fourth aspect, relates to a kit comprising a first antibody capable of specifically binding to a histone protein and a photoswitchable fluorophore linked-secondary antibody.
- the invention relates to the use of a kit of the invention for detecting and isolating a cell in an open chromatin state or in a closed chromatin state.
- the invention relates to a device adapted to detect the chromatin state of a cell comprising
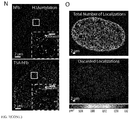
- FIG. 1 Nucleosomes are arranged in discrete nanodomains in interphase nuclei of human somatic cells.
- A Super-resolution images of H2B in human fibroblast nucleus (hFb, left) and human fibroblast nucleus after treatment with trichostatin A (TSA-hFb, right). Progressively higher zooms of the regions inside the white squares are shown next to each nucleus.
- B Density images showing regions of high (light grey, spotted) and low (dark grey, background) H2B density (number of H2B localizations per unit area) in hFb (upper) and TSA-hFb (lower) according to the grey scale bar.
- the density images are converted into binary images in which regions containing H2B localizations appear white. Every white region is analyzed using a cluster identification algorithm that groups the individual localizations based on their proximity into nanodomains. Shown are example nanodomains in hFb (upper) and TSA-hFb (lower) for which localizations (crosses) having the same shade belong to the same nanodomain. The centroid position of each nanodomain is shown as a black dot. The nearest neighbor distances (nnds) between nanodomains inside the white regions are calculated (double head black arrows), along with the number of localizations per nanodomain and the nanodomain area.
- FIG. 2 Nucleosomes are arranged in discrete nanodomains in interphase nuclei of mouse embryonic stem cells.
- A-F Super-resolution images of H2B in (A) the less pluripotent (Type 1) group of mouse embryonic stem cells (mESCs) cultured in serum plus Lif (sLif) medium, (B) the more pluripotent (Type 2) group of mESCs cultured in sLif medium, (C) mESCs cultured in 2iLif medium, (D) neuronal precursor cells (mNPC) obtained after differentiation of mESCs, (E) mutant mESCs lacking Tcf3 (mESC Tcf3 ⁇ / ⁇ ) and (F) mutant mESCs that are triple H1 knockout (mESC H1tKO ).
- FIG. 3 The number of nucleosomes inside clutches correlates with cellular phenotype. Box plots showing the median number of H2B localizations per clutch in hFbs, TSA-hFbs (A); and in different mESCs and in mNPCs (B). (C) Calibration curve to convert from the median number of H2B localizations to the median number of nucleosomes per clutch. The median number of localizations per mononucleosome (hollow ring), 12—(medium grey) and 24-nucleosome array (black circle) assembled in vitro were used to generate the calibration curve.
- Light grey is data from a 4500 base pair (bp) plasmid assembled into nucleosome-arrays with an expected number of ⁇ 20 nucleosomes per array.
- Dark grey ring circle is data from fluorophore-labeled secondary antibody alone.
- the median number of localizations per 4500 bp plasmid and per secondary antibody was interpolated from the calibration curve to obtain the median number of nucleosomes.
- Inset shows the first part of the curve containing the secondary antibody and the mononucleosomes. Error bars correspond to standard deviations.
- D Box plots showing the median number of nucleosomes per clutch in hFbs, TSA-hFbs, in the different types of mESCs and in mNPCs.
- E-F Box plots showing the median density of nucleosomes per clutch in hFbs, TSA-hFbs (E) in the different types of mESCs and mNPCs (F).
- each black dot shows the median number of nucleosomes obtained per individual nucleus.
- the dark grey is the median for the entire population of nuclei analyzed for that cell type.
- the light grey region corresponds to the standard error and the dark grey region to the standard deviation.
- Statistical significance between the different cell types was determined using one-way Anova.
- the stars indicate p-values according to *(p ⁇ 0.05), **(p ⁇ 0.01) and ***(p ⁇ 0.001). See also FIG. 9 .
- FIG. 4 Clutch size is predictive of pluripotency grade in human induced pluripotent stem cells clones.
- A Box plots showing the median number of H2B localizations per clutch in different human induced pluripotent stem cell clones (hiPSCs).
- B Box plots showing the median number of nucleosomes per clutch in the different hiPSCs. The dotted line corresponds to one nucleosome.
- C Box plots showing the median density of nucleosomes per clutch in the different hiPSCs.
- D Pluripotency score of the different hiPSCs obtained from the gene card plotted against the median number of nucleosomes. Error bars indicate standard deviations. For black dots, lines, box plot grey shades and statistics in (A-C) see description in the legend of FIG. 3 . See also FIG. 10 .
- FIG. 5 The linker histone H1 increases in large clutches while RNA Polymerase II associates with small clutches.
- A-B Multi-color super-resolution images showing H2B and H1 in hFb (A) and TSA-hFb (B). Higher zooms of the regions inside white rectangles are shown next to each nucleus.
- C Plot showing the number of H2B (x-axis) and H1 (y-axis) localizations inside clutches for which these two histones showed colocalization. Error bars in x-axis indicate standard deviations and in y-axis indicate standard errors.
- E (upper) Plot showing the distribution of nearest neighbour distances between H2B and PolII11 in hFb (dark grey) and TSA-hFb (light grey).
- lower Plot showing the number of H2B localizations within clutches (y-axis) as a function of the nearest neighbour distances between PolII11 and H2B (x-axis) for hFb (dark grey) and TSA-hFb (light grey). Error bars indicate standard errors.
- FIG. 6 Computer simulations of nucleosome occupancy.
- Nucleosomes (light grey) are initially arranged at regular intervals of 50 bp on the DNA fiber (full occupancy). 146 bp of DNA wraps around each nucleosome.
- a three-dimensional DNA fiber arrangement is generated by positioning nucleosomes according to a Gaussian chain model with end-to-end distances (le-e) calculated according to the worm like chain model (WLM) for a polymer with a persistence length of 150 bp
- WLM worm like chain model
- the resulting DNA fiber configuration is projected onto 2D space
- D In the nucleosome removal (NR) model nucleosomes are removed from the DNA with a given probability ranging from 0 to 95%.
- FIG. 7 Super-resolution imaging of different core histone proteins under various fixation and labeling conditions and H3 acetylation.
- FIG. 1 Comparison of super-resolution (STORM) image of H2B (upper portion) to conventional fluorescence microscopy image of H2B labeled with a primary anti-H2B antibody and Alexa Fluor 647-conjugated secondary antibody (lower portion, grey). The conventional fluorescence image was recorded with 647 nm laser at low enough laser power such that the Alexa Fluor 647 fluorophore did not switch off to the dark state. Higher zooms of the region inside the white square are shown to the right.
- C-D Super-resolution images of H2B after fixation with 4% PFA (C), or Methanol-Ethanol (MeOH-EtOH) (D). Higher zooms of the regions inside the red squares are shown as an inset.
- E Super-resolution image of H2B in cells stably expressing H2B fused to SNAP-tag (H2B-SNAP). H2B was indirectly labeled using an anti-SNAP tag antibody. Higher zoom of the region inside the white square is shown as an inset.
- F-M Control experiment showing the labeling efficiency of H2B antibody in comparison to the GFP-nanobody.
- FIG. 8 Super-resolution imaging of H2B in mouse embryonic stem cells (mESCs) cultured in serum and Lif (sLif) expressing different levels of Nanog, and H3 acetylation in mESCs.
- mESCs mouse embryonic stem cells
- Lif Lif
- FIG. 8 Super-resolution imaging of H2B in mouse embryonic stem cells (mESCs) cultured in serum and Lif (sLif) expressing different levels of Nanog, and H3 acetylation in mESCs.
- A Conventional fluorescence (Cony Fl) image of Nanog (grey) labeled with a primary anti-Nanog antibody and Cy3-conjugated secondary antibody. Density images show high (light grey) and low (dark grey-black) H2B density regions in H2B super-resolution images of Type 1 (upper) and Type 2 (lower) mESCs cultured in sLif according to the grey scale bar.
- B-F Super-resolution images of H3 acetylation in mESC Tcf3 ⁇ / ⁇ (B), mESCs cultured in sLif, Type 1 (C), mESCs cultured in 2iLif, (D), mESCs cultured in sLif, Type 2 (E), and mouse neuronal precursor cells (mNPC) (F).
- FIG. 9 In vitro experiments for the calibration curve.
- A Super-resolution images of fluorophore-labeled secondary antibodies (2ary Ab), mononucleosomes, 12- and 24-nucleosome arrays (left and middle) and examples of identified nanodomains in these images represented as crosses different shades of grey (right).
- B Plot showing the cumulative distribution of the number of localizations per fluorophore-labeled secondary antibody (light grey line), mononucleosome (middle grey line), 12—(dark grey line) and 24-nucleosome array (black line).
- FIG. 10 Classical characterization of the human induced pluripotent stem cell (hiPSC) clone 8 and 13. Related to FIG. 4 .
- (A-B) hiPSCs #8 and #13 were visualized by phase contrast, were stained for the expression of the stem cell marker alkaline phosphatase (AP) (A) and were visualized by conventional fluorescence microscopy after staining with antibodies against the stem cell markers TRA 1-60, SSEA4 (A), Oct4, Sox2 and Nanog (B). Conventional fluorescence microscopy using an anti-Oct4 antibody was carried out in single cells.
- AP alkaline phosphatase
- Mean intensity of Oct4 signal in hiPSCs #8 is 144 ⁇ 1 (Mean intensity ⁇ SEM) and in #13 is 2063 ⁇ 7 (Mean intensity ⁇ SEM). Nuclei were stained with DAPI.
- C Embryoid bodies (upper panels) were formed from hiPSCs #8 and #13 and induced to differentiate in the three germ layers. Immunostaining using anti-Foxa2 (endoderm), anti- ⁇ -Sma (mesoderm) and anti- ⁇ -Tubulin III (ectoderm) were carried out 15 days after differentiation.
- FIG. 11 Quantification of the number of H2B and H1 localizations in mESCs.
- A Plot showing the number of H2B (x-axis) and H1 (y-axis) localizations inside clutches for which these two histones showed colocalization in mESCs cultured in sLif (light grey) and mESCs H1tKO (dark grey).
- B Bar plot showing the average number of H1 localizations detected per area in the nuclei of mESCs cultured in sLif (light grey) and mESCs H1tKO (dark grey).
- A-B Error bars in x-axis indicate standard deviations in y-axis indicate standard errors.
- FIG. 12 Computer simulations of H2B labeling efficiency. Related to FIG. 6 .
- A Example synthetic super-resolution images obtained from computer simulations of 20%, 50% and 80% H2B labeling efficiency. 100% labeling efficiency corresponds to an average of 1.6 antibodies per nucleosome as determined from in vitro images of fluorophore-labeled secondary antibodies and mononucleosomes.
- B Comparison of simulation results (black circles and black line) to experimental data for hFb (horizontal dark grey line) and hFb-TSA (horizontal lighter grey line) at different levels of antibody labeling efficiency (x-axis). The comparison is made for the number of localizations per clutch (upper), nearest neighbor distances of clutches (middle) and clutch area (lower).
- the vertical dark greylines show the antibody labeling efficiency values for which the simulation results intersect the experimental data for the hFb.
- the vertical light grey lines show the antibody labeling efficiency values for which the simulation results intersect the experimental data for the TSA-hFb.
- C-E Comparison of the distributions for the number of localizations per clutch (C), clutch nearest neighbour distances (D) and clutch areas (E) between experimental data and occupancy simulations (57% occupancy for hFb and 45% occupancy for TSA-hFb).
- the distributions obtained from the experimental data are shown as darker greylines for hFb and red lines for TSA-hFb in all cases.
- the distributions obtained from the simulations are shown as the lighter grey lines.
- FIG. 13 (A) Experimental procedure.
- B Conventional image of histone H2B in the two nuclei of a fused cell.
- Lamin A is used as a marker to distinguish the human fibroblast nucleus from the mESC nucleus.
- mESC nucleus does not express lamin A.
- C STORM image of histone H2B in the two nuclei of a fused cell.
- D Quantification of clutch size in the two nuclei 7 hours and 24 hours after fusion.
- nucleosome clutches in analogy with “egg clutches” (Example 1). They developed quantitative methods to assess clutch size, defined as the number of nucleosomes per clutch, and found that this number is very heterogeneous in a given nucleus arguing against the existence of a well-organized and ordered fiber. By comparing experimental data to computer simulations they estimated the nucleosome occupancy of the chromatin fiber and found that nucleosome-depleted regions intersperse nucleosome clutches.
- chromatin compaction follows a hierarchical model where nucleosomes from a “beads-on-string” fiber of 10 nm in diameter, which folds into higher ordered fibers of 30 nm, which in turn compact progressively into larger fibers of 100-200 nm.
- the structural information needs to be obtained using optical means having optical sensors combined with post-processing software configured to reveal internal structures having a length scale of about 10 nm.
- the invention relates to a method for detecting the chromatin state of a cell comprising,
- the cell comprises smaller clutches, less densely compacted nucleosomes or less nucleosomes per clutches compared to the corresponding reference value is indicative that said cell is in an open chromatin state and wherein if the cell comprises bigger clutches, more densely compacted nucleosomes or more nucleosomes per clutches compared to the corresponding reference value is indicative that said cell is in a closed chromatin state.
- Preferred confidence intervals are at least 50%, at least 60%, at least 70%, at least 80%, at least 90%, or at least 95%.
- the p-values are, preferably, 0.05, 0.01, 0.005 or lower.
- the method of the invention allows comparing the chromatin state between two cells, and thus it is possible to determine if two cells have a similar or different chromatin state.
- Chromatin state of a cell relates to a condition of a cell showing open (active) chromatin or closed (inactive) chromatin. Said terms are known by a skill person.
- Open chromatin means a DNA in which histone modifications such as acetylation lead to exposure of a DNA sequence thus allowing binding of transcription factors and transcription to take place. Open chromatin is structurally loose to allow access to RNA and DNA polymerases that transcribe and replicate the DNA.
- “Closed chromatin” is found associated with structural proteins and include modifications of the histone tails that lead to are more tightly packaged state of the chromatin, which is less accessible to the binding of the majority of transcription factors and polymerases.
- the cell in an open chromatin state is selected from the group consisting of transcriptionally active cells, pluripotent cells, cancer cells, drug perturbed cells and reprogrammed cells.
- the cell in an open chromatin state is a pluripotent cell.
- transcriptionally active cell as used herein, relates to a cell having an active chromatin, which means a DNA in which histone modifications such as acetylation lead to exposure of a DNA sequence thus allowing binding of transcription factors and transcription to take place.
- “Pluripotent cell” as used herein, relates to a primordial cell that can differentiate into a sub-group of specialized types of cells, for example, a stem cell that has the potential to differentiate into any of the three germ layers: endoderm (interior stomach lining, gastrointestinal tract, the lungs), mesoderm (muscle, bone, blood, urogenital), or ectoderm (epidermal tissues and nervous system).
- Pluripotent stem cells can give rise to any fetal or adult cell type. However, alone they cannot develop into a fetal or adult animal because they lack the potential to contribute to extraembryonic tissue, such as the placenta.
- pluripotent cells include adipose-derived stem cells (ASCs), amniotic stem cells, bone marrow-derived stem cells (BMSCs), cord blood-derived stem cells (CBSCs), embryonic stem cells (ESCs), fetal stem cells (FSCs), amniotic stem cells, endothelial stem cells, epidermal stem cells, haematopoietic stem and progenitor cells (HSPCs), mesenchymal stem cells (MSCs), neural stem cells (NSCx), retinal stem and progenitor cells (RSPCs), etc.
- ASCs adipose-derived stem cells
- BMSCs bone marrow-derived stem cells
- CBSCs cord blood-derived stem cells
- ESCs embryonic stem cells
- FSCs fetal stem cells
- amniotic stem cells amniotic stem cells
- endothelial stem cells epidermal stem cells
- haematopoietic stem and progenitor cells
- the pluripotent cell is an induced pluripotent stem cell, commonly abbreviated as iPS cell or iPSC, which is a type of pluripotent stem cell artificially derived from a non-pluripotent cell, typically an adult somatic cell, by inducing a “forced” expression of specific genes.
- iPSCs are similar to natural pluripotent stem cells in many respects, such as the expression of certain stem cell genes and proteins, chromatin methylation patterns, doubling time, embryoid body formation, teratoma formation, viable chimera formation, and potency and differentiability.
- Cancer cell refers to a cell from a cancer or tumor or a cancer cell line. “Cancer” refers to a broad group of diseases involving unregulated cell growth and which are also referred to as malignant neoplasms. The term is usually applied to a disease characterized by uncontrolled cell division (or by an increase of survival or apoptosis resistance) and by the ability of said cells to invade other neighboring tissues (invasion) and spread to other areas of the body where the cells are not normally located (metastasis) through the lymphatic and blood vessels, circulate through the bloodstream, and then invade normal tissues elsewhere in the body.
- tumours are classified as being either benign or malignant: benign tumours are tumours that cannot spread by invasion or metastasis, i.e., they only grow locally; whereas malignant tumours are tumours that are capable of spreading by invasion and metastasis.
- Biological processes known to be related to cancer include angiogenesis, immune cell infiltration, cell migration and metastasis. Cancers usually share some of the following characteristics: sustaining proliferative signalling, evading growth suppressors, resisting cell death, enabling replicative immortality, inducing angiogenesis, and activating invasion and eventually metastasis. Cancers invade nearby parts of the body and may also spread to more distant parts of the body through the lymphatic system or bloodstream. Cancers are classified by the type of cell that the tumour cells resemble, which is therefore presumed to be the origin of the tumour. These types include:
- the cancer cells are cells from a cancer selected from breast, ovarian, prostate, brain, pancreas, skin, bone, bone marrow, blood, thymus, uterus, testicles, hepatobiliary and liver tumors, adenoma, angiosarcoma, astrocytoma, epithelial carcinoma, germinoma, glioblastoma, glioma, hemangioendothelioma, hemangiosarcoma, hematoma, hepatoblastoma, leukaemia, lymphoma, medulloblastoma, melanoma, neuroblastoma, hepatobiliary cancer, osteosarcoma, retinoblastoma, rhabdomyosarcoma, sarcoma, and teratoma, acrallentiginous melanoma, actinic keratosis adenocarcinoma
- “Drug perturbed cell”, as used herein relates to a cell treated with a compound that target the cell machinery of transcription, the cell cycle or proliferation process.
- Illustrative non-limitative examples of components of the transcription machinery are RNA polymerase; specificity factors (alter the specificity of RNA polymerase for a given promoter or set of promoters, making it more or less likely to bind to them (i.e.
- repressors bind to non-coding sequences on the DNA strand that are closed to or overlapping the promoter region, impeding RNA polymerase's progress along the strand, thus impeding the expression of the gene
- general transcription factors position RNA polymerase at the start of a protein-coding sequence and then release the polymerase to transcribe the mRNA
- activators enhance the interaction between RNA polymerase and a particular promoter, encouraging the expression of the gene.
- Activators do this by increasing the attraction of RNA polymerase for the promoter, through interactions with subunits of the RNA polymerase or indirectly by changing the structure of the DNA); enhancers (sites on the DNA helix that are bound to by activators in order to loop the DNA bringing a specific promoter to the initiation complex); silencers (regions of DNA that are bound by transcription factors in order to silence gene expression); chromatin remodeling through specific use of miRNA molecules presents one method by which euchromatin, typically associated with transcriptional activity, is converted to heterochromatin, reducing transcription. This occurs by means of RNA induced transcriptional silencing complex or “RITS.”
- Illustrative non-limitative examples of such drugs are tamoxifene, bicalutamide and various types of anti-inflammatory and anabolic steroid, enzyme inhibitors such as kinase and acetylase inhibitors or activators. As a result of treatment with the drug the cell could suffer transcription of a gene.
- Reprogrammed cell can be referred in general to the passage of a cell from the differentiated state (or differentiated cell—i.e., a cell specialized for a specific function, such as a heart, liver, etc., that cannot generate other types of cells) to an undifferentiated state (or undifferentiated stem cell—i.e., a cell not specialized for a specific function that retains the potential to give rise to specialized cells), both at level of embryonic state or progenitor state; but also reprogramming can be referred to the passage from one differentiated state to another differentiated state (for example, a fibroblast that becomes a neuron without going back to a precursor/embryonic state, or a retinal neuron that becomes another retinal neuron without going back to a precursor/embryonic state).
- differentiated state or differentiated cell—i.e., a cell specialized for a specific function, such as a heart, liver, etc., that cannot generate other types of cells
- undifferentiated state
- Reprogramming of a somatic cells can be achieved via cell fusion, via overexpression of specific transcription factors, via nuclear transfer and via the use of protein extracts.
- the reprogrammed cell obtained after transcription factor overexpression, nuclear transfer or via protein extracts
- the reprogrammed hybrids formed as a result of the cell fusion between a cell, e.g. stem cell and a somatic cell
- a cell e.g. stem cell and a somatic cell
- Step a) of the method for detecting the chromatin state of a cell comprises contacting a sample containing cells with a first antibody capable of specifically binding to a histone protein.
- a first antibody capable of specifically binding to a histone protein comprises contacting a sample containing cells with a first antibody capable of specifically binding to a histone protein.
- sample refers to any biological sample susceptible of containing cells, and it can be obtained by conventional methods known by those of average skill in the art, depending on the nature of the sample.
- said biological sample is a biopsy sample, tissue, cell or biofluid sample (plasma, serum, saliva, semen, sputum, cerebral spinal fluid (CSF), tears, mucus, sweat, milk, brain extracts and the like).
- Said biological samples can be obtained by any conventional method.
- the sample is a cell culture sample.
- the sample is a mouse or human commercial cell line.
- the sample is a biopsy sample from a human patient.
- the sample comprises primary cells purified from body parts of human donors.
- antibody refers to immunoglobulin molecules and immunologically active portions of immunoglobulin molecules, i.e., molecules containing an antigen fixing site binding specifically (immunoreacting) with an antigen, such as a protein for example.
- immunoglobulin M immunoglobulin M
- IgD immunoglobulin D
- IgG immunoglobulin G
- IgA immunoglobulin A
- IgE immunoglobulin E
- the antibodies that are going to be used in the present invention can be, for example, polyclonal sera, hybridoma supernatants or monoclonal antibodies, antibody fragments, Fv, Fab, Fab′ and F(ab′)2, scFv, diabodies, triabodies, tetrabodies and humanized antibodies.
- Histone protein relates to a highly alkaline protein found in eukaryotic cell nuclei that packages and orders the DNA into structural units called nucleosomes.
- Histones H2A, H2B, H3 and H4 are known as the core histones, while histones H1 and H5 are known as the linker histones.
- Nucleosomes are a repeating unit of the chromatin, formed by 146 base pairs (bp) of DNA wrapped around octamers of the four core histone proteins (H2A, H2B, H3 and H4).
- the histone protein can also be detected by detecting a functionally equivalent variant of a histone protein.
- “Functionally equivalent variant” is understood to mean all those proteins derived from a histone sequence by modification, insertion and/or deletion or one or more amino acids, whenever the function is substantially maintained.
- Assays to determine the function of an enzyme are known by the skilled person and include, without limitation, initial rate assays, progress curve assays, transient kinetics assays and relaxation assays.
- Continuous assays of enzymatic activity include, without limitation, spectrophotometric, fluorometric, calorimetric, chemiluminiscent, light scattering and microscale thermopheresis assays.
- Discontinuous assays of enzymatic activity include, without limitation, radiometric and chromatographic assays.
- factors that may influence enzymatic activity comprise salt concentration, temperature, pH, and substrate concentration.
- the function of a histone can be determined by analyzing the compaction of DNA.
- the compaction of DNA can be assay using several methods known in the art, by way of illustrative-non limitative example by density gradient centrifugation on MNase digested samples, comet assay.
- the function of H2B can be assayed by determining the phosphorylation of H2B at serine 14, which is linked to chromatin condensation.
- the function of the H2B can be assayed by detecting acetylation in Lys12 and in Lys15 or ubiquitylation in Lys120, all of these modifications, associated with transcriptionally activation, and thus with an open chromatin state.
- variants of a histone protein are (i) polypeptides in which one or more amino acid residues are substituted by a preserved or non-preserved amino acid residue (preferably a preserved amino acid residue) and such substituted amino acid may be coded or not by the genetic code, (ii) polypeptides in which there is one or more modified amino acid residues, for example, residues modified by substituent bonding, (iii) polypeptides resulting from alternative processing of a similar mRNA, (iv) polypeptide fragments and/or (v) polypeptides resulting from a histone fusion or the polypeptide defined in (i) to (iii) with another polypeptide, such as a secretory leader sequence or a sequence being used for purification (for example, His tag) or for detection (for example, Sv5 epitope tag).
- the fragments include polypeptides generated through proteolytic cut (including multisite proteolysis) of an original sequence.
- the variants may be post-translationally
- the “similarity” between two polypeptides is determined by comparing the amino acid sequence and the substituted amino acids preserved from a polypeptide with the sequence of a second polypeptide.
- the variants are defined to include polypeptide sequences different from the original sequence, preferably different from the original sequence in less than 40% of residues per segment concerned, more preferably different from the original sequence in less than 25% of residues per segment concerned, more preferably different from the original sequence in less than 10% of residues per segment concerned, more preferably different from the original sequence in only a few residues per segment concerned and, at the same time, sufficiently homologous to the original sequence to preserve functionality of the original sequence.
- the present invention includes amino acid sequences which are at least 60%, 65%, 70%, 72%, 74%, 76%, 78%, 80%, 90%, or 95% similar or identical to the original amino acid sequence.
- the degree of identity between two polypeptides may be determined using computer algorithms and methods which are widely known to those skilled in the art.
- the identity between two amino acid sequences is preferentially determined using BLASTP algorithm [BLASTManual, Altschul, S. et al., NCBI NLM NIH Bethesda, Md. 20894, Altschul, S., et al., J. Mol. Biol. 215: 403-410 (1990)].
- the histone protein is core histone protein.
- Core histone protein refers to any histone selected from the group consisting of histone H2A, H2B, H3 and H4.
- the core histone protein is H2B.
- H2B refers to one of the 5 main histone proteins involved in the structure of chromatin in eukaryotic cells. Featuring a main globular domain and a long N terminal tail H2B is involved with the structure of the nucleosomes of the ‘beads on a string’ structure. H2B has 19 variants in humans. The detection of any variant of H2B can be used in the present invention.
- the sample is properly collected, fixed and/or sectioned.
- Cells in a sample can be fixed by any suitable process including perfusion or by submersion in a fixative.
- Fixatives can be classified as cross-linking agents (such as aldehydes, e.g., formaldehyde, paraformaldehyde, and glutaraldehyde, as well as non-aldehyde cross-linking agents), oxidizing agents (e.g., metallic ions and complexes, such as osmium tetroxide and chromic acid), protein-denaturing agents (e.g., acetic acid, methanol, and ethanol), fixatives of unknown mechanism (e.g., mercuric chloride, acetone, and picric acid), combination reagents (e.g., Carnoy's fixative, methacarn, Bouin's fluid, B5 fixative, Rossman's fluid, and Gendre's fluid), microwaves, and miscellaneous fixatives (e.g., excluded volume fixation and vapor fixation).
- cross-linking agents such as aldehydes, e.g.,
- Additives may also be included in the fixative, such as buffers, detergents, tannic acid, phenol, metal salts (such as zinc chloride, zinc sulfate, and lithium salts), and lanthanum.
- the fixative used in the present invention is a combination of methanol and ethanol, more particularly in a 1:1 ratio.
- samples can be incubated with a buffer that blocks the reactive sites to which the primary or secondary antibodies may otherwise bind.
- Common blocking buffers include normal serum, non-fat dry milk, BSA, or gelatin. Commercial blocking buffers with proprietary formulations are available. Methods to eliminate background staining include dilution of the primary or secondary antibodies, changing the time or temperature of incubation, or using a different primary antibody. In a preferred embodiment, the blocking is carry out by a buffer comprising BSA
- the detection of the antibody:histone complex is carried out by contacting said complex with a secondary antibody, having at least one photoswitchable fluorophore adapted to be optically excited at a certain wavelength and to emit light at a wavelength ⁇ 2 different from ⁇ 1 .
- a secondary antibody having at least one photoswitchable fluorophore adapted to be optically excited at a certain wavelength and to emit light at a wavelength ⁇ 2 different from ⁇ 1 .
- Fluorophore refers to entities that can emit light of a certain emission wavelength when exposed to a stimulus, for example, an excitation wavelength.
- “Photoswitchable” as used herein relates to an entity which can be switched between different light-emitting or non-emitting states by incident light of different wavelengths.
- a “switchable” entity can be identified by one of ordinary skill in the art by determining conditions under which an entity in a first state can emit light when exposed to an excitation wavelength, switching the entity from the first state to the second state, e.g., upon exposure to light of a switching wavelength, then showing that the entity, while in the second state can no longer emit light (or emits light at a reduced intensity) or emits light at a different wavelength when exposed to the excitation wavelength. Examples of switchable entities are disclosed in WO 2008/091296.
- Cy5 can be switched between a fluorescent and a dark state in a controlled and reversible manner by light of different wavelengths, e.g., 633 nm or 657 nm red light can switch or deactivate Cy5 to a stable dark state, while 405 nm or 532 nm light can switch or activate the Cy5 back to the fluorescent state.
- light of different wavelengths e.g., 633 nm or 657 nm red light can switch or deactivate Cy5 to a stable dark state, while 405 nm or 532 nm light can switch or activate the Cy5 back to the fluorescent state.
- the fluorophore can be reversibly switched between the two or more states, e.g., upon exposure to the proper stimuli.
- a first stimuli e.g., a first wavelength of light
- a second stimuli e.g., a second wavelength of light
- Any suitable method may be used to activate the fluorophore.
- incident light of a suitable wavelength may be used to activate the entity to emit light, i.e., the entity is photoswitchable.
- the photoswitchable fluorophore can be switched between different light-emitting or non-emitting states by incident light, e.g., of different wavelengths.
- the light may be monochromatic (e.g., produced using a laser) or polychromatic.
- the entity may be activated upon stimulation by electric field and/or magnetic field.
- the entity may be activated upon exposure to a suitable chemical environment, e.g., by adjusting the pH, or inducing a reversible chemical reaction involving the entity, etc.
- any suitable method may be used to deactivate the entity, and the methods of activating and deactivating the entity need not be the same.
- the entity may be deactivated upon exposure to incident light of a suitable wavelength, or the entity may be deactivated by waiting a sufficient time.
- the switchable entity includes a first, light-emitting portion (e.g., a fluorophore), and a second portion that activates or “switches” the first portion.
- a first, light-emitting portion e.g., a fluorophore
- a second portion that activates or “switches” the first portion.
- the second fluorophore may activate the first fluorophore a, causing the first fluorophore to emit light.
- activator fluorophores include, but are not limited to Alexa Fluor 405 (Invitrogen), Alexa 488 (Invitrogen), Cy2 (GE Healthcare), Cy3 (GE Healthcare), Cy3.5 (GE Healthcare), or Cy5 (GE Healthcare), or other suitable dyes.
- light-emitting portions include, but are not limited to, Cy5, Cy5.5 (GE Healthcare), or Cy7 (GE Healthcare), Alexa Fluor 647 (Invitrogen), or other suitable dyes.
- a linker e.g., forming compounds such as, but not limited to, Cy5-Alexa Fluor 405, Cy5-Alexa Fluor 488, Cy5-Cy2, Cy5-Cy3, Cy5-Cy3.5, Cy5.5-Alexa Fluor 405, Cy5.5-Alexa Fluor 488, Cy5.5-Cy2, Cy5.5-Cy3, Cy5.5-Cy3.5, Cy7-Alexa Fluor 405, Cy7-Alexa Fluor 488, Cy7-Cy2, Cy7-Cy3, Cy7-Cy3.5, or Cy7-Cy5.
- the first fluorophore (activator) is Alexa 405 and the second fluorophore is Alexa 647.
- wavelength ⁇ 1 is 647 nm
- wavelength ⁇ 2 is 670 nm
- wavelength ⁇ 3 is 405 nm.
- any suitable method may be used to link the first, light-emitting fluorophore and the second, activation fluorophore.
- a linker is chosen such that the distance between the first and second fluorophore is sufficiently close to allow the activator fluorophore to activate the light-emitting fluorophore as desired, e.g., whenever the light-emitting fluorophore has been deactivated in some fashion.
- the fluorophore will be separated by distances on the order of 500 nm or less, for example, less than about 300 nm, less than about 100 nm, less than about 50 nm, less than about 20 nm, less than about 10 nm, less than about 5 nm, less than about 2 nm, less than about 1 nm, etc.
- linkers include, but are not limited to, carbon chains (e.g., alkanes or alkenes), polymer units, or the like.
- the switchable entity may comprise a first fluorophore directly bonded to the second fluorophore, or the first and second entity may be connected via a linker or a common entity. Whether a pair of light emitting portion and activator portion produces a suitable switchable entity can be tested by methods known to those of ordinary skills in the art. For example, light of various wavelength can be used to stimulate the pair and emission light from the light-emitting portion can be measured to determine whether the pair makes a suitable switch.
- Step c) of the method of the invention comprises recording a super resolution image of nucleosome organization by means of a sensor being sensitive at least to the wavelength of emission of the photoswitchable fluorophore by exciting the sample with an optical radiation having a wavelength ⁇ 1 .
- Recording an image by means of an optical sensor aiming to the optically excited sample provides a bitmap image at certain resolution having information about the nucleosome organization.
- the image shows the projection over the focal plane of the sensor used for recording the image of the location of the photoswitchable fluorophores that have emitted light. This information will be used to provide characteristic length scales and density of some relevant structural parts of the protein that allows identifying nucleosomal organization and thus the chromatin state of a cell.
- Super resolution image refers to an image with an axial and lateral resolution under 100 nm allowing single molecule localization. At present, super resolution images provides a resolution near the limit of the length scale defined by chromatin fibers, that is 10-30 nm.
- the super resolution images can be obtained by any super resolution techniques known in the art.
- Super-resolution techniques allow the capture of images with a higher resolution than the diffraction limit. They fall into two broad categories, “true” super-resolution techniques, which capture information contained in evanescent waves, and “functional” super-resolution techniques, which use clever experimental techniques and known limitations on the matter being imaged to reconstruct a super-resolution image.
- “true” super-resolution techniques which capture information contained in evanescent waves
- “functional” super-resolution techniques which use clever experimental techniques and known limitations on the matter being imaged to reconstruct a super-resolution image.
- Deterministic super-resolution The most commonly used emitters in biological microscopy, fluorophores, show a nonlinear response to excitation, and this nonlinear response can be exploited to enhance resolution. These methods include without limitation STED, GSD, RESOLFT and SSIM.
- a plurality of super resolution images are taken by means of a sensor being sensitive at least to the wavelength of emission of the second fluorophore ⁇ 2 rendering a further super resolution image by collecting the sensed light emissions recorded in the plurality of images.
- a plurality of images are recorded and post-processed in order to obtain a new image with the accumulated value of the optical radiation emitted by the sample.
- some of the photoswitchable fluorophores are activated and other photoswitchable fluorophores are not.
- the new image provides information of a large number of locations of photoswitchable fluorophores because the probability of recording the emission of light of certain photoswitchable fluorophore being excited is higher.
- a pair of different photoswitchable fluorophores is used.
- the first photoswitchable fluorophore is adapted to be optically excited at a certain wavelength ⁇ 1 and to emit light at a wavelength ⁇ 2 different from ⁇ 1 ; and, the second photoswitchable fluorophore is adapted to be optically excited at a wavelength ⁇ 3 and reactivate the first fluorophore by bringing it from its dark state back to its ground state.
- the secondary antibody further comprises a second fluorophore adapted to be optically excited at a wavelength ⁇ 3 and reactivate the first fluorophore by bringing it from its dark state back to its ground state, upon which the first fluorophore can be excited again at its excitation wavelength and emit light at its emission wavelength ⁇ 2 .
- a first step the sample is excited with an optical radiation having a wavelength ⁇ 2 turning the first fluorophore to a dark state.
- a further optical radiation having a wavelength ⁇ 3 excites the second photoswitchable fluorophore which reactivates the first fluorophore by bringing it from its dark state back to its ground state, upon which the first fluorophore can be excited again at its excitation wavelength ⁇ 1 and emit light at its emission wavelength ⁇ 2 .
- This last excitation using an optical radiation at a wavelength ⁇ 1 provides the emission at an emission wavelength ⁇ 2 that is recorded at least in one image.
- the power of the optical radiation having a wavelength ⁇ 3 is monotonically increased.
- the optical radiation at a wavelength ⁇ 3 has been gradually increased in a sigmoidal manner reaching a maximum power value, keeping this maximum value until the fluorophores are exhaustively imaged and photobleached.
- the sample is excited once or more times with an optical radiation having a wavelength ⁇ 1 and subsequently excited once or more times with an optical radiation having a wavelength ⁇ 3 .
- One fluorophore is recorded in the image by a plurality of pixels grouped in a region of the said image.
- the value of each pixel is associated to a certain value of radiation.
- the location of the fluorophore needs to be determined for the set of pixels having information of that fluorophore.
- a more complex situation is found when two or more fluorophores are close enough as for a plurality of pixels show the accumulated radiation of the plurality of fluorophores. That is, the radiation value represented in a single pixel may be the contribution of the radiation from more than one fluorophore.
- the individual locations of photoswitchable fluorophores and cluster information need to be identified over the image.
- Step d) of the present invention comprises correlating the image obtained in step c) with size of nucleosomal clutches, nucleosomal density and/or number of nucleosomes per nucleosomal clutches.
- Nucleosome clutch as used herein relates to a heterogeneous nucleosome group.
- Size of nucleosomal clutches as used herein relates to the number of nucleosomes per clutch.
- Nucleosomal density relates to the number of nucleosomes in a clutch divided by the unit area of that clutch.
- the image obtained in step c) is converted to a list of “fluorescent probe positions”.
- fluorescent probe positions Several known softwares can be used for obtaining fluorescent probe positions, as illustrative non-limiting example the Insight 3 provided by BO Huang, University of California, San Francisco. Briefly, peaks in single-molecule images are identified based on a threshold and fit to a simple Gaussian to determine the x and y positions. The final images are rendered by representing each x-y position (localization) as a Gaussian with a width that corresponds to the determined localization precision (9 nm).
- Sample drift during acquisition is calculated and subtracted by reconstructing STORM images from subsets of frames (typically 500-1000 frames, for which drift was assumed to be small) and correlating these images to a reference frame (typically one that is reconstructed at the initial time segment).
- each peak is color coded based on whether the emission is recorded immediately after ⁇ 3 or another activation wavelength ( ⁇ 4 ).
- the peaks coming from a frame not belonging to the one right after an activation frame were coded as “non-specific”.
- a crosstalk algorithm as described previously is applied to correct for non-specific activations by the imaging laser (Dani et al., 2010).
- the number of “apparent specific” activations are calculated from the frame immediately following the activation pulse and the number of “non-specific” activations from subsequent imaging frames in the imaging cycle. Assuming that the probability of “non-specific” activations is constant across all frames, it could be determined the number of “actual specific” activations by subtracting the “non-specific activation” number from the “apparent specific” activation number. We then used these numbers to statistically subtract crosstalk due to “non-specific” activations in an unbiased way as previously described (Dani et al., 2010).
- the position lists can be used to construct discrete localization images, such that each pixel has a value equal to the number of localizations falling within the pixel area, as a way of illustrative-non limitative example the pixel size is ⁇ the location accuracy, in a more preferred embodiment the pixel size is 10 nm.
- density maps may be obtained by 2-dimensional convolution with a square kernel, as a way of illustrative-non limitative example, preferably ⁇ 1 ⁇ 1 pixels 2 , more preferably 5 ⁇ 5 pixels 2 , although the kernel can have different shapes.
- a constant threshold may be used to digitize the density maps into binary images, such that pixels have a value of 1 where the density is larger than the threshold value and a value of 0 elsewhere. Localizations falling on zero-valued pixels of the binary images (low-density areas) may be discarded from further analysis. Connected components of the binary image, composed by adjacent non-zero pixels (4-connected neighborhood), are sequentially singled out and analyzed. Localization coordinates within each connected component can be grouped by means of a distance-based clustering algorithm. Initialization values for the number of clusters and the relative centroid coordinates can be obtained from local maxima of the density map within the connected region, calculated by means of a peak finding routine. Localizations may be associated to clusters based on their proximity to cluster centroids.
- New cluster centroid coordinates can be iteratively calculated as the average of localization coordinates belonging to the same cluster. The procedure was iterated until convergence of the sum of the squared distances between localizations and the associated cluster and provided cluster centroid positions and number of localizations per cluster. Cluster sizes can be calculated as the standard deviation of localization coordinates from the relative cluster centroid.
- a super resolution image is rendered from the list of locations (x,y) determined as the coordinates in the sample where an optical emission of a photoswitchable fluorophore adapted to emit light at a wavelength ⁇ 2 is present.
- peaks in single-molecule image are identified wherein only values over a predetermined threshold value are taken into account.
- the relevant values, those values over the threshold value are fit to a simple Gaussian to determine the x and y positions over the image.
- the x and y position over the image can be correlated to the physical x and y coordinates over the sample for instance once the limits of the image over the sample are known.
- the set of locations (x,y) may be provided as a list.
- a further procedure uses data in a form of a list of coordinates (x, y), each coordinate (x, y) corresponding to one location of a photoswitchable fluorophore.
- clutches and relevant parameters on said clutches is provided.
- a density image of resolution lower than or equal to the rendered high resolution image used for the determination of the locations (x, y) and representing the same area as said rendered high resolution image is provided wherein each pixel of the density image has a value proportional to the number of locations of the location list falling within the area represented by said pixel. In particular, the value is taken as the number of localizations falling within the pixel area represented by the pixel.
- a binary image representing the same area than the density image comprising zero value pixels if the corresponding value represented by the density image in the same location is lower than a predefined threshold; and, nonzero if said value is higher, is provided.
- Zero and nonzero values are examples of binary values representing two different levels. A first level corresponding to pixel values under the threshold value and a second level corresponding to pixel values equal or over the threshold value.
- Regions of pixels corresponding to the second level comprise clutches, which are shows as clusters of pixels.
- a third step identifies connected regions of pixels representing values higher than the predefined threshold, that is, the binary value representing the second level.
- the localization of clutches is identified from the binary image and the list of localizations. For each connected region, the localization coordinates falling within said connected region is grouped according to a distance-based criterion. Each group of locations is deemed to belong to the same clutch.
- the position of the clutch is taken as the centroid position of the localization coordinates associated with said clutch.
- the fourth step provides a list of the position of clutches calculated as disclosed. Once the position of the clutches being in each region, the number of clutches per region, the density calculated using a distance-based criterion and other statistical values may be used as measurements parameters for the determination of criteria that allows discerning if a cell is in an open chromatin state or in a closed chromatin state according to particular embodiments of the invention.
- a density image of resolution lower than or equal to the rendered high resolution image and representing the same area than said rendered high resolution image wherein each pixel of the density image has a value proportional to the number of locations of the list of location coordinates falling within the area represented by said pixel,
- the method comprises identifying connected regions of nonzero pixels.
- the size of nucleosomal clutch is calculated as a measure of the spreading of the positions of all the localization coordinates associated with said clutch and/or the number of nucleosomes within said clutch.
- the density of clutches within a connected region is calculated as the number of nucleosomes per clutch divided by the area occupied by said clutches.
- the method of the invention further comprises step e) comparing data obtained in step d) with a corresponding reference value to obtain a score based on size of nucleosomal clutches, nucleosomal density and/or number of nucleosomes per nucleosomal clutch.
- Reference value relates to a laboratory value used as a reference for the values/data obtained from samples.
- the reference value (or reference level) can be an absolute value, a relative value, a value which has an upper and/or lower limit, a series of values, an average value, a median, a mean value, or a value expressed by reference to a control or reference value.
- a reference value can be based on the value obtained from an individual sample, such as, for example, a value obtained from a sample of study but obtained at a previous point in time.
- the reference value can be based on a high number of samples, such as the values obtained in a population of samples.
- the reference value can be based on the clutches area, number of nucleosomes per nucleosomal clutch, or nucleosome density of clutches from a cell in a closed chromatin state, by way of illustrative non-limitative example from a non-cancer cell, a terminally differentiated cell or from a cell wherein the machinery of transcription is inactive.
- the reference value can be based on the clutch area, number of nucleosomes per nucleosomal clutch or nucleosome density of clutches from cells with an open chromatin state or alternatively with a more open chromatin state, by way of illustrative, non-limitative example highly transcriptionally activated cells, highly pluripotent cell, ESCs and iPSCs.
- Cells with a more open chromatin state may correspond to cells with higher grade of pluripotency.
- the grade of pluripotency in a cell can be determined, for example, with a gene card technology (Bock et al, 2011).
- the reference value is based on the clutch area, number of nucleosomes per nucleosomal clutch or nucleosome density of clutches from cell known to be in a closed chromatin state.
- the size of nucleosomal clutches, nucleosomal density and/or number of nucleosomes per nucleosomal clutch is compared with the reference value. As a consequence of this comparison the size of nucleosomal clutches, nucleosomal density and/or number of nucleosomes per nucleosomal clutch can be “greater than” or “bigger than” or “more that”; “less than” or “smaller than” or “equal to” the corresponding reference value.
- the size of nuclesomal clutches, the nucleosomal density or the number of nucleosomes per nucleosomal clutches are “greater than or more than or bigger than” the corresponding reference value, when the size of nuclesomal clutches, the nucleosomal density or the number of nucleosomes per nucleosomal clutches is by way of illustrative, non-limitative example, at least 1.1-fold, 1.5-fold, 2-fold, 5-fold, 10-fold, 20-fold, 30-fold, 40-fold, 50-fold, 60-fold, 70-fold, 80-fold, 90-fold, 100-fold or even more when compared with the reference value for said marker.
- the size of nuclesomal clutches, the nucleosomal density or the number of nucleosomes per nucleosomal clutches are “lower than or smaller than” the corresponding reference value, when the size of nuclesomal clutches, the nucleosomal density or the number of nucleosomes per nucleosomal decreases by way of illustrative, non-limitative example, at least 5%, 10%, 25%, 50%, 75%, or even 100%.
- the cell comprises smaller clutches, less densely compacted nucleosomes or less nucleosomes per clutches compared to the corresponding reference value is indicative that said cell is in an open chromatin state.
- the cell comprises bigger clutches, more densely compacted nucleosomes or more nucleosomes per clutches compared to the corresponding reference value is indicative that said cell is in a closed chromatin state
- the method for detecting the chromatin state of a cell further comprises detecting the RNA polymerase II association to the nucleosome.
- RNA polymerase II is more associated to the nucleosome is indicative that said cell is in an open chromatin state.
- RNA polymerase II relates to an enzyme that catalyzes the transcription of DNA to synthesize precursors of mRNA and most snRNA and microRNA.
- RNA pol II subunit B1 is detected.
- the sequence of RNA pol II subunit B1 in humans corresponds to the sequence P24928 in the Uniprot database 3 Sep. 2014.
- the invention further comprises detecting the linker histone H1.
- Histone H1 as used herein relates to a protein involved with the packing of the “beads on a string” sub-structures into a high order structure.
- the sequence of RNA H1 in humans corresponds to the sequence Q02539 in the Uniprot database 3 Sep. 2014.
- the histone H1 is more associated to the nucleosome is indicative that said cell is in a closed chromatin state.
- RNA polymerase II or H1 The association of RNA polymerase II or H1 to the nucleosome can be detected by any method known in the art. In a preferred embodiment, the association is detected by multicolor super resolution imaging as described in Bates et al., 2007.
- the invention relates to a method for isolating a cell in an open chromatin state comprising
- the cell in an open chromatin state is selected from the group consisting of transcriptionally active cells, pluripotent cells, cancer cells, drug perturbed cells and reprogrammed cells.
- the cell in an open chromatin state is a pluripotent cell.
- the invention relates to a method for isolating a cell in a closed chromatin state comprising
- the invention in another aspect, relates to a kit comprising a first antibody capable of specifically binding to a histone protein and a photoswitchable fluorophore linked-secondary antibody.
- kits are understood as a product containing the different reagents necessary for carrying out the methods of the invention packed so as to allow their transport and storage.
- the kits of the invention can contain instructions for the simultaneous, sequential or separate use of the different components which are in the kit.
- Said instructions can be in the form of printed material or in the form of an electronic support capable of storing instructions susceptible of being read or understood, such as, for example, electronic storage media (e.g. magnetic disks, tapes), or optical media (e.g. CD-ROM, DVD), or audio materials. Additionally or alternatively, the media can contain internet addresses that provide said instruction.
- the first antibody capable of specifically binding to a histone protein and a photoswitchable fluorophore linked-secondary antibody comprise at least 10%, at least 20%, at least 30%, at least 40%, at least 50%, at least 60%, at least 70%, at least 80%, at least 90% or at least 100% of the total amount of reagents forming the kit.
- the histone protein is a core histone protein, more preferably histone H2B.
- the invention relates to the use of the kit according to the invention for detecting the chromatin state of a cell and isolating a cell in an open chromatin state or in a closed chromatin state.
- the detection of the chromatin state of a cell and the isolation of a cell in an open chromatin state or in a closed chromatin state is performed by a method of the invention.
- the method of the first and second aspect of the invention may be carried out by means of a device adapted to detect the chromatin state of a cell comprising:
- the source of the optical radiation may be in the form of a laser source.
- the interrogation area is the area where the sample is located and it is the area over which the optical sensor is aiming so that the image taken by the optical sensor is the focused over the sample.
- the optical sensor is sensible to the second wavelength ⁇ 2 , that is, the wavelength of the radiation emitted by the photoswitchable fluorophores linked to the antibody:histone complex determining its location.
- the control unit is configured to have the control over the source of the optical radiation and the optical sensor to allow recording images of samples when the photoswitchable fluorophores are excited.
- control unit is further adapted to carry out the method of the invention.
- control unit is a programmable unit and is adapted to execute a computer program.
- control unit is an ASIC unit being programmed to carry out the control over the source of the optical radiation and the optical sensor to allow recording images of samples when the photoswitchable fluorophores are excited.
- control unit is adapted to carry out a post-processing of the image for the assessment of parameters over a sample.
- control unit is configured to carry out steps first, second, third and fourth for the calculation of position of clutches.
- Human fibroblasts (hFb) (BJ, Skin Fibroblast, American Type Culture Collection, ATCC® CRL-2522TM) were cultured in DMEM supplemented with 10% FBS, 1 ⁇ Non-essential AA, 1 ⁇ GlutaMax and 1 ⁇ penicillin/streptomycin. Human fibroblasts were treated with 300 nM of TSA (TricostatinA, Sigma-Aldrich) solution (TSA-hFbs) in complete growth medium for 24 hours before imaging experiments.
- TSA TricostatinA, Sigma-Aldrich
- Human fibroblasts expressing the Histone H2B-SNAP fusion protein were obtained after drug selection of nucleofected cells with the pSNAP-H2B Plasmid (N91795, New England BioLabs) using the Amaxa Human Dermal Fibroblast Nucleofector Kit (Lonza, VPD-1001).
- mESCs and mESCs Tcf3 ⁇ / ⁇ were previously described (Merrill et al., 2004).
- mESCs H1tKO were gift from Arthur I. Skoultchi (Fan et al., 2005) mESCs were cultured on gelatin in sLif medium composed by KO DMEM supplemented with 15% FBS (Hyclone), 1 ⁇ Non-Essential Amino acid, 1 ⁇ GlutaMax (Invitrogen), 1 ⁇ penicillin/streptomycin, 1 ⁇ 2-mercaptoethanol and 1,000 U/mL LIF ESGRO (Chemicon).
- mESCs were cultured also in 2iLif medium composed by N2B27 medium supplemented with 3 ⁇ M CHIR99021, 1 ⁇ M PD0325901, 1,000 U/mL LIF and 1 ⁇ penicillin/streptomycin for eight passages before imaging experiments.
- mNPCs were generated by culturing mESCs as cell aggregates with 5 ⁇ M retinoic acid (RA) as previously described (Bibel et al., 2007). Neuronal progenitors cells were fixed 2 days after plating dissociated cellular aggregates.
- RA retinoic acid
- Heterokaryons were generated fusing E14 mESCs with Human Fibroblasts (BJ) (1:1 ratio) using polyethylene glycol ((w/v) PEG 50%) as previously described (Pereira et al., 2008).
- Mouse and human specific surface markers were used to label the cells to FACS-sort heterokaryons using a BD FACSAna Cell sorter.
- the sorted heterokaryons were plated on gelatin coated 8-well Lab-tek 1 coverglass chamber (Nunc) and cultured in the sLif Medium. Attached heterokaryons were fixed 7 hours and 24 hours after fusion with Methanol-Ethanol solution (50:50) for 6 minutes at ⁇ 20° C.
- Lamin A/C antibody (VPL550, Vector Laboratories) incubation was done at room temperature for 2 hours, followed by Alexa Fluor-488 (Invitrogen) secondary antibody incubation for 40 min at room temperature.
- Histone H2B labeling for STORM Imaging was done as explained in details in the ‘Immuno-staining for STORM’ section.
- the regular 12-mer and 24-mer DNA templates (gift from S. Grigoryev, (Grigoryev et al., 2009)) were isolated from Escherichia Coli and reconstituted with native histone octamers from HeLa cells using the ‘In vitro Chromatin Assembly Kit’ (CA-vitro-003, DIAGENODE). Chromatin was purified over a column of 4% agarose beads (cat #: A-1040-M, ABT, Agarose Bead Technologies) in a 0.5 ⁇ 20 cm Econo-Column (BioRad) and immediately used for experiments.
- the purified polynucleosomes were spotted on a coverglass and incubated over night at 4° C. in presence of 1 mM MgCl2 and 150 mM NaCl, then fixed with PFA 4% solution for 10 min at 4° C.
- Mononucleosomes were reconstituted as described before (Workman and guitarist, 1992). Briefly, naked 200 bp DNA was mixed with HeLa octamers in a 1:1 w/w ratio in a reconstitution mix with 10 mM Tris-HCl, pH 8, 20 mM EDTA, 2M NaCl, 10 mM DTT, 2 mM 2-mercaptoethanol, 15 ng/ ⁇ l BSA and left in mini dialysis chamber in a floater for dialysis in a high salt concentrated buffer for 2 h at 4° C. Then the samples were dialyzed over 20 h at 4° C. continuously diluting the concentration of NaCl from 2M to 0M.
- Mononucleosomes were collected from the mini dialysis chamber and centrifuged. Then they were spotted on a coverglass and left at 4° C. overnight and finally fixed in PFA 4% for 10 minutes at 4° C. HeLa's octamers were spotted on a coverglass and fixed in the same way after overnight incubation at 4° C. without addition of salts.
- 12-polynucleosome arrays were prepared for EM according to standard protocols (CA-vitro-003, DIAGENODE). Purified and undiluted samples were applied to air glow discharged continuous carbon (hydrophilic-negatively charged surface), contrasted with Uranyl Formate and examined in a Philips Biotwin microscope at 120 kV. Images were recorded on a KeenView CCD camera (SIS Olympus) (Electron Microscopy Core Facility of European Molecular Biology Laboratory, EMBL Heidelberg).
- Integration-free hiPSCs were generated as described previously (Okita et al., 2011). Briefly a combination of episomal vectors encoding for OCT3/4-shp53, SOX2, KLF4 and L-MYC (Addgene, #27077, #27078, #27080) was nucleofected in human skin.
- Fibroblast cells BJ, American Type Culture Collection, ATCC® CRL-2522TM
- Amaxa Human Dermal Fibroblast Nucleofector Kit Lonza, VPD-1001
- Normal fibroblast medium (DMEM supplemented with 10% FBS, 1 ⁇ GlutaMax and 1 ⁇ penicillin/streptomycin) was changed every day.
- the nucleofected fibroblasts were reseeded onto a monolayer of feeders cells and on day 8 the normal medium was changed to hiPSC medium (DMEM/F12, 20% KO-SR, 1 ⁇ Minimum Non-Essential Amino acid, 1 ⁇ GlutaMax (Invitrogen), 1 ⁇ penicillin/streptomycin, 1000 ⁇ 2-Mercaptoethanol, supplemented with 10 ng/mL fresh basic FGF just before feeding the cells).
- Medium was changed every day the first week and then every 2 days.
- hiPSC colonies appeared ⁇ 20 days after nucleofection. 20 clones were picked and plated on human feeders adding ROCK inhibitor (Y27632) at 10 ⁇ M to the medium. After some passages cells were collected using trypsin (0.05%) and plated on matrigel coated plates. 5 different clones (#6, #8, #13, #16 and #20) were finally cultured and characterized.
- hiPSC clones were plated on feeders and cultured in hiPSC medium.
- hiPSCs plated on matrigel were cultured with the MEF-conditioned hiPSC medium.
- the alkaline-phosphatase-positive cells showed a red color and were visible under phase-contrast microscopy.
- the staining was carried out on cells fixed with 4% PFA for 15 min at room temperature and permeabilized with 0.1% Triton X-100 (Sigma) in PBS for 10 min. Samples were incubated in blocking buffer containing 10% BSA (Sigma) in PBS for 1 h and then where left overnight at 4° C. with primary antibodies in solution with blocking buffer.
- mice monoclonal anti-Human SSEA-4 clone MC-813-70 were diluted 1:50; mouse monoclonal anti-Human TRA1-60 clone TRA1-60R (STEMCELL technologies) diluted 1:50, mouse monoclonal anti-Oct3/4 (Santa Cruz Biotechnologies, sc-5279) diluted 1:100, rabbit polyclonal anti-Sox2 (SIGMA, s9072) diluted 1:200; rabbit polyclonal anti-Nanog (Abcam, ab21624) diluted 1:100.
- a respective secondary antibodies conjugated to Alexa Fluor was used for 40 min at room temperature diluted 1:1000 in blocking buffer. The cells were then counterstained with DAPI (Vector Laboratories).
- EBs Embryoid Bodies
- the cells were harvested by trypsinisation and seeded in 96 well plates with V-bottom (Corning Costar) in hiPSC medium supplemented with 10 ng/ml bFGF and 10 ⁇ M ROCK inhibitor (Y27632). 48 h later the EBs were removed from the V-bottom well plates and transferred to 10 cm2 low attachment dishes in hiPSC medium. After 24 h formed EBs were divided in three parts for in vitro differentiation to meso-endo-ecto-lineages.
- EBs were propagated for 3 more days in suspension with EB medium (KO DMEM, 10% FBS (Hyclone), 1 ⁇ GlutaMax (Invitrogen), 1 ⁇ penicillin/streptomycin) before being plated on gelatine coated plates in EB medium.
- the medium was changed every 2-3 days until 15 days when samples were fixed and processed for immuno-fluorescence staining.
- the medium was supplied with 0.5 mM ascorbic acid.
- rabbit polyclonal anti-Alpha Actin-Smooth Muscle (ThermoScientific, # RB-9010), 1:100 dilution and rabbit polyclonal Anti-FOXA2 antibody (Abcam, ab40874), 1:500 dilution were used.
- the EBs were propagated for 3 additional days in suspension with N2B27 media (50% Neurobasal medium, 50% DMEM/F12 media, 1 ⁇ GlutaMax (Invitrogen), 1 ⁇ penicillin/streptomycin) supplemented with 10 ng/mL bFGF, 20 ng/mL EGF and 1,000 U/mL LIF and then for 4 more days with the addition of 1 ⁇ M RA to the medium. Then EBs were collected, washed and dissociated by incubating with trypsin (0.25) for 10 min at room temperature, pipetting up and down.
- N2B27 media 50% Neurobasal medium, 50% DMEM/F12 media, 1 ⁇ GlutaMax (Invitrogen), 1 ⁇ penicillin/streptomycin
- RNA extracted with the RNeasy Mini Kit (Quiagen), according to manufacturer instructions. Total RNA was treated with DNase (Quiagen) to prevent DNA Contamination. RNA integrity was controlled by bioanalyzer instrument. High Capacity cDNA Reverse Transcription (Invitrogen) was used to prepare cDNA according to TaqMan hPSC Scorecard Panel Workflow. qRT-PCR using the TaqMan hPSC Scorecard Panel was prepared according to manufacturer instruction and run in Viia 7 Real-Time PCR System. Raw Data were analyzed using the web-based hPSC ScorecardTM Analysis Softwarev1.2, available at lifetechnologies.com/scorecardsoftware.
- cells were plated on 8-well Lab-tek 1 coverglass chamber (Nunc) at a seeding density of 20,000-50,000 cells per well, fixed and permeabilized with Methanol-Ethanol (1:1) solution at ⁇ 20° C. for 6 min or fixed with PFA 4% in PBS for 10 min and then permeabilized with 0.1% v/v Triton X-100 (SIGMA) in PBS for 10 min at room temperature.
- Methanol-Ethanol (1:1) was preferred to minimize the handling of the sample.
- Secondary antibodies used were donkey-anti mouse and donkey-anti rabbit. Secondary antibodies were all from Jackson ImmunoResearch.
- the secondary antibodies were labeled in-house with different combinations of pairs of activator/reporter dyes, as previously described (Bates et al., 2007). Briefly, the dyes were purchased as NHS ester derivatives: Alexa Fluor 405 Carboxylic Acid Succinimidyl Ester (Invitrogen), Cy3 mono-Reactive Dye Pack (GE HealthCare), and Alexa Fluor 647.
- hiPSCs grown on feeder layers were co-stained for OCt3/4 (sc-5279) and H2B (ab1790), only the cells positive for the pluripotency marker were then STORM imaged for H2B.
- STORM imaging was carried out with a commercial STORM microscope system from Nikon Instruments (NSTORM). Laser light at 647 nm was used for exciting Alexa Fluor 647 (Invitrogen) and switching it to the dark state, and laser light at 405 nm was used for reactivating the Alexa Fluor 647 (Invitrogen) fluorescence via an activator dye (Alexa Fluor 405)—facilitated manner. An imaging cycle was used in which one frame belonging to the activating light pulse (405 nm) was alternated with three frames belonging to the imaging light pulse (647 nm).
- Dual color imaging was performed with two sets of secondary antibodies labeled with the same reporter dye (Alexa Fluor 647) but two different activator dyes (Alexa Fluor 405 and Cy3) (Bates et al., 2007).
- Alexa Fluor 647 Alexa Fluor 647
- Cy3 Cy3
- the emitted light from Alexa Fluor 647 was collected by an oil immersion 100 ⁇ objective with 1.49 NA, filtered by an emission filter (ET705/72m) and imaged onto an electron multiplying charge coupled device (EMCCD) (Andor Technology) camera at a frame rate of 15 ms per frame.
- EMCD electron multiplying charge coupled device
- Imaging was done using a previously described imaging buffer [Cysteamine MEA (SigmaAldrich, #30070-50G), Glox Solution: 0.5 mgmL- 1 glucose oxidase, 40 mgmL- 1 catalase (all Sigma), 10% Glucose in PBS](Bates et al., 2007).
- STORM images were analyzed and rendered as previously described (Bates et al., 2007; Huang et al., 2008a; Huang et al., 2008b), using custom-written software (Insight3, kindly provided by Bo Huang, University of California, San Francisco). Briefly, peaks in single-molecule images were identified based on a threshold and fit to a simple Gaussian to determine the x and y positions. The final images were rendered by representing each x-y position (localization) as a Gaussian with a width that corresponds to the determined localization precision (9 nm).
- Sample drift during acquisition was calculated and subtracted by reconstructing STORM images from subsets of frames (typically 500-1000 frames, for which drift was assumed to be small) and correlating these images to a reference frame (typically one that is reconstructed at the initial time segment).
- STORM images typically 500-1000 frames, for which drift was assumed to be small
- a reference frame typically one that is reconstructed at the initial time segment.
- each peak was color coded based on whether the emission was recorded immediately after 405 nm or 532 nm activation cycle.
- the peaks coming from a frame not belonging to the one right after an activation frame were coded as “non-specific”.
- a crosstalk algorithm as described previously was applied to correct for non-specific activations by the imaging laser (Dani et al., 2010).
- the number of “apparent specific” activations were calculated from the frame immediately following the activation pulse and the number of “non-specific” activations from subsequent imaging frames in the imaging cycle. Assuming that the probability of “non-specific” activations is constant across all frames, we could then determine the number of “actual specific” activations by subtracting the “non-specific activation” number from the “apparent specific” activation number. We then used these numbers to statistically subtract crosstalk due to “non-specific” activations in an unbiased way as previously described (Dani et al., 2010).
- density maps were obtained by 2-dimensional convolution with a square kernel (5 ⁇ 5 pixels 2 ).
- a constant threshold was used to digitize the density maps into binary images, such that pixels have a value of 1 where the density is larger than the threshold value and a value of 0 elsewhere.
- unlabeled samples were imaged. The images were analyzed as described, and digitized with increasing threshold values. For each threshold value, the ratio of nonzero to zero pixels was calculated.
- the threshold value (0.002 nm ⁇ 2 ) giving a ratio ⁇ 2 ⁇ 10 ⁇ 4 was used for image analysis. Localizations falling on zero-valued pixels of the binary images (low-density areas) were discarded from further analysis. For our threshold setting, the number of discarded localizations typically corresponded to ⁇ 5% of the total number of localization within a nuclear region.
- WLC worm like chain
- nucleosomes have 146 bp DNA wrapped around them and are uniformly spaced by linker DNA fragments of 50 bp (Kornberg and Lorch, 1999).
- OCC DNA 100 ⁇ % - [ p + ( 100 ⁇ % - p ) ⁇ 50 ⁇ ⁇ bp ( 50 + 146 ) ⁇ ⁇ bp ] . Equation ⁇ ⁇ 1
- OCC DNA l ⁇ ⁇ bp ( l + 146 ) ⁇ ⁇ bp . Equation ⁇ ⁇ 2
- Simulations were carried out for several nucleosome removal percentages (from 0 to 95%) and average linker length l average (from 50 bp to 3000 bp). For each parameter value, thousands of simulation were generated and analyzed.
- the localization coordinates were then analyzed in the same way as the regular STORM images and the number of localization per cluster, cluster area and nearest neighbor distance were quantified.
- H2B histone protein H2B in interphase human fibroblast nuclei (hFb).
- An antibody that recognizes native H2B was used.
- STORM images revealed a striking organization of H2B inside the nucleus ( FIG. 1A , left), which was not evident with conventional fluorescence microscopy ( FIG. 7A ).
- H2B appeared clustered in discrete and spatially separated nanodomains ( FIG. 1A , right zooms).
- the H2B nanodomain density (number of nanodomains per unit area) was ⁇ 25% higher in the nuclear periphery, where the heterochromatin is thought to be located, compared to the nuclear interior.
- H2B is a core histone of the nucleosome octamer
- its localization should reflect the arrangement of nucleosomes within the chromatin fiber.
- H3 another core histone protein of the nucleosome octamer, H3, was found to be similarly clustered in discrete nanodomains ( FIG. 7B ).
- hFbs showed varying levels of GFP-H2B expression as could be observed from the intensity of the GFP signal in the nucleus ( FIG. 7F , H, J, L).
- Transfected cells were immunostained with either an anti-H2B antibody or an anti-GFP nanobody, which has a smaller size (nanobodies are 13 kDa as opposed to ⁇ 150 kDa size of the antibodies).
- STORM images of H2B conventional fluorescence images of GFP were recorded in these cells to assess the level of H2B-GFP expression.
- STORM images of low-GFP expressing cells FIG. 7F and J
- TSA Trichostatin A
- the nanodomains appeared dimmer and hence contained less localizations. Furthermore, these dimmer nanodomains were also more dispersed within the nucleus ( FIG. 1A , right zooms).
- the H2B nanodomain density was enhanced by ⁇ 10% in the nuclear periphery of TSA-hFbs compared to the nuclear interior, although it was less dense than the nuclear periphery of untreated hFbs.
- the acetylated H3 levels were increased in TSA-hFbs but also the distribution of acetylated H3 was highly dispersed in the nuclei, mirroring the spatial re-distribution observed for the H2B nanodomains after TSA treatment ( FIG. 7N ).
- FIG. 1B To gain quantitative insight into the H2B nanodomains, the inventors next developed a cluster identification algorithm to group the detected localizations in STORM images into nanodomains ( FIG. 1B ). Briefly, images were converted into a density map and a threshold was set to filter out low-density regions containing isolated localizations that were likely due to background and noise. They applied a stringent threshold setting and only ⁇ 5% of the total number of localizations within a given nuclear area was discarded ( FIG. 10 ). The remaining localizations were converted into a binary image and all the regions that contained localizations in this binary image were retained for further analysis. Within these regions a maximum likelihood algorithm was used to group the localizations together based on their spatial proximity.
- the number of localizations per nanodomain, nanodomain area and the nearest neighbor distances (nnd) between nanodomains were then quantified ( FIG. 1C ).
- the quantitative analysis revealed that the distributions of the number of localizations per nanodomain, nanodomain areas and nanodomain nnds were shifted to lower values in TSA-hFbs compared to hFbs ( FIG. 1C ).
- H2B nanodomains, and hence nucleosomes showed statistically significant spatial re-organization (p ⁇ 10 ⁇ 3 ) after TSA treatment and chromatin decondensation.
- mESC mouse embryonic stem cells
- STORM mouse embryonic stem cells
- mESCs were initially cultured in a medium containing serum and the Leukemia inhibitory factor (sLif) and H2B was labeled by immunofluorescence and imaged with STORM as before.
- STORM images of these mESCs showed two different categories of nuclei.
- the first category, Type 1 displayed nanodomains that appeared bright (i.e. contained a large number of localizations) similar to hFbs ( FIG. 2A , light grey arrowheads).
- Type 2 displayed an increased amount of dimmer nanodomains (i.e.
- Tcf3 acts as a key effector of this pathway by repressing Wnt target genes. Its deletion in mESCs maintains the ground state of pluripotency. H2B nanodomains in the STORM images of mESCs in which Tcf3 was knocked-out (mESCs Tcf3 ⁇ / ⁇ ) resembled those found in na ⁇ ve pluripotent mESCs (Type 2 and 2iLif) ( FIG. 2E ).
- H3 acetylation resembled H2B nanodomain organization.
- these results indicated that the ground state of pluripotency in mESCs was associated with increased acetylation and dimmer H2B nanodomains, which were more dispersed inside the nuclear space.
- the inventors next aimed to further quantify the changes they observed in the number of localizations (and hence brightness) of nanodomains in terms of the number of nucleosomes.
- the epitope labeling efficiency of the H2B antibody should be comparable across the human cells (hFbs, TSA-hFbs) and likewise across the different mESCs analyzed.
- Nanodomains in any given nucleus contained a large distribution of localizations spanning two orders of magnitude ( ⁇ 3 to 300) ( FIGS. 1C and 2I ), indicating that these nanodomains comprised heterogeneous groups with varying numbers of nucleosomes.
- the inventors will refer to these heterogeneous nucleosome groups as “nucleosome clutches” in analogy to “egg clutches” and they will use the term “clutch size” interchangeably with the number of nucleosomes per clutch.
- the median number of localizations per clutch in individual cells correlated strongly with cell type and showed statistically significant differences between hFbs and TSA-hFbs as well as among the different mESCs ( FIG.
- nucleosomes formed larger clutches in differentiated mNPCs and less pluripotent mESCs (mESC cultured in sLif) compared to the more pluripotent mESCs (mESC cultured in 2iLif and mESC Tcf3 ⁇ / ⁇ ) and mESC H1tKO ( FIG. 3B ).
- the inventors generated an in vitro calibration curve.
- single nucleosomes were assembled, spotted on coverglass in vitro, labeled using the same cell immunostaining protocol and STORM images were obtained using identical imaging conditions (Table I).
- STORM images were obtained using identical imaging conditions (Table I).
- the mononucleosome images resembled small clusters of localizations ( FIG. 9A ).
- the distribution of the number of localizations per mononucleosome was quantified as before ( FIG. 9B ).
- polynucleosome arrays were assembled, spotted on glass under high salt conditions to induce compaction, immunostained and imaged.
- the plasmids used had a length and a specific DNA content allowing the assembly of exactly 12- and 24-nucleosomes (Grigoryev et al., 2009). Electron microscopy images of the in vitro assembled polynucleosome arrays showed that these structures had expected sizes for the number of nucleosomes that were in the arrays ( FIG. 9C ). STORM images of the polynucleosome arrays also resembled small clusters ( FIG. 9A ) and the distribution of the number of localizations per polynucleosome array was quantified as before ( FIG. 9B ). The median number of localizations in the mono-, 12- and 24-nucleosome data was used to generate the calibration curve ( FIG. 3C ).
- the calibration curve was first validated by imaging nucleosomes assembled with circular DNA in vitro.
- the plasmid used had a DNA length allowing the assembly of ⁇ 20 nucleosomes.
- the polynucleosomes assembled with this plasmid were immunostained, imaged and the number of localizations per polynucleosome was quantified.
- the median number of localizations obtained was then interpolated from the calibration curve into the median number of nucleosomes and corresponded to 19.5 ⁇ 2.0 nucleosomes, confirming that the calibration curve was indeed accurate ( FIG. 3C ).
- the inventors next proceeded to convert the median number of localizations obtained from the in vivo STORM images ( FIGS. 3A and 3B ) to the median number of nucleosomes per clutch in the different cell types ( FIG. 3D ). It is possible that antibody epitope binding efficiency might be different between in vivo and in vitro conditions. In particular, due to nuclear crowding, antibody epitope binding efficiency might be lower in vivo than it is in vitro, which would lead to an underestimation of the number of nucleosomes per clutch. Nevertheless, this underestimation will not impact our conclusions regarding the relative relationship among the different cell types.
- the median number of localizations in hFbs corresponded to a median number of ⁇ 8 nucleosomes per clutch whereas this number decreased to ⁇ 2 nucleosomes after TSA treatment ( FIG. 3D , left).
- the mESCs cultured in sLif medium contained a median number of ⁇ 5 nucleosomes per clutch ( FIG. 3D , right). These cells comprised a rather heterogeneous population consisting of cells with a median of ⁇ 5 nucleosomes and cells with a median of ⁇ 5 nucleosomes per clutch. The cells that contained ⁇ 5 nucleosomes per clutch were the same population as the Type 1 mESCs.
- the median number of nucleosomes per clutch increased to ⁇ 6 in mNPCs ( FIG. 3D , right).
- the mESCs cultured in 2iLif and mESC Tcf3 ⁇ / ⁇ contained a median number of ⁇ 3 and ⁇ 3.5 nucleosomes per clutch, respectively ( FIG. 3D , right).
- a median number of only ⁇ 2 nucleosomes per clutch were found in mESCs H1tKO ( FIG. 3D , right).
- the median nucleosome density was calculated by dividing the median number of nucleosomes per clutch with the median area of the clutches. Indeed, the nucleosomes in hFbs were more densely compacted inside the clutches compared to TSA-hFbs ( FIG. 3E ). Nucleosome density was likewise higher for mNPCs and mESCs cultured in sLif with respect to mESCs cultured in 2iLif medium, mESCs Tcf3 ⁇ / ⁇ and mESCs H1tKO ( FIG. 3F ). These results show that nucleosomes are less densely compacted in pluripotent cells and nucleosome compaction increases upon differentiation.
- the inventors next aimed to study whether the identification of the number of nucleosomes per clutch could be predictive of the pluripotency grade in hiPSC clones.
- hiPSC clones were generated from hFbs and were characterized using standard methods such as alkaline phosphatase (AP) staining, analysis of expression of stem cell genes, formation of embryoid bodies and in vivo teratoma in immune-compromised mice. Based on the results of this characterization, hiPSC clone 13 was the most pluripotent since it was AP positive, expressed high levels of the stem cell markers TRA1-60, SSEA4, Oct4, Sox2 and Nanog, formed embryoid bodies, which differentiated in the three germ layers, and generated large and fully differentiated teratomas in mice ( FIG. 10A-D ).
- AP alkaline phosphatase
- the hiPSC clone 8 was the least pluripotent since, although it showed expression of stem cell markers, the OCt4 expression level of single cells was fourteen-fold lower compared to hiPSC clone 13, it did not form the ectoderm layer from the embryoid bodies and it generated very small undifferentiated teratomas in vivo ( FIG. 10A-D ).
- the median number of localizations was quantified after STORM imaging of all the hiPSC clones ( FIG. 4A ), which showed statistically significant differences among the different clones and a gradual increase of the median number of localizations passing from the more pluripotent hiPSCs clone, #13, to the less pluripotent one, #8.
- the calibration curve was used to deduce the median number and density of nucleosomes inside clutches in each hiPSC clone ( FIGS. 4B and 4C ). There was a remarkable agreement between the pluripotency score obtained from the gene card and the clutch size ( FIG.
- nucleosomes in large and small clutches with higher and lower compaction could potentially facilitate the binding of transcription factors, polymerases and other proteins to the DNA, which should be more accessible in regions containing a smaller number of nucleosomes.
- the compaction of the nucleosomes within the clutches should be aided by the presence of linker histone protein H1, which is known to be involved in nucleosome compaction as well as to be enriched in heterochromatin (Fan et al., 2005; Shen et al.,
- RNA Polymerase II RNA Polymerase II
- multi-color super-resolution imaging of H2B with histone H1 and of H2B with PolII was carried out.
- H1 an antibody that recognizes all of its isoforms was used.
- PolII an antibody against phosphoserine 5 of the carboxiterminal domain of PolII (PolII11) was used to image both PolII at the initiation complex and the elongating PolII.
- the inventors first recorded multi-color STORM images of H2B and H1 in hFbs and TSA-hFbs ( FIGS. 5A and 5B ), which significantly differ in the median number of nucleosomes per clutch ( FIG. 3D ).
- H1 was more enriched at the nuclear periphery of hFbs where heterochromatin is more abundant (Meister and Taddei, 2013) ( FIG. 5A ).
- the DNA Fiber is not Fully Occupied with Nucleosomes
- nucleosome-depleted regions likely exist in the chromatin fiber.
- nucleosomes were placed along the DNA fiber at regular intervals with 146 bp of DNA wrapped around each nucleosome and with 50 bp of linker-DNA separating them, which is the average linker-DNA length measured in previous studies, ( FIG. 6A ). They define this configuration as full occupancy of DNA, which in reality corresponds to ⁇ 75% of DNA occupied with nucleosomes after accounting for the 50 bp linker DNA.
- Final nucleosome positions were generated according to a Gaussian chain model ( FIG. 6B ).
- Inter-nucleosome distances were calculated by converting the linker-DNA length (50 bp) into an end-to-end distance according to the worm-like-chain theory for a polymer with 150 bp persistence length, which is the experimentally determined persistence length of double stranded DNA.
- the resulting DNA fiber configuration was then projected onto two-dimensional space ( FIG. 6C ).
- nucleosome occupancy level was calculated according to Equation 1 shown before.
- Synthetic STORM images of the nucleosomes along the DNA fiber at different levels of nucleosome occupancy ( FIG. 6F ) or labeling efficiency ( FIG. 12A ) were generated by assigning to each nucleosome a given number of localizations. The number of localizations was extracted from the experimental distribution of the in vitro mononucleosome (for NR and LL models) or secondary antibody data (for labeling efficiency simulations) ( FIG. 9B ).
- the synthetic STORM images at different nucleosome occupancy levels ( FIG. 6F ) showed striking resemblance to the experimental images with nucleosomes grouped in clutches generating high and low density regions.
- the number of localizations, area and nearest neighbor distances of the nucleosome clutches in these synthetic STORM images were determined using identical analysis parameters as before, including threshold.
- the median number of localizations, the median nearest neighbor distances and the median area obtained from the NR model (filled squares and solid line) and the LL model (open circles and dashed line) were plotted as a function of nucleosome occupancy level ( FIG. 6G ). These data are the results of at least thousand simulations for each parameter value. Also shown are the corresponding median values obtained from the experimental data for hFbs (dark grey line) and TSA-hFbs (light grey line).
- both the NR and LL models intersected the experimental values at around similar level of occupancy for both cell types (57% hFbs and 43% TSA-hFbs) ( FIG. 6G , middle).
- the NR model intersected the experimental value for TSA-hFbs at similar level of occupancy (45%) whereas the LL model intersected the experimental value at a much lower occupancy level (34%) ( FIG. 6G , bottom).
- the inventors explored how the chromatin state of somatic human fibroblasts changes when using the cell-fusion method for reprogramming.
- Cell fusion can generate synkaryons or heterokaryons. Synkaryons proliferate, after the nuclei of the original cells fuse in a tetraploid genome, whereas heterokaryons do not proliferate and contain the original nuclei distinct sharing the same cytoplasm. Furthermore if the two fusing cell types are from different species, their gene products can be distinguished. H. M. Blau and A.
- the inventors analyzed the clutches reorganization occurring in a somatic nucleus after cell fusion with Embryonic Stem Cells.
- mES cells were fused with hFb cells and stained with surface markers. Fused cells were then FACS sorted. Sorted cells were fixed at different time points after fusion, The histones were imaged and the nucleosome clutches quantified as previously described.
Landscapes
- Health & Medical Sciences (AREA)
- Life Sciences & Earth Sciences (AREA)
- Engineering & Computer Science (AREA)
- Chemical & Material Sciences (AREA)
- Immunology (AREA)
- General Health & Medical Sciences (AREA)
- Physics & Mathematics (AREA)
- Molecular Biology (AREA)
- General Physics & Mathematics (AREA)
- Biochemistry (AREA)
- Biomedical Technology (AREA)
- Urology & Nephrology (AREA)
- Hematology (AREA)
- Pathology (AREA)
- Analytical Chemistry (AREA)
- Medicinal Chemistry (AREA)
- Nuclear Medicine, Radiotherapy & Molecular Imaging (AREA)
- Cell Biology (AREA)
- Food Science & Technology (AREA)
- Microbiology (AREA)
- Biotechnology (AREA)
- Proteomics, Peptides & Aminoacids (AREA)
- Organic Chemistry (AREA)
- Optics & Photonics (AREA)
- Theoretical Computer Science (AREA)
- Computer Vision & Pattern Recognition (AREA)
- Zoology (AREA)
- Tropical Medicine & Parasitology (AREA)
- Virology (AREA)
- Quality & Reliability (AREA)
- Radiology & Medical Imaging (AREA)
- Medical Informatics (AREA)
- Chemical Kinetics & Catalysis (AREA)
- Genetics & Genomics (AREA)
- Biophysics (AREA)
- Measuring Or Testing Involving Enzymes Or Micro-Organisms (AREA)
Abstract
Description
-
- a) contacting a sample containing cells with a first antibody capable of specifically binding to a histone protein,
- b) contacting the antibody:histone complex formed in step a) with a secondary antibody having at least one photoswitchable fluorophore adapted to be optically excited at a certain wavelength and to emit light at a wavelength λ2 different from λ1,
- c) recording a super resolution image of nucleosome organization by means of a sensor being sensitive at least to the wavelength of emission of the photoswitchable fluorophore by exciting the sample with an optical radiation having a wavelength λ1,
- d) correlating the image obtained in step c) with size of nucleosomal clutches, nucleosomal density and/or number of nucleosomes per nucleosomal clutches, and
- e) comparing data obtained in step d) with a corresponding reference value to obtain a score based on size of nucleosomal clutches, nucleosomal density and/or number of nucleosomes per nucleosomal clutch,
-
- a) detecting the chromatin state of a cell by a method according to the invention, and
- b) isolating a cell having smaller clutches, less densely compacted nucleosomes or less nucleosomes per clutches.
-
- a) detecting the chromatin state of a cell by a method according to the invention, and
- b) isolating a cell having bigger clutches, more densely compacted nucleosomes or more nucleosomes per clutches
-
- a source of optical radiation adapted to emit light at a wavelength λ1 over an interrogation area adapted to receive a biological sample,
- an optical sensor sensible to a second wavelength λ2 adapted to measure the optical radiation at λ2,
- a control unit connected to the optical sensor and to the source of optical radiation wherein said control unit is adapted to carry out the method of the invention.
-
- a) contacting a sample containing cells with a first antibody capable of specifically binding to a histone protein,
- b) contacting the antibody:histone complex formed in step a) with a secondary antibody having at least one photoswitchable fluorophore adapted to be optically excited at a certain wavelength and to emit light at a wavelength λ2 different from λ1,
- c) recording a super resolution image of nucleosome organization by means of a sensor being sensitive at least to the wavelength of emission of the photoswitchable fluorophore by exciting the sample with an optical radiation having a wavelength λ1,
- d) correlating the image obtained in step c) with size of nucleosomal clutches, nucleosomal density and/or number of nucleosomes per nucleosomal clutches, and
- e) comparing data obtained in step d) with a corresponding reference value to obtain a score based on size of nucleosomal clutches, nucleosomal density and/or number of nucleosomes per nucleosomal clutch,
-
- Carcinoma: Cancers derived from epithelial cells. This group includes many of the most common cancers, particularly in the aged, and include nearly all those developing in the breast, prostate, lung, pancreas, and colon.
- Sarcoma: Cancers arising from connective tissue (i.e. bone, cartilage, fat, nerve), each of which develop from cells originating in mesenchymal cells outside the bone marrow.
- Lymphoma and leukaemia: These two classes of cancer arise from hematopoietic (blood-forming) cells that leave the marrow and tend to mature in the lymph nodes and blood, respectively.
- Germ cell tumour: Cancers derived from pluripotent cells, most often presenting in the testicle or the ovary (seminoma and dysgerminoma, respectively).
- Blastoma: Cancers derived from immature “precursor” cells or embryonic tissue. Blastomas are more common in children than in older adults.
-
- a binary image representing the same area than the density image comprising zero value pixels if the corresponding value represented by the density image in the same location is lower than a predefined threshold; and, nonzero if said value is higher, is provided,
- identifying connected regions of pixels representing values higher than the predefined threshold,
- for each connected region, providing a list of clutch positions by grouping the localization coordinates within said connected region according to a distance-based criterion being the position of the clutch the centroid position of the localization coordinates associated with said clutch.
-
- a) detecting the chromatin state of a cell by a method according to the invention, and
- b) isolating a cell having smaller clutches, less densely compacted nucleosomes or less nucleosomes per clutches.
-
- a) detecting the chromatin state of the cell by a method according to the method of the invention, and
- b) isolating a cell having bigger clutches, more densely compacted nucleosomes or more nucleosomes per clutches.
-
- a source of optical radiation adapted to emit light at a wavelength over an interrogation area adapted to receive a biological sample,
- an optical sensor sensible to a second wavelength λ2 adapted to measure the optical radiation at λ2,
- a control unit connected to the optical sensor and to the source of optical radiation wherein said control unit is adapted to carry out the method according to the invention.
| TABLE I |
| 405 nm laser power scheme used to activate fluorophores |
| during STORM imaging |
| 405 nm Laser Power (μW) | Frame Number | ||
| 0.5 | 800 | ||
| 3 | 7200 | ||
| 7 | 8000 | ||
| 22 | 10000 | ||
| 45 | 15200 | ||
| 78 | 20000 | ||
| 127 | 24000 | ||
| 200 | 28000 | ||
| 290 | 32000 | ||
| 500 | 36000 | ||
| 1000 | 40000 | ||
| 1630 | 42800 | ||
| 2000 | 44800 | ||
- Bates, M., Huang, B., Dempsey, G. T., and Zhuang, X. (2007). Multicolor super-resolution imaging with photo-switchable fluorescent probes. Science 317, 1749-1753.
- Bibel, M., Richter, J., Lacroix, E., and Barde, Y. A. (2007). Generation of a defined and uniform population of CNS progenitors and neurons from mouse embryonic stem cells.
Nature protocols 2, 1034-1043. - Bock, C., Kiskinis, E., Verstappen, G., Gu, H., Boulting, G., Smith, Z. D., Ziller, M., Croft, G. F., Amoroso, M. W., Oakley, D. H., et al. (2011). Reference Maps of human ES and iPS cell variation enable high-throughput characterization of pluripotent cell lines. Cell 144, 439-452.
- Dani, A., Huang, B., Bergan, J., Dulac, C., and Zhuang, X. (2010). Superresolution imaging of chemical synapses in the brain. Neuron 68, 843-856.
- Fan, Y., Nikitina, T., Zhao, J., Fleury, T. J., Bhattacharyya, R., Bouhassira, E. E., Stein, A., Woodcock, C. L., and Skoultchi, A. I. (2005). Histone H1 depletion in mammals alters global chromatin structure but causes specific changes in gene regulation. Cell 123, 1199-1212.
- Fussner, E., Ching, R. W., and Bazett-Jones, D. P. (2011a). Living without 30 nm chromatin fibers. Trends in biochemical sciences 36, 1-6.
- Fussner, E., Djuric, U., Strauss, M., Hotta, A., Perez-Iratxeta, C., Lanner, F., Dilworth, F. J., Ellis, J., and Bazett-Jones, D. P. (2011b). Constitutive heterochromatin reorganization during somatic cell reprogramming. The
EMBO journal 30, 1778-1789. - Grigoryev, S. A., Arya, G., Correll, S., Woodcock, C. L., and Schlick, T. (2009). Evidence for heteromorphic chromatin fibers from analysis of nucleosome interactions. Proceedings of the National Academy of Sciences of the United States of America 106, 13317-13322.
- Huang, B., Jones, S. A., Brandenburg, B., and Zhuang, X. (2008a). Whole-cell 3D STORM reveals interactions between cellular structures with nanometer-scale resolution.
Nature methods 5, 1047-1052. - Huang, B., Wang, W., Bates, M., and Zhuang, X. (2008b). Three-dimensional super-resolution imaging by stochastic optical reconstruction microscopy. Science 319, 810-813.
- Kornberg, R. D., and Lorch, Y. (1999). Twenty-five years of the nucleosome, fundamental particle of the eukaryote chromosome. Cell 98, 285-294.
- Kuhl, S. J., and Kuhl, M. (2013). On the role of Wnt/beta-catenin signaling in stem cells. Biochimica et biophysica acta 1830, 2297-2306.
- Marks, H., Kalkan, T., Menafra, R., Denissov, S., Jones, K., Hofemeister, H., Nichols, J., Kranz, A., Stewart, A. F., Smith, A., et al. (2012). The transcriptional and epigenomic foundations of ground state pluripotency. Cell 149, 590-604.
- Meshorer, E., Yellajoshula, D., George, E., Scambler, P. J., Brown, D. T., and Misteli, T. (2006). Hyperdynamic plasticity of chromatin proteins in pluripotent embryonic stem cells.
Developmental cell 10, 105-116. - Nieuwenhuizen, R. P., Lidke, K. A., Bates, M., Puig, D. L., Grunwald, D., Stallinga, S., and Rieger, B. (2013). Measuring image resolution in optical nanoscopy.
Nature methods 10, 557-562. - Ying, Q. L., Wray, J., Nichols, J., Batlle-Morera, L., Doble, B., Woodgett, J., Cohen, P., and Smith, A. (2008). The ground state of embryonic stem cell self-renewal. Nature 453, 519-523.
- Pereira C Fl, Terranova R, Ryan N K, Santos J, Morris K J, Cui W, Merkenschlager M, Fisher A G (2008) Heterokary on-based reprogramming of human B lymphocytes for pluripotency requires Oct4 but not Sox2. PLoS Genet. September 5; 4(9):e1000170.
- Rust, M. J., Bates, M., and Zhuang, X. (2006). Sub-diffraction-limit imaging by stochastic optical reconstruction microscopy (STORM).
Nature methods 3, 793-795. - Struhl, K., and Segal, E. (2013). Determinants of nucleosome positioning. Nature structural &
molecular biology 20, 267-273. - Toth, K. F., Knoch, T. A., Wachsmuth, M., Frank-Stohr, M., Stohr, M., Bacher, C. P., Muller, G., and Rippe, K. (2004). Trichostatin A-induced histone acetylation causes decondensation of interphase chromatin. Journal of cell science 117, 4277-4287.
- Woodcock, C. L., and Ghosh, R. P. (2010). Chromatin higher-order structure and dynamics. Cold Spring Harbor perspectives in
biology 2, a000596. - Yi, F., Pereira, L., and Merrill, B. J. (2008). Tcf3 functions as a steady-state limiter of transcriptional programs of mouse embryonic stem cell self-renewal.
Stem cells 26, 1951-1960.
Claims (15)
Priority Applications (1)
| Application Number | Priority Date | Filing Date | Title |
|---|---|---|---|
| US15/510,082 US10564167B2 (en) | 2014-09-10 | 2015-09-10 | Method for detecting cells |
Applications Claiming Priority (3)
| Application Number | Priority Date | Filing Date | Title |
|---|---|---|---|
| US14/482,586 US20160069903A1 (en) | 2014-09-10 | 2014-09-10 | Method for detecting cells |
| PCT/EP2015/070734 WO2016038145A1 (en) | 2014-09-10 | 2015-09-10 | Method for detecting cells |
| US15/510,082 US10564167B2 (en) | 2014-09-10 | 2015-09-10 | Method for detecting cells |
Related Parent Applications (2)
| Application Number | Title | Priority Date | Filing Date |
|---|---|---|---|
| US14/482,586 Continuation-In-Part US20160069903A1 (en) | 2014-09-10 | 2014-09-10 | Method for detecting cells |
| US14/482,586 Continuation US20160069903A1 (en) | 2014-09-10 | 2014-09-10 | Method for detecting cells |
Publications (2)
| Publication Number | Publication Date |
|---|---|
| US20170299610A1 US20170299610A1 (en) | 2017-10-19 |
| US10564167B2 true US10564167B2 (en) | 2020-02-18 |
Family
ID=54072856
Family Applications (2)
| Application Number | Title | Priority Date | Filing Date |
|---|---|---|---|
| US14/482,586 Abandoned US20160069903A1 (en) | 2014-09-10 | 2014-09-10 | Method for detecting cells |
| US15/510,082 Active 2035-02-06 US10564167B2 (en) | 2014-09-10 | 2015-09-10 | Method for detecting cells |
Family Applications Before (1)
| Application Number | Title | Priority Date | Filing Date |
|---|---|---|---|
| US14/482,586 Abandoned US20160069903A1 (en) | 2014-09-10 | 2014-09-10 | Method for detecting cells |
Country Status (2)
| Country | Link |
|---|---|
| US (2) | US20160069903A1 (en) |
| WO (1) | WO2016038145A1 (en) |
Families Citing this family (15)
| Publication number | Priority date | Publication date | Assignee | Title |
|---|---|---|---|---|
| US10638734B2 (en) | 2004-01-05 | 2020-05-05 | Abt Holding Company | Multipotent adult stem cells, sources thereof, methods of obtaining and maintaining same, methods of differentiation thereof, methods of use thereof and cells derived thereof |
| US11000546B2 (en) | 2005-11-09 | 2021-05-11 | Athersys, Inc. | Immunomodulatory properties of MAPCs and uses thereof |
| SG183497A1 (en) * | 2010-02-25 | 2012-09-27 | Abt Holding Co | Modulation of macrophage activation |
| EP2568991B3 (en) | 2010-05-12 | 2018-11-28 | ABT Holding Company | Modulation of splenocytes in cell therapy |
| AU2014250761B2 (en) | 2013-04-12 | 2019-02-28 | Robert J. Deans | Improving organs for transplantation |
| AU2014266935B2 (en) * | 2013-04-30 | 2020-06-11 | Katholieke Universiteit Leuven | Cell therapy for myelodysplastic syndromes |
| JP6595156B2 (en) * | 2014-03-04 | 2019-10-23 | 富士フイルム株式会社 | Cell image acquisition apparatus and method, and program |
| NZ745530A (en) | 2016-01-21 | 2023-03-31 | Abt Holding Co | Stem cells for wound healing |
| CN108198176A (en) * | 2017-12-29 | 2018-06-22 | 贵州省烟草公司毕节市公司 | A kind of method of discrimination based on image analysis tobacco maturity |
| CN108416821B (en) * | 2018-03-08 | 2019-08-02 | 山东财经大学 | A kind of CT Image Super-resolution Reconstruction method of deep neural network |
| JP7387720B2 (en) * | 2018-05-03 | 2023-11-28 | アコヤ・バイオサイエンシズ・インコーポレイテッド | Multispectral sample imaging |
| DE102018215831B4 (en) * | 2018-09-18 | 2020-04-02 | Fraunhofer-Gesellschaft zur Förderung der angewandten Forschung e.V. | Optical arrangement for fluorescence microscopic applications |
| CN113782095B (en) * | 2020-06-10 | 2023-11-28 | 香港城市大学深圳研究院 | Method for detecting cell state in real time at high flux |
| CN113076909B (en) * | 2021-04-16 | 2022-10-25 | 重庆大学附属肿瘤医院 | Automatic cell detection method |
| WO2023148359A1 (en) * | 2022-02-04 | 2023-08-10 | Julius-Maximilians-Universität Wurzburg | Sub-10 nanometer fluorescence imaging |
Citations (9)
| Publication number | Priority date | Publication date | Assignee | Title |
|---|---|---|---|---|
| WO2002018418A1 (en) | 2000-08-25 | 2002-03-07 | University Of Virginia Patent Foundation | Antibodies specific for methylated lysines in histones |
| WO2003014142A2 (en) | 2001-08-03 | 2003-02-20 | University Of Virginia Patent Foundation | Phosphorylated histone h2b as an apoptosis marker |
| WO2008091296A2 (en) | 2006-08-07 | 2008-07-31 | President And Fellows Of Harvard College | Sub-diffraction limit image resolution and other imaging techniques |
| WO2008101249A1 (en) | 2007-02-16 | 2008-08-21 | Donndelinger Thomas M | Methods for sorting dimorphic daughter cells |
| WO2009085218A1 (en) | 2007-12-21 | 2009-07-09 | President And Fellows Of Harvard College | Sub-diffraction limit image resolution in three dimensions |
| US20100002929A1 (en) | 2004-05-13 | 2010-01-07 | The Charles Stark Draper Laboratory, Inc. | Image-based methods for measuring global nuclear patterns as epigenetic markers of cell differentiation |
| WO2013090360A2 (en) | 2011-12-15 | 2013-06-20 | President And Fellows Of Harvard College | High resolution dual-objective microscopy |
| WO2014072960A2 (en) | 2012-11-12 | 2014-05-15 | National Centre For Biological Sciences | A method to identify and isolate pluripotent stem cells using endogenous blue fluorescence |
| US20140333750A1 (en) | 2011-12-15 | 2014-11-13 | President And Fellows Of Harvard College | High resolution dual-objective microscopy |
-
2014
- 2014-09-10 US US14/482,586 patent/US20160069903A1/en not_active Abandoned
-
2015
- 2015-09-10 WO PCT/EP2015/070734 patent/WO2016038145A1/en active Application Filing
- 2015-09-10 US US15/510,082 patent/US10564167B2/en active Active
Patent Citations (15)
| Publication number | Priority date | Publication date | Assignee | Title |
|---|---|---|---|---|
| WO2002018418A1 (en) | 2000-08-25 | 2002-03-07 | University Of Virginia Patent Foundation | Antibodies specific for methylated lysines in histones |
| WO2003014142A2 (en) | 2001-08-03 | 2003-02-20 | University Of Virginia Patent Foundation | Phosphorylated histone h2b as an apoptosis marker |
| US20040197838A1 (en) * | 2001-08-03 | 2004-10-07 | Allis C David | Phosphorylated histone h2b as apoptosis marker |
| US20100002929A1 (en) | 2004-05-13 | 2010-01-07 | The Charles Stark Draper Laboratory, Inc. | Image-based methods for measuring global nuclear patterns as epigenetic markers of cell differentiation |
| WO2008091296A2 (en) | 2006-08-07 | 2008-07-31 | President And Fellows Of Harvard College | Sub-diffraction limit image resolution and other imaging techniques |
| US7776613B2 (en) | 2006-08-07 | 2010-08-17 | President And Fellows Of Harvard College | Sub-diffraction image resolution and other imaging techniques |
| EP2378343A2 (en) | 2006-08-07 | 2011-10-19 | President and Fellows of Harvard College | Sub-diffraction limit image resolution and other imaging techniques |
| WO2008101249A1 (en) | 2007-02-16 | 2008-08-21 | Donndelinger Thomas M | Methods for sorting dimorphic daughter cells |
| US8084257B2 (en) | 2007-02-16 | 2011-12-27 | Donndelinger Thomas M | Methods for sorting dimorphic daughter cells |
| WO2009085218A1 (en) | 2007-12-21 | 2009-07-09 | President And Fellows Of Harvard College | Sub-diffraction limit image resolution in three dimensions |
| US9137516B2 (en) | 2007-12-21 | 2015-09-15 | President And Fellows Of Harvard College | Sub-diffraction limit image resolution in three dimensions |
| WO2013090360A2 (en) | 2011-12-15 | 2013-06-20 | President And Fellows Of Harvard College | High resolution dual-objective microscopy |
| US20140333750A1 (en) | 2011-12-15 | 2014-11-13 | President And Fellows Of Harvard College | High resolution dual-objective microscopy |
| WO2014072960A2 (en) | 2012-11-12 | 2014-05-15 | National Centre For Biological Sciences | A method to identify and isolate pluripotent stem cells using endogenous blue fluorescence |
| US20160305885A1 (en) | 2012-11-12 | 2016-10-20 | National Centre For Biological Sciences | Method to identify and isolate pluripotent stem cells using endogenous blue fluorescence |
Non-Patent Citations (37)
| Title |
|---|
| Abstract of the Seminar: Advance Fuorescence Imaging and Biophysics Group. ICFO-Institut de Ciènces Fotòniqes. Nov. 4, 2013 Departament de Fisica Fonomental. |
| Abstract of the Seminar: Advance Fuorescence Imaging and Biophysics Group. ICFO—Institut de Ciènces Fotòniqes. Nov. 4, 2013 Departament de Fisica Fonomental. |
| Altschul, S., et al.; BLASTManual, NCBI NLM NIH Bethesda, MD. 20894, J. Mol. Biol. vol. 215: pp. 403-410 (1990). |
| Bates et al. Super-resolution imaging by nanoscale localization of photoswitchable fluorescent probes. Curr Opin Chem Biol. 15 (5): 505-514 (Oct. 2008). * |
| Bates, M., et al.; "Multicolor super-resolution imaging with photo-switchable fluorescent probes," Science, 2007, vol. 317, pp. 1749-1753. |
| Bates, M., et al.; "Super-resolution imaging by nanoscale localization of photo-switchable fluorescent probes," Current Opinion in Chemical Biology, 2008, vol. 12, pp. 505-514. |
| Bibel, M., et al.; "Generation of a defined and uniform population of CNS progenitors and neurons from mouse embryonic stem cells," Nature protocols, 2007, vol. 2, pp. 1034-1043. |
| Bock, C., et al.; "Reference Maps of human ES and iPS cell variation enable high-throughput characterization of pluripotent cell lines," Cell, 2011, vol. 144, pp. 439-452. |
| Dani, A., et al.; "Superresolution imaging of chemical synapses in the brain," Neuron, 2010, vol. 68, pp. 843-856. |
| Durisic, et al.; "Quantitative super-resolution microscopy: pitfalls and strategies for image analysis," Current Opinion in Chemical Biology, 2014, vol. 20: pp. 22-28. |
| Fan, Y., et al.; "Histone H1 depletion in mammals alters global chromatin structure but causes specific changes in gene regulation," Cell, 2005, vol. 123, pp. 1199-1212. |
| Fussner, E., et al.; "Constitutive heterochromatin reorganization during somatic cell reprogramming," The EMBO journal, 2011, vol. 30, pp. 1778-1789. |
| Fussner, E., et al.; "Living without 30nm chromatin fibers," Trends in biochemical sciences, 2011, vol. 36, pp. 1-6. |
| Grigoryev, S.A., et al.; "Evidence for heteromorphic chromatin fibers from analysis of nucleosome interactions," Proceedings of the National Academy of Sciences of the United States of America, 2009, vol. 106, pp. 13317-13322. |
| Hu, Ying, S., et al.; "Light-sheet Bayesian microscopy enables deep-cell super-resolution imaging of heterochromatin in live human embryonic stem cells," Optical Nanoscopy, 2013, vol. 7. |
| Huang, B., et al.; "Three-dimensional super-resolution imaging by stochastic optical reconstruction microscopy," Science, 2008, vol. 319, pp. 810-813. |
| Huang, B., et al.; "Whole-cell 3D Storm reveals interactions between cellular structures with nanometer-scale resolution," Nature methods, 2008, vol. 5, pp. 1047-1052. |
| International Search Report, dated Nov. 4, 2015. |
| Kamiyama, D, et al.; "Development in the Storm," Developmental Cell, 2012, vol. 23, pp. 1103-1110. |
| Kornberg, R.D., et al.; "Twenty-five years of the nucleosome, fundamental particle of the eukaryote chromosome," Cell, 1999, vol. 98, pp. 285-294. |
| Kühl, S.J., et al.; "On the role of Wnt/beta-catenin signaling in stem cells," Biochimica et biophysica acta, 2013, vol. 1830, pp. 2297-2306. |
| Marks, H., et al.; "The transcriptional and epigenomic foundations of ground state pluripotency," Cell, 2012, vol. 149, pp. 590-604. |
| Meister, Peter, et al.; "Building silent compartments at the nuclear periphery: a recurrent theme," Genetics & Development, 2013, vol. 23, pp. 96-103. |
| Meshorer, et al.; Hyperdynamic plasticity of chromatin proteins in pluripotent embryonic stem cells. Developmental cell, 2006, vol. 10, pp. 105-116. |
| Nela et al. Quantitative super-resolutionn microscopy: pitfalls and strategies of image analysis. Current Opinion in Chemical Biology. 20: 22-28 (Jun. 1, 2004). * |
| Nieuwenhuizen, R.P., et al.; Measuring image resolution in optical nanoscopy, Nature methods, 2013, vol. 10, pp. 557-562. |
| Pereira, Carlos F., et al.; "Heterokaryon-Based Reprogramming of Juman B Lymphocytes for Pluripotency Requires Oct4 but Not Sox2," PLOS Genetics, 2008, vol. 4, Issue 9, e1000170. |
| Ricci, et al.; "Chromatin Fibers Are Formed by Heterogeneous Groups of Nucleosomes In Vivo," Cell, 2015, vol. 160, pp. 1145-1158. |
| Rust, M.J., et al.; "Sub-diffraction-limit imaging by stochastic optical reconstruction microscopy (STORM)," Nature methods, 2006, vol. 3, pp. 793-795. |
| Struhl, K., et al.; "Determinants of nucleosome positioning," Nature structural & molecular biology, 2013, vol. 20, pp. 267-273. |
| Toth, K.F., et al.; "Trichostatin A-induced histone acetylation causes decondensation of interphase chromatin," Journal of cell science, 2004, vol. 117, pp. 4277-4287. |
| Wang et al. Super-resolution microscopy reveals decondensed chromatin structure at transcription sites. Scientific Reports 4 (4477) : 1-8 (Mar. 2014). * |
| Wang, Y, et al.; "Super-resolution microscopy reveals decondensed chromatin structure at transcription sites," Scientific Reports, 2014, vol. 4, 4477, DOI: 10.1038/srep04477. |
| Woodcock, C.L, et al.; "Chromatin higher-order structure and dynamics," Cold Spring Harbor perspectives in biology, 2010, vol. 2, a000596. |
| Workman, Jerry L., et al.; "Nucleosome Core Displacement in Vitro via a Metastable Transcription Factor-Nucleosome Complex," Science, 1992, vol. 258, pp. 1780-1784. |
| Yi, F., et al.; "Tcf3 functions as a steady-state limiter of transcriptional programs of mouse embryonic stem cell self-renewal," Stem cells, 2008. vol. 26, pp. 1951-1960. |
| Ying, Q.L., et al.; "The ground state of embryonic stem cell self-renewal," Nature, 2008, vol. 453, pp. 519-523. |
Also Published As
| Publication number | Publication date |
|---|---|
| US20170299610A1 (en) | 2017-10-19 |
| WO2016038145A1 (en) | 2016-03-17 |
| US20160069903A1 (en) | 2016-03-10 |
Similar Documents
| Publication | Publication Date | Title |
|---|---|---|
| US10564167B2 (en) | Method for detecting cells | |
| Ricci et al. | Chromatin fibers are formed by heterogeneous groups of nucleosomes in vivo | |
| Andersen et al. | Precardiac organoids form two heart fields via Bmp/Wnt signaling | |
| Amadei et al. | Inducible stem-cell-derived embryos capture mouse morphogenetic events in vitro | |
| Shah et al. | Pathogenic LMNA variants disrupt cardiac lamina-chromatin interactions and de-repress alternative fate genes | |
| Nieto et al. | EMT: 2016 | |
| Kempf et al. | Bulk cell density and Wnt/TGFbeta signalling regulate mesendodermal patterning of human pluripotent stem cells | |
| Noseda et al. | PDGFRα demarcates the cardiogenic clonogenic Sca1+ stem/progenitor cell in adult murine myocardium | |
| Alexanian et al. | A transcribed enhancer dictates mesendoderm specification in pluripotency | |
| Paige et al. | A temporal chromatin signature in human embryonic stem cells identifies regulators of cardiac development | |
| Liu et al. | Recapitulation of premature ageing with iPSCs from Hutchinson–Gilford progeria syndrome | |
| Kreitzer et al. | A robust method to derive functional neural crest cells from human pluripotent stem cells | |
| Dolezalova et al. | MicroRNAs regulate p21Waf1/Cip1 protein expression and the DNA damage response in human embryonic stem cells | |
| Yan et al. | Genome-wide R-loop landscapes during cell differentiation and reprogramming | |
| Kubo et al. | Identification of mesenchymal stem cell (MSC)‐transcription factors by microarray and knockdown analyses, and signature molecule‐marked MSC in bone marrow by immunohistochemistry | |
| Melzer et al. | MSC stimulate ovarian tumor growth during intercellular communication but reduce tumorigenicity after fusion with ovarian cancer cells | |
| Yap et al. | In vivo generation of post-infarct human cardiac muscle by laminin-promoted cardiovascular progenitors | |
| Zhao et al. | Small molecule-directed specification of sclerotome-like chondroprogenitors and induction of a somitic chondrogenesis program from embryonic stem cells | |
| Yamada et al. | Induction and expansion of human PRRX1+ limb-bud-like mesenchymal cells from pluripotent stem cells | |
| Ma et al. | Differential histone distribution patterns in induced asymmetrically dividing mouse embryonic stem cells | |
| JP6893633B2 (en) | Extraction method of differentiated cells | |
| Singh et al. | Isolation and characterization of calcium sensing receptor null cells: a highly malignant and drug resistant phenotype of colon cancer | |
| Choudhary et al. | A FOXM1 dependent mesenchymal-epithelial transition in retinal pigment epithelium cells | |
| Hislop et al. | Modelling post-implantation human development to yolk sac blood emergence | |
| Ho et al. | Robust generation of human-chambered cardiac organoids from pluripotent stem cells for improved modelling of cardiovascular diseases |
Legal Events
| Date | Code | Title | Description |
|---|---|---|---|
| AS | Assignment |
Owner name: INSTITUCIO CATALANA DE RECERCA I ESTUDIS AVANCATS, SPAIN Free format text: ASSIGNMENT OF ASSIGNORS INTEREST;ASSIGNOR:COSMA, MARIA PIA;REEL/FRAME:044691/0077 Effective date: 20170424 Owner name: INSTITUCIO CATALANA DE RECERCA I ESTUDIS AVANCATS, Free format text: ASSIGNMENT OF ASSIGNORS INTEREST;ASSIGNOR:COSMA, MARIA PIA;REEL/FRAME:044691/0077 Effective date: 20170424 Owner name: FUNDACIO CENTRE DE REGULACIO GENOMICA, SPAIN Free format text: ASSIGNMENT OF ASSIGNORS INTEREST;ASSIGNOR:COSMA, MARIA PIA;REEL/FRAME:044691/0077 Effective date: 20170424 Owner name: FUNDACIO CENTRE DE REGULACIO GENOMICA, SPAIN Free format text: ASSIGNMENT OF ASSIGNORS INTEREST;ASSIGNOR:RICCI, MARIA AURELIA;REEL/FRAME:044691/0117 Effective date: 20170424 Owner name: FUNDACIO INSTITUT DE CIENCIES FOTONIQUES, SPAIN Free format text: ASSIGNMENT OF ASSIGNORS INTEREST;ASSIGNORS:LAKADAMYALI, MELIKE;MANZO, CARLO;REEL/FRAME:045111/0870 Effective date: 20170331 |
|
| STPP | Information on status: patent application and granting procedure in general |
Free format text: RESPONSE TO NON-FINAL OFFICE ACTION ENTERED AND FORWARDED TO EXAMINER |
|
| STPP | Information on status: patent application and granting procedure in general |
Free format text: NON FINAL ACTION MAILED |
|
| STPP | Information on status: patent application and granting procedure in general |
Free format text: RESPONSE TO NON-FINAL OFFICE ACTION ENTERED AND FORWARDED TO EXAMINER |
|
| STPP | Information on status: patent application and granting procedure in general |
Free format text: NOTICE OF ALLOWANCE MAILED -- APPLICATION RECEIVED IN OFFICE OF PUBLICATIONS |
|
| STPP | Information on status: patent application and granting procedure in general |
Free format text: PUBLICATIONS -- ISSUE FEE PAYMENT RECEIVED |
|
| STCF | Information on status: patent grant |
Free format text: PATENTED CASE |
|
| CC | Certificate of correction | ||
| MAFP | Maintenance fee payment |
Free format text: PAYMENT OF MAINTENANCE FEE, 4TH YR, SMALL ENTITY (ORIGINAL EVENT CODE: M2551); ENTITY STATUS OF PATENT OWNER: SMALL ENTITY Year of fee payment: 4 |