US10401458B2 - Systems and methods for multi-echo, background suppressed magnetic resonance angiography - Google Patents
Systems and methods for multi-echo, background suppressed magnetic resonance angiography Download PDFInfo
- Publication number
- US10401458B2 US10401458B2 US15/708,824 US201715708824A US10401458B2 US 10401458 B2 US10401458 B2 US 10401458B2 US 201715708824 A US201715708824 A US 201715708824A US 10401458 B2 US10401458 B2 US 10401458B2
- Authority
- US
- United States
- Prior art keywords
- image
- echo
- mask image
- image data
- mask
- Prior art date
- Legal status (The legal status is an assumption and is not a legal conclusion. Google has not performed a legal analysis and makes no representation as to the accuracy of the status listed.)
- Active, expires
Links
Images


Classifications
-
- G—PHYSICS
- G01—MEASURING; TESTING
- G01R—MEASURING ELECTRIC VARIABLES; MEASURING MAGNETIC VARIABLES
- G01R33/00—Arrangements or instruments for measuring magnetic variables
- G01R33/20—Arrangements or instruments for measuring magnetic variables involving magnetic resonance
- G01R33/44—Arrangements or instruments for measuring magnetic variables involving magnetic resonance using nuclear magnetic resonance [NMR]
- G01R33/48—NMR imaging systems
- G01R33/54—Signal processing systems, e.g. using pulse sequences ; Generation or control of pulse sequences; Operator console
- G01R33/56—Image enhancement or correction, e.g. subtraction or averaging techniques, e.g. improvement of signal-to-noise ratio and resolution
- G01R33/563—Image enhancement or correction, e.g. subtraction or averaging techniques, e.g. improvement of signal-to-noise ratio and resolution of moving material, e.g. flow contrast angiography
- G01R33/5635—Angiography, e.g. contrast-enhanced angiography [CE-MRA] or time-of-flight angiography [TOF-MRA]
-
- G—PHYSICS
- G01—MEASURING; TESTING
- G01R—MEASURING ELECTRIC VARIABLES; MEASURING MAGNETIC VARIABLES
- G01R33/00—Arrangements or instruments for measuring magnetic variables
- G01R33/20—Arrangements or instruments for measuring magnetic variables involving magnetic resonance
- G01R33/44—Arrangements or instruments for measuring magnetic variables involving magnetic resonance using nuclear magnetic resonance [NMR]
- G01R33/48—NMR imaging systems
- G01R33/4818—MR characterised by data acquisition along a specific k-space trajectory or by the temporal order of k-space coverage, e.g. centric or segmented coverage of k-space
- G01R33/4824—MR characterised by data acquisition along a specific k-space trajectory or by the temporal order of k-space coverage, e.g. centric or segmented coverage of k-space using a non-Cartesian trajectory
-
- G—PHYSICS
- G01—MEASURING; TESTING
- G01R—MEASURING ELECTRIC VARIABLES; MEASURING MAGNETIC VARIABLES
- G01R33/00—Arrangements or instruments for measuring magnetic variables
- G01R33/20—Arrangements or instruments for measuring magnetic variables involving magnetic resonance
- G01R33/44—Arrangements or instruments for measuring magnetic variables involving magnetic resonance using nuclear magnetic resonance [NMR]
- G01R33/48—NMR imaging systems
- G01R33/483—NMR imaging systems with selection of signals or spectra from particular regions of the volume, e.g. in vivo spectroscopy
- G01R33/4838—NMR imaging systems with selection of signals or spectra from particular regions of the volume, e.g. in vivo spectroscopy using spatially selective suppression or saturation of MR signals
-
- G—PHYSICS
- G01—MEASURING; TESTING
- G01R—MEASURING ELECTRIC VARIABLES; MEASURING MAGNETIC VARIABLES
- G01R33/00—Arrangements or instruments for measuring magnetic variables
- G01R33/20—Arrangements or instruments for measuring magnetic variables involving magnetic resonance
- G01R33/44—Arrangements or instruments for measuring magnetic variables involving magnetic resonance using nuclear magnetic resonance [NMR]
- G01R33/48—NMR imaging systems
- G01R33/54—Signal processing systems, e.g. using pulse sequences ; Generation or control of pulse sequences; Operator console
- G01R33/56—Image enhancement or correction, e.g. subtraction or averaging techniques, e.g. improvement of signal-to-noise ratio and resolution
- G01R33/5608—Data processing and visualization specially adapted for MR, e.g. for feature analysis and pattern recognition on the basis of measured MR data, segmentation of measured MR data, edge contour detection on the basis of measured MR data, for enhancing measured MR data in terms of signal-to-noise ratio by means of noise filtering or apodization, for enhancing measured MR data in terms of resolution by means for deblurring, windowing, zero filling, or generation of gray-scaled images, colour-coded images or images displaying vectors instead of pixels
Definitions
- the field of the disclosure is systems and methods for magnetic resonance imaging (“MRI”). More particularly, the disclosure relates to systems and methods for multi-echo background-suppressed magnetic resonance angiography (MRA).
- MRI magnetic resonance imaging
- MRA multi-echo background-suppressed magnetic resonance angiography
- Peripheral vascular disease has an age-adjusted prevalence of 12% in the United States, causes significant morbidity, and is often associated with excess cardiovascular mortality.
- Contrast-enhanced (CE) magnetic resonance angiography (MRA) often substitutes for the more invasive “gold standard” procedure of digital subtraction angiography. Given the frequency of renal functional impairment in patients with PVD and concerns about nephrogenic systemic fibrosis, there is growing interest in non-contrast-enhanced MRA.
- QISS MRA Quiescent-interval slice-selective
- the MRI system acquires data using a modified single shot two-dimensional balanced steady-state free precession (bSSFP) pulse sequence.
- bSSFP steady-state free precession
- the imaging parameters for QISS MRA require minimal if any tailoring for individual patients.
- the bSSFP readout used for QISS is more sensitive to susceptibility effects.
- the image quality may be degraded by susceptibility artifacts due to the use of a bSSFP readout.
- a high bandwidth and short TE may reduce artifacts at the expense of worsening small vessel conspicuity on projection images.
- the present disclosure overcomes the aforementioned drawbacks by providing a method for producing an image of a subject using a magnetic resonance imaging (“MRI”) system, in which data is acquired from a subject by directing the MRI system to perform a pulse sequence that forms echoes at least at two different echo times.
- the MRI system acquires first echo image data at a first echo time and second echo image data at a second echo time.
- a first image is reconstructed from the first echo image data and a second image is reconstructed from the second echo image data.
- a mask image is generated using the first and second image.
- a first scale factor (SF 1 ) is computed by calculating a first ratio of a selected tissue signal in the first image and the mask image, and a first scaled mask image is generated by multiplying the mask image by SF 1 .
- a second scale factor (SF 2 ) is computed by calculating a second ratio of the selected tissue signal in the second image and the mask image, and a second scaled mask image is generated by multiplying the mask image by SF 2 .
- a first processed image is generated by subtracting the first scaled mask image from the first image, and a second processed image is generated by subtracting the second scaled mask image from the second image.
- a projection angiogram is then generated from the processed images.
- FIG. 1 is a graphic illustration of an example pulse sequence that can be used by a magnetic resonance imaging (“MRI”) system to acquire multi-echo data in accordance with the present disclosure.
- MRI magnetic resonance imaging
- FIG. 2 is an example flow chart setting forth the steps of a method in accordance with the present disclosure.
- FIG. 3A shows an unprocessed MRA image without fat saturation using a dual-echo QISS FLASH sequence.
- FIG. 3B shows a mask image using the absolute difference of the first echo and the second echo.
- FIG. 3C shows a processed MRA image without fat saturation using a dual-echo QISS FLASH sequence.
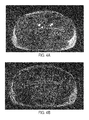
- FIG. 4A shows an unprocessed MRA image without fat saturation using a dual-echo QISS FLASH sequence.
- FIG. 4B shows a mask image using the absolute difference of the first echo and the second echo.
- FIG. 4C shows a processed MRA image without fat saturation using a dual-echo QISS FLASH sequence.
- FIG. 5A shows an unprocessed phantom image with susceptibility artifact from metal using a one-shot QISS trueFISP sequence.
- FIG. 5B shows a phantom image using a dual-echo QISS FLASH sequence with TE at 1.7 ms.
- FIG. 5C shows a phantom image using a dual-echo QISS FLASH sequence with TE at 3.9 ms.
- FIG. 5D shows a mask image using the absolute difference of the two images in FIGS. 5B and 5C .
- FIG. 6 is a block diagram of an example of an MRI system that can implement the methods described in the present disclosure.
- First and second echo image data are acquired using a multi-echo pulse sequence having a first and second echo time, from which first and second images are reconstructed.
- a mask image is generated by subtracting the first and second image.
- a first scale factor is calculated as a ratio of fat signal in the first image and the mask image, and a first scaled mask image is generated by multiplying the mask image by the first scale factor.
- a second scale factor is calculated as a ratio of fat signal in the second image and the mask image, and a second scaled mask image is generated by multiplying the mask image by the second scale factor.
- a first processed image is generated by subtracting the first scaled mask image from the first image, and a second processed image is generated by subtracting the second scaled mask image from the second image.
- a projection angiogram is then generated from the processed images.
- FIG. 1 is a graphic illustration of one example of a pulse sequence that can be implemented to acquire multi-echo data in accordance with the present disclosure.
- the pulse sequence includes an RF pulse 102 that is generated while the MRI system applies the slice selection gradient 104 .
- the pulse sequence also includes a readout gradient 106 and a phase encoding gradient 108 .
- two gradient echoes 110 and 112 with different echo time TE 1 and TE 2 , respectively, are formed and sampled.
- Other gradients or RF pulses may be applied by the MRI system if needed or desired.
- a multiband RF pulse can be used to simultaneously excite spins in more than one slice. Simultaneous multislice acquisitions and reconstruction techniques can then be used to reconstruct images from multiple different slice locations from data that were simultaneously acquired.
- the MRI system implements a dual-echo, dual-bandwidth QISS FLASH sequence that allows for enhanced background suppression.
- Image sets for both echoes can be reconstructed and a mask image can be created by taking the absolute difference of the two image sets.
- the mask image can be scaled so that fat signal matched that in the first echo image, and then subtracted from the first echo image. The same process may be used for the second echo image, also with mask scaling.
- the MRI system may then create maximum intensity projection (“MIP”) images from the difference images.
- MIP maximum intensity projection
- FIG. 2 is an example flow chart setting forth the steps of a method in accordance with the present disclosure.
- the MRI system acquires first echo image data at a first echo time and second echo image data at a second echo time within the same repetition time period while controlling the RF system and the plurality of gradient coils to apply a gradient-echo pulse sequence that forms echoes at least at the first and second echo times.
- the MRI system may acquire the first and second echo image data using different readout bandwidths.
- Accelerated imaging techniques can also be used to accelerate data acquisition.
- parallel imaging techniques may also be implemented to accelerate in-plane k-space sample. For instance, undersampling can be used together with a parallel imaging reconstruction technique, such as SENSE or GRAPPA.
- the first echo image data are acquired with a higher readout bandwidth than the readout bandwidth used to acquire the second echo image data.
- the first echo image data are acquired at a short echo time (TE).
- the MRI system may acquire the first echo image data using a high readout bandwidth greater than 400 Hz/pixel and a short TE less than 2 milliseconds.
- the short TE used for the first echo minimizes susceptibility artifacts and maximizes the signal from adipose and muscle tissues, but the high bandwidth provides a smaller signal-to-noise ratio (“SNR”) than the lower bandwidth, second echo readout.
- SNR signal-to-noise ratio
- the second echo image data are more sensitive to susceptibility artifacts and there is less signal from fat and muscle. Further, to minimize loss of signal from flowing blood between the first and second echoes, gating to a diastolic phase of the cardiac cycle or flow compensation may be applied.
- a mask image can be generated by subtracting images reconstructed from the first and second echo image data (i.e., a first image and a second image, respectively). For instance, a mask image representing the absolute signal difference of the first and second echo images can be calculated.
- the mask image shows substantial signal from fat, muscle, ghost artifacts, and susceptibility artifacts, while containing negligible signal from flowing blood. Because susceptibility artifacts have a differing spatial extent and intensity for each echo, the mask image may show a bright halo around each metal implant and facilitate their identification and localization.
- the mask image can be generated based on a standard deviation calculated from the first and second images. In such examples, it may be beneficial to acquire additional data from different echoes at different echo times, such that additional images are reconstructed and used to compute the standard deviation.
- a first scale factor (“SF 1 ”) is computed by calculating a first ratio of fat signal in the first echo image and the mask image, and a first scaled mask image is generated by multiplying the mask image by SF 1 .
- SF 1 is calculated as the ratio of the fat signal in the first echo image and the mask image. Multiplication of the mask image by SF 1 results in a first scaled mask image.
- a second scale factor (“SF 2 ”) is computed by calculating a second ratio of fat signal in the second echo image and the mask image, and a second scaled mask image is generated by multiplying the mask image by SF 2 .
- SF 2 is calculated as the ratio of the fat signal in the second echo image and the mask image. Multiplication of the mask image by SF 2 results in a second scaled mask image.
- a first processed image is generated by subtracting the first scaled mask image from the first echo image.
- a second processed image is generated by subtracting the second scaled mask image from the second echo image. Accordingly, the first echo image is processed by subtracting the first scaled mask image, while the second echo image is processed by subtracting the second scaled mask image.
- signal from flowing blood is only slightly diminished, whereas signals from adipose and muscle tissues are markedly reduced. Moreover, the conspicuity of motion-related ghost artifacts is greatly reduced as well.
- a projection angiogram is generated from each of the first and second processed images.
- the processed first and second echo images may be separately reconstructed into projective angiograms using a maximum intensity projection (“MIP”) algorithm.
- MIP maximum intensity projection
- Additional maps or images can also be generated based on the first echo image data and the second echo image data.
- relaxation parameter maps such as T2* maps
- susceptibility maps can be generated. Together with the projection angiograms generated using the methods described in the present disclosure, these additional maps can provide additional diagnostic information to a clinician.
- time-of-flight MR angiograms require a high flip angle RF excitation in order to suppress the fat signal.
- An unfortunate consequence of a larger flip angle is saturation of slow flow and horizontal vessel segments, which can falsely cause arteries to appear narrow or occluded.
- the need for background suppression is decoupled from the choice of flip angle. Consequently, signal from adipose tissue can be suppressed even when using a reduced flip angle, thereby resulting in fewer flow-related artifacts and providing better fidelity to the vascular anatomy.
- a low readout bandwidth is often used in order to improve SNR.
- the use of a low readout bandwidth and correspondingly long TE increases the sensitivity to susceptibility artifacts from air-containing structures such as the paranasal sinuses, bowel loops as well as metal implants.
- Susceptibility artifacts can be substantially overcome by acquiring the angiographic data using a short TE and high readout bandwidth.
- a drawback of using this approach is that fat appears bright and will obscure small vessels in the projection image. Subtraction of a scaled mask image as described in the present disclosure effectively suppresses fat signal and thereby maximizes the conspicuity of the blood vessels in the projection angiograms.
- the ability to readily identify metal implants (such as a surgical clip or vascular occluder) in the mask image is helpful in determining whether signal voids in the MRA are caused by susceptibility artifact related to an implant versus vascular stenosis or occlusion.
- FIG. 3A shows an unprocessed MRA image without fat saturation using a dual-echo QISS FLASH sequence.
- small vessel detail was obscured in the unprocessed first echo images due to the high signal intensity of adipose tissue and fat-containing bone marrow.
- FIG. 3B shows a mask image using the absolute difference of the first echo and the second echo.
- the absolute difference mask image shows high fat signal and moderate muscle signal, with negligible signal from blood vessels.
- regions of altered magnetic susceptibility manifested in the mask image as distinctive bright regions.
- FIG. 3C shows a processed MRA image without fat saturation using a dual-echo QISS FLASH sequence. After processing, the background signal was greatly reduced (particularly with the first echo), resulting in improved small vessel detail in the projected difference images.
- FIG. 4A shows an unprocessed MRA image without fat saturation using a dual-echo QISS FLASH sequence.
- the first echo has a TE of 1.7 ms.
- the second echo may have a TE of 3.9 ms.
- FIG. 4B shows a mask image using the absolute difference of the first echo and the second echo.
- the absolute difference mask image shows high fat signal and moderate muscle signal, with negligible signal from blood vessels.
- FIG. 4C shows a processed MRA image without fat saturation using a dual-echo QISS FLASH sequence.
- the processed image may be obtained by subtracting a constant C 1 times the mask image.
- the constant C 1 may be selected based on previously collected data. For instance, the constant C 1 may be selected between 2.0 and 5.0.
- FIG. 5A shows an unprocessed phantom image with susceptibility artifact from metal using a one-shot QISS trueFISP sequence.
- the metal artifact is very obvious.
- the echo time TE is at 1.6 ms with bandwidth of 930 Hz/px.
- FIG. 5B shows a phantom image using a dual-echo QISS FLASH sequence with TE at 1.7 ms.
- the bandwidth is 930 Hz/px and the imaging data were collected using 4 shots.
- FIG. SC shows a phantom image using a dual-echo QISS FLASH sequence with TE at 3.9 ms. The bandwidth is 395 Hz/px and the imaging data were collected using 4 shots.
- FIG. 5D shows a mask image using the absolute difference of the two images in FIGS. 5B and 5C .
- the bright region clearly identifies the susceptibility artifact from metal.
- an MRI system implements a dual-echo, dual-bandwidth QISS FLASH pulse sequence, which allows for enhanced background suppression by processing each echo with an absolute difference mask image.
- the dual-echo QISS MRA overcomes limitations of the standard QISS sequence by allowing the acquisition of a background-suppressed short-TE, high bandwidth first echo image that is insensitive to susceptibility artifacts, simultaneously with a low-bandwidth, second echo image that provides competitive image quality to standard QISS.
- the choice of TE is less restrictive when using the methods described in the present disclosure, and there are no fat-water phase swaps.
- the mask image may have additional value for highlighting ferromagnetic clips or other metallic implants that might be inconspicuous in the QISS MRA.
- the technique may be reserved for areas where there is concern for potential susceptibility artifacts using a bSSFP readout.
- the MRI system 600 includes an operator workstation 602 that may include a display 604 , one or more input devices 606 (e.g., a keyboard, a mouse), and a processor 608 .
- the processor 608 may include a commercially available programmable machine running a commercially available operating system.
- the operator workstation 602 provides an operator interface that facilitates entering scan parameters into the MRI system 600 .
- the operator workstation 602 may be coupled to different servers, including, for example, a pulse sequence server 610 , a data acquisition server 612 , a data processing server 614 , and a data store server 616 .
- the operator workstation 602 and the servers 610 , 612 , 614 , and 616 may be connected via a communication system 640 , which may include wired or wireless network connections.
- the pulse sequence server 610 functions in response to instructions provided by the operator workstation 602 to operate a gradient system 618 and a radiofrequency (“RF”) system 620 .
- Gradient waveforms for performing a prescribed scan are produced and applied to the gradient system 618 , which then excites gradient coils in an assembly 622 to produce the magnetic field gradients G x , G y , and G z that are used for spatially encoding magnetic resonance signals.
- the gradient coil assembly 622 forms part of a magnet assembly 624 that includes a polarizing magnet 626 and a whole-body RF coil 628 .
- RF waveforms are applied by the RF system 620 to the RF coil 628 , or a separate local coil to perform the prescribed magnetic resonance pulse sequence.
- Responsive magnetic resonance signals detected by the RF coil 628 , or a separate local coil are received by the RF system 620 .
- the responsive magnetic resonance signals may be amplified, demodulated, filtered, and digitized under direction of commands produced by the pulse sequence server 610 .
- the RF system 620 includes an RF transmitter for producing a wide variety of RF pulses used in MRI pulse sequences.
- the RF transmitter is responsive to the prescribed scan and direction from the pulse sequence server 610 to produce RF pulses of the desired frequency, phase, and pulse amplitude waveform.
- the generated RF pulses may be applied to the whole-body RF coil 628 or to one or more local coils or coil arrays.
- the RF system 620 also includes one or more RF receiver channels.
- phase of the received magnetic resonance signal may also be determined according to the following relationship:
- the pulse sequence server 610 may receive patient data from a physiological acquisition controller 630 .
- the physiological acquisition controller 630 may receive signals from a number of different sensors connected to the patient, including electrocardiograph (“ECG”) signals from electrodes, or respiratory signals from a respiratory bellows or other respiratory monitoring devices. These signals may be used by the pulse sequence server 610 to synchronize, or “gate,” the performance of the scan with the subject's heart beat or respiration.
- ECG electrocardiograph
- the pulse sequence server 610 may also connect to a scan room interface circuit 632 that receives signals from various sensors associated with the condition of the patient and the magnet system. Through the scan room interface circuit 632 , a patient positioning system 634 can receive commands to move the patient to desired positions during the scan.
- the digitized magnetic resonance signal samples produced by the RF system 620 are received by the data acquisition server 612 .
- the data acquisition server 612 operates in response to instructions downloaded from the operator workstation 602 to receive the real-time magnetic resonance data and provide buffer storage, so that data is not lost by data overrun. In some scans, the data acquisition server 612 passes the acquired magnetic resonance data to the data processor server 614 . In scans that require information derived from acquired magnetic resonance data to control the further performance of the scan, the data acquisition server 612 may be programmed to produce such information and convey it to the pulse sequence server 610 . For example, during pre-scans, magnetic resonance data may be acquired and used to calibrate the pulse sequence performed by the pulse sequence server 610 .
- navigator signals may be acquired and used to adjust the operating parameters of the RF system 620 or the gradient system 618 , or to control the view order in which k-space is sampled.
- the data acquisition server 612 may also process magnetic resonance signals used to detect the arrival of a contrast agent in a magnetic resonance angiography (“MRA”) scan.
- MRA magnetic resonance angiography
- the data acquisition server 612 may acquire magnetic resonance data and processes it in real-time to produce information that is used to control the scan.
- the data processing server 614 receives magnetic resonance data from the data acquisition server 612 and processes the magnetic resonance data in accordance with instructions provided by the operator workstation 602 .
- processing may include, for example, reconstructing two-dimensional or three-dimensional images by performing a Fourier transformation of raw k-space data, performing other image reconstruction algorithms (e.g., iterative or backprojection reconstruction algorithms), applying filters to raw k-space data or to reconstructed images, generating functional magnetic resonance images, or calculating motion or flow images.
- Images reconstructed by the data processing server 614 are conveyed back to the operator workstation 602 for storage.
- Real-time images may be stored in a data base memory cache, from which they may be output to operator display 602 or a display 636 .
- Batch mode images or selected real time images may be stored in a host database on disc storage 638 .
- the data processing server 614 may notify the data store server 616 on the operator workstation 602 .
- the operator workstation 602 may be used by an operator to archive the images, produce films, or send the images via a network to other facilities.
- the MRI system 600 may also include one or more networked workstations 642 .
- a networked workstation 642 may include a display 644 , one or more input devices 646 (e.g., a keyboard, a mouse), and a processor 648 .
- the networked workstation 642 may be located within the same facility as the operator workstation 602 , or in a different facility, such as a different healthcare institution or clinic.
- the networked workstation 642 may gain remote access to the data processing server 614 or data store server 616 via the communication system 640 . Accordingly, multiple networked workstations 642 may have access to the data processing server 614 and the data store server 616 . In this manner, magnetic resonance data, reconstructed images, or other data may be exchanged between the data processing server 614 or the data store server 616 and the networked workstations 642 , such that the data or images may be remotely processed by a networked workstation 642 .
Landscapes
- Health & Medical Sciences (AREA)
- Nuclear Medicine, Radiotherapy & Molecular Imaging (AREA)
- Physics & Mathematics (AREA)
- Vascular Medicine (AREA)
- General Health & Medical Sciences (AREA)
- Radiology & Medical Imaging (AREA)
- Engineering & Computer Science (AREA)
- Signal Processing (AREA)
- High Energy & Nuclear Physics (AREA)
- Condensed Matter Physics & Semiconductors (AREA)
- General Physics & Mathematics (AREA)
- Magnetic Resonance Imaging Apparatus (AREA)
Abstract
Description
M=√{square root over (I2 +Q 2)} (1);
Claims (19)
Priority Applications (1)
| Application Number | Priority Date | Filing Date | Title |
|---|---|---|---|
| US15/708,824 US10401458B2 (en) | 2016-09-19 | 2017-09-19 | Systems and methods for multi-echo, background suppressed magnetic resonance angiography |
Applications Claiming Priority (2)
| Application Number | Priority Date | Filing Date | Title |
|---|---|---|---|
| US201662396623P | 2016-09-19 | 2016-09-19 | |
| US15/708,824 US10401458B2 (en) | 2016-09-19 | 2017-09-19 | Systems and methods for multi-echo, background suppressed magnetic resonance angiography |
Publications (2)
| Publication Number | Publication Date |
|---|---|
| US20180081017A1 US20180081017A1 (en) | 2018-03-22 |
| US10401458B2 true US10401458B2 (en) | 2019-09-03 |
Family
ID=61620228
Family Applications (1)
| Application Number | Title | Priority Date | Filing Date |
|---|---|---|---|
| US15/708,824 Active 2038-02-22 US10401458B2 (en) | 2016-09-19 | 2017-09-19 | Systems and methods for multi-echo, background suppressed magnetic resonance angiography |
Country Status (1)
| Country | Link |
|---|---|
| US (1) | US10401458B2 (en) |
Families Citing this family (2)
| Publication number | Priority date | Publication date | Assignee | Title |
|---|---|---|---|---|
| US20210223341A1 (en) * | 2018-06-01 | 2021-07-22 | The Trustees Of The University Of Pennsylvania | Solid-state mri as a noninvasive alternative to computed tomography (ct) |
| EP3584595B1 (en) * | 2018-06-19 | 2021-10-20 | Siemens Healthcare GmbH | Method of mr-angiography using curved imaging slices |
Citations (6)
| Publication number | Priority date | Publication date | Assignee | Title |
|---|---|---|---|---|
| US20100245360A1 (en) * | 2009-03-31 | 2010-09-30 | Ting Song | System and method for center point trajectory mapping |
| US20100277172A1 (en) * | 2007-12-25 | 2010-11-04 | Masahiro Takizawa | Magnetic resonance imaging apparatus and susceptibility-emphasized imaging method |
| US20110166436A1 (en) * | 2010-01-04 | 2011-07-07 | Edelman Robert R | System and Method For Non-Contrast MR Angiography Using Steady-State Image Acquisition |
| US20150137811A1 (en) * | 2012-05-31 | 2015-05-21 | Medical College Of Wisconsin | System and method for magnetic resonance imaging using highly accelerated projection imaging |
| US20150371372A1 (en) * | 2013-02-08 | 2015-12-24 | Sunnybrook Health Sciences Centre | System and method for medical image quality enhancement using multiscale total variation flow |
| US20160327623A1 (en) * | 2014-01-30 | 2016-11-10 | Hitachi, Ltd. | Magnetic resonance imaging apparatus and fat suppression water image calculation method |
-
2017
- 2017-09-19 US US15/708,824 patent/US10401458B2/en active Active
Patent Citations (6)
| Publication number | Priority date | Publication date | Assignee | Title |
|---|---|---|---|---|
| US20100277172A1 (en) * | 2007-12-25 | 2010-11-04 | Masahiro Takizawa | Magnetic resonance imaging apparatus and susceptibility-emphasized imaging method |
| US20100245360A1 (en) * | 2009-03-31 | 2010-09-30 | Ting Song | System and method for center point trajectory mapping |
| US20110166436A1 (en) * | 2010-01-04 | 2011-07-07 | Edelman Robert R | System and Method For Non-Contrast MR Angiography Using Steady-State Image Acquisition |
| US20150137811A1 (en) * | 2012-05-31 | 2015-05-21 | Medical College Of Wisconsin | System and method for magnetic resonance imaging using highly accelerated projection imaging |
| US20150371372A1 (en) * | 2013-02-08 | 2015-12-24 | Sunnybrook Health Sciences Centre | System and method for medical image quality enhancement using multiscale total variation flow |
| US20160327623A1 (en) * | 2014-01-30 | 2016-11-10 | Hitachi, Ltd. | Magnetic resonance imaging apparatus and fat suppression water image calculation method |
Also Published As
| Publication number | Publication date |
|---|---|
| US20180081017A1 (en) | 2018-03-22 |
Similar Documents
| Publication | Publication Date | Title |
|---|---|---|
| US9002430B2 (en) | System and method for combined time-resolved magnetic resonance angiography and perfusion imaging | |
| US9395431B2 (en) | Multi-contrast delayed enhancement cardiac magnetic resonance imaging | |
| US20090143666A1 (en) | System And Method For Non-Contrast Agent MR Angiography | |
| US9113810B2 (en) | System and method for ungated non-contrast enhanced magnetic resonance angiography | |
| US8441257B2 (en) | Time resolved spin labeled MRI cineangiography | |
| US9507003B2 (en) | System and method for imaging of vascular structures using non-contrast enhanced magnetic resonance imaging | |
| JP2002533144A (en) | Detection and guided reconstruction of contrast in contrast-enhanced magnetic resonance angiography | |
| US9241654B2 (en) | System and method for selective magnetic resonance imaging angiography of arteries or veins | |
| US5827187A (en) | Dynamic MR digital subtraction angiography with complex subtraction | |
| JP2003528663A (en) | Magnetic resonance imaging method and system using microcoil | |
| US8154287B2 (en) | System and method for ghost magnetic resonance imaging | |
| US8918159B2 (en) | System and method for improved accelerated magnetic resonance imaging using ROI masking | |
| EP4057022A1 (en) | System and method for magnetization-prepared three-dimensional unbalanced steady-state free precession magnetic resonance imaging | |
| US20110166436A1 (en) | System and Method For Non-Contrast MR Angiography Using Steady-State Image Acquisition | |
| US8509874B2 (en) | Method for non-contrast enhanced pulmonary vein magnetic resonance imaging | |
| US9968276B2 (en) | System and method for imaging of the vascular components with temporal information and suppressed blood pools using magnetic resonance imaging | |
| US10401458B2 (en) | Systems and methods for multi-echo, background suppressed magnetic resonance angiography | |
| US10362961B2 (en) | System and method for neutral contrast magnetic resonance imaging of calcifications | |
| US20110194746A1 (en) | Method for Time-of-Arrival Mapping in Magnetic Resonance Imaging | |
| US8838204B2 (en) | System and method for phase contrast imaging with improved efficiency | |
| US9594143B2 (en) | System and method for controlling calibration and delay phases of parallel, contrast-enhanced magnetic resonance imaging | |
| US10401459B2 (en) | Systems and methods for imaging vascular calcifications with magnetic resonance imaging | |
| US10670680B2 (en) | System and method for motion insensitive magnetic resonance fingerprinting | |
| US11846655B2 (en) | System and method for three-dimensional (3D) unbalanced steady-state free precession magnetic resonance imaging | |
| US20230139038A1 (en) | System and method for t1 relaxation enhanced steady-state mri |
Legal Events
| Date | Code | Title | Description |
|---|---|---|---|
| FEPP | Fee payment procedure |
Free format text: ENTITY STATUS SET TO UNDISCOUNTED (ORIGINAL EVENT CODE: BIG.); ENTITY STATUS OF PATENT OWNER: LARGE ENTITY |
|
| AS | Assignment |
Owner name: NORTHSHORE UNIVERSITY HEALTH SYSTEM, ILLINOIS Free format text: ASSIGNMENT OF ASSIGNORS INTEREST;ASSIGNOR:EDELMAN, ROBERT R.;REEL/FRAME:043636/0471 Effective date: 20170621 |
|
| FEPP | Fee payment procedure |
Free format text: ENTITY STATUS SET TO SMALL (ORIGINAL EVENT CODE: SMAL); ENTITY STATUS OF PATENT OWNER: LARGE ENTITY |
|
| STPP | Information on status: patent application and granting procedure in general |
Free format text: DOCKETED NEW CASE - READY FOR EXAMINATION |
|
| STPP | Information on status: patent application and granting procedure in general |
Free format text: NOTICE OF ALLOWANCE MAILED -- APPLICATION RECEIVED IN OFFICE OF PUBLICATIONS |
|
| FEPP | Fee payment procedure |
Free format text: ENTITY STATUS SET TO UNDISCOUNTED (ORIGINAL EVENT CODE: BIG.); ENTITY STATUS OF PATENT OWNER: LARGE ENTITY |
|
| STPP | Information on status: patent application and granting procedure in general |
Free format text: PUBLICATIONS -- ISSUE FEE PAYMENT VERIFIED |
|
| STCF | Information on status: patent grant |
Free format text: PATENTED CASE |
|
| CC | Certificate of correction | ||
| MAFP | Maintenance fee payment |
Free format text: PAYMENT OF MAINTENANCE FEE, 4TH YEAR, LARGE ENTITY (ORIGINAL EVENT CODE: M1551); ENTITY STATUS OF PATENT OWNER: LARGE ENTITY Year of fee payment: 4 |