US10378953B2 - Methods for guiding personal limit selection in UV dosimetry - Google Patents
Methods for guiding personal limit selection in UV dosimetry Download PDFInfo
- Publication number
- US10378953B2 US10378953B2 US15/996,231 US201815996231A US10378953B2 US 10378953 B2 US10378953 B2 US 10378953B2 US 201815996231 A US201815996231 A US 201815996231A US 10378953 B2 US10378953 B2 US 10378953B2
- Authority
- US
- United States
- Prior art keywords
- dose
- user
- percentile
- history
- threshold
- Prior art date
- Legal status (The legal status is an assumption and is not a legal conclusion. Google has not performed a legal analysis and makes no representation as to the accuracy of the status listed.)
- Active
Links
- 238000000034 method Methods 0.000 title claims abstract description 76
- 238000004980 dosimetry Methods 0.000 title description 4
- 230000000007 visual effect Effects 0.000 claims description 13
- 230000008859 change Effects 0.000 claims description 4
- 230000002354 daily effect Effects 0.000 description 28
- 208000024891 symptom Diseases 0.000 description 24
- 230000004044 response Effects 0.000 description 19
- 206010015150 Erythema Diseases 0.000 description 17
- 231100000321 erythema Toxicity 0.000 description 16
- 238000005259 measurement Methods 0.000 description 16
- 230000005855 radiation Effects 0.000 description 13
- 230000006870 function Effects 0.000 description 12
- 239000000463 material Substances 0.000 description 11
- 230000009266 disease activity Effects 0.000 description 10
- 230000002411 adverse Effects 0.000 description 9
- 238000001514 detection method Methods 0.000 description 9
- 230000005291 magnetic effect Effects 0.000 description 8
- 238000001228 spectrum Methods 0.000 description 8
- 238000001720 action spectrum Methods 0.000 description 7
- 230000035945 sensitivity Effects 0.000 description 7
- 230000036541 health Effects 0.000 description 6
- 230000036555 skin type Effects 0.000 description 5
- 230000007704 transition Effects 0.000 description 5
- 206010060933 Adverse event Diseases 0.000 description 4
- 239000008186 active pharmaceutical agent Substances 0.000 description 4
- 230000008901 benefit Effects 0.000 description 4
- 230000000694 effects Effects 0.000 description 4
- 206010025135 lupus erythematosus Diseases 0.000 description 4
- 210000000707 wrist Anatomy 0.000 description 4
- PQHZWWBJPCNNGI-UHFFFAOYSA-N 1,3,5-trichloro-2-(2,5-dichlorophenyl)benzene Chemical compound ClC1=CC=C(Cl)C(C=2C(=CC(Cl)=CC=2Cl)Cl)=C1 PQHZWWBJPCNNGI-UHFFFAOYSA-N 0.000 description 3
- 206010042496 Sunburn Diseases 0.000 description 3
- 230000005540 biological transmission Effects 0.000 description 3
- 238000003066 decision tree Methods 0.000 description 3
- 201000010099 disease Diseases 0.000 description 3
- 208000037265 diseases, disorders, signs and symptoms Diseases 0.000 description 3
- 230000007613 environmental effect Effects 0.000 description 3
- 230000003287 optical effect Effects 0.000 description 3
- 230000002093 peripheral effect Effects 0.000 description 3
- 230000008569 process Effects 0.000 description 3
- 230000009885 systemic effect Effects 0.000 description 3
- 206010034972 Photosensitivity reaction Diseases 0.000 description 2
- 238000012937 correction Methods 0.000 description 2
- 229940079593 drug Drugs 0.000 description 2
- 239000003814 drug Substances 0.000 description 2
- 230000003203 everyday effect Effects 0.000 description 2
- 239000004744 fabric Substances 0.000 description 2
- 239000011521 glass Substances 0.000 description 2
- 210000004247 hand Anatomy 0.000 description 2
- 210000000987 immune system Anatomy 0.000 description 2
- 238000010801 machine learning Methods 0.000 description 2
- 238000002483 medication Methods 0.000 description 2
- 201000001441 melanoma Diseases 0.000 description 2
- 230000008520 organization Effects 0.000 description 2
- 208000007578 phototoxic dermatitis Diseases 0.000 description 2
- 231100000018 phototoxicity Toxicity 0.000 description 2
- 238000010079 rubber tapping Methods 0.000 description 2
- 238000012706 support-vector machine Methods 0.000 description 2
- 230000036642 wellbeing Effects 0.000 description 2
- 208000006820 Arthralgia Diseases 0.000 description 1
- 208000023275 Autoimmune disease Diseases 0.000 description 1
- 206010028980 Neoplasm Diseases 0.000 description 1
- 206010040914 Skin reaction Diseases 0.000 description 1
- 229930003316 Vitamin D Natural products 0.000 description 1
- QYSXJUFSXHHAJI-XFEUOLMDSA-N Vitamin D3 Natural products C1(/[C@@H]2CC[C@@H]([C@]2(CCC1)C)[C@H](C)CCCC(C)C)=C/C=C1\C[C@@H](O)CCC1=C QYSXJUFSXHHAJI-XFEUOLMDSA-N 0.000 description 1
- 230000009471 action Effects 0.000 description 1
- 230000004913 activation Effects 0.000 description 1
- 201000011510 cancer Diseases 0.000 description 1
- 238000006243 chemical reaction Methods 0.000 description 1
- 238000004040 coloring Methods 0.000 description 1
- 238000004891 communication Methods 0.000 description 1
- 239000004020 conductor Substances 0.000 description 1
- 238000012790 confirmation Methods 0.000 description 1
- 238000010276 construction Methods 0.000 description 1
- 208000030381 cutaneous melanoma Diseases 0.000 description 1
- 238000013461 design Methods 0.000 description 1
- 238000010586 diagram Methods 0.000 description 1
- 230000009977 dual effect Effects 0.000 description 1
- 238000002474 experimental method Methods 0.000 description 1
- 239000003302 ferromagnetic material Substances 0.000 description 1
- 230000002068 genetic effect Effects 0.000 description 1
- 230000036449 good health Effects 0.000 description 1
- 230000009931 harmful effect Effects 0.000 description 1
- 230000010354 integration Effects 0.000 description 1
- 230000003993 interaction Effects 0.000 description 1
- 238000002372 labelling Methods 0.000 description 1
- 239000000696 magnetic material Substances 0.000 description 1
- 230000003278 mimic effect Effects 0.000 description 1
- 238000005457 optimization Methods 0.000 description 1
- 230000000737 periodic effect Effects 0.000 description 1
- 208000002440 photoallergic dermatitis Diseases 0.000 description 1
- 230000000258 photobiological effect Effects 0.000 description 1
- 231100001255 photocarcinogenicity Toxicity 0.000 description 1
- 231100000239 photoclastogenicity Toxicity 0.000 description 1
- 230000005195 poor health Effects 0.000 description 1
- 230000002035 prolonged effect Effects 0.000 description 1
- 238000011084 recovery Methods 0.000 description 1
- 238000000926 separation method Methods 0.000 description 1
- 230000009759 skin aging Effects 0.000 description 1
- 230000035483 skin reaction Effects 0.000 description 1
- 231100000430 skin reaction Toxicity 0.000 description 1
- 230000003595 spectral effect Effects 0.000 description 1
- 230000000087 stabilizing effect Effects 0.000 description 1
- 238000012360 testing method Methods 0.000 description 1
- 238000012549 training Methods 0.000 description 1
- 235000019166 vitamin D Nutrition 0.000 description 1
- 239000011710 vitamin D Substances 0.000 description 1
- 150000003710 vitamin D derivatives Chemical class 0.000 description 1
- 229940046008 vitamin d Drugs 0.000 description 1
- 230000003442 weekly effect Effects 0.000 description 1
Images


Classifications
-
- G—PHYSICS
- G01—MEASURING; TESTING
- G01J—MEASUREMENT OF INTENSITY, VELOCITY, SPECTRAL CONTENT, POLARISATION, PHASE OR PULSE CHARACTERISTICS OF INFRARED, VISIBLE OR ULTRAVIOLET LIGHT; COLORIMETRY; RADIATION PYROMETRY
- G01J1/00—Photometry, e.g. photographic exposure meter
- G01J1/02—Details
- G01J1/0219—Electrical interface; User interface
-
- G—PHYSICS
- G01—MEASURING; TESTING
- G01J—MEASUREMENT OF INTENSITY, VELOCITY, SPECTRAL CONTENT, POLARISATION, PHASE OR PULSE CHARACTERISTICS OF INFRARED, VISIBLE OR ULTRAVIOLET LIGHT; COLORIMETRY; RADIATION PYROMETRY
- G01J1/00—Photometry, e.g. photographic exposure meter
- G01J1/02—Details
- G01J1/0228—Control of working procedures; Failure detection; Spectral bandwidth calculation
-
- G—PHYSICS
- G01—MEASURING; TESTING
- G01J—MEASUREMENT OF INTENSITY, VELOCITY, SPECTRAL CONTENT, POLARISATION, PHASE OR PULSE CHARACTERISTICS OF INFRARED, VISIBLE OR ULTRAVIOLET LIGHT; COLORIMETRY; RADIATION PYROMETRY
- G01J1/00—Photometry, e.g. photographic exposure meter
- G01J1/02—Details
- G01J1/0242—Control or determination of height or angle information of sensors or receivers; Goniophotometry
-
- G—PHYSICS
- G01—MEASURING; TESTING
- G01J—MEASUREMENT OF INTENSITY, VELOCITY, SPECTRAL CONTENT, POLARISATION, PHASE OR PULSE CHARACTERISTICS OF INFRARED, VISIBLE OR ULTRAVIOLET LIGHT; COLORIMETRY; RADIATION PYROMETRY
- G01J1/00—Photometry, e.g. photographic exposure meter
- G01J1/02—Details
- G01J1/0271—Housings; Attachments or accessories for photometers
-
- G—PHYSICS
- G01—MEASURING; TESTING
- G01J—MEASUREMENT OF INTENSITY, VELOCITY, SPECTRAL CONTENT, POLARISATION, PHASE OR PULSE CHARACTERISTICS OF INFRARED, VISIBLE OR ULTRAVIOLET LIGHT; COLORIMETRY; RADIATION PYROMETRY
- G01J1/00—Photometry, e.g. photographic exposure meter
- G01J1/02—Details
- G01J1/04—Optical or mechanical part supplementary adjustable parts
- G01J1/0407—Optical elements not provided otherwise, e.g. manifolds, windows, holograms, gratings
- G01J1/0474—Diffusers
-
- G—PHYSICS
- G01—MEASURING; TESTING
- G01J—MEASUREMENT OF INTENSITY, VELOCITY, SPECTRAL CONTENT, POLARISATION, PHASE OR PULSE CHARACTERISTICS OF INFRARED, VISIBLE OR ULTRAVIOLET LIGHT; COLORIMETRY; RADIATION PYROMETRY
- G01J1/00—Photometry, e.g. photographic exposure meter
- G01J1/42—Photometry, e.g. photographic exposure meter using electric radiation detectors
- G01J1/429—Photometry, e.g. photographic exposure meter using electric radiation detectors applied to measurement of ultraviolet light
-
- G—PHYSICS
- G01—MEASURING; TESTING
- G01J—MEASUREMENT OF INTENSITY, VELOCITY, SPECTRAL CONTENT, POLARISATION, PHASE OR PULSE CHARACTERISTICS OF INFRARED, VISIBLE OR ULTRAVIOLET LIGHT; COLORIMETRY; RADIATION PYROMETRY
- G01J1/00—Photometry, e.g. photographic exposure meter
- G01J1/02—Details
- G01J2001/0257—Details portable
Definitions
- UV radiation ultraviolet
- a system attempting to perform such measurements has previously been proposed [1]. It includes a wearable device that measures UV exposure and where the exposure data can be displayed to the user, either on the wearable device or on a remote mobile device (such as a smartphone or tablet) through a wireless transmission.
- UV exposure represents the instantaneous strength of UV radiation (usually in units of power or power per unit surface), while UV dose is the aggregated strength of UV radiation over a specified time period (usually in units of energy or energy per unit surface).
- One of the foundations of the exemplary system is the selection of a limit for UV dose that a user wishes to remain under over a specific period of time (usually during a day, which we will use thereafter but it could be an hour, a week, a month, etc.).
- a limit for UV dose that a user wishes to remain under over a specific period of time (usually during a day, which we will use thereafter but it could be an hour, a week, a month, etc.).
- UV light is radiation in the wavelength range of 280-400 nm. Most of people receive their UV exposure from sunlight but some may be exposed to artificial UV exposure during their work (e.g. nurses) or for aesthetic purposes (e.g. tanning bed). UV exposure enables the skin to synthesize Vitamin D but overexposure to UV can cause adverse effects such as: skin redness, sunburn, systemic reactions in autoimmune diseases such as lupus, or pharmaceutical phototoxicity in the short term, and non-melanoma and melanoma skin cancer, skin aging, pharmaceutical photoallergy, photogenotoxicity, and photocarcinogenicity in the longer term (adverse effects thereafter).
- Sensitivity to UV varies from person to person. Factors influencing UV sensitivity are comprised of genetic factors, history of UV exposure, concomitant medications, and medical conditions. For instance, on average, people with darker skin are more tolerant to UV exposure than people with fair skin. However, people with dark skin suffering from lupus are as sensitive, if not more, to UV exposure than people with fair skin. There is no way, a priori, to determine what daily UV dose a person can be exposed to without experiencing adverse events.
- Time spent outdoors varies from individual to individual. Outdoor runners spend more time outside during their exercise than indoor treadmill runners. Certain professions, such as construction, involve a longer time being outside on a daily basis, compared to office jobs for instance.
- the UV dose received by someone depends on both the UV strength and the time spent at the corresponding UV strength, two factors that heavily depend on someone's location and lifestyle.
- the primary way to be able to control any adverse event caused by UV overexposure is to have an accurate knowledge of one's real-time UV dose and, as importantly, relate it to a limit that makes sense for this specific person so that she or he can avoid any adverse event by making sure her or his UV dose remains under this limit.
- UV Index UV Index
- Typical UV measuring systems include a UV detector, which converts the incident ultraviolet radiation signal to electric current, coupled with additional circuitry. This includes an analog-to-digital converter (ADC), op-amp and microcontroller [1]. The current is then converted into a value for the UV index using a reference value of Some examples of these systems are the Solarmeter 6.5 UVI and the Genicom UV Index Meter. While such a system is capable of estimating the UVI, it is not accurate in a wide variety of situations because of the mismatch between their spectral sensitivity and the erythema spectrum [17, 20].
- ADC analog-to-digital converter
- op-amp op-amp
- microcontroller microcontroller
- UV dose limit Every person has a certain UV dose they can tolerate in a given time span before it has an adverse effect. For some, depending on their location, this limit is small enough to be achieved in a few minutes to a few hours. If the UV dose limit is being approached, or has been exceeded, this information needs to be conveyed to the user so that he/she can act on it immediately. Otherwise it can lead to adverse effects. It is for instance known that UV exposure has a systemic impact on lupus and evidence shows that lupus patients experience more flares in the summer than in the winter [23]. Once a UV dose limit is set, a user may be notified when they have exceeded a certain percentage of that limit (e.g. 50%) by one of several methods e.g.
- a certain percentage of that limit e.g. 50%
- UV dosimetry recommends a UV dose based on skin type. These recommendations do not take into account the history of UV exposure, which influences the tolerance to UV dose, concomitant medications, and diseases. As a result, this method can lead to inappropriate UV dose limits for many users, and a result, lead to adverse events.
- the guiding, or assisting can include providing additional information to the user.
- the limit may be based on a pre-set period of time e.g. an hour or a day.
- the user is guided to set a limit based on a display of a history of previous doses, and in some embodiments a history of self-recorded symptoms or health reports. Examples of systems, devices, and methods that allow a user to set a personal UV dose limit based on a dose history and symptom history are included herein in reference to FIGS. 1-22 , which are also included in U.S. Pat. App. Pub. 2016/0364131A1.
- the user is provided with further guides or additional information as to what is a high UV dose by displaying on the graph (or other visual presentation) a certain percentile of their UV history (for example, without limitation, the 90th percentile), as computed over the past UV dose history.
- This guide or other additional information can be displayed on the graph visually in the form of, for example, a region or a line (algorithms can of course be adapted to visually indicate this information in other ways), indicating a potentially dangerous high UV dose.
- This additional information allows the user to be better informed while setting (also referred to herein as “choosing” or “selecting”) their UV dose limit.
- One aspect of the disclosure is a computer executable method adapted to be stored in a memory, comprising: visually presenting on a display of a user device a history of UV dose that was calculated based on information sensed by a UV sensor in a wearable UV sensing device; visually presenting a percentile indicator on the display, the percentile indicator being indicative of a calculated percentile of the history of UV dose.
- the method can also include visually presenting on the display a user-adjustable UV dose threshold interface that is adapted to allow the user to interact with the user-adjustable UV dose interface and choose a user-chosen UV dose threshold quantity.
- the history of UV dose can be visually presented in graph form.
- the percentile indicator can be visually overlaid with the history of UV dose.
- the user-adjustable UV dose threshold interface can be visually overlaid with the history of UV dose.
- the percentile indicator can be overlaid with the user-adjustable UV dose threshold and the history of UV dose.
- the percentile indicator can indicate to the user doses on the history of UV dose that are at least one of at or above the calculated percentile.
- the user-adjustable UV dose threshold interface can be adapted to change visually if the user-adjustable UV dose threshold interface is moved to a dose that is at least one of at or above the calculated percentile.
- the percentile indicator can indicate to the user doses on history of UV dose that are at least one of at or below the calculated percentile.
- the percentile indicator can comprise at least one of a horizontal line, a shaded area, and a colored area.
- the history of UV dose can be broken up into epochs of time, optionally, days, weeks, or months.
- One aspect of the disclosure is a computer executable method adapted to be stored in a memory, the method comprising: visually presenting on a display of a user device a percentile indicator indicative of a calculated percentile of a UV dose history that was calculated based on information sensed by a UV sensor in a UV sensing device.
- the method can further include visually presenting on the display a history of UV dose that was calculated based on information sensed by a UV sensor in a wearable UV sensing device.
- the method can further comprise visually presenting on the display a user-adjustable UV dose threshold interface that is adapted to allow the user to choose a user-chosen UV dose threshold quantity.
- One aspect of the disclosure is a computer executable method adapted to be stored in a memory, the method comprising: receiving as input a UV dose history that was calculated based on information sensed by a UV sensor in a UV sensing device; calculating a percentile of the UV dose history (e.g., 90%), and communicating as output to a display the calculated percentile of the UV dose history.
- the method can further comprise visually presenting on a display of a user device a percentile indicator indicative of the calculated percentile of the UV dose history that was calculated based on information sensed by a UV sensor in a UV sensing device.
- FIG. 1 illustrates an exemplary system including a wearable UV sensing device and a mobile device.
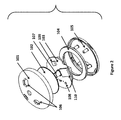
- FIG. 2 is an exploded view of an exemplary wearable device.
- FIG. 3 shows the response of two commercially available UVI diodes and sensors in comparison to the erythema action spectrum.
- FIG. 4 An exemplary algorithm for determining the environment based on sensor readings is shown in FIG. 4 .
- FIG. 5 is an exemplary method of selecting the appropriate model for predicting the erythemally-weighted UV exposure from the sensor values.
- FIG. 6 shows the ratio of erythemally-weighted UVB to erythemally-weighted UVA as seen over the course of a day (every hour).
- FIG. 7 shows the variation of R B/A with the solar zenith angle.
- FIG. 8 shows an exemplary method for the estimation of UVA and UVB.
- FIGS. 9( a ) and 9( b ) illustrate an exemplary magnetic attachment system.
- FIG. 10 illustrates an exemplary magnetic attachment system.
- FIGS. 11A and 11B illustrate an exemplary charging system.
- FIGS. 12A and 12B illustrate an angle the tilt ( ⁇ ).
- FIG. 13 illustrates an exemplary method of user notification.
- FIGS. 14( a )( i ) and 14( a ) ( ii ) illustrate light with and without a diffuser.
- FIG. 14( b ) illustrates the angle between a normal and the incoming ray of light.
- FIG. 15 illustrates an exemplary wearable device, including a diffuser therein and above a plurality of sensors also within the wearable device.
- FIGS. 16A and 16B illustrate an exemplary proximity sensor, including a light source and a detector, and a covering material over the proximity sensor.
- FIG. 17 illustrates an exemplary method for proximity detection using a proximity sensor.
- FIG. 18 illustrates an exemplary method that can cause a device to switch between a sleep mode and an active mode.
- FIGS. 19A and 19B illustrate exemplary displays and a method of allowing users to select a UV threshold based on a time history of symptoms and UV exposure.
- FIG. 20 illustrates an exemplary embodiment of a method for setting a threshold.
- FIG. 21 shows the variation of UV index over a typical day.
- FIG. 22 An exemplary computer executable method for estimating the safe amount of time to spend in current UV conditions is shown in FIG. 22 .
- FIG. 23 illustrates an exemplary method of visually presenting a percentile of UV dose.
- FIG. 24 illustrates an exemplary visual presentation on a display of a device.
- FIGS. 1-22 referenced in the disclosure below, are those shown in U.S. Pat. App. Pub. 2016/0364131A1.
- the systems and methods described above can include or incorporate any and all aspects of any of the systems, devices, and methods described below.
- any of the methods above can be performed using algorithms stored in memory on a hand-held device and/or a wearable UV sensing device.
- the methods and devices herein can be incorporated with other types of UV sensing systems, and are not limited to those shown in FIGS. 1-22 .
- the methods herein can be used to calculate a percentile of a time history of UV dose calculated using traditional or other UV sensing and dose determination devices.
- the methods herein can be used to establish a new UV dose threshold for the system using the calculated percentile, without requiring a user to be part of the UV dose threshold selection process (or without allowing a user to select the UV dose limit).
- FIG. 1 is a block diagram of an exemplary system that can be adapted for accurate measurement and real-time feedback of ultraviolet exposure, and can incorporate any of the methods herein.
- the system in FIG. 1 includes two sub-systems.
- the first subsystem is wearable device ( 100 ).
- Wearable device 100 includes a plurality of light sensors—a UV Index (“UVI”) diode ( 110 ), a UVA diode (UVA) ( 115 ), a visible light diode (VIS) ( 120 ), an infra-red LED ( 125 ) coupled with an infra-red detector (PROX) ( 130 ).
- UVI UV Index
- UVA UVA diode
- VIS visible light diode
- PROX infra-red detector
- the wearable device also includes one or more orientation sensors (ORIENT) ( 135 ) capable of determining the orientation of the wearable device in space.
- ORIENT orientation sensors
- Sensors 110 , 115 , and 120 are in communication with a microcontroller ( 150 ) via one or more transimpedance amplifiers A 1 -A 3 , respectively ( 111 ), which itself is powered by an on-board battery ( 140 ).
- the battery is capable of being recharged via a charger ( 145 ).
- Microcontroller 150 transmits collected data via a wireless transmitter ( 155 ) following a certain protocol such as Bluetooth Low Energy, which is known.
- the exemplary system in FIG. 1 includes a second subsystem—mobile device 160 .
- the mobile device may also be referred to as a “remote” device.
- Mobile device ( 160 ) can be a typical handheld device such as a smartphone or tablet, which has a wireless receiver ( 165 ) that follows the same protocol as the transmitter on the wearable, e.g., Bluetooth Low Energy.
- Collected data is received by an application ( 170 ) executable on mobile device ( 160 ), which interfaces with the user via a display ( 175 ) that includes one or more pieces of information about the user's UV exposure. This display can be the screen of the mobile device.
- the wearable device includes a housing comprising top case 101 and bottom case 105 , which contain therein internal components.
- Top case ( 101 ) is made of opaque material and has a plurality of windows 106 therein that allow light to reach the sensors that are disposed on a printed circuit board (PCB) ( 103 ) within the housing.
- the device includes UVI sensor 107 disposed below the central window, proximity and visible light sensor 108 disposed below a peripheral window, UVA sensor 109 disposed below a second peripheral window, and a LED that cannot be seen in FIG.
- the top case 101 includes a UVI sensor window, a UVA sensor window, a window for a sensor that includes both a proximity sensor and visible light sensor, and a LED light window, but in other embodiments it can have a different number of windows depending on how many objects disposed in the housing need to receive light, and their relative positions.
- Diffuser 102 is disposed between the top case 101 and the PCB 103 , which is adapted to capture light from different angles and project them on to the sensors below.
- the PCB 103 rests on a magnet ( 104 ), which is optionally annular, which engages and attaches to the bottom case ( 105 ).
- the bottom case and the top case are secured to one another.
- the magnet can be is used in an attachment system, examples of which are described herein, wherein an external magnet allows the wearable device to be clipped on to any article of clothing.
- Microprocessor 110 is also shown on PCB 103 .
- the exemplary system has a unique combination of sensors: a UVI sensor, a UVA sensor, a visible light sensor, a proximity sensor, and an orientation sensor, as well as unique algorithms that can utilize information from one or more of the sensors.
- sensors a UVI sensor, a UVA sensor, a visible light sensor, a proximity sensor, and an orientation sensor, as well as unique algorithms that can utilize information from one or more of the sensors.
- the following sub-sections describe how the sensors and algorithms can all work, some individually and some together, to improve either the accuracy of measurement or real-time feedback of ultraviolet exposure. Not all of the algorithms described herein need to be performed with each other. In fact, any of the algorithms herein can be used individually.
- the UVI, UVA and visible light sensors are all light sensors, but they have different responses to light.
- the optional UVA diode examples of which are known, has a peak of measurement in the UVA region (315-400 nm) and has very low response outside this band.
- the visible light diode examples of which are known, has a peak of response in the visible light region (400-800 nm), and near-zero response outside this band.
- the UV Index (UVI) diode has a unique response that attempts to match the erythema action spectrum (see McKinlay, A. & Diffey, B. “A reference action spectrum for ultra-violet induced erythema in human skin”. CIE J.
- FIG. 3 shows the response of two commercially available UVI diodes and sensors in comparison to the erythema action spectrum.
- UVI, UVA, proximity, visible, and orientations sensors are included in the wearable device.
- a UVA sensor is optional if information from a UVA is not needed for a particular method.
- a visible light sensor is optional if an algorithm need not receive information from a visible light sensor.
- the device does not include an orientation sensor if the orientation is not needed or desired.
- UV Index erythemally-weighted UV
- This exemplary system identifies the following environments:
- FIG. 4 An exemplary algorithm for determining the environment based on sensor readings is shown in FIG. 4 .
- This is a decision tree algorithm based on the readings from the UVI, UVA and visible light sensors ( 200 ).
- the next section will describe how these sensors are used to separately estimate erythemally-weighted UVA and UVB, but for this section it is assumed that the values have already been derived.
- UVB is absorbed by glass and hence drops to undetectable levels when indoors. The same is not true for UVA, which is usually transmitted through glass.
- the value of the threshold is trained a priori by collecting data from several users in both indoor and outdoor situations.
- a maximal margin separating hyperplane method e.g., Cortes, C.; Vapnik, V. (1995). “Support-vector networks”. Machine Learning 20 (3):273. doi: 10.1007/BF00994018) can be used to train this threshold from the collected data.
- the algorithm then utilizes the UVA sensor value to decide if the user is in direct sunlight through the windows or away from it.
- the algorithm compares this UVA sensor reading to a threshold UVAth,indoor, ( 225 ) which can be set using the same set of machine learning methods described above. It is known that UVA partially travels through windows, which makes the UVA value higher when in sunlight through the windows, and lower when away from the window.
- the algorithm determines the user is outdoors, the algorithm utilizes the reading of the visible light sensor (VIS) to determine if the user is in shade or in the open. The algorithm then compares the reading from the VIS sensor to a threshold VISth,shade ( 255 ). Being lower than the threshold implies shade, while being above the threshold indicates being in the open. This threshold can be trained using data collected from a number of users in both situations. Finally, if in the open, the sensor values can further be utilized to determine whether the weather is cloudy or sunny. This is achieved using both the visible light readings (VIS) and the UVB reading ( 260 ). We know that clouds attenuate the visible light, but transmit UVB, while in sunny weather both VIS and UVB are high. We formulate this determination of cloudy vs. sunny as an optimization problem, where:
- the parameters a1, a2 and a3 can be trained using data collected with the devices placed in sunny and cloudy conditions.
- a maximal margin separating hyperplane algorithm also known as a support vector machine
- the above sunny vs. cloudy determination has been described as a two-class problem, but it can also be described as a multi-class problem to detect different cloud densities e.g., scattered light clouds vs. overcast. Solving such a multi-class problem would involve training several one-vs-all classifiers—one for each class that we are interested in.
- the device is able to select the appropriate model for predicting the erythemally-weighted UV exposure from the sensor values— FIG. 5 .
- the form of the polynomial function is derived during the calibration process. If we fit only one calibration function or model (f) for all environmental conditions, it suffers from a lack of accuracy. For example, a model that is calibrated on data collected across a variety of environments will not be particularly accurate for just the indoor environment. However, using multiple models, each of which is calibrated to data from a particular environment allows each model to be more accurate for only its particular environment. This exemplary embodiment uses five such models, corresponding to our five environments described above, which is stored in a calibration database ( 320 ).
- the system is able to select the most appropriate calibration function ( 350 ), which is then used with the sensor values ( 300 ) to derive the UV Index ( 330 ). This gives the most accurate measurement of the UV Index in all possible environments.
- the UV Index can then be, for example, displayed to a user on a display.
- UVA has very different impact on the human body as compared to UVB. Different amounts of UVA and UVB are required for activation of an adverse response, with the amount of UVB being much smaller than UVA for the same adverse response.
- UVB and UVA it suffices to compare erythemally-weighted UVB and UVA.
- two exemplary methods to measure erythemally weighted UVA and UVB dose one utilizing two UVI diodes with different filters, the other utilizing software-based estimation with a single UVI diode.
- the first method two diodes with identical response similar to the erythema spectrum are placed in the wearable device, one underneath a filter that lets pass the UVA region of the spectrum and nothing else, the other one underneath a similar filter for UVB. Since perfect filters for the said regions of the spectrum do not exist in practice, this method introduces errors, the first consequence of which is that the addition of the responses of both diodes (even when normalized to the peak transmission of each individual filter) may not be equal to the full erythema spectrum, hence the UVI cannot be retrieved from this device, even if the response curve of the original diodes were to match perfectly the erythema curve.
- Another embodiment of the above concept makes use of diodes with different responses each, and also different filters.
- the combination of each diode response and filter tries to match as closely as possible the UVA portion of the erythema spectrum in one case, and the UVB in the other.
- this configuration utilizing two diodes resembles that of the UVA and UVI diodes in FIG. 1 , in that each is connected to an analog amplifier, then analog to digital converter and then the response is read in the microcontroller.
- FIG. 6 shows the ratio of erythemally-weighted UVB to erythemally-weighted UVA as seen over the course of a day (every hour). Erythemal weighting gives exponentially higher weight to UVB as opposed to UVA, but the solar spectrum also contains much higher quantities of UVA as compared to UVB.
- the plot shown is for a location in France in summer. This ratio varies with location (latitude in particular), as well as time of the year. There are lower amounts of UVB during winter, and higher amounts during summer.
- the erythemally weighted UVB/UVA ratio (RB/A) is modeled as a function of solar zenith angle ( ⁇ ).
- FIG. 7 shows the variation of RB/A with the solar zenith angle.
- R B/A p 0 +p 1 sin ⁇ (Eq. 2.1)
- the flow for estimation of UVA and UVB using this method is shown in FIG. 8 .
- the mobile device such as mobile device 160 , has information about the current location and time of the measurement ( 400 ). This is used to look up the solar zenith angle for an existing database ( 410 ).
- the solar zenith angle (SZA) is readily available via internet APIs or can be computed using well-known models. With knowledge of the SZA ( ⁇ ) ( 420 ), and the coefficients p0, p1 ( 430 ), we calculate the UVB/UVA ratio using Eq. 2.1 ( 440 ).
- the system estimates in real time, the amount of erythemally-weighted UVB (EUVB) and erythemally-weighted UVA (EUVA) separately ( 460 , 465 ) from the UV Index ( 450 ) using the following equations:
- EUVB 25 ⁇ mW cm 2 ⁇ UVIndex ⁇ R B / A 1 + R B / A ( Eq . ⁇ 2.2 )
- EUVA 25 ⁇ mW cm 2 ⁇ UVIndex ⁇ 1 1 + R B / A ( Eq . ⁇ 2.3 )
- the factor of 25 accounts for the fact that one unit of UV Index corresponds to 25 mW/cm2 of erythemally weighted ultraviolet radiance (McKinlay, A. & Diffey, B. “A reference action spectrum for ultra-violet induced erythema in human skin”. CIE J. 17-22 (1987)).
- the UVA and UVB estimate can then be used in any methods herein, such as estimating the UV index.
- Ultraviolet exposure on one region of the body often does not correlate with other regions.
- E. Thieden et al. “The wrist is a reliable body site for personal dosimetry of ultraviolet radiation”, Journal of Photodermatology, photoimmunology & photomedicine , Vol. 16, Issue 2, 2000, found that exposure on the chest does not correlate well with the top of the head, so measuring one does not give a clear idea of the other.
- the systems herein are generally configured and adapted to measure ultraviolet dose on the face.
- the system includes a magnetic wearable system that is capable of being attached to the front of the top layer of clothing, usually a shirt. This sensor is generally always oriented in the same direction of the face, and hence will collect a UV exposure dose that correlates very closely with that of the face. Measuring on the chest also provides the advantage of having a very stable measurement, as opposed to the wrist.
- the magnetic attachment system shown in FIGS. 9( a ) and 9( b ) comprises two magnets, one ( 710 ) disposed inside the wearable device housing and one ( 712 ) on the outside of the wearable device housing ( 700 ).
- the magnet in the inside of the wearable device ( 710 ) housing sits close to the bottom of the unit ( 740 ), and the wearable device is meant to be placed on top of the outer layer of clothing ( 750 ) in the upper torso region of the user (see FIG. 9( b ) .
- the other magnet is meant to be placed on the opposite side of the outer layer of clothes. In this manner, the attraction of the 2 magnets makes the device press against the fabric of the garment, providing a secure grasp.
- the user can freely choose any place in the fabric of the garment to place the device, its intended area of use is in the upper torso ( 770 ), as depicted in FIG. 9( b ) .
- This method is superior to others based on specific features in clothing, such as clips, which can only be placed on edges of clothing. It is also superior to pin or brooch attachments in that it does not pierce the clothing. It is conceivable however, that in some embodiments there the wearable device can be positioned elsewhere.
- This system includes similarly shaped (e.g., cylinders of same diameter, rings of same internal and external diameters, but not necessarily height) magnets (see FIG. 10 ), as projected to the plane that lies in between them in order to ensure that they are aligned when snapped together.
- similarly shaped magnets e.g., cylinders of same diameter, rings of same internal and external diameters, but not necessarily height
- the ring-shaped magnets allow for the design of a particular charging system, as described below.
- FIGS. 11A and 11B An exemplary charging system shown in the side and perspective views of FIGS. 11A and 11B uses conductive, concentric ring shaped conductors ( 810 ) in the bottom of the device ( 800 ), which are connected to different signals in the internal circuitry of the device.
- the charger makes use of spring loaded contacts ( 820 ) in a flat configuration, at varying distances from a common axis of symmetry normal to the said plane, which coincide with the radii of the conductive rings on the device, and carry the electrical signal intended to make connection with that specific ring. This is depicted in FIGS. 11A and 11B . In this way, electrical connection is ensured, irrespective of the relative rotation angle between the device and the charger around the common axis of symmetry.
- the charger may optionally also include a magnet or ferromagnetic material. This will cause magnetic attraction to the magnet inside the device housing and allow for better engagement of the charger and device. The strength and position of such a magnet is also adjusted so that the magnetic clamping causes the electrical contacts on both device and charger to align correctly with each other.
- the wearable device ( 100 ) can be attached to the front of the clothing using a magnetic attachment system.
- the purpose of the wearable device is to measure the exposure on the face (I face ) ( 510 ), and hence needs to be aligned as flat against the chest as possible.
- the device may, in practice, be tilted from this ideal flat position corresponding to the face orientation ( 520 ). Further, the tilt of this device might be changing very rapidly, such as when the wearable is attached to a loose shirt while the user is running. This would cause an unstable measurement, despite the user's face receiving a uniform amount of UV exposure. Stability and accuracy are both important, in order to accurately estimate UV dose.
- Orientation detection is performed by a set of orientation sensors (e.g., orientation sensor 135 , in FIG. 1 ) including accelerometers and gyroscopes, which are known. These determine the angular position of an object in three dimensions in terms of pitch, roll and yaw. We are primarily interested in the angular rotation of the device around the horizontal axis passing from left to right through the human face. We will call this angle the tilt ( ⁇ ) ( FIGS. 12A and 12B ) ( 540 ). The tilt angle is an output from the orientation sensor, or derived from output from the orientation sensor, and is input to computer executable methods herein.
- orientation sensors e.g., orientation sensor 135 , in FIG. 1
- accelerometers and gyroscopes which are known.
- I face I device cos ⁇ 6.
- the wearable device ( 100 ) can be adapted to able to alert the user in certain scenarios e.g. when the daily UV exposure has exceeded safe limits, or the wearable device is running out of battery, or the wearable device is being obstructed by something.
- the notification needs to happen soon after the alert condition is detected on the wearable device, so as to not risk the user's health, and hence needs to be in real-time.
- the slave cannot initiate contact with the master.
- the slave is the wearable device
- the master is the mobile device
- this is a common condition for Bluetooth/Bluetooth Low Energy.
- Geo-fencing is the science of alerting a mobile user when the device has entered a particular location. Normally, this location is determined using the GPS chip on the mobile device, although increasingly commonly WiFi signals are also being used to improve this location estimate. Beacon-based geo-fencing allows even more fine-grained location estimates by being able to determine if the mobile device is in the vicinity of a Bluetooth beacon whose location is known a priori. Previously, this has purely been used for more accurate location estimates, but our proposed system utilizes the same method for sending alerts from any Bluetooth-enabled device.
- FIG. 13 shows an exemplary flow for user notification.
- the application on the mobile device ( 670 ) can be set up for beacon-based geo-fencing ( 675 ). This allows the device to be alerted whenever it is in the vicinity of a beacon with a specific identifier.
- This alert identifier is known to both the wearable device and the mobile device and stored in a database ( 660 ), which may exist in-memory on the wearable device and mobile device, or reside in the cloud.
- Three alert conditions may exist on the device: (a) the wearable device is covered by an object e.g.
- the wearable device is running low on battery ( 630 ).
- the microcontroller on the wearable device detects its alert condition, it switches to advertising with that same pre-specified alert identifier ( 650 ), which it looks up from the database ( 645 ).
- the identification information is contained in the advertisement packet of the beacon ( 655 ).
- the system utilizes different identifiers to indicate different alert conditions.
- the mobile device is alerted of the presence of a beacon ( 680 ), it first derives the alert identifier from the beacon advertisement packet ( 681 ).
- the mobile device checks its identifier against its list of known identifiers ( 682 ). If the identifier corresponds to a known alert condition, the mobile device displays this alert condition to the user ( 685 ). If the user acknowledges the alert condition, the mobile device then connects wirelessly (note that the mobile device as the master can initiate connection) and sends an acknowledgement to the wearable device ( 690 ). This acknowledgement causes the wearable to stop advertising as a beacon ( 691 ) and resume normal operation by clearing the alert condition ( 692 ).
- the wearable device is adapted and configured such that the sensors lie under an opaque casing.
- the casing can include windows in the material to transmit light.
- the casing should have a material that is capable of accepting light at different incident angles and removing this angular information when transmitting it to the sensor below ( FIG. 14( a ) ( ii )).
- the wearable device thus includes one or more optical diffusers as the filling material for the aforementioned windows. Here we describe the desired response of the diffuser material.
- the amount of irradiance in a flat area element A from a planar source of light (direct light from the sun can be assumed to be a planar source, since the origin of the rays is so far away that they are almost parallel) reaches a maximum when the normal of the element is parallel to the incoming rays. Let's call this maximum I max . If the area is then tilted so that the angle between its normal and the incoming rays is ⁇ (as seen in FIG. 14( b ) ), then the irradiance varies as a cosine of ⁇ multiplied by the maximum radiation. Note that this is independent of rotation of the said area element around its normal.
- the wearable device should exhibit the same angular response when the sensor is tilted with respect to the sun.
- the optical diffuser placed on top of the UV and optical sensors, needs to have the properties of a perfect Lambertian diffuser, which will allow the recovery of the desired cosine angular response (Eq. 7.1).
- the device includes windows of a specific material aimed at resembling as close as possible a Lambertian transmission diffuser.
- the diffuser material may be cut into window-shaped pieces and adhered underneath the openings to allow the light in, or may be assembled as a single piece directly underneath the windows using clips in the casing, as depicted in FIG. 15 .
- the top case ( 1050 ) comprises clips ( 1030 ) into which the single-piece diffuser ( 1040 ) is able to snap in place, and be held firmly.
- the plurality of windows in the top case are directly positioned above the sensors of interest ( 1010 , 1020 ), which reside on the printed circuit board (PCB) ( 1000 ).
- the wearable device is magnetically attached to the front of the clothing. It is possible that the user mistakenly covers this device, such as when wearing a jacket over the shirt. This would cause the covering to block all UV to the device, and thus render it unable to estimate the radiation incident on the face.
- the wearable device includes a covering detection system, which is capable of alerting the user, so that the covering may be promptly removed.
- a proximity sensor e.g., proximity sensor 130 in FIG. 1
- a proximity sensor which includes an infra-red (IR) LED ( 1100 ) and an IR detector ( 1110 ).
- the IR LED sends pulses outward ( 1130 ).
- the two components are place under a window of the top case ( 1150 ), which is covered by diffuser material ( 1120 ). Without any covering items, the IR pulses escape and are not captured by the IR detector (see FIG. 16A ). If any object is covering the wearable ( 1140 ), there is significantly high reflection of IR from it and is picked up as a signal in the IR detector, as shown in FIG. 16B .
- the flow for proximity detection is shown in FIG. 17 .
- the micro-controller ( 1170 ) pulses the IR LED ( 1171 ) and polls the value of the IR detector ( 1172 ) in sequence. If the IR detector signal (PROX) is found to exceed a certain proximity threshold (PROX th ) ( 1174 ), then the microcontroller increments a counter ( 1176 ), else clears the counter ( 1178 ). When the counter (Counter PROX ) exceeds a pre-specified threshold ( 1180 ), the microcontroller determines that there is material covering the wearable device. It then triggers an alert condition ( 1182 ), which in turn will notify the user that their device is covered by something.
- the wearable device needs to not only be accurate, but also power-efficient so that it is able to maximize the amount of UV data captured on a single charge. For this purpose, collecting UV data in the absence of the sun i.e. before dawn or after dusk, is an unnecessary drain on the power supply. Being able to sleep during this time saves both battery and memory for collecting data. However, it is not expected that the wearable device will be constantly connected to the mobile device, which would make it unaware of sunrise and sunset times. In order to overcome this issue, we utilize an algorithm based on the existing sensors, which determines when to sleep and when to wake up the device.
- FIG. 18 shows an exemplary sleep mode algorithm in more detail.
- active mode all sensors are active and the microcontroller polls these sensors to aggregate the UV data. From polling the visible light sensor ( 950 ) it determines if the reading (VIS) is above a certain threshold. It also polls the proximity sensor (PROX) to ensure that there is nothing covering the device. If the reading is found to be below a pre-determined light/dark threshold (VIS light/dark ) ( 940 ), and the proximity reading exceeds the covered threshold ( 945 ), a counter is incremented ( 930 ), else the counter is cleared ( 935 ).
- VIS light/dark pre-determined light/dark threshold
- PROX proximity sensor
- the device If the counter exceeds a pre-specified value (Counts dark ) ( 920 ), indicating the condition of darkness has persisted for some time, the device is put into sleep mode ( 900 ).
- Running a counter-based scheme helps prevent against noisy readings, or sudden darkness conditions e.g., when a train passes through a tunnel. If the proximity sensor senses something is covering the device rather than darkness due to the absence of sun, the system can send an alert to the user, as described above.
- a method for selecting such a threshold based on past exposure history, along with disease activity We define the term disease activity to indicate symptom occurrences and general well-being of the user, as tracked on a periodic basis via the mobile application. Symptoms include skin reactions (e.g., erythema, sunburn, etc.) and systemic symptoms (e.g. joint pain, etc.). Our system asks the user to rate their disease activity daily on a scale of 0 (no symptoms, good health), to 10 (lots of symptoms, poor health). Note that the threshold may apply to a full day's UV dose, or to some other time unit, such as a week, or an hour.
- the unit of time may also be user-selectable, e.g., a user may choose to select a threshold for hourly UV dose, and a different threshold for daily UV dose.
- a threshold for hourly UV dose and a different threshold for daily UV dose.
- daily threshold we will describe the rest of this section using daily threshold as an example, but it easily extends to other time periods.
- UV dose but it is equally applicable to UVA dose or UVB dose individually.
- the user By looking at both disease activity and UV dose, the user decides to manage a dose of UV exposure that he or she thinks may be safe for his or her own wellbeing. Different users have different tolerances to UV and our method enables anybody to manage the right amount of UV dose.
- the threshold selection occurs on the mobile device, where all or some of the following information can be presented to the user:
- FIGS. 19A and 19B show one depiction of this information.
- the top graphs labeled “UV daily exposure” represents UV dose in units of Joulcs/m 2 (B. L. Diffey et al., “The standard erythema dose: a new photobiological concept”, Journal of Photodermatology, photoimmunology & photomedicine , Vol. 13, 1997).
- This is visually presented on top of another graph with a representation of disease activity information, and can either be on the same graph, or on an adjacent (the information can be presented in many different ways).
- the disease activity is, in this embodiment, shown as a score, which was recorded by the user on a daily basis.
- the daily minimum, maximum and average dose can also be shown on the plot.
- the maximum of the UV dose on the Y-axis is set according to the maximum daily UV dose ever received by the user.
- a daily threshold using a slider (or some other form of input), which lies between zero and the maximum UV dose the user has ever been exposed to.
- the threshold can be selected so that future symptoms can be avoided or minimized. For example, if a relatively high UV dose is associated with certain diseases symptoms, as indicated on the screen, a user can select a threshold dose that is below the level of the dose that was associated with the disease symptoms.
- Such thresholds can also be determined for UVA and UVB separately. Such a threshold can be determined for hourly, daily, weekly, monthly doses.
- Threshold can be chosen over any number of hours, days, weeks, months, and in some embodiments the user can select the time epoch for which to set this threshold. In some embodiments the time histories are broken up into epochs of time, and can be the same epochs, or they can be broken up into different epochs of time.
- FIG. 20 One embodiment of the user interaction flow for setting the threshold is shown in FIG. 20 .
- the process is started with the user requesting to set their UV threshold ( 1200 ).
- This action may be in the form of tapping a button on the mobile application ( 1290 ) (e.g., FIG. 19A ), or may use other forms of input such as voice.
- the mobile application fetches the user's UV exposure history ( 1210 ) from the UV exposure history database ( 1215 ), and the user's current UV threshold from its respective database ( 1245 ).
- the database may reside on the mobile device running the application, or in the cloud, in which case the data would be retrieved over the internet.
- the user's disease activity information is also retrieved ( 1220 ) from the disease activity database ( 1225 ). These two pieces of data are used to draw two bar graphs to display the information simultaneously ( 1230 ). It is important to view both pieces of data at the same time, since a safe threshold may only be inferred from how UV dose affected disease activity in the past.
- the line corresponding to the current UV threshold is drawn across the UV dose graph ( 1240 ), which is shown in FIG. 19A via the horizontal line in the top graph, and the user is a given a visual cue of which days they exceeded their threshold by coloring bars above the threshold differently ( 1250 ) (as can be seen in the different highlighted areas above the line in the top graph in FIG. 19A , for an example).
- the threshold line is re-drawn at the new threshold value ( 1245 ). If the user confirms their new threshold by tapping on a confirmation button ( 1295 ) (shown in FIG. 19B ), this new threshold is saved in the UV threshold database ( 1245 ). This is an example of how a user can select a threshold, and also optionally change a threshold after it has already been set. This ability to control the threshold based on symptoms personalizes the threshold for each patient, providing much better care for the patient.
- the wearable device measures the aggregated UV dose, it is difficult for users to have a notion of how fast they are approaching safe limits of UV dose (which may be user-selected, as described herein). Thus, it is important that the system provide an estimate of how much time can be safely spent outside current weather conditions.
- the mobile device can provide this information, after the current UV dose has been wirelessly obtained from the wearable device. This time estimate needs to be accurate, because overestimating the time can have serious health consequences for the user, while underestimating the time deprives the user of valuable healthy UV.
- I(t) represents the UV exposure as a function of time.
- UV exposure varies with the solar zenith angle (U.S. Pat. No. 9,068,887) ( ⁇ ), which in turn is a function of time (t) as well as the location.
- FIG. 21 shows the variation of UV index over a typical day. We fit a sinusoidal function to approximate this curve, which is also shown in the figure. This allows us to approximate the UV exposure as:
- the information for these times is readily available for a given location from internet APIs.
- the mobile device has access to both such internet APIs and the location of the device.
- the maximum UV exposure is estimated from the current UV exposure (I current ) by solving for the above equation at the current time (t current ).
- I max I current sin ⁇ ⁇ ⁇ ( t - T subrise ) ( T sunset - T sunrise ) ( Eq . ⁇ 11.3 )
- I current ( t 0 ) a 0 I current ( t 0 )+ a 1 I current ( t 0 ⁇ T )+ a 2 I current ( t 0 ⁇ 2 T )+ . . . + a n I current ( t 0 ⁇ nT ) (Eq.11.4)
- this can be displayed on the mobile device to the user, to inform them of the amount of time that is safe to be spent in the current environmental conditions. If the user is detected to be indoors (e.g., using any of the environmental detection algorithms herein), then the time display can be dismissed and the mobile device can instead inform the user that they are safe from UV radiation.
- FIG. 22 An exemplary computer executable method for estimating the safe amount of time to spend in current UV conditions is shown in FIG. 22 .
- the wearable device sends the values of current exposure ( 1300 ) and current dose ( 1310 ) using its wireless connection to the mobile device.
- the mobile device maintains a first-in-first-out (FIFO) queue ( 1320 ) to cache the past few values of UV exposure. From these values an average current exposure can be estimated (Eq. 11.4).
- the mobile device also looks up the user's pre-selected UV threshold from a database ( 1350 ) which might exist on the device or in the cloud. It also utilizes its internet connection to get sunrise and sunset times from a weather API ( 1360 ).
- the mobile device computes the safe amount of time for the user to spend in current conditions ( 1330 ), by numerically solving Eq. 11.1. This information is then displayed to the user ( 1340 ) using the mobile device's visual interface.
- Systems such as those referenced herein with respect to FIGS. 1-22 enable users to set or choose a daily limit for their UV dose, and may be based on symptoms they have reported. These methods enable them to decide how much UV is tolerable to them based on how they felt. However, if users live in the northern hemisphere and set their daily limit of UV dose during the winter, users may not have experienced any symptom that helps them understand how much UV they can tolerate over a day. As these users transition from winter to spring, they may want to watch carefully their UV dose as they are subject to higher UV exposure.
- Described herein are improved systems and methods that are adapted to visually present to users a particular percentile of the history of their daily UV dose (such as, for example without limitation, 90th percentile of the history of their daily UV dose) over a period of time, such as, for example without limitation, 30 days.
- a particular percentile of the history of their daily UV dose such as, for example without limitation, 90th percentile of the history of their daily UV dose
- a period of time such as, for example without limitation, 30 days.
- the methods herein (which can be performed with one or more algorithms) can thus visually present or indicate to the user a percentile of the history of their daily UV dose.
- Labeling (or visually indicating) the region of UV doses above the 90% percentile (for example) as “dangerous” can be used as a visual cue to help or assist the user set a daily limit for their UV dose, as well as transitioning into higher-UV exposure areas or timeframes. As these users receive an increasing UV dose every day, their skin or immune system is getting used to receiving higher UV doses and the 90th percentile limit shifts up. If they were to experience an adverse event, they can naturally set their daily limit to a number lower.
- FIG. 23 An exemplary system and method for guiding or assisting the user to set their personal limit of UV dose is shown in FIG. 23 directly below.
- the steps shown in FIG. 23 can be performed with one or more algorithms across one or devices (e.g., a hand-held device, a wearable device with one or more sensors, a database).
- the user is visually presented (such as on the display of a hand-held device) with a graph of their UV dose history, based on a pre-selected time step, such as a day or an hour.
- a pre-selected time step such as a day or an hour.
- we take the daily view as an example. This can be, but need not be, visually overlaid with a history of the user's symptoms, to provide a visual correlation of UV exposure to experienced symptoms.
- the system is adapted to further visually present (using any variety of visual indicators such as drawing), on the UV exposure graph, a region indicative of a danger zone (or increased risk of adverse event(s)), corresponding to, in this embodiment, the 90th percentile of their exposure (see FIG. 24 ).
- the entire danger zone region may not be visually filled in with the lines, but rather a horizontal line or other visual indicator could simply be used to indicate where the 90% (or other percent) is on the graph.
- a limit line (“current limit” in FIG. 23 ) is drawn on this graph to indicate the user's current UV dose limit. This user-adjustable dose limit line can be presented and controlled in the same manner as is described herein with reference to FIGS. 1-22 .
- the position of this limit line may be adjusted and the system can be adapted to provide a visual cue (e.g. the limit line can turn a different color), when the selected UV dose limit moves above the 90th percentile (or any other percentile).
- a visual cue e.g. the limit line can turn a different color
- the method shown in FIG. 23 is an exemplary method, and not all of the steps shown necessarily need to be performed. For example, steps 1220 and 1225 related to disease activity could be eliminated from the method, and the method could still visually present information indicative of a calculated percentile of the history of UV dose. Additionally, the order of some steps can be varied and need not be carried out in the exact order as shown.
- FIG. 24 illustrates an exemplary visual presentation on a display of a device, such as a user hand-held device.
- Visual presentation 2400 includes a region 2401 that visually presents a history of UV dose, and optional region 2402 that visually presents information indicative of symptoms (e.g., user entered symptoms, such as in the methods set forth herein).
- Region 2401 visually presents in graph form UV dose over time, and in this embodiment, the dose is broken down per day, as is shown in region 2404 of region 2401 .
- the history of UV dose can be calculated based on information sensed by a UV sensor in a wearable UV sensing device, such as using any of the methods and devices herein.
- Visual presentation 2400 also includes a percentile indicator, which is this embodiment includes percentile limit 2406 (e.g., in this embodiment it indicates the 90 th percentile of dose).
- the percentile indicator also includes region 2407 (in this embodiment is a rectangular region), which can indicate a region of increase risk to the patient. In other embodiments, the percentile indicator could, for example, exclude region 2407 , and could simply be a horizontal line 2406 indicating a percentile of dose. There are a wide variety of ways to visually present the percentile indicator.
- Region 2401 also includes a user-adjustable UV dose threshold interface 2405 , which is adapted to allow the user to interact with the user-adjustable UV dose interface and choose a user-chosen UV dose threshold quantity.
- User-adjustable interface 2405 and alternatives, are described else herein.
- user adjustable interface 2405 can be a slidable line or bar that can be moved up or down on the display by the user, so the user can select (choose) a new UV dose threshold. Prior to being moved by the user, user-adjustable interface 2405 can also indicate a current, or existing, UV dose threshold.
- Symptom region 2402 is optionally displayed, and can indicate symptoms 2411 over time 2410 . Times 2410 can be broken down into the same increments as in region 2401 , which may help a user correlate symptoms and UV dose.
- the history of UV dose is visually presented in graph form, showing UV dose over time.
- the percentile indicator (comprising 2406 and 2407 ) is visually overlaid with the history of UV dose.
- user-adjustable UV dose threshold interface 2405 is visually overlaid with the history of UV dose.
- the method can cause interface 2405 to change visually if interface 2405 is moved to a dose that is at least as high as 2406 .
- zone 2407 could instead be a region that is presented visually as being below 2406 .
- the percentile indicator could then be considered to be indicative of a safer zone, rather than a zone of increased risk as is shown in FIG. 24 .
- FIG. 24 is an example of a computer executable method that visually presents on a display of a user device a percentile indicator indicative of a calculated percentile of a UV dose history that was calculated based on information sensed by a UV sensor in a UV sensing device.
- any of the computer executable methods herein may be performed on a wearable device (which in fact need not be worn, but could simply be placed next to a subject, such as on desk) or on a mobile device, or some parts of the computer executable methods may be performed on a wearable device while some parts are performed on a mobile device.
- a wearable device which in fact need not be worn, but could simply be placed next to a subject, such as on desk
- mobile device or some parts of the computer executable methods may be performed on a wearable device while some parts are performed on a mobile device.
- the specific examples herein are illustrative.
Abstract
Description
UV Index=f(s uvi ,s uva ,s vis)
R B/A =p 0 +p 1 sin ϕ (Eq. 2.1)
I face =I device cos ϕ
6. Real-Time Notification from Wearable Device to Mobile Device using Geo-Fencing
I(θ)=I max cos(θ) (Eq. 7.1)
-
- (i) Minimum daily UV dose (over period of usage of the device)
- (ii) Maximum daily UV dose (over period of usage of the device)
- (iii) Average daily UV dose
- (iv) Symptoms by date
- (v) UV dose history by date
D current+∫t=0 T
where Tsunrise and Tsunset represent the times of sunrise and sunset respectively. The information for these times is readily available for a given location from internet APIs. The mobile device has access to both such internet APIs and the location of the device. The maximum UV exposure is estimated from the current UV exposure (Icurrent) by solving for the above equation at the current time (tcurrent).
I current(t 0)=a 0 I current(t 0)+a 1 I current(t 0 −T)+a 2 I current(t 0−2T)+ . . . +a n I current(t 0 −nT) (Eq.11.4)
Claims (5)
Priority Applications (1)
| Application Number | Priority Date | Filing Date | Title |
|---|---|---|---|
| US15/996,231 US10378953B2 (en) | 2017-06-01 | 2018-06-01 | Methods for guiding personal limit selection in UV dosimetry |
Applications Claiming Priority (2)
| Application Number | Priority Date | Filing Date | Title |
|---|---|---|---|
| US201762513821P | 2017-06-01 | 2017-06-01 | |
| US15/996,231 US10378953B2 (en) | 2017-06-01 | 2018-06-01 | Methods for guiding personal limit selection in UV dosimetry |
Publications (2)
| Publication Number | Publication Date |
|---|---|
| US20190033126A1 US20190033126A1 (en) | 2019-01-31 |
| US10378953B2 true US10378953B2 (en) | 2019-08-13 |
Family
ID=65038274
Family Applications (1)
| Application Number | Title | Priority Date | Filing Date |
|---|---|---|---|
| US15/996,231 Active US10378953B2 (en) | 2017-06-01 | 2018-06-01 | Methods for guiding personal limit selection in UV dosimetry |
Country Status (1)
| Country | Link |
|---|---|
| US (1) | US10378953B2 (en) |
Cited By (1)
| Publication number | Priority date | Publication date | Assignee | Title |
|---|---|---|---|---|
| US11353361B2 (en) | 2018-10-19 | 2022-06-07 | Youv Labs, Inc. | Methods, systems, and apparatuses for accurate measurement of health relevant UV exposure from sunlight |
Families Citing this family (1)
| Publication number | Priority date | Publication date | Assignee | Title |
|---|---|---|---|---|
| CN116672614B (en) * | 2023-06-15 | 2024-02-13 | 广州穗海新峰医疗设备制造股份有限公司 | Ultraviolet treatment system, method and device |
Citations (5)
| Publication number | Priority date | Publication date | Assignee | Title |
|---|---|---|---|---|
| US20100173865A1 (en) * | 2007-04-25 | 2010-07-08 | Jim Klostergaard | Anti-Cancer Agent-Hyaluronic Acid Conjugate Compositions and Methods |
| US20150238774A1 (en) * | 2014-02-26 | 2015-08-27 | Illumicure Inc. | Phototherapy dressing for treating psoriasis |
| US20160363479A1 (en) * | 2013-10-02 | 2016-12-15 | Emmanuel Dumont | Methods, systems, and apparatuses for accurate measurement and real-time feedback of solar ultraviolet exposure |
| US20170225006A1 (en) * | 2016-02-09 | 2017-08-10 | Evan R. Anderson | Methods, compositions and apparatuses for treating psoriasis by phototherapy |
| US20180080818A1 (en) * | 2016-09-19 | 2018-03-22 | Samsung Electronics Co., Ltd. | Electronic device and method for providing information of uv dose thereof |
-
2018
- 2018-06-01 US US15/996,231 patent/US10378953B2/en active Active
Patent Citations (5)
| Publication number | Priority date | Publication date | Assignee | Title |
|---|---|---|---|---|
| US20100173865A1 (en) * | 2007-04-25 | 2010-07-08 | Jim Klostergaard | Anti-Cancer Agent-Hyaluronic Acid Conjugate Compositions and Methods |
| US20160363479A1 (en) * | 2013-10-02 | 2016-12-15 | Emmanuel Dumont | Methods, systems, and apparatuses for accurate measurement and real-time feedback of solar ultraviolet exposure |
| US20150238774A1 (en) * | 2014-02-26 | 2015-08-27 | Illumicure Inc. | Phototherapy dressing for treating psoriasis |
| US20170225006A1 (en) * | 2016-02-09 | 2017-08-10 | Evan R. Anderson | Methods, compositions and apparatuses for treating psoriasis by phototherapy |
| US20180080818A1 (en) * | 2016-09-19 | 2018-03-22 | Samsung Electronics Co., Ltd. | Electronic device and method for providing information of uv dose thereof |
Cited By (2)
| Publication number | Priority date | Publication date | Assignee | Title |
|---|---|---|---|---|
| US11353361B2 (en) | 2018-10-19 | 2022-06-07 | Youv Labs, Inc. | Methods, systems, and apparatuses for accurate measurement of health relevant UV exposure from sunlight |
| US11428572B2 (en) | 2018-10-19 | 2022-08-30 | Youv Labs, Inc. | Methods, systems, and apparatuses for accurate measurement of health relevant UV exposure from sunlight |
Also Published As
| Publication number | Publication date |
|---|---|
| US20190033126A1 (en) | 2019-01-31 |
Similar Documents
| Publication | Publication Date | Title |
|---|---|---|
| US10732034B2 (en) | Methods, systems, and apparatuses for accurate measurement and real-time feedback of solar ultraviolet exposure | |
| US9880052B2 (en) | Methods, systems, and apparatuses for accurate measurement and real-time feedback of solar ultraviolet exposure | |
| US9880725B2 (en) | Methods, systems, and apparatuses for accurate measurement and real-time feedback of solar ultraviolet exposure | |
| US10648858B2 (en) | UV dosimetry system with sensor data correction | |
| US9383256B2 (en) | UV dosimetry system with sensor data correction | |
| US9068887B1 (en) | UV dosimetry system | |
| US10072975B2 (en) | Wearable to monitor exposure to UV radiation | |
| US9933298B2 (en) | Monitoring light exposure using a weighting function and light-monitoring system configured for user communication | |
| US10132680B1 (en) | UV dosimetry and exposure alert | |
| EP2568266A1 (en) | Mobile UV-intensity indicator | |
| US9476765B2 (en) | Ultraviolet monitoring device | |
| KR20200059220A (en) | Light exposure tracking system, device, and method | |
| JP2016529676A (en) | System for sensing user exposure to light | |
| US10378953B2 (en) | Methods for guiding personal limit selection in UV dosimetry | |
| US11118968B1 (en) | UV dosimetry system for measuring vitamin D production |
Legal Events
| Date | Code | Title | Description |
|---|---|---|---|
| FEPP | Fee payment procedure |
Free format text: ENTITY STATUS SET TO UNDISCOUNTED (ORIGINAL EVENT CODE: BIG.); ENTITY STATUS OF PATENT OWNER: SMALL ENTITY |
|
| FEPP | Fee payment procedure |
Free format text: ENTITY STATUS SET TO SMALL (ORIGINAL EVENT CODE: SMAL); ENTITY STATUS OF PATENT OWNER: SMALL ENTITY |
|
| STPP | Information on status: patent application and granting procedure in general |
Free format text: NOTICE OF ALLOWANCE MAILED -- APPLICATION RECEIVED IN OFFICE OF PUBLICATIONS |
|
| AS | Assignment |
Owner name: YOUV LABS, INC., NEW YORK Free format text: ASSIGNMENT OF ASSIGNORS INTEREST;ASSIGNORS:DUMONT, EMMANUEL;BANERJEE, SHAYAK;REEL/FRAME:048998/0241 Effective date: 20190312 |
|
| STPP | Information on status: patent application and granting procedure in general |
Free format text: PUBLICATIONS -- ISSUE FEE PAYMENT RECEIVED |
|
| STPP | Information on status: patent application and granting procedure in general |
Free format text: PUBLICATIONS -- ISSUE FEE PAYMENT VERIFIED |
|
| STCF | Information on status: patent grant |
Free format text: PATENTED CASE |
|
| MAFP | Maintenance fee payment |
Free format text: PAYMENT OF MAINTENANCE FEE, 4TH YR, SMALL ENTITY (ORIGINAL EVENT CODE: M2551); ENTITY STATUS OF PATENT OWNER: SMALL ENTITY Year of fee payment: 4 |