US10145227B2 - Method for estimating permeability of fractured rock formations from induced slow fluid pressure waves - Google Patents
Method for estimating permeability of fractured rock formations from induced slow fluid pressure waves Download PDFInfo
- Publication number
- US10145227B2 US10145227B2 US15/224,046 US201615224046A US10145227B2 US 10145227 B2 US10145227 B2 US 10145227B2 US 201615224046 A US201615224046 A US 201615224046A US 10145227 B2 US10145227 B2 US 10145227B2
- Authority
- US
- United States
- Prior art keywords
- fluid
- wave
- borehole
- permeability
- imaging
- Prior art date
- Legal status (The legal status is an assumption and is not a legal conclusion. Google has not performed a legal analysis and makes no representation as to the accuracy of the status listed.)
- Active, expires
Links
- 239000012530 fluid Substances 0.000 title claims abstract description 71
- 239000011435 rock Substances 0.000 title claims abstract description 71
- 230000035699 permeability Effects 0.000 title claims abstract description 54
- 238000000034 method Methods 0.000 title claims abstract description 38
- 230000015572 biosynthetic process Effects 0.000 title claims abstract description 30
- 238000005755 formation reaction Methods 0.000 title abstract description 21
- 238000003384 imaging method Methods 0.000 claims abstract description 36
- LYCAIKOWRPUZTN-UHFFFAOYSA-N Ethylene glycol Chemical compound OCCO LYCAIKOWRPUZTN-UHFFFAOYSA-N 0.000 claims description 12
- KFZMGEQAYNKOFK-UHFFFAOYSA-N Isopropanol Chemical compound CC(C)O KFZMGEQAYNKOFK-UHFFFAOYSA-N 0.000 claims description 12
- 239000007788 liquid Substances 0.000 claims description 10
- 239000002002 slurry Substances 0.000 claims description 7
- 238000003325 tomography Methods 0.000 claims description 7
- -1 two-butoxyethanol Substances 0.000 claims description 6
- XLYOFNOQVPJJNP-UHFFFAOYSA-N water Substances O XLYOFNOQVPJJNP-UHFFFAOYSA-N 0.000 claims description 5
- 238000002347 injection Methods 0.000 claims description 4
- 239000007924 injection Substances 0.000 claims description 4
- 238000004458 analytical method Methods 0.000 abstract description 7
- 230000001052 transient effect Effects 0.000 abstract description 4
- 238000012360 testing method Methods 0.000 abstract description 3
- 239000007789 gas Substances 0.000 description 12
- VNWKTOKETHGBQD-UHFFFAOYSA-N methane Chemical compound C VNWKTOKETHGBQD-UHFFFAOYSA-N 0.000 description 12
- 230000006870 function Effects 0.000 description 10
- 239000006185 dispersion Substances 0.000 description 7
- 230000008901 benefit Effects 0.000 description 6
- IJGRMHOSHXDMSA-UHFFFAOYSA-N Atomic nitrogen Chemical compound N#N IJGRMHOSHXDMSA-UHFFFAOYSA-N 0.000 description 4
- CURLTUGMZLYLDI-UHFFFAOYSA-N Carbon dioxide Chemical compound O=C=O CURLTUGMZLYLDI-UHFFFAOYSA-N 0.000 description 4
- 238000012986 modification Methods 0.000 description 4
- 230000004048 modification Effects 0.000 description 4
- 229920006395 saturated elastomer Polymers 0.000 description 4
- 239000000203 mixture Substances 0.000 description 3
- 230000008569 process Effects 0.000 description 3
- 239000011343 solid material Substances 0.000 description 3
- 239000000243 solution Substances 0.000 description 3
- 230000006399 behavior Effects 0.000 description 2
- 238000004364 calculation method Methods 0.000 description 2
- 239000001569 carbon dioxide Substances 0.000 description 2
- 229910002092 carbon dioxide Inorganic materials 0.000 description 2
- 238000004891 communication Methods 0.000 description 2
- 229910052500 inorganic mineral Inorganic materials 0.000 description 2
- 238000005259 measurement Methods 0.000 description 2
- 239000011707 mineral Substances 0.000 description 2
- 229910052757 nitrogen Inorganic materials 0.000 description 2
- 230000003287 optical effect Effects 0.000 description 2
- 238000012545 processing Methods 0.000 description 2
- 239000003380 propellant Substances 0.000 description 2
- 239000013049 sediment Substances 0.000 description 2
- 239000002689 soil Substances 0.000 description 2
- 230000000638 stimulation Effects 0.000 description 2
- 235000015076 Shorea robusta Nutrition 0.000 description 1
- 244000166071 Shorea robusta Species 0.000 description 1
- 230000001133 acceleration Effects 0.000 description 1
- 239000003570 air Substances 0.000 description 1
- QVGXLLKOCUKJST-UHFFFAOYSA-N atomic oxygen Chemical compound [O] QVGXLLKOCUKJST-UHFFFAOYSA-N 0.000 description 1
- 230000002146 bilateral effect Effects 0.000 description 1
- 229910052799 carbon Inorganic materials 0.000 description 1
- 238000010276 construction Methods 0.000 description 1
- 238000013500 data storage Methods 0.000 description 1
- 230000001419 dependent effect Effects 0.000 description 1
- 238000009792 diffusion process Methods 0.000 description 1
- 238000009826 distribution Methods 0.000 description 1
- 238000003708 edge detection Methods 0.000 description 1
- 238000005516 engineering process Methods 0.000 description 1
- 238000001914 filtration Methods 0.000 description 1
- 230000008014 freezing Effects 0.000 description 1
- 238000007710 freezing Methods 0.000 description 1
- 230000002706 hydrostatic effect Effects 0.000 description 1
- 238000003709 image segmentation Methods 0.000 description 1
- 238000009434 installation Methods 0.000 description 1
- 238000004519 manufacturing process Methods 0.000 description 1
- 238000013507 mapping Methods 0.000 description 1
- 239000000463 material Substances 0.000 description 1
- 239000011159 matrix material Substances 0.000 description 1
- 230000007246 mechanism Effects 0.000 description 1
- 238000012544 monitoring process Methods 0.000 description 1
- 239000003345 natural gas Substances 0.000 description 1
- 230000010355 oscillation Effects 0.000 description 1
- 229910052760 oxygen Inorganic materials 0.000 description 1
- 239000001301 oxygen Substances 0.000 description 1
- 230000010363 phase shift Effects 0.000 description 1
- 239000011148 porous material Substances 0.000 description 1
- 238000005086 pumping Methods 0.000 description 1
- 239000010453 quartz Substances 0.000 description 1
- VYPSYNLAJGMNEJ-UHFFFAOYSA-N silicon dioxide Inorganic materials O=[Si]=O VYPSYNLAJGMNEJ-UHFFFAOYSA-N 0.000 description 1
- 238000006467 substitution reaction Methods 0.000 description 1
- 230000000007 visual effect Effects 0.000 description 1
Images


Classifications
-
- E—FIXED CONSTRUCTIONS
- E21—EARTH DRILLING; MINING
- E21B—EARTH DRILLING, e.g. DEEP DRILLING; OBTAINING OIL, GAS, WATER, SOLUBLE OR MELTABLE MATERIALS OR A SLURRY OF MINERALS FROM WELLS
- E21B49/00—Testing the nature of borehole walls; Formation testing; Methods or apparatus for obtaining samples of soil or well fluids, specially adapted to earth drilling or wells
- E21B49/008—Testing the nature of borehole walls; Formation testing; Methods or apparatus for obtaining samples of soil or well fluids, specially adapted to earth drilling or wells by injection test; by analysing pressure variations in an injection or production test, e.g. for estimating the skin factor
-
- E—FIXED CONSTRUCTIONS
- E21—EARTH DRILLING; MINING
- E21B—EARTH DRILLING, e.g. DEEP DRILLING; OBTAINING OIL, GAS, WATER, SOLUBLE OR MELTABLE MATERIALS OR A SLURRY OF MINERALS FROM WELLS
- E21B43/00—Methods or apparatus for obtaining oil, gas, water, soluble or meltable materials or a slurry of minerals from wells
- E21B43/25—Methods for stimulating production
- E21B43/26—Methods for stimulating production by forming crevices or fractures
-
- E—FIXED CONSTRUCTIONS
- E21—EARTH DRILLING; MINING
- E21B—EARTH DRILLING, e.g. DEEP DRILLING; OBTAINING OIL, GAS, WATER, SOLUBLE OR MELTABLE MATERIALS OR A SLURRY OF MINERALS FROM WELLS
- E21B49/00—Testing the nature of borehole walls; Formation testing; Methods or apparatus for obtaining samples of soil or well fluids, specially adapted to earth drilling or wells
-
- G—PHYSICS
- G01—MEASURING; TESTING
- G01V—GEOPHYSICS; GRAVITATIONAL MEASUREMENTS; DETECTING MASSES OR OBJECTS; TAGS
- G01V1/00—Seismology; Seismic or acoustic prospecting or detecting
- G01V1/28—Processing seismic data, e.g. analysis, for interpretation, for correction
- G01V1/30—Analysis
- G01V1/306—Analysis for determining physical properties of the subsurface, e.g. impedance, porosity or attenuation profiles
-
- G—PHYSICS
- G01—MEASURING; TESTING
- G01V—GEOPHYSICS; GRAVITATIONAL MEASUREMENTS; DETECTING MASSES OR OBJECTS; TAGS
- G01V2210/00—Details of seismic processing or analysis
- G01V2210/10—Aspects of acoustic signal generation or detection
- G01V2210/12—Signal generation
- G01V2210/123—Passive source, e.g. microseismics
- G01V2210/1234—Hydrocarbon reservoir, e.g. spontaneous or induced fracturing
-
- G—PHYSICS
- G01—MEASURING; TESTING
- G01V—GEOPHYSICS; GRAVITATIONAL MEASUREMENTS; DETECTING MASSES OR OBJECTS; TAGS
- G01V2210/00—Details of seismic processing or analysis
- G01V2210/60—Analysis
- G01V2210/62—Physical property of subsurface
- G01V2210/624—Reservoir parameters
- G01V2210/6246—Permeability
Definitions
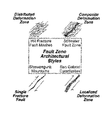
- the present invention relates generally to geophysical exploration. More particularly, the present invention relates to a method for estimating the permeability of the transmissive fracture network of fractured rock formations from the analysis of a slow fluid pressure wave, which is generated by pressurization of a borehole and imaged with TFITM.
- FIG. 1A is a map view of a Tomographic Fracture Image (TFITM) of a space-filling fracture network at the reservoir scale.
- TFITM Tomographic Fracture Image
- FIG. 1B illustrates a graphical view of localized zones with relatively high permeability.
- Reservoir-scale permeability is an extremely difficult parameter to measure in the deep subsurface.
- Rock core permeabilities are not representative of the permeabilities of the reservoir-scale fracture networks, which typically exceed the matrix permeability of the cores by orders of magnitude.
- Pumping tests e.g., pressure transient analysis (PTA)
- PTA pressure transient analysis
- TFITM processes passive seismic data from buried and surface based seismic networks via Seismic Emission Tomography (SET).
- SET Seismic Emission Tomography
- TFITM can be used to image directly the dynamic behavior of fracture/fault systems at scales ranging from 10 meters to kilometers. Therefore TFITM generates five dimensional (5D) semblance data, i.e., the 3D position, time, and seismic energy.
- 5D five dimensional
- the foregoing needs are met, to a great extent, by the present invention which provides a method of estimating permeability of fractured rock formations.
- the method includes generating a Pf wave in a perforated portion of a borehole within the rock formation for the purpose of permeability determination for the fractured rock formation.
- the method also includes imaging of the Pf wave with TFITM and analyzing TFITM data in order to determine the transmissive fracture network, in which the Pf wave propagates as well as the front position of the Pf wave as a function of time within this network.
- the method includes analyzing the front position data in order to determine the speed of the Pf wave as a function of 3D position over time within the rock formation.
- the method also includes using poroelastic theory to estimate the 3D permeability field from the 3D field for the Pf wave speed.
- the present disclosure provides a method of estimating permeability of a rock formation that includes the steps of generating, by a signal generator, a pressure (Pf) wave in a perforated portion of a borehole within the rock formation; imaging, by an imaging device, the Pf wave to produce imaging data; analyzing, by a controller, the imaging data to identify a front position of the Pf wave as a function of time and to formulate a transmissive fracture network in which the Pf wave propagates; determining the speed of the Pf wave as a function of three dimensional (3D) position within the rock formation based on the front position data; and establishing an estimated 3D permeability field from the 3D field for the Pf wave speed using poroelastic theory.
- Pf pressure
- the imaging device is a Tomographic Fracture Imaging (“TFITM”) device or a Seismic Emission Tomography (SET) device.
- TFITM Tomographic Fracture Imaging
- SET Seismic Emission Tomography
- the TFITM device comprises a surface array or a sub-surface array.
- the surface array is a beam forming surface array.
- the sub-surface array is positioned 1-10 meters below the surface.
- the poroelastic theory is Biot's theory.
- FIGS. 1A-1B illustrate a map view image of a space-filling fracture network that has been imaged with TFITM and a graphical view of localized zones with relatively high permeability that could appear in fault zones, respectively.
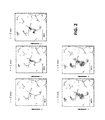
- FIG. 2 shows a series of map view TFITM images of a Pf wave in the Barnett Shale.
- the five map views show the semblance for five different times.
- the gray-scale stands for the magnitude of semblance, with black and white indicating high and low values.
- the images show that the Pf wave travels about 5,000 ft in 3 minutes, which corresponds roughly to a velocity of 6.3 m/s.
- FIGS. 3A-3E illustrate graphical views of how TFITM data is processed in order to determine the permeability of the transmissive fracture network.
- FIG. 3A illustrates that first the entire ambient fracture network is mapped by processing passive seismic data with TFITM. Shown here are the central surfaces of the fracture network.
- FIG. 3B illustrates that the transmissive fracture network is then illuminated by increasing the borehole pressure, which induces a Pf wave. The recorded 5D semblance data is used to determine the arrival times of the Pf wave front in the fractures. Only fractures that form the transmissive fracture network are shown. The color of a fracture indicates the travel time of the Pf wave.
- FIG. 3C illustrates that from the travel time field, the velocity of the Pf wave is calculated.
- FIG. 3A illustrates that first the entire ambient fracture network is mapped by processing passive seismic data with TFITM. Shown here are the central surfaces of the fracture network.
- FIG. 3B illustrates that the transmissive fracture network is then illuminated by increasing the
- FIG. 4 illustrates graphical views of the bottom borehole pressure p b and flow rate as a function of time as observed during hydraulic fracturing.
- FIG. 5 illustrates a graphical view of the dependence of the group velocity on permeability, which was calculated from Biot's theory for poro-elastic media.
- the present invention is based, at least in part, on the discovery that the permeability of reservoir scale (e.g., about 1-10 km in size) geological features and/or transmissive fractures/faults may be estimated by using a signal generator to produce a slow fluid wave that emanates omni-directionally from the signal generator, imaging the slow fluid wave in three dimensions using a geological imaging device/technique (e.g., TFITM), identifying the wave front of the slow fluid wave in three dimensions, calculating the velocity of the wave front in all three dimensions as the slow fluid wave moves outwardly through the geological features and/or transmissive fractures/faults, and analyzing the wave front velocity in three dimensions with a poroelastic theory (e.g., Biot's theory) to calculate permeabilities throughout the geological feature.
- a poroelastic theory e.g., Biot's theory
- TFITM Tomographic Fracture Imaging
- SET Seismic Emission Tomography
- empirical data on fracture geometry e.g. naturally occurring fracture networks, induced fracture networks, and the like.
- SET is a technique that may identify sources of seismic energy contained within the volume of the geological feature (e.g. a reservoir) being imaged as described in, for example, U.S. Pat. No. 9,389,326 (incorporated herein by reference in its entirety).
- the seismic energy may be recorded by a sensor array (e.g., a beam forming surface array) and collected and processed to provide a three dimensional (3D) grid of voxels.
- the seismic data for TFITM may be collected by a surface array, which enables it to be used to map fracture networks at both the well and reservoir level scale with a high level of resolution. It is also contemplated within the scope of the invention that the seismic data for TFITM may be collected by a shallow sub-surface sensor array (e.g., a sensor array that has been buried below the surface). In an exemplary embodiment, such a sub-surface sensor array may be positioned 1-100 meters below the surface, or in some cases even deeper.
- An embodiment in accordance with the present invention includes a method for estimating the permeability of fractured rock formations from the analysis of a slow fluid pressure wave, which may be generated by pressurization of a borehole.
- borehole pressurization may be used as a signal generator to create the slow fluid pressure wave.
- a borehole may be pressurized by injecting any fluid such as, for example, water, isopropyl alcohol, two-butoxyethanol, ethylene glycol, liquid nitrogen, or a slurry. It is also contemplated within the scope of the invention that a borehole may be pressurized by injecting a supercritical fluid such as, for example, supercritical carbon dioxide.
- a borehole may be pressurized with a gas such as, for example, atmospheric air, oxygen, nitrogen, carbon dioxide, and the like.
- the specific signal generator may be matched to the geological composition of the reservoir being analyzed.
- the signal generator may be a gas in the case of a reservoir composed primarily of a gas such as natural gas or methane, while the signal generator may be a fluid or a supercritical fluid for a reservoir composed primarily of a liquid such as, for example, oil.
- matching the type of signal generator to the geological composition of the reservoir being analyzed may increase the quality and/or resolution of the data that results from the imaging of the Pf wave.
- Wave propagation in the rock may be recorded with an imaging technique (such as, e.g., TFITM, SET, and the like) or a pressure monitoring technique (such as, e.g., direct measurement of pore fluid pressure with a pressure sensor deployed into a preexisting or newly drilled borehole).
- Poroelastic theory may then be used to estimate the permeability of the fractured rock formations from the measured wave speed.
- the present invention makes it possible to measure the permeability of fractured rock at reservoir-scale because the imaged pressure wave is able to propagate through a large rock volume, on the order of kilometers in size (e.g., 1-10 km). This is in stark contrast to traditional methods, which yield permeability measurements for much smaller rock volumes.
- the signal generator may be, for example, fluid pumped into an existing borehole to allow assessment of permeability of an undisturbed reservoir (e.g., a natural reservoir that has not been subjected to artificial fracturing), or an artificially fractured reservoir (e.g., a natural reservoir that has been subjected to hydraulic fracturing, propellant fracking, or other rock stimulation methods).
- an undisturbed reservoir e.g., a natural reservoir that has not been subjected to artificial fracturing
- an artificially fractured reservoir e.g., a natural reservoir that has been subjected to hydraulic fracturing, propellant fracking, or other rock stimulation methods.
- the signal generator may be, for example, a slurry used during the process of hydraulic fracturing so that the permeability of an exemplary reservoir may be assessed at the same time that it is subject to fracturing.
- the present invention provides an explanation of the physical mechanisms that give rise to the Pf wave, and demonstrates that this physical understanding may be used to estimate the permeability of the transmissive fracture network.
- several field data sets show Pf waves observed via TFITM, and the Pf wave corresponds to Biot's Slow Wave.
- the Biot theory may be used to estimate the permeability of the fracture networks in which the Pf waves were observed.
- FIG. 2 illustrates graphical views of Pf wave in the Barnett Shale. The plots suggest that the wave travels about 5,000 ft in 3 minutes, which corresponds roughly to a velocity of 6.3 m/s.
- the method of the present invention includes several steps for deriving/estimating subsurface formation permeability.
- One step includes creation of a 3D model for seismic velocity of the rock formation under consideration.
- the velocity model can be constructed from sonic logs, geological models, Vertical Seismic Profiles (VSPs), crosswell tomography, seismic tomography, and the like.
- Another step may include installation of a surface or buried seismic array for TFITM at the field site. Collection of passive-seismic data with the seismic array may be used to image the preexisting fracture system.
- the passive seismic data may be processed via TFITM in order to create a 3D image of the seismically active fracture system.
- FIG. 3A illustrates a graphical view of an ambient fracture network that has been mapped by processing passive seismic data with TFITM.
- a well may be drilled into the imaged rock formation, for which a permeability estimate is sought.
- the well may be vertically oriented. Due to the attenuation of the Pf wave, it is preferable that the well be located in the center of the formation such that sufficiently high pressure perturbations can be created everywhere within the geological domain of interest.
- Fluid may be injected into the borehole for some period of time at a rate such that the bottom borehole pressure increases substantially.
- the rock formation is imaged with TFITM in order to determine the fracture system that is stimulated by the generated pressure wave.
- TFITM is disclosed herein as an exemplary imaging modality, any suitable imaging system known to or conceivable by one of skill in the art could also be used.
- the bottom borehole fluid pressure p b is recorded as a function of time t in order to characterize the transient behavior of the source of the Pf wave.
- other variables e.g., acceleration
- FIG. 4 illustrates graphical views of borehole pressure data shows typical bottom borehole pressure data that is obtained when a slurry is injected into the well for the purposes of hydraulic fracturing.
- the seismic data is processed via TFITM in order to achieve 5D semblance data that describes the propagation of the induced pressure disturbance.
- the recorded 5D semblance data is used to determine the arrival time of the Pf wave front at the central surfaces of the transmissive fracture network.
- the data likely first need to be denoised (e.g. using anisotropic diffusion filtering), and then the front will be highlighted (e.g., using edge detection or image segmentation).
- FIG. 3B illustrates a graphical view of the transmissive fracture network which is illuminated by increasing the borehole pressure.
- FIG. 3C illustrates a graphical view of the velocity field of the Pf wave.
- 5D semblance data from the passive seismic imaging is used to identify the permeable zones around the central surfaces.
- the rock volume in these zones contains the dominant flow paths and forms the transmissive fracture network.
- FIG. 3D illustrates a graphical view of the 5D semblance data from the passive seismic imaging that is used to identify the permeable zones around the major fractures.
- Poroelastic theory according to Biot is used to estimate the permeability of the transmissive fracture network, k.
- Biot developed a theory in order to describe the propagation of elastic waves in fluid-saturated porous media.
- the Biot theory has been modified using the notation introduced by Stoll and Kan (R. D. Stoll and T. K. Kan. Reflection of acoustic waves at a water-sediment interface. Journal of the Acoustical Society of America, 70: 149-156, 1981) and Stoll (R. D. Stoll. Sediment Acoustics. Springer-Verlag, New York, 1989) to model parameters directly related to typical rock properties.
- Stoll and Kan R. D. Stoll and T. K. Kan. Reflection of acoustic waves at a water-sediment interface. Journal of the Acoustical Society of America, 70: 149-156, 1981
- Stoll R. D. Stoll. Sediment Acoustics. Springer-Verlag, New York, 1989
- H, C and M depend on the following 11 parameters: 1. the porosity of the rock, ⁇ [ ⁇ ]; 2. the dynamic viscosity of the fluid, ⁇ [kg ⁇ m ⁇ 1 s ⁇ 1 ]; 3. the total mass density of the fluid-saturated porous medium, ⁇ [kg m ⁇ 3 ]; 4. the density of the fluid, ⁇ f [kg m ⁇ 3 ]; 5. the permeability of the fractured rock, k [m 2 ]; 6. the shear modulus of the rock, ⁇ [m 2 ]; 7.
- T ⁇ ( ⁇ ) ber ′ ⁇ ( ⁇ ) + i ⁇ ⁇ bei ′ ⁇ ( ⁇ ) ber ⁇ ( ⁇ ) + ibei ⁇ ( ⁇ ) ( 17 ) is a nondimensional function
- Equation (15) can be used to determine the dispersion relation between the complex wave number 1 and the real angular frequency ⁇ . This dispersion relation allows one to calculate the phase velocity and the attenuation of a harmonic wave. Equation (15) can be written as a fourth-order polynomial in 1:
- the two ⁇ values correspond to Biot's first and second compressional wave. They have different phase velocities and attenuation coefficients.
- the complex wave number is obtained by taking the square root of each ⁇ value.
- the velocity of a localized wave package which is characterized by a dominant frequency ⁇ c.
- this dominant frequency changes with time t, because the different harmonics which make up a wave package die out at different rates.
- the group velocity d ⁇ /dl as defined for the case without attenuation becomes complex, because 1 is complex.
- the real and imaginary parts of the group velocity can be related to the position of the spatial maximum of the wave package,
- Typical values of reservoir pressures range from 20 to 50 MPa; therefore, a gas pressure of 20 MPa may be assumed.
- the reservoir pressure may be estimated by assuming a hydrostatic pressure distribution in the subsurface, in which case a pressure of 20 MPa corresponds roughly to a reservoir depth of 2 km. It may further be assumed that the reservoir temperature may be calculated from the geothermal gradient (e.g., 22.1° C. per km of depth) and that the ground surface has a temperature of 20° C., then the reservoir temperature is about 64° C.
- the bulk modulus is also the inverse of the compressibility.
- K r [Pa] is the bulk modulus of the solid material that makes up the rock that differs from the bulk modulus of the porous/fractured rock. Note that the bulk modulus is also the inverse of the compressibility.
- Jizba see e.g., D. L. Jizba. Mechanical and acoustical properties of sandstones and shales. PhD thesis, Stanford University, 1991.
- the bulk modulus of room-dry shale cores varies between 15 and 35 GPa.
- Latief and Fauzi F. D. E. Latief and U. Fauzi.
- Biot theory is used to calculate the dispersion relation for Biot's slow wave, i.e., the dependence of the complex wave number on ⁇ .
- the dominant frequency ⁇ c of the signal generator is determined by Fourier analysis of the bottom hole pressure p b (t), or from other variables that characterize the generator/source strength. Using the dispersion relation one can then calculate the corresponding wave number 1 c .
- the velocity of the Pf wave is estimated by the group velocity for a package of harmonic slow waves that is characterized by a
- FIG. 5 illustrates a graphical view of the dependence of the group velocity on permeability.
- the speed of the Pf wave, c g , in the 3D rock volume of the transmissive fracture network is used to calculate the permeability k in the same rock volume. This is done by determining at each point k(c g ) where the latter function is obtained by numerically inverting c g (k) from Equation (25).
- FIG. 3E illustrates a graphical view of the calculated permeability field.
- control unit may refer to a hardware device that includes a memory and a processor.
- the memory is configured to store program instructions, and the processor is specifically programmed to execute the program instructions to perform one or more processes which are described further below.
- the above methods may be executed by an apparatus comprising the control unit in conjunction with one or more other components, as would be appreciated by a person of ordinary skill in the art.
- control unit of the present disclosure may be embodied as non-transitory computer readable media containing executable program instructions executed by a processor, controller or the like.
- Examples of the computer readable mediums include, but are not limited to, ROM, RAM, compact disc (CD)-ROMs, magnetic tapes, floppy disks, flash drives, smart cards and optical data storage devices.
- the computer readable recording medium can also be distributed throughout a computer network so that the program instructions are stored and executed in a distributed fashion, e.g., by a telematics server or a Controller Area Network (CAN).
- a telematics server or a Controller Area Network (CAN).
- CAN Controller Area Network
- the steps and analysis of the present invention can be carried out using a computer, non-transitory computer readable medium, or alternately a computing device or non-transitory computer readable medium incorporated into an imaging device.
- a computer non-transitory computer readable medium
- any suitable method of calculation known to or conceivable by one of skill in the art could be used.
- a non-transitory computer readable medium is understood to mean any article of manufacture that can be read by a computer.
- non-transitory computer readable media includes, but is not limited to, magnetic media, such as a floppy disk, flexible disk, hard disk, reel-to-reel tape, cartridge tape, cassette tape or cards, optical media such as CD-ROM, writable compact disc, magneto-optical media in disc, tape or card form, and paper media, such as punched cards and paper tape.
- the computing device can be a special computer designed specifically for this purpose.
- the computing device can be unique to the present invention and designed specifically to carry out the method of the present invention.
- the computing device can also take the form of an operating console computer for the imaging device.
- the operating console is a non-generic computer specifically designed by the scanner manufacturer for bilateral (input output) communication with the scanner. It is not a standard business or personal computer that can be purchased at a local store. Additionally this console computer carries out communications with the scanner through the execution of proprietary custom built software that is designed and written by the scanner manufacturer for the computer hardware to specifically operate the scanner hardware.
Landscapes
- Life Sciences & Earth Sciences (AREA)
- Engineering & Computer Science (AREA)
- Geology (AREA)
- Physics & Mathematics (AREA)
- Mining & Mineral Resources (AREA)
- Environmental & Geological Engineering (AREA)
- General Life Sciences & Earth Sciences (AREA)
- Remote Sensing (AREA)
- Geochemistry & Mineralogy (AREA)
- Fluid Mechanics (AREA)
- Acoustics & Sound (AREA)
- General Physics & Mathematics (AREA)
- Geophysics (AREA)
- Chemical & Material Sciences (AREA)
- Analytical Chemistry (AREA)
- Geophysics And Detection Of Objects (AREA)
Abstract
An embodiment in accordance with the present invention includes a method for estimating the permeability of fractured rock formations from the analysis of a slow fluid pressure wave, which is generated by pressurization of a borehole. Wave propagation in the rock is recorded with TFI™. Poroelastic theory is used to estimate the permeability from the measured wave speed. The present invention offers the opportunity of measuring the reservoir-scale permeability of fractured rock, because the method relies on imaging a wave, which propagates through a large rock volume, on the order of kilometers in size. Traditional methods yield permeability for much smaller rock volumes: well logging tools only measure permeability in the vicinity of a borehole. Pressure transient testing accesses larger rock volumes; however, these volumes are much smaller than for the proposed method, particularly in low-permeability rock formations.
Description
This application claims the benefit of priority under 35 U.S.C. § 119(e) to U.S. Provisional Application No. 62/199,290, filed on Jul. 31, 2015 and entitled, “Method for Estimating Permeability of Fractured Rock Formations from Induced Slow Fluid Pressure Waves”, which is incorporated herein by reference in its entirety.
The present invention relates generally to geophysical exploration. More particularly, the present invention relates to a method for estimating the permeability of the transmissive fracture network of fractured rock formations from the analysis of a slow fluid pressure wave, which is generated by pressurization of a borehole and imaged with TFI™.
Rock permeability is one, if not the most, important parameter to know when it comes to understanding natural and engineered flows in the permeable subsurface. Likewise it is crucial to quantify changes in rock permeability, e.g., due to reservoir stimulation through hydraulic or propellant fracturing. Permeability fields in fractured rock are highly heterogeneous with most of the flow concentrated on transmissive fracture networks. Nonetheless fractures can be rather space-filling, and therefore the transmissive fracture network which predominantly participates in subsurface flow can be rather space filling too. FIG. 1A is a map view of a Tomographic Fracture Image (TFI™) of a space-filling fracture network at the reservoir scale. However, it is also possible that there are localized conduits for fluid flow, which can, for example, be linked to fault zones. FIG. 1B illustrates a graphical view of localized zones with relatively high permeability.
Reservoir-scale permeability is an extremely difficult parameter to measure in the deep subsurface. Rock core permeabilities are not representative of the permeabilities of the reservoir-scale fracture networks, which typically exceed the matrix permeability of the cores by orders of magnitude. Pumping tests [e.g., pressure transient analysis (PTA)], in which fluid is injected or withdrawn from a well while changes in borehole pressure are monitored, are not reliable for the low permeabilities often encountered at depth or yield a permeability that is representative only for a small rock volume in the vicinity of the borehole.
Recent advances in rock imaging technology now allow not only mapping the fracture network in the deep subsurface but also identifying dominant flow paths associated with transmissive fracture/fault systems. This is possible through the usage of TFI™, which processes passive seismic data from buried and surface based seismic networks via Seismic Emission Tomography (SET). TFI™ can be used to image directly the dynamic behavior of fracture/fault systems at scales ranging from 10 meters to kilometers. Therefore TFI™ generates five dimensional (5D) semblance data, i.e., the 3D position, time, and seismic energy. TFI™ has, for example, been used to monitor fracture growth during hydraulic fracturing.
Using TFI™, it has been possible to observe slow fluid pressure waves induced by pressurization of a borehole due to the injection of slurries. These so-called Pf waves propagate with a speed on the order of 10 m/s through the transmissive fracture/fault network. The rock domain, which the Pf wave excites, is associated with high-permeability zones within the transmissive fracture network. Due to the small velocity of the Pf waves, it is clear that they are not regular compressional or shear waves, which in natural subsurface environments have velocities on the order of one thousand m/s (e.g., 500 m/s; 1,000 m/s; 2,000 m/s; etc.). So far, a theoretical explanation for the Pf wave has not been provided. Therefore, it is currently not possible to determine rock parameters from the measured speed and attenuation of the Pf wave.
Accordingly, there is a need in the art for a method to estimate the permeability of fractured rock formations from the analysis of a slow fluid pressure wave.
The foregoing needs are met, to a great extent, by the present invention which provides a method of estimating permeability of fractured rock formations. The method includes generating a Pf wave in a perforated portion of a borehole within the rock formation for the purpose of permeability determination for the fractured rock formation. The method also includes imaging of the Pf wave with TFI™ and analyzing TFI™ data in order to determine the transmissive fracture network, in which the Pf wave propagates as well as the front position of the Pf wave as a function of time within this network. The method includes analyzing the front position data in order to determine the speed of the Pf wave as a function of 3D position over time within the rock formation. The method also includes using poroelastic theory to estimate the 3D permeability field from the 3D field for the Pf wave speed.
In one aspect, the present disclosure provides a method of estimating permeability of a rock formation that includes the steps of generating, by a signal generator, a pressure (Pf) wave in a perforated portion of a borehole within the rock formation; imaging, by an imaging device, the Pf wave to produce imaging data; analyzing, by a controller, the imaging data to identify a front position of the Pf wave as a function of time and to formulate a transmissive fracture network in which the Pf wave propagates; determining the speed of the Pf wave as a function of three dimensional (3D) position within the rock formation based on the front position data; and establishing an estimated 3D permeability field from the 3D field for the Pf wave speed using poroelastic theory.
In one embodiment, the signal generator is borehole pressurization. In one embodiment, the borehole pressurization results from injection of a liquid, a gas, or a supercritical fluid into the borehole. In one embodiment, the liquid is selected from the group consisting of water, isopropyl alcohol, two-butoxyethanol, ethylene glycol, and a slurry.
In one embodiment, the imaging device is a Tomographic Fracture Imaging (“TFI™”) device or a Seismic Emission Tomography (SET) device. In one embodiment, the TFI™ device comprises a surface array or a sub-surface array. In one embodiment, the surface array is a beam forming surface array. In one embodiment, the sub-surface array is positioned 1-10 meters below the surface. In one embodiment, the poroelastic theory is Biot's theory.
The accompanying drawings provide visual representations, which will be used to more fully describe the representative embodiments disclosed herein and can be used by those skilled in the art to better understand them and their inherent advantages. In these drawings, like reference numerals identify corresponding elements and:
The presently disclosed subject matter now will be described more fully hereinafter with reference to the accompanying Drawings, in which some, but not all embodiments of the inventions are shown. Like numbers refer to like elements throughout. The presently disclosed subject matter may be embodied in many different forms and should not be construed as limited to the embodiments set forth herein; rather, these embodiments are provided so that this disclosure will satisfy applicable legal requirements. Indeed, many modifications and other embodiments of the presently disclosed subject matter set forth herein will come to mind to one skilled in the art to which the presently disclosed subject matter pertains having the benefit of the teachings presented in the foregoing descriptions and the associated Drawings. Therefore, it is to be understood that the presently disclosed subject matter is not to be limited to the specific embodiments disclosed and that modifications and other embodiments are intended to be included within the scope of the appended claims.
The present invention is based, at least in part, on the discovery that the permeability of reservoir scale (e.g., about 1-10 km in size) geological features and/or transmissive fractures/faults may be estimated by using a signal generator to produce a slow fluid wave that emanates omni-directionally from the signal generator, imaging the slow fluid wave in three dimensions using a geological imaging device/technique (e.g., TFI™), identifying the wave front of the slow fluid wave in three dimensions, calculating the velocity of the wave front in all three dimensions as the slow fluid wave moves outwardly through the geological features and/or transmissive fractures/faults, and analyzing the wave front velocity in three dimensions with a poroelastic theory (e.g., Biot's theory) to calculate permeabilities throughout the geological feature.
Tomographic Fracture Imaging (“TFI™”) is an imaging method that combines Seismic Emission Tomography (SET) with empirical data on fracture geometry to directly image geological fracture networks (e.g. naturally occurring fracture networks, induced fracture networks, and the like). SET is a technique that may identify sources of seismic energy contained within the volume of the geological feature (e.g. a reservoir) being imaged as described in, for example, U.S. Pat. No. 9,389,326 (incorporated herein by reference in its entirety). The seismic energy may be recorded by a sensor array (e.g., a beam forming surface array) and collected and processed to provide a three dimensional (3D) grid of voxels. The semblance value for the seismic energy associated with each voxel may then be calculated and assigned to a node point and then color contoured for semblance value. Advantageously, the seismic data for TFI™ may be collected by a surface array, which enables it to be used to map fracture networks at both the well and reservoir level scale with a high level of resolution. It is also contemplated within the scope of the invention that the seismic data for TFI™ may be collected by a shallow sub-surface sensor array (e.g., a sensor array that has been buried below the surface). In an exemplary embodiment, such a sub-surface sensor array may be positioned 1-100 meters below the surface, or in some cases even deeper.
An embodiment in accordance with the present invention includes a method for estimating the permeability of fractured rock formations from the analysis of a slow fluid pressure wave, which may be generated by pressurization of a borehole. In this regard, borehole pressurization may be used as a signal generator to create the slow fluid pressure wave. Typically, a borehole may be pressurized by injecting any fluid such as, for example, water, isopropyl alcohol, two-butoxyethanol, ethylene glycol, liquid nitrogen, or a slurry. It is also contemplated within the scope of the invention that a borehole may be pressurized by injecting a supercritical fluid such as, for example, supercritical carbon dioxide. Is also contemplated within the scope of the invention that a borehole may be pressurized with a gas such as, for example, atmospheric air, oxygen, nitrogen, carbon dioxide, and the like. The specific signal generator may be matched to the geological composition of the reservoir being analyzed. For example, the signal generator may be a gas in the case of a reservoir composed primarily of a gas such as natural gas or methane, while the signal generator may be a fluid or a supercritical fluid for a reservoir composed primarily of a liquid such as, for example, oil. Without being bound by theory, it is believed that matching the type of signal generator to the geological composition of the reservoir being analyzed may increase the quality and/or resolution of the data that results from the imaging of the Pf wave.
Wave propagation in the rock may be recorded with an imaging technique (such as, e.g., TFI™, SET, and the like) or a pressure monitoring technique (such as, e.g., direct measurement of pore fluid pressure with a pressure sensor deployed into a preexisting or newly drilled borehole). Poroelastic theory may then be used to estimate the permeability of the fractured rock formations from the measured wave speed. Advantageously, the present invention makes it possible to measure the permeability of fractured rock at reservoir-scale because the imaged pressure wave is able to propagate through a large rock volume, on the order of kilometers in size (e.g., 1-10 km). This is in stark contrast to traditional methods, which yield permeability measurements for much smaller rock volumes. For example, well logging tools only measure permeability in the vicinity of a borehole. Pressure transient testing accesses larger rock volumes; however, these volumes are much smaller than those enabled by the present invention, particularly in low-permeability rock formations. Another advantage of the present invention is that the signal generator may be, for example, fluid pumped into an existing borehole to allow assessment of permeability of an undisturbed reservoir (e.g., a natural reservoir that has not been subjected to artificial fracturing), or an artificially fractured reservoir (e.g., a natural reservoir that has been subjected to hydraulic fracturing, propellant fracking, or other rock stimulation methods). It is contemplated within the scope of the invention that the signal generator may be, for example, a slurry used during the process of hydraulic fracturing so that the permeability of an exemplary reservoir may be assessed at the same time that it is subject to fracturing.
The present invention provides an explanation of the physical mechanisms that give rise to the Pf wave, and demonstrates that this physical understanding may be used to estimate the permeability of the transmissive fracture network. According to the techniques herein, several field data sets show Pf waves observed via TFI™, and the Pf wave corresponds to Biot's Slow Wave. In this regard, the Biot theory may be used to estimate the permeability of the fracture networks in which the Pf waves were observed. FIG. 2 illustrates graphical views of Pf wave in the Barnett Shale. The plots suggest that the wave travels about 5,000 ft in 3 minutes, which corresponds roughly to a velocity of 6.3 m/s.
The method of the present invention includes several steps for deriving/estimating subsurface formation permeability. One step includes creation of a 3D model for seismic velocity of the rock formation under consideration. The velocity model can be constructed from sonic logs, geological models, Vertical Seismic Profiles (VSPs), crosswell tomography, seismic tomography, and the like. Another step may include installation of a surface or buried seismic array for TFI™ at the field site. Collection of passive-seismic data with the seismic array may be used to image the preexisting fracture system.
Using the 3D velocity model, the passive seismic data may be processed via TFI™ in order to create a 3D image of the seismically active fracture system. FIG. 3A illustrates a graphical view of an ambient fracture network that has been mapped by processing passive seismic data with TFI™.
A well may be drilled into the imaged rock formation, for which a permeability estimate is sought. In an exemplary embodiment, the well may be vertically oriented. Due to the attenuation of the Pf wave, it is preferable that the well be located in the center of the formation such that sufficiently high pressure perturbations can be created everywhere within the geological domain of interest.
Fluid may be injected into the borehole for some period of time at a rate such that the bottom borehole pressure increases substantially. At the same time, the rock formation is imaged with TFI™ in order to determine the fracture system that is stimulated by the generated pressure wave. While TFI™ is disclosed herein as an exemplary imaging modality, any suitable imaging system known to or conceivable by one of skill in the art could also be used. Also, the bottom borehole fluid pressure pb is recorded as a function of time t in order to characterize the transient behavior of the source of the Pf wave. However, it is also contemplated within the scope of the invention that other variables (e.g., acceleration) could be measured in order to characterize the source of the Pf wave. FIG. 4 illustrates graphical views of borehole pressure data shows typical bottom borehole pressure data that is obtained when a slurry is injected into the well for the purposes of hydraulic fracturing.
The seismic data is processed via TFI™ in order to achieve 5D semblance data that describes the propagation of the induced pressure disturbance. The recorded 5D semblance data is used to determine the arrival time of the Pf wave front at the central surfaces of the transmissive fracture network. To that end, the data likely first need to be denoised (e.g. using anisotropic diffusion filtering), and then the front will be highlighted (e.g., using edge detection or image segmentation). FIG. 3B illustrates a graphical view of the transmissive fracture network which is illuminated by increasing the borehole pressure.
From the travel time on the central surfaces of the transmissive fracture network, the velocity of the Pf wave on the central surfaces of the transmissive fracture network is calculated. FIG. 3C illustrates a graphical view of the velocity field of the Pf wave. 5D semblance data from the passive seismic imaging is used to identify the permeable zones around the central surfaces. The rock volume in these zones contains the dominant flow paths and forms the transmissive fracture network. FIG. 3D illustrates a graphical view of the 5D semblance data from the passive seismic imaging that is used to identify the permeable zones around the major fractures.
Poroelastic theory according to Biot is used to estimate the permeability of the transmissive fracture network, k. Biot developed a theory in order to describe the propagation of elastic waves in fluid-saturated porous media. The Biot theory has been modified using the notation introduced by Stoll and Kan (R. D. Stoll and T. K. Kan. Reflection of acoustic waves at a water-sediment interface. Journal of the Acoustical Society of America, 70: 149-156, 1981) and Stoll (R. D. Stoll. Sediment Acoustics. Springer-Verlag, New York, 1989) to model parameters directly related to typical rock properties. In this regard, Biot's theory may be presented in the form of the following two partial differential equations:
where the volumetric strain e [−] and the increment in fluid content ξ [−] are the unknowns. The fluid pressure pf can be obtained from the primary dependent variables via
p f =Mζ−Ce (3)
These equations including the lumped parameters H, C and M depend on the following 11 parameters:
1. the porosity of the rock, β [−];
2. the dynamic viscosity of the fluid, η [kg·m−1 s−1];
3. the total mass density of the fluid-saturated porous medium, ρ [kg m−3];
4. the density of the fluid, ρf [kg m−3];
5. the permeability of the fractured rock, k [m2];
6. the shear modulus of the rock, μ [m2];
7. the bulk modulus of the fluid, Kf [Pa];
8. the bulk modulus of the solid material that makes up the rock that differs from the bulk modulus of the porous/fractured rock, Kr [Pa];
9. the bulk modulus of the free-draining porous/fractured rock, Kb [Pa];
10. a pore-size parameter a [m]; and
11. a factor that accounts for the tortuosity of the rock, α≥1 [−].
The lumped parameters are defined as follows:
The problem may be assessed in Fourier space where the solutions represent harmonic waves that oscillate in time with an angular frequency ω and in space with a complex wave number 1:
e(x,t)=B 1 e i(ωt-lx) (12)
ζ(x,t)=B 2 e i(ωt-lx) (13)
It is convenient to introduce a vector for the unknowns e and ζ:
By substituting these assumed solutions into Equations (1) and (2), one can show that the following condition must be fulfilled:
is a function which accounts for deviations of Darcy's law in case of ω>0,
is a nondimensional function, and
is a nondimensional frequency. Equation (15) can be used to determine the dispersion relation between the
where
The two λ values correspond to Biot's first and second compressional wave. They have different phase velocities and attenuation coefficients. The complex wave number is obtained by taking the square root of each λ value. The two roots that one obtains for each λ value, l1=lr+ili and l2=−lr−ili, represent one and the same dispersion relation. They correspond to two waves which travel with the same absolute speed into either the positive or the negative x-direction and which experience the same attenuation/growth along the direction of propagation. From Equation (15), it is also possible to calculate
where l(ω) is known from the dispersion relation. Due to the linearity of the governing equations, this vector can be multiplied by any complex number. For each location x, the {right arrow over (B)} vector gives according to Equation 14 information about the ratio of the amplitudes of the e and oscillations and the phase shift between them.
From the dispersion relation, one can determine the velocity of a localized wave package, which is characterized by a dominant frequency ωc. In case of attenuation, this dominant frequency changes with time t, because the different harmonics which make up a wave package die out at different rates. In case of attenuation, the group velocity dω/dl as defined for the case without attenuation becomes complex, because 1 is complex. The real and imaginary parts of the group velocity can be related to the position of the spatial maximum of the wave package,
and the central wave number
where Δ is the width of the assumed initial Gaussian wave package. Thus the group velocity is given by
The group velocity changes with time because the
All parameters of the Biot theory, except for the permeability k which is to be determined inversely, can be estimated for an exemplary gas shale reservoir. Shale generally has a porosity between 0 and 10%, so it is possible to estimate β=0.05. In a gas shale reservoir the fluid may typically be assumed to be methane, even though actual shale gas is a gas mixture. At 0° C. (freezing point of water) and 101.3 kPa (atmospheric pressure), methane has a viscosity η=10.2×10⁻⁶ kg m−1 s−1. Typical values of reservoir pressures range from 20 to 50 MPa; therefore, a gas pressure of 20 MPa may be assumed. In some instances, the reservoir pressure may be estimated by assuming a hydrostatic pressure distribution in the subsurface, in which case a pressure of 20 MPa corresponds roughly to a reservoir depth of 2 km. It may further be assumed that the reservoir temperature may be calculated from the geothermal gradient (e.g., 22.1° C. per km of depth) and that the ground surface has a temperature of 20° C., then the reservoir temperature is about 64° C. The viscosity of methane may be modeled as η=1.3×10⁻⁵ kg m−1 s−1. Densities of most mineral soil materials vary between 2600 and 2750 kg/m3. Even though shale is not a soil, an average value for the total density of shale, ρ=2675 kg/m3 may be used (e.g., the small porosity of the shale may be neglected in the modeling). Methane has a specific gas constant R=519 J kg−K−. Using the ideal gas law, ρf=p/(RT), ρf=114 kg/m3 is obtained for the pressure and temperature used in the viscosity calculation. A value of μ=6.1 GPa may be set according to Simm (see e.g., R. Simm Practical Gassmann fluid substitution in sand/shale sequences. First Break, 25:61-68, 2007). The bulk modulus is also the inverse of the compressibility. For an ideal gas, the isothermal compressibility is the inverse pressure. Therefore the bulk modulus is the pressure itself, which means Kf=20 MPa. Kr [Pa] is the bulk modulus of the solid material that makes up the rock that differs from the bulk modulus of the porous/fractured rock. Note that the bulk modulus is also the inverse of the compressibility. For quartz and most minerals, the compressibility is about 2×10⁻¹¹ Pa−1, accordingly, a value of Kr=5×10¹⁰ Pa=50 GPa may be assumed. According to Jizba (see e.g., D. L. Jizba. Mechanical and acoustical properties of sandstones and shales. PhD thesis, Stanford University, 1991.), the bulk modulus of room-dry shale cores varies between 15 and 35 GPa. Accordingly, the arithmetic mean Kb=25 GPa may be used. In an exemplary embodiment, a=1 mm may be used for the pore-size parameter. According to Latief and Fauzi (F. D. E. Latief and U. Fauzi. Permeability and tortuosity anisotropy of a fractured porous rock. pages 1-8, 2015. 3rd International Workshop on Rock Physics, Apr. 13-17, 2015 in Perth, Western Australia.), who analyzed a 3D image of a cm-scale igneous rock sample, the tortuosity of fractured rock is on the order of 1.5. Accordingly, a value of α=1.5 may be used in an exemplary embodiment.
It is generally possible to obtain independent estimates for all Biot theory parameters of a fluid-saturated fractured rock, except for the permeability k [m2]. These parameters are the following: the porosity of the rock [−], the dynamic viscosity of the fluid [kg m−1 s−1], the total mass density of the fluid-saturated porous medium [kg m−3], the density of the fluid [kg m−3], the shear modulus of the rock [Pa], the bulk modulus of the fluid [Pa], the bulk modulus of the solid material that makes up the rock [Pa], the bulk modulus of the free-draining porous/fractured rock [Pa], a pore-size parameter [m], and a factor that accounts for the tortuosity of the rock [−]. Biot theory is used to calculate the dispersion relation for Biot's slow wave, i.e., the dependence of the complex wave number on ω.
The dominant frequency ωc of the signal generator is determined by Fourier analysis of the bottom hole pressure pb(t), or from other variables that characterize the generator/source strength. Using the dispersion relation one can then calculate the corresponding wave number 1c. The velocity of the Pf wave is estimated by the group velocity for a package of harmonic slow waves that is characterized by a
Numerical values for this group velocity cannot be determined because it depends on the unknown permeability k. However, the function that describes the dependence of cg on k can be numerically determined.
The speed of the Pf wave, cg, in the 3D rock volume of the transmissive fracture network is used to calculate the permeability k in the same rock volume. This is done by determining at each point k(cg) where the latter function is obtained by numerically inverting cg(k) from Equation (25). FIG. 3E illustrates a graphical view of the calculated permeability field.
It is understood that one or more of the above methods, or aspects thereof, may be executed by at least one control unit. The term “control unit” may refer to a hardware device that includes a memory and a processor. The memory is configured to store program instructions, and the processor is specifically programmed to execute the program instructions to perform one or more processes which are described further below. Moreover, it is understood that the above methods may be executed by an apparatus comprising the control unit in conjunction with one or more other components, as would be appreciated by a person of ordinary skill in the art.
Furthermore, the control unit of the present disclosure may be embodied as non-transitory computer readable media containing executable program instructions executed by a processor, controller or the like. Examples of the computer readable mediums include, but are not limited to, ROM, RAM, compact disc (CD)-ROMs, magnetic tapes, floppy disks, flash drives, smart cards and optical data storage devices. The computer readable recording medium can also be distributed throughout a computer network so that the program instructions are stored and executed in a distributed fashion, e.g., by a telematics server or a Controller Area Network (CAN).
The steps and analysis of the present invention can be carried out using a computer, non-transitory computer readable medium, or alternately a computing device or non-transitory computer readable medium incorporated into an imaging device. Indeed, any suitable method of calculation known to or conceivable by one of skill in the art could be used. It should also be noted that while specific equations are detailed herein, variations on these equations can also be derived, and this application includes any such equation known to or conceivable by one of skill in the art. A non-transitory computer readable medium is understood to mean any article of manufacture that can be read by a computer. Such non-transitory computer readable media includes, but is not limited to, magnetic media, such as a floppy disk, flexible disk, hard disk, reel-to-reel tape, cartridge tape, cassette tape or cards, optical media such as CD-ROM, writable compact disc, magneto-optical media in disc, tape or card form, and paper media, such as punched cards and paper tape. The computing device can be a special computer designed specifically for this purpose. The computing device can be unique to the present invention and designed specifically to carry out the method of the present invention. The computing device can also take the form of an operating console computer for the imaging device. The operating console is a non-generic computer specifically designed by the scanner manufacturer for bilateral (input output) communication with the scanner. It is not a standard business or personal computer that can be purchased at a local store. Additionally this console computer carries out communications with the scanner through the execution of proprietary custom built software that is designed and written by the scanner manufacturer for the computer hardware to specifically operate the scanner hardware.
The many features and advantages of the invention are apparent from the detailed specification, and thus, it is intended by the appended claims to cover all such features and advantages of the invention, which fall within the true spirit and scope of the invention. Further, since numerous modifications and variations will readily occur to those skilled in the art, it is not desired to limit the invention to the exact construction and operation illustrated and described, and accordingly, all suitable modifications and equivalents may be resorted to, falling within the scope of the invention.
Claims (20)
1. A method of estimating permeability of a rock formation comprising:
generating, by a control unit and by injecting a fluid into a borehole within the rock formation, a fluid pressure (N) wave in a perforated portion of the borehole;
imaging, by the control unit, the fluid Pf wave to produce imaging data;
analyzing, by the control unit, the imaging data to identify a front position of the fluid Pf wave as a function of time and to formulate a transmissive fracture network in which the fluid Pf wave propagates;
determining, by the control unit, a speed of the fluid Pf wave as a function of a three dimensional (3D) position within the rock formation based on the front position; and
establishing, by the control unit, an estimated 3D permeability field from a 3D field for the speed of the fluid Pf wave using poroelastic theory.
2. The method of claim 1 , wherein generating the fluid Pf wave in the perforated portion of the borehole results in borehole pressurization.
3. The method of claim 2 , wherein the fluid is at least one of:
a liquid,
a gas, or
a supercritical fluid, and
wherein the borehole pressurization results from injection of the liquid, the gas, or the supercritical fluid into the borehole.
4. The method of claim 3 , wherein the liquid is selected from a group comprising water, isopropyl alcohol, two-butoxyethanol, ethylene glycol, or a slurry.
5. The method of claim 1 , wherein imaging the fluid Pf wave comprises:
imaging the fluid Pf wave by utilizing at least one of:
Tomographic Fracture Imaging (“TFI™”), or Seismic Emission Tomography (SET).
6. The method of claim 1 , wherein imaging the fluid Pf wave utilizing TFI™ further comprises:
utilizing a surface array or a sub-surface array.
7. The method of claim 6 , wherein the surface array is a beam forming surface array.
8. The method of claim 6 , wherein the sub-surface array is positioned 1-10 meters below a surface of the rock formation.
9. The method of claim 1 , wherein the poroelastic theory is Biot's theory.
10. A device, comprising:
one or more processors to:
generate, by injecting a fluid into a borehole within a rock formation, a fluid pressure (N) wave in a perforated portion of the borehole;
image the fluid Pf wave to produce imaging data;
analyze the imaging data to identify a front position of the fluid Pf wave as a function of time and to formulate a transmissive fracture network in which the fluid Pf wave propagates;
determine a speed of the fluid Pf wave as a function of a three dimensional (3D) position within the rock formation based on the front position; and
establish an estimated 3D permeability field from a 3D field for the speed of the fluid Pf wave using poroelastic theory.
11. The device of claim 10 , wherein the one or more processors, when generating the fluid Pf wave in the perforated portion of the borehole, are to:
generate borehole pressurization.
12. The device of claim 11 , wherein the fluid is at least one of:
a liquid,
a gas, or
a supercritical fluid; and
wherein the borehole pressurization results from injection of the liquid, the gas, or the supercritical fluid into the borehole.
13. The device of claim 12 , wherein the liquid is selected from a group comprising water, isopropyl alcohol, two-butoxyethanol, ethylene glycol, or a slurry.
14. The device of claim 10 , wherein the one or more processors, when imaging the fluid Pf wave, are further to:
image the fluid Pf wave by utilizing at least one of:
Tomographic Fracture Imaging (“TFI™”), or Seismic Emission Tomography (SET).
15. The device of claim 14 , wherein the one or more processors, when imaging the fluid Pf wave utilizing TFI™, are further to:
image the fluid Pf wave utilizing a surface array or a sub-surface array.
16. The device of claim 15 , wherein the surface array is a beam forming surface array.
17. The device of claim 15 , wherein the sub-surface array is positioned 1-10 meters below a surface of the rock formation.
18. The device of claim 10 , wherein the poroelastic theory is Biot's theory.
19. A non-transitory computer-readable medium storing instructions, the instructions comprising:
one or more instructions that, when executed by one or more processors, cause the one or more processors to:
generate, by injecting a fluid into a borehole within a rock formation, a fluid pressure (N) wave in a perforated portion of the borehole;
image the fluid Pf wave to produce imaging data;
analyze the imaging data to identify a front position of the fluid Pf wave as a function of time and to formulate a transmissive fracture network in which the fluid Pf wave propagates;
determine a speed of the fluid Pf wave as a function of a three dimensional (3D) position within the rock formation based on the front position; and
establish an estimated 3D permeability field from a 3D field for the speed of the fluid Pf wave using poroelastic theory.
20. The non-transitory computer-readable medium of claim 19 , where the one or more instructions, that cause the one or more processors to generate the fluid Pf wave in the perforated portion of the borehole, further cause the one or more processors to:
generate borehole pressurization.
Priority Applications (2)
| Application Number | Priority Date | Filing Date | Title |
|---|---|---|---|
| US15/224,046 US10145227B2 (en) | 2015-07-31 | 2016-07-29 | Method for estimating permeability of fractured rock formations from induced slow fluid pressure waves |
| US16/207,737 US11098565B2 (en) | 2015-07-31 | 2018-12-03 | Method for estimating permeability of fractured rock formations from induced slow fluid pressure waves |
Applications Claiming Priority (2)
| Application Number | Priority Date | Filing Date | Title |
|---|---|---|---|
| US201562199290P | 2015-07-31 | 2015-07-31 | |
| US15/224,046 US10145227B2 (en) | 2015-07-31 | 2016-07-29 | Method for estimating permeability of fractured rock formations from induced slow fluid pressure waves |
Related Child Applications (1)
| Application Number | Title | Priority Date | Filing Date |
|---|---|---|---|
| US16/207,737 Continuation US11098565B2 (en) | 2015-07-31 | 2018-12-03 | Method for estimating permeability of fractured rock formations from induced slow fluid pressure waves |
Publications (2)
| Publication Number | Publication Date |
|---|---|
| US20170031048A1 US20170031048A1 (en) | 2017-02-02 |
| US10145227B2 true US10145227B2 (en) | 2018-12-04 |
Family
ID=57882365
Family Applications (2)
| Application Number | Title | Priority Date | Filing Date |
|---|---|---|---|
| US15/224,046 Active 2036-12-09 US10145227B2 (en) | 2015-07-31 | 2016-07-29 | Method for estimating permeability of fractured rock formations from induced slow fluid pressure waves |
| US16/207,737 Active 2037-04-22 US11098565B2 (en) | 2015-07-31 | 2018-12-03 | Method for estimating permeability of fractured rock formations from induced slow fluid pressure waves |
Family Applications After (1)
| Application Number | Title | Priority Date | Filing Date |
|---|---|---|---|
| US16/207,737 Active 2037-04-22 US11098565B2 (en) | 2015-07-31 | 2018-12-03 | Method for estimating permeability of fractured rock formations from induced slow fluid pressure waves |
Country Status (2)
| Country | Link |
|---|---|
| US (2) | US10145227B2 (en) |
| WO (1) | WO2017023789A1 (en) |
Cited By (2)
| Publication number | Priority date | Publication date | Assignee | Title |
|---|---|---|---|---|
| US11098565B2 (en) | 2015-07-31 | 2021-08-24 | The John Hopkins University | Method for estimating permeability of fractured rock formations from induced slow fluid pressure waves |
| US11953638B2 (en) | 2019-05-24 | 2024-04-09 | G-O-Image, LLC | Methods for creating a critical crust reservoir model |
Families Citing this family (12)
| Publication number | Priority date | Publication date | Assignee | Title |
|---|---|---|---|---|
| US10087733B2 (en) * | 2015-10-29 | 2018-10-02 | Baker Hughes, A Ge Company, Llc | Fracture mapping using vertical seismic profiling wave data |
| CN106968647B (en) * | 2017-05-23 | 2019-02-26 | 中海石油(中国)有限公司 | A kind of preparation method of slit formation Carbonate Reservoir perforation |
| CN108376422A (en) * | 2018-01-05 | 2018-08-07 | 中山大学 | A kind of continuous across the scale measurement characterizing method of rock-soil material |
| US10907460B2 (en) | 2018-02-12 | 2021-02-02 | The Johns Hopkins University | Energetic charge for propellant fracturing |
| US10289816B1 (en) * | 2018-06-08 | 2019-05-14 | Gsfm Llc | Methods, systems, and devices for an encrypted and obfuscated algorithm in a computing environment |
| US11899155B2 (en) * | 2018-06-08 | 2024-02-13 | Cenovus Energy Inc. | System, method and apparatus for reduced water usage for fracturing hydrocarbon wells with three-dimensional imaging of the formation from a single borehole |
| CN108952659B (en) * | 2018-07-11 | 2020-06-05 | 中国石油大学(北京) | Visual supercritical carbon dioxide fracturing physical simulation test method |
| CN109357984B (en) * | 2018-09-05 | 2023-11-24 | 贵州师范大学 | Karst earth surface crack degree calculation method |
| CN109870720B (en) * | 2019-01-25 | 2021-01-01 | 中国石油天然气集团有限公司 | Shale gas micro-crack well logging identification method |
| CN110794039B (en) * | 2019-11-06 | 2021-12-21 | 长江勘测规划设计研究有限责任公司 | Method for calculating crack filling rate of curtain grouting rock mass by using rock mass wave velocity |
| US11474270B2 (en) | 2021-01-04 | 2022-10-18 | Saudi Arabian Oil Company | Three-component seismic data acquisition while fracking |
| CN114184533B (en) * | 2022-02-16 | 2022-05-13 | 中国矿业大学(北京) | Fractured rock mass seepage heat transfer device and system |
Citations (9)
| Publication number | Priority date | Publication date | Assignee | Title |
|---|---|---|---|---|
| US5251286A (en) | 1992-03-16 | 1993-10-05 | Texaco, Inc. | Method for estimating formation permeability from wireline logs using neural networks |
| US6047595A (en) | 1997-12-12 | 2000-04-11 | Schlumberger Technology Corporation | Method of determining the permeability of sedimentary strata using NMR data |
| US6140816A (en) | 1997-12-12 | 2000-10-31 | Schlumberger Technology Corporation | Method of determining the permeability of sedimentary strata |
| US20040108110A1 (en) * | 1998-11-20 | 2004-06-10 | Zupanick Joseph A. | Method and system for accessing subterranean deposits from the surface and tools therefor |
| US20090005995A1 (en) * | 2007-06-26 | 2009-01-01 | Baker Hughes Incorporated | Method and Apparatus for Characterizing and Estimating Permeability Using LWD Stoneley-Wave Data |
| US20090299637A1 (en) * | 2005-11-03 | 2009-12-03 | Dasgupta Shivaji N | Continuous Reservoir Monitoring for Fluid Pathways Using Microseismic Data |
| US20130215712A1 (en) * | 2011-03-23 | 2013-08-22 | Global Geophysical Services, Inc. | Method for Assessing the Effectiveness of Modifying Transmissive Networks of Natural Reservoirs |
| US20140083681A1 (en) * | 2012-09-24 | 2014-03-27 | Stewart Thomas Taylor | Seismic monitoring system and method |
| US9389326B2 (en) | 2011-03-23 | 2016-07-12 | Global Ambient Seismic, Inc. | Methods, systems and devices for near-well fracture monitoring using tomographic fracture imaging techniques |
Family Cites Families (4)
| Publication number | Priority date | Publication date | Assignee | Title |
|---|---|---|---|---|
| US5353637A (en) * | 1992-06-09 | 1994-10-11 | Plumb Richard A | Methods and apparatus for borehole measurement of formation stress |
| AU2007205225B2 (en) * | 2006-01-05 | 2010-11-11 | Prad Research And Development Limited | Method for determining formation fluid entry into or drilling fluid loss from a borehole using a dynamic annular pressure control system |
| US8607870B2 (en) * | 2010-11-19 | 2013-12-17 | Schlumberger Technology Corporation | Methods to create high conductivity fractures that connect hydraulic fracture networks in a well |
| US10145227B2 (en) | 2015-07-31 | 2018-12-04 | The Johns Hopkins University | Method for estimating permeability of fractured rock formations from induced slow fluid pressure waves |
-
2016
- 2016-07-29 US US15/224,046 patent/US10145227B2/en active Active
- 2016-07-29 WO PCT/US2016/044820 patent/WO2017023789A1/en active Application Filing
-
2018
- 2018-12-03 US US16/207,737 patent/US11098565B2/en active Active
Patent Citations (9)
| Publication number | Priority date | Publication date | Assignee | Title |
|---|---|---|---|---|
| US5251286A (en) | 1992-03-16 | 1993-10-05 | Texaco, Inc. | Method for estimating formation permeability from wireline logs using neural networks |
| US6047595A (en) | 1997-12-12 | 2000-04-11 | Schlumberger Technology Corporation | Method of determining the permeability of sedimentary strata using NMR data |
| US6140816A (en) | 1997-12-12 | 2000-10-31 | Schlumberger Technology Corporation | Method of determining the permeability of sedimentary strata |
| US20040108110A1 (en) * | 1998-11-20 | 2004-06-10 | Zupanick Joseph A. | Method and system for accessing subterranean deposits from the surface and tools therefor |
| US20090299637A1 (en) * | 2005-11-03 | 2009-12-03 | Dasgupta Shivaji N | Continuous Reservoir Monitoring for Fluid Pathways Using Microseismic Data |
| US20090005995A1 (en) * | 2007-06-26 | 2009-01-01 | Baker Hughes Incorporated | Method and Apparatus for Characterizing and Estimating Permeability Using LWD Stoneley-Wave Data |
| US20130215712A1 (en) * | 2011-03-23 | 2013-08-22 | Global Geophysical Services, Inc. | Method for Assessing the Effectiveness of Modifying Transmissive Networks of Natural Reservoirs |
| US9389326B2 (en) | 2011-03-23 | 2016-07-12 | Global Ambient Seismic, Inc. | Methods, systems and devices for near-well fracture monitoring using tomographic fracture imaging techniques |
| US20140083681A1 (en) * | 2012-09-24 | 2014-03-27 | Stewart Thomas Taylor | Seismic monitoring system and method |
Non-Patent Citations (5)
| Title |
|---|
| Jizba, Mechanical and Acoustical Properties of Sandstones and Shales, (1991) PhD Thesis, Department of Geophysics and the Committee on Graduate Studies of Standford University. |
| Latiefa et al., Permeability and Tortuosity Anisotropy of a Fractured Porous Rock, (2015) International Workshop on Rock Physics, 1-8. |
| Simm, Practical Gassmann fluid substitution in sand/shale sequences, (2007) First Break, 25, 61-68. |
| Stoll et al., Reflection of acoustic waves at a water-sediment interface., (1981) Journal of the Acoustical Society of America, 70, 149-156. |
| Stoll et al., Reflection of acoustic waves at a water—sediment interface., (1981) Journal of the Acoustical Society of America, 70, 149-156. |
Cited By (2)
| Publication number | Priority date | Publication date | Assignee | Title |
|---|---|---|---|---|
| US11098565B2 (en) | 2015-07-31 | 2021-08-24 | The John Hopkins University | Method for estimating permeability of fractured rock formations from induced slow fluid pressure waves |
| US11953638B2 (en) | 2019-05-24 | 2024-04-09 | G-O-Image, LLC | Methods for creating a critical crust reservoir model |
Also Published As
| Publication number | Publication date |
|---|---|
| US20170031048A1 (en) | 2017-02-02 |
| US20190178070A1 (en) | 2019-06-13 |
| WO2017023789A1 (en) | 2017-02-09 |
| US11098565B2 (en) | 2021-08-24 |
Similar Documents
| Publication | Publication Date | Title |
|---|---|---|
| US11098565B2 (en) | Method for estimating permeability of fractured rock formations from induced slow fluid pressure waves | |
| US20160349389A1 (en) | Method for developing a geomechanical model based on seismic data, well logs and sem analysis of horizontal and vertical drill cuttings | |
| He et al. | A new method to determine Biot's coefficients of Bakken samples | |
| US9279897B2 (en) | Locating oil or gas passively by observing a porous oil and gas saturated system giving off its characteristic resonance response to ambient background noise, including optional differentiation of oil, locatinggas and water | |
| Lebedev et al. | Direct laboratory observation of patchy saturation and its effects on ultrasonic velocities | |
| Quintal et al. | Sensitivity of S-wave attenuation to the connectivity of fractures in fluid-saturated rocks | |
| US20180203144A1 (en) | Interferometric Microseismic Imaging Methods and Apparatus | |
| US9557433B2 (en) | Fracture imaging methods employing skeletonization of seismic emission tomography data | |
| Alam et al. | Static and dynamic effective stress coefficient of chalk | |
| Wang et al. | Experimental investigation on the fracture behaviour of black shale by acoustic emission monitoring and CT image analysis during uniaxial compression | |
| Wang et al. | Experimental measurements of seismoelectric signals in borehole models | |
| Vlastos et al. | Dual simulations of fluid flow and seismic wave propagation in a fractured network: effects of pore pressure on seismic signature | |
| CA2273783C (en) | Method of imaging the permeability and fluid content structure within sediment | |
| Yan et al. | Prediction of seismic wave dispersion and attenuation from ultrasonic velocity measurements | |
| US20160047933A1 (en) | Systems and methods for removal of electromagnetic dispersion and attenuation for imaging of proppant in an induced fracture | |
| Falcon‐Suarez et al. | Integrated geophysical and hydromechanical assessment for CO2 storage: shallow low permeable reservoir sandstones | |
| Katterbauer et al. | Synergizing crosswell seismic and electromagnetic techniques for enhancing reservoir characterization | |
| CA2678289A1 (en) | Passively locating a porous oil, gas or water saturated system giving off its characteristic resonance response to ambient background noise | |
| Sharifi et al. | Investigation of static and dynamic bulk moduli in a carbonate field | |
| King | Rock-physics developments in seismic exploration: A personal 50-year perspective | |
| US8532954B2 (en) | Method of characterizing a CO2 plume in a geological storage aquifer | |
| Duffaut et al. | Stress and fluid sensitivity in two North Sea oil fields—Comparing rock physics models with seismic observations | |
| Vasquez et al. | Experimental efforts to access 4D feasibility and interpretation issues of Brazilian presalt carbonate reservoirs | |
| CN109100801B (en) | A kind of high-pressure medium seimic wave propagation analogy method | |
| CN113900143B (en) | Method and device for determining attribute characteristics of natural gas hydrate and server |
Legal Events
| Date | Code | Title | Description |
|---|---|---|---|
| AS | Assignment |
Owner name: THE JOHNS HOPKINS UNIVERSITY, MARYLAND Free format text: ASSIGNMENT OF ASSIGNORS INTEREST;ASSIGNORS:HILPERT, MARKUS;GEISER, PETER ANDERSON;MARSH, BRUCE D.;SIGNING DATES FROM 20171222 TO 20180131;REEL/FRAME:045316/0236 |
|
| STCF | Information on status: patent grant |
Free format text: PATENTED CASE |
|
| CC | Certificate of correction | ||
| MAFP | Maintenance fee payment |
Free format text: PAYMENT OF MAINTENANCE FEE, 4TH YR, SMALL ENTITY (ORIGINAL EVENT CODE: M2551); ENTITY STATUS OF PATENT OWNER: SMALL ENTITY Year of fee payment: 4 |