KR20180066425A - A Method for Stock Trading based on Moving Average Line Analysis - Google Patents
A Method for Stock Trading based on Moving Average Line Analysis Download PDFInfo
- Publication number
- KR20180066425A KR20180066425A KR1020160167219A KR20160167219A KR20180066425A KR 20180066425 A KR20180066425 A KR 20180066425A KR 1020160167219 A KR1020160167219 A KR 1020160167219A KR 20160167219 A KR20160167219 A KR 20160167219A KR 20180066425 A KR20180066425 A KR 20180066425A
- Authority
- KR
- South Korea
- Prior art keywords
- moving average
- average line
- line
- stock
- time
- Prior art date
Links
Images


Classifications
-
- G—PHYSICS
- G06—COMPUTING; CALCULATING OR COUNTING
- G06Q—INFORMATION AND COMMUNICATION TECHNOLOGY [ICT] SPECIALLY ADAPTED FOR ADMINISTRATIVE, COMMERCIAL, FINANCIAL, MANAGERIAL OR SUPERVISORY PURPOSES; SYSTEMS OR METHODS SPECIALLY ADAPTED FOR ADMINISTRATIVE, COMMERCIAL, FINANCIAL, MANAGERIAL OR SUPERVISORY PURPOSES, NOT OTHERWISE PROVIDED FOR
- G06Q40/00—Finance; Insurance; Tax strategies; Processing of corporate or income taxes
- G06Q40/06—Asset management; Financial planning or analysis
-
- G06F17/604—
-
- G—PHYSICS
- G06—COMPUTING; CALCULATING OR COUNTING
- G06Q—INFORMATION AND COMMUNICATION TECHNOLOGY [ICT] SPECIALLY ADAPTED FOR ADMINISTRATIVE, COMMERCIAL, FINANCIAL, MANAGERIAL OR SUPERVISORY PURPOSES; SYSTEMS OR METHODS SPECIALLY ADAPTED FOR ADMINISTRATIVE, COMMERCIAL, FINANCIAL, MANAGERIAL OR SUPERVISORY PURPOSES, NOT OTHERWISE PROVIDED FOR
- G06Q10/00—Administration; Management
- G06Q10/06—Resources, workflows, human or project management; Enterprise or organisation planning; Enterprise or organisation modelling
- G06Q10/063—Operations research, analysis or management
- G06Q10/0637—Strategic management or analysis, e.g. setting a goal or target of an organisation; Planning actions based on goals; Analysis or evaluation of effectiveness of goals
-
- G—PHYSICS
- G06—COMPUTING; CALCULATING OR COUNTING
- G06Q—INFORMATION AND COMMUNICATION TECHNOLOGY [ICT] SPECIALLY ADAPTED FOR ADMINISTRATIVE, COMMERCIAL, FINANCIAL, MANAGERIAL OR SUPERVISORY PURPOSES; SYSTEMS OR METHODS SPECIALLY ADAPTED FOR ADMINISTRATIVE, COMMERCIAL, FINANCIAL, MANAGERIAL OR SUPERVISORY PURPOSES, NOT OTHERWISE PROVIDED FOR
- G06Q40/00—Finance; Insurance; Tax strategies; Processing of corporate or income taxes
- G06Q40/04—Trading; Exchange, e.g. stocks, commodities, derivatives or currency exchange
Abstract
Description
본 발명은 이동평균선 분석을 통해 최적의 주식투자 종목 및 시기를 결정하는 주식투자방법을 제공하는 것이다.The present invention provides a stock investment method that determines the optimal stock investment item and timing through a moving average line analysis.
대부분의 개인 주식투자가들은 주식에 대한 정보를 얻기 위해 주변 증권전문가나 지인들의 의견을 듣거나, 투자관련 커뮤니티나 각종 포털사이트에서 정보를 획득하여 주식투자에 활용하고 있으나, 투자 종목 선택 및 적절한 매수 및 매도 시기를 결정하는 것은 매우 어려운 일이다. 주식투자는 정확한 시장정보를 통한 관심종목 선정과 동시에 선정된 종목의 매수/매도 시점을 판단하여야만 높은 수익률을 얻을 수 있는데, 투자가들은 주식 움직임을 포착할 수 있는 주식 거래량 및 가격변동폭 정보로서 정확한 주가의 움직임을 분석하는데 어려움을 겪고 있다.Most individual stock investors use their stocks to obtain information on stocks, obtain information from nearby securities experts or acquaintances, obtain information from investment-related communities and various portal sites, and use them for stock investment. However, It is very difficult to determine when to sell. Stock investors can obtain high returns only if they select the stocks that are interested in the market information and determine the buying / selling points of the stocks at the same time. Investors can view the stock trading volume and price fluctuation information It is difficult to analyze movements.
이에 각 증권사들은 금융공학, 계량분석을 활용하여 금융시장과 종목의 과거 주가 움직임을 분석하여, 상승 가능성이 가장 높은 종목들을 추천하거나, 매매 시기를 분석할 수 있는 홈 트레이딩 시스템(HTS, home trading system ) 기반의 서비스를 제공하고 있다. Each brokerage firm uses the financial engineering and quantitative analysis to analyze past market movements of financial markets and stocks, to recommend the most likely stocks, to analyze home trading system (HTS), home trading system ) Based services.
또 주식매매기법 또는 투자시기를 결정하는 방식으로, 특허공개 제2003-0026118에서는, 소정기간 동안의 주식 종가의 평균을 중간기준가로 산출하고 상기 주식정보 중 주가시세가 상기 상한기준가보다 크게 될 때 매수신호를 출력하고, 주가시세가 상기 하한기준가보다 작게 될 때 매도신호를 발생하는 방법을 제시하였다. 상기 발명은 현재 주가시세의 경향을 확실히 반영하고 상황 변화에 대한 판단이 용이하도록 하고, 주식 시장의 일반적인 흐름에서 이탈하는 순간을 감지하여 최대 수익률을 얻기 위해서는 3일에서 10일 사이를 잡고, 그 기간 중에서도 4일을 기준하여 상기 상한기준가, 하한기준가, 중간기준가를 산출하는 매매신호 로직을 제공하고 있다.In a method for determining a stock trading technique or investment timing, Japanese Patent Application Laid-Open No. 2003-0026118 discloses a method for calculating an average of stock closing prices for a predetermined period as an intermediate standard price, and when the stock price of the stock information becomes larger than the upper limit standard price, And generates a selling signal when the stock price is lower than the lower limit standard value. The present invention is based on the idea that the current stock market clearly reflects the trend of the stock market and makes it easy to judge the change of the situation. In order to obtain the maximum profit rate by sensing the departure from the general flow of the stock market, The sales signal logic for calculating the upper limit standard price, the lower limit standard price, and the intermediate standard price based on 4 days is provided.
또 공개특허 제10-2009-0056127호는, HTS에서 주체 정보를 내포한 봉차트 표시방법으로서, 주가의 상승, 하락 등 주가변화를 주도한 주체의 움직임을 단순히 봉 차트만 봄으로써 일목요연하게 알 수 있으므로 주가변화추이 및 강약을 예측하고 투자시점을 용이하게 결정하는 방법을 제시하고 있다. In addition, Japanese Laid-Open Patent Application No. 10-2009-0056127 discloses a method of displaying a bar chart containing subject information in HTS, which can clearly understand the movement of a subject that has led to a stock price change such as an increase or a decrease in stock price Suggesting ways to predict stock price change trends and strengths and to determine investment timing easily.
공개특허 제10-2016-0047436호는 사용자가 선택한 종목에 대한 이동평균선 분석을 통해 과거 데이터를 기초로 초과수익을 달성할 수 있는 적절한 매수시점을 제공하거나, 적절한 매수시점에서 부합하는 종목들을 검색하는 방법을 제시하고 있다. 상기 기술의 이동평균선 분석항목은 배열도, 방향성, 크로스, 이격도, 밀집도 중 적어도 일부가 포함되며, 이동평균선 분석 서비스장치는 현재 시점에서 이동평균선 분석내용과 동일한 패턴 종목을 검색하여, 그 종목 리스트를 사용자 인터페이스에 제공하거나, 기간 수익률을 산출하여 화면에 표시하는 것을 포함한다.Japanese Patent Laid-Open No. 10-2016-0047436 discloses a method of analyzing a moving average line for an item selected by a user to provide an appropriate buying point for achieving an excess profit on the basis of past data or searching for items matching at an appropriate buying point . The moving average line analysis item of the technique includes at least a part of sequence, direction, cross, spacing, and density, and the moving average line analysis service apparatus searches for the same pattern item as the moving average line analysis content at the present time point, To the user interface, or to calculate the period profit rate and display it on the screen.
그런데, 투자가의 목적은 매매를 통해 매매차익을 획득하는 것이고, 이를 위해서는 낮은 가격에 사서 높은 가격에 팔아야 하는데, 자금력과 정보분석력이 뛰어난 기관투자가 등의 메이저 세력들에 비해, 개인투자가들은 자금력, 정보력 부족, 정보획득 속도의 뒤처짐 등에서 대부분 시작부터 지고 들어가는 게임을 하고 있는 것이 현실로서 그 신뢰성이 의문시 된다. However, the purpose of the investor is to acquire the profit of the sale through the sale, and to sell it at a low price and to buy it at a high price, compared with the major power such as the institutional investor who has excellent financial ability and information analysis ability, The lack of information, the lag behind the speed of information acquisition, and most of the game from the beginning is getting into the reality that the reliability is questionable.
본 발명자는 오랜 기간 동안 주식거래 경험을 통해, 증권사들이 제공하고 있는 HTS 상의 이동평균선들의 생성 원리에서부터 착안하여, 일봉 차트의 5日/10日/20日/60日/120日의 5개의 이동평균선의 패턴의 매커니즘을 분석하여, 기관투자가 등의 메이저 세력들의 동향을 파악하고 이들에 비해 매우 취약한 정보력 및 정보분석력을 가진 개인투자가 (일명 개미)들이 사용할 수 있는 신뢰성 있는 투자종목, 투자시점을 제공하여 보다 안전하고 수익성 있는 투자방법을 제공하고자 본원 발명을 하기에 이르렀다. The inventor of the present invention, considering the long-term stock trading experience and the principle of generating the moving average lines on the HTS provided by the securities companies, finds five moving average lines of 5 days / 10 days / 20 days / 60 days / The analysis of the patterns of the pattern of the institutional investors, such as major trends, such as those who have a very weak information and information analytical power of the individual investors (aka ants) can use the reliable investment items, To provide a more secure and profitable investment method.
본 발명의 목적은 주가의 흐름을 이동평균선을 통해 분석하고, 각 이동평균선이 가진 시간의 값을 파악해 냄으로써, 개인투자가도 용이하게 신뢰성 있는 투자종목 및 투자시점을 선택할 수 있는 주식투자방법을 제공하는데 있다.The object of the present invention is to provide a stock investment method in which an individual investor can easily select a reliable investment item and an investment time point by analyzing the stock price through the moving average line and grasping the value of the time possessed by each moving average line have.
이러한 목적을 달성하기 위해 본 발명의 특징은, 임의의 종목을 선택하는 단계; 선택된 종목에 대해 이동평균선이 표시되고; 상기 이동평균선의 1분봉은 장 시작 1시간 후 60 이동평균선이, 0.5분봉은 120 이동평균선이 생성, 상기 이동평균선의 아래에 주가가 위치하는 종목은 투자하지 않고 다시 새로운 종목을 찾는 단계;로 이루어지는 것을 특징으로 한다.In order to achieve this object, a feature of the present invention is to provide a method of selecting an item, A moving average line is displayed for the selected item; A first moving average line is generated for one hour after the start of the first round and a second moving average line is generated for the second round for a 0.5 minute roll while a new stock is not invested without investing the stock for which the stock price is below the moving average line; .
그리고, 본 발명은 임의의 종목을 선택하는 단계; 선택된 종목에 대해 이동평균선을 표시하는 단계;분봉/일봉 차트의 이동평균선 표시단계; 4개의 기본이동평균선과 추가로 1개의 이동평균선을 조합하여 합을 구하고, 각 이동평균선이 가지고 있는 시간의 값을 산출하는 단계; 적용 분봉표를 생성하는 단계; 상기 실전 적용 분봉에서 아래의 3가지의 필수조건을 충족하는 분봉의 종목을 선정하는 단계; ①차조건: 기본이동평균선 10일선 × 추가이동평균선, ②차조건: 기본이동평균선 40일선 × 추가이동평균선, ③차조건: 추가이동평균선 × 추가이동평균선의 배수이동평균선을 포함하여 이루어지는 것을 특징으로 한다.In addition, the present invention provides a method of selecting an item, the method comprising: selecting an item; Displaying a moving average line for the selected item; displaying a moving average line of the spread / daily chart; Obtaining a sum by combining the four basic moving average lines and the one moving average line, and calculating a time value of each moving average line; Generating an application distribution table; Selecting an item of the spectroscopy satisfying the following three essential conditions in the practical application distribution; (1) Basic condition: basic moving
이때, 5일/10일/20일/40일 이동평균선이 기본이동평균선이고, 추가되는 1개 이동평균선 60일 이동평균선을 특징으로 한다.At this time, the 5-day / 10-day / 20-day / 40-day moving average line is the basic moving average line, and the additional one moving average line is characterized by the 60-day moving average line.
그리고, 상기 5개 이동평균선의 합에 대해서 시간의 값을 산출시 日일 정규시간 6.5시간을 기준점으로 하는 것을 특징으로 한다.And, when calculating the time value with respect to the sum of the five moving average lines, the reference point is 6.5 hours of day and day regular time.
통계에 의하면 주식투자가의 80% 이상이 주식투자로 손실을 본다고 한다. 그 이유는 주식투자에 관한 기본지식(예컨대 기업분석, 정보분석 등)과 능숙한 HTS 활용능력을 포함한 자신만의 투자방식이나 매매기법이 부족하기 때문이다. 따라서 개인 투자가들은 투자의 고수들이나 메이저들이 어떤 기준으로 종목을 선정하고, 어느 시점에서 매수하고 어느 시점에서 매도하는지를 알지 못하는 한 주식투자에 실패할수 밖에 없는 것이다. 본 발명은 이러한 현실에서 이동평균선의 분석만으로도 용이하게 매직 포인트를 찾아서 성장종목을 선정하고 시기 적절한 투자시점을 알 수 있도록 하여, 개인 투자가에게 안전하고도 신뢰성 있는 투자방법을 제공하는데 탁월한 공헌을 할 것이다.Statistics show that more than 80% of stock investors see losses from stock investments. The reason for this is that there is a lack of investment methods and trading techniques, including basic knowledge about stock investment (eg, corporate analysis, information analysis, etc.) and proficient HTS utilization ability. As a result, individual investors will fail to invest in stocks unless they know what stocks, major stocks, and stocks will be selected, at what point in time they will buy and sell at some point. The present invention will make an excellent contribution to providing a safe and reliable investment method to individual investors by allowing the user to easily find the magic point by only analyzing the moving average line to select the growth item and know the timing of the investment in a timely manner .
도 1은 주식거래운영시스템을 나타내는 간략 구성도,
도 2는 일실시예 (단기)에 따른 주식투자방법 흐름도
도 3은 일실시예(중단기)에 따른 주식투자방법 흐름도
도 4 내지 도 5는 본 발명에 따른 분봉 이동평균선을 도시한 그래프
BRIEF DESCRIPTION OF THE DRAWINGS FIG. 1 is a schematic diagram showing a stock trading operating system,
FIG. 2 is a flow chart of a stock investment method according to an embodiment (short-term)
FIG. 3 is a flow chart of the stock investment method according to one embodiment
FIGS. 4 to 5 are graphs showing the moving average line along the present invention
[도 1]은 HTS를 통한 주식거래 시스템을 나타내며, 각 증권사들은 온라인을 통해 증권 거래가 가능하도록 운영자 서버(100)를 구축하고 고객 또는 투자가들에게 다양한 종목 검색 정보를 제공한다.FIG. 1 shows a stock trading system using HTS. Each securities company constructs an
고객단말기(300)는 고객의 신상데이터를 입력받아 운영자 서버(100)에 전송하고, 운영자서버에서 제공되는 각종 정보를 제공받으며, 고객의 매도 및 매수주문을 입력하여 전송한다. 고객단말기(300)는 개인용 컴퓨터, 스마트폰 등 인터넷이 가능한 단말기로서, 앱을 다운로드 받아, 사용자ID, 비밀번호, 공인인증이 되어 로그인을 완료하면, 계좌비밀번호 설정 창이 나오고 계좌비밀번호가 입력되면 HTS 실행 메인화면이 나와서 주식거래에 필요한 기능들을 실행하게 된다.The
운영자 서버(100)는 실제 주식거래 현황과 연동하는 HTS 프로그램을 운영하고, 상기 고객의 신상에 관한 데이터베이스를 구축하여 거래 내역을 저장한다. 또 주식종목별 데이터베이스를 구축하고, 각 종목별 이동평균선을 제공하는 모듈을 구축하며, 사용자 인터페이스를 통해 사용자가 선택하는 종목별 이동평균선 분석자료를 제공하는 모듈을 구축하고 있다. 투자가 (이하 사용자라고 칭하기도 한다.)들은 인터넷 망을 통해 자신의 단말기를 통하여 운영자 서버가 제공하는 HTS에 접속하여 금융상품들을 임의로 선택하고, 이동평균선을 분석하여 투자종목과 시기를 결정하는데,HTS에는 종목 검색기능, 검색된 종목에 대한 다양한 정보제공 메뉴들 및 계좌관리 기능 등과 같은 기능들이 포함되어 있다. The
오늘날 인터넷을 통한 주식, 채권, 선물, 옵션, 지수, 외환 등 금융 상품들의 거래 (이하 주식거래라고 총칭한다) 가 주로 HTS를 통해 이루어지고 있는데, HTS를 활용하기 위해서는 주식거래에 필요한 메뉴들과, 화면번호, 화면툴바, 티커(국내외 지수,환율, 업종 등락현황, 투자자별 매매, 관심종목 등) 등이 사용자 인터페이스로 실시간 제공되는데, 이들에 대한 사항은 본 발명의 기술적 사상이 아니므로 자세한 설명을 생략하고, 본 발명을 이해하기 위한 기본개념들 위주로 설명하겠다.Today, trading of financial products such as stocks, bonds, futures, options, indices and foreign currencies through the Internet (collectively referred to as stock trading) is mainly conducted through HTS. In order to utilize HTS, Screen number, screen tool bar, ticker (domestic and overseas index, exchange rate, trading status of trader, trader by investor, interested item, etc.) are provided in the user interface in real time. Since these matters are not technical idea of the present invention, And the basic concepts for understanding the present invention will be mainly described.
본 발명에서 사용되는 캔들 그래프로 표시된 주가차트, 이동평균선은 현재 통용되는 개념으로 설명한다. 주가는 시가(당일 시작가격), 고가(당일 최고 가격), 저가(당일 최저가격), 종가(당일 마감가격)으로 구성되며 캔들 그래프로 표시되는데, 시가보다 종가가 높은 캔들은 양봉 (주가가 상승했다는 의미), 시가보다 종가가 낮은 캔들은 음봉(주가가 하락했다는 의미)이라고 한다. 이동평균선은 일정기간 종가의 합을 그 기간으로 나눈 값을 이은 선이다.The stock price chart and the moving average line indicated by the candle graph used in the present invention are described in the currently used concept. The share price is composed of the market price (starting price on the day), high price (the highest price on the day), low price (the lowest price on the day) and closing price (closing price on the same day) ), And a candle with a lower closing price than the market price is called a pit (meaning that the price has fallen). The moving average line is the sum of the closing price for a certain period divided by the period.
I. 종목의 선정 (S100)I. Selection of items (S100)
사용자는 HTS에서 제공하는 화면상에서 무작위로 종목을 선택하거나 관심종목을 저장하여 시세 및 각종 정보를 편리하게 조회할 수 있다.The user can randomly select an item on the screen provided by the HTS or store the item of interest to conveniently inquire the price and various information.
증권사 또는 증권정보제공 업체에서 제공되는 호가, 호가별 잔량, 현재가, 체결가, 체결수량 등의 정보는 사용자의 단말기에 표시되고, 사용자는 HTS에서 제공되는 상기 정보들을 실시간으로 접속하여 종목을 검색한 후, 희망하는 종목에 가격 및 해당 가격에 대한 매수 수량을 입력함으로써 주문이 이루어지게 된다. The information such as the offer price, the remaining price per offer price, the current price, the contracted price, the contracted quantity, and the like provided by the securities company or the securities information provider is displayed on the user's terminal, and the user accesses the information provided by the HTS in real- , The order will be made by entering the price in the desired item and the purchase quantity for the price.
II. 이동평균선의 표시(S200) II. Display of moving average line (S200)
[도 2] 및 [도 4]를 통해, 본 발명에 따른 일실시예인 종목 결정 및 투자시점 방법을 설명한다.2 and 4, an item selection and investment time point method according to an embodiment of the present invention will be described.
투자가가 HTS 상에서 임의의 종목을 무작위 또는 조건검색을 통해 선택하면, 선택된 종목에 대해 기준시점에서 이동평균선이 표시된다. (S200 단계)If the investor selects any item on the HTS through a random or conditional search, a moving average line is displayed at the base point for the selected item. (Step S200)
이동평균선은 매일의 주가 평균인 이동평균 (Moving Average)들을 연결한 선으로서, 과거의 일정기간 동안의 평균치를 현재로 표현하는 것이며, 이론적으로 무한한 이동평균선이 존재한다. [도 4]는 HTS에서 사용자 단말기에 제공되는 이동평균선의 일실시예로서 5일, 10일, 20일, 40일, 60일 이동평균선이 사용된 것이다.The moving average line is a line connecting moving average, which is the average of daily stock prices. It represents the average value of past past period, and theoretically there is infinite moving average line. FIG. 4 is a diagram illustrating a moving average line provided to the user terminal in the HTS, in which 5, 10, 20, 40, and 60 moving average lines are used.
[도 4a]에는 Pink, Blue, Yellow, Green, Black 색상의 곡선들이 각각 5일, 10일, 20일, 40일, 60일의 이동평균선을 나타낸다.In FIG. 4a, curves of Pink, Blue, Yellow, Green, and Black colors represent moving average lines of 5 days, 10 days, 20 days, 40 days, and 60 days, respectively.
이러한 이동평균선은 지지선이나 저항선의 중요한 기능을 하는 것으로, 투자가들이 자신이 매입한 가격보다 낮은 가격에는 주식을 쉽게 팔지 않을 것이라는 심리를 이용하여, 이동평균선은 주가 하락의 중요한 지지선으로 활용될 수 있고, 반대로 하락하던 주가가 반등해 이동평균선에 근접할 때 손실을 만회하려는 투자자들이 일시에 주식을 내다 팔 경우 저항선이 된다. 또 이동평균선에서 정배열 상태는 주가가 상승세를 보이고 있다는 것이고, 단기 및 장기 이동평균선이 서로 크로스 하는 지점은 단기 이동평균선이 장기 이동평균선을 상향 돌파하는 상황으로서, 증시가 강세시장으로 변한다고 판단하며 매수를 하는 시점이다. These moving average lines play an important role in supporting lines or resistance lines. Using the sentiment that investors will not sell stocks at prices lower than the price they buy, moving average lines can be used as an important support line for stock price declines, On the other hand, investors who want to make up for the loss when the stock price rebounding nears the moving average rebound, will be a resistance line if they sell the stock at a time. The short-term moving average crosses the long-term moving average, which indicates that the stock market has turned to a bullish market. .
상기 [도 4a]에서 20 이동평균선은 과거 20일 동안의 종가를 단순평균 낸 값을 매일 점으로 표시하고, 이를 계속 이어서 표시하는 20일 단순이동평균선이다.단순 이동평균선 20일 이동평균선은 과거 20일의 데이터를 합산하여 20으로 나누는 방식이다. 평균치는 가장 오래된 데이터는 빠지고 새로운 데이터가 추가되는 과정을 반복되는데, 만약 높은 수치가 바람직하지 않은 방법으로 반영된다면 평균 수치에 왜곡현상이 일어날 수 있으며, 후행성으로 인해 최초 주가를 신속하게 반영하지 못한다. In FIG. 4A, the 20 moving average line is a 20-day simple moving average line that displays a simple average value of the closing price for the past 20 days as a daily point and displays it continuously. The data of the day is summed and divided by 20. The average value repeats the process of adding the oldest data and adding new data. If the high value is reflected in an undesirable way, the average value may be distorted and the initial price can not be reflected quickly due to the background.
이러한 문제를 해결하기 위해, 가중치를 각기 달리 부여하여 평균치를 산출하는 방식으로 가중이동평균선이 사용될 수 있다. 가중이동평균선은 후행성을 완화하기 위해 최근 주가일수록 높은 가중치를 부여하여 계산을 하는 방식이다. 지수이동평균선은 단순이동평균선의 후행성을 어느 정도 완화시키면서 더욱 정교하게 완화시키는 방법으로서, 최근 주가에 가중치를 두면서 점진적으로 다음 데이터에도 가중치를 완만하게 줄이면서 산정하는 방식이다. To solve this problem, a weighted moving average line can be used in a manner of calculating the average value by assigning different weights to each other. The weighted moving average line is calculated by applying a higher weight to the recent stock price in order to alleviate the posteriority. The exponential moving average line is a method of mitigating the delinquency of the simple moving average line to a more elaborate level. It is a method of gradually decreasing the weight to the next data while gradually weighting the stock price.
주가의 단기추세를 예민하게 점검할 때는 지수이동평균선이 유용하겠지만, 주가의 장기 추세를 추적할 때는 가중치로 인해 데이터가 왜곡되지 않기 때문에 단순이동평균선이 바람직하다. 본 발명은 상기 모든 산정방식에 적용될 수 있다. The exponential moving average can be useful for sensitive short-term trends of stock prices. However, when tracking long-term trends of stock prices, the simple moving average is preferable because the data is not distorted due to the weight. The present invention can be applied to all of the above calculation methods.
HTS상에서 이동평균선은 각 증권사가 제공하는 프로그램에 따라 조금씩 상이하게 표시될 수 있으나, 통상 차트종합설정에서 다양한 이동평균선 설정이 가능하다. 이동평균선을 표시하는 방법은 종목, 일자와 기준값을 입력하고 차트를 만들거나, 차트 요소의 추세선 추가를 통해 이동평균선을 추가할 수 있다. 또 이동평균선을 분봉으로 구하는 방식은 HTS 프로그램을 접속하여 저장된 지표를 불러오면 분봉에 일봉의 이동평균선이 표시되므로, 소정의 날짜만 바꾸면 구해질 수 있는데, 이러한 방법은 프로그램적인 요소로서 본 발명의 요지가 아니므로 상세한 설명은 생략한다. The moving average line on the HTS can be slightly different depending on the program provided by each securities company, but it is possible to set various moving average lines in the general chart setting. To display the moving average line, you can add a moving average line by entering a line item, a date and a reference value, creating a chart, or adding a trend line of a chart element. In addition, the method of obtaining the moving average line by the spectrometric method can be obtained by changing only the predetermined date since the moving average line is displayed on the spectrometer when the stored index is loaded by connecting the HTS program. This method is a program element, And therefore, detailed description thereof will be omitted.
III. 분봉 차트의 이동평균선 표시 (S300) III. Displaying the moving average line of the distribution chart (S300)
[도 4a] 내지 [도 4e]를 통해, 본 발명의 분봉 이동평균선을 설명한다. 4 through Fig. 4E, the segmented moving average line of the present invention will be described.
본 발명은 선택된 종목의 이동평균선을 분봉 차트의 이동평균선으로 표시하는데, 사용자 단말기에는 분봉 차트로 각 이동평균선이 표시된다. 이처럼 분봉 이동평균선을 사용하는 이유는, 조금 더 빠른 매수 매도 타이밍을 찾아내기 위한 것이다. [도 4]에 나타난 봉 (Candle) 들은 매매가 일어나는 시간을 일정한 간격으로 분할하고 각 구간 내의 주가 변화를 시가, 고가, 저가 그리고 종가 등만을 상하 직사각형 및 꼬리로 표현된 봉(Candle)으로 단순화시킨 후, 각 시각에서의 봉들의 나열한 형태로 표현된 것이다. The present invention displays the moving average line of a selected item as a moving average line of the distribution chart, and the user terminal displays each moving average line as a distribution chart. The reason for using the spreading moving average line in this way is to find the timing of buying a little earlier. The candles shown in FIG. 4 are obtained by dividing the time at which the sale occurs at regular intervals, and simplifying the stock price change in each section into candles represented by upper and lower rectangles and tails only, such as cigars, high prices, low prices, and closing prices , Which are expressed in the form of the bars at each time.
각 봉의 단위시간 간격에 따라 1분봉 봉차트, 5분봉 봉차트, 1일 단위의 일봉차트, 주단위의 주봉차트, 월단위의 월봉차트 등 다양한 형태의 봉차트가 만들어 질수 있다. 이렇게 차트 상에 표시될 수 있는 분봉의 종류는 1,3,5...60분봉으로 다양하게 존재하며, 1분봉의 경우 봉 하나가 1분을 나타내고, 5분봉은 봉 하나가 5분을 나타낸다. 따라서 분봉의 숫자가 낮은 이동평균선을 사용할수록 더 세밀한 차트가 만들어 지면서 빠른 매수매도 타이밍을 찾아낼 수 있고, 보다 장기적인 매수매도를 위해서는 분봉의 숫자가 높은 이동평균선을 사용하게 되는 것이다. Depending on the unit time interval of each rod, various types of rod charts can be made, such as a one-bar chart, a five-bar chart, a daily chart, a weekly main chart, and a monthly chart. In this way, the kinds of the spectroscopic markings that can be displayed on the chart are various in the range of 1, 3, 5... 60, and one bar indicates one minute, and the 5 minute bar indicates five minutes . Therefore, using the moving average line with a smaller number of seals, a more detailed chart can be created to find the timing of a quick buy-in, and a moving average line with a higher number of seals is used for a longer-term buy-sell.
[도 4a]는 일봉 이동평균선, [도 4b]는 480분봉 이동평균선을 나타낸다. 일봉은 봉 하나가 하루의 가격 변화를 나타내는 것이므로, 일봉보다 더 장기적인 추세를 알기 위해서 주봉을 사용할 수 있고, 주봉보다 더 장기적 추세를 파악하기 위하여 월봉을 사용한다. FIG. 4A shows a single-bar moving average line, and FIG. 4B shows a 480-bar moving average line. Since one rod represents a change in the price of one day, the main bar can be used to know a longer-term trend than the other, and the wolbon is used to identify a longer-term trend than the main bar.
아래 [표 1]에서 시간 단위로 분봉이 산출되는 방식을 살펴본다. In the following [Table 1], we will look at how the division is calculated in units of time.
현재 우리나라의 증권거래는 오전 9시에 시작하여, 오후 3시 반에 마감할 때 까지 1일 봉 개수는, 1시간 단위로 생성되는 분봉은 6.5개가 형성된다. 즉, 1일간 60분봉은 6.5개가 생성되므로, 30분봉(30분 단위로 생성되는 분봉)은 13개의 봉이 생성되고, 15분봉은 26개, 5분봉은 78개, 1분봉은 390개가 생성된다. Currently, Korea's securities trading starts at 9 am and ends at 3:30 pm, and the number of bars per day is 6.5. In other words, since 6.5 pieces are produced per day for 60 minutes, the number of bars for 30 minutes (13 minutes for bars produced in 30 minutes), 26 for 15 minutes, 78 minutes for 5 minutes, and 390 minutes for 1 minute.

상기 표 1에 의거하여 1분봉은 390개의 캔들 (봉)이, 0.5분봉은 780개의 캔들이 하루에 생성된다. 이를 달리 표현하면, 1분봉의 60 이동평균선(1시간)은 60개의 봉으로 나타나고, 0.5분봉의 120 이동평균선(1시간)은 120개의 봉으로 나타난다. Based on the above Table 1, 390 candles (rods) for 1 minute and 780 candles for 0.5 minute are produced in one day. In other words, 60 moving average lines (1 hour) of 1 minute are represented by 60 bars, and 120 moving average lines of 0.5 minutes (1 hour) are 120 bars.
1분봉 120 이동평균선, 0.5분봉 240 이동평균선의 발생 시점을 보면, 1분봉 60 이동평균선이 1시간이면, 120 이동평균선은 2시간. 0.5분봉 120 이동평균선이 1시간이면, 240 이동평균선은 2시간이므로, 장 시작 2시간 (오전 11시) 후에 1분봉은 120 이동평균선이, 0.5분봉은 240 이동평균선이 생긴다. 1분봉 120 이동평균선이 2시간이면, 240 이동평균선은 4시간 (오후 1시)에 생성된다. 0.5분봉 역시 240 이동평균선이 2시간이면 480 이동평균선은 4시간(오후 1시)에 생성된다. In the case of 1 minute interval, 120 moving average line and 0.5 minute interval 240 moving average line are observed, one moving average line is 1 hour and the 120 moving average line is 2 hours. 0.5 minutes 120 When the moving average line is 1 hour, the 240 moving average line is 2 hours. Therefore, 120 minutes of moving average for 1 minute and 240 times of moving average for 0.5 minute is generated after 2 hours (11:00 am). 1 Split 120 If the moving average line is 2 hours, the 240 moving average line is created at 4 hours (1:00 pm). In the case of 0.5 minutes, 240 moving average lines are created in 2 hours and 480 moving average lines are generated in 4 hours (1:00 pm).
따라서 사용자 단말기에서는 9시에 장이 시작된 후, 정확히 1시간 후에는 1분봉은 60 이동평균선이, 0.5분봉은 120 이동평균선이 생성되는 것을 볼 수 있고, 장이 시작된 1시간 후 (오전 10시)에 생성되는 1분봉 60 이동평균선 또는 0.5분봉 120 이동평균선 아래에 있는 주가의 종목은 투자 종목으로 바람직하지 않다.Therefore, it can be seen that the user terminal generates 60 moving average lines for 1 minute and 120 moving average lines for 0.5 minute after exactly 1 hour after the start of the day at 9:00 am and 1 hour after the day starts (at 10:00 am) Stocks that are below the 1-minute 60-moving average or the 0.5-minute 120-moving average are not desirable as investment items.
상기한 로직에 의해, 각 종목별 분봉 차트의 이동평균선이 생성되며, 현재 시점에서 각 시간마다 생성되는 이동평균선 아래에 있는 주가의 종목은 투자하지 않는 것이, 본 발명에 의한 안전한 투자방법의 일 실시예이다. The above logic generates a moving average line of a distribution chart for each item and does not invest stocks of a stock price below the moving average line generated at each time in the present time. In the embodiment of the safe investment method according to the present invention to be.
IV. 이동평균선에 '시간의 값' 도입 (S400)IV. The 'value of time' is introduced into the moving average line (S400)
상기 방식으로 투자를 하게 된다면 안전한 투자가 될 것이지만, 현실적으로 短 분봉일수록 메이저 투자가들의 영향력으로 불규칙적인 롤링이 발생하므로, 주가가 방금 생성시킨 이동평균선을 올라왔다가 빠졌다가를 쉽게 반복하기 때문에 개인투자가들의 입장에서는 절대 감당하기가 쉬운 일이 아니다. 이에 본 발명은 보다 중장기적인 분석을 통해 투자종목과 시기를 선택하기 위해, 아래와 같이 이동평균선에 '시간의 값' 개념을 도입하게 된 것이다.If the investment is made in this way, it will be a safe investment, but in reality, the shorter the spread, the more irregular rolling occurs due to the influence of major investors. Therefore, the stock price has risen above the moving average line that has just been created, It is not easy to bear in absolute terms. Accordingly, the present invention introduces the concept of 'value of time' in the moving average line as below to select investment items and time periods through more mid-term analysis.
본 발명은 주가의 이동패턴을 일봉 이동평균선 내지 480분봉 이동평균선의 흐름에서 파악,분석한다. 현재 주식시장에서는 5일선 위, 10일선 위, 20일선 방어등의 다양한 주가 이동패턴 이론들이 제안되고 있지만, 특정 종목의 주가를 움직이는 메이저 세력들은 이러한 패턴으로 운용하지 않는다는 것을 오랜 관찰과 경험칙으로 알 수 있었고, 주가가 움직이는 것은 5개의 이동평균선의 합으로 나타난다는 것을 알게 되었다. The present invention grasps and analyzes the movement pattern of the stock price in the flow of the daily moving average line to the 480 minute moving average line. In the current stock market, various stock movement pattern theories such as 5-day line, 10-day line, and 20-day line defense have been proposed. However, it is a long observation and empirical rule that major forces moving stock prices of certain stocks do not operate in this pattern. And that the stock price moves is the sum of the five moving average lines.
즉 본 발명은 주가의 움직임이, 항상 기본이 되는 4개의 이동평균선과 추가로 더해지는 이동평균선, 즉 5개의 이동평균선 합을 구하고, 주가는 그 합들의 선행조건들이 전부 충족되어졌을 때 움직인다는 규칙을 확인되었다. 또 주가의 움직임은 단순히 가격이 아닌 시간의 개념으로 움직인다는 점을 포착하고 그 개념을 도입하게 되었다. That is, the present invention is based on the assumption that the movement of the stock price always obtains four basic moving average lines and a further moving average line, that is, five moving average line sum, and moves the stock price when all the prerequisites of the sums are satisfied . Also, the movement of the stock price captures the fact that it moves by the concept of time rather than price, and introduces the concept.
현재 일봉 차트에서 나타나는 이동평균선은 그 속에 시간의 값이 내포되어 있는 것이며, 상기 기본이 되는 4개 이동평균선에 1개가 추가되는, 5개 이동평균선 합에 각각의 시간의 값을 합하여 가중치를 구한다.The moving average line appearing in the current chart is a value of time included in the moving average line, and the weights are obtained by adding the values of the respective times to the sum of the five moving average lines in which one is added to the four moving average lines.
임의의 종목별로 이동평균선이 표시되는 경우, 기본이 되는 이동평균선 4개에 1개의 추가로 더해지는 이동평균선의 합을 구하고, 주가는 그 합들의 선행조건들이 전부 충족되어 졌을 때 움직이므로, 이 구간에서 매직 포인트(Magic Point: MP) 시점을 구한다. 본 발명에서 매직 포인트(Magic Point: MP) 란, 투자가가 이동평균선 상에서 매수 또는 매도를 하는 적정 시기 또는 구간을 나타내는 용어이고, 매직 포인트 이외의 주가의 움직임은 투자할 구간 또는 시기가 아닌 것을 나타내는 용어이다. If a moving average line is displayed for any item, the sum of the moving average lines plus one additional moving average line is added to the basic moving average line, and the stock price moves when the preceding conditions of the sums are all satisfied. Find the Magic Point (MP) point. In the present invention, a Magic Point (MP) is a term indicating an appropriate period or period during which an investor makes a purchase or sale on a moving average line, and a term other than a magic point indicates a period to be.
아래 [표 2]를 통해, 본 발명에 의한 이동평균선의 합을 산출하는 방식을 설명한다. 아래 좌측 박스 속의 4개의 이동평균선 (A)과 우측 박스 속에서 선택될 수 있는 1개의 추가되는 이동평균선 (B)의 조합으로 '5개 이동평균선' 이 생성된다. 상기 5개 이동평균선 합으로 시작하여, 각 이동평균선이 가지고 있는 시간의 값이 산출된다. A method of calculating the sum of moving average lines according to the present invention will be described with reference to Table 2 below. A 'five moving average line' is generated by a combination of four moving average lines A in the lower left box and one additional moving average line B that can be selected in the right box. Starting with the five moving average sum, the value of the time of each moving average line is calculated.
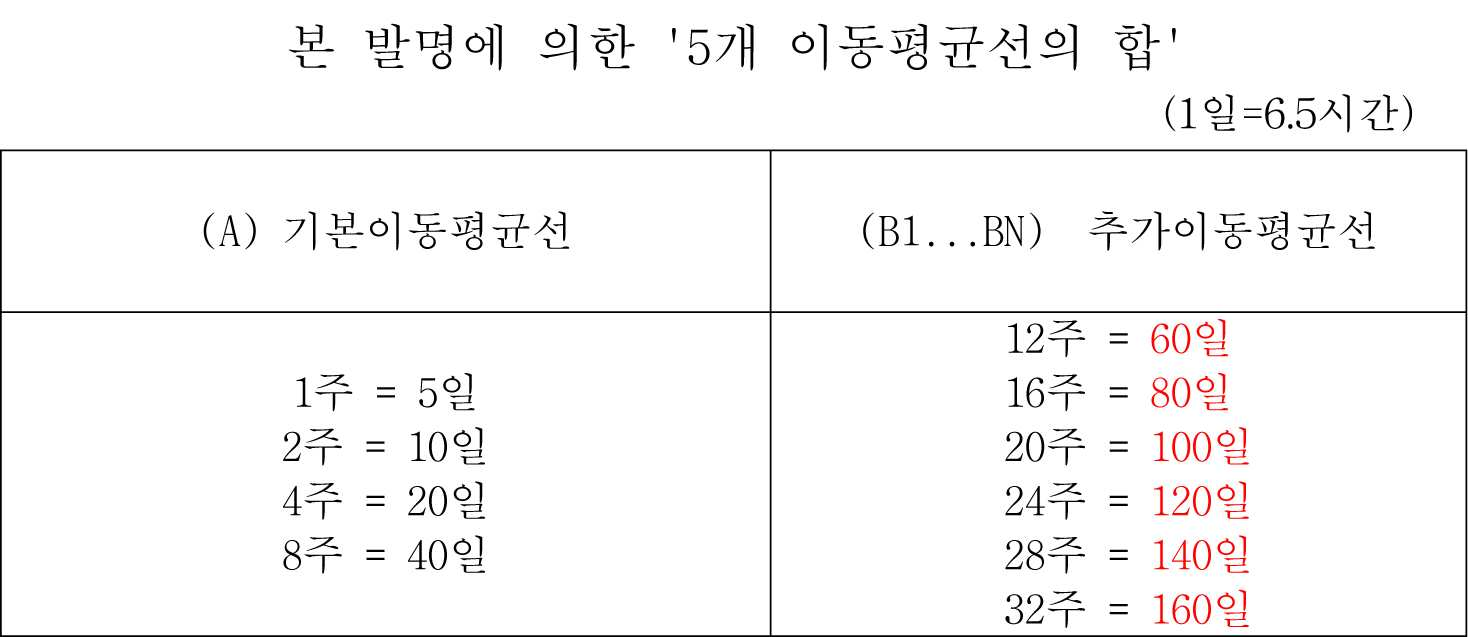
상기 표 2에서 기본이동평균선 4개 (A)가 중심이며 , 거기에 나머지 한 개의 이동평균선(B)가 추가되어, 투자시점인 매직 포인트(Magic Point: MP)가 생성되며, 이러한 방식을 수식으로 표현하면 다음과 같다.In Table 2, four basic moving average lines (A) are centered, and another moving average line (B) is added thereto to generate a Magic Point (MP) as an investment time point. Here is the expression.
매직 포인트 산출식 : A + B = MP Magic point calculation formula: A + B = MP
상기 방식에 따르면 5일/10일/20일/40일 이동평균선이 기본이동평균선 (A)이고, 거기에 추가되는 이동평균선은 이론적으로 N개로 무한대이지만, 현실적으로 가장 유용하고 또한 매직 포인트 매커니즘의 1단계이기도한 첫 관문은 60일 이동평균선으로서 A + B(60일 이평선)이 MP가 된다. 상기 표 2에서는 6개의 매직 포인트의 실시 예가 나타나 있다. According to the above method, the moving average line of 5 days / 10 days / 20 days / 40 days is the basic moving average line (A), and the moving average line added to it is theoretically infinite with N number. However, The first gateway to the stage is the 60-day moving average, which is the A + B (60-day horizon) MP. In Table 2 above, an embodiment of six magic points is shown.
본 발명은 상기한 기본이동평균선(A)에 주가 형성 세력의 중심선이라 할 수 있는 20일선과, HTS 프로그램 및 현실 거래시장에서는 중요시 되지 않거나 대부분 취급되지 않는 숨겨진 선 40일선을 기본이동평균선으로 구성하는 것이, MP를 생성하는데 가장 바람직한 것을 알게 되었다. 또 본 발명은 상기 5개 이동평균선에는 각각의 '시간의 값'을 내포하고 있는 점에 착안하여, 상기 5개 이동평균선의 합에 대해서 '시간의 값'을 日일 정규시간 '6.5시간'으로 하여 기준점으로 하는데 중요한 기술적 의미가 있다. The present invention is based on the above-mentioned basic moving average line (A), which is the center line of the stock price forming power, and the HTS program and the hidden moving line which is not considered in the real market It was found to be the most desirable to generate MP. The present invention is based on the fact that each of the five moving average lines contains the respective values of 'time', and the value of 'time' is added to the sum of the five moving average lines as a day-to-day regular time '6.5 hours' There is an important technical meaning to make it a reference point.
본 발명가는 오랜 기간에 걸친 분석 과정에서 기준점을 1주일, 15일, 한 달 등 매우 다양한 시간단위를 적용해 보았으나 이 경우 유의적인 결과를 얻을 수 없었고, 결국 日일 정규시간 '6.5시간'으로 하여 기준점을 정했을 경우 주가의 움직임의 패턴과 본 발명의 MP가 신뢰도가 있음을 확인하게 되었다. The present inventor has applied a very different time unit such as 1 week, 15 days, and 1 month to the reference point in the analysis process over a long period of time, but in this case, no significant result was obtained, In the case where the reference point is determined, it is confirmed that the MP of the present invention and the pattern of movement of the stock price are reliable.
따라서 본 발명은 5개 이동평균선에 내포된 시간의 값을 6.5시간으로 기준점을 정하고, 이에 따라 5일/10일/20일/40일 + 추가이동평균선 1개의 조합의 합은 日정규시간인 6.5시간의 공식을 도출하게 되었다. 이하 상기 설명은 하기 [표 3] 내지 [표 6]을 통해 설명한다. Therefore, in the present invention, the reference point is defined as 6.5 hours, and the sum of the combinations of 5 days / 10 days / 20 days / 40 days plus one additional moving average line is 6.5 The time formula was derived. Hereinafter, the above description will be described with reference to [Table 3] to [Table 6].
아래 [표 3]을 통해, 매직 포인트 40 × 60의 일실시예인 A + B (60일 이동평균선)로서 40 이동평균선과 60 이동평균선을 살펴본다. Through Table 3 below, 40 moving average lines and 60 moving average lines are examined as A + B (60 day moving average line) which is one example of the Magic Point 40 × 60.

상기 6분봉은 일봉차트를 분봉으로 표현하기에 가장 적합한 방식이므로, 6분봉 값(x)를 구하는 것이다. 상기 각 이동평균선의 일봉 값 (a: 5,10,20,40,60)에 상기 기준점이 되는 65 (정규시간 6.5)을 곱하면, 1일 6분봉 값 (x)이 산출된다. 즉 6분봉 각각의 이동평균선 값은, 각각의 이동평균선 일봉 값과 日 정규시간(6.5시간)의 곱과 같다.Since the 6-minute span is the most suitable method for expressing the daily chart as a span, the 6-span value (x) is obtained. (6, 6) is calculated by multiplying the value of the moving average line (a: 5, 10, 20, 40, 60) by the reference point 65 (regular time 6.5). That is, the moving average value of each of the six minute bars is equal to the product of the daily average value of each moving average line and the day normal time (6.5 hours).
6분봉 값 산출식 : a × 65 = X 6 Segment value calculation formula: a × 65 = X
상기 산출 식에 따라, 1주에는 5 × 65 = 325, 2주에는 10 × 65 = 650, 4주에는 20 × 65 = 1300, 8주에는 40 × 65 = 2600, 12주에는 60 × 65 = 3900의 6분봉 값이 각각 산출된다. According to the above calculation formula, 5 × 65 = 325 for 1 week, 10 × 65 = 650 for 2 weeks, 20 × 65 = 1300 for 4 weeks, 40 × 65 = 2600 for 8 weeks and 60 × 65 = 3900 Quot; 6 "
상기 6분봉 값(x)가 산출되면, 아래 [표 4]와 같이 각각의 일봉 이동평균선이 가진 일봉 시간값(Y)를 산출할 수 있다. 아래 [표 4]에서는 일봉 시간 값(Y)는 5개의 이동평균선 조합의 합이 日정규시간(6.5시간)과 동일하게 맞아떨어지도록 기준 값을 입력하여 산출한다.When the six-divided value x is calculated, the full-time value Y of each of the two-way moving average lines can be calculated as shown in Table 4 below. In the following Table 4, the full time value (Y) is calculated by inputting the reference value so that the sum of the five moving average line combinations equals the day normal time (6.5 hours).

2.41 + 4.82 + 9.63 + 19.26 + 28.89 = 65.00 (日 기준값 합)2.41 + 4.82 + 9.63 + 19.26 + 28.89 = 65.00 (Sum of daily reference values)
상기 방법으로 일봉 이동평균선의 다양한 분봉표는 아래 [표 5] 와 같이 나타낼 수 있다.In this way, the various charts of the moving average line can be expressed as shown in Table 5 below.
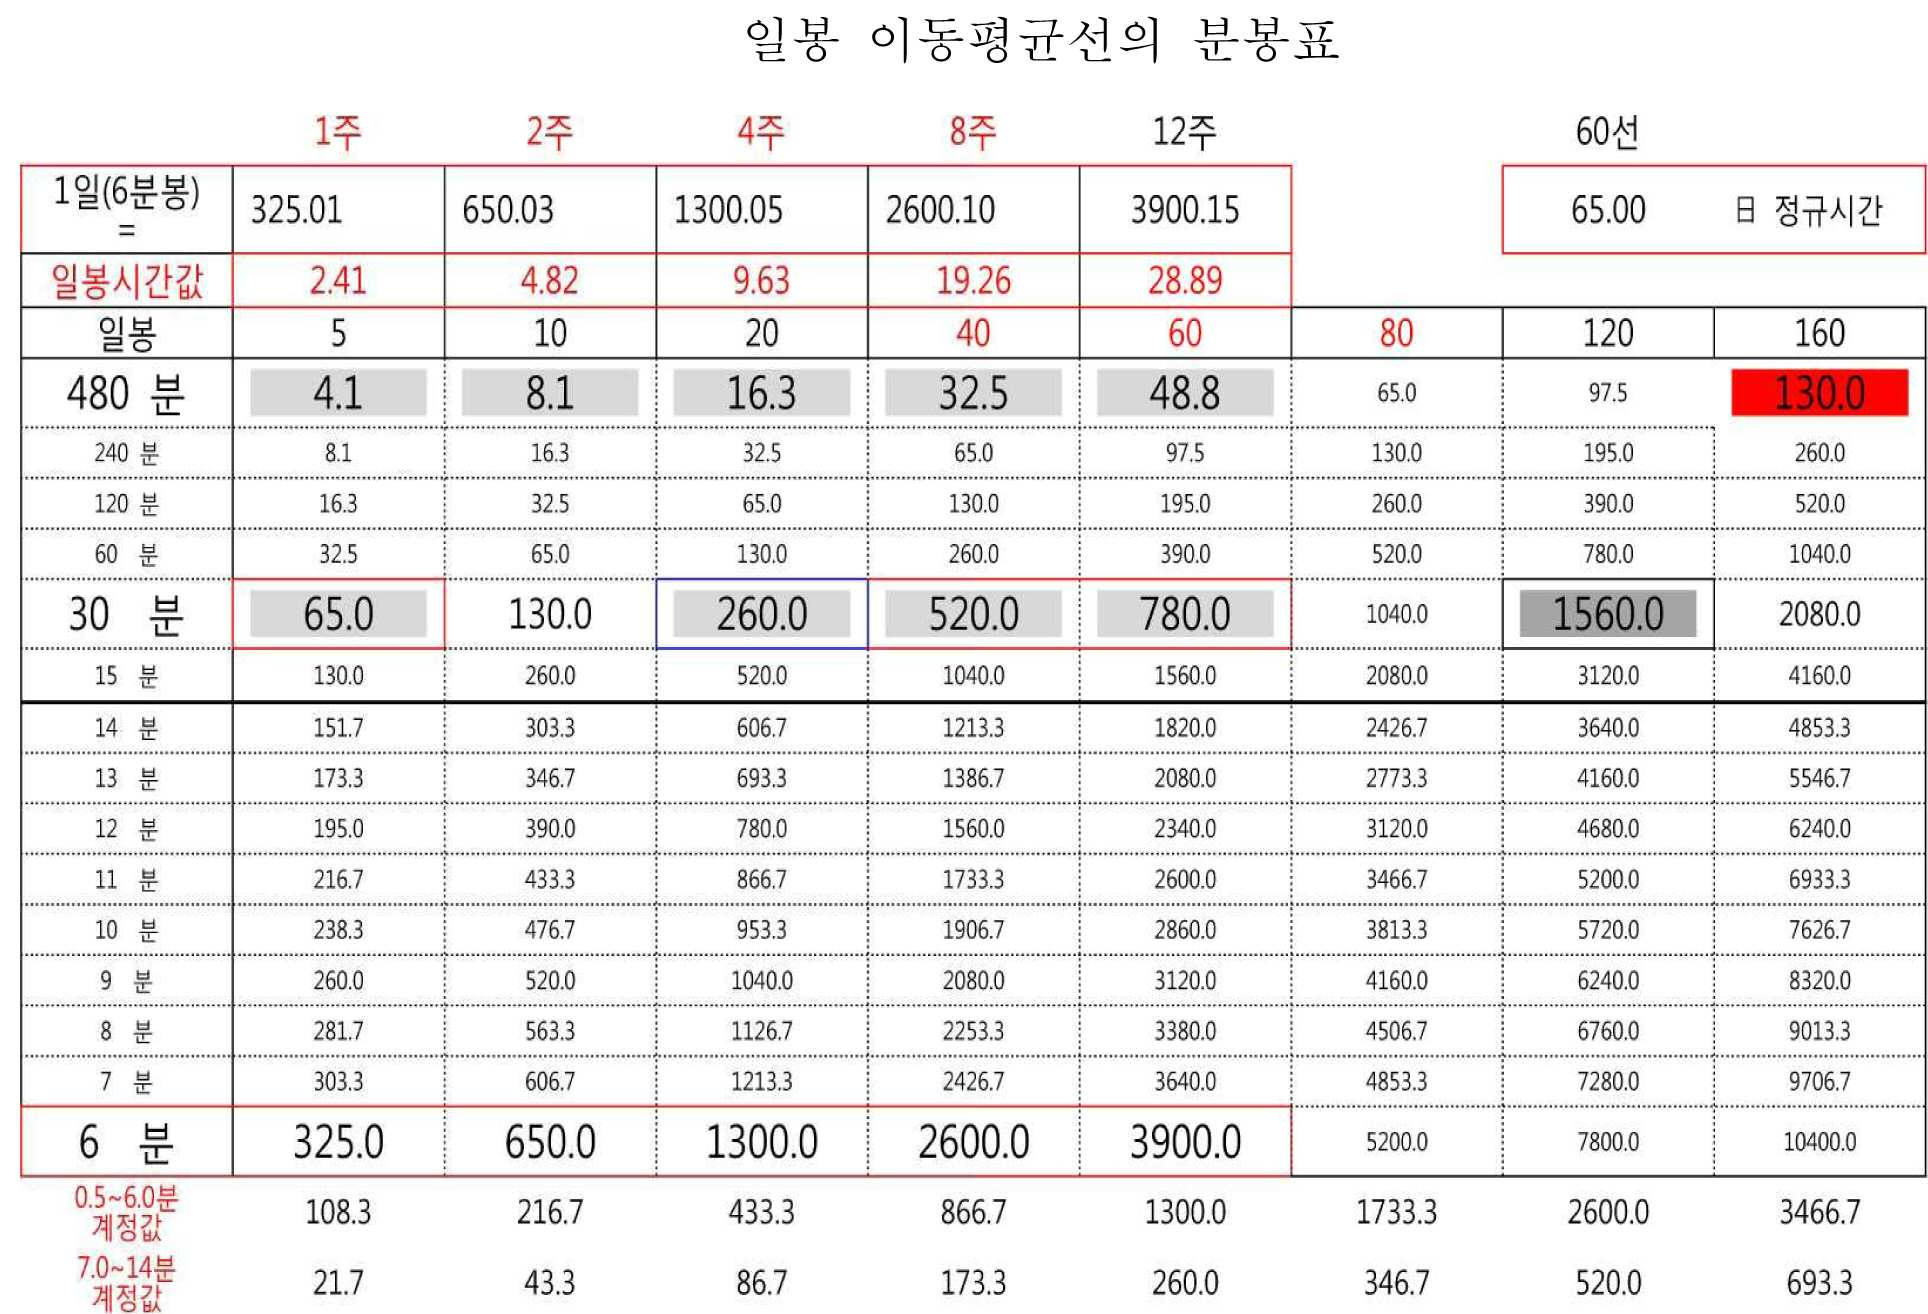
상기 [표 5]에서는 5,10,20,40,60,80,120,160 이동평균선 (이평선이라 약칭함)의 분봉 개수가 일목요연하게 나타난다.In Table 5, the number of shots of 5, 10, 20, 40, 60, 80, 120, and 160 moving average lines (abbreviated as horizontal lines)
480 분봉의 경우, 5 이평선에서 4.1개, 10 이평선에서는 8.1개, 20 이평선에서는 16.3개, 40 이평선에서는 32.5개, 60 이평선에서는 48.8개가 나타난다. [도 4b]에서와 같이 480 분봉이 일봉 차트를 분봉으로 표현할 때 시각적으로 가장 비슷한 양상을 보임을 확인할 수 있다. 일봉차트처럼 한 개의 캔들만 나오면서, 좀 더 세밀한 일봉의 이동평균선이 표현된다. 사용자의 단말기에는 [도 4a]의 일봉과 [도 4b]의 480 분봉이 동시에 표시되거나 2개 이상의 단말기를 통해 표시될 수 있으며, 해당 종목이 일봉 기준인지, 480 분봉 기준인지가 명확히 표시된다. 30 분봉의 값은 각 종목마다의 실제 적용 분봉시, 조건 조합의 기준 분봉이 된다. In the case of the 480 split, the number is 4.1 in the 5-line, 8.1 in the 10-line, 16.3 in the 20-line, 32.5 in the 40-line and 48.8 in the 60-line. As can be seen in FIG. 4B, when the 480 splits represent the daily charts, they are visually the most similar. As a single chart comes out with only one candle, a more detailed moving average line is expressed. The user's terminal can be displayed at the same time with the display of FIG. 4A and the display of 480 of FIG. 4B simultaneously or through two or more terminals, and it is clearly displayed whether the corresponding item is a single-bar reference or a 480-bar reference. The value of the 30-minute mark is the standard distribution of the condition combination at the time of actual application of each item.
V. 적용 분봉의 도출과 적용 분봉의 이동평균선 조건에 따른 종목선정 (S500단계 ~ S600단계) V. Derivation of Application Segments and Selection of Stocks According to Moving Average Line Condition of Application Segment (Steps S500 ~ S600)
상기와 같이 기본이동평균선 4개 (A) 및 한 개의 추가이동평균선(B)으로 매직 포인트(MP)가 생성되고, 매직 포인트에 해당되는 골든 크로스 (G/C) 이동평균선들이 가진 시간의 값 (일봉 시간값)을 합해주어, 본 발명에 따른 실제 거래에 사용되는 적용 분봉을 도출할 수 있다.(S500)As described above, a magic point (MP) is generated by four basic moving average lines (A) and one additional moving average line (B), and the value of the time of the golden cross (G / C) moving average lines corresponding to the magic point The sum of the supply time values) can be summed to derive the application distribution used in the actual transaction according to the present invention (S500)
아래 [표 6]은 매직 포인트 40 × 60 적용 분봉표로서, 매직 포인트 40 × 60 및 그 下位 각 이평선들의 골든 크로스 時, 해당 이동평균선들의 시간의 값 (일봉 시간값)의 합이 바로 실전 적용 분봉임을 나타내는 표이다. [Table 6] shows the application table of the application of the Magic Point 40 × 60, and the sum of the time values of the corresponding moving averaging lines (full time values) at the time of the golden cross of the Magic Point 40 × 60 and its lower horizontal lines, .

상기 [표 6]에서, 5일 이평선과 10일 이평선의 골든 크로스 시점 (5 × 10)의 매직 포인트값은, 5일선값 = 2.41 및 10일선값 = 4.82의 합 (2.41 + 4.82 = 7.2)으로 표현된다. In Table 6, the magic point value of the 5th day line and the 10th day line of the golden cross point (5x10) is the sum of the 5th line value = 2.41 and the 10th line value = 4.82 (2.41 + 4.82 = 7.2) Is expressed.
상기와 같은 실전 적용 분봉표가 생성되면, 실전 적용 분봉에서 아래의 3가지의 필수조건을 충족하는 분봉의 종목을 선정한다. (S600)When such a practical application chart is generated, an item of the spectrometer satisfying the following three essential conditions is selected in the actual application distribution. (S600)
①차조건 : 기본이동평균선10일선 × 추가이동평균선 [도 4c]① Condition: Basic moving
②차조건 : 기본이동평균선40일선 × 추가이동평균선 [도 4d]② Condition: Basic moving average line 40 days line × additional moving average line [FIG. 4d]
③차조건 : 추가이동평균선 × 추가이동평균선의 배수이동평균선 [도 4e]③ Difference condition: additional moving average line × multiple of moving average line Moving average line (FIG. 4e)
본 발명은 상기 3차 조건이 모두 충족된 종목을 선택하고, 이 종목에 대한 주가가 움직임을 확인하고, 이 시점 또는 구간에서 투자시점을 결정하는 것을 핵심 사상으로 한다.In the present invention, it is a core idea to select an item that satisfies all of the above-mentioned third conditions, to confirm the stock price of the item, and to determine the point-in-time at this point or period.
상기 조건이 충족되는 방법을 아래 [표 7]을 통해 3단계로 구분하여 설명한다. 또 [도 4c] 내지 [도 4e]의 차트를 통해 설명한다.The manner in which the above conditions are met will be described in three stages through Table 7 below. It will be described with reference to the charts of FIGS. 4C to 4E.
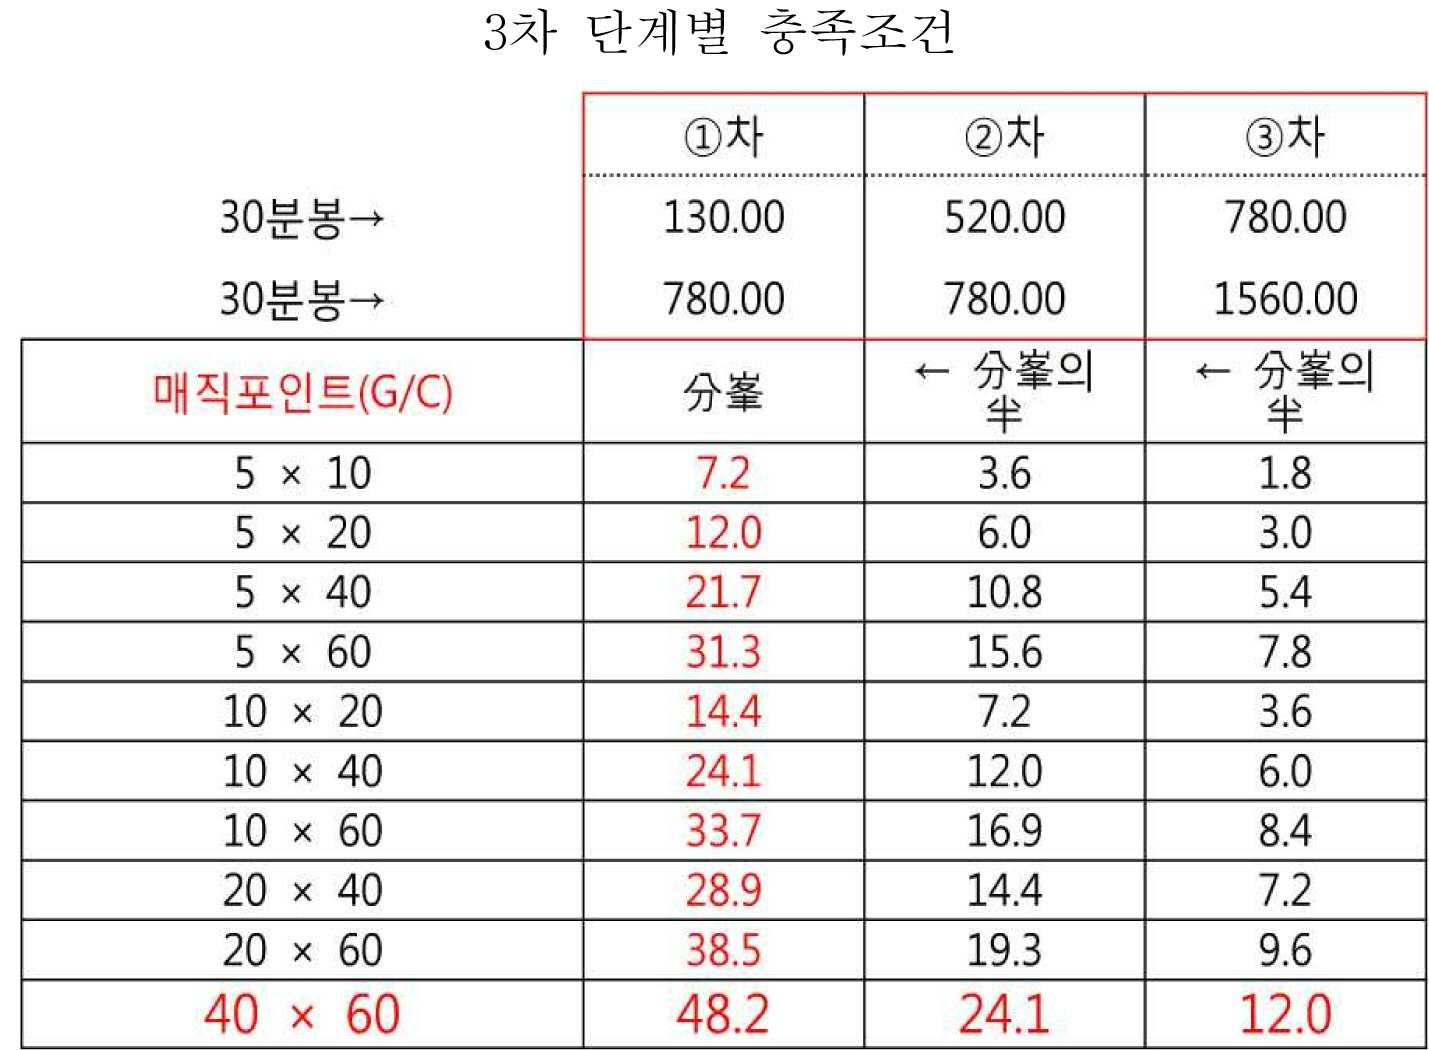
상기 ①차조건 : 기본이동평균선 10일선 × 추가이동평균선은 10일 이평선이 추가 이평선과 크로스 되는 시점을 조건으로 한다. 상기 표 7에서, 제1차 조건은 10일 이평선(130선)이 60일 이평선(780선)과 크로스 하는 시점 및 동시에 20일 이평선(260선)과 40일 이평선(520선)이 크로스 하는 시점이다. [도 4c]에서는 blue 이평선(10일 이평선) 및 black 이평선(60일 이평선)이 크로스 되고, 동시에 Yellow 이평선 (20일 이평선)과 Green 이평선(40일 이평선)이 크로스 되는 시점에서 거래량이 급증하고 있음을 확인된다. (1) Condition: Basic moving
상기 ②차조건 : 기본이동평균선 40일선 × 추가이동평균선이 크로스 하는 시점을 조건으로 한다. 상기 표 7에서, 제2차 조건은 40일 이평선 및 60일 이평선이 크로스 하는 시점이다. [도 4d]에서는 Green 이평선(40일 이평선) 및 black이평선(60일 이평선)이 크로스 되는 시점이고, 이 시점에서 역시 거래량이 급증하고 있음이 확인된다. (2) Difference condition: It is a condition that the intersection of the basic moving average line 40 line × additional moving average line crosses. In Table 7, the second condition is a time point when the 40-day horizon and the 60-day horizon cross each other. In FIG. 4d, it is confirmed that the Green Yip Line (40-day Yip Line) and the Black Yip Line (60-day Yip Line) are crossed, and at this point, the volume of transactions is also surging.
상기 ③차조건 : 추가이동평균선 × 추가이동평균선의 배수이동평균선은 표 7에서와 같이, 60일 이평선과 그 배수인 120일선이 크로스 하는 시점이다. [도 4e]에서는 grey 이평선(60일 이평선)과 black 이평선 (120일 이평선)이 크로스 되는 시점에서 거래량이 급증하고 있음이 확인된다. The above ③ condition: the additional moving average line × the multiple of moving average line The moving average line is the intersection of the 60-day horizon and the 120-day line, which is a multiple thereof, as shown in Table 7. In FIG. 4e, it is confirmed that the trading volume is surging when the gray horizontal line (60-day horizontal line) and the black horizontal line (120-day horizontal line) are crossed.
상기 ①차 ~ ③차 조건은, 반드시 1일 ~ 2일의 시차 이내에서 동시에 만족해야만 하며, 단 하나의 조건이라도 만족하지 않는 종목은 투자하지 않는 것이 바람직하다. 또한, 당해 매직 포인트 40 × 60뿐만 아니라, 향후의 매직 포인트 역시 일봉 20일선(30분봉 260선) 이탈종목은 일단 제외함을 공통으로 한다.The above (1) to (3) conditions must be satisfied at the same time within the time difference of 1 day to 2 days, and it is desirable not to invest in an item that does not satisfy even one condition. In addition, not only the Magic Point 40 × 60 but also the future Magic Points will be excluded once except for the 20th day line (30 minutes and 260 lines).
VI. 또 다른 매직 포인트로 목표를 설정 VI. Set another Magic Point goal
상기 ①차 ~ ③차 3가지의 조건이 충족되면, 주가는 다음 매직 포인트 40 × 80을 향해서 또 나아간다.If the above three conditions are satisfied, the stock price moves to the next Magic Point 40 × 80 again.

본 발명에서 바람직하게는 주가의 첫 관문인 매직 포인트 40 × 60 前([도 5a] 또는 [도 5b]), 즉 그 아래에 위치하는 (下位)의 G/C 상황에서는 해당 G/C 적용 분봉을 적용하기보다는 해당 G/C, 바로 직전 G/C의 적용 분봉을 적용하면 훨씬 높은 적중률을 기대할 수 있다.In the present invention, preferably, in the case of the G / C situation before the magic point 40 × 60 ([FIG. 5a] or [5b] Rather than applying the G / C, just before the application of the G / C can be expected to achieve a much higher hit rate.
예컨대, 해당 G/C 20 × 40 時, 적용 분봉은 바로 직전의 G/C 10 × 40의 적용 분봉을 적용한다. 즉, 해당 G/C 20 × 40 時 적용 분봉은 : ①차조건 → 29분 ②차조건 → 14분 ③차조건 → 7분이지만, 직전 G/C 10 × 40의 적용 분봉을 적용하면 : ①차조건 → 24분[도 5c] ②차조건 → 12분[도 5d] ③차조건 → 6분[도 5e]이 된다.For example, apply G /
상기 표 8에서 나타나듯이 대부분 종목 주가의 시작점은 이동평균선 역배열 상태 下인, 골든 크로스 5 × 10으로 출발, 상기 ①차 ~ ③차 3가지의 핵심 필수 조건의 완성 과정을 거치며, 매직 포인트 40 × 60을 돌파, 주가는 계속해서 다음 단계의 매직 포인트 40 × 80을 향한다. As shown in Table 8, the starting point of most stock prices starts with Golden Cross 5 × 10, which is in a state of inverse shift of moving average line, through the completion of the three core essential conditions mentioned above, , The share price continues to the next step of Magic Point 40 × 80.
단, 매직 포인트 40 × 60 돌파 후, 다음 매직 포인트를 노려볼 수 있는 선결 조건은 메이저 세력들의 자금력이 받쳐줄 때만 가능한 시나리오이며, 개인투자자들은 상기한 바와 같이 일봉 20일선 (30분봉 260선)이탈 유무 확인만으로도 메이저들의 자금력을 가늠해볼 수 있는 - 향후 지속적인 우상향을 기대할 수 있는 - 가장 큰 기준점으로 삼을 수 있다. However, the prerequisite for pursuing the next Magic Point after exceeding the Magic Point of 40 × 60 is a scenario that can only be made when the funding power of the major powers supports it. Individual investors are asked to confirm whether or not they have diverted from the 20 day line (30 minutes, 260 lines) It can be used as the biggest reference point that can measure the funding power of the majors - expecting a steady upward trend in the future.
주식시장에서 많은 종목들은 매직 포인트 40 × 80, 즉 시간개념 2 ~ 4개월 -더한 장기관점으로는 2 ~ 6개월- 이 메이저 세력들의 일반적 원타임 작전 시간으로 확인되고 있으며, 물론 그 다음의 매직 포인트(MP)도 무한대지만, 문제는 메이저들의 자금력의 능력에 따라 작전의 기한도 정해진다는 점이다. 따라서 개인 투자가들은 주식의 매카니즘이라 할 수 있는 본 발명의 매직 포인트 이론을 바탕으로 지속적으로 대응만 해나가면 될 것이다.Many stocks in the stock market are identified as having a magic point of 40 × 80, a time-concept of 2 to 4 months - plus a long-term perspective of 2 to 6 months - MP) is infinite, but the problem is that the operational deadlines are set according to the ability of the major powers. Therefore, individual investors will continue to respond based on the magic point theory of the present invention, which is a mechanism of stocks.
본 발명은 HTS에서 제공되는 주가나 개별기업의 이동평균선을 활용한 것이고 본 발명에 적합하도록 엑셀자료로 표현한 것이지만 이에 한정되는 것은 아니며, MTS나 기타 프로그램으로의 활용도 제한되지 않는다.The present invention utilizes the stock price provided by the HTS or the moving average line of an individual company, and is expressed in Excel data in accordance with the present invention, but the present invention is not limited thereto, and its application to MTS or other programs is not limited.
Claims (6)
선택된 종목에 대해 이동평균선이 표시되고;
상기 이동평균선의 1분봉은 장 시작 1시간 후 60 이동평균선이, 0.5분봉은 120 이동평균선이 생성, 상기 이동평균선의 아래에 주가가 위치하는 종목은 투자하지 않고 다시 새로운 종목을 찾는 단계;
를 포함하는 이동평균선을 기반으로 하는 주식투자방법.Selecting an arbitrary item;
A moving average line is displayed for the selected item;
A first moving average line is generated for one hour after the start of the first round and a second moving average line is generated for the second round of the average moving line for 0.5 minute and a new stock is searched again without investing the stock for which the stock price is below the moving average;
Based on the moving average line,
선택된 종목에 대해 이동평균선을 표시하는 단계;
상기 이동평균선은 분봉/일봉차트의 이동평균선으로 표시하는 단계;
4개의 기본이동평균선과 추가로 1개의 이동평균선을 조합하여 합을 구하고, 각 이동평균선이 가지고 있는 시간의 값을 산출하는 단계;
적용 분봉표를 도출하는 단계;
상기 실전 적용 분봉에서 아래의 3가지의 필수조건을 충족하는 분봉의 종목을 선정하는 단계;
①차조건 : 기본이동평균선 10일선 × 추가이동평균선
②차조건 : 기본이동평균선 40일선 × 추가이동평균선
③차조건 : 추가이동평균선 × 추가이동평균선의 배수이동평균선
를 포함하는 이동평균선을 기반으로 하는 주식투자방법.Selecting an arbitrary item;
Displaying a moving average line for the selected item;
Marking the moving average line with a moving average line of a spread / spread chart;
Obtaining a sum by combining the four basic moving average lines and the one moving average line, and calculating a time value of each moving average line;
Deriving an application partition table;
Selecting an item of the spectroscopy satisfying the following three essential conditions in the practical application distribution;
① Condition: Basic moving average line 10 line × Additional moving average line
② Condition: Basic moving average line 40 days line × Additional moving average line
③ Difference condition: additional moving average line × multiple of additional moving average line Moving average line
Based on the moving average line,
5일/10일/20일/40일 이동평균선이 기본이동평균선이고, 추가되는 1개 이동평균선 60일 이동평균선을 특징으로 하는 이동평균선을 기반으로 하는 주식투자방법3. The method according to claim 2,
A stock investment method based on moving average lines characterized by a moving average line of 5 days / 10 days / 20 days / 40 days and a moving average line of 60 days
상기 5개 이동평균선의 합에 대해서 시간의 값을 산출시 日일 정규시간 6.5시간을 기준점으로 하는 것을 특징으로 하는 이동평균선을 기반으로 하는 주식투자방법3. The method according to claim 2,
And calculating the value of the time for the sum of the five moving average lines as a reference point based on a day-to-day regular time of 6.5 hours.
상기 ①차~③차 조건은 1일~2일의 시차 이내에서 동시에 만족하며, 단 하나의 조건이라도 만족하지 않는 종목은 투자하지 않는 것을 특징으로 하는 이동평균선을 기반으로 하는 주식투자방법3. The method according to claim 2,
The above-mentioned ① to ③ conditions are satisfied at the same time within the time difference of 1 day to 2 days, and the stocks that do not satisfy even one condition are not invested.
매직 포인트 40 × 60 前의 下位의 골든 크로스(G/C) 상황에서는 해당 G/C 적용 분봉을 적용하기 보다는 해당 G/C 바로 직전 G/C의 적용 분봉을 적용하는 것을 특징으로 하는 이동평균선을 기반으로 하는 주식투자방법3. The method according to claim 2,
In case of the Golden Cross (G / C) in the lower position before the Magic Point 40 × 60, the moving average line is characterized by applying the G / C application segment immediately before the G / C immediately before applying the applicable G / How to invest in a stock based on
Priority Applications (1)
| Application Number | Priority Date | Filing Date | Title |
|---|---|---|---|
| KR1020160167219A KR101869245B1 (en) | 2016-12-09 | 2016-12-09 | A Method for Stock Trading based on Moving Average Line Analysis |
Applications Claiming Priority (1)
| Application Number | Priority Date | Filing Date | Title |
|---|---|---|---|
| KR1020160167219A KR101869245B1 (en) | 2016-12-09 | 2016-12-09 | A Method for Stock Trading based on Moving Average Line Analysis |
Publications (2)
| Publication Number | Publication Date |
|---|---|
| KR20180066425A true KR20180066425A (en) | 2018-06-19 |
| KR101869245B1 KR101869245B1 (en) | 2018-07-20 |
Family
ID=62790287
Family Applications (1)
| Application Number | Title | Priority Date | Filing Date |
|---|---|---|---|
| KR1020160167219A KR101869245B1 (en) | 2016-12-09 | 2016-12-09 | A Method for Stock Trading based on Moving Average Line Analysis |
Country Status (1)
| Country | Link |
|---|---|
| KR (1) | KR101869245B1 (en) |
Cited By (5)
| Publication number | Priority date | Publication date | Assignee | Title |
|---|---|---|---|---|
| KR102165041B1 (en) * | 2020-01-15 | 2020-10-13 | 프로그 주식회사 | System and method for forecasting stock investment prices using stock and commodity subsidy index |
| KR20220087286A (en) * | 2020-12-17 | 2022-06-24 | 김현규 | How to calculate the stock buying and selling charts |
| KR20220087285A (en) * | 2020-12-17 | 2022-06-24 | 김현규 | A Method of Calculating Stock Buying and Selling Charts Using Diagnostic Line |
| KR20220087290A (en) * | 2020-12-17 | 2022-06-24 | 김현규 | A stocks' dealing order chart calculating method using moving average line analysis |
| KR102619040B1 (en) * | 2022-10-18 | 2023-12-28 | 주식회사 준다 | Apparatus for analyzing market conditions based on market trends in a fintech platform service system |
Families Citing this family (1)
| Publication number | Priority date | Publication date | Assignee | Title |
|---|---|---|---|---|
| KR102461537B1 (en) | 2020-08-05 | 2022-11-01 | 심규민 | Apparatus and method for automated trading of investment products based on statistical data of price moving average line and candle stick chart |
Citations (2)
| Publication number | Priority date | Publication date | Assignee | Title |
|---|---|---|---|---|
| KR20010000884A (en) * | 2000-10-25 | 2001-01-05 | 김명식 | Method for trading stocks using internet |
| KR20160047436A (en) * | 2016-01-05 | 2016-05-02 | 키움증권 주식회사 | Apparatus and method for providing trading guide service based on moving average line analysis |
Family Cites Families (1)
| Publication number | Priority date | Publication date | Assignee | Title |
|---|---|---|---|---|
| KR101365314B1 (en) * | 2013-07-08 | 2014-02-19 | 박형삼 | Method for providing chart information and trading system using the method |
-
2016
- 2016-12-09 KR KR1020160167219A patent/KR101869245B1/en active IP Right Grant
Patent Citations (2)
| Publication number | Priority date | Publication date | Assignee | Title |
|---|---|---|---|---|
| KR20010000884A (en) * | 2000-10-25 | 2001-01-05 | 김명식 | Method for trading stocks using internet |
| KR20160047436A (en) * | 2016-01-05 | 2016-05-02 | 키움증권 주식회사 | Apparatus and method for providing trading guide service based on moving average line analysis |
Cited By (5)
| Publication number | Priority date | Publication date | Assignee | Title |
|---|---|---|---|---|
| KR102165041B1 (en) * | 2020-01-15 | 2020-10-13 | 프로그 주식회사 | System and method for forecasting stock investment prices using stock and commodity subsidy index |
| KR20220087286A (en) * | 2020-12-17 | 2022-06-24 | 김현규 | How to calculate the stock buying and selling charts |
| KR20220087285A (en) * | 2020-12-17 | 2022-06-24 | 김현규 | A Method of Calculating Stock Buying and Selling Charts Using Diagnostic Line |
| KR20220087290A (en) * | 2020-12-17 | 2022-06-24 | 김현규 | A stocks' dealing order chart calculating method using moving average line analysis |
| KR102619040B1 (en) * | 2022-10-18 | 2023-12-28 | 주식회사 준다 | Apparatus for analyzing market conditions based on market trends in a fintech platform service system |
Also Published As
| Publication number | Publication date |
|---|---|
| KR101869245B1 (en) | 2018-07-20 |
Similar Documents
| Publication | Publication Date | Title |
|---|---|---|
| KR101869245B1 (en) | A Method for Stock Trading based on Moving Average Line Analysis | |
| US20190295167A1 (en) | System and method for estimating and optimizing transaction costs | |
| US7860774B1 (en) | System and method for providing financial advice for an investment portfolio | |
| JP2005530232A5 (en) | ||
| US20080300960A1 (en) | Competitive advantage rating method and apparatus | |
| KR20130123663A (en) | System for ranking stock and method for selecting stock using the same system | |
| US20130024349A1 (en) | Method for trading stocks | |
| Chernonog et al. | How to set price and quality in a supply chain of virtual products under bi-criteria and risk consideration | |
| Makkonen et al. | Multi‐criteria decision support in the liberalized energy market | |
| US20130159161A1 (en) | System and method for creating and supplying particular data constructs in evaluating whether to buy or sell a traded security | |
| EP2706500A2 (en) | Method for displaying current disparate ratio for enterprise value using difference between market value for enterprise and basic analysis | |
| KR20000053962A (en) | A System on the Anticipation of Futures and Stock Index | |
| Neven et al. | The Structure and Determinants of East-West Trade: A Preliminary Analysis of the Manufacturing Sector | |
| CN113256116A (en) | Transaction price reference index calculation method realized through computer | |
| KR20180053609A (en) | Investment evaluation information system using the baseball rule and the method thereof | |
| KR20020073953A (en) | offering method for buying and selling index of stocks item by real time in internet | |
| Silva | Equity research-Kingfisher PLC | |
| KR102243647B1 (en) | Profit information service system and the service method | |
| Kianfar et al. | Assessing the real value of the firm: an overview | |
| KR20070059522A (en) | System and method for real time trading | |
| CN116438563A (en) | System and method for analyzing financial products | |
| KR20230008429A (en) | stock firm investment history management system | |
| US20140297499A1 (en) | System for analyzing characteristics of stock information in conjunction with baseball terminology, and method for providing the characteristics | |
| Da Silva | Equity Research: Kingfisher PLC | |
| Duquaine et al. | Tale of Two Styles: Growth Versus Value |
Legal Events
| Date | Code | Title | Description |
|---|---|---|---|
| A201 | Request for examination | ||
| E902 | Notification of reason for refusal | ||
| E701 | Decision to grant or registration of patent right | ||
| GRNT | Written decision to grant |