KR20140043439A - System of sequential kernel regression modeling for forecasting and prognostics - Google Patents
System of sequential kernel regression modeling for forecasting and prognostics Download PDFInfo
- Publication number
- KR20140043439A KR20140043439A KR1020147001392A KR20147001392A KR20140043439A KR 20140043439 A KR20140043439 A KR 20140043439A KR 1020147001392 A KR1020147001392 A KR 1020147001392A KR 20147001392 A KR20147001392 A KR 20147001392A KR 20140043439 A KR20140043439 A KR 20140043439A
- Authority
- KR
- South Korea
- Prior art keywords
- input
- vectors
- values
- vector
- monitoring system
- Prior art date
Links
Images


Classifications
-
- G—PHYSICS
- G05—CONTROLLING; REGULATING
- G05B—CONTROL OR REGULATING SYSTEMS IN GENERAL; FUNCTIONAL ELEMENTS OF SUCH SYSTEMS; MONITORING OR TESTING ARRANGEMENTS FOR SUCH SYSTEMS OR ELEMENTS
- G05B23/00—Testing or monitoring of control systems or parts thereof
- G05B23/02—Electric testing or monitoring
- G05B23/0205—Electric testing or monitoring by means of a monitoring system capable of detecting and responding to faults
- G05B23/0218—Electric testing or monitoring by means of a monitoring system capable of detecting and responding to faults characterised by the fault detection method dealing with either existing or incipient faults
- G05B23/0243—Electric testing or monitoring by means of a monitoring system capable of detecting and responding to faults characterised by the fault detection method dealing with either existing or incipient faults model based detection method, e.g. first-principles knowledge model
-
- G—PHYSICS
- G06—COMPUTING; CALCULATING OR COUNTING
- G06F—ELECTRIC DIGITAL DATA PROCESSING
- G06F18/00—Pattern recognition
- G06F18/20—Analysing
- G06F18/22—Matching criteria, e.g. proximity measures
-
- G—PHYSICS
- G06—COMPUTING; CALCULATING OR COUNTING
- G06N—COMPUTING ARRANGEMENTS BASED ON SPECIFIC COMPUTATIONAL MODELS
- G06N7/00—Computing arrangements based on specific mathematical models
- G06N7/02—Computing arrangements based on specific mathematical models using fuzzy logic
- G06N7/023—Learning or tuning the parameters of a fuzzy system
Landscapes
- Engineering & Computer Science (AREA)
- General Physics & Mathematics (AREA)
- Physics & Mathematics (AREA)
- Theoretical Computer Science (AREA)
- Data Mining & Analysis (AREA)
- Automation & Control Theory (AREA)
- Software Systems (AREA)
- General Engineering & Computer Science (AREA)
- Life Sciences & Earth Sciences (AREA)
- Evolutionary Computation (AREA)
- Artificial Intelligence (AREA)
- Fuzzy Systems (AREA)
- Evolutionary Biology (AREA)
- Bioinformatics & Cheminformatics (AREA)
- Bioinformatics & Computational Biology (AREA)
- Computer Vision & Pattern Recognition (AREA)
- General Health & Medical Sciences (AREA)
- Mathematical Optimization (AREA)
- Pure & Applied Mathematics (AREA)
- Computing Systems (AREA)
- Mathematical Analysis (AREA)
- Mathematical Physics (AREA)
- Computational Mathematics (AREA)
- Algebra (AREA)
- Molecular Biology (AREA)
- Biomedical Technology (AREA)
- Health & Medical Sciences (AREA)
- Testing And Monitoring For Control Systems (AREA)
- Complex Calculations (AREA)
Abstract
객체의 미래 동작 상태를 결정하는 모니터링 시스템은 객체의 정상 동작 상태를 나타내는 기준 데이터 및 입력 패턴 어레이들을 수신하는 실증적 모델 모듈을 포함한다. 각각의 입력 패턴 어레이는 다수의 입력 벡터들을 가지며, 각각의 입력 벡터는 시점을 표현하고 객체의 현재 상태를 나타내는 다수의 파라미터들을 표현하는 입력 값들을 갖는다. 실증적 모델은 입력 패턴 어레이 및 기준 데이터를 사용하여 입력 값들과 기준 데이터 간의 유사도 척도를 판단하는 계산에 따라 추정 값들을 생성한다. 추정 값들은 추론된 추정 값들의 적어도 하나의 추정 벡터를 포함하는 추정 매트릭스의 형태이고, 각각의 추정 매트릭스는 입력 벡터들에 의해 표현되지 않은 적어도 하나의 시점을 표현한다. 추론된 추정 값들은 객체의 미래 상태를 판단하는데 사용된다.The monitoring system for determining the future operational state of the object includes an empirical model module that receives input data arrays and reference data indicative of the normal operational state of the object. Each input pattern array has a plurality of input vectors, each input vector having input values representing a viewpoint and representing a plurality of parameters representing the current state of the object. The empirical model uses the input pattern array and reference data to generate estimated values according to a calculation that determines a similarity measure between the input values and the reference data. The estimates are in the form of an estimation matrix comprising at least one estimate vector of the inferred estimate values, each estimate matrix representing at least one viewpoint not represented by the input vectors. Inferred estimates are used to determine the future state of the object.
Description
본 명세서에 개시된 주제는 일반적으로 머신, 시스템 또는 프로세스와 같은 객체의 예지적 상태 모니터링(predictive condition monitoring) 및 예측(prognostics)에 사용되는 커널 회귀 모델링(kernel regression modeling)의 분야에 관한 것으로, 특히, 파라미터들의 측정치들의 분석을 위한 다변수 모델들(multivariate models)을 사용하여 모니터링되는 객체의 평가를 제공하는 것에 관한 것이다.
The subject matter disclosed herein relates generally to the field of kernel regression modeling used in predictive condition monitoring and prognostics of objects such as machines, systems or processes. The present invention relates to providing an evaluation of a monitored object using multivariate models for the analysis of measurements of parameters.
커널 회귀는 데이터 집합 내 값들 사이의 비선형 함수 또는 관계를 결정하는데 사용된 모델링의 한 형태이며 머신들 또는 시스템들을 모니터링하여 머신 또는 시스템의 상태를 판단하는데 사용된다. 커널 회귀 모델링의 한가지 공지된 형태는 미국 특허 제5,764,509호 및 제6,181,975에 의해 개시된 유사도-기반 모델링(similarity-based modeling (SBM))이다. SBM에 있어서, 다수의 센서 신호들은 모니터링되는 머신, 시스템 또는 다른 객체의 물리적으로 상호관련된 파라미터들을 측정하여 센서 데이터를 제공한다. 파라미터 데이터는 그 신호들로부터의 실제 또는 현재 값들 또는 그 센서 신호들에 기반하든 않든 다른 계산된 데이터를 포함할 수 있다. 그런 다음 이 파라미터 데이터는 실증적 모델(empirical model)에 의해 처리되어 이들 값들의 추정치를 제공한다. 그런 다음 추정치들은 모니터링되는 시스템에서 결함이 존재하는지를 확인하기 위해 실제 또는 현재 값들과 비교된다. Kernel regression is a form of modeling used to determine nonlinear functions or relationships between values in a dataset and is used to monitor the machines or systems to determine the state of the machine or system. One known form of kernel regression modeling is similarity-based modeling (SBM) disclosed by US Pat. Nos. 5,764,509 and 6,181,975. In SBM, multiple sensor signals provide sensor data by measuring physically correlated parameters of a monitored machine, system or other object. The parameter data may include other calculated data whether or not based on actual or current values from the signals or the sensor signals. This parametric data is then processed by an empirical model to provide an estimate of these values. The estimates are then compared to actual or current values to confirm that a fault exists in the monitored system.
보다 상세히 말해서, 모델은 공지된 동작 상태를 나타내는 센서 값들 중의 선택된 이력 패턴들의 기준 라이브러리를 이용하여 추정치를 생성한다. 이들 패턴들은 벡터, 스냅 샷(snapshots), 또는 관측치(observations)라고도 지칭되며, 순간적 시간에 모니터링되는 머신의 상태를 나타내는 다수의 센서들로부터의 값들 또는 다른 입력 데이터를 포함한다. 기준 라이브러리로부터 생성된 기준 벡터의 경우, 벡터들은 보통 모니터링되는 머신의 정상 동작을 표시한다. 모델은 현재 시간으로부터의 벡터를 기준 라이브러리의 공지된 상태로부터의 다수의 선택된 학습된 벡터들(learned vectors)과 비교하여 시스템의 현재 상태를 추정한다. 일반적으로 말해서, 현재 벡터는 기준 라이브러리로부터의 선택된 벡터들로 이루어진 매트릭스와 비교되어 가중 벡터를 형성한다. 다음 단계에서, 가중 벡터는 매트릭스에 곱해져서 추정 값들의 벡터를 산출하게 된다. 그런 다음 추정 벡터는 현재 벡터와 비교된다. 만일 이들 벡터들의 추정 값들 및 실제 값들이 충분히 유사하지 않으면, 이것은 모니터링되는 객체에서 결함이 존재함을 표시할 수 있다. More specifically, the model generates an estimate using a reference library of selected historical patterns among sensor values representing known operating states. These patterns, also referred to as vectors, snapshots, or observations, contain values or other input data from multiple sensors that represent the state of the machine being monitored at an instant time. In the case of a reference vector generated from a reference library, the vectors usually indicate the normal operation of the monitored machine. The model estimates the current state of the system by comparing the vector from the current time to a number of selected learned vectors from the known state of the reference library. Generally speaking, the current vector is compared with a matrix of selected vectors from the reference library to form a weight vector. In the next step, the weight vector is multiplied by the matrix to yield a vector of estimated values. The estimated vector is then compared with the current vector. If the estimated and actual values of these vectors are not sufficiently similar, this may indicate that a defect exists in the monitored object.
그러나, 이러한 커널 회귀 기술은 명시적으로 센서 신호들에 있는 타임 도메인 정보(time domain information)를 명시적으로 사용하지 않으며, 그 대신 추정치를 계산할 때 별개이고 연결관계가 없는 동시성 패턴들 내 데이터를 다룬다. 예를 들면, 각각의 현재 벡터는 개별적으로 기준 라이브러리 벡터들과 비교되기 때문에, 현재 벡터들이 기준 라이브러리의 벡터들과 어떤 순서로 비교되든 차이가 없다 - 각각의 현재 벡터는 자기 자체에 상응하는 추정 벡터를 받아들일 것이다. However, this kernel regression technique does not explicitly use time domain information in sensor signals, but instead handles data in separate and unconnected concurrency patterns when calculating estimates. . For example, since each current vector is compared with the reference library vectors individually, there is no difference in what order the current vectors are compared with the vectors in the reference library-each current vector is an estimated vector corresponding to itself. Will accept.
일부의 공지된 모델은 커널 회귀 모델링 구조물 내에서 타임 도메인 정보를 획득한다. 예를 들어, 복소 신호 분해 기술(complex signal decomposition techniques)은 시간 변동(time-varing) 신호를 미국 특허 제 6,957,172 및 제7,409,320호에 의해 개시된 바와 같이 주파수 컴퍼넌트 또는 미국 특허 제 7,085,675 호에 개시된 바와 같은 스펙트럼 특징으로 변환한다. 이러한 컴포넌트 또는 특징은 단일의 복소 신호가 동일 시간에서 발생하는 주파수 값들의 패턴 또는 벡터로 표현되도록 실증적 모델링 엔진에 개개의 입력으로서 제공된다. 실증적 모델링 엔진은 추출된 컴포넌트 입력들(현재 또는 실제 벡터)을 예상된 값들과 대조하여 실제 신호에 관한 또는 시간 변동 신호들을 발생하는 시스템의 상태에 관한 정보를 더 많이 유도한다. 이러한 방법들은 음향 또는 진동 신호와 같은 단일의 주기적 신호에 대해 동작하도록 설계되어 있다. 그러나, 복소 신호용 시스템에서 조차도, 현재 벡터의 추정치를 계산할 때 각각의 현재 벡터는 입력 벡터들이 표현하는 기간에 무관하게 참조로 한 벡터들 또는 예측된 벡터들의 매트릭스와 비교되기 때문에 타임 도메인 정보는 중요하지 않다.
Some known models obtain time domain information within the kernel regression modeling construct. For example, complex signal decomposition techniques can be used to generate time-varing signals such as those disclosed in US Pat. Nos. 6,957,172 and 7,409,320 or in frequency components or as disclosed in US Pat. No. 7,085,675. Convert to feature. These components or features are provided as individual inputs to the empirical modeling engine such that a single complex signal is represented by a pattern or vector of frequency values occurring at the same time. The empirical modeling engine compares the extracted component inputs (current or real vector) against expected values to derive more information about the actual signal or about the state of the system generating time varying signals. These methods are designed to operate on a single periodic signal, such as an acoustic or vibration signal. However, even in systems for complex signals, time domain information is not important when calculating the estimate of the current vector, since each current vector is compared with a matrix of referenced vectors or predicted vectors, regardless of the time period represented by the input vectors. not.
일 양태에서, 객체의 미래 동작 상태를 판단하기 위한 방법은 상기 객체의 정상 동작 상태를 나타내는 기준 데이터를 취득하는 단계와, 입력 패턴 어레이들을 취득하는 단계를 포함한다. 각각의 입력 패턴 어레이는 다수의 입력 벡터들을 가지며, 각각의 입력 벡터는 시점(time point)을 표현하고 상기 객체의 현재 상태를 나타내는 다수의 파라미터들을 표현하는 입력 값들을 갖는다. 적어도 하나의 프로세서는 입력 패턴 어레이 및 상기 기준 데이터를 사용하여 상기 입력 값들과 기준 데이터 간의 유사도 척도를 판단하는 계산에 따라 추정 값들을 생성한다. 추정 매트릭스의 형태로 된 추정 값들은 가상의 또는 추론된 추정 값들의 적어도 하나의 추정 벡터를 포함하며, 상기 입력 벡터들에 의해 표현되지 않은 적어도 하나의 시점을 표현한다. 상기 추론된 추정 값들은 상기 객체의 미래 상태를 판단하는데 사용될 수 있다. In one aspect, a method for determining a future operational state of an object includes acquiring reference data indicative of a normal operational state of the object and acquiring input pattern arrays. Each input pattern array has a plurality of input vectors, each input vector having input values representing a time point and representing a plurality of parameters representing the current state of the object. At least one processor generates estimates according to a calculation that uses the input pattern array and the reference data to determine a similarity measure between the input values and the reference data. Estimates in the form of an estimation matrix include at least one estimate vector of hypothetical or inferred estimate values and represent at least one viewpoint not represented by the input vectors. The inferred estimates can be used to determine the future state of the object.
다른 양태에서, 객체의 미래 동작 상태를 판단하는 모니터링 시스템은 상기 객체의 정상 동작 상태를 나타내는 기준 데이터를 수신하고, 입력 패턴 어레이들을 수신 ― 각각의 입력 패턴 어레이는 다수의 입력 벡터들을 가짐 ― 하도록 구성된 실증적 모델 모듈을 갖는다. 각각의 입력 벡터는 상기 객체의 현재 상태를 나타내는 다수의 파라미터들을 표현하는 입력 값들을 갖는다. 상기 실증적 모델은 또한 입력 패턴 어레이 및 상기 기준 데이터를 사용하여 상기 입력 값들과 기준 데이터 간의 유사도 척도를 판단하는 계산에 따라 추정 값들을 생성하도록 구성된다. 상기 추정 값들은 추론된 추정 값들의 적어도 하나의 추정 벡터를 포함하는 추정 매트릭스의 형태이고, 각각의 추정 매트릭스는 상기 입력 벡터들에 의해 표현되지 않은 적어도 하나의 시점을 표현한다. 예측 모듈은 상기 추론된 값들을 사용하여 상기 객체의 미래 상태를 판단하도록 구성된다.
In another aspect, a monitoring system that determines a future operational state of an object is configured to receive reference data indicative of the normal operational state of the object and to receive input pattern arrays, each input pattern array having a plurality of input vectors. Have an empirical model module. Each input vector has input values representing a number of parameters indicative of the current state of the object. The empirical model is further configured to generate estimated values according to a calculation that uses the input pattern array and the reference data to determine a similarity measure between the input values and the reference data. The estimates are in the form of an estimate matrix comprising at least one estimate vector of the inferred estimate values, each estimate matrix representing at least one viewpoint not represented by the input vectors. The prediction module is configured to determine the future state of the object using the inferred values.
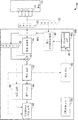
도 1은 모니터링 시스템의 예시적인 구성의 블록도를 도시한다.
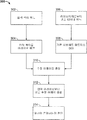
도 2는 모니터링 시스템의 기본 프로세스를 도시하는 플로우 차트이다.
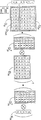
도 3은 자동연상 유사도 기반 모델링 방정식(auto associative similarity based modeling equation)의 개략도이다.
도 4는 추론 유사도 기반 모델링 방정식(inferential similarity based modeling equation)의 일 형태의 개략도이다.
도 5는 추론 유사도 기반 모델링 방정식의 다른 형태의 개략도이다.
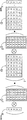
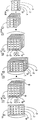
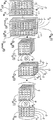
도 6은 자동연상 순차적 유사도 기반 모델링 방정식(autoassociative sequential similarity based modeling equation)의 개략도이다.
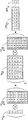
도 7은 모델링된 센서 차원에서 추정하는 추론 순차적 유사도 기반 모델링 방정식(inferential sequential similarity based modeling equation)의 일 형태의 개략도이다.
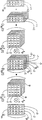
도 8은 모델링된 센서 차원(modeled sensor dimension)에서 추정하는 추론 순차적 유사도 기반 모델링 방정식(inferential sequential similarity based modeling equation)의 다른 형태의 개략도이다.
도 9는 시간 차원에서 추정하는 순차적 유사도 기반 모델링 방정식의 개략도이다.
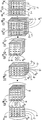
도 10은 시간 차원에서 추정하는 추론 순차적 유사도 기반 모델링 방정식의 개략도이다.
도 11은 시간 차원 및 센서 차원에서 추정하는 추론 순차적 유사도 기반 모델링 방정식의 개략도이다. 1 shows a block diagram of an exemplary configuration of a monitoring system.
2 is a flow chart illustrating the basic process of the monitoring system.
3 is a schematic diagram of an auto associative similarity based modeling equation.
4 is a schematic diagram of one form of an inferential similarity based modeling equation.
5 is a schematic diagram of another form of inference similarity based modeling equation.
6 is a schematic diagram of an autoassociative sequential similarity based modeling equation.
7 is a schematic diagram of one form of an inferential sequential similarity based modeling equation that is estimated at the modeled sensor dimension.
8 is a schematic diagram of another form of an inferential sequential similarity based modeling equation that is estimated at a modeled sensor dimension.
9 is a schematic diagram of a sequential similarity based modeling equation estimated in the time dimension.
10 is a schematic diagram of inference sequential similarity based modeling equations estimated in the time dimension.
11 is a schematic diagram of inference sequential similarity based modeling equations estimated in the time dimension and the sensor dimension.
커널 회귀 모델, 및 특히 유사도 기반 모델에서 추정치의 정확성은 실질적으로 시간 도메인 정보를 모델로 포함시킴으로써 개선될 수 있다고 판단되어 왔다. 그래서, 본 발명의 모니터링 시스템 및 방법의 한가지 기술적 효과는 시간 도메인 정보를 산업 공정, 시스템, 머신 또는 다른 객체들을 모니터하는 대다수의 주기적 및 비주기적 센서 신호들로부터 포착함으로써 추정 데이터를 생성하는 것이다. 본 발명 시스템의 기술적 효과는 또한 아래에서 상세히 설명되는 바와 같이 커널 회귀 모델링의 코어에서 기본적인 비선형 수학적 계산을 벡터-대-벡터 연산에서 매트릭스-대-매트릭스 (또는 어레이-대-어레이) 연산으로 확장하는 실증적 모델을 동작시키는 것이다. 모니터링 시스템 및 방법의 또 다른 대안의 기술적 효과는 추정치를 생성하는데 사용된 기준 데이터가 모니터링되는 객체의 정상적 동작을 표현하는 데이터인지 또는 결함을 나타내는 객체으로부터의 데이터를 더 잘 매칭시키는 결함 모드 데이터인지 모니터링되는 객체의 미래 상태를 판단하는 미래 시점에 대한 가상 또는 추론된 추정 값을 생성하는 것이다. It has been determined that the accuracy of estimates in kernel regression models, and especially similarity-based models, can be substantially improved by including time domain information as a model. Thus, one technical effect of the monitoring system and method of the present invention is to generate estimation data by capturing time domain information from the majority of periodic and aperiodic sensor signals that monitor industrial processes, systems, machines or other objects. The technical effect of the present system is also to extend basic nonlinear mathematical calculations from vector-to-vector operations to matrix-to-matrix (or array-to-array) operations in the core of kernel regression modeling, as detailed below. It is to operate an empirical model. Another alternative technical effect of the monitoring system and method is to monitor whether the reference data used to generate the estimate is data representing the normal behavior of the monitored object or defect mode data that better matches data from the object representing the defect. It is to generate a hypothetical or inferred estimate of the future time point for determining the future state of the object.
도 1을 참조하면, 시간 도메인 정보를 포함하는 모니터링 시스템은 하나 이상의 모듈의 형태로 된 컴퓨터 프로그램으로 구현될 수 있으며 하나 이상의 컴퓨터(100)에서 실행되고 하나 이상의 프로세서(102)에 의해 실행될 수 있다. 컴퓨터(100)는 센서 데이터 및/또는 컴퓨터 프로그램을 영구적이든 일시적이든 보유하는 내부이든 외부이든 하나 이상의 메모리 스토리지 디바이스(104)를 가질 수 있다. 일 형태에서, 스탠드얼론 컴퓨터는 생물, 계측 파라미터 (온도, 및 압력 등)을 포함하는 지령받은 머신, 프로세스 또는 다른 객체에 있는 센서들로부터 센서 데이터를 수신하도록 구성된 전용 프로그램을 구동한다. 모니터링되는 객체는, 특별하게 제한되지 않지만, 몇 가지 예를 들면, 산업 플랜트 내 하나 이상의 머신, 하나 이상의 차량, 또는 제트 엔진과 같이 차량에 탑재된 특정한 머신일 수 있다. 센서 데이터는 컴퓨터 네트워크 또는 인터넷을 통하여 유선 또는 무선으로, 예를 들면, 데이터를 수집하는 컴퓨터 또는 데이터베이스에 전송될 수 있다. 하나 이상의 프로세서를 갖는 하나의 컴퓨터는 모든 모듈의 모든 모니터링 작업을 수행할 수 있거나, 또는 각각의 작업 또는 모듈은 그 모듈을 실행하는 그 자신의 컴퓨터 또는 프로세서를 가질 수 있다. 그래서, 한 곳에서 프로세싱이 일어날 수도 있고 또는 유선 또는 무선 네트워크에 의해 모두 연결되어 있는 다른 많은 장소에서 프로세싱이 일어날 수 있다. Referring to FIG. 1, a monitoring system including time domain information may be implemented as a computer program in the form of one or more modules and may be executed on one or
도 2를 참조하면, 모니터링 시스템(10)에 의해 수행된 프로세스(300)에서, 시스템은 전술한 바와 같이 모니터링되는 객체(16) 위에 놓여진 센서들(12)로부터 데이터 또는 신호를 수신한다. 이러한 데이터는 모델(14)에 의해 사용하기 위한 입력 벡터들(32) 내로 배열된다. 여기서, 입력, 실제, 및 현재라는 용어는 서로 바꾸어 사용되며, 벡터, 스냅샷 및 관측치라는 용어는 서로 바꾸어 사용된다. 입력 벡터(또는 예를 들어, 실제 스냅샷)는 한 순간의 시간에 모니터링되는 머신의 동작 상태를 나타낸다. 2, in a
부가적으로, 또는 대안으로, 입력 벡터(32)는 센서 데이터(또는 미가공 데이터(raw data))에 기반하여 계산될 수 있거나 또는 계산되지 않았을 수 있는 계산된 데이터를 포함할 수 있다. 이것은, 예를 들어, 평균 압력 또는 압력 강하를 포함할 수 있다. 입력 벡터(32)는 또한 객체(16) 위에 놓여진 센서들에 의해 표현되지 않은 다른 변수를 표현하는 값들을 가질 수 있다. 이것은, 예를 들면, 센서 데이터가 수신되는 년도의 하루의 평균 주변 온도 등일 수 있다. Additionally or alternatively,
모델(14)은 벡터(32) 형태의 데이터를 취득하고(302) 입력 벡터들을 입력 어레이 또는 매트릭스로 배열한다(304). 그러나, 모델(14) 자체는 입력 데이터로부터 온 벡터들(32)을 구성할 수 있고 또는 데이터를 집합 또는 벡터들 및 어레이들로 구성하는 입력 컴퓨터 또는 프로세서로부터 벡터들을 수신할 수 있다. 그래서, 입력 데이터는 컴퓨터(100), 컴퓨터(100)의 위치에 가까운 다른 컴퓨터에 의해, 또는 객체(16) 근처와 같이 다른 위치에서 벡터로 배열될 수 있다.
모델(14)은 또한 기준 벡터 또는 행렬 형태, 때로는 행렬(H)라고 지칭되는 기준 데이터를 기준 라이브러리(18)로부터 취득한다(306). 라이브러리(18)는 시스템 내 모든 이력 기준 벡터들을 포함할 수 있다. 그러면 모델(14)은 기준 데이터 및 입력 어레이들을 사용하여 결과 추정 매트릭스 또는 어레이 형태의 추정치를 생성한다(310). 추정 매트릭스는 차분 모듈(20)에 제공되며, 이 차분 모듈은 추정 매트릭스 내 추정 값들과 입력 어레이 내 대응하는 입력 값들 간의 차(또는 잔차(residual))를 판단한다(312). 잔차는 경보 또는 분석 관리 모듈(또는 간단히 경보 모듈)(22)에 의해 사용되어 결함이 존재하는지를 판단한다(314).
파선으로 도시한 바와 같이, 모니터링 시스템(10)은 또한 각각의 입력 어레이 내 벡터들과 비교하기 위해 서브세트 또는 매트릭스 D(t)(아래의 학습된 순차적 패턴 매트릭스들(learned sequential pattern matrics)의 3차원 집합(three-dimensional collection)이라고 지칭함(도 6))을 구성하는데(308) 사용된 기준 라이브러리로부터 어느 데이터를 변경하는 로컬라이제이션(localization) 모듈(28)을 포함할 수 있다. 그렇지 않으면, 기준 데이터의 매트릭스 D(t)는 아래에서 자세히 설명되는 바와 같이 모든 입력 매트릭스들에서 동일하게 유지할 수 있다. 또한, 모니터링 시스템은 적응 모듈(30)을 가질 수 있으며, 이 적응 모듈은 입력 벡터들을 계속하여 기준 라이브러리에 위치하게 하여 라이브러리 내 데이터를 갱신하거나 또는, 예를 들어, 모델이 여태껏 겪어보지 못한 머신의 새로운 정상 상태를 나타내는 데이터를 수신할 때처럼 어떤 이벤트가 발생할 때 라이브러리 내 데이터를 갱신한다. 이것 또한 아래에서 상세히 설명된다.As shown by the dashed lines, the
경보 모듈(22)은 경보뿐 아니라 잔차를 직접 사용자용 인터페이스 또는 출력 모듈(24)에 제공하여 잔차 자체의 진단 분석을 수행하도록 할 수 있고, 또는 진단 모듈(26)은 결함의 원인의 정확한 특성을 분석하여 출력 모듈(24)을 통해 진단 결론 및 심각도(severity ratings)를 사용자에게 보고하도록 제공될 수 있다. The
출력 모듈(24)은 이러한 결과를 표시하기 위한 메커니즘 (예를 들면, 컴퓨터 스크린, PDA 스크린, 프린트 아웃, 또는 웹 서버), 결과를 저장하는 메커니즘 (예를 들어, 쿼리 기능을 갖는 데이터베이스, 플랫 파일, XML 파일) 및/또는 결과를 원격 위치 또는 다른 컴퓨터 프로그램에 결과를 통신하기 위한 메커니즘(예를 들어, 소프트웨어 인터페이스, XML 데이터그램, 이메일 데이터 패킷, 비동기 메시지, 동기 메시지, FTP 파일, 서비스, 파이프형 명령 등)을 포함할 수 있다.The
실증적 모델(14)의 보다 상세한 설명은 커널 회귀의 확실한 지식을 필요로 한다. 커널 회귀와 같은 패턴 인식 기술에서, 패턴은 벡터로서 (전술한 바와 같이) 함께 그룹화된 입력 데이터로 구성된다. 각 벡터의 데이터는 공통의 시점에서 한편의 장비로부터 수집된다. 그러나, 여기에서, 그리고 아래에서 더 상세히 설명되는 바와 같이, 기존의 커널 회귀 방법과 연관된 동시성 센서 값들의 패턴(벡터)은 연속하는 순간의 시간에서 생성된 순차적 패턴과 같은 시간적으로 관련된 정보 또는 연속하는 순간의 시간에서 생성된 패턴에 적용된 시간-독립 함수들(예를 들면, 필터, 시간 유도체 등)에서 생성된 출력으로 늘어난다. 그러므로, 기존의 커널 회귀 방법에 의해 처리된 개개의 패턴(벡터)은 어레이를 구성하는 패턴들의 시간-관련 시퀀스들(또는 간단하게는 패턴 어레이 또는 패턴 매트릭스들)로 대체된다. A more detailed description of the
커널 회귀, 방사형 기저 함수(radial basis functions) 및 유사도-기반 모델링을 포함하는 모든 커널-기반 모델링 기술은 하기 수학식으로 기술될 수 있다. All kernel-based modeling techniques, including kernel regression, radial basis functions, and similarity-based modeling, can be described by the following equation.

상기 수학식에서, 센서 신호 또는 센서 값 추정치의 벡터 xest는 센서 측정치의 입력 벡터 xnew를 센서 데이터 xi의 L 개 학습된 패턴들과 비교하는, 커널 함수 K의 결과들의 가중 합(weighted sum)이다. xi는 벡터(또는 관측치, 패턴, 스냅샷, 또는 표본(exemplars)이라고도 지칭함)의 형태로 된 기준 또는 학습된 데이터로 구성된다. 커널 함수의 결과들은 벡터의 형태일 수 있고 또한 다수의 방식으로 판단될 수 있는 가중치 ci에 따라 조합된다. 전술한 형태는 모든 추정된 출력 신호들이 또한 입력 신호로 표현되는 "자동연상(autoassociative)" 형태이다. 다시 말해서, 각각의 입력 값마다, 추정 센서 값이 산출된다. 이것은 어떤 추정 출력 값들이 기존의 입력 값을 표현하지 못하는 "추론적(inferential)" 형태와 대조를 이루지만, 그 대신 입력으로부터 추론된다.In the above equation, the vector x est of the sensor signal or sensor value estimate is a weighted sum of the results of the kernel function K, which compares the input vector x new of the sensor measurement with the L learned patterns of the sensor data x i . to be. x i consists of reference or learned data in the form of a vector (or also called an observation, pattern, snapshot, or exemplars). The results of the kernel function are combined according to the weight c i , which can be in the form of a vector and can be determined in a number of ways. The foregoing form is in the form of " autoassociative " in which all estimated output signals are also represented as input signals. In other words, for each input value, an estimated sensor value is calculated. This contrasts with the "inferential" form in which some estimated output values do not represent existing input values, but are inferred from the input instead.

여기서 이 경우, yest는 다른 파라미터들의 입력 벡터들 xnew과 이들 파라미터들의 L 개 학습된 표본들 xi와의 커널-기반 비교를 통해 취득된 추론된 센서 추정치이다. 각각의 학습된 표본 xi는 이것은 적어도 부분적으로 yi의 함수인 커널 K 및 벡터들 ci에 따라서 가중된 방식으로 조합된 추정될 파라미터들의 또 다른 표본 벡터 yi와 연관된다. 유사한 방식으로, 하나보다 많은 센서가 동시에 추론될 수 있다. In this case, y est is an inferred sensor estimate obtained through a kernel-based comparison of the input vectors x new of the other parameters with the L learned samples x i of these parameters. Each of the learning samples x i which are at least partially associated with the function y i of the kernel K and the addition of vectors of the combination of the weighting scheme to be estimated the parameters according to the different sample vectors c i y i. In a similar manner, more than one sensor can be inferred simultaneously.
커널-기반 추정기에 공통적인 사항은 커널 함수, 및 커널 결과 및 표본들을 구현하는 벡터들 ci에 기반한 표본들의 선형적 조합(예를 들면, 표본들 또는 벡터들의 매트릭스)로부터 생성된 결과의 생성물이다. 커널 함수 K는 일반화된 내적(generalized inner product)이지만, 하나의 형태로 xnew 및 xi가 동일할 때 그의 절대 값이 최대라는 또 다른 특징을 가지고 있다. Common to kernel-based estimators is the product of the kernel function and the result generated from the kernel result and a linear combination of samples based on the vectors c i implementing the samples (e.g., a matrix of samples or vectors). . The kernel function K is a generalized inner product, but has another feature that its absolute value is maximum when x new and x i are identical in one form.
본 발명의 일 실시예에 따르면, 모델을 제공하는데 사용될 수 있는 커널-기반 추정기는 다음과 같이 나다라와-왓슨 커널 회귀 형(Nadaraya-Watson kernel regression form)으로 예시되는 커널 회귀이다. According to one embodiment of the present invention, a kernel-based estimator that can be used to provide a model is a kernel regression illustrated in the Nadaraya-Watson kernel regression form as follows.


추론 형태에서, 추론된 파라미터들 yest의 다변수 추정치는 파라미터 측정치 xnew 및, 각각의 xi와 연관되고 커널 결과들의 합으로 정규화된 각각의 학습된 벡터들 yi에 따라 선형적으로 조합된 L 개의 학습된 표본들 xi의 입력 벡터에 대한 커널 K 연산자의 결과로부터 생성된다. yi는 X 내 파라미터들의 학습된 측정치들과 연관된 (이를 테면, 동시적으로 측정된) Y 내 파라미터들의 학습된 측정치들의 L개 세트를 표현한다. 예를 들어, X는 다수의 압력 판독값들을 포함할 수 있으며, 한편 Y는 동일 시스템으로부터의 대응하는 다수의 온도 판독값들 표현할 수 있다. 다시 말해서, 압력 판독값들은 yi (빠트린 파라미터의 이전 값들을 가진 기준 벡터)와의 계산에서 사용되는 가중치들을 계산하는데 사용되어 yest에 대한 추정된 온도 판독값들 또는 센서 값들을 계산할 수 있다. In inference form, the multivariate estimate of the inferred parameters y est is linearly combined according to the parameter measure x new and each learned vectors y i associated with each x i and normalized to the sum of kernel results. Generated from the result of the kernel K operator on the input vector of L learned samples x i . y i represents L sets of learned measurements of the parameters in Y (eg, measured simultaneously) associated with the learned measurements of the parameters in X. For example, X can include multiple pressure readings, while Y can represent corresponding multiple temperature readings from the same system. In other words, the pressure readings can be used to calculate the weights used in the calculation with y i (the reference vector with the previous values of the missing parameters) to calculate the estimated temperature readings or sensor values for y est .
커널 회귀의 자동 연상 형태에 있어서, 파라미터 xest의 다변수 추정치는 학습된 관측치 xi에 대한 입력 벡터 xnew의 커널 동작 결과들로 곱해진, 이들 파라미터들 xi의 학습된 측정치들의 정규화된 선형적 조합에 의해 (예를 들어, 아래에서 기술된 표본의 매트릭스 D의 형태로) 생성된다. In the automatic association form of kernel regression, the multivariate estimate of the parameter x est is a normalized linearity of the learned measurements of these parameters x i , multiplied by the kernel operation results of the input vector x new for the learned observation x i . By combination (eg, in the form of matrix D of the sample described below).
본 예의 커널 회귀에 있어서, 상기 수학식 1 및 2로부터 ci는 커널 비교 값들의 합에 의해 정규화된 학습된 표본으로 구성된다. 추정 벡터 yest 또는 xest는, 일 예에 따르면, 잔차를 제공하기 위해 실제 측정된 값들(xnew 또는 ynew)과 차이나는 추정된 파라미터들의 세트를 포함한다. In the kernel regression of this example, c i from
커널 회귀의 특정 예에서, 유사도-기반 모델(SBM)은 본 발명에 따른 모델로서 사용될 수 있다. 나다라와-왓슨 커널 회귀는 한 세트의 (어쩌면 잡음의) 학습된 표본들이 주어진 경우 추정치를 유연하게 하는 추정치를 제공하는 반면, SBM은 입력 벡터가 학습된 표본들 중 하나와 동일한 경우와 같이 학습된 표본들이 또한 입력이 될 때도 학습된 표본에 맞는 보간된 추정치를 제공한다. 이것은 이들 신호 내 잡음이 (만일 잡음이 모델이 만들어졌던 표본에서도 마찬가지로 존재한다면) 어떤 범위까지 과적합할 것이기 때문에, 파라미터에서 편차를 검출할 때 유리할 수 있고, 그래서 나다라와-왓슨 커널 회귀 접근법과 비교하여 어느 정도 잔차로부터 잡음을 제거할 수 있다. SBM은 커널 함수 K를 연산자 ![]()
![]()

상기 수학식에서 D는 전치된 것으로, 그 결과 D 내 각각의 관측치 xi 마다 하나씩 커널 값들의 컬럼 벡터가 된다. 마찬가지로, 모든 표본들을 서로 비교하면 다음과 같이 표현될 수 있다. In the above equation, D is transposed, resulting in a column vector of kernel values, one for each observation x i in D. Similarly, comparing all the samples with each other can be expressed as

그런 다음, SBM의 자동연상 형태는 하기 수학식에 따라서 추정 벡터를 생성한다. Then, the auto-association form of SBM generates an estimation vector according to the following equation.

수학식에서, xest는 추정 벡터이고, xnew는 입력 관측치이고, D는 파라미터들의 학습된 표본 관측치들의 세트(또는 서브세트)를 포함하는 학습된 벡터 매트릭스이다. 유사도 연산자 또는 커널은 심볼![]()
![]()
![]()
![]()
![]()
![]()
수학식 7의 경우, 입력 벡터들의 그룹 중에서 시간 도메인 정보는 추정치를 생성하는데 무시된다는 것 또한 알아야 한다. 다시 말해서, 수학식 7은 단일 입력 벡터 xnew를 이용함으로써 추정 벡터를 생성하기 때문에, 입력 벡터들의 그룹 내 벡터들이 분석되어 추정 벡터를 생성하는 순서는 크게 중요치 않다. 만일 결함이 존재하는지를 판단하기 위해 또는 결함의 특정한 형태를 진단하기 위해 (순차적인 것처럼) 시간에 관련된 어떤 순서가 나중에 프로세서에서 필요하다면. 추정치를 생성한 이후에 벡터들을 원하는 대로 순서화시킬 수 있다. It should also be noted that for
추정치는 다음의 수학식에 따라서 데이터의 원본과 무관하게 만듦으로써 더욱 개선될 수 있는데, 이 수학식에서 추정치는 유사도 연산자로부터 생성된 "가중치들"의 합으로 나눔으로써 정규화된다.The estimate can be further improved by making it independent of the original data according to the following equation, where the estimate is normalized by dividing by the sum of the "weights" generated from the similarity operator.

추론 형태의 유사도-기반 모델링에 있어서, 추론된 파라미터 벡터 yest는 하기 수학식에 따른 학습된 관측치로부터 추정된다.In the similarity-based modeling of the inferred form, the inferred parameter vector y est is estimated from learned observations according to the following equation.
![]()
![]()
수학식에서 Din은 xin 내 실제 센서 값들(또는 파라미터들)과 동일한 개수의 로우들을 가지며, Dout는 추론된 파라미터들 또는 센서들을 포함하는 파라미터들의 총 개수와 동일한 개수의 로우들을 갖는다. 수학식 9는 벡터들의 위치, 입력 값들(1 내지 5) 및 추론된 결과 값들(6-7)을 보여주는 도 4에서 개략적으로 도시된다. D in has the same number of rows as the actual sensor values (or parameters) in x in , and D out has the same number of rows as the total number of parameters including the inferred parameters or sensors. Equation 9 is schematically shown in FIG. 4 showing the position of the vectors, the input values 1 to 5 and the inferred result values 6-7.
일 형태에서, 학습된 표본들 Da의 매트릭스는 입력 벡터 xin의 센서 값들에 맵핑하는 로우들과 추론된 센서들에 맵핑하는 로우들을 포함하는 집합 매트릭스(aggregate matrix)로서 이해될 수 있다.In one form, the matrix of learned samples D a can be understood as an aggregate matrix comprising rows that map to sensor values of the input vector x in and rows that map to inferred sensors.

이전처럼 가중치들의 합을 이용하여 정규화하면 다음과 같다. Normalized using the sum of weights as before.

다음과 같이 Dout를 학습된 표본들 Da의 전체 매트릭스로 대체함으로써, 유사도-기반 모델링은 (자동 연상형의) 입력 센서들과 (추론형의) 추론 센서들의 추정치들을 동시에 계산할 수 있다는 것을 알아야 한다. It should be noted that similarity-based modeling can compute the estimates of (auto-associative) input sensors and (inferential) inference sensors at the same time by replacing D out with the entire matrix of trained samples, D a , as follows : do.

도 5를 참조하면, 수학식 12는 입력 및 추론된 값들 둘 다를 기준 값으로 하는 매트릭스 Da를 사용한다. 이렇게 함으로써 입력 값들과 추론 값들을 모두 표현하는 추정 벡터가 된다. Referring to FIG. 5, Equation 12 uses a matrix D a that makes both the input and inferred values reference values. This results in an estimation vector representing both the input values and the inference values.
전술한 바와 유사한 또 다른 커널-기반 모델링 기술은 방사형 기저 함수의 기술이다. 신경학적 구조에 기초하여, 방사형 기저 함수는 - 각각의 기저 함수는 입력 벡터들의 n-차원 공간에서 수용 필드(receptive field)를 구성함 - 신경 회로망의 특정한 형태로 수용 필드를 활용하며, 신경망에서 은닉층 노드로 표현된다. 각각의 수용 필드는 전술한 커널들의 형태를 갖는데, 여기서 수용 필드의 "중앙(center)"은 특별한 은닉 단위가 표현하는 표본이다. 표본 만큼의 동일한 개수의 은닉 단위 수용 필드가 존재한다. 다변수 입력 관측치는 은닉 층과 완전히 연결된 입력 층에 입력된다. 그래서, 각각의 은닉 유닛은 전체 다변수 입력 관측치를 수용하고, 입력이 각각의 필드의 "중앙"에 일치할 때 최대가 되는 결과를 생성하며, (전술한 SBM과 유사하게) 이들이 점차 달라짐에 따라 줄어든다. 수용 필드의 은닉 층의 출력은 (상기 수학식 1에서와 같이) 가중치 ci에 따라서 조합된다.Another kernel-based modeling technique similar to the one described above is that of radial basis functions. Based on the neurological structure, the radial basis function-each basis function constitutes a receptive field in the n-dimensional space of the input vectors-utilizes the receptive field in a particular form of neural network, and the hidden layer in the neural network. Represented by a node. Each acceptance field takes the form of the aforementioned kernels, where the "center" of the acceptance field is a sample represented by a particular hidden unit. There is the same number of hidden unit acceptance fields as there are samples. Multivariate input observations are input to an input layer that is completely connected to the hidden layer. Thus, each concealment unit accepts the full multivariate input observations and produces maximum results when the inputs match the "center" of each field, as they gradually vary (similar to the SBM described above). Decreases. The outputs of the hidden layers of the acceptance field are combined according to the weight c i (as in
전술한 바와 같이, 커널은 각종의 가능한 커널들로부터 선택될 수 있으며, 일 형태에서 커널은 동일한 두 벡터들의 비교를 통해 그 커널에 의해 반환된 모든 값들 중 최대 절대 값을 갖는 값(또는 유사도 점수)을 반환하도록 선택된다. 본 명세서에서 여러 예가 제공되지만, 이들 예는 본 발명의 범주를 제한하려는 것은 아니다. 하기의 예는 어느 두 벡터들 xa 및 xb의 비교를 통해 본 발명에 따라 사용될 수 있는 커널/유사도 연산자의 예들이다. As mentioned above, the kernel can be selected from a variety of possible kernels, in which the kernel has the largest absolute value (or similarity score) of all values returned by the kernel through a comparison of the same two vectors. Is selected to return. While several examples are provided herein, these examples are not intended to limit the scope of the invention. The following example is an example of a kernel / similarity operator that can be used in accordance with the present invention through a comparison of any two vectors x a and x b .


수학식 13-15에서, 두 벡터들의 벡터 차 또는 "넘(norm)"이 사용되며, 일반적으로 이것은 2-넘이지만, 1-넘 또는 p-넘일 수도 있다. 파라미터 h는 일반적으로 커널의 흔히 "대역폭"이라고 불리우는 상수이며, 각각의 표본이 중요한 결과를 반환하는 "필드"의 크기에 영향을 미친다. 전력 λ 또한 사용되지만, 1이 되게 설정된다. 각각의 표본 xi 마다 상이한 h 및 λ를 이용하는 것이 가능하다. 한 가지 접근법에 의하면, 벡터 차 또는 넘을 이용하는 커널을 이용할 때, 측정된 데이터는, 예를 들면, 그 센서 데이터 세트의 최저 판독 값을 모든 센서 값들에 가산 또는 그로부터 감산한 다음 모든 결과들을 그 센서의 범위로 나눔으로써 0 내지 1의 범위 (또는 다른 선택된 범위)로 먼저 정규화되어야 한다. 대안으로, 데이터는 표준 편차 세트를 1로(또는 어떤 다른 상수로) 설정하는 제로-중심 평균 데이터(zero-centered mean data)로 변환함으로써 정규화될 수 있다. 더욱이, 본 발명에 따른 커널/유사도 연산자는 또한 관측치들의 원소들의 항에서 정의될 수 있다. 즉, 유사도는 벡터들의 각 차원에서 판단되며, 이들 개개의 원소 유사도들(elemental similarities)은 몇가지 방식으로 조합되어 전체 벡터 유사도를 제공한다. 전형적으로, 이것은 다음과 같이 어느 두 벡터 x 및 y의 커널 비교를 위해 원소 유사도들을 평균하는 것만큼 간단해질 수 있다. In Equation 13-15, the vector difference or "norm" of two vectors is used, which is generally 2-num, but may be 1-num or p-num. The parameter h is a constant, commonly called the "bandwidth" of the kernel, that affects the size of the "field" in which each sample returns an important result. The power lambda is also used, but is set to be one. It is possible to use different h and λ for each sample x i . According to one approach, when using a kernel that uses a vector difference or over, the measured data is, for example, adding or subtracting the lowest reading of the sensor data set to all sensor values and then subtracting all the results of that sensor. Divide by range and first normalize to a range of 0 to 1 (or other selected range). Alternatively, the data can be normalized by converting to zero-centered mean data that sets the set of standard deviations to one (or some other constant). Moreover, the kernel / similarity operator according to the invention can also be defined in terms of the elements of the observations. That is, the similarity is determined in each dimension of the vectors, and these individual elemental similarities are combined in several ways to provide the overall vector similarity. Typically, this can be as simple as averaging elemental similarities for a kernel comparison of any two vectors x and y as follows.

그런 다음, 본 발명에 따라 사용될 수 있는 원소 유사도 연산자는 제한없이 다음을 포함한다. Then, elemental similarity operators that can be used in accordance with the present invention include, without limitation:


상기 도시된 바와 같은 원소 커널의 경우에, 대역폭 h는 관측 벡터들의 m번째 파라미터의 예상된 범위의 몇 가지 종류의 측정치가 되게 선택될 수 있다. 이것은, 예를 들면, 모든 표본들 전체의 파라미터의 최대 값과 최소 값과의 사이의 차를 찾음으로써 판단될 수도 있다. 대안으로, 이것은 표본들 또는 기준 벡터들에 존재하는 데이터에 무관하게 알고있는 도메인을 이용하여 설정될 수 있다. 더욱이, 차이 함수를 이용하는 벡터 및 원소 커널들 둘다에 대하여, 만일 대역폭으로 나눈 차가 1 보다 크면, 이것은 1이 되게 설정될 수 있고, 그 결과 예를 들면 수학식 14, 15, 18 및 19 의 경우는 커널 값이 제로가 된다는 것을 주목하여야 한다. 또한, 커널 또는 유사도 연산자는 1, h, λ 등 대신에 상이한 상수들을 더하기 또는 곱하기 함으로써 변형될 수 있음을 용이하게 알 수 있다. 삼각 함수들 또한 사용될 수 있으며, 예를 들면, 다음과 같다. In the case of an elemental kernel as shown above, the bandwidth h can be chosen to be some kind of measurement of the expected range of the mth parameter of the observation vectors. This may be determined, for example, by finding the difference between the maximum and minimum values of the parameter across all samples. Alternatively, it can be set up using a domain known to the data present in the samples or reference vectors. Moreover, for both vector and elemental kernels that use the difference function, if the difference divided by the bandwidth is greater than 1, it can be set to be 1, so that, for example, for the following equations (14), (15), (18) and (19): Note that the kernel value is zero. It can also be readily appreciated that a kernel or similarity operator can be modified by adding or multiplying different constants instead of 1, h, λ, and the like. Trigonometric functions may also be used, for example:

일 형태에서, 유사도 연산자 또는 커널은 일반적으로 동일한 차원의 두 벡터들의 비교를 위해 유사도 점수를 제공한다. 이러한 유사도 점수는: In one form, the similarity operator or kernel generally provides a similarity score for comparison of two vectors of the same dimension. These similarity scores are:
1. 스칼라 범위 내에 있다. 이 범위는 각 끝 부분에서 경계를 이루고 있다; 1. It is in the scalar range. This range is bounded at each end;
2. 두 벡터가 동일하다면, 경계를 이룬 끝 부분들 중 한 곳에서 1이라는 값 (또는 다른 선택된 값)의 값을 갖는다;2. If two vectors are equal, they have a value of 1 (or other selected value) at one of the bounded ends;
3. 스칼라 범위를 넘어 단조적으로 변하며; 그리고 3. changes monotonically beyond the scalar range; And
4. 두 벡터가 동일해지게 접근함에 따라 증가하는 절대 값을 갖는다.4. The two vectors have an absolute value that increases as they approach the same.
전술한 모델링을 위한 모든 방법들은 전술한 커널-기반 접근법을 이용하며 표본들의 기준 라이브러리를 이용한다. 표본들(또는 기준 관측치 또는 기준 벡터들이라고도 지칭함)은 모델링된 시스템의 "정상(normal)" 행위(behavior)를 표현한다. 옵션으로, 이용가능한 기준 데이터는 표본들의 라이브러리로서 작용하는 특징 서브세트(characteristic subset)를 제공하기 위해 다운-선택(down-selected)될 수 있고, 이 경우에는 커널-기반 모델을 "훈련(training)하는" 다수의 기술들이 이용될 수 있다. 이 경우, 다운-선택된 라이브러리 자체는 상기 수학식에서 사용되는 매트릭스 D를 구성할 수 있다. 한가지 훈련 방법에 따르면, 라이브러리에는 모든 이용가능한 참조 관측치들 전체에서 소정 파라미터마다 최고 또는 최저 값을 갖는 적어도 이들 관측치들이 포함되어 있다. 이것은 추가적인 관측치들의 무작위 선택, 또는 충실히 데이터의 분산(scatter) 또는 군집(clustering)을 표현하기 위해 선정된 선택으로 보충될 수 있다. 대안으로, 기준 데이터는 군집될 수 있으며, 인위적으로 생성된 새로운 표본들로서 형성되는 - 그런 다음 라이브러리를 구성함 - 군집들의 "중심(centriods)"을 나타낸다. 본 기술들에는 표본들의 라이브러리를 포함하도록 관측치들을 선택하는 각종 기술들이 공지되어 있다. 그래서, 이 경우 적어도 일반적인 견지에서, 매트릭스 D는 라이브러리가 변하지 않는 한(즉, 이를 테면 라이브러리가 업데이트 될 때) 모든 입력 벡터들 xin 에 대한 수학식 7에서 동일하게 유지된다. All the methods for modeling described above use the kernel-based approach described above and use a reference library of samples. Samples (also called reference observations or reference vectors) represent the “normal” behavior of the modeled system. Optionally, the available reference data can be down-selected to provide a characteristic subset that acts as a library of samples, in which case "training" the kernel-based model. A number of techniques may be used. In this case, the down-selected library itself may constitute the matrix D used in the above equation. According to one training method, the library contains at least these observations with the highest or lowest value for each given parameter across all available reference observations. This can be supplemented with a random selection of additional observations, or a selection chosen to faithfully represent scatter or clustering of the data. Alternatively, the reference data can be clustered and represent "centriods" of clusters that are formed as artificially generated new specimens-which then constitute a library. Various techniques are known for selecting observations to include a library of samples. So in this case at least in general terms, matrix D remains the same in equation (7) for all input vectors x in as long as the library remains unchanged (ie, when the library is updated).
실증적 커널-기반 모델의 추론 및 자동연상 형태에 대한 대안의 구성에 있어서, 매트릭스 D는 모델이 입력 관측치의 품질에 기반하여 "수시로" 생성될 수 있도록 각각의 입력 벡터 xin 마다 재구성될 수 있으며, 학습된 관측치들의 대형 세트, 즉, 기준 세트으로부터 유도될 수 있다. 이것의 일예는 미국 특허 제7,403,869호에 기술되어 있다. 이 프로세스는 로컬라이제이션라고 지칭된다. 따라서, 커널-기반 모델링의 추론 형태 및 자동연상 형태의 커널-기반 모델링은 입력 관측에 기반하여, 대형 세트의 기준 관측치들로부터 선택된 한 세트의 학습된 관측치들 xi(매트릭스 D)를 이용하여 수행될 수 있다. 커널-기반 모델들은 예외적으로 이러한 종류의 로컬라이제이션에 아주 적합한데 그 이유는 이 모델들이 한번의 공정으로 훈련되고 신속하게 갱신될 수 있기 때문이다. 유리하게, 대형 세트의 후보 표본들을 이끌어내되, 추정치를 생성할 목적으로 각기 새로운 입력 관측치을 갖는 서브세트를 선택함으로써, 모델링 계산의 속도가 줄어들 수 있으며 모델링되는 시스템의 역학을 여전히 잘 특징으로 하면서 모델의 강인성을 개선할 수 있다. In an alternative construction to the inference and auto-association form of the empirical kernel-based model, matrix D can be reconstructed for each input vector x in such that the model can be generated "often" based on the quality of the input observations, It can be derived from a large set of learned observations, that is, a reference set. One example of this is described in US Pat. No. 7,403,869. This process is called localization. Thus, kernel-based modeling in inference and auto-association forms of kernel-based modeling is performed using a set of trained observations x i (matrix D) selected from a large set of reference observations based on an input observation. Can be. Kernel-based models are exceptionally well suited for this kind of localization because they can be trained in one step and updated quickly. Advantageously, by drawing a large set of candidate samples, but selecting a subset with each new input observation for the purpose of generating an estimate, the speed of modeling calculations can be reduced and still well characterize the dynamics of the modeled system. Toughness can be improved.
모니터링 시스템(10)에 있어서, 로컬라이제이션 모듈(28)은 각종 표준을 이용하여 유사도 연산자 자체의 응용을 포함하는 집합 D(t)의 로컬라이즈된 매트릭스 멤버십을 구성할 수 있다. 일반적으로, 그러나, 모니터링 프로세스의 일부로서 모델에 의해 평가될 파라미터들의 세트 또는 유도된 특징들의 세트를 포함하는 입력 관측치(32)는 로컬라이제이션 모듈(28)에 제공되며, 로컬라이제이션 모듈은 표본 관측들의 서브세트를 선택하여 모델을 구축하기 위하여 기준 라이브러리(18)의 형태로 된 표본 관측치들의 대형 스토어에 액세스한다. 로컬라이제이션 모듈(28)은 라이브러리의 크기 보다 훨씬 작은 세트일 수 있는, 입력 관측치(32)에 관련한 라이브러리(18)로부터 표본들을 선택한다. 예를 들어, 기준 라이브러리(18)는 모델링되는 파라미터들로 표현된 시스템의 정상적인 역학을 특징으로 하는 100,000 표본 관측치들을 포함할 수도 있지만, 로컬라이제이션 모듈(28)은 입력 관측치(32)를 수신함에 응답하여 로컬라이즈된 모델을 구축하는데 소수 무리의 관측치들만을 선택할 수 있다. 그런 다음, 선택된 표본 관측치들은 이제 로컬라이즈된 모델(14)에 제공된다. 벡터-기반 시스템에서, 그 다음에 이들 관측치들은 커널-기반 추정기의 목적상 학습된 표본들 xi의 세트(또한 상기 SBM과 관련하여 D로 도시됨)를 포함한다. 추정 관측치 xest은 전술한 바에 따라서 생성된다. 모니터링 시스템(10)에 있어서, 선택된 학습된 표본들은 각기 시점 tp에서 벡터를 표현할 수 있고, 그래서 순차적 패턴 매트릭스가 tp에서 각 벡터마다 구축되어 아래에서 기술되는 집합 D(t)을 구성하게 된다. 다음번 입력 관측치(32)는 모니터링 시스템(10)으로 제공되므로, 이 프로세스는 새로운 입력 관측치에 따라, 라이브러리(18)로부터 새롭고 아마도 상이한 표본들의 서브세트를 선택하면서 반복된다. In the
하나의 접근법에 따르면, 입력 관측치(32)는 군집 기술에 기반하여, 학습된 관측들의 기준 라이브러리(18)와 비교될 수 있다. 따라서, 라이브러리(18) 내 표본 관측치들은 벡터들을 군집하기 위한 기술에서 공지된 다수의 기술 중 어느 기술을 이용하여 군집되며, 로컬라이제이션 모듈(28)은 입력 관측치(32)가 가장 가까운 클러스터가 어느 클러스터인지를 식별하고 그 클러스터의 멤버 표본들이 로컬라이즈된 모델(14)에 제공된 로컬라이즈된 관측들이 되도록 선택한다. 적합한 군집 방법은 k-평균(k-means) 및 퍼지 c-평균 군집(fuzzy c-means clustering) 또는 자기-조직화 맵 신경 회로망(self-organizing map neural network)을 포함한다. According to one approach, the
또 다른 접근법에 따르면, 커널은 입력 관측치(32)를 라이브러리(18) 내 각각의 표본과 비교하는데 사용되어 입력 관측치 대하여 기준 관측치들의 순위를 제공하는 유사도 값을 산출할 수 있다. 그러면, 이들의 소정의 상단 부분은 로컬라이즈된 집합 D(t)에 포함될 수 있다. 이러한 로컬라이제이션 양태의 다른 개량으로서, 모든 기준 관측치들의 순위화된 리스트 내 관측치들은 이들의 컴포넌트 구성요소의 범위까지 로컬라이즈된 집합 D(t)에 포함되어, 입력 벡터에서 해당 값을 "괄호로 묶인" 값을 제공한다. 예를 들어, 입력 벡터 내 값들이 기준 관측치들 중 하나의 관측치의 값에 의해 낮고 높은 쪽의 양쪽에서 괄호로 묶일 때가지 순위화된 리스트의 서치 다운이 수행된다. 이러한 "괄호로 묶인" 관측치들은 라이브러리(18) 내 다른 관측치들이 입력보다 더 높은 유사도를 가질지라도 로컬라이즈된 집합 D(t)에 포함된다. 입력 벡터내 모든 입력 값들이 괄호로 묶일 때까지, 순차적인 패턴 매트릭스들을 집합 D(t)에 포함하도록 구축하기 위한 벡터들의 사용자-선택가능한 최대 한계에 도달할 때까지, 또는 입력과의 유사도가 충분히 높아서 포함을 위한 유사도 임계치를 능가하는 입력에 대한 기준 관측치들이 더 이상 없을 때까지 서치는 지속된다. According to another approach, the kernel can be used to compare the
로컬라이즈된 집합 D(t)의 멤버십을 판단하는데 있어서 다른 변형예가 고려된다. 예를 들어, 전술한 두 가지의 군집 선택 방법 및 유사도 선택 방법에 있어서, 원소들의 세트, 즉, 유사도를 위해 군집된 또는 커널과 비교된 벡터들을 포함하도록 사용된 파라미터들은 모델 및 추정치를 생성하는데 사용된 것들과 같을 수 없지만, 그 대신 서브세트와 동일할 수 있거나 또는 부분적으로 중복되는 파라미터 세트와 동일할 수 있다. 전술한 바와 같이, 시스템(10) 및 모델(14)의 다음 단계는 집합 D(t)를 생성하도록 수행된다. 상세히 말해서, 일단 벡터들(일차(primary) 벡터들 tp라 지칭함)이 집합 D(t)에 포함을 위해 선택되면, (시간상 앞으로든 뒤로든) 시간적으로 관련된 다른 벡터들은 학습된 순차적 패턴 매트릭스를 형성하기 위해 각각의 기본 벡터마다 선택되며 집합 D(t)에 포함된다. 시간적으로 관련된 벡터들을 선정하는 프로세스는 아래에서 설명된다. 모듈(28)에 의한 로컬라이제이션은 아래에서 상세히 설명되는 학습된 순차적 패턴 매트릭스의 3차원 집합들 모두에 적용될 수 있다는 것이 이해될 것이다. Another variant is considered in determining the membership of the localized set D (t). For example, in the two cluster selection methods and the similarity selection method described above, the parameters used to include a set of elements, ie clustered or similar vectors compared to the kernel, are used to generate the model and the estimate. It may not be the same as those listed, but may instead be identical to the subset or may be identical to the partially overlapping parameter set. As mentioned above, the next step of
이제 시간 도메인 정보를 모델(14)에 포함시키는 쪽으로 들어가면, 본 명세서에서 기술된 모니터링 시스템(10)의 한가지 접근법에 의해, 두 벡터들의 유사도를 비교하기 위해 동작하는 상기 커널 함수가 동일 차원의 두 어레이들에서 동작하는 확장된 커널 함수 K로 대체된다.Now, when it comes to incorporating time domain information into the

상기 수학식에서 Xnew는 입력 패턴 어레이이며 Xi는 학습된 패턴 어레이이다. 패턴 어레이 또는 패턴 매트릭스는 시간적으로 관련된 벡터들의 시퀀스로 구성되며, 여기서 이러한 구성 벡터들은 각기 시간적으로 구분된 순간에서의 센서 측정치를 포함한다. 패턴 어레이 내 벡터들 중 하나는 기본 벡터로 지정되며, 그 데이터가 현재의 일차 시점 tp으로 지정된다. 다른 벡터들은 체계적인 방식으로 일차 시점에 관련하는 시점과 연관된다. X new is an input pattern array and X i is a learned pattern array. The pattern array or pattern matrix consists of a sequence of temporally related vectors, where these construct vectors each comprise sensor measurements at temporally separated moments. One of the vectors in the pattern array is designated as the base vector and its data is designated as the current primary time point t p . The other vectors are associated with a viewpoint relative to the primary viewpoint in a systematic manner.
일 형태에서, 일차 기본 시점은 패턴 어레이에서 시간 순서로 된 시점들(또는 그러한 시점들을 나타내는 순서로 된 시간 벡터들)의 시퀀스를 작성하는 가장 최신의 시점들이다. 한 접근법에 의하면, 다른 시점들은 동일하게 이격되어 있으며, 시점들 간의 일정한 시간 간견을 제공하는 시간 폭(time step) △t의 정수곱만큼 일차 시점을 선행한다. 소정 개수의 샘플들 nlb의 경우, 시점들은 순서로 된 시퀀스, 즉, (tp - nlb△t, tp - (nlb -1)△t, . . . , tp - 2△t, tp - △t, tp)를 구성한다. 시점들의 시퀀스는 하기와 같은 룩-백(look-back) 패턴 어레이를 정의한다.In one form, the primary elementary viewpoints are the most recent viewpoints that create a sequence of time ordered time points (or ordered time vectors representing such time points) in the pattern array. According to one approach, the other time points are equally spaced apart and precede the primary time point by an integer product of the time step Δt, which provides a constant time discovery between the time points. For a given number of samples n lb , the time points are in an ordered sequence, i.e. (t p -n lb Δt, t p- (n lb -1) Δt,. . . , t p -2Δt, tp-Δt, t p ). The sequence of viewpoints defines a look-back pattern array as follows.

도 6에 도시된 바와 같이, 기본 벡터 tp는 각 패턴 어레이의 최우측 컬럼으로서 배치되며, 다른 (nib) 데이터 벡터들은 기본 벡터 tp의 좌측에 위치한 컬럼 벡터들이다. 패턴 어레이들의 로우들은 모델링된 센서들로부터의 시간-변동 신호들의 짧은 부분에 상응한다. As shown in FIG. 6, the base vector t p is disposed as the rightmost column of each pattern array, and other (n ib ) data vectors are column vectors located to the left of the base vector t p . The rows of pattern arrays correspond to the short portion of the time-varying signals from the modeled sensors.
룩-백 패턴 어레이들을 이용함으로써, 수학식 21의 확장된 커널 함수는 실시간 시스템 모니터링에 적용될 수 있다. (시점 tp에서 벡터를 의미하는) 입력 패턴 어레이 Xnew내 기본 벡터 tp는 시간적으로 현재 시점의 시스템 데이터를 포함하며, 어레이의 나머지는 과거의 최근 시점들의 데이터 벡터들로 구성된다. 그래서, 입력 패턴 어레이가 비록 고정적일지라도 통상적인 커널 방법들에 의해 사용된 현재 벡터를 포함할 뿐만 아니라, 모니터링된 시스템의 전개되는 동적 행위를 표현하는 벡터들의 시퀀스를 포함한다. 시스템 타임이 진행함에 따라, 새로운 기본 벡터들이 어레이들의 최우측 위치에서 나타나는 것을 제외하고는 선행하는 어레이들과 동일한 데이터를 많이 포함하는 새로운 입력 패턴 어레이들이 구성되며, 가장 오래된 벡터들을 최좌측 위치로부터 탈락된다. 그래서, 시간적으로 단일의 순간을 표현하는 단일 입력 벡터가 다중 입력 패턴 어레이들 Xnew에서 사용될 것이며, 벡터들이 시퀀스에서 사용된다고 가정하면, 이 벡터들은 벡터들이 어레이에 있을 때와 동일한 회수로 사용될 것이다. 이러한 방식으로, 입력 패턴 어레이는 시간을 통해 패턴들의 이동 윈도우를 기술한다. 여기서, 이동 윈도우는 윈도우가 타임라인을 따라 또는 시간 순서로 된 센서 값 벡터들의 시퀀스를 따라서 이동함에 따라 어느 벡터들이 세트 내에 포함되는지를 변화시키는 연대순으로 고정된 개수의 벡터들의 세트 또는 그룹을 의미한다. By using look-back pattern arrays, the extended kernel function of Equation 21 can be applied to real-time system monitoring. The base vector t p in the input pattern array X new (meaning the vector at time t p ) contains the system data of the current point in time in time, and the rest of the array consists of data vectors of past recent points in time. Thus, although the input pattern array is fixed, it contains not only the current vector used by conventional kernel methods, but also a sequence of vectors representing the evolving dynamic behavior of the monitored system. As system time progresses, new input pattern arrays are constructed that contain much of the same data as the preceding arrays, except that new base vectors appear at the rightmost positions of the arrays, and the oldest vectors are dropped from the leftmost position. do. Thus, a single input vector representing a single instant in time will be used in the multiple input pattern arrays X new , assuming that the vectors are used in the sequence, these vectors will be used the same number of times as when the vectors are in the array. In this way, the input pattern array describes the window of movement of the patterns over time. Here, the moving window means a set or group of chronologically fixed numbers of vectors that change which vectors are included in the set as the window moves along the timeline or along a sequence of sensor value vectors in time order. .
상기 수학식 22에서 정의된 패턴 어레이는 nlb*△t 와 동일한 시간에 윈도우에 걸쳐 이어져 있는 nlb 데이터 벡터들을 포함한다. 이 예에서 데이터 벡터들은 시간적으로 동일하게 이격되어 있다. 이것을 부르는 다른 방식은 각각의 입력 패턴 어레이 또는 매트릭스가 입력 패턴 어레이 Xnew 내 입력 벡터들로 표현된 시점들 간의 일정한 시간 간격만으로 정의된다는 것이다. The pattern array defined in
대안으로, 커널은 달라지는 시간 길이 전반의 패턴 어레이들을 비교하는데 사용될 수 있다. 만일 패턴 어레이가 제1 시간 폭 △t1 (예를 들어, 일초 간격)만큼 이격되어 있는 시점들에서의 데이터를 포함하는 경우, 및 다른 패턴 어레이의 시점들이 제2 시간 폭 △t2 (예를 들어, 10초 간격)만큼 차이가 난다면, 이 패턴 어레이들은 상이한 기간을 표현하는 두 개의 패턴 어레이들이 존재하도록 달라지는 두 시간 윈도우들, nlb*△t1 및 nlb*△t2 에 걸쳐 이어져 있을 것이다. 일 형태에서, 하나의 패턴 어레이가 다른 패턴 어레이 내에 있는 것 보다 벡터들 (또는 시점들) 사이에서 상이한 시간 간격들을 가질 수 있을 지라도 패턴 어레이들이 동일한 개수의 벡터들을 포함하고 있는 한, (최우측 대 최우측, 우측에서 두번째 대 우측에서 두번째, 최좌측 대 최좌측과 같이) 두 패턴 어레이들에서 동일한 위치에 있는 벡터들과 일치하는 커널 함수는 시간-변동 스케일 전체에서 동작할 수 있을 것이다. 그래서, 일 예에서, 매트릭스들은 시간 간격 이격이 스펙트럼 시간 신호에서 피크들의 하모닉(1/f)에 대응할 수 있도록 상이하게 이격된 시점들 전체에서 확장될 수 있다. 패턴 어레이들이 차지한 기간 또는 지속 기간에서 이러한 차이는 학습된 패턴 어레이들과 입력 패턴 어레이들 사이에서, 입력 패턴 어레이로부터 입력 패턴 어레이까지, 학습된 패턴 에레이로부터 학습된 패턴 어레이까지, 또는 입력 패턴 어레이 내 각각의 벡터가 학습된 패턴 어레이들 내 대응하는 학습된 표본을 가지고 있는 한 (또는 다른 말로 하여, 학습된 매트릭스들 및 입력 매트릭스들이 동일한 개수의 벡터들을 가지고 있는 한) 상기한 것들의 모든 조합에서 사용될 수 있음을 또한 이해될 것이다. Alternatively, the kernel can be used to compare pattern arrays over varying lengths of time. If the pattern array includes data at points that are spaced apart by a first time width Δt 1 (eg, one second interval), and the time points of the other pattern array are second time width Δt 2 (eg, For example, by 10 second intervals, these pattern arrays span over two time windows, n lb * Δt 1 and n lb * Δt 2 , so that there are two pattern arrays representing different periods of time. There will be. In one form, as long as the pattern arrays contain the same number of vectors, even though one pattern array may have different time intervals between the vectors (or viewpoints) than are in the other pattern array, A kernel function that matches the vectors at the same location in both pattern arrays (such as rightmost, second to right versus second to right, left to left) may operate across the time-varying scale. Thus, in one example, the matrices may be extended across differently spaced time points such that the time interval spacing may correspond to the harmonics of peaks (1 / f) in the spectral time signal. In the period or duration occupied by the pattern arrays, this difference is found between the learned pattern arrays and the input pattern arrays, from the input pattern array to the input pattern array, from the learned pattern array to the learned pattern array, or within the input pattern array. As long as each vector has a corresponding learned sample in the learned pattern arrays (or in other words, as long as the learned matrices and input matrices have the same number of vectors), they will be used in all combinations of the above. It will also be appreciated.
다른 예에 따르면, 커널은 패턴 벡터들이 시간적으로 동일하게 이격되어 있지 않은 패턴 어레이들을 비교하는데 사용될 수 있다. 패턴 벡터들을 일정한 시간 간격 또는 시간 폭으로 이격시키는 대신, 시간 폭은 패턴 어레이 내 위치에 따라 변할 수 있다. (어레이의 우측편 가까이에 위치한) 가장 최근의 벡터들에 대해 작은 시간 폭을 이용하고 (어레이의 좌측 편 가까이에 위치한) 오래된 벡터들에 대해서는 큰 시간 폭을 이용함으로써, 커널 함수는 여전히 더 먼 과거에서 변동으로부터 기인한 약간의 영향을 보유하면서도 가장 최근의 변동에 주목할 것이다. According to another example, the kernel can be used to compare pattern arrays in which the pattern vectors are not equally spaced in time. Instead of spacing the pattern vectors at regular time intervals or time widths, the time width may vary depending on the position in the pattern array. By using a small time width for the most recent vectors (near the right side of the array) and a large time width for the old vectors (near the left side of the array), the kernel function is still farther past. Attention will be paid to the most recent changes, while retaining some effect from the changes in.
다시 도 1을 참조하면, 부가적인 필터링 단계가 필터 모듈(106)에 의해 패턴 어레이들에 대해 부가적인 필터링 단계가 수행된 다음, 커널 함수(수학식 21)에 의 해 분석될 수 있다. 필터링이 사용될 때, 이러한 필터링은 추정치를 생성하기 위하여 사용될 두 개의 결과 신호 값들 사이에서 어떤 실질적이고 의도하지 않은 부조화를 피하기 위하여 기준 벡터들과 입력 벡터들에 대해 수행된다. 필터링 단계에서, 시간-변동 센서 세그먼트들(패턴 어레이의 로우들)은 각기 세그먼트 내 데이터를 스무스(smooth)하게 하거나 또는 데이터로부터 통계적 특징들을 계산하기 위하여 필터링 알고리즘에 의해 처리된다. 이동 윈도우 평균화(moving window averaging), 큐빅 스플라인 필터링(cubic spline filtering), 또는 사비츠키-코레이 필터링(Savitsky-Golay filtering)과 같은 스무딩 알고리즘은 원 신호에서 중요한 추세(trends)를 포착하지만, 그 신호에서 잡음을 줄여준다. 스무딩 알고리즘은 입력 신호에서 원소들 각각에 대해 스무스해진 값을 산출하기 때문에, 이 알고리즘들은 센서 데이터의 원래 패턴 어레이와 동일한 차원을 갖는 패턴 어레이를 생성한다. 대안으로, 필터링 단계는 한 가지 이상의 특징 추출 알고리즘들을 적용하여 각 신호 내 데이터의 통계적 특징들을 계산하는 단계로 구성될 수 있다. 이러한 특징들은 신호 데이터의 평균, 편차, 또는 시간 파생물을 포함할 수 있다. 동일한 개수의 특징 추출 알고리즘들이 패턴 어레이들 내 데이터에 적용되는 동안에는 원 패턴 어레이 내 데이터 벡터들의 개수는 변할 수 있다. Referring again to FIG. 1, an additional filtering step may be analyzed by the kernel function (Equation 21) after an additional filtering step is performed on the pattern arrays by the
전술한 바와 같이, 패턴 어레이들이 모델링되는 시스템으로부터 시간 정보를 표현하는데 사용되는 여러가지 방법이 있다. 이러한 방법들은 이것으로 제한되지 않지만, 동일하게 이격된 시점들에서부터의 데이터 벡터들의 시퀀스, 패턴 어레이들이 변하는 지속기간을 갖도록 달라지는 기간에 걸쳐 이어지는 데이터 벡터들의 시퀀스, 및 데이터 벡터들이 시간적으로 동일하게 이격되어 있지 않은 시퀀스들을 포함한다. 입력 패턴 어레이는 기준 패턴 어레이들보다 상이한 간격을 가질 수 있거나 또는 같을 수도 있다. 게다가, 패턴 시퀀스들은 스무딩 또는 특징 추출 알고리즘들에 의해 필터될 수 있다. 패턴 어레이들 또는 알고리즘들에 의해 필터링함으로써 생성된 어레이들의 형태에서 유일한 제한은 확장된 커널 함수 (수학식 21)에 의해 처리된 두 어레이들이 동일한 차원으로 이루어진다는 것(즉, 로우들 및 컬럼들의 개수가 동일한 것)이다. As mentioned above, there are several methods used to represent time information from the system in which the pattern arrays are modeled. These methods include, but are not limited to, a sequence of data vectors from equally spaced time points, a sequence of data vectors that follow over a period of time such that the pattern arrays have varying durations, and the data vectors are equally spaced apart in time. Contains sequences that are not present. The input pattern array may have a different spacing or may be the same as the reference pattern arrays. In addition, the pattern sequences can be filtered by smoothing or feature extraction algorithms. The only limitation in the form of arrays generated by filtering by pattern arrays or algorithms is that the two arrays processed by the extended kernel function (Equation 21) are of the same dimension (i.e. the number of rows and columns). Is the same thing).
전술한 벡터-기반 커널 함수와 유사하게, 비록 여기에서 스칼라 값이 두 벡터들이라기 보다 두 어레이들 사이의 유사도를 표현한다고 할지라도, 확장된 커널 함수는 스칼라 값 또는 유사도 척도를 반환한다. 확장된 커널 함수는 상기 열거된 벡터-기반 커널 함수와 동일한 특성을 보이는 유사도 점수를 생성한다. 즉, 유사도 점수는 그의 범위가 한정된 스칼라이고; 두 어레이들이 동일할 때 그 한정 값들 중 하나에 대해 일이라는 값(또는 다른 선택된 값)을 가지며; 그 범위에 걸쳐 일정하게 변하며; 그의 절대 값은 두 어레이들이 동일해지게 근접함에 따라 증가한다. 게다가, 확장된 커널 함수는 두 어레이들의 일치하는 시계열 컴포넌트들에서 동작한다. 이것은, 룩-백 패턴 어레이를 예를 든 경우, 확장된 커널 함수가 기준 및 입력 패턴 어레이들로부터 두 기본 벡터들 tp 간의 유사도를 찾는 것, 그런 다음, 어레이들 내 선행 벡터들 전체에서 기본 벡터들, -1 등의 좌측까지 두 데이터 벡터들 간의 유사도를 찾는 것을 의미한다. Similar to the vector-based kernel function described above, although the scalar value here represents the similarity between two arrays rather than the two vectors, the extended kernel function returns a scalar value or similarity measure. The extended kernel function produces a similarity score that exhibits the same characteristics as the vector-based kernel functions listed above. That is, the similarity score is a scalar whose range is limited; When two arrays are equal, they have a value of one (or another selected value) for one of their limiting values; Constant over its range; Its absolute value increases as the two arrays approach to be identical. In addition, the extended kernel function operates on matching time series components of the two arrays. This means that in the case of a look-back pattern array, for example, the extended kernel function has two basic vectors t p from the reference and input pattern arrays. Finding the similarity between two means then finding the similarity between two data vectors from the preceding vectors in the arrays to the left of the base vectors, -1, and so on.
확장된 커널 함수의 일예는 미국 특허 제 6,952,662호에 개시된 유사도 연산자에 기반한다. Xnew 및 Xi를 두 개의 동일하게 차원을 이룬 패턴 어레이라 하고, nsens 센서들 (또는 파라미터들)로부터의 데이터를 포함하면서 nib 순차적 시점을 이어지게 하면, 확장된 커널 함수는 다음과 같이 작성된다.One example of an extended kernel function is based on the similarity operator disclosed in US Pat. No. 6,952,662. If X new and X i are called two equally dimensioned pattern arrays, and the data from n sens sensors (or parameters) are passed through n ib sequential views, then the extended kernel function is written as do.

수학식에서 ρ 및 λ는 상수이다. 수학식 23에서 시간 종속 함수 θ(t)는 패턴 어레이들의 시간 원소들을 연산하여, 두 어레이들 내 동일 시점 벡터들로부터의 데이터를 매칭(match)한다. 이러한 시계열 데이터 매칭을 성취하는 한가지 수단은 소정 센서 j 마다 시계열 데이터의 가중 평균을 사용하는 것이다. Ρ and λ are constants in the equation. In

소정 센서 j 마다 데이터 원소들 간의 유사도 (Sj, k)는 센서 범위 rangej 동안 정상 동작 데이터의 범위로 정규화된 데이터 원소들의 절대차로서 정의된다. 그래서, 소정 센서의 데이터에 대한 시간 종속 유사도 함수 θ(t)는 다음과 같다.The similarity (S j , k) between data elements per predetermined sensor j is defined as the absolute difference of the data elements normalized to the range of normal operation data during the sensor range range j . Thus, the time dependent similarity function θ (t) for the data of a given sensor is as follows.

수학식 23과 25를 합하면, 하기와 같이 두 패턴 어레이에 대한 확장된 커널 함수가 생성된다. Adding

확장된 커널 함수의 다른 예는 미국 특허 제7,373,283호에 개시된 유사도 연산자에 기반한다. 또 다시 Xnew 및 Xi를 두 개의 동일하게 차원을 이룬 패턴 어레이라 하고, nsens 센서들 (또는 파라미터들)로부터의 데이터를 포함시키고 nlb 순차적 시점을 이어지게 하면, 제2의 확장된 커널 함수가 다음과 같이 작성된다. Another example of an extended kernel function is based on the similarity operator disclosed in US Pat. No. 7,373,283. Again, if X new and X i are two equally dimensioned pattern arrays, including data from n sens sensors (or parameters) and continuing n lb sequential views, the second extended kernel function Is written as:

이러한 확장된 커널 함수는 수학식 24 및 25에 의해 정의된 바와 같이 동일한 시간-종속 함수 θ(t)를 활용하여 두 패턴 매트릭스 내 소정 센서의 시계열 데이터를 비교한다. This extended kernel function utilizes the same time-dependent function θ (t) as defined by equations (24) and (25) to compare time series data of a given sensor in two pattern matrices.

도 6을 참조하는 동안, 두 확장된 커널 함수들(수학식 26 및 28)은 이 함수들이 모델링된 센서들로부터 정보를 모으는 방법에서만 차이가 나는데, 첫 번째 수학식은 커럴 함수의 원소적 형태를 표현하며, 두 번째 수학식은 커널 함수의 (1-넘과 같은) 벡터 차 형태를 표현한다. 두 수학식은 두 어레이들 Xnew 및 Xi 내 시간-변동 신호들의 세그먼트들 간의 차를 설명하기 위해 가중 평균을 활용한다. 상세히 말해서, 두 예의 수학식 26 및 28에서, 그리고 각각의 순차적 학습된 패턴 매트릭스 a 내지 g 경우, 각각의 학습 및 입력 값의 대응 쌍마다 절대차가 계산된다. 이 값들은 이 값들이 (1) 동일한 센서(또는 파라미터) 및 (두 값들이 기본 시간 tp 로부터 발생하는 것 처럼) 패턴 어레이 내 동일 시점 또는 (두 값들이 패턴 어레이 내에서 우측으로부터 두번 째인 벡터들 상에 놓여있을 때와 같이) 어레이 내 다른 벡터들에 대한 동일 위치를 나타낼 때와 대응한다. 학습 및 입력 값의 쌍들로부터의 절대 차는 가중 평균을 통해 결합되어 특정 센서에 대한 단일 평균의 결과를 취득하게 된다. 이것은 패턴 매트릭스들 a 내지 g 및 패턴 어레이들 Xnew로 표현된 각 센서 마다 또는 파라미터(1 내지 5) 마다 반복되어, 가중 평균 단계에서 각 센서/파라미터 마다 하나의 평균 스칼라 결과가 만들어 낸다. While referring to FIG. 6, the two extended kernel functions (
그 다음, 제1의 확장된 커널 함수(수학식 26)에서, 가중 평균 단계의 결과는 차례로 모든 센서들 전체에 대해 평균되어 어레이-대-어레이 비교를 위한 스칼라 값을 생성한다. 마지막으로, 이 스칼라 값은 제로 내지 1의 범위 내에 속하도록 전술한 바와 같이 유사도 점수의 특성들을 고수하는 신봉하는 값으로 변환된다 - 여기서 1은 동일함을 의미한다. 그런 다음 이 프로세스는 3차원 집합 D(t) 내 학습된 순차적 패턴 매트릭스 a 내지 g 에 대해 반복된다. 제2의 확장된 커널 함수(수학식 28)에서, 가중 평균 단계의 결과는 각 센서마다 하나씩 즉시 유사도 점수들로 변환된다. 그 다음 이러한 유사도 점수들의 벡터는 단일의 유사도 점수가 3차원 집합 D(t) 내 각 학습된 순차적 패턴 매트릭스 a 내지 g 마다 함수로 반환되도록 평균된다. Then, in the first extended kernel function (Equation 26), the result of the weighted average step is in turn averaged over all the sensors to produce a scalar value for array-to-array comparison. Finally, this scalar value is converted into a belief value that adheres to the properties of the similarity score, as described above, so as to fall within the range of zero to one, where 1 means equal. This process is then repeated for the learned sequential pattern matrices a to g in the three-dimensional set D (t). In the second extended kernel function (Equation 28), the result of the weighted average step is immediately converted into similarity scores, one for each sensor. These vectors of similarity scores are then averaged such that a single similarity score is returned as a function for each learned sequential pattern matrix a through g in the three-dimensional set D (t).
유사도-기반 모델링의 상황 내에서 사용될 때, 전술한 확장된 커널 함수는 일반성을 잃지 않고 확장된 유사도 연산이라고도 불리운다. 상기 수학식에서 사용된 표시 ![]()
![]()
![]()
![]()
앞에서 정의된 다른 벡터-기반 커널 함수의 확장된 버전(예를 들면, 수학식 13 내지 20)은 두 순차적 패턴 어레이에서 동일한 시점으로부터의 시계열 데이터를 일치시키기 위해 가중 평균을 이용함으로써 구축될 수 있다. 예를 들어, Xnew 및 Xi를 동일하게 차원을 이룬 두 패턴 어레이라 하고, nsens 센서들 (또는 파라미터들)로부터의 데이터를 포함시키고 nib 순차적 시점을 이어지게 하면, 수학식 17의 원소 유사도 연산자를 이용하여 수학식 16에서 정의된 커널 함수의 확장된 버전은 다음과 같다.Extended versions of other vector-based kernel functions defined above (eg, Equations 13-20) can be built by using weighted averages to match time series data from the same time point in two sequential pattern arrays. For example, if X new and X i are two equally dimensioned arrays of patterns, including data from n sens sensors (or parameters) and continuing n ib sequential views, the element similarity of equation (17) An extended version of the kernel function defined in

가중 평균(수학식 23)은 가중치들이 오래된 데이터 보다 더욱 최신의 데이터에 더 많이 가중되도록 선택될 수 있기 때문에 패턴 어레이들 내 시간-변동 신호들의 세그먼트들 간의 차이를 설명하는데 사용된다. 그래서, 일차 시점 tp로부터의 데이터에는 가장 높은 가중치가 주어진다 - 전형적으로 앞선 시점으로부터의 데이터(수학식 22)에는 점차 증가하는 가중치가 주어진다. 기본 시점에 대한 시간에 따라 가중치들을 선형적으로 또는 지수함수적으로 감소시키는 것과 같이 가중치를 정의하는 수많은 방식이 사용될 수 있다. The weighted average (Equation 23) is used to account for the difference between segments of time-varying signals in pattern arrays because the weights can be chosen to weight more on more recent data than on older data. Thus, data from the primary time point t p is given the highest weight-typically, data from earlier time points (Equation 22) is given increasing weight. Numerous ways of defining weights may be used, such as decreasing the weights linearly or exponentially over time with respect to the base view.
여러가지 다른 시간-종속 함수들 θ(t)이 시간-변동 신호의 두 세그먼트들 내 순차적인 시점들로부터 데이터를 일치시키하는데 사용될 수 있다는 것이 이해될 것이다. 그러한 방법은 이것으로 제한되지 않지만, 다른 가중 넘(2-넘 및 p-넘) 및 최대, 최소, 또는 중간 차를 포함한다. 함수에게 필요한 모든 것은 두 시퀀스들이 차이가 더 벌어짐에 따라 두 시퀀스들의 값이 동일하거나 증가한다면 최소가 되는(0의 값) 스칼라 값을 반환하는 것이다. It will be appreciated that various other time-dependent functions θ (t) can be used to match data from sequential points in time within two segments of the time-varying signal. Such methods include, but are not limited to, other weighted overs (2- and p-overs) and maximum, minimum, or intermediate differences. All the function needs is to return a scalar value that is the minimum (value of 0) if the values of the two sequences are the same or increase as the two sequences become more different.
순차적 패턴 어레이들의 개념을 SBM(수학식 7)의 자동연상 형태의 확장된 유사도 연산자 (예를 들어, 수학식 26 또는 28)와 조합하기 위하여, 벡터-기반 학습 벡터 매트릭스 D의 개념이 확장된다. 전술한 SBM의 표준 형태에서, 학습된 벡터 매트릭스는 정규 연산의 기간 동안 여러 시점에서 선택된 한 세트의 학습된 표본들(벡터들)로 이루어진다. 이들 벡터들이 선택된 시점들을 기본 시점들이라 표현하면, 각각의 학습된 벡터는 각각의 기본 시점에 선행하는 시점들의 시퀀스로부터 데이터를 수집함으로써 학습된 순차적 패턴 매트릭스로 확장될 수 있다. 이러한 방식으로, 학습된 벡터 매트릭스 D는 학습된 순차적 패턴 매트릭스들 D(t)의 집합으로 확장된다. 이러한 학습된 패턴 매트릭스들의 집합은 3차원 매트릭스를 형성하며, 여기서 차원은 제1 차원에서 모델링된 센서들 또는 파라미터들, 제2 차원에서 다양한 기본 시점들로부터의 학습된 표본들(벡터들), 및 제3 차원에서 기본 시점들에 대한 시간을 표현한다. In order to combine the concept of sequential pattern arrays with the extended similarity operator (e.g.,
SBM의 벡터-기반 형태에서 사용된 학습된 벡터 매트릭스를 구축하는데 사용된 전술한 훈련 방법은 SBM의 순차적 패턴 형태에 의해 요구된 학습된 순차적 패턴 매트릭스들 D(t)의 3차원 집합을 창출하는데 활용될 수 있다. 이것은 훈련 알고리즘에 의해 선택된 각각의 기준 벡터를 순차적 패턴 매트릭스를 구축하는 선행 시점들로부터의 기준 벡터들로 늘림으로써 성취된다. 학습된 패턴 매트릭스들의 집합은 훈련 알고리즘에 의해 선택된 각각의 기준 벡터 마다 하나씩, 모델링된 시스템의 "정상적" 행위를 표현하는 표본들의 기준 라이브러리(18)로부터 유도된다. 만일 순차적 SBM의 시간-추론적 형태가 사용된다면, 선행 시점들로부터의 부가적인 벡터들이 각각의 순차적 패턴 매트릭스에 추가된다. The aforementioned training method used to construct the learned vector matrix used in the vector-based form of the SBM is utilized to create a three-dimensional set of the learned sequential pattern matrices D (t) required by the sequential pattern form of the SBM. Can be. This is accomplished by increasing each reference vector selected by the training algorithm to reference vectors from preceding points of time that construct a sequential pattern matrix. The set of learned pattern matrices is derived from the
SBM의 벡터-기반 형태를 위해 사용되는 훈련 방법들은 기준 데이터에 내재하는 시간 도메인 정보를 고려하지 않고 정규 연산의 기간 동안의 여러 시점들로부터 표본들(벡터들)을 선택한다. SBM의 순차적 패턴 어레이 형태에서, 그 시간 도메인 정보는 각각의 선택된 표본을 증가함으로써 바로 선행하는 그리고 (어쩌면) 기본 시점들에 후행하는 시점들의 시퀀스로부터의 데이터 벡터를 공급받게 된다. 시간 도메인 정보를 감안하면서 순차적 학습된 패턴 매트릭스들의 집합 D(t)를 구축하고 로컬라이징하기 위한 대안의 프로세스에서, 각각의 입력 패턴 어레이는 입력 패턴 어레이의 개수와 동일한(즉, nlb+1) 기준 벡터들의 매 시퀀스와 비교될 수 있다. 이러한 비교는 입력 패턴 어레이와 가장 유사한 기준 벡터들의 시퀀스들을 식별하는 유사도 연산자의 확장된 형태(예를 들어, 수학식 26 또는 28)를 이용함으로써 성취된다. 기준 벡터들의 식별된 시퀀스들은 각기 집합 D(t) 내 순차적 학습된 패턴 매트릭스 중 하나를 구성한다. 선택 프로세스가 무엇이든 간에, 훈련 방법은 서로에 아주 가까운 기본 시점으로부터의 표본들을 선택하는 것이 가능하다. 가까운 기본 시점들로부터 두 표본들이 선택될 때, 상응하는 순차적 패턴 매트릭스들은 공동으로 데이터 벡터를 포함할 수 있다. The training methods used for the vector-based form of SBM select samples (vectors) from several points in time during a normal operation without considering the time domain information inherent in the reference data. In the form of a sequential pattern array of SBMs, the time domain information is supplied with a data vector from a sequence of time points immediately preceding and possibly (possibly) base points by increasing each selected sample. In an alternative process for constructing and localizing a set D (t) of sequentially learned pattern matrices taking into account time domain information, each input pattern array is equal to the number of input pattern arrays (ie, n lb +1) Can be compared with every sequence of vectors. This comparison is accomplished by using an extended form of similarity operator (eg,
도 6을 참조하면, 수학식 7은 입력 패턴 어레이 Xnew 및 학습된 순차적 패턴 매트릭스들 D(t)의 3차원 집합으로 도시된다. 입력 패턴 어레이 Xnew는 또한 현재 순간을 표현하는 벡터 tp를 포함하고 D(t) 내 학습된 패턴 매트릭스들과 대조가 되기 때문에 현재 또는 실제 패턴 어레이 또는 매트릭스라고 지칭할 수 있다. 예시된 실시예에서, 입력 패턴 어레이 Xnew는 네개의 벡터를 포함하며, 벡터 tp는 어레이에서 마지막(최우측) 벡터이다. 다른 벡터들은 간략성을 기하기 위해 tp 다음에 오는 시간 간격의 번호대로 -3 내지 -1로 번호가 붙여진다. 그래서, 도 6에서 벡터 -3은 (tp-nlb△t)와 같은 것을 표현한다 (여기서 nlb = 3 이다). 도 6에 도시된 바와 같이, 학습된 순차적 패턴 매트릭스들(모델링된 센서들, 기본 시점들, 및 패턴 시퀀스들)의 3차원 집합은 다음과 같이 묘사된다. 즉, 번호 1 내지 5는 모델링된 다섯 센서들로부터의 데이터를 표현하고, 번호들 붙인 네개의 컬럼들(또는 벡터들)은 네개의 순차적 시점들을 표현하며, 일곱개 층을 이룬 사각형들은 순차적 패턴 매트릭스 a 내지 g, - 각기 정규 연산의 여러 기간들로부터 선택된 기본 시점 tp인를 가짐 - 를 나타낸다. 학습된 순차적 패턴 매트릭스들 D(t)의 3차원 집합은 일곱개의 순차적 패턴 매트릭스들 a 내지 g를 포함한다. 그래서, 각각의 순차적 패턴 매트릭스 a 내지 g는 다섯 센서들과 네개의 순차적 시점들을 포함하며, 입력 패턴 매트릭스 Xnew와 동일한 차원을 갖는다. 비교를 위해, 이차원 매트릭스 D의 종래의 벡터-기반 수학식(도 3)과 학습된 순차적 패턴 매트릭스 D(t)의 3차원 집합(도 6)과의 차이를 가시화하는 다른 방식은 종래의 이차원 어레이는 3차원 집합 D(t)로부터 tp 벡터들만을 포함시키기 위해 그저 일곱개의 순차적 패턴 어레이들 a 내지 g 전반의 단일 매트릭스에 의해 구성되었을 것이라는 것이다. Referring to FIG. 6,
도 6의 최우측 괄호에서, 확장형 유사도 연산자 (![]()
![]()
중간 괄호에서 연산은, 집합 D(t) 내 학습된 순차적 패턴 매트릭스들 a 내지 g의 쌍의 각 조합 마다 하나씩, 유사도 값들의 7x7 사각 유사도 매트릭스를 산출한다. 유사도 벡터로 된 결과 유사도 매트릭스의 전치 매트릭스를 곱하면 일곱 원소를 포함하는 가중 벡터가 산출된다. 마지막 단계에서, 가중 벡터는 집합 D(t)로 곱해져서 추정 매트릭스 Xest를 생성한다. 일 형태에서, 추정 매트릭스 Xest는 입력 패턴 어레이들 내 입력 벡터들로 표현된 각각의 기간들에 상응하는 추정 벡터를 갖도록 입력 패턴 어레이 Xnew와 동일한 크기를 갖는다. 도 6의 예에서, 추정 매트릭스 Xest는 마치 룩-백 윈도우에서 형성된 것처럼 현재 시간의 순간 tp 및 세개의 선행 시점들 -1 내지 -3 각각에 대한 추정 벡터들 갖는다. 추정 벡터 Xest의 사용은 아래에서 더 상세히 기술된다. 현재 또는 기본 벡터와 함께 또는 기본 벡터 없이 그룹화된 선행 벡터들은 본 명세서에서 룩-백 윈도우라고 불리울 수 있으며, 현재 또는 기본 벡터와 함께 또는 기본 벡터 없이 그룹화된 후행 벡터들은 본 명세서의 아래나 어디에서든 설명되는 룩-어헤드(look-ahead) 윈도우라고 불리울 수 있음을 알아야 한다. The operation in middle parentheses yields a 7 × 7 square similarity matrix of similarity values, one for each combination of the trained sequential pattern matrices a to g in the set D (t). As a result of the similarity vector, multiplying the transpose matrix of the similarity matrix yields a weight vector containing seven elements. In the last step, the weight vector is multiplied by the set D (t) to produce the estimation matrix X est . In one form, the estimation matrix X est has the same size as the input pattern array X new to have an estimation vector corresponding to each period represented by the input vectors in the input pattern arrays. In the example of FIG. 6, the estimation matrix X est has estimation vectors for the instant t p of the current time and three preceding time points -1 to -3, respectively, as if formed in the look-back window. The use of the estimation vector X est is described in more detail below. Leading vectors grouped with or without a base vector may be referred to herein as a look-back window, and trailing vectors grouped with or without a base vector may be referred to below or anywhere in the specification. It should be noted that it may be called a look-ahead window described.
확장된 유사도 연산자를 갖는 순차적 패턴 매트릭스를 활용하는 SBM의 추론형으로의 확장(수학식 9)는 쉽게 명백해진다. 추론 모델링의 벡터-기반형과 유사하게, 학습된 순차적 패턴 매트릭스의 3차원 집합 Da(t)은 입력 패턴 어레이 Xin 내 센서 값들에 맵핑하는 학습된 순차적 패턴 매트릭스 a 내지 g 및 추론된 센서들 Dout(t)에 맵핑하는 순차적 패턴 매트릭스들 a 내지 g를 포함하는 집합 매트릭스(aggregate matrix)라고 이해될 수 있다. 도 7을 참조하면, 수학식 9는 입력 패턴 어레이 Xin 및 학습된 순차적 패턴 매트릭스들의 3차원 집합 Din(t) ― 다섯 입력 센서들 1 내지 5에 대해 일곱 개의 학습된 순차적 패턴 매트릭스들 a 내지 g를 가짐 ― 으로 도시되어 있다. 집합 매트릭스 Da(t)는 수학식 10에서 정의된 2차원 집합 매트릭스의 3차원 확장이다. 도 7의 도시한 것과 도 6의 도시한 것을 비교하면, 두 도면의 괄호로 묶인 매트릭스들은 이들을 표현하는 방법을 제외하고는 동일하다. 그러므로, 추론 모델의 가중 벡터의 계산은 자동연상 모델에 대해 앞에서 설명한 바와 동일한 방식으로 진행한다. 그러면, 도 4에서와 같이, 여기서 매트릭스 Dout(t)가 지금 학습된 순차적 패턴 매트릭스들의 3차원 집합이라는 것을 제외하고는, 가중 벡터는 도 7의 추론된 센서들의 학습된 순차적 패턴 어레이로 곱해지며, 이 단계에 의해 추론된 센서들 만을 표현하는 추정 매트릭스 Yest가 구성된다. 추론적 모델링의 벡터-기반 형태에 대해 앞에서 설명한 바와 같이, 가중 벡터는 또한 (도 8에 도시된) 두 입력 및 추론된 센서들의 추정 매트릭스들을 생성하기 위해 두 Din(t) 및 Dout(t)를 포함하는 학습된 순차적 패턴 매트릭스들의 3차원 집합 Da(t) 전체로 곱해질 수 있다. It is readily apparent that SBM's expansion to inferential (Equation 9) utilizing a sequential pattern matrix with extended similarity operators. Similar to the vector-based form of inference modeling, the three-dimensional set D a (t) of the learned sequential pattern matrix is a learned sequential pattern matrix a to g and inferred sensors that map to sensor values in the input pattern array X in . It can be understood as an aggregate matrix comprising sequential pattern matrices a to g that map to D out (t). Referring to FIG. 7, Equation 9 is a three-dimensional set of input pattern array X in and learned sequential pattern matrices D in (t) —seven learned sequential pattern matrices a through 5 for
추론 모델링은 데이터가 입력 데이터 스트림에 포함된 센서들의 기준 데이터가 학습된 순차적 패턴 매트릭스들의 3차원 집합 Da(t) 또는 Dout(t)에 포함되기 때문에 이들 센서들의 추정치를 계산할 수 있게 해준다. 개념적으로, 추론 모델은 모델링된 센서들의 차원을 따라서 추론한다. 시간 차원에서 추론하는 추론적 모델을 생성하는 것 또한 가능하다. 이것은 기본 시점의 개념과 수학식 22의 룩-백 윈도우를 다시 돌아봄으로써 이해될 수 있다. 룩-백 윈도우 내 시점들은 기본 시점에 선행하는데, 이것은 이 시점들이 기본 시점에 대해 과거에 놓여 있다는 것을 의미한다. 우리는 기본 시간에 후행하는 시점들로 구축된 룩-어헤드 윈도우를 정의할 수 있다. 룩-어헤드 윈도우 내 시점들은 기본 시간에 대해 미래에 있는 것이다. 기본 시점에 후행하는 소정 개수(nlb)의 시점들과 기본 시점에 후행하는 소정 개수(nla)의 시점들로 구성되는 시점들의 순서화된 시퀀스, 즉, (tp - nlb△t, tp - (nlb -1)△t, . . . , tp - 2△t, tp - △t, tp, tp + △t, tp + 2△t, . . ., tp + (nla-1)△t, tp + nla△t)를 고려해보자. 시점들의 시퀀스는 다음과 같이 룩-백 및 룩-어헤드 데이터를 포함하는 패턴 어레이를 정의한다. Inference modeling allows the estimation of these sensors because the data is included in the three-dimensional set D a (t) or D out (t) of the learned sequential pattern matrices of the reference data of the sensors included in the input data stream. Conceptually, inference models infer along the dimensions of the modeled sensors. It is also possible to create inferential models that deduce from the time dimension. This can be understood by looking back at the concept of the base view and the look-back window of equation (22). The views in the look-back window precede the base view, which means that they are in the past relative to the base view. We can define a look-ahead window built with trailing points in time. Points in the look-ahead window are in the future relative to the base time. An ordered sequence of viewpoints consisting of a predetermined number n lb of trailing points in the base view and a predetermined number n la of trailing points in the base view, that is, (t p -n lb Δt, t p - (n lb -1) △ t,, t p -... 2 △ t, t p -... △ t, t p, t p + △ t, t p + 2 △ t,, t p Consider + (n la -1) Δt, t p + n la Δt). The sequence of viewpoints defines a pattern array containing look-back and look-ahead data as follows.

도 9를 참조하면, 학습된 순차적 패턴 매트릭스의 3차원 집합 Da(t)이 룩-백 및 룩-어헤드 둘 다를 포함하는 순차적 패턴 매트릭스 a 내지 g로 생성된다면 추론을 지원하는 SBM의 추론 형태가 시간 도메인으로 확장된다. 입력 패턴 어레이 Xin는 단지 현재 시점부터의 데이터 및 후행 시점들(미래 시점들부터의 데이터는 아직 존재하지 않음)를 포함하기 때문에, 학습된 순차적 패턴 매트릭스의 집합 Da(t)은 시간 차원을 따라서 분리된 두 서브 매트릭스들로 구성된 집합 매트릭스이다. 이들 서브-매트릭스들 Dlb(t) 중 첫 서브-매트릭스는 여러 기본 시점들로부터 그리고 룩-백 시점들로부터의 데이터를 포함한다. 서브 매트릭스 Dla(t)의 두 번째 서브-매트릭스는 룩-어헤드 시점들로부터의 데이터를 포함한다. 수학식 9는 다섯개의 입력 센서들 및 시점들 tp 내지 -3 사이의 세개의 시간 간격들의 룩-백 윈도우의 입력 패턴 어레이 Xin로 도시된다. 룩-백 부분 또는 서브-매트릭스 Dlb(t)는 다섯 개의 입력 센서들(1-5)로부터의 데이터, 각자 자체의 순차적 패턴 매트릭스 a 내지 g 상의 일곱개의 기본 시점들, 및 각기 순차적 패턴 매트릭스 a 내지 g 상의 네 개의 룩-백 시점들 또는 기준 벡터들 tp 내지 -3을 포함하는 학습된 순차적 패턴 매트릭스들의 3차원 집합이다. 룩-어헤드 부분 또는 서브-매트릭스 Dla(t)는 다섯 입력 센서들(1-5)로부터의 데이터, 각기 자신의 기본 시점을 갖는 일곱 개의 순차적 패턴 매트릭스들 a 내지 g, 및 두 개의 미래 또는 후행하는 시점들 또는 벡터들 +1 및 +2를 포함하는 학습 순차적 패턴 매트릭스들의 3차원 집합이다. 두 세트의 괄호로 묶인 연산들에 의해 생성된 결과 가중 벡터는 학습된 순차적 패턴 매트릭스들의 룩-어헤드 집합 Din(t)으로 곱해져서 시간적으로 추론하는 추정 매트릭스 Yla를 생성한다. 이 예에서, 두 개의 추론된 추정 벡터들 +1 및 +2는 미래에서 하나 및 두 개의 시간 폭 △t에 해당하는 시점들을 표현하는 추정 매트릭스 Yla에 대해 계산된다. 벡터-기반 수학식(도 5)으로 전술한 바와 같이, 가중 벡터는 또한 두 Dla(t) 및 Dlb(t)를 포함하는 기본 벡터 패턴 매트릭스들의 총 집합 Da(t)로 곱해져서 (도 10에 도시된) 과거, 현재 및 미래 시점들의 추정 데이터를 포함하는 추정 매트릭스 XYel 내에 있는 추정 매트릭스들 Xlb 및 Xla를 생성한다. Referring to FIG. 9, if the three-dimensional set D a (t) of the learned sequential pattern matrix is generated as the sequential pattern matrices a to g including both look-back and look-ahead, inference forms of SBM supporting inference Is extended to the time domain. Since the input pattern array X in contains only data from the current time point and trailing time points (data from future time points do not yet exist), the set of learned sequential pattern matrices D a (t) represents the time dimension. Therefore, it is a set matrix composed of two separated sub-matrices. The first sub-matrix of these sub-matrices D lb (t) includes data from several base views and from look-back views. The second sub-matrix of submatrix D la (t) contains data from look-ahead viewpoints. Equation 9 is shown as an input pattern array X in of a look-back window of five input sensors and three time intervals between time points t p to -3. The look-back portion or sub-matrix D lb (t) is the data from the five input sensors 1-5, each of the seven basic viewpoints on its own sequential pattern matrix a to g, and the sequential pattern matrix a, respectively. Three-dimensional set of learned sequential pattern matrices comprising four look-back viewpoints on to g or reference vectors t p to -3. The look-ahead portion or sub-matrix D la (t) is the data from the five input sensors 1-5, seven sequential pattern matrices a to g, each with its own base view, and two future or A three-dimensional set of learning sequential pattern matrices comprising trailing viewpoints or vectors +1 and +2. The resulting weight vector generated by the two sets of parenthesized operations is multiplied by a look-ahead set D in (t) of trained sequential pattern matrices to produce the temporal inference matrix Y la . In this example, two inferred estimation vectors +1 and +2 are computed for the estimation matrix Y la representing the time points corresponding to one and two time widths Δt in the future. As described above with the vector-based equation (FIG. 5), the weight vector is also multiplied by the total set of basic vector pattern matrices D a (t) comprising two D la (t) and D lb (t) ( Generate estimation matrices X lb and X la within the estimation matrix XY el containing estimate data of past, present and future viewpoints (shown in FIG. 10).
도 9 및 도 10에 예시된 것과 도 7 및 도 8에 도시된 것을 비교하면, 네개의 도면 모두의 괄호 내의 매트릭스 계산은 동일하다. 이것은 시간 차원에서 추론하는 추론 모델의 가중 벡터를 계산하는 것이 모델링된 센서들의 차원을 따라서 추론하는 추론 모델의 가중 벡터와 동일하다는 것을 의미한다. 추론 모델링의 두 형태는 학습된 순차적 패턴 매트릭스들의 총 집합에 포함된 데이터만이 다를 뿐이다. 기본 시점들에 비해 미래에 있는 시점의 데이터를 포함하는 모델은 미래에서 추론한다. 입력 데이터 스트림에 있지 않은 센서들의 데이터를 포함하는 모델은 이들센서들내에서 추론한다. 도 11을 참조하면, 시간 및 모델링된 센서 차원 둘 다에서 추론하는 추론 모델이 도시된다. 이 모델의 학습된 순차적 패턴 매트릭스의 3차 집합 Da(t)는 모델링된 센서 및 시간 차원을 따라서 분리된 네 개의 서브-매트릭스들로 구성된 집합 매트릭스이다. 이 서브-매트릭스들은 입력 센서들의 룩-백 윈도의 데이터 Dlb(t), 출력 (추론된) 센서들의 룩-백 윈도우의 데이터 Dlbout(t), 및 출력(추론된) 센서들의 룩-어헤드 윈도우의 데이터 Dlaout(t)를 포함한다. 이를 계산하면 두 입력 및 출력(추론된) 센서들에 대해 (도 10에 도시된) 과거, 현재 및 미래 시점들의 추정 데이터를 포함하는 추정 매트릭스 XYe2 내 추정 매트릭스들 Xlb 및 Xla가 생성된다. Compared to those illustrated in FIGS. 9 and 10 and those shown in FIGS. 7 and 8, the matrix calculations in parentheses in all four figures are the same. This means that calculating the weight vector of the inference model inferring in the time dimension is the same as the weight vector of the inference model infering along the dimension of the modeled sensors. The two forms of inference modeling differ only in the data contained in the total set of learned sequential pattern matrices. A model that includes data from a future point in time compared to the base points is inferred from the future. A model that includes data from sensors that are not in the input data stream is inferred within these sensors. Referring to FIG. 11, an inference model is shown that deduces in both time and modeled sensor dimensions. The cubic set D a (t) of the trained sequential pattern matrix of this model is a set matrix consisting of the modeled sensor and four sub-matrices separated along the time dimension. These sub-matrices are data D lb (t) of the look-back window of the input sensors, data D lbout (t) of the look-back window of the output (inferred) sensors, and look-up of the output (inferred) sensors. Contains the data D laout (t) of the head window. Calculating this yields estimation matrices X lb and X la in estimation matrix XY e2 that include estimate data of past, present and future time points (shown in FIG. 10) for both input and output (inferred) sensors. .
전술한 순차적 패턴 어레이들을 이용하여 각종 형태의 커널 회귀 모델링은 각기 모델 추정 데이터의 추정 매트릭스를 생성한다. 일 예에서, 추정 매트릭스 Xest는 각 입력 패턴 어레이 Xnew (도 6) 마다 형성된다. 전술한 예들로부터 이해되는 바와 같이, 현재 시점에 상응하는 추정 벡터 이외에, 추정 매트릭스는 룩-백 및/또는 룩-어헤드 윈도우들 내 각각의 시점에서 벡터들을 포함한다. 추정 매트릭스 내 순차적 벡터들의 개수는 (자동연상 또는 추론) 모델링 수학식 및 룩-백 윈도우 내 시점들의 개수 nlb 및 룩-어헤드 윈도우 내 시점들의 개수 nla에 달려있다. 시스템 시간이 진행함에 따라, 시간표를 따라 있는 각각의 고정된 시점은 다수의 추정 벡터들이 그 시점에 도달하고, 지나가고, 시점이 과거가 되므로 다수의 추정 벡터를 누적한다. 고정된 순간마다 계산될 추정 벡터들의 총 개수는 순차적 패턴 매트릭스 내의 그리고 모델에 의해 분석된 순차적 패턴들(벡터들)의 총 개수와 같다. 자동연상 모델 또는 센서 차원을 따라서 추론하는 추론 모델의 경우, 이러한 총 개수는 nlb+1로 주어지는데, 이것은 룩-백 윈도우 내 각 패턴에 대한 추정 벡터 및 기본 (현재) 시점에 대한 추정 벡터에 상응한다. 시간 차원을 따라 추론하는 추론 모델의 경우, 이러한 총 개수는 nlb+1+nla로 주어지며, 이것은 룩-백 내 각 패턴의 추정 벡터 및 기본 (현재) 시점의 추정 벡터에 상응한다. Various types of kernel regression modeling using the above-described sequential pattern arrays respectively generate an estimation matrix of model estimation data. In one example, the estimation matrix X est is formed for each input pattern array X new (FIG. 6). As will be appreciated from the above examples, in addition to the estimation vector corresponding to the current view, the estimation matrix includes the vectors at each view in the look-back and / or look-ahead windows. The number of sequential vectors in the estimation matrix depends on the (auto association or inference) modeling equation and the number n lb of views in the look-back window and the number n la of views in the look-ahead window. As the system time progresses, each fixed time point along the timetable accumulates a number of estimated vectors as the number of estimated vectors arrives, passes by, and the point in time is past. The total number of estimated vectors to be calculated at fixed instants is equal to the total number of sequential patterns (vectors) in the sequential pattern matrix and analyzed by the model. For inference models that infer along the auto-association model or sensor dimension, this total number is given by n lb +1, which is based on the estimation vector for each pattern in the look-back window and the estimation vector for the base (current) viewpoint. Corresponds. For inference models inferring along the time dimension, this total number is given by n lb +1 + n la , which corresponds to the estimated vector of each pattern in the look-back and the estimated vector of the base (current) viewpoint.
고정 시점 마다 다수의 추정 벡터들이 계산되기 때문에, 상태 모니터링 또는 진단을 위한 알고리즘을 충족시키는 순차적 커널 회귀 모델을 활용하는 것은 이들 알고리즘들 대부분이 한 시점 당 하나의 단일 추정 벡터만 존재한다는 것을 제외한다는 사실로 인해 복잡해진다. 다수의 추정 벡터들을 다루는 가장 간단한 수단은 간단하게 모델 추정치들의 소스로서 추정 매트릭스 내 모든 다수의 벡터들 보다 적게 단순하게 지정하고 다른 것들은 무시하는 것이다. 일 형태에서, 각각의 추정치 매트릭스로부터의 추정 벡터들 중 단 하나만이 추가적인 진단 분석을 위해 선택된다. 전형적으로, 이것은 다수의 추정 매트릭스들 전체를 보면서 고정된 임의의 시점 ti 에서 선택된 추정 매트릭스 내 추정 벡터가 현재 시점(ti = tcur) 또는 다른 말로 하자면, 가장 최신의 시점 (도 6 내지 도 8의 예시적인 추정 매트릭스에서는 tp)가 될 때 생성된 추정 벡터임을 의미한다. 입력 패턴 윈도우가 과거 ti로 진행하여 ti가 지금의 새로운 시점까지의 룩-백 윈도우의 일부가 되기 때문에, ti에 대해 계산된 새로운 추정 데이터는 무시된다. 다시 말해서, 추정 매트릭스 내 현재 벡터 tp에 비해 오래된 또는 선행 벡터들은 무시된다. Since multiple estimate vectors are computed per fixed time point, utilizing a sequential kernel regression model that satisfies algorithms for state monitoring or diagnostics excludes the fact that most of these algorithms only have one single estimate vector per time point. Is complicated. The simplest means of dealing with multiple estimation vectors is simply to specify less simply than all the multiple vectors in the estimation matrix as a source of model estimates and ignore others. In one form, only one of the estimate vectors from each estimate matrix is selected for further diagnostic analysis. Typically, this means that the estimation vector in the estimation matrix selected at any point in time t i fixed while looking through the entire number of estimation matrices is the current time point (t i = t cur ) or, in other words, the most recent time point (FIGS. In the exemplary estimation matrix of 8, t p ) means the estimated vector generated. Since the input pattern window proceeds past t i and t i becomes part of the look-back window up to the current new point in time, the new estimated data calculated for t i is ignored. In other words, older or preceding vectors are ignored relative to the current vector t p in the estimation matrix.
다수의 벡터들 내 정보의 장점을 취하면서도 다수의 추정 매트릭스 전체의 고정 시간 마다 단일의 추정 벡터를 산출 또는 선택하는 다른 더 많은 복잡한 방법이 사용될 수 있다. 그러한 방법은 이것으로 제한되지 않지만, 평균; 가중 평균; 다른 가중 넘(2-넘 및 p-넘); 최대, 최소 또는 중간 값 등을 포함한다. 진단 분석을 위해 선택된 추정 벡터는 그의 대응하는 입력 벡터와의 최고의 유사도를 갖는 벡터일 수도 있으며, 가중 벡터를 판단하는데 사용되는 것과 유사한 유사도 수학식을 사용할 수 있다. 또한 이들 방법은 다수의 추정 매트릭스들 전반의 단일의 고정된 시점이라기 보다는 추정 매트릭스 내 다수의 순차적 시점들을 표현하는 각각의 추정 매트릭스에 대해 단일의 추정 벡터를 제공하도록 적용될 수 있다. Other more complex methods may be used that take advantage of information in multiple vectors while still calculating or selecting a single estimate vector for every fixed time across multiple estimate matrices. Such methods are not limited to this, but mean; Weighted average; Other weighted over (2-over and p-over); Maximum, minimum, or median values. The estimated vector selected for diagnostic analysis may be the vector with the highest similarity with its corresponding input vector, and similarity equations similar to those used to determine the weight vector may be used. These methods can also be applied to provide a single estimate vector for each estimate matrix representing multiple sequential views in the estimate matrix, rather than a single fixed point of view across the multiple estimate matrices.
시간 차원에서 추론하는 추론 모델의 경우, 예측 모델은 자산의 잔여 유효 수명의 계산과 같이 예측 알고리즘을 만족시키기 위해 (또는 달리 말해서, 모니터링되는 객체의 미래 상태 또는 동작 상태를 판단하기 위해) 미래의 추정 매트릭스 Xla를 사용할 수 있다. 이것은 모델링된 센서의 추론된 추정치들의 시퀀스가 모델링된 센서의 미래 행위를 예측하는 추세선(trend-line)이라는 사실에 기반한다. 시스템 시간이 진행되고 새로운 기본 벡터들을 포함하는 새로운 입력 패턴 어레이가 구성됨에 따라 새로운 미래 추정 매트릭스들이 계산된다. 전술한 다른 커널 회귀 모델들과 마찬가지로, 새로운 추정 매트릭스들은 실질적으로 이전의 매트릭스들과 겹치는데, 이것은 다수의 추정 값들이 각 시점에서 각 센서마다 산출된다는 것을 의미한다. In the case of inferential models that deduce from the time dimension, the predictive model is a prediction of the future to satisfy the prediction algorithm (or, in other words, determine the future or operational state of the monitored object), such as the calculation of the remaining useful life of the asset. Matrix X la can be used. This is based on the fact that the sequence of inferred estimates of the modeled sensor is a trend-line that predicts the future behavior of the modeled sensor. New future estimation matrices are calculated as the system time progresses and a new input pattern array is constructed that includes the new fundamental vectors. As with the other kernel regression models described above, the new estimation matrices substantially overlap with the previous matrices, which means that multiple estimates are calculated for each sensor at each time point.
또한 다른 커널 회귀 모델들과도 유사하게, 추론 시간 추론 모델은 고정된 시점에서 계산된 다수의 추정 값들을 센서의 추세에 적합한 하나의 단일 값으로 줄이기 위해 고안된 여러 방법을 사용할 수 있다. 가장 간단한 방법은 룩-어헤드 윈도우 내 각각의 시점들에서 추정 데이터를 공급하는 가장 최근에 계산된 추정 매트릭스를 선택하는 것이다. 상세히 말해서, 미래에까지 고정된 시점 ti의 경우, 추정 벡터는 룩-어헤드 패턴 윈도우가 이 시점에 처음 도달할 때, 즉, ti = tcur + nla*△t 생성될 것이다. 각각의 후행 시간 단계에서, 룩-어헤드 윈도우가 고정된 시점을 통과함에 따라, 새로운 추정 벡터는 그 시점 마다 계산되고, 마지막 벡터를 대체한다. 그래서, 모든 추정 벡터들은 모두 추세선을 구축하는데 사용되며, 추정 벡터들로 표현된 매 시점(고정 시점) 마다의 결과는 이들 결과들이 추정 매트릭스들을 구축하는데 사용된 룩-어헤드 윈도우를 통과함에 따라 벡터들에 대응하는 더 최근의 추정 값들로 거듭 갱신되어진다. Also similar to other kernel regression models, the inference time inference model can use a number of methods designed to reduce multiple estimates calculated at fixed points to a single value that is appropriate for the trend of the sensor. The simplest method is to select the most recently calculated estimation matrix that supplies the estimation data at the respective points in the look-ahead window. Specifically, for a fixed time point t i until the future, the estimated vector will be generated when the look-ahead pattern window first reaches this point, i.e., t i = t cur + n la * Δt. In each trailing time step, as the look-ahead window passes through a fixed point in time, a new estimate vector is calculated for that point in time and replaces the last vector. Thus, all the estimation vectors are all used to build the trend line, and the results for each time point (fixed time point) expressed in the estimation vectors are passed through the look-ahead window used to build the estimation matrices. Are updated with more recent estimates corresponding to the same.
간단하다는 것 이외에, 이러한 접근법은 가장 최근에 계산된 추정 매트릭스만이 사용되기 때문에 동적인 변화에 신속하게 반응하는 센서 추세를 생성한다. 추세선에 놓인 추정 데이터는 각각의 후행 시간 단계마다 대체되기 때문에, 추세는 랜덤한 변동에 민감하다. 이것은 고정된 시점에서의 추세 값은 후속하는 시간 단계들 사이에서 극적으로 변할 수 있다는 것을 의미한다. 평균, 가중 평균, 또는 다른 가중 넘(weighted norms)과 같은 다른 많은 복잡한 방법들은 다수의 추정 매트릭스들 전체의 고정된 시점에서 계산된 추정 값들 중 둘 이상, 또는 모두를 활용하여 그 시점에 대해 단일의 추정 값을 산출한다. 이러한 방법들에 의해 산출된 추세선은 더 스무드하지만, 급격한 동적인 변동에는 미약하게 반응한다. 예상된 시스템 행위를 나타내는 추세선을 생성하도록 설계된 전술한 방법들 이외에, 가능한 행위의 범위를 나타내는 다른 추세선들이 산출될 수 있다. 예를 들면, 최소 추정 값들을 연결하는 추세선과 결합된 각각의 미래 시점에서의 최대 추정 값들을 연결하는 추세선은 모델에 의해 생성된 결과를 구속한다. In addition to being simple, this approach generates sensor trends that respond quickly to dynamic changes because only the most recently calculated estimation matrix is used. Since the estimated data placed on the trend line is replaced at each trailing time step, the trend is sensitive to random variations. This means that the trend value at a fixed point in time can vary dramatically between subsequent time steps. Many other complex methods, such as mean, weighted average, or other weighted norms, utilize a single or more of the estimated values calculated at a fixed point in time across multiple estimate matrices, or both. Calculate the estimated value. The trendline produced by these methods is smoother but weakly responds to rapid dynamic fluctuations. In addition to the methods described above, which are designed to generate trendlines indicative of expected system behavior, other trendlines indicative of the range of possible behaviors can be calculated. For example, a trend line connecting the maximum estimated values at each future time point combined with a trend line connecting the minimum estimated values constrains the results produced by the model.
다시 도 1을 참조하면, 전술한 바와 같이, 전체 추정 매트릭스 Xest 또는 단일의 대표적인 추정 벡터는 차분 엔진(20)에 전달된다. 차분 엔진은 추정 매트릭스를 입력 패턴 어레이 (Xin 또는 Xnew)에서 감해지거나 또는 대표적이 추정 벡터를 현재 시점의 입력 벡터에서 감해진다. 상세히 말해서, 추정 매트릭스로부터 각기 선택된 추정 값은 입력 패턴 어레이로부터 대응하는 입력값으로부터 감해진다. 그런 다음 나머지 벡터들 또는 단일의 대표적인 잔여 벡터들의 어레이는 경보 모듈(22)에 제공된다. 경보 모듈(22)은 통계적 테스트를 잔여 데이터에 적용하여 추정 및 입력 데이터가 통계적으로 다른지를 판단한다. 경보 모듈(22)은 결함 판단을 위해 각종 테스트 중 어느 테스르를 수행한다. 이것은 하나 이상의 잔여 값들을 이용하여 룰 로직을 평가하기 위한 룰 엔진을 포함할 수 있다. 룰은 간단한 일변량(univariate)의 임계 측정치부터 다변량(multivariate) 및/또는 시계열 로직까지 각종의 통상적으로 사용된 룰 중 어느 룰일 수 있다. 더욱이, 일부 룰의 출력은, 예를 들어, 간단한 임계 룰이 윈도우형 경보 카운팅 룰(예를 들어, y 관측치에서 x 임계치 경보)에 넣어질 때처럼 다른 룰로의 입력일 수 있다. 더욱이, 이들 자체가 룰에 입력될 수 있는 다른 측정치 및 신호들을 유도하기 위해 잔여 데이터에 대해 통계적 기술이 사용될 수 있다. 적용가능한 통계적 분석은 이것으로 제한하지 않지만, 이동 윈도우 통계(평균, 중간, 표준편차, 최대, 최소, 왜도(skewness), 첨도(kurtosis) 등), 통계적 가설 테스트(예를 들면, 순차 확률비 테스트(sequential probability ratio test(SPRT)), 추세화(trending), 및 통계 프로세스 제어(예를 들면, CUSUM, S-chart))를 포함하는 본 기술에서 공지된 매우 다양한 기술로부터 선택될 수 있다.Referring back to FIG. 1, as described above, the entire estimation matrix X est or a single representative estimation vector is passed to the
경보 모듈(22)은 추정과 입력 데이터 간의 어떤 차이가 훈련 중에 조우되지 않는 정상적 동작 상태 때문이라고 판단할 수 있다. 이러한 경우, 새로운 동작 상태를 나타내는 센서 데이터는 옵션의 적응 모듈(30)에 제공되고, 이 모듈은 그 데이터를 예를 들어, 라이브러리(18)를 통해 모델(14)의 학습에 포함시킨다. 또한, 적응 모듈(30)은 옵션으로 그 자체의 자동화된 테스트를 데이터 및/또는 잔여 분석 결과에 대해 수행하여 어느 입력 벡터 또는 입력 어레이가 모듈(14)을 갱신하는데 사용되어야 하는지를 판단한다. The
모델을 적응하는 프로세스는 새로운 동작 상태를 나타내는 센서 데이터를 원(original) 커널-기반 모델이 훈련받았던 라이브러리 H 내 기준 데이터의 세트에 추가하는 단계를 포함한다. 가장 간단한 실시예에서, 모든 기준 데dl터는 모델 표본으로서 사용되며, 그러므로 모델 평균을 적응하는 것은 새로운 센서 데이터를 모델의 표본 세트에 추가하는 것이다. 순차적 커널 회귀 모델은 설계에 따라 관측 벡터들의 시퀀스에서 동작하기 때문에, 기준 데이터에 추가된 새로운 동작 데이터는 관측 벡터들의 시퀀스로 이루어져야만 한다. 어떠한 적응 이벤트 동안 추가된 벡터의 최소 개수는 모델에 의해 분석된 순차적 패턴들(벡터들)의 총 개수와 같다. 전술한 바와 같이, 이러한 총 개수는 센서 차원을 따라서 추론하는 자동연상 모델 또는 추론 모델의 경우에는 nlb+1로 제시되거나 또는 시간 차원을 따라서 추론하는 추론 모델의 경우에는 nlb+1+nla로 제시된다. 만일 훈련 방법이 상기 기술된 바와 같이 기본 벡터 패턴 매트릭스들의 3차원 집합 D(t)을 구성하기 위한 시스템 동력학을 "대표하는"것으로서 저장된 서브세트에 대한 기준 관측치를 다운-선택하는데 사용되었다면, 관측 벡터들(또는 다른 말로 전체 입력 패턴 어레이)의 새로운 시퀀스는 원래 기준 데이터 세트에 추가되며, 다운-선택 기술은 새로운 관측의 표현을 포함하여야 하는 새로운 대표적 표본 세트를 유도하는데 적용된다. 다운-선택 기술을 반환하지 않고도, 새로운 시퀀스를 다운-선택된 학습 패턴 어레이의 다운-선택된 세트에 단순하게 추가하는 것 또한 가능하다. 더욱이, 그 경우에 있어서, 일부의 학습 패턴 어레이들이 새로운 데이터에 의해 효과적으로 대체되도록 이들을 모델로부터 제외하는 것 또한 유용할 수 있으며, 모델은 관리가능한 크기로 유지된다. 오래된 학습 패턴 어레이들이 제거되는 기준은 새로운 기본 시점들에서의 관측치를 오래된 기본 시점들에서의 관측치들과 비교하고 새로운 순차적 패턴 어레이들과 가장 유사한 순차적 패턴 어레이들을 교체하는 전술한 수학식들을 이용하는 군집 및 유사도 판단을 포함할 수 있다. The process of adapting the model includes adding sensor data indicative of the new operating state to the set of reference data in library H from which the original kernel-based model was trained. In the simplest embodiment, all reference data is used as a model sample, so adapting the model mean is adding new sensor data to the sample set of the model. Since the sequential kernel regression model operates on a sequence of observation vectors according to design, new motion data added to the reference data must consist of a sequence of observation vectors. The minimum number of vectors added during any adaptation event is equal to the total number of sequential patterns (vectors) analyzed by the model. As noted above, this total number is given as n lb +1 for auto- association models or inference models that infer along the sensor dimension, or n lb + 1 + n la for inference models that infer along the time dimension. Is presented. If the training method was used to down-select the reference observations for the stored subset as "representing" the system dynamics for constructing the three-dimensional set D (t) of the base vector pattern matrices as described above, the observation vector The new sequence of fields (or in other words the entire input pattern array) is added to the original reference data set, and the down-selection technique is applied to derive a new representative sample set that should include a representation of the new observation. It is also possible to simply add a new sequence to the down-selected set of down-selected learning pattern arrays without returning the down-selection technique. Moreover, in that case, it may also be useful to exclude some of the learning pattern arrays from the model so that they are effectively replaced by new data, and the model is maintained in manageable size. The criteria by which the old learning pattern arrays are removed is based on a cluster using the above-described equations for comparing observations at the new base views with observations at the old base views and replacing the sequential pattern arrays most similar to the new sequential pattern arrays. Similarity judgment may be included.
이 점에서, 본 발명은 정상 동작의 기간으로부터의 대표적인 데이터를 이용하여 훈련된 순차적 커널 회귀 모델을 기술한다. 그러한 모델은 시스템 결함을 검출하고 진단하는데 사용될 수 있다. 또한, 본 발명의 시간-추론적 형태는 시스템 행위를 미래에서 추론할 수 있는 모델을 생성한다. 그러나, 모델은 정상적 동작 데이터로만 훈련되기 때문에, 결함이 진행함에 따라 이들의 활용은 시스템 행위가 더 정상에서 더 많이 벗어남에 따라 제한된다. In this regard, the present invention describes a sequential kernel regression model trained using representative data from periods of normal operation. Such a model can be used to detect and diagnose system faults. In addition, the time-inferential form of the present invention creates a model from which system behavior can be inferred in the future. However, since the models are trained only with normal behavioral data, their use is limited as the fault progresses as system behavior deviates more from normal.
결함을 발생하는 동안 진단과 예측을 개선하기 위하여, 결함 상태 동안 수집된 데이터(또는 결함 모드 참조 데이터)를 이용하여 훈련된 별개의 순차적 커널 회귀 모델이 활용될 수 있다. 이러한 결함 모델들은 결함이 시스템에서 결함이 발생되고 있음을 표시한 이후에만 작동된다. 결함 표시는 정상 시스템 데이터를 이용하여 또는 다수의 다른 수단에 의해 훈련된 순차적 모델들, 즉 이것으로 제한되지 않지만, 벡터-기반 커널 회귀 모델(예를 들면, SBM), 신경 회로망, k-평균 군집 모델, 및 룰-기반 결함 검출 모델에 의해 제공될 수 있다. 결함 모델들은 모니터되고 있는 자산의 알고 있는 결함 이벤트의 총체적 이력을 이용하여 훈련된다. 이들 결함 이벤트는 실제 자산에 대해 초기의 기간부터 발생할 필요가 없고, 모니터링되는 자산에 실질적으로 대등한 다른 기계류에서 발생한 결함 이벤트로부터 유래할 수 있다. 결함 히스토리 이력은 그 결함이 시스템 결함 또는 시스템 셧다운과 같이 이벤트의 최종단 상태까지 처음 표시되었던 시간부터 수집된 모든 시스템 데이터로 이루어진다. In order to improve diagnosis and prediction during fault generation, a separate sequential kernel regression model trained using data collected during fault conditions (or fault mode reference data) may be utilized. These fault models only work after the fault indicates that a fault is occurring in the system. Defect indication is not limited to sequential models trained using normal system data or by a number of other means, ie, but not limited to, vector-based kernel regression models (e.g., SBM), neural networks, k-means clusters. Model, and rule-based defect detection model. Defect models are trained using the aggregate history of known defect events of the asset being monitored. These fault events do not need to occur from an initial period for the actual asset, and may originate from fault events that occur in other machinery substantially comparable to the monitored asset. The fault history history consists of all system data collected from the time the fault was first marked up to the last state of the event, such as a system fault or system shutdown.
본 기술에서 통상의 지식을 가진 자라면 전술한 실시예들에 대한 변형은 다양한 양태로 이루어질 수 있다는 것이 인식될 것이다. 다른 변경도 또한 만들어질 것이며 본 발명의 범주와 정신 내에 있다. 본 발명은 첨부의 청구범위에서 자세하게 설명된다. 본 발명의 정신과 범주는 본 기술에서 통상의 지식을 갖고 본 출원의 가르침에 정통한 자들에게 자명해지는 것처럼 본 명세서에서 실시예들에 대한 그러한 변형 및 변경을 망라하는 것으로 간주된다.Those skilled in the art will recognize that modifications to the above-described embodiments may be made in various aspects. Other changes will also be made and are within the scope and spirit of the invention. The invention is described in detail in the appended claims. The spirit and scope of the present invention is considered to encompass such modifications and variations of the embodiments herein as will become apparent to those skilled in the art and familiar with the teachings of the present application.
Claims (21)
상기 객체의 정상 동작 상태(normal operational state)를 나타내는 기준 데이터를 수신하고,
입력 패턴 어레이들을 수신하고 ― 각각의 입력 패턴 어레이는 다수의 입력 벡터들을 갖고, 각각의 입력 벡터는 시점(a time point)을 표현하고 상기 객체의 현재 상태(current condition)를 나타내는 다수의 파라미터들을 표현하는 입력 값들(input values)을 가짐 ―,
입력 패턴 어레이 및 상기 기준 데이터를 사용하여 상기 입력 값들과 기준 데이터 간의 유사도 척도를 판단하는 계산에 따라 추정 값들(estimate values)을 생성하되, 상기 추정 값들은 추론된 추정 값들의 적어도 하나의 추정 벡터를 포함하는 추정 매트릭스(an estimate matrix)의 형태로 되어 있고, 각각의 추정 매트릭스는 상기 입력 벡터들에 의해 표현되지 않은 적어도 하나의 시점을 표현하도록 구성된 실증적 모델 모듈(empirical model module)과,
상기 추론된 값들을 사용하여 상기 객체의 미래 상태를 판단하도록 구성된 예측 모듈(a prognostic module)을 포함하는
모니터링 시스템.
Monitoring system to determine the future operation status of the object,
Receive reference data indicative of a normal operational state of the object,
Receive input pattern arrays—each input pattern array having a plurality of input vectors, each input vector representing a time point and representing a plurality of parameters indicative of a current condition of the object; Has input values,
Estimate values are generated according to a calculation that determines a similarity measure between the input values and the reference data using an input pattern array and the reference data, wherein the estimate values comprise at least one estimate vector of the inferred estimate values. An empirical model module in the form of an estimate matrix, wherein each estimate matrix is configured to represent at least one viewpoint not represented by the input vectors;
A prognostic module configured to determine a future state of the object using the inferred values;
Monitoring system.
상기 추정 매트릭스들은 상기 입력 벡터들에 의해 표현되지 않은 시점들을 표현하는 추정 벡터들을 포함할 뿐인
모니터링 시스템.
The method according to claim 1,
The estimation matrices only include estimation vectors that represent viewpoints not represented by the input vectors.
Monitoring system.
상기 추정 매트릭스들은 상기 입력 벡터들에 의해 표현된 동일 시점을 나타내는 적어도 하나의 추정 벡터 및 상기 입력 벡터들에 의해 표현되지 않는 시점을 나타내는 적어도 하나의 추정 벡터를 포함하는
모니터링 시스템.
The method according to claim 1,
The estimation matrices include at least one estimation vector representing the same view represented by the input vectors and at least one estimation vector representing a view not represented by the input vectors.
Monitoring system.
상기 추정 매트릭스들은 상기 객체의 상태를 나타내는 그리고 상기 입력 값들에 의해 표현되지 않는 파라미터들을 표현하는 추정 값들을 포함하는
모니터링 시스템.
The method according to claim 1,
The estimation matrices include estimated values representing the state of the object and representing parameters not represented by the input values.
Monitoring system.
각각의 추정 매트릭스는 기본 현재 시점 및 상기 입력 벡터들에 의해 표현되지 않은 그리고 상기 현재 시점에 비해 후행하는 시점들인 시점들을 나타내는
모니터링 시스템.The method according to claim 1,
Each estimation matrix represents viewpoints that are not represented by a base current view and the input vectors and that are later views than the current view.
Monitoring system.
상기 실증적 모듈은 상기 유사도 척도를 이용함으로써 가중 값들을 생성하도록 구성되며, 상기 가중 값들을 상기 기준 데이터를 이용하여 계산하는데 사용하여 상기 추정 매트릭스를 생성하는
모니터링 시스템.
The method according to claim 1,
The empirical module is configured to generate weighting values by using the similarity measure, and uses the weighting values to calculate using the reference data to generate the estimation matrix.
Monitoring system.
상기 가중치 값들은 가중 벡터의 형태로 되어 있는
모니터링 시스템.
The method according to claim 6,
The weight values are in the form of a weight vector
Monitoring system.
가중 값들을 이용한 계산에서 사용된 상기 기준 데이터는 상기 입력 패턴 어레이들에 의해 표현되지 않는 시점들을 표현하는 기준 값들을 포함하는
모니터링 시스템.
The method according to claim 6,
The reference data used in the calculation using weighted values includes reference values representing time points not represented by the input pattern arrays.
Monitoring system.
상기 가중 값들을 이용한 계산에서 사용된 상기 기준 데이터는 기본 현재 시점을 나타내며, 상기 입력 벡터들에 의해 표현되지 않는 시점들은 상기 현재 시점에 비해 후행하는 시점들인
모니터링 시스템.
The method of claim 8,
The reference data used in the calculation using the weighted values represents a basic current view, and the views not represented by the input vectors are views that are later than the current view.
Monitoring system.
상기 가중 값들을 이용한 계산에서 사용된 상기 기준 데이터는 학습된 순차적 패턴 매트릭스들의 3차원 집합의 형태로 되어 있고, 각각의 학습된 학습된 패턴 매트릭스는 기준 값들의 기준 벡터들을 포함하며, 각각의 기준 벡터는 학습된 순차적 패턴 매트릭스 내 상이한 시점을 나타내는
모니터링 시스템.
The method according to claim 6,
The reference data used in the calculation using the weighted values is in the form of a three-dimensional set of learned sequential pattern matrices, each learned learned pattern matrix including reference vectors of reference values, each reference vector Represents different viewpoints in the learned sequential pattern matrix
Monitoring system.
각각의 학습된 순차적 패턴 매트릭스는 기본의 현재 시점 및 상기 기본의 현재 시점에 비해 후행하는 시점들을 표현하고 그리고 상기 입력 패턴 어레이들에 의해 표현되지 않는 시점들을 포함하는
모니터링 시스템.
11. The method of claim 10,
Each learned sequential pattern matrix represents a base current view and views that are trailing relative to the base current view and include views that are not represented by the input pattern arrays.
Monitoring system.
상기 동일 시점은 다수의 추정 매트릭스들로 표현되는
모니터링 시스템.
The method according to claim 1,
The same time point is represented by a plurality of estimation matrices.
Monitoring system.
상기 예측 모듈은 가장 최신의 추정 매트릭스를 사용하여 상기 객체의 상태를 판단하는데 사용하기 위한 상기 추정 값들을 갱신하도록 구성되는
모니터링 시스템.
The method according to claim 1,
The prediction module is configured to update the estimates for use in determining the state of the object using the most recent estimate matrix.
Monitoring system.
상기 예측 모듈은 단일의 추정 벡터에 대한 값들을 제공하여 다수의 추정 매트릭스들 전반에서 단일의 시점을 표현하도록 구성된
모니터링 시스템.
The method according to claim 1,
The prediction module is configured to provide values for a single estimation vector to represent a single viewpoint across multiple estimation matrices.
Monitoring system.
상기 단일의 추정 벡터는 상기 단일 시점에서 상기 추정 벡터들 모두의 평균, 가중 평균, 또는 가중 넘(weighted norm)인
모니터링 시스템.
15. The method of claim 14,
The single estimate vector is the mean, weighted average, or weighted norm of all of the estimate vectors at the single time point.
Monitoring system.
상기 예측 모듈은 단일의 추정 벡터에 대한 값들을 제공하여 각각의 추정 매트릭스를 표현하도록 구성된
모니터링 시스템.
The method according to claim 1,
The prediction module is configured to provide values for a single estimate vector to represent each estimate matrix.
Monitoring system.
상기 단일의 추정 벡터는 상기 추정 매트릭스 내 상기 추정 벡터들의 평균, 가중 평균, 또는 가중 넘인
모니터링 시스템.
17. The method of claim 16,
The single estimate vector is the mean, weighted average, or weighted over of the estimate vectors in the estimate matrix.
Monitoring system.
상기 예측 모듈은 상기 추론된 추정 값들로 표현된 적어도 하나의 파라미터에 대한 추세선을 형성하여 상기 객체의 예상된 행위를 표시하도록 구성된
모니터링 시스템.
The method according to claim 1,
The prediction module is configured to form a trend line for at least one parameter represented by the inferred estimates to indicate the expected behavior of the object.
Monitoring system.
상기 예측 모듈은 각각의 새로운 추정 매트릭스를 이용하여 새로운 추세선을 형성하도록 구성된
모니터링 시스템.
19. The method of claim 18,
The prediction module is configured to form a new trendline using each new estimation matrix.
Monitoring system.
상기 예측 모듈은 경계 추세선을 형성하여 상기 객체의 예상된 행위의 범위를 정의하도록 구성된
모니터링 시스템.
19. The method of claim 18,
The prediction module is configured to form a boundary trend line to define a range of expected behavior of the object.
Monitoring system.
상기 예측 모듈은 상기 시점들로부터 최대 추정 값들을 갖는 상위 경계 추세선, 및 상기 시점들로부터 최소 추정 값들을 갖는 하위 경계 추세선을 형성하도록 구성된
모니터링 시스템.20. The method of claim 19,
The prediction module is configured to form an upper boundary trend line having maximum estimate values from the viewpoints, and a lower boundary trend line having minimum estimate values from the viewpoints.
Monitoring system.
Applications Claiming Priority (3)
| Application Number | Priority Date | Filing Date | Title |
|---|---|---|---|
| US13/186,153 US9250625B2 (en) | 2011-07-19 | 2011-07-19 | System of sequential kernel regression modeling for forecasting and prognostics |
| US13/186,153 | 2011-07-19 | ||
| PCT/US2012/045901 WO2013012584A1 (en) | 2011-07-19 | 2012-07-09 | System of sequential kernel regression modeling for forecasting and prognostics |
Publications (1)
| Publication Number | Publication Date |
|---|---|
| KR20140043439A true KR20140043439A (en) | 2014-04-09 |
Family
ID=46640100
Family Applications (1)
| Application Number | Title | Priority Date | Filing Date |
|---|---|---|---|
| KR1020147001392A KR20140043439A (en) | 2011-07-19 | 2012-07-09 | System of sequential kernel regression modeling for forecasting and prognostics |
Country Status (8)
| Country | Link |
|---|---|
| US (2) | US9250625B2 (en) |
| JP (1) | JP2014525097A (en) |
| KR (1) | KR20140043439A (en) |
| CN (1) | CN103842923B (en) |
| AU (1) | AU2012284460B2 (en) |
| BR (1) | BR112014001230A2 (en) |
| CA (1) | CA2841442A1 (en) |
| WO (1) | WO2013012584A1 (en) |
Families Citing this family (22)
| Publication number | Priority date | Publication date | Assignee | Title |
|---|---|---|---|---|
| AU2006325153B2 (en) * | 2005-11-29 | 2013-03-28 | PhysIQ Inc. | Residual-based monitoring of human health |
| US9256224B2 (en) | 2011-07-19 | 2016-02-09 | GE Intelligent Platforms, Inc | Method of sequential kernel regression modeling for forecasting and prognostics |
| EP2746942A4 (en) * | 2011-08-15 | 2015-09-30 | Nec Corp | Distributed processing management device and distributed processing management method |
| US20140188772A1 (en) * | 2012-12-27 | 2014-07-03 | General Electric Company | Computer-implemented methods and systems for detecting a change in state of a physical asset |
| WO2014178877A1 (en) * | 2013-05-03 | 2014-11-06 | Ge Intelligent Platforms, Inc. | Method for using posterior information to improve forecast capabilities of sequential kernel regression models |
| US10318552B2 (en) | 2014-05-15 | 2019-06-11 | International Business Machines Corporation | Probability mapping model for location of natural resources |
| US9681270B2 (en) * | 2014-06-20 | 2017-06-13 | Opentv, Inc. | Device localization based on a learning model |
| AU2015315838A1 (en) * | 2014-09-12 | 2017-03-30 | Ge Intelligent Platforms, Inc. | Apparatus and method for ensembles of kernel regression models |
| JP6193287B2 (en) * | 2015-03-30 | 2017-09-06 | 有限責任監査法人トーマツ | Anomaly detection device, anomaly detection method, and network anomaly detection system |
| JP6574527B2 (en) * | 2016-09-06 | 2019-09-11 | 日本電信電話株式会社 | Time-series data feature extraction device, time-series data feature extraction method, and time-series data feature extraction program |
| US10452510B2 (en) * | 2017-10-25 | 2019-10-22 | Oracle International Corporation | Hybrid clustering-partitioning techniques that optimizes accuracy and compute cost for prognostic surveillance of sensor data |
| EP3729340A4 (en) * | 2017-12-18 | 2021-12-29 | Mythic, Inc. | Systems and methods for mapping matrix calculations to a matrix multiply accelerator |
| US10826932B2 (en) | 2018-08-22 | 2020-11-03 | General Electric Company | Situation awareness and dynamic ensemble forecasting of abnormal behavior in cyber-physical system |
| KR20200036085A (en) * | 2018-09-19 | 2020-04-07 | 엘지전자 주식회사 | Artificial intelligence device |
| US11262272B2 (en) * | 2018-10-10 | 2022-03-01 | Palo Alto Research Center Incorporated | Adaptive remaining useful life estimation method using constraint convex regression from degradation measurement |
| TWI690440B (en) * | 2018-10-17 | 2020-04-11 | 財團法人車輛研究測試中心 | Intelligent driving method for passing intersections based on support vector machine and intelligent driving system thereof |
| US10853694B2 (en) * | 2018-12-04 | 2020-12-01 | Apical Ltd. | Processing input data in a convolutional neural network |
| US11573561B2 (en) | 2018-12-11 | 2023-02-07 | General Electric Company | Methods and systems for automated condition-based maintenance of mechanical systems |
| US20230028886A1 (en) * | 2019-11-20 | 2023-01-26 | University Of Tennessee Research Foundation | Methods of detecting anomalous operation of industrial systems and respective control systems, and related systems and articles of manufacture |
| WO2023049811A1 (en) * | 2021-09-24 | 2023-03-30 | Intelligentdx Llc | Systems and methods for vision diagnostics |
| FR3131786A1 (en) * | 2022-01-13 | 2023-07-14 | Psa Automobiles Sa | Processing of an object based on a comparison, by vector representation, with a reference object |
| CN115499289B (en) * | 2022-08-17 | 2023-08-25 | 华电电力科学研究院有限公司 | Equipment state evaluation early warning method and system |
Family Cites Families (267)
| Publication number | Priority date | Publication date | Assignee | Title |
|---|---|---|---|---|
| US3651454A (en) | 1969-12-15 | 1972-03-21 | Borg Warner | Automotive multiplex system |
| US3851157A (en) | 1973-07-09 | 1974-11-26 | United Aircraft Corp | Self-correcting feedback control system |
| US3906437A (en) | 1973-09-07 | 1975-09-16 | Textron Inc | Device for monitoring the operating parameters of a dynamic system |
| US3866166A (en) | 1974-04-09 | 1975-02-11 | Gen Motors Corp | Digital multigage for motor vehicle |
| US3992884A (en) | 1975-01-03 | 1976-11-23 | Fives-Cail Babcock | Thermal power plant |
| US4067061A (en) | 1975-03-18 | 1978-01-03 | Rockwell International Corporation | Monitoring and recording system for vehicles |
| US4060716A (en) | 1975-05-19 | 1977-11-29 | Rockwell International Corporation | Method and apparatus for automatic abnormal events monitor in operating plants |
| US4080654A (en) | 1976-03-25 | 1978-03-21 | General Signal Corporation | Vehicle performance monitor |
| US4071898A (en) | 1976-06-14 | 1978-01-31 | Sun Shipbuilding & Dry Dock Company | Ship performance analyzer |
| US4057847A (en) | 1976-06-14 | 1977-11-08 | Sperry Rand Corporation | Remote controlled test interface unit |
| US4212064A (en) | 1977-04-05 | 1980-07-08 | Simmonds Precision Products, Inc. | Performance advisory system |
| DE2824190A1 (en) | 1978-06-02 | 1979-12-06 | Bosch Gmbh Robert | MICRO COMPUTER SYSTEM FOR THE CONTROL OF OPERATING PROCEDURES IN MOTOR VEHICLES, WITH A DIAGNOSTIC DEVICE FOR CHECKING THE VEHICLE |
| JPS5511418A (en) | 1978-07-07 | 1980-01-26 | Hitachi Ltd | Test operating apparatus of elevator |
| US4296409A (en) | 1979-03-12 | 1981-10-20 | Dickey-John Corporation | Combine performance monitor |
| USRE31582E (en) | 1979-03-23 | 1984-05-08 | Nissan Motor Company, Limited | Automatic control system for method and apparatus for checking devices of an automotive vehicle in use with a microcomputer |
| US4295128A (en) | 1979-03-26 | 1981-10-13 | University Of Tennessee Research Corp. | Apparatus for measuring the degradation of a sensor time constant |
| US4271402A (en) | 1979-08-29 | 1981-06-02 | General Motors Corporation | Motor vehicle diagnostic and monitoring device having keep alive memory |
| US4334136A (en) | 1979-10-01 | 1982-06-08 | Douglas P. Mahan | Microwave treating mechanism |
| JPS5695738A (en) | 1979-12-26 | 1981-08-03 | Nippon Denso Co Ltd | Method and apparatus for indicating and disposing of abnormal condition |
| US4521885A (en) | 1983-01-05 | 1985-06-04 | Towmotor Corporation | Diagnostic display apparatus |
| JPS59213548A (en) | 1983-05-17 | 1984-12-03 | Nissan Motor Co Ltd | Trouble diagnostic device of control system for vehicle |
| US4677429A (en) | 1983-12-01 | 1987-06-30 | Navistar International Transportation Corp. | Vehicle information on-board processor |
| JPS6136785U (en) | 1984-08-09 | 1986-03-07 | 史朗 金尾 | Synthetic resin underground pipe |
| JPH0447152Y2 (en) | 1985-03-27 | 1992-11-06 | ||
| US4978291A (en) | 1985-11-12 | 1990-12-18 | Nakai Gary T | Method of regulating the fuel-air mixture in a burner |
| DE3672311D1 (en) | 1985-12-12 | 1990-08-02 | Bayerische Motoren Werke Ag | METHOD FOR DETERMINING OPERATING CONDITIONS OF A MOTOR VEHICLE. |
| JPS63131847A (en) | 1986-04-28 | 1988-06-03 | Mitsubishi Electric Corp | Control device for car |
| JPS6390629A (en) | 1986-10-03 | 1988-04-21 | Sanshin Ind Co Ltd | Trouble alarm system for internal combustion engine |
| JPS63133201A (en) | 1986-11-25 | 1988-06-06 | Mitsubishi Electric Corp | Vehicle controller |
| US5005142A (en) | 1987-01-30 | 1991-04-02 | Westinghouse Electric Corp. | Smart sensor system for diagnostic monitoring |
| US4953085A (en) | 1987-04-15 | 1990-08-28 | Proprietary Financial Products, Inc. | System for the operation of a financial account |
| DE3816930A1 (en) | 1988-05-11 | 1989-11-23 | Heribert Hiendl | REVERSIBLE CONCRETE STEEL |
| US4924418A (en) | 1988-02-10 | 1990-05-08 | Dickey-John Corporation | Universal monitor |
| JPH0718779B2 (en) | 1988-02-16 | 1995-03-06 | 富士重工業株式会社 | Vehicle diagnostic device |
| JPH0776725B2 (en) | 1988-02-18 | 1995-08-16 | 富士重工業株式会社 | Vehicle diagnostic device |
| JPH0718780B2 (en) | 1988-03-29 | 1995-03-06 | 富士重工業株式会社 | Vehicle diagnostic system |
| GB8813066D0 (en) | 1988-06-02 | 1988-07-06 | Pi Research Ltd | Vehicle data recording system |
| US4985857A (en) | 1988-08-19 | 1991-01-15 | General Motors Corporation | Method and apparatus for diagnosing machines |
| US4937763A (en) | 1988-09-06 | 1990-06-26 | E I International, Inc. | Method of system state analysis |
| JPH0776736B2 (en) | 1988-09-28 | 1995-08-16 | 富士重工業株式会社 | Vehicle diagnostic system |
| JPH0776737B2 (en) | 1988-10-21 | 1995-08-16 | 富士重工業株式会社 | Vehicle diagnostic system |
| US5309351A (en) | 1988-10-27 | 1994-05-03 | Texas Instruments Incorporated | Communications, information, maintenance diagnostic and training system |
| US5067099A (en) | 1988-11-03 | 1991-11-19 | Allied-Signal Inc. | Methods and apparatus for monitoring system performance |
| US5195046A (en) | 1989-01-10 | 1993-03-16 | Gerardi Joseph J | Method and apparatus for structural integrity monitoring |
| US5009833A (en) | 1989-01-11 | 1991-04-23 | Westinghouse Electric Corp. | Expert system for surveillance, diagnosis and prognosis of plant operation |
| US5010487A (en) | 1989-03-02 | 1991-04-23 | Coltec Industries Inc. | Computer-based engine diagnostic method |
| DE4008560C2 (en) | 1989-03-17 | 1995-11-02 | Hitachi Ltd | Method and device for determining the remaining service life of an aggregate |
| DE69006885T3 (en) | 1989-04-14 | 1999-05-20 | Hitachi Ltd | Control device for cars. |
| US4975685A (en) | 1989-05-08 | 1990-12-04 | General Motors Corporation | Guide path short detector |
| SE463338B (en) | 1989-06-14 | 1990-11-05 | Ludwik Liszka | SETTING TO MONITOR AND / OR DIAGNOSTIC CURRENT OPERATING CONDITIONS WITH COMPLIED MACHINES |
| DE3923432C2 (en) | 1989-07-15 | 1997-07-17 | Bodenseewerk Geraetetech | Device for generating measurement signals with a plurality of sensors |
| US4990885A (en) | 1989-10-11 | 1991-02-05 | Navistar International Transportation Corp. | Auxiliary battery monitor |
| JPH03180968A (en) | 1989-12-08 | 1991-08-06 | Hitachi Ltd | Data base retrieving method and formated document outputting method using the retrieving method |
| DE69133020T2 (en) | 1990-02-19 | 2002-09-05 | Fuji Photo Film Co Ltd | Remote control method for photographic equipment |
| US5402521A (en) | 1990-02-28 | 1995-03-28 | Chiyoda Corporation | Method for recognition of abnormal conditions using neural networks |
| US5164895A (en) | 1990-03-16 | 1992-11-17 | Westinghouse Electric Corp. | Neutron flux mapping system for nuclear reactors |
| US5262941A (en) | 1990-03-30 | 1993-11-16 | Itt Corporation | Expert credit recommendation method and system |
| US5187735A (en) | 1990-05-01 | 1993-02-16 | Tele Guia Talking Yellow Pages, Inc. | Integrated voice-mail based voice and information processing system |
| JPH0425357A (en) | 1990-05-18 | 1992-01-29 | Mitsubishi Electric Corp | Indication device for input |
| US5063513A (en) | 1990-06-15 | 1991-11-05 | Nartron Corporation | Vehicle preheater control |
| KR920002268A (en) | 1990-07-17 | 1992-02-28 | 유끼노리 가까즈 | Intelligent Processing Equipment |
| US5309139A (en) | 1990-08-03 | 1994-05-03 | Austin Charles W | Vehicle monitoring system |
| US5210704A (en) | 1990-10-02 | 1993-05-11 | Technology International Incorporated | System for prognosis and diagnostics of failure and wearout monitoring and for prediction of life expectancy of helicopter gearboxes and other rotating equipment |
| US5214582C1 (en) | 1991-01-30 | 2001-06-26 | Edge Diagnostic Systems | Interactive diagnostic system for an automobile vehicle and method |
| GB2253933B (en) | 1991-03-21 | 1995-04-26 | Mars Inc | Device for routing coins |
| US5255208A (en) | 1991-08-08 | 1993-10-19 | Aeg Westinghouse Transportation Systems, Inc. | On-line processor based diagnostic system |
| US5257190A (en) | 1991-08-12 | 1993-10-26 | Crane Harold E | Interactive dynamic realtime management system for powered vehicles |
| JP3113351B2 (en) | 1991-11-05 | 2000-11-27 | バブコック日立株式会社 | Fault diagnosis support device |
| US5361336A (en) | 1991-11-21 | 1994-11-01 | Hewlett-Packard Company | Method for controlling an instrument through a common instrument programming interface |
| US5680541A (en) | 1991-12-16 | 1997-10-21 | Fuji Xerox Co., Ltd. | Diagnosing method and apparatus |
| AU668370B2 (en) | 1991-12-20 | 1996-05-02 | Snap-On Technologies, Inc. | Automotive service equipment expert system |
| US5223207A (en) | 1992-01-29 | 1993-06-29 | The United States Of America As Represented By The United States Department Of Energy | Expert system for online surveillance of nuclear reactor coolant pumps |
| US5459675A (en) | 1992-01-29 | 1995-10-17 | Arch Development Corporation | System for monitoring an industrial process and determining sensor status |
| US5629872A (en) | 1992-01-29 | 1997-05-13 | Arch Development Corporation | System for monitoring an industrial process and determining sensor status |
| US5239462A (en) | 1992-02-25 | 1993-08-24 | Creative Solutions Groups, Inc. | Method and apparatus for automatically determining the approval status of a potential borrower |
| US5774882A (en) | 1992-03-12 | 1998-06-30 | Keen; Regina D. | Credit approval system |
| US5387783A (en) | 1992-04-30 | 1995-02-07 | Postalsoft, Inc. | Method and apparatus for inserting and printing barcoded zip codes |
| US5442553A (en) | 1992-11-16 | 1995-08-15 | Motorola | Wireless motor vehicle diagnostic and software upgrade system |
| JP3186866B2 (en) | 1992-11-20 | 2001-07-11 | 株式会社東芝 | Method and apparatus for predicting deterioration / damage of structural member |
| US6002839A (en) | 1992-11-24 | 1999-12-14 | Pavilion Technologies | Predictive network with graphically determined preprocess transforms |
| JP3435713B2 (en) | 1992-11-27 | 2003-08-11 | 株式会社デンソー | Learning pattern selection type additional learning device |
| US5544320A (en) | 1993-01-08 | 1996-08-06 | Konrad; Allan M. | Remote information service access system based on a client-server-service model |
| US5559710A (en) | 1993-02-05 | 1996-09-24 | Siemens Corporate Research, Inc. | Apparatus for control and evaluation of pending jobs in a factory |
| JPH06274784A (en) | 1993-03-24 | 1994-09-30 | Asahi Chem Ind Co Ltd | Plant monitoring diagnostic device and its abnormal sign identification method |
| JP3190917B2 (en) | 1993-03-26 | 2001-07-23 | ポリプラスチックス株式会社 | Injection molding method, injection mold and injection molded product |
| US5579232A (en) | 1993-03-29 | 1996-11-26 | General Electric Company | System and method including neural net for tool break detection |
| US5479574A (en) | 1993-04-01 | 1995-12-26 | Nestor, Inc. | Method and apparatus for adaptive classification |
| US5465321A (en) | 1993-04-07 | 1995-11-07 | The United States Of America As Represented By The Administrator Of The National Aeronautics And Space Administration | Hidden markov models for fault detection in dynamic systems |
| US5539638A (en) | 1993-08-05 | 1996-07-23 | Pavilion Technologies, Inc. | Virtual emissions monitor for automobile |
| US5386373A (en) | 1993-08-05 | 1995-01-31 | Pavilion Technologies, Inc. | Virtual continuous emission monitoring system with sensor validation |
| US5822212A (en) | 1993-08-06 | 1998-10-13 | Fanuc Ltd | Machining load monitoring system |
| US5940811A (en) | 1993-08-27 | 1999-08-17 | Affinity Technology Group, Inc. | Closed loop financial transaction method and apparatus |
| ATE202864T1 (en) | 1993-08-27 | 2001-07-15 | Affinity Technology Inc | CLOSED LOOP FINANCIAL TRANSACTION METHOD AND DEVICE |
| US5802509A (en) | 1993-09-21 | 1998-09-01 | Hitachi, Ltd. | Rule generation system and method of generating rule |
| US6141647A (en) | 1995-10-20 | 2000-10-31 | The Dow Chemical Company | System and method for integrating a business environment, a process control environment, and a laboratory environment |
| US5930776A (en) | 1993-11-01 | 1999-07-27 | The Golden 1 Credit Union | Lender direct credit evaluation and loan processing system |
| US5611052A (en) | 1993-11-01 | 1997-03-11 | The Golden 1 Credit Union | Lender direct credit evaluation and loan processing system |
| US5463769A (en) | 1993-12-15 | 1995-10-31 | International Business Machines Corporation | Method and apparatus using dictionary of methods and states for high performance context switching between build and run modes in a computer application builder program |
| DE59300336D1 (en) | 1993-12-24 | 1995-09-07 | Landis & Gry Tech Innovat Ag | Control device for actuating switching devices according to a time program. |
| US5566092A (en) | 1993-12-30 | 1996-10-15 | Caterpillar Inc. | Machine fault diagnostics system and method |
| US5463768A (en) | 1994-03-17 | 1995-10-31 | General Electric Company | Method and system for analyzing error logs for diagnostics |
| US5496450A (en) | 1994-04-13 | 1996-03-05 | Blumenthal; Robert N. | Multiple on-line sensor systems and methods |
| US5817958A (en) | 1994-05-20 | 1998-10-06 | Hitachi, Ltd. | Plant monitoring and diagnosing method and system, as well as plant equipped with the system |
| US5704029A (en) | 1994-05-23 | 1997-12-30 | Wright Strategies, Inc. | System and method for completing an electronic form |
| US5586066A (en) | 1994-06-08 | 1996-12-17 | Arch Development Corporation | Surveillance of industrial processes with correlated parameters |
| FR2721123B1 (en) | 1994-06-08 | 1996-09-06 | Digilog | Method and system for optimal non-linear estimation of dynamic processes in real time. |
| US5481674A (en) | 1994-06-20 | 1996-01-02 | Mahavadi; Manohar R. | Method and apparatus mapping the physical topology of EDDI networks |
| US5502543A (en) | 1994-06-28 | 1996-03-26 | Xerox Corporation | System for collecting statistical data on remotely monitored machines |
| JPH0822403A (en) | 1994-07-11 | 1996-01-23 | Fujitsu Ltd | Monitor device for computer system |
| US5596507A (en) | 1994-08-15 | 1997-01-21 | Jones; Jeffrey K. | Method and apparatus for predictive maintenance of HVACR systems |
| US5797133A (en) | 1994-08-31 | 1998-08-18 | Strategic Solutions Group, Inc | Method for automatically determining the approval status of a potential borrower |
| DE69515096T2 (en) | 1994-10-18 | 2000-07-20 | Neles Controls Oy Helsinki | Method and device for determining a fault in a control valve arrangement in a control loop |
| US5835902A (en) | 1994-11-02 | 1998-11-10 | Jannarone; Robert J. | Concurrent learning and performance information processing system |
| US5617342A (en) | 1994-11-14 | 1997-04-01 | Elazouni; Ashraf M. | Discrete-event simulation-based method for staffing highway maintenance crews |
| US5671635A (en) | 1994-11-14 | 1997-09-30 | Westinghouse Electric Corporation | Method and apparatus for monitoring of spring pack displacement of a motor-operated valve |
| JPH0973313A (en) | 1995-02-09 | 1997-03-18 | Matsushita Electric Ind Co Ltd | Method and device for planning manufacture program |
| JPH08220279A (en) | 1995-02-17 | 1996-08-30 | Hitachi Ltd | Plant control device, abnormality identifying method and abnormality identifying device |
| US5696907A (en) | 1995-02-27 | 1997-12-09 | General Electric Company | System and method for performing risk and credit analysis of financial service applications |
| US5727163A (en) | 1995-03-30 | 1998-03-10 | Amazon.Com, Inc. | Secure method for communicating credit card data when placing an order on a non-secure network |
| US5710723A (en) | 1995-04-05 | 1998-01-20 | Dayton T. Brown | Method and apparatus for performing pre-emptive maintenance on operating equipment |
| US5600726A (en) | 1995-04-07 | 1997-02-04 | Gemini Systems, L.L.C. | Method for creating specific purpose rule-based n-bit virtual machines |
| US5699403A (en) | 1995-04-12 | 1997-12-16 | Lucent Technologies Inc. | Network vulnerability management apparatus and method |
| US5612886A (en) | 1995-05-12 | 1997-03-18 | Taiwan Semiconductor Manufacturing Company Ltd. | Method and system for dynamic dispatching in semiconductor manufacturing plants |
| US5774883A (en) | 1995-05-25 | 1998-06-30 | Andersen; Lloyd R. | Method for selecting a seller's most profitable financing program |
| US5708780A (en) | 1995-06-07 | 1998-01-13 | Open Market, Inc. | Internet server access control and monitoring systems |
| US5867118A (en) | 1995-06-07 | 1999-02-02 | Lockheed Martin Corporation | Apparatus for and method of classifying patterns |
| US5819236A (en) | 1995-06-12 | 1998-10-06 | Carreker-Antinori, Inc. | System and method for providing advance notification of potential presentment returns due to account restrictions |
| US5774379A (en) | 1995-07-21 | 1998-06-30 | The University Of Chicago | System for monitoring an industrial or biological process |
| US5663894A (en) | 1995-09-06 | 1997-09-02 | Ford Global Technologies, Inc. | System and method for machining process characterization using mechanical signature analysis |
| US5878403A (en) | 1995-09-12 | 1999-03-02 | Cmsi | Computer implemented automated credit application analysis and decision routing system |
| US5761090A (en) | 1995-10-10 | 1998-06-02 | The University Of Chicago | Expert system for testing industrial processes and determining sensor status |
| DE19537694A1 (en) | 1995-10-10 | 1997-04-17 | Schenck Ag Carl | Process for monitoring a machine or system |
| US6088686A (en) | 1995-12-12 | 2000-07-11 | Citibank, N.A. | System and method to performing on-line credit reviews and approvals |
| US5761640A (en) | 1995-12-18 | 1998-06-02 | Nynex Science & Technology, Inc. | Name and address processor |
| JPH09166483A (en) | 1995-12-19 | 1997-06-24 | Hitachi Ltd | Method and apparatus for monitoring equipment |
| US5724254A (en) | 1996-01-18 | 1998-03-03 | Electric Power Research Institute | Apparatus and method for analyzing power plant water chemistry |
| JP2735064B2 (en) | 1996-01-31 | 1998-04-02 | 日本電気株式会社 | Waveform analyzer |
| US5745654A (en) | 1996-02-13 | 1998-04-28 | Hnc Software, Inc. | Fast explanations of scored observations |
| US5946662A (en) | 1996-03-29 | 1999-08-31 | International Business Machines Corporation | Method for providing inventory optimization |
| US5956664A (en) | 1996-04-01 | 1999-09-21 | Cairo Systems, Inc. | Method and apparatus for monitoring railway defects |
| US6014645A (en) | 1996-04-19 | 2000-01-11 | Block Financial Corporation | Real-time financial card application system |
| US5848396A (en) | 1996-04-26 | 1998-12-08 | Freedom Of Information, Inc. | Method and apparatus for determining behavioral profile of a computer user |
| US5877954A (en) | 1996-05-03 | 1999-03-02 | Aspen Technology, Inc. | Hybrid linear-neural network process control |
| US5809490A (en) | 1996-05-03 | 1998-09-15 | Aspen Technology Inc. | Apparatus and method for selecting a working data set for model development |
| US5805442A (en) | 1996-05-30 | 1998-09-08 | Control Technology Corporation | Distributed interface architecture for programmable industrial control systems |
| US5987434A (en) | 1996-06-10 | 1999-11-16 | Libman; Richard Marc | Apparatus and method for transacting marketing and sales of financial products |
| US5764509A (en) | 1996-06-19 | 1998-06-09 | The University Of Chicago | Industrial process surveillance system |
| US6246972B1 (en) | 1996-08-23 | 2001-06-12 | Aspen Technology, Inc. | Analyzer for modeling and optimizing maintenance operations |
| US5819291A (en) | 1996-08-23 | 1998-10-06 | General Electric Company | Matching new customer records to existing customer records in a large business database using hash key |
| US5963884A (en) | 1996-09-23 | 1999-10-05 | Machine Xpert, Llc | Predictive maintenance system |
| US5970430A (en) | 1996-10-04 | 1999-10-19 | Fisher Controls International, Inc. | Local device and process diagnostics in a process control network having distributed control functions |
| US5966699A (en) | 1996-10-11 | 1999-10-12 | Zandi; Richard | System and method for conducting loan auction over computer network |
| US5791147A (en) | 1996-10-28 | 1998-08-11 | Basic Resources, Inc. | Power plant performance management systems and methods |
| US6603487B1 (en) | 1996-10-31 | 2003-08-05 | International Business Machines Corporation | System for electronically developing and processing a document |
| US5905989A (en) | 1996-11-27 | 1999-05-18 | Bently Nevada Corporation | Knowledge manager relying on a hierarchical default expert system: apparatus and method |
| US5753805A (en) | 1996-12-02 | 1998-05-19 | General Motors Corporation | Method for determining pneumatic states in an internal combustion engine system |
| US5714683A (en) | 1996-12-02 | 1998-02-03 | General Motors Corporation | Internal combustion engine intake port flow determination |
| US5950179A (en) | 1996-12-03 | 1999-09-07 | Providian Financial Corporation | Method and system for issuing a secured credit card |
| US5961560A (en) | 1996-12-19 | 1999-10-05 | Caterpillar Inc. | System and method for managing access of a fleet of mobile machines to a service resource |
| DE69628177D1 (en) | 1996-12-27 | 2003-06-18 | St Microelectronics Srl | Coding and storage method for fuzzy logic rules and circuit architecture for processing such rules |
| US5790977A (en) | 1997-02-06 | 1998-08-04 | Hewlett-Packard Company | Data acquisition from a remote instrument via the internet |
| US5995911A (en) | 1997-02-12 | 1999-11-30 | Power Measurement Ltd. | Digital sensor apparatus and system for protection, control, and management of electricity distribution systems |
| US5913911A (en) | 1997-02-14 | 1999-06-22 | Kuhlman Corporation | Method and apparatus for concentrating signals |
| JP3507270B2 (en) | 1997-02-20 | 2004-03-15 | 株式会社日立製作所 | Network management system, network equipment, network management method, and network management tool |
| US5819029A (en) | 1997-02-20 | 1998-10-06 | Brittan Communications International Corp. | Third party verification system and method |
| US5960435A (en) | 1997-03-11 | 1999-09-28 | Silicon Graphics, Inc. | Method, system, and computer program product for computing histogram aggregations |
| US5970478A (en) | 1997-03-12 | 1999-10-19 | Walker Asset Management Limited Partnership | Method, apparatus, and program for customizing credit accounts |
| US6013108A (en) | 1997-03-18 | 2000-01-11 | Endevco Corporation | Intelligent sensor system with network bus |
| US5930779A (en) | 1997-03-25 | 1999-07-27 | Mci Communications Corporation | Web based system and method to automate storage of power plant data and calculation of battery reserves |
| US5832465A (en) | 1997-04-07 | 1998-11-03 | General Electric Company | Method for building a self-learning evidential reasoning system |
| US5940298A (en) | 1997-05-07 | 1999-08-17 | Vanguard International Semiconductor Corporation | Capacity loss control method for preventative maintenance in IC plant |
| KR100225637B1 (en) | 1997-05-23 | 1999-10-15 | 윤종용 | Temperature control apparatus for air conditioner |
| CA2207670A1 (en) | 1997-05-29 | 1998-11-29 | Andre Marguinaud | Procedure for synthesizing a finite pulse response digital filter and filter obtained using this procedure |
| US5845627A (en) | 1997-05-30 | 1998-12-08 | General Motors Corporation | Internal combustion engine pneumatic state estimator |
| US5933818A (en) | 1997-06-02 | 1999-08-03 | Electronic Data Systems Corporation | Autonomous knowledge discovery system and method |
| US6006260A (en) | 1997-06-03 | 1999-12-21 | Keynote Systems, Inc. | Method and apparatus for evalutating service to a user over the internet |
| JPH10339630A (en) | 1997-06-10 | 1998-12-22 | Mitsutoyo Corp | 3-dimension measuring system |
| US6131076A (en) | 1997-07-25 | 2000-10-10 | Arch Development Corporation | Self tuning system for industrial surveillance |
| US6300127B1 (en) | 1997-07-30 | 2001-10-09 | Emory University | Bone mineralization proteins, DNA, vectors, expression systems |
| US6112190A (en) | 1997-08-19 | 2000-08-29 | Citibank, N.A. | Method and system for commercial credit analysis |
| US5940812A (en) | 1997-08-19 | 1999-08-17 | Loanmarket Resources, L.L.C. | Apparatus and method for automatically matching a best available loan to a potential borrower via global telecommunications network |
| US5960411A (en) | 1997-09-12 | 1999-09-28 | Amazon.Com, Inc. | Method and system for placing a purchase order via a communications network |
| US5995947A (en) | 1997-09-12 | 1999-11-30 | Imx Mortgage Exchange | Interactive mortgage and loan information and real-time trading system |
| US6331864B1 (en) | 1997-09-23 | 2001-12-18 | Onadime, Inc. | Real-time multimedia visual programming system |
| US6000832A (en) | 1997-09-24 | 1999-12-14 | Microsoft Corporation | Electronic online commerce card with customer generated transaction proxy number for online transactions |
| US6076048A (en) | 1997-09-26 | 2000-06-13 | Betzdearborn, Inc. | System and method for least squares filtering based leak flow estimation/detection using exponentially shaped leak profiles |
| US6026348A (en) | 1997-10-14 | 2000-02-15 | Bently Nevada Corporation | Apparatus and method for compressing measurement data correlative to machine status |
| US6240372B1 (en) | 1997-11-14 | 2001-05-29 | Arch Development Corporation | System for surveillance of spectral signals |
| US5987399A (en) | 1998-01-14 | 1999-11-16 | Arch Development Corporation | Ultrasensitive surveillance of sensors and processes |
| AU2595399A (en) | 1998-02-09 | 1999-08-23 | Stephen Barone | Motion detectors and occupancy sensors based on displacement detection |
| US6128540A (en) | 1998-02-20 | 2000-10-03 | Hagen Method Pty. Ltd. | Method and computer system for controlling an industrial process using financial analysis |
| US6192352B1 (en) | 1998-02-20 | 2001-02-20 | Tennessee Valley Authority | Artificial neural network and fuzzy logic based boiler tube leak detection systems |
| US6418431B1 (en) | 1998-03-30 | 2002-07-09 | Microsoft Corporation | Information retrieval and speech recognition based on language models |
| JP3525736B2 (en) | 1998-04-28 | 2004-05-10 | 日産自動車株式会社 | Diagnostic device for machine driven by motor |
| US6119111A (en) | 1998-06-09 | 2000-09-12 | Arch Development Corporation | Neuro-parity pattern recognition system and method |
| US6029890A (en) | 1998-06-22 | 2000-02-29 | Austin; Frank | User-Specified credit card system |
| US6272449B1 (en) | 1998-06-22 | 2001-08-07 | Torrent Systems, Inc. | Computer system and process for explaining behavior of a model that maps input data to output data |
| US6327574B1 (en) | 1998-07-07 | 2001-12-04 | Encirq Corporation | Hierarchical models of consumer attributes for targeting content in a privacy-preserving manner |
| CA2340977C (en) | 1998-08-17 | 2006-09-12 | Aspen Technology, Inc. | Sensor validation apparatus and method |
| US6245517B1 (en) | 1998-09-29 | 2001-06-12 | The United States Of America As Represented By The Department Of Health And Human Services | Ratio-based decisions and the quantitative analysis of cDNA micro-array images |
| US6826552B1 (en) | 1999-02-05 | 2004-11-30 | Xfi Corporation | Apparatus and methods for a computer aided decision-making system |
| US6107919A (en) | 1999-02-24 | 2000-08-22 | Arch Development Corporation | Dual sensitivity mode system for monitoring processes and sensors |
| US6941287B1 (en) | 1999-04-30 | 2005-09-06 | E. I. Du Pont De Nemours And Company | Distributed hierarchical evolutionary modeling and visualization of empirical data |
| US7386426B1 (en) | 1999-04-30 | 2008-06-10 | Smartsignal Corporation | Method and system for nonlinear state estimation |
| WO2000067412A2 (en) | 1999-04-30 | 2000-11-09 | Dryken Technologies | Method and system for nonlinear state estimation |
| US6553336B1 (en) | 1999-06-25 | 2003-04-22 | Telemonitor, Inc. | Smart remote monitoring system and method |
| US7783507B2 (en) | 1999-08-23 | 2010-08-24 | General Electric Company | System and method for managing a fleet of remote assets |
| US20110208567A9 (en) | 1999-08-23 | 2011-08-25 | Roddy Nicholas E | System and method for managing a fleet of remote assets |
| US6571186B1 (en) | 1999-09-14 | 2003-05-27 | Textronix, Inc. | Method of waveform time stamping for minimizing digitization artifacts in time interval distribution measurements |
| US6522978B1 (en) | 1999-09-15 | 2003-02-18 | General Electric Company | Paper web breakage prediction using principal components analysis and classification and regression trees |
| US6591296B1 (en) | 1999-12-15 | 2003-07-08 | General Electric Company | Remote notification of machine diagnostic information utilizing a unique email address identifying the sensor, the associated machine, and the associated machine condition |
| US20030126258A1 (en) | 2000-02-22 | 2003-07-03 | Conkright Gary W. | Web based fault detection architecture |
| US6421571B1 (en) | 2000-02-29 | 2002-07-16 | Bently Nevada Corporation | Industrial plant asset management system: apparatus and method |
| WO2001067262A1 (en) | 2000-03-09 | 2001-09-13 | Smartsignal Corporation | Generalized lensing angular similarity operator |
| US7739096B2 (en) | 2000-03-09 | 2010-06-15 | Smartsignal Corporation | System for extraction of representative data for training of adaptive process monitoring equipment |
| US6609212B1 (en) | 2000-03-09 | 2003-08-19 | International Business Machines Corporation | Apparatus and method for sharing predictive failure information on a computer network |
| US6957172B2 (en) | 2000-03-09 | 2005-10-18 | Smartsignal Corporation | Complex signal decomposition and modeling |
| US6853920B2 (en) | 2000-03-10 | 2005-02-08 | Smiths Detection-Pasadena, Inc. | Control for an industrial process using one or more multidimensional variables |
| US6952662B2 (en) | 2000-03-30 | 2005-10-04 | Smartsignal Corporation | Signal differentiation system using improved non-linear operator |
| US6609036B1 (en) | 2000-06-09 | 2003-08-19 | Randall L. Bickford | Surveillance system and method having parameter estimation and operating mode partitioning |
| US6917839B2 (en) | 2000-06-09 | 2005-07-12 | Intellectual Assets Llc | Surveillance system and method having an operating mode partitioned fault classification model |
| US6898554B2 (en) | 2000-06-12 | 2005-05-24 | Scientific Monitoring, Inc. | Fault detection in a physical system |
| US6678639B2 (en) | 2000-08-04 | 2004-01-13 | Sun Microsystems, Inc. | Automated problem identification system |
| US20030060808A1 (en) | 2000-10-04 | 2003-03-27 | Wilk Peter J. | Telemedical method and system |
| CA2419240C (en) | 2000-10-26 | 2007-04-10 | Triant Technologies Inc. | Method for estimating and reducing uncertainties in process measurements |
| US6556939B1 (en) | 2000-11-22 | 2003-04-29 | Smartsignal Corporation | Inferential signal generator for instrumented equipment and processes |
| US6859739B2 (en) | 2001-01-19 | 2005-02-22 | Smartsignal Corporation | Global state change indicator for empirical modeling in condition based monitoring |
| US7233886B2 (en) | 2001-01-19 | 2007-06-19 | Smartsignal Corporation | Adaptive modeling of changed states in predictive condition monitoring |
| US6879969B2 (en) | 2001-01-21 | 2005-04-12 | Volvo Technological Development Corporation | System and method for real-time recognition of driving patterns |
| US7373283B2 (en) | 2001-02-22 | 2008-05-13 | Smartsignal Corporation | Monitoring and fault detection system and method using improved empirical model for range extrema |
| AU2002248549B2 (en) | 2001-03-08 | 2005-01-20 | California Institute Of Technology | Real-time spatio-temporal coherence estimation for autonomous mode identification and invariance tracking |
| EP1724717A3 (en) | 2001-03-08 | 2009-07-22 | California Institute Of Technology | Real-time spatio-temporal coherence estimation for autonomous mode identification and invariance tracking |
| US7539597B2 (en) | 2001-04-10 | 2009-05-26 | Smartsignal Corporation | Diagnostic systems and methods for predictive condition monitoring |
| US20020183971A1 (en) * | 2001-04-10 | 2002-12-05 | Wegerich Stephan W. | Diagnostic systems and methods for predictive condition monitoring |
| US6975962B2 (en) | 2001-06-11 | 2005-12-13 | Smartsignal Corporation | Residual signal alert generation for condition monitoring using approximated SPRT distribution |
| US7089154B2 (en) | 2001-08-09 | 2006-08-08 | Rovsing Dynamics A/S | Automatic machinery fault diagnostic method and apparatus |
| US7200613B2 (en) | 2001-11-09 | 2007-04-03 | Xerox Corporation | Asset management system for network-based and non-network-based assets and information |
| US7085675B2 (en) | 2002-02-06 | 2006-08-01 | The University Of Chicago | Subband domain signal validation |
| US6892163B1 (en) | 2002-03-08 | 2005-05-10 | Intellectual Assets Llc | Surveillance system and method having an adaptive sequential probability fault detection test |
| US7313550B2 (en) * | 2002-03-27 | 2007-12-25 | Council Of Scientific & Industrial Research | Performance of artificial neural network models in the presence of instrumental noise and measurement errors |
| US6839660B2 (en) | 2002-04-22 | 2005-01-04 | Csi Technology, Inc. | On-line rotating equipment monitoring device |
| US6925357B2 (en) | 2002-07-25 | 2005-08-02 | Intouch Health, Inc. | Medical tele-robotic system |
| US6795763B2 (en) | 2002-10-30 | 2004-09-21 | Visteon Global Technologies, Inc. | Expert-type vehicle steering control system and method |
| HUE033477T2 (en) | 2002-11-04 | 2017-12-28 | Ge Intelligent Platforms Inc | System state monitoring using recurrent local learning machine |
| US20040243636A1 (en) | 2003-03-18 | 2004-12-02 | Smartsignal Corporation | Equipment health monitoring architecture for fleets of assets |
| US7734400B2 (en) | 2003-07-24 | 2010-06-08 | Honeywell International Inc. | Fault detection system and method using augmented data and fuzzy logic |
| US7113890B2 (en) | 2003-10-16 | 2006-09-26 | Abb Inc. | Method and apparatus for detecting faults in steam generator system components and other continuous processes |
| US7451003B2 (en) | 2004-03-04 | 2008-11-11 | Falconeer Technologies Llc | Method and system of monitoring, sensor validation and predictive fault analysis |
| US20050261837A1 (en) | 2004-05-03 | 2005-11-24 | Smartsignal Corporation | Kernel-based system and method for estimation-based equipment condition monitoring |
| US7621141B2 (en) | 2004-09-22 | 2009-11-24 | York International Corporation | Two-zone fuzzy logic liquid level control |
| US7640145B2 (en) | 2005-04-25 | 2009-12-29 | Smartsignal Corporation | Automated model configuration and deployment system for equipment health monitoring |
| EP1892597A1 (en) | 2006-08-26 | 2008-02-27 | Peter Renner | State monitoring for machines and technical equipment |
| US8275577B2 (en) | 2006-09-19 | 2012-09-25 | Smartsignal Corporation | Kernel-based method for detecting boiler tube leaks |
| US8311774B2 (en) * | 2006-12-15 | 2012-11-13 | Smartsignal Corporation | Robust distance measures for on-line monitoring |
| US20080183245A1 (en) | 2007-01-31 | 2008-07-31 | Van Oort Geeske | Telemetry of external physiological sensor data and implantable medical device data to a central processing system |
| US7797259B2 (en) | 2007-04-12 | 2010-09-14 | Hrl Laboratories, Llc | System for temporal prediction |
| WO2009020861A1 (en) | 2007-08-03 | 2009-02-12 | Smartsignal Corporation | Fuzzy classification approach to fault pattern matching |
| US8108136B2 (en) | 2007-08-09 | 2012-01-31 | Ford Global Technologies, Llc. | Driver advisory system for fuel economy improvement of a hybrid electric vehicle |
| US8306778B2 (en) | 2008-12-23 | 2012-11-06 | Embraer S.A. | Prognostics and health monitoring for electro-mechanical systems and components |
| JP2010218301A (en) * | 2009-03-17 | 2010-09-30 | Taiyo Nippon Sanso Corp | Failure diagnosis apparatus, failure diagnosis method, and failure diagnosis program |
| KR101360790B1 (en) | 2009-04-22 | 2014-02-11 | 한국전력공사 | Pridiction method for monitoring performance of plant instruments |
| CN101582159A (en) | 2009-06-26 | 2009-11-18 | 哈尔滨工业大学 | Infrared image background suppression method based on unsupervised kernel regression analysis |
| CN101930501B (en) | 2010-08-24 | 2014-02-12 | 昆明理工大学 | Method for building fractal dimension-based multi-phase mixed effect prediction model |
| US8620853B2 (en) | 2011-07-19 | 2013-12-31 | Smartsignal Corporation | Monitoring method using kernel regression modeling with pattern sequences |
| US9235208B2 (en) | 2011-07-19 | 2016-01-12 | GE Intelligent Platforms, Inc | System of sequential kernel regression modeling for forecasting financial data |
| US9256224B2 (en) | 2011-07-19 | 2016-02-09 | GE Intelligent Platforms, Inc | Method of sequential kernel regression modeling for forecasting and prognostics |
| US8660980B2 (en) | 2011-07-19 | 2014-02-25 | Smartsignal Corporation | Monitoring system using kernel regression modeling with pattern sequences |
-
2011
- 2011-07-19 US US13/186,153 patent/US9250625B2/en active Active
-
2012
- 2012-07-09 JP JP2014521650A patent/JP2014525097A/en not_active Ceased
- 2012-07-09 CA CA2841442A patent/CA2841442A1/en not_active Abandoned
- 2012-07-09 KR KR1020147001392A patent/KR20140043439A/en not_active Application Discontinuation
- 2012-07-09 BR BR112014001230A patent/BR112014001230A2/en not_active IP Right Cessation
- 2012-07-09 CN CN201280035645.8A patent/CN103842923B/en active Active
- 2012-07-09 AU AU2012284460A patent/AU2012284460B2/en not_active Ceased
- 2012-07-09 WO PCT/US2012/045901 patent/WO2013012584A1/en active Application Filing
-
2015
- 2015-12-22 US US14/978,432 patent/US20160110655A1/en not_active Abandoned
Also Published As
| Publication number | Publication date |
|---|---|
| CA2841442A1 (en) | 2013-01-24 |
| AU2012284460B2 (en) | 2016-06-23 |
| US20160110655A1 (en) | 2016-04-21 |
| CN103842923B (en) | 2016-09-07 |
| BR112014001230A2 (en) | 2017-02-21 |
| US20130024414A1 (en) | 2013-01-24 |
| AU2012284460A1 (en) | 2014-01-30 |
| JP2014525097A (en) | 2014-09-25 |
| US9250625B2 (en) | 2016-02-02 |
| WO2013012584A1 (en) | 2013-01-24 |
| CN103842923A (en) | 2014-06-04 |
Similar Documents
| Publication | Publication Date | Title |
|---|---|---|
| KR20140043439A (en) | System of sequential kernel regression modeling for forecasting and prognostics | |
| JP6068468B2 (en) | A sequential kernel regression modeling method for prediction and prediction | |
| AU2012284497B2 (en) | Monitoring system using kernel regression modeling with pattern sequences | |
| AU2012284498B2 (en) | Monitoring method using kernel regression modeling with pattern sequences | |
| Niu et al. | Intelligent condition monitoring and prognostics system based on data-fusion strategy | |
| US9235208B2 (en) | System of sequential kernel regression modeling for forecasting financial data | |
| US20070088550A1 (en) | Method for predictive maintenance of a machine | |
| US8577815B2 (en) | Method and system for concurrent event forecasting | |
| Martins et al. | Prediction maintenance based on vibration analysis and deep learning–A case study of a drying press supported on a hidden Markov model | |
| Zhang et al. | New Multifeature Information Health Index (MIHI) Based on a Quasi-Orthogonal Sparse Algorithm for Bearing Degradation Monitoring | |
| Chen | Recurrent Neural Networks for Fault Detection: An exploratory study on a dataset about air compressor failures of heavy duty trucks | |
| Tidriri et al. | A new Signal Processing-based Prognostic Approach applied to Turbofan Engines |
Legal Events
| Date | Code | Title | Description |
|---|---|---|---|
| WITN | Application deemed withdrawn, e.g. because no request for examination was filed or no examination fee was paid |