KR101413229B1 - DOA estimation Device and Method - Google Patents

DOA estimation Device and Method Download PDF

Info

Publication number
KR101413229B1
KR101413229B1 KR20130053828A KR20130053828A KR101413229B1 KR 101413229 B1 KR101413229 B1 KR 101413229B1 KR 20130053828 A KR20130053828 A KR 20130053828A KR 20130053828 A KR20130053828 A KR 20130053828A KR 101413229 B1 KR101413229 B1 KR 101413229B1
Authority
KR
South Korea
Prior art keywords
signal
sound source
statistical distribution
calculated
music
Prior art date
Application number
KR20130053828A
Other languages
Korean (ko)
Inventor
유창동
최진호
Original Assignee
한국과학기술원
Priority date (The priority date is an assumption and is not a legal conclusion. Google has not performed a legal analysis and makes no representation as to the accuracy of the date listed.)
Filing date
Publication date
Application filed by 한국과학기술원 filed Critical 한국과학기술원
Priority to KR20130053828A priority Critical patent/KR101413229B1/en
Priority to US14/070,716 priority patent/US20140334265A1/en
Application granted granted Critical
Publication of KR101413229B1 publication Critical patent/KR101413229B1/en

Links

Images

Classifications

    • GPHYSICS
    • G01MEASURING; TESTING
    • G01SRADIO DIRECTION-FINDING; RADIO NAVIGATION; DETERMINING DISTANCE OR VELOCITY BY USE OF RADIO WAVES; LOCATING OR PRESENCE-DETECTING BY USE OF THE REFLECTION OR RERADIATION OF RADIO WAVES; ANALOGOUS ARRANGEMENTS USING OTHER WAVES
    • G01S3/00Direction-finders for determining the direction from which infrasonic, sonic, ultrasonic, or electromagnetic waves, or particle emission, not having a directional significance, are being received
    • G01S3/02Direction-finders for determining the direction from which infrasonic, sonic, ultrasonic, or electromagnetic waves, or particle emission, not having a directional significance, are being received using radio waves
    • G01S3/14Systems for determining direction or deviation from predetermined direction
    • GPHYSICS
    • G01MEASURING; TESTING
    • G01SRADIO DIRECTION-FINDING; RADIO NAVIGATION; DETERMINING DISTANCE OR VELOCITY BY USE OF RADIO WAVES; LOCATING OR PRESENCE-DETECTING BY USE OF THE REFLECTION OR RERADIATION OF RADIO WAVES; ANALOGOUS ARRANGEMENTS USING OTHER WAVES
    • G01S3/00Direction-finders for determining the direction from which infrasonic, sonic, ultrasonic, or electromagnetic waves, or particle emission, not having a directional significance, are being received
    • G01S3/80Direction-finders for determining the direction from which infrasonic, sonic, ultrasonic, or electromagnetic waves, or particle emission, not having a directional significance, are being received using ultrasonic, sonic or infrasonic waves
    • G01S3/8006Multi-channel systems specially adapted for direction-finding, i.e. having a single aerial system capable of giving simultaneous indications of the directions of different signals
    • GPHYSICS
    • G01MEASURING; TESTING
    • G01SRADIO DIRECTION-FINDING; RADIO NAVIGATION; DETERMINING DISTANCE OR VELOCITY BY USE OF RADIO WAVES; LOCATING OR PRESENCE-DETECTING BY USE OF THE REFLECTION OR RERADIATION OF RADIO WAVES; ANALOGOUS ARRANGEMENTS USING OTHER WAVES
    • G01S3/00Direction-finders for determining the direction from which infrasonic, sonic, ultrasonic, or electromagnetic waves, or particle emission, not having a directional significance, are being received
    • G01S3/02Direction-finders for determining the direction from which infrasonic, sonic, ultrasonic, or electromagnetic waves, or particle emission, not having a directional significance, are being received using radio waves
    • G01S3/04Details
    • G01S3/12Means for determining sense of direction, e.g. by combining signals from directional antenna or goniometer search coil with those from non-directional antenna

Landscapes

  • Physics & Mathematics (AREA)
  • Engineering & Computer Science (AREA)
  • General Physics & Mathematics (AREA)
  • Radar, Positioning & Navigation (AREA)
  • Remote Sensing (AREA)
  • Measurement Of Velocity Or Position Using Acoustic Or Ultrasonic Waves (AREA)

Abstract

A direction of arrival (DOA) estimation device and method is disclosed. The present invention may comprise a sensor unit for sensing a signal and including at least two sensors to output a sensor signal which is a sensing signal for the sensed signal; and a control unit for calculating statistical distribution data for describing the statistical distribution of the sensor signal per sensor signal which is output by the two sensors respectively, extracting the statistical distribution data for describing the statistical distribution of a sound source signal which is a non-stationary signal contained in the signal on the calculated statistical distribution data, and estimating the direction of the sound source which outputs the sound source signal on the basis of the extracted statistical distribution data.

Description

방향 추정 장치 및 방법{DOA estimation Device and Method}(DOA estimation device and method)

본 발명은 음원 방향 추정 장치에 관한 것으로서, 더 상세하게는 언더디터민트 상황에서 고해상도를 가지는 2p 차원의 신호 및 잡음 신호 부공간 제약 최적화에 기반한 방향 추정 장치 및 방법에 관한 것이다.
BACKGROUND OF THE INVENTION 1. Field of the Invention The present invention relates to a sound source direction estimating apparatus, and more particularly, to an apparatus and method for estimating a direction based on a 2p-dimensional signal and a noise signal subspace constraint optimization having a high resolution in an under-dieter mint situation.

전자 , 통신, 기계 등 다양한 분야의 기술이 발달함에 따라 인간의 생활은 더욱 편리하게 되었고, 많은 부분에 있어서 인간을 대신하여 움직이고 주어진 일을 처리하는 자동 시스템이 개발되고 있다. 이러한 자동 시스템은 인간, 비행기, 새, 잠수함 등과 같은 음원이 출력하는 신호를 인식하고, 인식된 음성 데이터에 따라 적절한 행동을 취할 수 있게 구현되고 있다. 특히, 음원의 신호를 인식하여 음원이 발생하는 위치를 추정할 수도 있다.As technologies in various fields such as electronics, communication, and machinery have developed, human life has become more convenient, and in many places, an automated system that moves on behalf of human beings and processes given tasks is being developed. Such an automatic system recognizes signals output from sound sources such as humans, airplanes, birds, submarines, and the like, and is implemented so as to take appropriate actions according to recognized voice data. In particular, it is also possible to estimate a position at which a sound source is generated by recognizing a signal of the sound source.

음원 방향 검출장치는 장치에 장착된 수신기를 통해 음향 신호가 출력되는 순서를 이용하여 음원의 방향을 검출하며, 이러한 음원에서 출력되는 신호는 비젼(vision)보다 데이터량이 적고, 단조로운 데이터 형태를 가지는 단점이 있다. 하지만 조명이 없는 곳이나 장애물이 있어 시야를 벗어나 보이지 않는 곳 등의 환경에서도 유용하다는 점에서 신호는 비젼이 인식하지 못하는 것들을 보완해줄 수 있는 중요한 데이터이다.The sound source direction detecting apparatus detects the direction of a sound source by using a sequence in which a sound signal is output through a receiver mounted on the apparatus. The signal outputted from the sound source has a data amount smaller than vision and has a disadvantage . Signals, however, are important data that can complement things that vision does not recognize, because it is also useful in environments where there is no lighting or obstacles and where they can not be seen out of sight.

한편, 로봇에 마이크로폰과 같은 수신기를 부착시키고 사용자의 호출 음성이나 박수소리를 입력받아 인식함으로서 카메라나 키보드와 같은 입력 시스템 대용으로 활용할 수 있도록 하는 자동 인터페이스 기능 구현을 위한 연구가 수행되고 있으며, 로봇 스스로가 소비자의 목소리를 포함하는 음원에 반응하여 그 방향을 정확하게 추정하는 기술에 대한 관심이 높아지고 있는 실정이다.On the other hand, studies have been carried out to realize an automatic interface function that enables a user to attach a receiver such as a microphone to a robot and input and recognize a call voice or an applause sound of a user so that the robot can be used as a substitute for an input system such as a camera or a keyboard. There is a growing interest in the technique of accurately estimating the direction in response to a sound source including a voice of a consumer.

이를 위해 대한 특허공개공부(A) 제10-2011-0057661호에서는 음원 방향 추정기술로 음원과의 거리를 계산하여 이동하는 이동체 및 그 제어방법을 제시하고 있다. 따라서 이동체가 음원의 방향을 추정하는데 있어서 오차 및 시간이 오래 걸리는 어려움이 있다.For this purpose, Korean Patent Application Laid-Open No. 10-2011-0057661 proposes a mobile object moving by calculating the distance between the sound source and the sound source direction estimation technique and a control method thereof. Therefore, it is difficult for the moving object to take a long time and error in estimating the direction of the sound source.

특허공개공보(A) 제10-20006-0000064호에서는 음성 신호를 발생시킨 화자의 위치를 추정하는 것으로 비고정 잡음(non-stationary noise) 환경에서의 화자 위치 추정 시스템을 제시하고 있다. 따라서 고정 잡음(stationary noise) 환경에서는 음원의 방향 추적의 어려움이 있다.A-10-20006-0000064 discloses a speaker position estimation system in a non-stationary noise environment by estimating a position of a speaker generating a speech signal. Therefore, it is difficult to track the direction of a sound source in a stationary noise environment.

IEEE 논문인 W. J. Zeng and X. L. Li, "High-resolution multiple wideband and nonstationary source localization with unknown number of sources", IEEE Trans. Signal Process., vol. 58, pp. 3125-3136, Jun. 2010.는 비고정 음원 신호에 대한 방향 추정 방법을 제시하고 있다. 하지만 음원의 개수를 알지 못할 경우에는 음원 신호를 추정의 해상도 및 정확도가 높지 않은 어려움이 있다.
IEEE paper WJ Zeng and XL Li, "High-resolution multiple wideband and nonstationary source localization with unknown number of sources", IEEE Trans. Signal Process . , vol. 58, pp. 3125-3136, Jun. 2010. suggests a direction estimation method for non-stationary source signals. However, if the number of sound sources is not known, it is difficult for the resolution and accuracy of the sound source signal to be high.

본 발명이 이루고자 하는 기술적인 과제는 언더디터민트 상황에서 신호가 출력되는 음원의 방향에 대한 공간적 고해상도를 가지는데 목적이 있다.SUMMARY OF THE INVENTION It is an object of the present invention to provide a spatial high resolution of a direction of a sound source from which a signal is output in an under-dieter mint situation.

본 발명이 이루고자 하는 다른 기술적인 과제는 언더디터민트 상황에서 신호가 출력되는 음원의 방향에 대한 높은 정확도를 가는데 목적이 있다.Another object of the present invention is to provide a high accuracy of a direction of a sound source from which a signal is output in an under-dieter mint condition.

본 발명이 이루고자 하는 또 다른 기술적인 과제는 언더디터민트 상황에서 음원의 개수를 더 많이 추출하는데 목적이 있다.
Another technical problem to be solved by the present invention is to extract more number of sound sources in Under Dieter mint condition.

신호를 감지하고, 상기 감지한 신호에 대한 감지 신호인 센서 신호를 출력하는 적어도 두 개의 센서를 포함하는 센서부, 상기 적어도 두 개의 센서가 각각 출력한 센서 신호별로 상기 센서 신호의 통계학적 분포를 지시하는 통계학적 분포 데이터를 산출하고, 상기 산출된 통계학적 분포 데이터에서 상기 신호에 포함된 비고정(non-stationary) 신호인 음원 신호의 통계학적 분포를 지시하는 통계학적 분포 데이터를 추출하며, 상기 추출된 통계학적 분포 데이터를 기초로 상기 음원 신호를 출력한 음원의 방향을 추정하는 제어부를 포함할 수 있다.A sensor unit including at least two sensors for sensing a signal and outputting a sensor signal as a sensing signal for the sensed signal; a sensor unit for indicating a statistical distribution of the sensor signal for each of the sensor signals output by the at least two sensors And extracting statistical distribution data indicating a statistical distribution of a sound source signal which is a non-stationary signal included in the signal in the calculated statistical distribution data, And a controller for estimating a direction of the sound source outputting the sound source signal based on the statistical distribution data.

상기 센서부에 포함된 센서의 개수는 상기 음원의 개수보다 같거나 적을 수 있다.The number of sensors included in the sensor unit may be equal to or less than the number of the sound sources.

상기 통계학적 분포 데이터는 상기 음원 신호의 시간에 따른 변화 및 특성 변화를 지시하는 데이터를 포함할 수 있다.The statistical distribution data may include data indicating a time-dependent change in the sound source signal and a characteristic change.

상기 산출된 통계학적 분포는 가우시안 분포, 비 가우시안 분포, 라플라스 분포 및 빔포밍 분포 중 적어도 하나일 수 있다.The computed statistical distribution may be at least one of a Gaussian distribution, a non-Gaussian distribution, a Laplacian distribution, and a beamforming distribution.

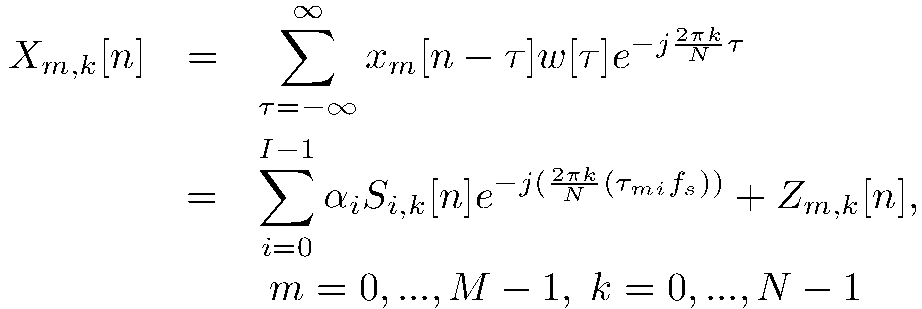
상기 제어부는 상기 산출된 통계학적 분포 데이터로 커뮬런트(cumulant) 행렬을 산출하고, 상기 커뮬런트 행렬을 하기 수학식을 이용하여 산출할 수 있다:The controller may calculate a cumulant matrix using the calculated statistical distribution data and calculate the cumulant matrix using the following equation:

[수학식][Mathematical Expression]

Figure 112013042004143-pat00001

여기서,

Figure 112013042004143-pat00002
는 k 번째 주파수 빈(frequency bin)의 2p차원 커뮬런트 행렬을 나타내고,
Figure 112013042004143-pat00003
는 k 번째 주파수 빈의 가상 배열 매니폴드(manifold) 벡터를 나타내며,
Figure 112013042004143-pat00004
는 고정 신호인 잡음 신호를 나타낸다.here,
Figure 112013042004143-pat00002
Denotes a 2-dimensional convolution matrix of the k-th frequency bin,
Figure 112013042004143-pat00003
Denotes a virtual array manifold vector of the k-th frequency bin,
Figure 112013042004143-pat00004
Represents a noise signal which is a fixed signal.

상기 제어부는 상기 센서 신호를 디지털 신호로 변환하는 전처리부, 상기 변환된 디지털 신호의 통계학적 분포를 지시하는 통계학적 분포 데이터를 산출하고, 상기 산출된 통계학적 분포 데이터에서 상기 신호에 포함된 잡음 신호에 대한 데이터를 제거하여 상기 음원 신호의 통계학적 분포를 지시하는 통계학적 분포 데이터를 추출하며, 상기 추출된 통계학적 분포 데이터를 이용하여 상기 디지털 신호의 음원의 개수 및 방향에 대한 공간 스펙트럼(spatial spectrum)을 산출하는 신호 분석부 및 상기 산출된 디지털 신호의 공간 스펙트럼의 피크(peak)를 상기 음원의 방향인 것으로 추정하는 방향 추정부를 포함할 수 있다.Wherein the control unit comprises: a preprocessing unit for converting the sensor signal into a digital signal; calculating statistical distribution data indicating a statistical distribution of the converted digital signal; Extracts statistical distribution data indicating a statistical distribution of the sound source signal by removing data on the sound source signal and extracts statistical distribution data indicating a spatial spectrum of the number and direction of sound sources of the digital signal using the extracted statistical distribution data, And a direction estimator for estimating a peak of the spatial spectrum of the digital signal as a direction of the sound source.

상기 신호 분석부는 상기 공간 스펙트럼을 하기에 기재된 수학식 및 조건식을 이용하여 산출할 수 있다:The signal analyzer may calculate the spatial spectrum using the following mathematical expression and conditional expression:

[수학식][Mathematical Expression]

Figure 112013042004143-pat00005

[조건식][Conditional expression]

Figure 112013042004143-pat00006

여기서,

Figure 112013042004143-pat00007
는 k 번째 주파수 빈의 가중치 벡터를 나타내고,
Figure 112013042004143-pat00008
는 k 번째 주파수 빈에서
Figure 112013042004143-pat00009
의 가상 배열 매니폴드(manifold) 벡터를 나타낸다. 또한
Figure 112013042004143-pat00010
는 비특이 행렬을 나타내고,
Figure 112013042004143-pat00011
은 임의의 0이 아닌 실제 상수이다.here,
Figure 112013042004143-pat00007
Represents the weight vector of the k-th frequency bin,
Figure 112013042004143-pat00008
Lt; RTI ID = 0.0 > k &
Figure 112013042004143-pat00009
Manifold < / RTI > Also
Figure 112013042004143-pat00010
Represents a non-singular matrix,
Figure 112013042004143-pat00011
Is an arbitrary non-zero real constant.

상기 신호 분석부는 음원(I)가 정해져있는 경우 및 정해지지 않은 경우에 따라 하기에 기재된 수학식을 이용하여, 상기 비특이 행렬

Figure 112013042004143-pat00012
을 산출할 수 있다:The signal analyzing unit may use the mathematical formulas described below according to whether the sound source (I) is fixed or not, and the non-singular matrix
Figure 112013042004143-pat00012
: ≪ / RTI >

[수학식][Mathematical Expression]

Figure 112013042004143-pat00013

Figure 112013042004143-pat00014
는 고유벡터
Figure 112013042004143-pat00015
이고, 영이 아닌 고유값에 해당하는 고유벡터이다.
Figure 112013042004143-pat00016
는 고유벡터
Figure 112013042004143-pat00017
이고, 영인 고유값에 해당하는 고유벡터이다.
Figure 112013042004143-pat00018
는 음원의 개수이고,
Figure 112013042004143-pat00019
Figure 112013042004143-pat00020
단위 행렬이다.
Figure 112013042004143-pat00021
는 음원 신호를 나타내는 고유벡터
Figure 112013042004143-pat00022
및 잡음 신호를 나타내는 고유벡터
Figure 112013042004143-pat00023
에 모두 해당하는 고유값에 관련된 고유벡터이고,
Figure 112013042004143-pat00024
는 잡음 신호 제거 및 치수 조정된 2p차원 커뮬런트 행렬이다.
Figure 112013042004143-pat00014
Eigenvectors
Figure 112013042004143-pat00015
And is an eigenvector corresponding to a non-zero eigenvalue.
Figure 112013042004143-pat00016
Eigenvectors
Figure 112013042004143-pat00017
And is an eigenvector corresponding to an eigenvalue of zero.
Figure 112013042004143-pat00018
Is the number of sound sources,
Figure 112013042004143-pat00019
The
Figure 112013042004143-pat00020
Unit matrix.
Figure 112013042004143-pat00021
Is an eigenvector
Figure 112013042004143-pat00022
And eigenvectors representing the noise signal
Figure 112013042004143-pat00023
Is an eigenvector related to eigenvalues corresponding to all eigenvectors,
Figure 112013042004143-pat00024
Is a 2p-dimensional com- plement matrix with noise cancellation and dimension adjustment.

상기 신호 분석부는 상기 음원의 개수가 사전에 정해진 경우에는 상기 비특이 행렬

Figure 112013042004143-pat00025
를 상기 고유벡터
Figure 112013042004143-pat00026
및 상기 고유벡터
Figure 112013042004143-pat00027
를 이용하여 산출하고, 상기 산출된 비특이 행렬
Figure 112013042004143-pat00028
를 이용하여 라그랑주 승수
Figure 112013042004143-pat00029
를 산출하며, 상기 산출된
Figure 112013042004143-pat00030
를 이용하여 최적의 가중치 벡터
Figure 112013042004143-pat00031
를 산출하고, 상기 산출된
Figure 112013042004143-pat00032
및 상기 고유 벡터
Figure 112013042004143-pat00033
를 이용하여 고유벡터
Figure 112013042004143-pat00034
를 산출할 수 있다.Wherein the signal analyzer analyzes the non-singular matrix when the number of the sound sources is predetermined,
Figure 112013042004143-pat00025
Lt; / RTI >
Figure 112013042004143-pat00026
And the eigenvector
Figure 112013042004143-pat00027
, And the calculated non-specific matrix
Figure 112013042004143-pat00028
Using the Lagrange multiplier
Figure 112013042004143-pat00029
, And the calculated
Figure 112013042004143-pat00030
The optimal weight vector < RTI ID = 0.0 >
Figure 112013042004143-pat00031
, And the calculated
Figure 112013042004143-pat00032
And the eigenvector
Figure 112013042004143-pat00033
Using eigenvectors
Figure 112013042004143-pat00034
Can be calculated.

상기 신호 분석부는 상기 음원의 개수가 사전에 정해지지 않은 경우에는, Wherein the signal analyzing unit, when the number of the sound sources is not predetermined,

상기 비특이 행렬

Figure 112013042004143-pat00035
를 2p차원 커뮬런트 행렬
Figure 112013042004143-pat00036
를 이용하여 산출하고, 상기 산출된 비특이 행렬
Figure 112013042004143-pat00037
를 이용하여 라그랑주 승수
Figure 112013042004143-pat00038
를 산출하며, 상기 산출된
Figure 112013042004143-pat00039
를 이용하여 최적의 가중치 벡터
Figure 112013042004143-pat00040
를 산출하고, 상기 산출된
Figure 112013042004143-pat00041
및 상기 2p차원 커뮬런트 행렬
Figure 112013042004143-pat00042
를 이용하여 고유벡터
Figure 112013042004143-pat00043
를 산출할 수 있다.The non-singular matrix
Figure 112013042004143-pat00035
A 2p-dimensional convolution matrix
Figure 112013042004143-pat00036
, And the calculated non-specific matrix
Figure 112013042004143-pat00037
Using the Lagrange multiplier
Figure 112013042004143-pat00038
, And the calculated
Figure 112013042004143-pat00039
The optimal weight vector < RTI ID = 0.0 >
Figure 112013042004143-pat00040
, And the calculated
Figure 112013042004143-pat00041
And the 2p-dimensional convolution matrix
Figure 112013042004143-pat00042
Using eigenvectors
Figure 112013042004143-pat00043
Can be calculated.

상기 방향 추정부는 상기 2p차원 커뮬런트 행렬

Figure 112013042004143-pat00044
를 이용하여 산출된 비특이값들 중 가장 큰 비특이 값을 가지는 상기 고유벡터
Figure 112013042004143-pat00045
에 해당하는 상기 음원 신호의 방향각을 음원의 방향으로 추정할 수 있다.The direction estimating unit may calculate the 2p-dimensional convolution matrix
Figure 112013042004143-pat00044
The eigenvector having the largest non-singular value among the non-singular values calculated using the eigenvectors
Figure 112013042004143-pat00045
The direction angle of the sound source signal corresponding to the direction of the sound source.

신호를 감지하고, 상기 감지한 신호에 대한 감지 신호인 센서 신호를 출력하는 단계, 상기 출력한 센서 신호별로 상기 센서 신호의 통계학적 분포를 지시하는 통계학적 분포 데이터를 산출하고, 상기 산출된 통계학적 분포 데이터에서 상기 신호에 포함된 비고정(non-stationary) 신호인 음원 신호의 통계학적 분포를 지시하는 통계학적 분포 데이터를 추출하는 단계, 상기 추출된 통계학적 분포 데이터를 기초로 상기 음원 신호를 출력한 음원의 방향을 추정하는 단계를 포함할 수 있다.
Detecting a signal and outputting a sensor signal as a sensing signal for the sensed signal, calculating statistical distribution data indicating a statistical distribution of the sensor signal for each of the sensor signals output, Extracting statistical distribution data indicating a statistical distribution of a sound source signal which is a non-stationary signal contained in the signal from the distribution data, outputting the sound source signal based on the extracted statistical distribution data, And estimating the direction of one sound source.

본 발명에 따른 방향 추정 장치 및 방법에 의하면 언더디터민트 상황에서 신호가 출력되는 음원의 방향에 대한 공간적 고해상도를 가질 수 있다.According to the apparatus and method for estimating a direction according to the present invention, it is possible to have a high spatial resolution with respect to a direction of a sound source from which a signal is output in an under-dieter mint condition.

또한 언더디터민트 상황에서 신호가 출력되는 음원의 방향에 대한 높은 정확도를 가질 수 있다.It can also have a high degree of accuracy with respect to the direction of the sound source from which the signal is output in the Under Dieter Mint condition.

또한 언더디터민트 상황에서 음원의 개수를 더 많이 추출할 수 있다.
Also, the number of sound sources can be extracted more in Under Dieter Mint condition.

도 1은 본 발명의 일 실시예에 따른 방향 추정 장치를 도시한 구성도이다.
도 2은 본 발명의 일 실시에에 따른 방향 추정 장치를 도시한 블록도이다.
도 3은 본 발명의 일 실시예에 따른 방향 추정 장치의 제어부를 도시한 블록도이다.
도 4는 본 발명의 일 실시예에 따른 방향 추정 장치의 고해상도를 도시한 그래프이다.
도 5는 본 발명의 다른 실시예에 따른 방향 추정 장치의 고해상도를 도시한 그래프이다.
도 6은 본 발명의 또 다른 실시예에 따른 방향 추정 장치의 고해상도를 도시한 그래프이다.
도 7은 본 발명의 또 다른 실시예에 따른 방향 추정 장치의 고해상도를 도시한 그래프이다.
도 8은 본 발명의 일 실시예에 따른 방향 추정 장치의 정확도를 도시한 그래프이다.
도 9는 본 발명의 다른 실시예에 따른 방향 추정 장치의 정확도를 도시한 그래프이다.
도 10은 본 발명의 또 다른 실시예에 따른 방향 추정 장치의 정확도를 도시한 그래프이다.
도 11은 본 발명의 또 다른 실시예에 따른 방향 추정 장치의 정확도를 도시한 그래프이다.
도 12는 본 발명의 또 다른 실시예에 따른 방향 추정 장치의 정확도를 도시한 그래프이다.
도 13은 본 발명의 또 다른 실시예에 따른 방향 추정 장치의 정확도를 도시한 그래프이다.
도 14는 본 발명의 또 다른 실시예에 따른 방향 추정 장치의 정확도를 도시한 그래프이다.
도 15는 본 발명의 또 다른 실시예에 따른 방향 추정 장치의 정확도를 도시한 그래프이다.
도 16은 본 발명의 일 실시예에 따른 방향 추정 장치의 음원 추출 개수를 도시한 그래프이다.
도 17은 본 발명의 다른 실시예에 따른 방향 추정 장치의 음원 추출 개수를 도시한 그래프이다.
도 18은 본 발명의 또 다른 실시예에 따른 방향 추정 장치의 음원 추출 개수를 도시한 그래프이다.
도 19는 본 발명의 일 실시예 따른 방향 추정 방법을 도시한 순서도이다.
도 20은 도 19의 S140을 더 상세하게 도시한 순서도이다.
도 21은 도 19의 S150을 더 상세하게 도시한 순서도이다.
1 is a block diagram illustrating a direction estimating apparatus according to an embodiment of the present invention.
2 is a block diagram showing a direction estimating apparatus according to an embodiment of the present invention.
3 is a block diagram illustrating a controller of a direction estimating apparatus according to an embodiment of the present invention.
4 is a graph showing a high resolution of a direction estimating apparatus according to an embodiment of the present invention.
5 is a graph showing a high resolution of a direction estimating apparatus according to another embodiment of the present invention.
6 is a graph showing a high resolution of a direction estimating apparatus according to another embodiment of the present invention.
7 is a graph showing a high resolution of a direction estimating apparatus according to another embodiment of the present invention.
8 is a graph showing the accuracy of the direction estimating apparatus according to an embodiment of the present invention.
9 is a graph showing the accuracy of the direction estimating apparatus according to another embodiment of the present invention.
10 is a graph showing the accuracy of a direction estimating apparatus according to another embodiment of the present invention.
11 is a graph showing the accuracy of a direction estimating apparatus according to another embodiment of the present invention.
12 is a graph showing the accuracy of a direction estimating apparatus according to another embodiment of the present invention.
13 is a graph showing the accuracy of a direction estimating apparatus according to another embodiment of the present invention.
14 is a graph showing the accuracy of the direction estimating apparatus according to another embodiment of the present invention.
15 is a graph showing the accuracy of a direction estimating apparatus according to another embodiment of the present invention.
16 is a graph showing the number of excitation sources extracted by the direction estimating apparatus according to an embodiment of the present invention.
FIG. 17 is a graph illustrating the number of extracted sound sources of a direction estimating apparatus according to another embodiment of the present invention.
18 is a graph showing the number of excitation sources extracted by the direction estimating apparatus according to another embodiment of the present invention.
19 is a flowchart illustrating a direction estimation method according to an embodiment of the present invention.
20 is a flowchart showing S140 in Fig. 19 in more detail.
21 is a flowchart showing S150 in Fig. 19 in more detail.

도 1은 본 발명의 일 실시예에 따른 방향 추정 장치를 도시한 구성도이다.1 is a block diagram illustrating a direction estimating apparatus according to an embodiment of the present invention.

도 1을 참조하면, 방향 추정 장치(1)는 신호가 출력되는 방향(DOA: Direction of arrival)을 추정하는 장치이다. 방향 추정 장치(1)는 음원에서 출력하는 신호를 감지할 수 있다. 방향 추정 장치(1)는 감지된 신호로부터 비고정(non-stationary) 신호인 음원 신호를 추출하고, 추출된 음원 신호의 통계학적 분포를 산출할 수 있다. 방향 추정 장치(1)는 산출된 통계학적 분포를 기초로 음원 신호를 출력된 음원의 방향을 추정할 수 있다. 방향 추정 장치(1)는 레이더(radar), 소나(sonar) 및 생물의학(biomedical) 신호 추출 중 적어도 하나에 이용될 수 있다. Referring to FIG. 1, the direction estimating apparatus 1 is a device for estimating a direction (arrival of arrival) of a signal (DOA). The direction estimation apparatus 1 can sense a signal output from a sound source. The direction estimation apparatus 1 can extract a sound source signal which is a non-stationary signal from the sensed signal and calculate a statistical distribution of the extracted sound source signal. The direction estimation apparatus 1 can estimate the direction of the sound source outputting the sound source signal based on the calculated statistical distribution. The direction estimating device 1 may be used for at least one of radar, sonar, and biomedical signal extraction.

음원은 신호가 발생하는 근원일 수 있다. 음원은 자동차, 새, 비행기, 잠수함, 미사일, 및 사람 중 적어도 하나일 수 있다. 음원은 레이더 및 소나 시스템에서 자동차, 새, 비행기, 잠수함 및 미사일 중 적어도 하나일 수 있다. 또한 음원은 소리 인식 시스템에서 방 안에 있는 말하는 사람일 수 있다. 또한 음원은 소스(source)로 명명될 수 있다. The sound source may be the source from which the signal originates. The sound source may be at least one of a car, a bird, an airplane, a submarine, a missile, and a person. The sound source may be at least one of a car, a bird, an airplane, a submarine, and a missile in a radar and sonar system. The sound source may also be a speaking person in the room in a sound recognition system. Also, a sound source may be named as a source.

신호는 음원에서 출력하는 소리일 수 있다. 신호는 전자기파 신호, 생체 신호, 레이더 신호, 소나 신호 및 음파 중 적어도 하나일 수 있다. 신호는 소스 신호로 명명될 수 있다.The signal may be a sound output from a sound source. The signal may be at least one of an electromagnetic wave signal, a biological signal, a radar signal, a sonar signal, and a sound wave. The signal can be named as the source signal.

또한 음원 신호는 센서를 통해 들어온 센서 신호 중 잡음 신호를 제거한 신호일 수 있다.The sound source signal may be a signal obtained by removing a noise signal from a sensor signal input through the sensor.

방향 추정 장치(1)는 음원의 개수가 음원의 신호를 감지하는 센서의 개수보다 많을 경우에 동작할 수 있다. 상기 음원의 신호는 음원 신호 및 잡음 신호를 포함할 수 있다. 방향 추정 장치(1)는 비고정 신호인 음원 신호 및 고정(stationary) 신호인 잡음 신호(noise)를 수신할 수 있다. The direction estimating apparatus 1 can operate when the number of sound sources is larger than the number of sensors that sense the sound source signal. The signal of the sound source may include a sound source signal and a noise signal. The direction estimating apparatus 1 can receive a sound source signal which is a non-fixed signal and a noise signal which is a stationary signal.

음원 신호 및 잡음 신호는 평균이 0인 정규분포일 수 있다. 또한 음원 신호 및 잡음 신호는 가우시안(Gaussian) 분포, 비 가우시안(non-Gaussian) 분포, 라플라스(Laplace) 분포 및 빔포밍(beamforming) 분포 중 적어도 하나의 통계학적 분포를 포함할 수 있다. The source signal and the noise signal may be a normal distribution with an average of zero. The source signal and the noise signal may also include a statistical distribution of at least one of a Gaussian distribution, a non-Gaussian distribution, a Laplace distribution, and a beamforming distribution.

통계학적 분포는 가우시안 분포, 비 가우시안 분포, 라플라스 분포 및 빔포밍 분포와 같은 신호 특성일 수 있다.The statistical distribution may be a signal characteristic such as a Gaussian distribution, a non-Gaussian distribution, a Laplacian distribution, and a beamforming distribution.

방향 추정 장치(1)는 음원(110), 음원(120), 음원(130) 및 음원(140)에서 출력하는 신호를 감지하고 분석하여 음원의 방향을 추정할 수 있다. The direction estimating apparatus 1 can sense and analyze a signal output from the sound source 110, the sound source 120, the sound source 130, and the sound source 140 to estimate the direction of the sound source.

방향 추정 장치(1)는 음원(110), 음원(120), 음원(130) 및 음원(140)에서 출력하는 신호를 센서로 감지할 수 있다. 방향 추정 장치(1)는 센서의 개수가 음원의 개수보다 적을 수 있다. 센서는 레이더, 마이크로 폰(Microphone) 및 초음파 센서 중 적어도 하나일 수 있다. The direction estimating apparatus 1 can sense a signal output from the sound source 110, the sound source 120, the sound source 130, and the sound source 140 by a sensor. The direction estimating device 1 may have a smaller number of sensors than the number of sound sources. The sensor may be at least one of a radar, a microphone, and an ultrasonic sensor.

방향 추정 장치(1)는 감지된 신호를 디지털 신호로 변환할 수 있다. 방향 추정 장치(1)는 변환된 신호에 포함된 잡음 신호를 필터링할 수 있다. 방향 추정 장치(1)는 필터링된 신호인 음원 신호가 포함하고 있는 통계학적 분포를 분석하여 신호의 방향을 추정할 수 있다. The direction estimation apparatus 1 can convert the sensed signal into a digital signal. The direction estimation apparatus 1 can filter the noise signal included in the converted signal. The direction estimation apparatus 1 can estimate a direction of a signal by analyzing a statistical distribution included in a sound source signal which is a filtered signal.

방향 추정 장치(1)는 센서의 개수가 음원의 개수보다 적을 경우에도 음원 신호에 대한 공간적 해상도가 높을 수 있고, 방향의 추정 정확도가 높을 수 있다. Even if the number of sensors is smaller than the number of sound sources, the direction estimating apparatus 1 can have a high spatial resolution with respect to the sound source signal and high estimation accuracy of the direction.

공간적 해상도는 여러 개의 음원이 비슷한 방향각을 가질 경우, 얼마나 정확하게 음원의 방향각을 판단하는지를 말한다. 즉, 음원(110)이 30°에서 출력하고 음원(120)이 32°에서 출력했다고 가정할 때, 공간적 해상도가 높은 방향 추정 장치는 음원(110)과 음원(120)을 두 개의 음원으로 감지할 수 있다. 하지만 공간적 해상도가 낮은 방향 추정 장치는 음원(110)과 음원(120)을 하나의 음원으로 감지할 수 있다.
Spatial resolution refers to how accurately the direction angle of a sound source is determined when multiple sound sources have similar directional angles. That is, assuming that the sound source 110 outputs at 30 ° and the sound source 120 outputs at 32 °, the direction estimating device having a high spatial resolution detects the sound source 110 and the sound source 120 as two sound sources . However, the direction estimating apparatus having a low spatial resolution can sense the sound source 110 and the sound source 120 as a single sound source.

도 2는 본 발명의 일 실시예에 따른 방향 추정 장치를 도시한 블록도이다.2 is a block diagram illustrating a direction estimating apparatus according to an embodiment of the present invention.

도 2를 참조하면, 방향 추정 장치(1)는 신호가 포함하는 비고정 신호인 음원 신호 및 고정 신호인 잡음 신호를 감지하고, 감지된 신호의 방향을 추정할 수 있다. 방향 추정 장치(1)는 언더디터민드(underdetermined) 상황 즉, 음원의 개수가 센서의 개수보다 많은 상황에서 비고정 신호인 음원 신호를 방향 추정할 수 있다. Referring to FIG. 2, the direction estimating apparatus 1 may sense a sound source signal, which is a non-fixed signal included in a signal, and a noise signal, which is a fixed signal, and estimate the direction of the sensed signal. The direction estimating apparatus 1 can estimate a sound source signal which is an unfixed signal in an underdetermined situation, that is, in a situation where the number of sound sources is larger than the number of sensors.

방향 추정 장치(1)는 센서부(220), 제어부(240), 출력부(260) 및 저장부(280)를 포함할 수 있다. The direction estimating apparatus 1 may include a sensor unit 220, a control unit 240, an output unit 260, and a storage unit 280.

센서부(220)는 음원에서 발생된 신호를 감지할 수 있다. 즉, 센서부(220)는 비고정 신호인 음원 신호 및 고정 신호인 잡음 신호를 감지할 수 있다. 센서부(220)에서 감지하여 수신된 신호는 센서 신호라고 명명할 수 있다. 센서 신호는 음원 신호 및 잡음 신호를 포함한 신호일 수 있다.The sensor unit 220 can sense a signal generated from the sound source. That is, the sensor unit 220 can sense a sound source signal, which is an unfixed signal, and a noise signal, which is a fixed signal. The signal sensed by the sensor unit 220 and received may be referred to as a sensor signal. The sensor signal may be a signal including a sound source signal and a noise signal.

센서부(220)는 신호를 0°~ 180°범위에서 감지할 수 있다. 또한 센서부(220)는 움직이지않고 고정될 수 있다. 센서부는 적어도 2개의 센서를 포함할 수 있다. 또한 센서부(220)는 음원의 개수보다 센서의 개수가 같거나 적을 수 있다. 센서부(220)에서 감지한 신호는 각각의 센서들의 위치에 따라 시간 딜레이(delay)가 생길 수 있다. 센서부(220)는 레이더, 마이크로 폰 및 초음파 센서 중 적어도 하나의 센서를 포함할 수 있다. The sensor unit 220 can detect a signal in a range of 0 ° to 180 °. Also, the sensor unit 220 can be fixed without moving. The sensor unit may include at least two sensors. In addition, the sensor unit 220 may have the same or smaller number of sensors than the number of sound sources. The signal sensed by the sensor unit 220 may have a time delay depending on the position of each sensor. The sensor unit 220 may include at least one of a radar, a microphone, and an ultrasonic sensor.

제어부(240)는 센서부(220)의 센서가 각각 감지한 신호로부터 비고정 신호인 음원 신호를 추출하고, 추출된 음원 신호의 통계학적 분포를 산출할 수 있다. 제어부(240)는 상기 음원 신호별로 산출된 통계학적 분포 데이터들을 기초로 음원 신호를 출력한 음원의 방향을 추정할 수 있다. The control unit 240 may extract a sound source signal, which is a non-fixed signal, from the signals sensed by the sensors of the sensor unit 220, and may calculate a statistical distribution of the extracted sound source signals. The control unit 240 may estimate the direction of the sound source outputting the sound source signal based on the statistical distribution data calculated for each sound source signal.

제어부(240)는 아날로그 신호인 음원 신호 및 잡음 신호를 디지털 신호로 변환할 수 있다. 제어부(240)는 변환된 신호에 포함된 잡음 신호를 필터링할 수 있다. 제어부(240)는 필터링된 신호를 분석할 수 있다. 이때, 제어부(240)가 음원의 개수가 정해져 있을 경우와 정해지지 않은 경우에 따라 서로 다른 알고리즘을 이용할 수 있다. The control unit 240 may convert the sound source signal and the noise signal, which are analog signals, into a digital signal. The controller 240 may filter the noise signal included in the converted signal. The control unit 240 may analyze the filtered signal. At this time, the controller 240 may use different algorithms depending on whether the number of sound sources is fixed or not.

음원의 개수가 정해진 경우, 제어부(240)는 c-2p-KR-MUSIC 알고리즘을 이용할 수 있다. c-2p-KR-MUSIC 알고리즘은 2p-KR-MUSIC 알고리즘을 변형시켜서 공간적인 해상도를 높이고, 정확도를 높인 알고리즘일 수 있다.When the number of sound sources is determined, the control unit 240 can use the c-2p-KR-MUSIC algorithm. The c-2p-KR-MUSIC algorithm can be modified to increase the spatial resolution and accuracy by modifying the 2p-KR-MUSIC algorithm.

음원의 개수가 정해지지 않은 경우, 제어부(240)는 c-2p-KR-Capon 알고리즘을 이용할 수 있다. c-2p-KR-Capon 알고리즘은 2p-KR-Capon 알고리즘을 변형시켜서 공간적인 해상도를 높이고, 정확도를 높인 알고리즘일 수 있다.If the number of sound sources is not specified, the control unit 240 may use the c-2p-KR-Capon algorithm. The c-2p-KR-Capon algorithm can be modified to increase the spatial resolution and accuracy by modifying the 2p-KR-Capon algorithm.

제어부(240)는 산출된 통계학적 분포 데이터들을 기초로 음원의 방향을 추정할 수 있다. The controller 240 can estimate the direction of the sound source based on the calculated statistical distribution data.

통계학적 분포 데이터는 상기 음원 신호의 시간에 따른 변화 및 특성 변화를 포함하는 데이터일 수 있다. 특성 변화는 신호의 증폭, 주기 및 센서 간의 딜레이(delay)에 따른 오차 중 적어도 하나일 수 있다.The statistical distribution data may be data including a temporal change and a characteristic change of the sound source signal. The characteristic change may be at least one of the amplification of the signal, the period, and the error due to the delay between the sensors.

출력부(260)는 제어부(240)에서 추정된 음원 방향의 데이터를 출력할 수 있다. 출력부(260)는 모니터, 프로젝터, 액정 및 전방 유리에 화면을 출력하는 헤드 업 디스플레이(head-up display) 중 적어도 하나일 수 있다.The output unit 260 can output the data of the sound source direction estimated by the control unit 240. The output unit 260 may be at least one of a monitor, a projector, a liquid crystal, and a head-up display for outputting a screen to the windshield.

저장부(280)는 제어부(240)에서 사용되는 음원 방향 추정 알고리즘이 저장될 수 있다. 또한 저장부(280)는 신호의 2p차원의 통계학적 특성에 대한 데이터가 저장될 수 있다.The storage unit 280 may store a sound source direction estimation algorithm used in the control unit 240. [ The storage unit 280 may also store data on the 2p-dimensional statistical characteristics of the signal.

따라서, 음원 방향 장치(1)는 센서부(220)의 각각의 센서로 감지한 신호를 제어부(240)에서 통계학적인 분포 데이터를 이용하여 상기 센서들의 데이터를 비교 분석할 수 있다. 음원 방향 장치(1)는 상기 비교 분석된 데이터를 이용하여 음원의 방향을 추정할 수 있다.
Accordingly, the sound source directional device 1 can compare and analyze the data of the sensors by using the statistical distribution data in the control unit 240 using the signals sensed by the respective sensors of the sensor unit 220. The sound source directional device 1 can estimate the direction of the sound source using the comparative analyzed data.

도 3은 본 발명의 일 실시예에 따른 방향 추정 장치의 제어부를 도시한 블록도이다.3 is a block diagram illustrating a controller of a direction estimating apparatus according to an embodiment of the present invention.

도 3을 참조하면, 제어부(240)는 신호를 디지털 신호로 변환하고, 변환된 디지털 신호의 잡음 신호를 제거할 수 있다. 제어부(240)는 제거된 디지털 신호의 통계학적 분포를 이용하여 디지털 신호의 음원 개수 및 방향에 대한 공간 스펙트럼을 산출할 수 있다. 제어부(240)는 산출된 디지털 신호의 공간 스펙트럼의 피크를 음원의 방향인 것으로 추정할 수 있다.Referring to FIG. 3, the controller 240 may convert a signal to a digital signal and remove a noise signal of the converted digital signal. The controller 240 may calculate the spatial spectrum of the number of sound sources and the direction of the digital signal using the statistical distribution of the removed digital signals. The control unit 240 can estimate that the peak of the spatial spectrum of the calculated digital signal is the direction of the sound source.

전처리부(320)는 아날로그 신호를 디지털 신호로 변환할 수 있다. 전처리부(320)는 아날로그 디지털 변환기(ADC: Analog-to-Digital Conversion)를 포함할 수 있다. ADC는 음원 신호 및 잡음 신호를 디지털 신호로 변환할 수 있다. The preprocessing unit 320 may convert an analog signal to a digital signal. The preprocessing unit 320 may include an analog-to-digital conversion (ADC). The ADC can convert the source signal and the noise signal into a digital signal.

전처리부(320)는 균일하게 떨어진 거리

Figure 112013042004143-pat00046
에 이격된 센서
Figure 112013042004143-pat00047
과 균일 선형 배열(ULA: Uniform Linear Array)을 고려할 수 있다. 전처리부(320)는 광대역 음원
Figure 112013042004143-pat00048
Figure 112013042004143-pat00049
Figure 112013042004143-pat00050
Figure 112013042004143-pat00051
인 경우, m 번째 센서에서 수신된 센서 신호
Figure 112013042004143-pat00052
로 [수학식 1]처럼 모델링을 할 수 있다.The preprocessing unit 320 uniformly calculates the distance
Figure 112013042004143-pat00046
Sensor spaced
Figure 112013042004143-pat00047
And a uniform linear array (ULA) can be considered. The preprocessing unit 320 includes a pre-
Figure 112013042004143-pat00048
Figure 112013042004143-pat00049
end
Figure 112013042004143-pat00050
Figure 112013042004143-pat00051
, The sensor signal received from the m-th sensor
Figure 112013042004143-pat00052
The modeling can be performed as in Equation (1).

Figure 112013042004143-pat00053

Figure 112013042004143-pat00054
Figure 112013042004143-pat00055
는 미시간 전파 효과에 의한 감쇠 계수이다. 전처리부(320)는 m 번째 센서에서 i 번째 음원 신호의 첫 번째 센서
Figure 112013042004143-pat00056
로부터 전파 시간 지연을 할 수 있다.
Figure 112013042004143-pat00057
는 m 번째 센서에서의 잡음 신호다. 전처리부(320)는 짧은 시간 이산 푸리에 변환(STDFT: Shot-Time Discrete Fourier Transform)을 이용하여
Figure 112013042004143-pat00058
의 샘플링 속도를
Figure 112013042004143-pat00059
로 만들 수 있다. 전처리부(320)는 k번째 주파수 빈(frequency bin) 및 시간 n에서 m센서의 주파수 요소를 [수학식 2]로 표현할 수 있다.
Figure 112013042004143-pat00054
Wow
Figure 112013042004143-pat00055
Is the damping coefficient due to the Michigan radio wave effect. The preprocessing unit 320 receives the first sensor signal of the i-th sound source signal from the m-
Figure 112013042004143-pat00056
The propagation time delay can be performed.
Figure 112013042004143-pat00057
Is the noise signal at the mth sensor. The preprocessing unit 320 uses a short time discrete Fourier transform (STDFT)
Figure 112013042004143-pat00058
The sampling rate of
Figure 112013042004143-pat00059
. The preprocessing unit 320 can express the frequency component of the m sensor at the k-th frequency bin and the time n by the following equation (2).

Figure 112013042004143-pat00060

Figure 112013042004143-pat00061
Figure 112013042004143-pat00062
의 이산 시간 수신 센서 신호이다.
Figure 112013042004143-pat00063
는 윈도우(window) 순서이고,
Figure 112013042004143-pat00064
는 DFT(Discrete Fourier Transform) 지점의 개수이다.
Figure 112013042004143-pat00065
Figure 112013042004143-pat00066
는 각각
Figure 112013042004143-pat00067
Figure 112013042004143-pat00068
의 STDFT이다. 전처리부(320)는 센서 배열 구멍의 크기가 신호부터 센서 배열까지의 거리에 비해 훨씬 작고 멀어지면 [수학식3]과 같이
Figure 112013042004143-pat00069
를 정의할 수 있다.
Figure 112013042004143-pat00061
The
Figure 112013042004143-pat00062
Is a discrete time receiving sensor signal of
Figure 112013042004143-pat00063
Is the window order,
Figure 112013042004143-pat00064
Is the number of DFT (Discrete Fourier Transform) points.
Figure 112013042004143-pat00065
And
Figure 112013042004143-pat00066
Respectively
Figure 112013042004143-pat00067
And
Figure 112013042004143-pat00068
Lt; / RTI > When the size of the sensor array hole is much smaller than the distance from the signal to the sensor array and moves away from the sensor array,
Figure 112013042004143-pat00069
Can be defined.

Figure 112013042004143-pat00070

Figure 112013042004143-pat00071
는 i번째 신호의 DOA이고,
Figure 112013042004143-pat00072
는 신호의 속도이다. 전처리부(320)는 만약
Figure 112013042004143-pat00073
= 1이면, k 번째 주파수 빈에서
Figure 112013042004143-pat00074
의 많은 배열 벡터를 [수학식 4]로 정의할 수 있다.
Figure 112013042004143-pat00071
Is the DOA of the i < th > signal,
Figure 112013042004143-pat00072
Is the speed of the signal. The preprocessing unit 320
Figure 112013042004143-pat00073
= 1, then in the k-th frequency bin
Figure 112013042004143-pat00074
Can be defined by [Equation (4)].

Figure 112013042004143-pat00075

[수학식 4]에서

Figure 112013042004143-pat00076
이다. In Equation (4)
Figure 112013042004143-pat00076
to be.

음원 신호는 평균이 0인 정규분포이고 비고정 신호이며, 가우시안 분포 또는 비 가우시안 분포가 될 수 있다. 음원 신호는 서로 독립적일 수 있다. 잡음 신호는 평균이 0인 정규분포이고 고정 신호이며, 가우스 분포 또는 비 가우시안 분포가 될 수 있다. 잡음 신호는 공간적인 상관성(correlated) 또는 비 상관성(uncorrelated)이 있을 수 있다. 음원 신호 및 잡음 신호는 서로 독립적일 수 있다.The source signal is a normal distribution with an average of zero and is an unfixed signal, which can be a Gaussian distribution or a non-Gaussian distribution. The source signals may be independent of each other. The noise signal is a normal distribution with a mean of zero, a fixed signal, and may be a Gaussian or a non-Gaussian distribution. The noise signal may be spatially correlated or uncorrelated. The sound source signal and the noise signal may be independent of each other.

전처리부(320)는 변환된 신호의 잡음 신호를 필터링할 수 있다. 전처리부(320)는 저역 통과 필터(low pass filter) 및 대역 통과 필터(band pass filter) 중 적어도 하나를 포함할 수 있다.The preprocessing unit 320 may filter the noise signal of the converted signal. The preprocessing unit 320 may include at least one of a low pass filter and a band pass filter.

Figure 112013042004143-pat00077
는 L차원의 복잡한 임의의 벡터이다.
Figure 112013042004143-pat00078
는 L-길이 벡터의 원소의 지수인 2p의 길이 벡터이다.
Figure 112013042004143-pat00079
Figure 112013042004143-pat00080
Figure 112013042004143-pat00081
이다.
Figure 112013042004143-pat00082
Figure 112013042004143-pat00083
Figure 112013042004143-pat00084
의 차원이다. 전처리부(320)는
Figure 112013042004143-pat00085
의 2p 차원 커뮬런트(cumulant)를 Leonov - Shiryaev에 기반으로 [수학식 5]로 정의할 수 있다.
Figure 112013042004143-pat00077
Is a complex arbitrary vector of L dimension.
Figure 112013042004143-pat00078
Is a length vector of 2p which is an exponent of an element of the L-length vector.
Figure 112013042004143-pat00079
The
Figure 112013042004143-pat00080
Figure 112013042004143-pat00081
to be.
Figure 112013042004143-pat00082
of
Figure 112013042004143-pat00083
The
Figure 112013042004143-pat00084
Of the total. The preprocessing unit 320
Figure 112013042004143-pat00085
Can be defined as [Equation 5] based on Leonov-Shiryaev.

Figure 112013042004143-pat00086

전처리부(320)는

Figure 112013042004143-pat00087
Figure 112013042004143-pat00088
Figure 112013042004143-pat00089
집합에서 모든 분할(partitions)이라고 설명할 수 있다. 또한 전처리부(320)는
Figure 112013042004143-pat00090
를 예상을 나타내는데 사용할 수 있다.
Figure 112013042004143-pat00091
Figure 112013042004143-pat00092
이고, 그렇지 않으면
Figure 112013042004143-pat00093
Figure 112013042004143-pat00094
와 같이
Figure 112013042004143-pat00095
이고,
Figure 112013042004143-pat00096
가 될 수 있다. *는 결합 연산자를 나타낼 수 있다.
Figure 112013042004143-pat00097
의 총 차원 집합은
Figure 112013042004143-pat00098
이고, 집합의 원소의 개수인
Figure 112013042004143-pat00099
Figure 112013042004143-pat00100
일 수 있다.
Figure 112013042004143-pat00101
의 각 원소는
Figure 112013042004143-pat00102
의 지수를 생성할 수 있습니다.
Figure 112013042004143-pat00103
Figure 112013042004143-pat00104
이고,
Figure 112013042004143-pat00105
일 수 있다.
Figure 112013042004143-pat00106
Figure 112013042004143-pat00107
번째 원소는
Figure 112013042004143-pat00108
로 나타낼 수 있다.
Figure 112013042004143-pat00109
Figure 112013042004143-pat00110
의 2p 길이 L항을 나타낼 수 있다. 전처리부(320)는 시간 n에서
Figure 112013042004143-pat00111
와 함께 k 번째 주파수 빈인
Figure 112013042004143-pat00112
의 수신 센서 신호 벡터는 [수학식 6]으로 나타낼 수 있다. The preprocessing unit 320
Figure 112013042004143-pat00087
To
Figure 112013042004143-pat00088
of
Figure 112013042004143-pat00089
It can be described as all partitions in a set. Also, the preprocessing unit 320
Figure 112013042004143-pat00090
Can be used to express expectations.
Figure 112013042004143-pat00091
The
Figure 112013042004143-pat00092
, Otherwise
Figure 112013042004143-pat00093
And
Figure 112013042004143-pat00094
together with
Figure 112013042004143-pat00095
ego,
Figure 112013042004143-pat00096
. * Can represent a join operator.
Figure 112013042004143-pat00097
The total dimension set of
Figure 112013042004143-pat00098
, And the number of elements of the set
Figure 112013042004143-pat00099
The
Figure 112013042004143-pat00100
Lt; / RTI >
Figure 112013042004143-pat00101
Each element of
Figure 112013042004143-pat00102
You can generate an exponent of.
Figure 112013042004143-pat00103
The
Figure 112013042004143-pat00104
ego,
Figure 112013042004143-pat00105
Lt; / RTI >
Figure 112013042004143-pat00106
of
Figure 112013042004143-pat00107
The second element
Figure 112013042004143-pat00108
.
Figure 112013042004143-pat00109
The
Figure 112013042004143-pat00110
Lt; RTI ID = 0.0 > L < / RTI > The preprocessing unit 320 performs a pre-
Figure 112013042004143-pat00111
Lt; RTI ID = 0.0 > k <
Figure 112013042004143-pat00112
Can be expressed by the following equation (6). &Quot; (6) "

Figure 112013042004143-pat00113

전처리부(320)는

Figure 112013042004143-pat00114
를 모든 요소 것들의 2p-길이 벡터로 할 수 있다.
Figure 112013042004143-pat00115
Figure 112013042004143-pat00116
는 각각 시간
Figure 112013042004143-pat00117
에서
Figure 112013042004143-pat00118
번째 주파수 빈의 음원 신호 벡터의 2p차원 커뮬런트 행렬 및 잡음 신호 벡터일 수 있다.
Figure 112013042004143-pat00119
번째 주파수 빈의 음원 신호 벡터의 2p차원 커뮬런트 행렬인
Figure 112013042004143-pat00120
Figure 112013042004143-pat00121
이다.
Figure 112013042004143-pat00122
번째 주파수 빈의 잡음 신호 벡터인
Figure 112013042004143-pat00123
Figure 112013042004143-pat00124
이다. The preprocessing unit 320
Figure 112013042004143-pat00114
Can be a 2p-length vector of all elements.
Figure 112013042004143-pat00115
And
Figure 112013042004143-pat00116
Respectively,
Figure 112013042004143-pat00117
in
Figure 112013042004143-pat00118
Th frequency bin may be a 2p-dimensional convolution matrix of the excitation vector of the ith frequency bin and a noise signal vector.
Figure 112013042004143-pat00119
The 2p-dimensional convolution matrix of the excitation vector of the ith frequency bin
Figure 112013042004143-pat00120
The
Figure 112013042004143-pat00121
to be.
Figure 112013042004143-pat00122
The noise signal vector of the ith frequency bin
Figure 112013042004143-pat00123
The
Figure 112013042004143-pat00124
to be.

전처리부(320)는

Figure 112013042004143-pat00125
Figure 112013042004143-pat00126
일 때,
Figure 112013042004143-pat00127
라고 할 수 있다. 전처리부(320)는 비고정 음원 신호의 경우에는 배열
Figure 112013042004143-pat00128
을 시간
Figure 112013042004143-pat00129
에서 열(column)같이 [수학식 6]에서 정의할 수 있다. 지수
Figure 112013042004143-pat00130
는 0부터
Figure 112013042004143-pat00131
까지 오름차순이고, 고정부분
Figure 112013042004143-pat00132
를 위해 시간
Figure 112013042004143-pat00133
에 열을 스택(stack)할 수 있다. The preprocessing unit 320
Figure 112013042004143-pat00125
end
Figure 112013042004143-pat00126
when,
Figure 112013042004143-pat00127
. The preprocessing unit 320, in the case of an unfixed excitation signal,
Figure 112013042004143-pat00128
Time
Figure 112013042004143-pat00129
Can be defined in Equation (6) as a column in Equation (6). Indices
Figure 112013042004143-pat00130
From 0
Figure 112013042004143-pat00131
Ascending order,
Figure 112013042004143-pat00132
Time for
Figure 112013042004143-pat00133
You can stack the columns in the stack.

신호 분석부(340)는 전처리부(320)에서 변환된 음원 신호의 통계학적 분포를 산출할 수 있다. 또한 신호 분석부(340)는 2차원 통계학적 분포 데이터를 포함한 높은 2p 차원의 통계학적 분포 데이터를 이용하여 음원 신호가 포함하고 있는 통계학적 분포 데이터를 분석하여 산출할 수 있다. The signal analyzer 340 may calculate the statistical distribution of the sound source signal converted by the preprocessor 320. Also, the signal analyzer 340 can analyze statistical distribution data included in the sound source signal using the high 2p-dimensional statistical distribution data including the two-dimensional statistical distribution data.

신호 분석부(340)는 음원의 개수가 정해지고, 정해지지 않은 경우에 따라 다른 알고리즘을 이용하여 신호 분석을 할 수 있다. 신호 분석부(340)는 음원의 개수가 정해진 경우에는 MUSIC 알고리즘 기반의 c-2p-MUSIC 알고리즘을 이용할 수 있다. 신호 분석부(340)는 음원의 개수가 정해지지 않은 경우에는 Capon 알고리즘 기반의 c-2p-Canpon 알고리즘을 이용할 수 있다.The signal analyzer 340 can analyze the signal using a different algorithm depending on the number of sound sources and the number of sound sources. The signal analyzer 340 can use the c-2p-MUSIC algorithm based on the MUSIC algorithm when the number of sound sources is determined. The signal analyzer 340 can use the c-2p-Canon algorithm based on the Capon algorithm when the number of sound sources is not determined.

신호 분석부(340)는

Figure 112013042004143-pat00134
번째 주파수 빈의 2p차원 커뮬런트 행렬을 [수학식 7]로 정의할 수 있다. [수학식 7]의 신호는 통계학적 분포를 나타내고 있고, 잡음 신호를 포함할 수 있다.The signal analysis unit 340
Figure 112013042004143-pat00134
The 2p-dimensional common matrix of the ith frequency bin can be defined as Equation (7). The signal of Equation (7) represents a statistical distribution and may include a noise signal.

Figure 112013042004143-pat00135

여기서,

Figure 112013042004143-pat00136
,here,
Figure 112013042004143-pat00136
,

Figure 112013042004143-pat00137
,
Figure 112013042004143-pat00137
,

Figure 112013042004143-pat00138
Figure 112013042004143-pat00139
,
Figure 112013042004143-pat00138
Figure 112013042004143-pat00139
,

Figure 112013042004143-pat00140
,
Figure 112013042004143-pat00140
,

Figure 112013042004143-pat00141
,
Figure 112013042004143-pat00141
,

Figure 112013042004143-pat00142
,
Figure 112013042004143-pat00142
,

Figure 112013042004143-pat00143
And

Figure 112013042004143-pat00144
이다.
Figure 112013042004143-pat00144
to be.

신호 분석부(340)는 감지된 센서 신호의

Figure 112013042004143-pat00145
를 고정 부분을 포함하고 있다고 가정한다. 신호 분석부(340)는
Figure 112013042004143-pat00146
Figure 112013042004143-pat00147
에 의해 지수로 주어진
Figure 112013042004143-pat00148
의 고정 부분을 위해
Figure 112013042004143-pat00149
을 모든 고정 부분에서 고정 길이로 설정할 수 있다. 신호 분석부(340)는
Figure 112013042004143-pat00150
Figure 112013042004143-pat00151
번째 부분의
Figure 112013042004143-pat00152
에서 로컬(로컬 고정) 2차원 커뮬런트 행렬로 나타낼 수 있다. 신호 분석부(340)는 [수학식 7]에서
Figure 112013042004143-pat00153
는 k 번째 주파수 빈의 가상 배열 매니폴드(manifold) 벡터를 나타낼 수 있다. 또한
Figure 112013042004143-pat00154
Figure 112013042004143-pat00155
의 i번째 열은 k 번째 주파수 빈에서
Figure 112013042004143-pat00156
의 가상 배열는 매니폴드 벡터일 수 있고, p차원의 함수일 수 있다. The signal analyzer 340 analyzes the sensed signal
Figure 112013042004143-pat00145
Is assumed to include a fixed portion. The signal analysis unit 340
Figure 112013042004143-pat00146
And
Figure 112013042004143-pat00147
Given by exponent
Figure 112013042004143-pat00148
For the fixed part of
Figure 112013042004143-pat00149
Can be set to a fixed length at all fixed portions. The signal analysis unit 340
Figure 112013042004143-pat00150
To
Figure 112013042004143-pat00151
Part of
Figure 112013042004143-pat00152
Can be represented as a local (locally fixed) two-dimensional com- plement matrix. The signal analyzing unit 340 obtains the following equation (7)
Figure 112013042004143-pat00153
May represent a virtual array manifold vector of the k-th frequency bin. Also
Figure 112013042004143-pat00154
And
Figure 112013042004143-pat00155
I < th > column of the <
Figure 112013042004143-pat00156
May be a manifold vector and may be a p-dimensional function.

신호 분석부(340)는 고정 가우시안의 잡음 신호를

Figure 112013042004143-pat00157
이라고 표현할 수 있고, p > 1일 때
Figure 112013042004143-pat00158
Figure 112013042004143-pat00159
일 수 있다. 또한
Figure 112013042004143-pat00160
Figure 112013042004143-pat00161
는 모두 0인 영 행렬이다. The signal analyzer 340 receives the fixed Gaussian noise signal
Figure 112013042004143-pat00157
, And when p> 1
Figure 112013042004143-pat00158
And
Figure 112013042004143-pat00159
Lt; / RTI > Also
Figure 112013042004143-pat00160
of
Figure 112013042004143-pat00161
Is a zero matrix with all zeros.

신호 분석부(340)는 p = 1일 때,

Figure 112013042004143-pat00162
의 차원 감소 절차를 직교 열행렬 및 반데르몬데(Vandermonde) 행렬의 곱으로 표현할 수 있고, KR 부공간 기반의 알고리즘에 사용할 수 있다. KR 부공간 기반의 알고리즘은 방향을 추정하는 차원 감소 절차를 제안 알고리즘의 복잡성을 줄여줄 수 있다.When p = 1, the signal analysis unit 340 calculates
Figure 112013042004143-pat00162
Can be expressed as the product of the orthogonal column matrix and the Vandermonde matrix, and can be used for the KR subspace based algorithm. KR subspace based algorithms can reduce the complexity of the proposed algorithm by reducing the dimensionality of the directions.

신호 분석부(340)는 KR 부공간 기반 알고리즘으로, 고정 신호인 잡음 신호를 위해 [수학식 7]의

Figure 112013042004143-pat00163
(
Figure 112013042004143-pat00164
Figure 112013042004143-pat00165
)를 직교 보완 투영 행렬인
Figure 112013042004143-pat00166
Figure 112013042004143-pat00167
를 투영하여 제거할 수 있습니다.The signal analyzer 340 is a KR subspaces-based algorithm, and uses the following Equation (7) for a noise signal as a fixed signal
Figure 112013042004143-pat00163
(
Figure 112013042004143-pat00164
Figure 112013042004143-pat00165
) As an orthogonal complementary projection matrix
Figure 112013042004143-pat00166
on
Figure 112013042004143-pat00167
Can be projected and removed.

Figure 112013042004143-pat00168

[수학식 8]의

Figure 112013042004143-pat00169
Figure 112013042004143-pat00170
로 나타낼 수 있다. 또한
Figure 112013042004143-pat00171
Figure 112013042004143-pat00172
는 각각
Figure 112013042004143-pat00173
행렬 및 b-길이 열 벡터이고 해당 요소가 모두 1이다.In Equation (8)
Figure 112013042004143-pat00169
The
Figure 112013042004143-pat00170
. Also
Figure 112013042004143-pat00171
And
Figure 112013042004143-pat00172
Respectively
Figure 112013042004143-pat00173
Matrix and b-length column vectors and all the elements are 1s.

Figure 112013042004143-pat00174

Figure 112013042004143-pat00175

[수학식 9]의

Figure 112013042004143-pat00176
및 [수학식 10]의
Figure 112013042004143-pat00177
는 순위와 범위의 공간을 나타낼 수 있다. In Equation (9)
Figure 112013042004143-pat00176
And " (10) "
Figure 112013042004143-pat00177
Can represent the space of rank and range.

신호 분석부(340)는

Figure 112013042004143-pat00178
의 켤레전치(conjugate transpose)로
Figure 112013042004143-pat00179
를 곱할 수 있다. 이를 통해, 신호 분석부(340)는 잡음 신호 제거 및 치수 조정된 2차원 커뮬런트 행렬을 [수학식 11]과 같이 정의할 수 있다.The signal analysis unit 340
Figure 112013042004143-pat00178
With a conjugate transpose of
Figure 112013042004143-pat00179
Lt; / RTI > In this way, the signal analyzer 340 can define a two-dimensional convolution matrix with noise signal elimination and dimension adjustment as in Equation (11).

Figure 112013042004143-pat00180

Figure 112013042004143-pat00181

Figure 112013042004143-pat00182

신호 분석부(340)는 [수학식11]에서

Figure 112013042004143-pat00183
는 반드시 대각선이 아니지만 대칭이고,
Figure 112013042004143-pat00184
에 충족할 수 있다. [수학식 12] 및 [수학식 13]은 [수학식 11]을 적용하여 순위 및 범위를 나타낼 수 있다.The signal analyzing unit 340 calculates a signal
Figure 112013042004143-pat00183
Are not necessarily diagonal but symmetrical,
Figure 112013042004143-pat00184
. ≪ / RTI > [Equation 12] and [Equation 13] can be expressed in rank and range by applying [Equation 11].

신호 분석부(340)는 한계 최적화 문제(COP: constrained optimization problem)에 대해 [수학식 11]의

Figure 112013042004143-pat00185
를 이용할 수 있다. 신호 분석부(340)는 COP의 해결책(solution)을 방향각(look direction)에서 가중치 벡터 이득의 제곱을 극대화하는 것으로 할 수 있다. The signal analyzing unit 340 may be configured to analyze the constrained optimization problem (COP)
Figure 112013042004143-pat00185
Can be used. The signal analyzer 340 may maximize the square of the weight vector gain in the direction of the look of the COP solution.

신호 분석부(340)는 COP에 대한 제약 조건을 해결책 사이의 내적의 제곱의 합을 제한할 수 있다. 신호 분석부(340)는 각각의 고유 벡터인

Figure 112013042004143-pat00186
Figure 112013042004143-pat00187
는 2p 차원 음원 신호의 부공간 및 2p 차원 잡음 신호의 부공간에 참조할 수 있다. 신호 분석부(340)는
Figure 112013042004143-pat00188
을 널(NULL) 공간으로 나타낼 수 있다. 신호 분석부(340)는 제약 조건에서 음원의 개수에 대한 가용성을 조절하고, 제약 조건의 특정 매개 변수 설정에 따라 해결책을 세 가지 공간 중 하나에 걸쳐 제한할 수 있다. 상기 세 가지 공간은
Figure 112013042004143-pat00189
,
Figure 112013042004143-pat00190
Figure 112013042004143-pat00191
Figure 112013042004143-pat00192
일 수 있다. The signal analysis unit 340 may limit the constraint on the COP to the sum of squares of the inner product between the solutions. The signal analyzing unit 340 obtains the respective eigenvectors
Figure 112013042004143-pat00186
And
Figure 112013042004143-pat00187
Can refer to the subspace of the 2p-dimensional sound source signal and the subspace of the 2p-dimensional noise signal. The signal analysis unit 340
Figure 112013042004143-pat00188
Can be represented as a NULL space. The signal analyzer 340 may adjust the availability of the number of sound sources in the constraint condition and limit the solution over one of the three spaces according to the specific parameter setting of the constraint condition. The three spaces
Figure 112013042004143-pat00189
,
Figure 112013042004143-pat00190
And
Figure 112013042004143-pat00191
Wow
Figure 112013042004143-pat00192
Lt; / RTI >

신호 분석부(340)는 COP를 [수학식 14]로 나타낼 수 있다.The signal analyzing unit 340 can express the COP by Equation (14).

Figure 112013042004143-pat00193

Figure 112013042004143-pat00194

[수학식 15]는 [수학식 14]의 조건을 나타낼 수 있다.Equation (15) can represent the condition of (14).

Figure 112013042004143-pat00195

Figure 112013042004143-pat00196

[수학식 16]는 I를 알고 있을 때의 수학식이고, [수학식 17]는 I를 모르고 있을 때의 수학식이다. [수학식 16] 및 [수학식 17]의

Figure 112013042004143-pat00197
Figure 112013042004143-pat00198
단위 행렬을 나타낼 수 있다.[Equation 16] is a mathematical expression when I is known, and [Equation 17] is a mathematical expression when I is unknown. [Equation 16] and [Equation 17]
Figure 112013042004143-pat00197
The
Figure 112013042004143-pat00198
A unit matrix can be represented.

신호 분석부(340)는 [수학식 16]를 이용하여

Figure 112013042004143-pat00199
Figure 112013042004143-pat00200
Figure 112013042004143-pat00201
의 고유값 분해(EVD: eigenvalue decomposition)로 산출할 수 있다.The signal analyzing unit 340 uses Equation (16)
Figure 112013042004143-pat00199
And
Figure 112013042004143-pat00200
To
Figure 112013042004143-pat00201
Can be calculated by eigenvalue decomposition (EVD).

Figure 112013042004143-pat00202

신호 분석부(340)는

Figure 112013042004143-pat00203
Figure 112013042004143-pat00204
은 각각
Figure 112013042004143-pat00205
Figure 112013042004143-pat00206
를 영이 아닌 고유값과 영인 고유값에 해당하는 고유 벡터로 구성할 수 있다. 신호 분석부(340)는
Figure 112013042004143-pat00207
를 대각선을 따라 영이 아닌 고유값을 가질 수 있다.
Figure 112013042004143-pat00208
Figure 112013042004143-pat00209
Figure 112013042004143-pat00210
이고
Figure 112013042004143-pat00211
이면,
Figure 112013042004143-pat00212
이다.
Figure 112013042004143-pat00213
는 k 번째 주파수의 가중치 벡터이고,
Figure 112013042004143-pat00214
는 임의의 영 아닌 실제 상수이다. The signal analysis unit 340
Figure 112013042004143-pat00203
And
Figure 112013042004143-pat00204
Respectively
Figure 112013042004143-pat00205
And
Figure 112013042004143-pat00206
Can be composed of an eigenvector corresponding to a non-zero eigenvalue and a non-zero eigenvalue. The signal analysis unit 340
Figure 112013042004143-pat00207
Lt; RTI ID = 0.0 > non-zero < / RTI > along the diagonal.
Figure 112013042004143-pat00208
The
Figure 112013042004143-pat00209
Figure 112013042004143-pat00210
ego
Figure 112013042004143-pat00211
If so,
Figure 112013042004143-pat00212
to be.
Figure 112013042004143-pat00213
Is the weight vector of the k-th frequency,
Figure 112013042004143-pat00214
Is an arbitrary non-zero real constant.

신호 분석부(340)는 제약된 [수학식 15]를 음원 개수의 가용성을 조건으로 할 수 있다. 신호 분석부(340)는 [수학식 16] 또는 [수학식 17]의

Figure 112013042004143-pat00215
를 비특이(non-singular)로 나타낼 수 있다. 신호 분석부(340)는
Figure 112013042004143-pat00216
의 EVD에서 변수
Figure 112013042004143-pat00217
Figure 112013042004143-pat00218
Figure 112013042004143-pat00219
에 모두 해당하는 강점(고유값) 관련된 고유 벡터로 결정할 수 있다. 신호 분석부(340)는 COP를 라그랑주 승수(Lagrange multiplier)인
Figure 112013042004143-pat00220
를 이용하여 해결할 수 있다. [수학식 18]은 COP의 해결책을 보여줄 수 있다.The signal analyzing unit 340 can limit (15) the availability of the number of sound sources. The signal analyzing unit 340 may be configured to perform the signal analysis of Equation (16) or Equation (17)
Figure 112013042004143-pat00215
Can be represented as non-singular. The signal analysis unit 340
Figure 112013042004143-pat00216
Variables in EVD of
Figure 112013042004143-pat00217
To
Figure 112013042004143-pat00218
And
Figure 112013042004143-pat00219
Can be determined as the eigenvectors related to all of the strengths (eigenvalues) associated with the eigenvectors. The signal analyzer 340 converts the COP into a Lagrange multiplier
Figure 112013042004143-pat00220
. ≪ / RTI > Equation (18) can show a solution of COP.

Figure 112013042004143-pat00221

[수학식 18]에서

Figure 112013042004143-pat00222
Figure 112013042004143-pat00223
이고,
Figure 112013042004143-pat00224
Figure 112013042004143-pat00225
의 편도 함수(partial derivative)일 수 있다. In Equation 18,
Figure 112013042004143-pat00222
The
Figure 112013042004143-pat00223
ego,
Figure 112013042004143-pat00224
silver
Figure 112013042004143-pat00225
And may be a partial derivative of.

Figure 112013042004143-pat00226

[수학식 19]은 영(0) 위의 변화도(gradient)을 설정한다. 또한 [수학식 19]은 최적의 가중치 벡터

Figure 112013042004143-pat00227
를 충족시킬 수 있다.[Equation 19] sets a gradient on zero (0). Equation (19) also shows that the optimal weight vector
Figure 112013042004143-pat00227
Can be satisfied.

Figure 112013042004143-pat00228

[수학식 20]의

Figure 112013042004143-pat00229
의 평균은
Figure 112013042004143-pat00230
Figure 112013042004143-pat00231
의 최대 일반화된 고유값과 관련된 일반화된 고유 벡터에 의해 주어질 수 있다.
Figure 112013042004143-pat00232
는 반전할 수 있고, [수학식 20]의 형태로 쓸 수 있다.In Equation (20)
Figure 112013042004143-pat00229
The average of
Figure 112013042004143-pat00230
And
Figure 112013042004143-pat00231
Lt; RTI ID = 0.0 > eigenvalues < / RTI > associated with the largest generalized eigenvalue of eigenvectors.
Figure 112013042004143-pat00232
Can be inverted and can be written in the form of (20).

Figure 112013042004143-pat00233

[수학식 21]에서

Figure 112013042004143-pat00234
는 역행렬을 나타낸다. In Equation 21,
Figure 112013042004143-pat00234
Represents an inverse matrix.

Figure 112013042004143-pat00235

[수학식 22]은 설명의 편의를 위해

Figure 112013042004143-pat00236
Figure 112013042004143-pat00237
로 나타낼 수 있다.Equation (22) is used for convenience of explanation
Figure 112013042004143-pat00236
To
Figure 112013042004143-pat00237
.

신호 분석부(340)는 음원 수의 가용성 조건에 따라 두 가지 분석으로 나누어 분석할 수 있다. 상기 가용성 조건은 음원(I)의 개수가 정해진 경우와 정해지지 않을 경우일 수 있다.The signal analyzing unit 340 can analyze the data according to the availability condition of the sound source. The availability condition may be the case where the number of sound sources I is fixed or not.

신호 분석부(340)가 음원의 개수가 정해지고

Figure 112013042004143-pat00238
을 분석할 경우에는 [수학식 16]를 이용할 수 있다.When the signal analysis unit 340 determines the number of sound sources
Figure 112013042004143-pat00238
The equation (16) can be used.

Figure 112013042004143-pat00239

방향각를 보여주는

Figure 112013042004143-pat00240
,
Figure 112013042004143-pat00241
는 [수학식 23]에서
Figure 112013042004143-pat00242
의 고유 벡터를 표현하는데 이용될 수 있다.Showing the direction angle
Figure 112013042004143-pat00240
,
Figure 112013042004143-pat00241
Is expressed by Equation (23)
Figure 112013042004143-pat00242
Can be used to express the eigenvector of eq.

Figure 112013042004143-pat00243

[수학식 24]의

Figure 112013042004143-pat00244
Figure 112013042004143-pat00245
이고,
Figure 112013042004143-pat00246
Figure 112013042004143-pat00247
Figure 112013042004143-pat00248
이다. 또한
Figure 112013042004143-pat00249
는 M 행령의 i번째 열을 나타낸다. [수학식 23] 및 [수학식 24]을 이용하면, [수학식 22]에서 주어진
Figure 112013042004143-pat00250
는 다시 정의될 수 있다.In Equation 24,
Figure 112013042004143-pat00244
silver
Figure 112013042004143-pat00245
ego,
Figure 112013042004143-pat00246
silver
Figure 112013042004143-pat00247
Figure 112013042004143-pat00248
to be. Also
Figure 112013042004143-pat00249
Represents the i-th column of the M order. Using Equation (23) and Equation (24), Equation (22) given in Equation (22)
Figure 112013042004143-pat00250
Can be redefined.

Figure 112013042004143-pat00251

Figure 112013042004143-pat00252

Figure 112013042004143-pat00253

[수학식 26]는 2차원 음원 신호 부공간 행렬이고, [수학식 27]은 2차원 잡음 신호 부공간 행렬이다.(26) is a two-dimensional sound source signal subspace matrix, and (27) is a two-dimensional noise signal subspace matrix.

신호 분석부(340)는 [수학식 25]에서 주어진

Figure 112013042004143-pat00254
를 이용하면,
Figure 112013042004143-pat00255
Figure 112013042004143-pat00256
인 경우와 아닌 경우와 같이 두 개의 분리할 수 있다. The signal analysis unit 340 calculates a signal
Figure 112013042004143-pat00254
In this case,
Figure 112013042004143-pat00255
The
Figure 112013042004143-pat00256
Two cases can be separated as in the case of and as in the case of not.

Figure 112013042004143-pat00257
인 경우, 신호 분석부(340)는 [수학식 24]의 오른쪽에서 두 번째 항인
Figure 112013042004143-pat00258
는 0이고,
Figure 112013042004143-pat00259
를 [수학식 28]과 같이 추정할 수 있다.
Figure 112013042004143-pat00257
, The signal analyzing unit 340 calculates the second argument from the right side of (Equation 24)
Figure 112013042004143-pat00258
Is 0,
Figure 112013042004143-pat00259
Can be estimated as Equation (28).

Figure 112013042004143-pat00260

Figure 112013042004143-pat00261

[수학식 29]에서

Figure 112013042004143-pat00262
Figure 112013042004143-pat00263
이다. 또한
Figure 112013042004143-pat00264
Figure 112013042004143-pat00265
의 표준으로 나타낼 수 있다. 그러므로,
Figure 112013042004143-pat00266
가 무시되면
Figure 112013042004143-pat00267
일 수 있다.In Equation 29,
Figure 112013042004143-pat00262
The
Figure 112013042004143-pat00263
to be. Also
Figure 112013042004143-pat00264
The
Figure 112013042004143-pat00265
As shown in Fig. therefore,
Figure 112013042004143-pat00266
Is ignored
Figure 112013042004143-pat00267
Lt; / RTI >

Figure 112013042004143-pat00268
인 경우, 신호 분석부(340)는 [수학식 24]의 오른쪽에서 첫 번째 항과 두 번째 항인
Figure 112013042004143-pat00269
Figure 112013042004143-pat00270
를 이용하여
Figure 112013042004143-pat00271
을 추정할 수 있다. 신호 분석부(340)는
Figure 112013042004143-pat00272
를 [수학식 30]와 같이 추정할 수 있다.
Figure 112013042004143-pat00268
, The signal analysis unit 340 calculates the first and second terms on the right side of (Equation 24)
Figure 112013042004143-pat00269
And
Figure 112013042004143-pat00270
Using
Figure 112013042004143-pat00271
Can be estimated. The signal analysis unit 340
Figure 112013042004143-pat00272
Can be estimated as Equation (30).

Figure 112013042004143-pat00273

Figure 112013042004143-pat00274
는 [수학식 25]에서 주어질 수 있다. [수학식 26] 및 [수학식 27]에서 정의된
Figure 112013042004143-pat00275
Figure 112013042004143-pat00276
Figure 112013042004143-pat00277
Figure 112013042004143-pat00278
을 정의할 수 있는
Figure 112013042004143-pat00279
또는
Figure 112013042004143-pat00280
Figure 112013042004143-pat00281
를 방향각
Figure 112013042004143-pat00282
으로 나타낼 수 있다.
Figure 112013042004143-pat00283
의 범위 조건은 두 가지 속성을 가질 수 있다.
Figure 112013042004143-pat00274
Can be given by: " (25) " Defined in [Equation 26] and [Equation 27]
Figure 112013042004143-pat00275
And
Figure 112013042004143-pat00276
of
Figure 112013042004143-pat00277
The
Figure 112013042004143-pat00278
That can define
Figure 112013042004143-pat00279
or
Figure 112013042004143-pat00280
And
Figure 112013042004143-pat00281
Direction angle
Figure 112013042004143-pat00282
.
Figure 112013042004143-pat00283
The range condition of a function can have two properties.

첫 번째 속성은

Figure 112013042004143-pat00284
의 고해상도 DOA 추정을 달성하기 위해 [수학식 25]에서
Figure 112013042004143-pat00285
Figure 112013042004143-pat00286
와 한 것 같이
Figure 112013042004143-pat00287
로 할 수 있다. 여기서
Figure 112013042004143-pat00288
는 공집합이다. 따라서, [수학식 27]에서 정의된
Figure 112013042004143-pat00289
의 각각의 대각선 값이 더 커질 수 있다. The first attribute is
Figure 112013042004143-pat00284
In order to achieve the high-resolution DOA estimation of Equation 25,
Figure 112013042004143-pat00285
And
Figure 112013042004143-pat00286
As with
Figure 112013042004143-pat00287
. here
Figure 112013042004143-pat00288
Is an empty set. Therefore, the value of < RTI ID = 0.0 >
Figure 112013042004143-pat00289
May be larger.

두 번째 속성은

Figure 112013042004143-pat00290
은 2p-KR-MUSIC에 동등한 기능을 달성하기 위해
Figure 112013042004143-pat00291
Figure 112013042004143-pat00292
를 조정된
Figure 112013042004143-pat00293
일 수 있다. 따라서, [수학식 26] 및 [수학식 27]에서 정의된 모든 대각선 값인
Figure 112013042004143-pat00294
Figure 112013042004143-pat00295
이 동시에 커질 수 있다.The second attribute is
Figure 112013042004143-pat00290
To achieve equivalent functionality to 2p-KR-MUSIC
Figure 112013042004143-pat00291
And
Figure 112013042004143-pat00292
Adjusted
Figure 112013042004143-pat00293
Lt; / RTI > Therefore, all the diagonal values defined in [Equation 26] and [Equation 27]
Figure 112013042004143-pat00294
And
Figure 112013042004143-pat00295
Can be increased at the same time.

신호 분석부(340)가 음원의 개수가 정해지지 않고

Figure 112013042004143-pat00296
을 분석할 경우에는, [수학식 17]를 이용할 수 있다. [수학식 17]의
Figure 112013042004143-pat00297
는 [수학식 25]에서 주어진
Figure 112013042004143-pat00298
를 산출하기 위해 이용될 수 있다. 그러나 [수학식 25]의
Figure 112013042004143-pat00299
Figure 112013042004143-pat00300
은 알지 못한다. 신호 분석부(340)는
Figure 112013042004143-pat00301
Figure 112013042004143-pat00302
인 경우와 아닌 경우로 나눌 수 있다.If the signal analysis unit 340 determines that the number of sound sources is not set
Figure 112013042004143-pat00296
, The following equation (17) can be used. In Equation 17,
Figure 112013042004143-pat00297
Is given by: < RTI ID = 0.0 >
Figure 112013042004143-pat00298
. ≪ / RTI > However, in Equation 25,
Figure 112013042004143-pat00299
And
Figure 112013042004143-pat00300
I do not know. The signal analysis unit 340
Figure 112013042004143-pat00301
To
Figure 112013042004143-pat00302
And can be divided into two cases.

Figure 112013042004143-pat00303
인 경우, [수학식 28]의
Figure 112013042004143-pat00304
와 관계없이
Figure 112013042004143-pat00305
일 수 있다.
Figure 112013042004143-pat00303
, Equation (28)
Figure 112013042004143-pat00304
Irrespective of
Figure 112013042004143-pat00305
Lt; / RTI >

Figure 112013042004143-pat00306
인 경우,
Figure 112013042004143-pat00307
는 [수학식 25]에서 주어진
Figure 112013042004143-pat00308
와 함께 [수학식 30]를 충족을 시킬 수 있다. 또한 신호 분석부(340)는
Figure 112013042004143-pat00309
의 두 가지 속성 범위 조건으로
Figure 112013042004143-pat00310
의 스판(spans)인
Figure 112013042004143-pat00311
또는
Figure 112013042004143-pat00312
Figure 112013042004143-pat00313
을 걸쳐 만들 수 있다.
Figure 112013042004143-pat00306
Quot;
Figure 112013042004143-pat00307
Is given by: < RTI ID = 0.0 >
Figure 112013042004143-pat00308
(30) can be satisfied. Also, the signal analysis unit 340
Figure 112013042004143-pat00309
As a condition of two properties of
Figure 112013042004143-pat00310
Spans of
Figure 112013042004143-pat00311
or
Figure 112013042004143-pat00312
Wow
Figure 112013042004143-pat00313
.

첫 번째 조건은

Figure 112013042004143-pat00314
의 고해상도 DOA 추정을 달성하기 위해, [수학식 25]의
Figure 112013042004143-pat00315
Figure 112013042004143-pat00316
Figure 112013042004143-pat00317
이고,
Figure 112013042004143-pat00318
일 수 있다. 따라서, [수학식 26]에서 정의된
Figure 112013042004143-pat00319
의 각 대각선 값은 더 작아질 수 있다.The first condition is
Figure 112013042004143-pat00314
In order to achieve the high-resolution DOA estimation of Equation 25,
Figure 112013042004143-pat00315
silver
Figure 112013042004143-pat00316
And
Figure 112013042004143-pat00317
ego,
Figure 112013042004143-pat00318
Lt; / RTI > Therefore, the value of < RTI ID = 0.0 >
Figure 112013042004143-pat00319
The diagonal value of each can be made smaller.

두 번째 조건은

Figure 112013042004143-pat00320
의 2p-KR-Capon에 동등한 기능을 달성하기 위해,
Figure 112013042004143-pat00321
Figure 112013042004143-pat00322
Figure 112013042004143-pat00323
이고,
Figure 112013042004143-pat00324
Figure 112013042004143-pat00325
일 수 있다. 따라서, [수학식 27]에 정의된
Figure 112013042004143-pat00326
의 각 대각선 요소값은 더 커질 수 있다.The second condition is
Figure 112013042004143-pat00320
In order to achieve an equivalent function to 2p-KR-Capon,
Figure 112013042004143-pat00321
The
Figure 112013042004143-pat00322
And
Figure 112013042004143-pat00323
ego,
Figure 112013042004143-pat00324
Figure 112013042004143-pat00325
Lt; / RTI > Hence, as defined in [Equation 27]
Figure 112013042004143-pat00326
The value of each diagonal element of < RTI ID = 0.0 >

신호 분석부(340)는 음원(I)의 개수가 정해지거나 정해지지 않을 경우에는 서로 다른 공간 스펙트럼 알고리즘을 이용할 수 있다.The signal analysis unit 340 may use different spatial spectrum algorithms when the number of sound sources I is determined or not determined.

음원의 개수가 정해져 있을 경우에는 신호 분석부(340)는 공간 스펙트럼 알고리즘을 [수학식 31]과 같이 제안할 수 있다. 신호 분석부(340)는 [수학식 16] 및

Figure 112013042004143-pat00327
에 해당하는
Figure 112013042004143-pat00328
를 이용하여 산출된
Figure 112013042004143-pat00329
를 제약된 2p차원 공간 스펙트럼인 c-2p-KR-MUSIC을 [수학식 31]과 같이 제안할 수 있다.When the number of sound sources is determined, the signal analyzing unit 340 can propose a spatial spectrum algorithm as shown in [Equation 31]. The signal analyzing unit 340 obtains the following equation (16) and
Figure 112013042004143-pat00327
Equivalent to
Figure 112013042004143-pat00328
Lt; / RTI >
Figure 112013042004143-pat00329
Quot; c-2p-KR-MUSIC ", which is a constrained 2p-dimensional spatial spectrum, can be proposed as " (31) "

Figure 112013042004143-pat00330

Figure 112013042004143-pat00331

[수학식 31]에서

Figure 112013042004143-pat00332
이고
Figure 112013042004143-pat00333
와 함께
Figure 112013042004143-pat00334
Figure 112013042004143-pat00335
일때, C-2-KR-MUSIC는 차원 감소 절차가 없을 수 있고 [수학식 32]과 같이 정의할 수 있다.In Equation 31,
Figure 112013042004143-pat00332
ego
Figure 112013042004143-pat00333
with
Figure 112013042004143-pat00334
end
Figure 112013042004143-pat00335
, The C-2-KR-MUSIC may have no dimensional reduction procedure and can be defined as shown in [Equation 32].

음원의 개수가 정해지지 않은 경우에는 신호 분석부(340)는 공간 스펙트럼 알고리즘을 [수학식 33]과 같이 제안할 수 있다. 신호 분석부(340)는 [수학식 17] 및

Figure 112013042004143-pat00336
에 해당하는
Figure 112013042004143-pat00337
를 이용하여 산출된
Figure 112013042004143-pat00338
를 제약된 2p차원 공간 스펙트럼인 c-2p-KR-Capon을 [수학식 33]와 같이 제안할 수 있다.If the number of sound sources is not determined, the signal analyzing unit 340 can propose a spatial spectrum algorithm as shown in Equation (33). The signal analyzing unit 340 obtains the following Equations (17) and
Figure 112013042004143-pat00336
Equivalent to
Figure 112013042004143-pat00337
Lt; / RTI >
Figure 112013042004143-pat00338
Quot; c-2p-KR-Capon ", which is a constrained 2p-dimensional spatial spectrum, can be proposed as " (33) "

Figure 112013042004143-pat00339

Figure 112013042004143-pat00340

[수학식 33]에서

Figure 112013042004143-pat00341
이고
Figure 112013042004143-pat00342
일 때, c-2-KR-Capon는 차원 감소 절차가 없을 수 있고 [수학식 34]과 같이 정의할 수 있다.In Equation 33,
Figure 112013042004143-pat00341
ego
Figure 112013042004143-pat00342
, The c-2-KR-Capon may have no dimensional reduction procedure and can be defined as [Equation 34].

신호 분석부(340)는 c-2p-KR-MUSIC 및 c-2p-KR-Capon에서 [수학식 21]의 해결책

Figure 112013042004143-pat00343
을 특이값분해(SVD: singular value decomposition)로
Figure 112013042004143-pat00344
의 가장 큰 비특이값(non-singular value)을 고려한 비특이벡터를 제공할 수 있다. 또한 신호 분석부(340)는 방향각
Figure 112013042004143-pat00345
을 검색하면 DOA가 제안하는 C-2P-KR-MUSIC과 C-2P-KR-Capon의 로컬 피크(peak)를 산출할 수 있다.The signal analysis unit 340 calculates the solution of the equation (21) in the c-2p-KR-MUSIC and c-2p-KR-
Figure 112013042004143-pat00343
To singular value decomposition (SVD)
Figure 112013042004143-pat00344
Specific vector considering the largest non-singular value of the non-singular value. In addition, the signal analyzing unit 340 analyzes the direction angle
Figure 112013042004143-pat00345
, It is possible to calculate the local peaks of C-2P-KR-MUSIC and C-2P-KR-Capon proposed by DOA.

방향 추정부(360)는 신호 분석부(340)에서 분석된 신호의 데이터를 이용하여 음원 신호의 방향을 추정할 수 있다. 방향 추정부(360)는 특이값 분해에서 산출한 가장 큰 비특이값을 가지는 비특이벡터의 방향각을 음원 신호의 방향으로 추정할 수 있다.The direction estimating unit 360 may estimate the direction of the sound source signal using the data of the signal analyzed by the signal analyzing unit 340. The direction estimator 360 can estimate the direction angle of the non-singular vector having the largest non-singular value calculated in singular value decomposition in the direction of the sound source signal.

실제로, 방향 추정부(360)는

Figure 112013042004143-pat00346
를 이용할 수 없기 때문에
Figure 112013042004143-pat00347
를 추정하는 것은 쉽지 않을 수 있고, [수학식 13]이 충족되지 않은 것 같이 상기 추정치에 특정 오류가 있을 수 있다. 즉,
Figure 112013042004143-pat00348
Figure 112013042004143-pat00349
의 추정한 것을 나타내고,
Figure 112013042004143-pat00350
Figure 112013042004143-pat00351
일 수 있다. 또한
Figure 112013042004143-pat00352
의 오류를 고려하면,
Figure 112013042004143-pat00353
는 2P-KR-MUSIC와 2P-KR-Capon과 같이 고해상도 DOA 추정과 기능의 균형을 결정될 수 있다.In practice, the direction estimating unit 360
Figure 112013042004143-pat00346
Can not be used
Figure 112013042004143-pat00347
May be difficult to estimate, and there may be a specific error in the estimate as if < RTI ID = 0.0 > (13) < / RTI > In other words,
Figure 112013042004143-pat00348
The
Figure 112013042004143-pat00349
, ≪ / RTI >
Figure 112013042004143-pat00350
And
Figure 112013042004143-pat00351
Lt; / RTI > Also
Figure 112013042004143-pat00352
Considering the error of < RTI ID =
Figure 112013042004143-pat00353
Can be used to determine the balance of high-resolution DOA estimation and functionality such as 2P-KR-MUSIC and 2P-KR-Capon.

c-2p-KR-MUSIC 및

Figure 112013042004143-pat00354
일 때의 상기 두 조건을 기초로, 방향 추정부(360)는
Figure 112013042004143-pat00355
Figure 112013042004143-pat00356
의 최대 고유값에 비례하도록 [수학식 35]와 같이 설정할 수 있다.c-2p-KR-MUSIC and
Figure 112013042004143-pat00354
, The direction estimating unit 360 estimates the direction
Figure 112013042004143-pat00355
To
Figure 112013042004143-pat00356
Can be set to be proportional to the maximum eigenvalue of Equation (35).

Figure 112013042004143-pat00357

c-2p-KR-Capon 및

Figure 112013042004143-pat00358
일 때의 상기 두 조건을 기초로, 방향 추정부(360)는
Figure 112013042004143-pat00359
Figure 112013042004143-pat00360
의 0이 아닌 최소 고유값에 비례하도록 [수학식 36]와 같이 설정할 수있다.c-2p-KR-Capon and
Figure 112013042004143-pat00358
, The direction estimating unit 360 estimates the direction
Figure 112013042004143-pat00359
To
Figure 112013042004143-pat00360
Can be set to be proportional to the non-zero minimum eigenvalue of Equation (36).

Figure 112013042004143-pat00361

[수학식 36]에서

Figure 112013042004143-pat00362
Figure 112013042004143-pat00363
이고
Figure 112013042004143-pat00364
의 최대 순위를 나타낼 수 있다.In Equation (36)
Figure 112013042004143-pat00362
The
Figure 112013042004143-pat00363
ego
Figure 112013042004143-pat00364
Can be displayed.

방향 추정부(360)는 [수학식 11]에서 주어진

Figure 112013042004143-pat00365
Figure 112013042004143-pat00366
를 이용하여 시간 평균을 추정할 수 있다. 그러나 방향 추정부(360)는 신호가 오디오 같은 비고정 신호일 때만 가능할 수 있다.
Figure 112013042004143-pat00367
은 알고 있지 않고 결정하는 것은 불가능하다. 또한 고정값
Figure 112013042004143-pat00368
Figure 112013042004143-pat00369
은 정확한 DOA추정으로 이어지지 않을 수 있다. 이러한 이유로, 방향 추정부(360)는
Figure 112013042004143-pat00370
의 추정값을 모든 것이 가능한
Figure 112013042004143-pat00371
를 이용하여 [수학식 37]처럼 산출할 수 있다.The direction estimating unit 360 estimates the direction given by Equation (11)
Figure 112013042004143-pat00365
And
Figure 112013042004143-pat00366
Can be used to estimate the time average. However, the direction estimator 360 may be enabled only when the signal is a non-stationary signal such as audio.
Figure 112013042004143-pat00367
It is impossible to decide without knowing. Also,
Figure 112013042004143-pat00368
And
Figure 112013042004143-pat00369
May not lead to accurate DOA estimation. For this reason, the direction estimating unit 360
Figure 112013042004143-pat00370
Of all possible
Figure 112013042004143-pat00371
Can be calculated as Equation (37).

Figure 112013042004143-pat00372

[수학식 37]에서

Figure 112013042004143-pat00373
Figure 112013042004143-pat00374
는 주어진
Figure 112013042004143-pat00375
Figure 112013042004143-pat00376
의 시간 평균 추정값이다.
Figure 112013042004143-pat00377
를 이용하는 대신, [수학식 37]은 주어진 평균
Figure 112013042004143-pat00378
를 DOA의 정확성을 향상시키기 위한 COP로 간주될 수 있다. In Equation 37,
Figure 112013042004143-pat00373
And
Figure 112013042004143-pat00374
Given
Figure 112013042004143-pat00375
of
Figure 112013042004143-pat00376
Is the time-averaged estimate.
Figure 112013042004143-pat00377
Instead of using Equation (37), Equation (37)
Figure 112013042004143-pat00378
Can be regarded as a COP for improving the accuracy of the DOA.

제어부(240)는 [수학식 4]의 정의된 실제 센서 지역의 집합인

Figure 112013042004143-pat00379
은 거리
Figure 112013042004143-pat00380
와 함께
Figure 112013042004143-pat00381
를 산출한다. 제어부(240)는 [수학식 7]의
Figure 112013042004143-pat00382
에서 실제 및 가상 센서 지역의 집합을 [수학식 38]과 같이 설정할 수 있다.The control unit 240 determines a set of actual sensor regions defined in Equation (4)
Figure 112013042004143-pat00379
Silver Distance
Figure 112013042004143-pat00380
with
Figure 112013042004143-pat00381
. The control unit 240 determines whether or not
Figure 112013042004143-pat00382
The set of real and virtual sensor regions can be set as shown in [Equation 38].

Figure 112013042004143-pat00383

제어부(240)는 가상 배열 프레임워크(virtual array framework)의 관점에서 공간만의 다양성을 고려하여 p차원의 가상 센서의 좌표를 이용할 수 있다. 제어부(240)는 [수학식 38]에서 실제 및 가상의 센서의 수는

Figure 112013042004143-pat00384
이고, 따라서 C-2P-KR-MUSIC,의 식별 가능성은 p 및 M의 함수로 [수학식 39]과 같이 구성할 수 있다.The control unit 240 can use the coordinates of the p-dimensional virtual sensor in consideration of the diversity of the space only in terms of the virtual array framework. The control unit 240 calculates the number of real and virtual sensors in Equation (38)
Figure 112013042004143-pat00384
, And therefore the identifiability of C-2P-KR-MUSIC can be constructed as a function of p and M as shown in Equation (39).

Figure 112013042004143-pat00385

[수학식 39]은 c-2p-KR-MUSIC 및 c-2p-KR-Capon의 센서의 식별 가능성을 나타낼 수 있다.[Equation 39] may indicate the identifiability of the sensors of c-2p-KR-MUSIC and c-2p-KR-Capon.

결론적으로, 제어부(240)는 하기의 순서대로 구동하여 동작할 수 있다. In conclusion, the control unit 240 can operate in the following order.

제1 단계는 [수학식 37]를 이용하여

Figure 112013042004143-pat00386
또는
Figure 112013042004143-pat00387
를 산출할 수 있다.The first step is to use Equation (37)
Figure 112013042004143-pat00386
or
Figure 112013042004143-pat00387
Can be calculated.

제 2단계는 방향각

Figure 112013042004143-pat00388
를 산출하기 위해[수학식 22]을 이용하여
Figure 112013042004143-pat00389
의 SVD에서 산출된 가장 큰 비특이값에 해당하는 비특이벡터인
Figure 112013042004143-pat00390
을 [수학식 31]에서
Figure 112013042004143-pat00391
또는 [수학식 33]에서
Figure 112013042004143-pat00392
로 산출한다. 음원의 개수가 정해진 경우에는
Figure 112013042004143-pat00393
를 [수학식 16]를 이용하여 산출하고,
Figure 112013042004143-pat00394
는 [수학식 35]를 이용하여 산출한다. 음원의 개수가 정해지지 않은 경우에는
Figure 112013042004143-pat00395
를 [수학식 17]를 이용하여 산출하고,
Figure 112013042004143-pat00396
는 [수학식 36]를 이용하여 산출한다.In the second step,
Figure 112013042004143-pat00388
(22) < RTI ID = 0.0 >
Figure 112013042004143-pat00389
Specific vector corresponding to the largest non-specific value calculated from the SVD of
Figure 112013042004143-pat00390
In Equation (31)
Figure 112013042004143-pat00391
Or < EMI ID = 33.0 >
Figure 112013042004143-pat00392
. If the number of sound sources is determined
Figure 112013042004143-pat00393
Is calculated using the following equation (16)
Figure 112013042004143-pat00394
Is calculated by using (35). If the number of sound sources is not determined
Figure 112013042004143-pat00395
Is calculated using the following equation (17)
Figure 112013042004143-pat00396
Is calculated by using [Expression 36].

제 3단계는 제안된 공간 스펙트럼의 로컬 최대값에 해당하는 방향으로 추정한다.The third step estimates the direction corresponding to the local maximum value of the proposed spatial spectrum.

제어부(240)는

Figure 112013042004143-pat00397
일 때, 하기 알고리즘을 제안할 수 있다. c-2p-KR-MUSIC 및 c-2-KR-Capon 알고리즘은
Figure 112013042004143-pat00398
을 이용한 COP에서 파생된 알고리즘일 수 있다. c-2-KR-MUSIC-M 및 c-2-KR-Capon-M 알고리즘은
Figure 112013042004143-pat00399
을 이용한 c-2p-KR-MUSIC 및 2p-KR-Capon 알고리즘일 수 있다. 4-KR-MUSIC 및 4-KR-Capon 알고리즘은
Figure 112013042004143-pat00400
을 이용한 간단하게 확장된 KR-MUSIC 및 KR-Capon 알고리즘일 수 있다. c-4-KR-MUSIC 및 c-4-KR-Capon은
Figure 112013042004143-pat00401
을 이용한 COP에서 파생된 알고리즘일 수 있다. c-4-KR-MUSIC-M 및 c-4-KR-Capon-M은
Figure 112013042004143-pat00402
을 이용한 c-4-KR-MUSIC 및 c-4-KR-Capon 알고리즘일 수 있다.
The control unit 240
Figure 112013042004143-pat00397
, The following algorithm can be proposed. The c-2p-KR-MUSIC and c-2-KR-Capon algorithms
Figure 112013042004143-pat00398
Which is a COP-derived algorithm. The c-2-KR-MUSIC-M and c-2-KR-Capon-M algorithms
Figure 112013042004143-pat00399
C-2p-KR-MUSIC and 2p-KR-Capon algorithms using the same algorithm. The 4-KR-MUSIC and 4-KR-Capon algorithms
Figure 112013042004143-pat00400
Can be simply extended KR-MUSIC and KR-Capon algorithms. c-4-KR-MUSIC and c-4-KR-Capon
Figure 112013042004143-pat00401
Which is a COP-derived algorithm. c-4-KR-MUSIC-M and c-4-KR-
Figure 112013042004143-pat00402
C-4-KR-MUSIC and c-4-KR-Capon algorithms using the c-4-KR-MUSIC algorithm.

도 4는 본 발명의 일 실시예에 따른 방향 추정 장치의 고해상도를 도시한 그래프이고, 도 5는 본 발명의 다른 실시예에 따른 방향 추정 장치의 고해상도를 도시한 그래프이며, 도 6은 본 발명의 또 다른 실시예에 따른 방향 추정 장치의 고해상도를 도시한 그래프이고, 도 7은 본 발명의 또 다른 실시예에 따른 방향 추정 장치의 고해상도를 도시한 그래프이다.FIG. 4 is a graph showing a high resolution of a direction estimating apparatus according to an embodiment of the present invention, FIG. 5 is a graph showing a high resolution of a direction estimating apparatus according to another embodiment of the present invention, FIG. 7 is a graph showing a high resolution of a direction estimating apparatus according to another embodiment of the present invention.

도 4 내지 도 7을 참조하면, 방향 추정 장치(1)은 공간적 고해상도가 높을 수 있다.Referring to Figs. 4 to 7, the direction estimating apparatus 1 may have a high spatial resolution.

도 4는 일반화된 가우시안 분포에서 생성된 협대역 비고정 음원 신호의 그래프이다. 도 4는 KR-Capon, c-2-KR-Capon, 4-KR-Capon 및 c-4-KR-Capon의 공간 스펙트럼을 나타낸다. 도 4는

Figure 112013042004143-pat00403
,
Figure 112013042004143-pat00404
,
Figure 112013042004143-pat00405
Figure 112013042004143-pat00406
인 그래프이다. 4 is a graph of narrowband unstructured excitation signal generated in a generalized Gaussian distribution. Figure 4 shows the spatial spectra of KR-Capon, c-2-KR-Capon, 4-KR-Capon and c-4-KR-Capon. Figure 4
Figure 112013042004143-pat00403
,
Figure 112013042004143-pat00404
,
Figure 112013042004143-pat00405
And
Figure 112013042004143-pat00406
.

도 4(a)는 KR-Capon과 c-2-KR-Capon을 비교한 그래프이다. 도 4(a)는 c-2-KR-Capon가 KR-Capon보다 더 높은 공간 해상도를 나타내는 것을 보여주고 있다. c-2-KR-Capon의 공간 스펙트럼은 KR-Capon의 공간 스펙트럼보다 더 깊은 곡선을 보여주면서

Figure 112013042004143-pat00407
Figure 112013042004143-pat00408
의 구분을 명확하게 하여 공간 해상도가 높다는 것을 보여준다.4 (a) is a graph comparing KR-Capon with c-2-KR-Capon. Figure 4 (a) shows that c-2-KR-Capon exhibits a higher spatial resolution than KR-Capon. The spatial spectrum of c-2-KR-Capon shows a deeper curve than that of KR-Capon
Figure 112013042004143-pat00407
and
Figure 112013042004143-pat00408
And the spatial resolution is high.

도 4(b)는 4-KR-Capon과 c-4-KR-Capon을 비교한 그래프이다. 도 4(b)는 c-4-KR-Capon가 4-KR-Capon보다 더 높은 공간 해상도를 나타내는 것을 보여주고 있다. c-4-KR-Capon의 공간 스펙트럼은 4-KR-Capon의 공간 스펙트럼보다 더 깊은 곡선을 보여주면서

Figure 112013042004143-pat00409
Figure 112013042004143-pat00410
의 구분을 명확하게 하여 공간 해상도가 높다는 것을 보여준다.4 (b) is a graph comparing 4-KR-Capon with c-4-KR-Capon. Figure 4 (b) shows that the c-4-KR-Capon exhibits a higher spatial resolution than the 4-KR-Capon. The spatial spectrum of c-4-KR-Capon shows a deeper curve than the spatial spectrum of 4-KR-Capon
Figure 112013042004143-pat00409
and
Figure 112013042004143-pat00410
And the spatial resolution is high.

도 5는 일반화된 가우시안 분포에서 생성된 협대역 비고정 음원 신호의 그래프이다. 도 5는 KR-MUSIC, c-2-KR-MUSIC, 4-KR-MUSIC 및 c-4-KR-MUSIC의 공간 스펙트럼을 나타낸다. 도 5는

Figure 112013042004143-pat00411
,
Figure 112013042004143-pat00412
,
Figure 112013042004143-pat00413
Figure 112013042004143-pat00414
인 그래프이다. 5 is a graph of narrowband unstructured excitation signal generated in a generalized Gaussian distribution. 5 shows the spatial spectra of KR-MUSIC, c-2-KR-MUSIC, 4-KR-MUSIC and c-4-KR-MUSIC. Figure 5
Figure 112013042004143-pat00411
,
Figure 112013042004143-pat00412
,
Figure 112013042004143-pat00413
And
Figure 112013042004143-pat00414
.

도 5(a)는 KR-MUSIC과 c-2-KR-MUSIC을 비교한 그래프이다. 도 5(a)는 c-2-KR-MUSIC가 KR-MUSIC보다 더 높은 공간 해상도를 나타내는 것을 보여주고 있다. c-2-KR-MUSIC의 공간 스펙트럼은 KR-MUSIC의 공간 스펙트럼보다 더 깊은 곡선을 보여주면서

Figure 112013042004143-pat00415
Figure 112013042004143-pat00416
의 구분을 명확하게 하여 공간 해상도가 높다는 것을 보여준다.5 (a) is a graph comparing KR-MUSIC with c-2-KR-MUSIC. Figure 5 (a) shows that c-2-KR-MUSIC exhibits higher spatial resolution than KR-MUSIC. The spatial spectrum of c-2-KR-MUSIC shows a deeper curve than the spatial spectrum of KR-MUSIC
Figure 112013042004143-pat00415
and
Figure 112013042004143-pat00416
And the spatial resolution is high.

도 5(b)는 4-KR-MUSIC과 c-4-KR-MUSIC을 비교한 그래프이다. 도 5(b)는 c-4-KR-MUSIC가 4-KR-MUSIC보다 더 높은 공간 해상도를 나타내는 것을 보여주고 있다. c-4-KR-MUSIC의 공간 스펙트럼은 4-KR-MUSIC의 공간 스펙트럼보다 더 깊은 곡선을 보여주면서

Figure 112013042004143-pat00417
Figure 112013042004143-pat00418
의 구분을 명확하게 하여 공간 해상도가 높다는 것을 보여준다.5 (b) is a graph comparing 4-KR-MUSIC with c-4-KR-MUSIC. 5 (b) shows that the c-4-KR-MUSIC exhibits a higher spatial resolution than the 4-KR-MUSIC. The spatial spectrum of c-4-KR-MUSIC shows a deeper curve than the spatial spectrum of 4-KR-MUSIC
Figure 112013042004143-pat00417
and
Figure 112013042004143-pat00418
And the spatial resolution is high.

도 6은 일반화된 가우시안 분포에서 생성된 협대역 비고정 음원 신호의 그래프이다. 도 6는 4-KR-MUSIC, c-4-KR-MUSIC, 4-KR-Capon 및 c-4-KR-Capon의 공간 스펙트럼을 보여주고 있다. 도 6는

Figure 112013042004143-pat00419
,
Figure 112013042004143-pat00420
,
Figure 112013042004143-pat00421
,
Figure 112013042004143-pat00422
Figure 112013042004143-pat00423
인 그래프이다. 6 is a graph of narrowband unstructured excitation signal generated in a generalized Gaussian distribution. Fig. 6 shows the spatial spectra of 4-KR-MUSIC, c-4-KR-MUSIC, 4-KR-Capon and c-4-KR-Capon. Fig. 6
Figure 112013042004143-pat00419
,
Figure 112013042004143-pat00420
,
Figure 112013042004143-pat00421
,
Figure 112013042004143-pat00422
And
Figure 112013042004143-pat00423
.

도 6(a)는 4-KR-MUSIC과 c-4-KR-MUSIC을 비교한 그래프이다. 도 6(a)는 c-4-KR-MUSIC가 4-KR-MUSIC보다 더 높은 공간 해상도를 나타낸다. c-4-KR-MUSIC의 공간 스펙트럼은 4-KR-MUSIC의 공간 스펙트럼보다 더 깊은 곡선을 보여주면서

Figure 112013042004143-pat00424
,
Figure 112013042004143-pat00425
Figure 112013042004143-pat00426
의 구분을 명확하게 하여 공간 해상도가 높다는 것을 보여준다.6 (a) is a graph comparing 4-KR-MUSIC with c-4-KR-MUSIC. 6 (a) shows a higher spatial resolution than c-4-KR-MUSIC with 4-KR-MUSIC. The spatial spectrum of c-4-KR-MUSIC shows a deeper curve than the spatial spectrum of 4-KR-MUSIC
Figure 112013042004143-pat00424
,
Figure 112013042004143-pat00425
And
Figure 112013042004143-pat00426
And the spatial resolution is high.

도 6(b)는 4-KR-Capon과 c-4-KR-Capon을 비교한 그래프이다. 도 6(b)는 c-4-KR-Capon가 4-KR-Capon보다 더 높은 공간 해상도를 나타내는 것을 보여주고 있다. c-4-KR-Capon의 공간 스펙트럼은 4-KR-Capon의 공간 스펙트럼보다 더 깊은 곡선을 보여주면서

Figure 112013042004143-pat00427
,
Figure 112013042004143-pat00428
Figure 112013042004143-pat00429
의 구분을 명확하게 하여 공간 해상도가 높다는 것을 보여준다.6 (b) is a graph comparing 4-KR-Capon with c-4-KR-Capon. Figure 6 (b) shows that the c-4-KR-Capon exhibits higher spatial resolution than the 4-KR-Capon. The spatial spectrum of c-4-KR-Capon shows a deeper curve than the spatial spectrum of 4-KR-Capon
Figure 112013042004143-pat00427
,
Figure 112013042004143-pat00428
And
Figure 112013042004143-pat00429
And the spatial resolution is high.

도 7은 광대역 비고정 음원 신호인 음성 및 오디오의 그래프이다. 도 7은 4-KR-MUSIC, c-4-KR-MUSIC, 4-KR-Capon 및 c-4-KR-Capon의 공간 스펙트럼을 나타낸다. 도 7는

Figure 112013042004143-pat00430
,
Figure 112013042004143-pat00431
,
Figure 112013042004143-pat00432
,
Figure 112013042004143-pat00433
Figure 112013042004143-pat00434
인 그래프이다. 7 is a graph of voice and audio, which is a broadband unfixed sound source signal. Figure 7 shows the spatial spectra of 4-KR-MUSIC, c-4-KR-MUSIC, 4-KR-Capon and c-4-KR-Capon. Fig. 7
Figure 112013042004143-pat00430
,
Figure 112013042004143-pat00431
,
Figure 112013042004143-pat00432
,
Figure 112013042004143-pat00433
And
Figure 112013042004143-pat00434
.

도 7(a)는 4-KR-MUSIC과 c-4-KR-MUSIC을 비교한 그래프이다. 도 7(a)는 c-4-KR-MUSIC가 4-KR-MUSIC보다 더 높은 공간 해상도를 나타내는 것을 보여주고 있다. c-4-KR-MUSIC의 공간 스펙트럼은 4-KR-MUSIC의 공간 스펙트럼보다 해당 방향각에서 뚜렷한 곡선을 보여주면서

Figure 112013042004143-pat00435
,
Figure 112013042004143-pat00436
Figure 112013042004143-pat00437
의 구분을 명확하게 하여 공간 해상도가 높다는 것을 보여준다.7 (a) is a graph comparing 4-KR-MUSIC with c-4-KR-MUSIC. Figure 7 (a) shows that c-4-KR-MUSIC exhibits a higher spatial resolution than 4-KR-MUSIC. The spatial spectrum of c-4-KR-MUSIC shows a distinct curve at the corresponding direction angle than the spatial spectrum of 4-KR-MUSIC
Figure 112013042004143-pat00435
,
Figure 112013042004143-pat00436
And
Figure 112013042004143-pat00437
And the spatial resolution is high.

도 7(b)는 4-KR-Capon과 c-4-KR-Capon을 비교한 그래프이다. 도 6(b)는 c-4-KR-Capon가 4-KR-Capon보다 더 높은 공간 해상도를 나타내는 것을 보여주고 있다. c-4-KR-Capon의 공간 스펙트럼은 4-KR-Capon의 공간 스펙트럼보다 해당 방향각에서 뚜렷한 곡선을 보여주면서

Figure 112013042004143-pat00438
,
Figure 112013042004143-pat00439
Figure 112013042004143-pat00440
의 구분을 명확하게 하여 공간 해상도가 높다는 것을 보여준다.
7 (b) is a graph comparing 4-KR-Capon with c-4-KR-Capon. Figure 6 (b) shows that the c-4-KR-Capon exhibits higher spatial resolution than the 4-KR-Capon. The spatial spectrum of the c-4-KR-Capon showed a distinct curve at the corresponding direction angle than the spatial spectrum of 4-KR-Capon
Figure 112013042004143-pat00438
,
Figure 112013042004143-pat00439
And
Figure 112013042004143-pat00440
And the spatial resolution is high.

도 8은 본 발명의 일 실시예에 따른 방향 추정 장치의 정확도를 도시한 그래프이고, 도 9는 본 발명의 다른 실시예에 따른 방향 추정 장치의 정확도를 도시한 그래프이며, 도 10은 본 발명의 또 다른 실시예에 따른 방향 추정 장치의 정확도를 도시한 그래프이고, 도 11은 본 발명의 또 다른 실시예에 따른 방향 추정 장치의 정확도를 도시한 그래프이며, 도 12는 본 발명의 또 다른 실시예에 따른 방향 추정 장치의 정확도를 도시한 그래프이고, 도 13은 본 발명의 또 다른 실시예에 따른 방향 추정 장치의 정확도를 도시한 그래프이며, 도 14는 본 발명의 또 다른 실시예에 따른 방향 추정 장치의 정확도를 도시한 그래프이고, 도 15는 본 발명의 또 다른 실시예에 따른 방향 추정 장치의 정확도를 도시한 그래프이다.FIG. 8 is a graph showing the accuracy of the direction estimating apparatus according to an embodiment of the present invention, FIG. 9 is a graph showing the accuracy of the direction estimating apparatus according to another embodiment of the present invention, 11 is a graph showing the accuracy of a direction estimating apparatus according to another embodiment of the present invention, and Fig. 12 is a graph showing the accuracy of a direction estimating apparatus according to another embodiment of the present invention FIG. 13 is a graph showing the accuracy of the direction estimating apparatus according to another embodiment of the present invention, and FIG. 14 is a graph showing the accuracy of the direction estimating apparatus according to another embodiment of the present invention. FIG. 15 is a graph showing the accuracy of the direction estimating apparatus according to another embodiment of the present invention. FIG.

도 8 내지 도 15를 참조하면, 방향 추정 장치(1)은 성공 가능성(PoS: Probability of Success)이 높고 평균 제곱근 각도 오차(RMSE: root-mean-squared-angle-error)가 낮을 수 있다.8 to 15, the direction estimating apparatus 1 may have a high Probability of Success (PoS) and a low root-mean-squared-angle-error (RMSE).

도 8은 일반화된 가우시안 분포에서 생성된 협대역 비고정 음원 신호의 그래프이다. 도 8은 KR-MUSIC, c-2-KR-MUSIC, KR-Capon, c-2-KR-Capon, 4-KR-MUSIC, c-4-KR-MUSIC, 4-KR-Capon, c-4-KR-Capon 및 4-MUSIC의 신호대잡음 신호비(SNR: Signal to noise ratio)에 대한 RMSE를 나타낸다. 도 8은

Figure 112013042004143-pat00441
,
Figure 112013042004143-pat00442
,
Figure 112013042004143-pat00443
및 PoS=1 인 그래프이다.8 is a graph of narrowband unstructured excitation signal generated in a generalized Gaussian distribution. FIG. 8 is a graph showing the results of a comparison between KR-MUSIC, c-2-KR-MUSIC, KR-Capon, c-2-KR- RMSE for signal-to-noise ratio (SNR) of -KR-Capon and 4-MUSIC. Figure 8
Figure 112013042004143-pat00441
,
Figure 112013042004143-pat00442
,
Figure 112013042004143-pat00443
And PoS = 1.

도 8은 KR-MUSIC, KR-Capon, 4-KR-MUSIC 및 4-KR-Capon 에 대응하는 c-2-KR-MUSIC, c-2-KR-Capon, c-4-KR-MUSIC 및 c-4-KR-Capon이 RMSE가 낮은 것을 보여준다. 즉, c-2-KR-MUSIC, c-2-KR-Capon, c-4-KR-MUSIC 및 c-4-KR-Capon이 KR-MUSIC, KR-Capon, 4-KR-MUSIC 및 4-KR-Capon 보다 오차가 작다는 것을 의미한다.FIG. 8 is a graph showing the distribution of c-2-KR-MUSIC, c-4-KR-MUSIC and c-2-KR-MUSIC corresponding to KR-MUSIC, KR-Capon, 4-KR- -4-KR-Capon shows lower RMSE. KR-MUSIC, KR-Capon, 4-KR-MUSIC, and c-4-KR- This means that the error is smaller than KR-Capon.

도 9는 일반화된 가우시안 분포에서 생성된 협대역 비고정 음원 신호의 그래프이다. 도 9는 KR-MUSIC, c-2-KR-MUSIC-M, KR-Capon, c-2-KR-Capon-M, 4-KR-MUSIC, c-4-KR-MUSIC-M, 4-KR-Capon, c-4-KR-Capon-M 및 4-MUSIC의 신호대잡음 신호비(SNR: Signal to noise ratio)에 대한 RMSE를 나타낸다. 도 8은

Figure 112013042004143-pat00444
,
Figure 112013042004143-pat00445
,
Figure 112013042004143-pat00446
및 PoS=1 인 그래프이다.9 is a graph of narrowband unstructured excitation signal generated in a generalized Gaussian distribution. FIG. 9 is a schematic diagram showing the structure of KR-MUSIC, c-2-KR-MUSIC-M, KR-Capon, c-2-KR-Capon-M, (RMSE) of the signal-to-noise ratio (SNR) of the c-4-KR-Capon-M and 4-MUSIC. Figure 8
Figure 112013042004143-pat00444
,
Figure 112013042004143-pat00445
,
Figure 112013042004143-pat00446
And PoS = 1.

도 9는 KR-MUSIC, KR-Capon, 4-KR-MUSIC 및 4-KR-Capon 에 대응하는 c-2-KR-MUSIC-M, c-2-KR-Capon-M, c-4-KR-MUSIC-M 및 c-4-KR-Capon-M이 RMSE가 낮은 것을 보여준다. 즉, c-2-KR-MUSIC-M, c-2-KR-Capon-M, c-4-KR-MUSIC-M 및 c-4-KR-Capon-M이 KR-MUSIC, KR-Capon, 4-KR-MUSIC 및 4-KR-Capon 보다 오차가 작다는 것을 의미한다. 또한 도 9는 [수학식 37]의

Figure 112013042004143-pat00447
을 이용하여 점선과 RMSE의 차를 늘려준다. 따라서,
Figure 112013042004143-pat00448
는 더 정확한 DOA를 제공해주는 효과가 있다. FIG. 9 is a graph showing the results of the measurement of c-2-KR-MUSIC-M, c-2-KR-Capon-M and c-4-KR corresponding to KR-MUSIC, KR-Capon, 4-KR- -MUSIC-M and c-4-KR-Capon-M show low RMSE. Namely, c-2-KR-MUSIC-M, c-2-KR-Capon-M, c-4-KR- 4-KR-MUSIC and 4-KR-Capon. 9 is a graph showing the relationship
Figure 112013042004143-pat00447
To increase the difference between the dotted line and the RMSE. therefore,
Figure 112013042004143-pat00448
Provides a more accurate DOA.

도 10은 일반화된 가우시안 분포에서 생성된 협대역 비고정 음원 신호의 그래프이다. 도 10은 4-KR-MUSIC, c-4-KR-MUSIC, 4-KR-Capon 및 c-4-KR-Capon의 신호대잡음 신호비(SNR: Signal to noise ratio)에 대한 RMSE를 나타낸다. 도 10은

Figure 112013042004143-pat00449
,
Figure 112013042004143-pat00450
,
Figure 112013042004143-pat00451
,
Figure 112013042004143-pat00452
및 PoS=1 인 그래프이다.10 is a graph of narrowband unstructured excitation signal generated in a generalized Gaussian distribution. FIG. 10 shows the RMSE for the signal-to-noise ratio (SNR) of 4-KR-MUSIC, c-4-KR-MUSIC, 4-KR-Capon and c-4-KR-Capon. Figure 10
Figure 112013042004143-pat00449
,
Figure 112013042004143-pat00450
,
Figure 112013042004143-pat00451
,
Figure 112013042004143-pat00452
And PoS = 1.

도 10은 4-KR-MUSIC 및 4-KR-Capon에 대응하는 c-4-KR-MUSIC 및 c-4-KR-Capon이 RMSE가 낮은 것을 보여준다. 즉, c-4-KR-MUSIC 및 c-4-KR-Capon이 4-KR-MUSIC 및 4-KR-Capon보다 오차가 작다는 것을 의미한다.Figure 10 shows that the c-4-KR-MUSIC and c-4-KR-Capon corresponding to 4-KR-MUSIC and 4-KR-Capon have low RMSE. That is, the c-4-KR-MUSIC and the c-4-KR-Capon have a smaller error than the 4-KR-MUSIC and the 4-KR-Capon.

도 11은 일반화된 가우시안 분포에서 생성된 협대역 비고정 음원 신호의 그래프이다. 도 11은 4-KR-MUSIC, c-4-KR-MUSIC-M, 4-KR-Capon 및 c-4-KR-Capon-M의 SNR에 대한 RMSE를 나타낸다. 도 11은

Figure 112013042004143-pat00453
,
Figure 112013042004143-pat00454
,
Figure 112013042004143-pat00455
,
Figure 112013042004143-pat00456
및 PoS=1 인 그래프이다.11 is a graph of narrowband unstructured excitation signal generated in a generalized Gaussian distribution. Figure 11 shows the RMSE for the SNRs of 4-KR-MUSIC, c-4-KR-MUSIC-M, 4-KR-Capon and c-4-KR-Capon-M. 11
Figure 112013042004143-pat00453
,
Figure 112013042004143-pat00454
,
Figure 112013042004143-pat00455
,
Figure 112013042004143-pat00456
And PoS = 1.

도 11은 4-KR-MUSIC 및 4-KR-Capon 에 대응하는 c-4-KR-MUSIC-M 및 c-4-KR-Capon-M이 RMSE가 낮은 것을 보여준다. 즉, c-4-KR-MUSIC 및 c-4-KR-Capon이 4-KR-MUSIC 및 4-KR-Capon 보다 오차가 작다는 것을 의미한다. 또한 도 11은

Figure 112013042004143-pat00457
을 이용하여 점선과 RMSE의 차를 늘려준다. 따라서,
Figure 112013042004143-pat00458
는 더 정확한 DOA를 제공해주는 효과가 있다. Figure 11 shows that the c-4-KR-MUSIC-M and c-4-KR-Capon-M corresponding to 4-KR-MUSIC and 4-KR-Capon have low RMSE. That is, the c-4-KR-MUSIC and the c-4-KR-Capon have a smaller error than the 4-KR-MUSIC and the 4-KR-Capon. 11,
Figure 112013042004143-pat00457
To increase the difference between the dotted line and the RMSE. therefore,
Figure 112013042004143-pat00458
Provides a more accurate DOA.

도 12는 광대역 비고정 음원 신호인 음성 및 오디오의 그래프이다. 도 12는 KR-MUSIC, c-2-KR-MUSIC-M, KR-Capon, c-2-KR-Capon-M, 4-KR-MUSIC, c-4-KR-MUSIC-M, 4-KR-Capon 및 c-4-KR-Capon-M의 SNR에 대한 PoS를 나타낸다. 도 12는

Figure 112013042004143-pat00459
,
Figure 112013042004143-pat00460
Figure 112013042004143-pat00461
인 그래프이다.12 is a graph of voice and audio, which is a broadband unfixed sound source signal. FIG. 12 is a block diagram of the KR-MUSIC, c-2-KR-MUSIC-M, KR-Capon, c-2-KR-Capon-M, -Papon and c-4-KR-Capon-M. 12 is a cross-
Figure 112013042004143-pat00459
,
Figure 112013042004143-pat00460
And
Figure 112013042004143-pat00461
.

도 12는 p=1, 2일 때, c-2p-KR-MUSIC-M 및 c-2p-Capon-M이 2p-KR-MUSIC 및 2p-KR-Capon보다 높은 PoS를 보여준다. 도 12는 SNR이 낮고 p=2일 때, PoS가 특히 높은 것을 보여준다.Figure 12 shows the PoS higher than that of 2p-KR-MUSIC and 2p-KR-Capon when c = 2, p = 1 and 2, c-2p-KR-MUSIC-M and c-2p-Capon-M. Figure 12 shows that the PoS is particularly high when the SNR is low and p = 2.

도 13는 광대역 비고정 음원 신호인 음성 및 오디오의 그래프이다. 도 13는 KR-MUSIC, c-2-KR-MUSIC-M, KR-Capon, c-2-KR-Capon-M, 4-KR-MUSIC, c-4-KR-MUSIC-M, 4-KR-Capon 및 c-4-KR-Capon-M의 SNR에 대한 RMSE를 나타낸다. 도 12는

Figure 112013042004143-pat00462
,
Figure 112013042004143-pat00463
,
Figure 112013042004143-pat00464
및 PoS=0인 그래프이다.13 is a graph of voice and audio, which is a broadband unfixed sound source signal. FIG. 13 is a schematic diagram showing the structure of KR-MUSIC, c-2-KR-MUSIC-M, KR-Capon, c-2-KR-Capon-M, And the RMSE for SNR of c-4-KR-Capon-M. 12 is a cross-
Figure 112013042004143-pat00462
,
Figure 112013042004143-pat00463
,
Figure 112013042004143-pat00464
And PoS = 0.

도 13는 p=1, 2일 때, c-2p-KR-MUSIC-M 및 c-2p-Capon-M이 2p-KR-MUSIC 및 2p-KR-Capon보다 더 좋은 결과를 보여준다.Figure 13 shows better results for c-2p-KR-MUSIC-M and c-2p-Capon-M than for 2p-KR-MUSIC and 2p-KR-Capon when p =

도 14는 광대역 비고정 음원 신호인 음성 및 오디오의 그래프이다. 도 14는 4-KR-MUSIC, c-4-KR-MUSIC-M, 4-KR-Capon 및 c-4-KR-Capon-M의 SNR에 대한 PoS를 나타낸다. 도 14는

Figure 112013042004143-pat00465
,
Figure 112013042004143-pat00466
,
Figure 112013042004143-pat00467
Figure 112013042004143-pat00468
인 그래프이다.14 is a graph of voice and audio, which is a broadband unfixed sound source signal. FIG. 14 shows the PoS for the SNRs of 4-KR-MUSIC, c-4-KR-MUSIC-M, 4-KR-Capon and c-4-KR-Capon-M. Fig. 14
Figure 112013042004143-pat00465
,
Figure 112013042004143-pat00466
,
Figure 112013042004143-pat00467
And
Figure 112013042004143-pat00468
.

도 14는 c-4-KR-MUSIC-M 및 c-4-KR-Capon-M은 4-KR-MUSIC 및 4-KR-Capon보다 높은 PoS를 보여준다. 도 14는 특히 SNR이 낮을 때, PoS가 특히 높은 것을 보여준다.Figure 14 shows that the c-4-KR-MUSIC-M and c-4-KR-Capon-M have higher PoS than 4-KR-MUSIC and 4-KR-Capon. Figure 14 shows particularly high PoS when the SNR is low.

도 15는 광대역 비고정 음원 신호인 음성 및 오디오의 그래프이다. 도 14는 4-KR-MUSIC, c-4-KR-MUSIC-M, 4-KR-Capon 및 c-4-KR-Capon-M의 SNR에 대한 RMSE를 나타낸다. 도 15는

Figure 112013042004143-pat00469
,
Figure 112013042004143-pat00470
,
Figure 112013042004143-pat00471
Figure 112013042004143-pat00472
인 그래프이다.15 is a graph of voice and audio, which is a broadband unfixed sound source signal. 14 shows the RMSE for the SNRs of 4-KR-MUSIC, c-4-KR-MUSIC-M, 4-KR-Capon and c-4-KR-Capon-M. Fig. 15
Figure 112013042004143-pat00469
,
Figure 112013042004143-pat00470
,
Figure 112013042004143-pat00471
And
Figure 112013042004143-pat00472
.

도 15는 c-4-KR-MUSIC-M 및 c-4-KR-Capon-M은 4-KR-MUSIC 및 4-KR-Capon보다 더 좋은 결과를 보여준다. 도 15는 특히 SNR이 낮을 때, PoS가 특히 높은 것을 보여준다.
Figure 15 shows better results than 4-KR-MUSIC and 4-KR-Capon for c-4-KR-MUSIC-M and c-4-KR-Capon-M. Figure 15 shows particularly high PoS when the SNR is low.

도 16은 본 발명의 일 실시예에 따른 방향 추정 장치의 음원 추출 개수를 도시한 그래프이고, 도 17은 본 발명의 다른 실시예에 따른 방향 추정 장치의 음원 추출 개수를 도시한 그래프이며, 도 18은 본 발명의 또 다른 실시예에 따른 방향 추정 장치의 음원 추출 개수를 도시한 그래프이다.FIG. 16 is a graph showing the number of extracted sound sources of the direction estimating apparatus according to an embodiment of the present invention, FIG. 17 is a graph showing the number of extracted sound sources of the direction estimating apparatus according to another embodiment of the present invention, Is a graph showing the number of extracted sound sources of the direction estimating apparatus according to another embodiment of the present invention.

도 16 내지 도 18은 방향 추정 장치(1)은 음원 신호의 개수를 더 많이 추출할 수 있다.16 to 18, the direction estimating apparatus 1 can extract more the number of sound source signals.

도 16은 일반화된 가우시안 분포에서 생성된 협대역 비고정 음원 신호의 그래프이다. 도 16은 4-KR-MUSIC, c-4-KR-MUSIC, 4-KR-Capon 및 c-4-KR-Capon의 음원 신호의 개수 추출을 나타낸다. 도 16은

Figure 112013042004143-pat00473
,
Figure 112013042004143-pat00474
,
Figure 112013042004143-pat00475
,
Figure 112013042004143-pat00476
,
Figure 112013042004143-pat00477
Figure 112013042004143-pat00478
인 그래프이다. 16 is a graph of narrowband unstructured excitation signal generated in a generalized Gaussian distribution. Fig. 16 shows the number extraction of the sound source signals of 4-KR-MUSIC, c-4-KR-MUSIC, 4-KR-Capon and c-4-KR-Capon. 16 is a cross-
Figure 112013042004143-pat00473
,
Figure 112013042004143-pat00474
,
Figure 112013042004143-pat00475
,
Figure 112013042004143-pat00476
,
Figure 112013042004143-pat00477
And
Figure 112013042004143-pat00478
.

도 16(a)은 4-KR-MUSIC과 c-4-KR-MUSIC을 비교한 그래프이다. 도 16(a)는 c-4-KR-MUSIC의 4개 피크(peak)가 4-KR-MUSIC의 4개 피크보다 더 명확하게 보여준다. 따라서, 도 16(a)는 c-4-KR-MUSIC가 4-KR-MUSIC보다 더 많은 음원 신호를 추출할 수 있다는 것을 보여준다. 16 (a) is a graph comparing 4-KR-MUSIC with c-4-KR-MUSIC. 16 (a) shows four peaks of c-4-KR-MUSIC more clearly than four peaks of 4-KR-MUSIC. Thus, FIG. 16 (a) shows that c-4-KR-MUSIC can extract more source signals than 4-KR-MUSIC.

도 16(b)은 4-KR-Capon과 c-4-KR-Capon을 비교한 그래프이다. 도 16(b)는 c-4-KR-Capon의 4개 피크가 4-KR-Capon의 4개 피크보다 더 명확하게 보여준다. 따라서, 도 16(b)는 c-4-KR-Capon가 4-KR-Capon보다 더 많은 음원 신호를 추출할 수 있다는 것을 보여준다. 16 (b) is a graph comparing 4-KR-Capon with c-4-KR-Capon. Figure 16 (b) shows the four peaks of c-4-KR-Capon more clearly than the four peaks of 4-KR-Capon. Thus, FIG. 16 (b) shows that c-4-KR-Capon can extract more source signals than 4-KR-Capon.

도 17은 광대역 비고정 음원 신호인 음성 및 오디오의 그래프이다. 도 17은 KR-Capon, c-2-KR-Capon, 4-KR-Capon 및 c-4-KR-Capon의 음원 신호의 개수 추출을 나타낸다. 도 17은

Figure 112013042004143-pat00479
,
Figure 112013042004143-pat00480
,
Figure 112013042004143-pat00481
Figure 112013042004143-pat00482
인 그래프이다.17 is a graph of voice and audio, which is a broadband unfixed sound source signal. Figure 17 shows the number extraction of the source signals of KR-Capon, c-2-KR-Capon, 4-KR-Capon and c-4-KR-Capon. 17
Figure 112013042004143-pat00479
,
Figure 112013042004143-pat00480
,
Figure 112013042004143-pat00481
And
Figure 112013042004143-pat00482
.

도 17(a)은 KR-Capon과 c-2-KR-Capon을 비교한 그래프이다. 도 17(a)은 방향 추정 장치(1)이 c-2-KR-Capon을 이용하여 2개 피크가 추출하지만 KR-Capon을 이용해서는 1개 피크만 추출되는 것을 보여준다. 따라서, 도 17(a)은 c-2-KR-Capon이 KR-Capon보다 더 많은 음원 신호를 추출할 수 있다는 것을 보여준다. 17 (a) is a graph comparing KR-Capon with c-2-KR-Capon. 17 (a) shows that the direction estimating apparatus 1 extracts two peaks using c-2-KR-Capon but only one peak using KR-Capon. Thus, Fig. 17 (a) shows that c-2-KR-Capon can extract more source signals than KR-Capon.

도 17(b)은 4-KR-Capon과 c-4-KR-Capon을 비교한 그래프이다. 도 17(b)는 c-4-KR-Capon을 이용하여 2개 피크를 추출하지만 4-KR-Capon을 이용해서는 1개 피크밖에 추출되는 것을 보여준다. 따라서, 도 17(b)은 c-4-KR-Capon이 4-KR-Capon보다 더 많은 음원 신호를 추출할 수 있다는 것을 보여준다. 17 (b) is a graph comparing 4-KR-Capon with c-4-KR-Capon. Figure 17 (b) shows that two peaks are extracted using c-4-KR-Capon but only one peak is extracted using 4-KR-Capon. Thus, FIG. 17 (b) shows that c-4-KR-Capon can extract more source signals than 4-KR-Capon.

도 18은 광대역 비고정 음원 신호인 음성 및 오디오의 그래프이다. 도 18은 KR-MUSIC, c-2-KR-MUSIC, 4-KR-MUSIC 및 c-4-KR-MUSIC의 음원 신호의 개수 추출을 나타낸다. 도 18(a)은

Figure 112013042004143-pat00483
,
Figure 112013042004143-pat00484
,
Figure 112013042004143-pat00485
Figure 112013042004143-pat00486
인 그래프이고, 도 18(b)은
Figure 112013042004143-pat00487
,
Figure 112013042004143-pat00488
,
Figure 112013042004143-pat00489
Figure 112013042004143-pat00490
인 그래프이다. 18 is a graph of voice and audio, which is a broadband unfixed sound source signal. 18 shows the number extraction of the source signals of KR-MUSIC, c-2-KR-MUSIC, 4-KR-MUSIC and c-4-KR-MUSIC. 18 (a)
Figure 112013042004143-pat00483
,
Figure 112013042004143-pat00484
,
Figure 112013042004143-pat00485
And
Figure 112013042004143-pat00486
18 (b) is a graph in which
Figure 112013042004143-pat00487
,
Figure 112013042004143-pat00488
,
Figure 112013042004143-pat00489
And
Figure 112013042004143-pat00490
.

도 18(a)은 KR-MUSIC 및 c-2-KR-MUSIC을 비교한 그래프이다. 도 18(a)은 c-4-KR-MUSIC의 2개 피크가 4-KR-MUSIC의 2개 피크보다 더 명확하게 보여준다. 따라서, 도 18(a)은 c-4-KR-MUSIC이 4-KR-MUSIC보다 더 많은 음원 신호를 추출할 수 있다는 것을 보여준다. 18 (a) is a graph comparing KR-MUSIC and c-2-KR-MUSIC. Figure 18 (a) shows two peaks of c-4-KR-MUSIC more clearly than two peaks of 4-KR-MUSIC. Therefore, Fig. 18 (a) shows that c-4-KR-MUSIC can extract more sound source signals than 4-KR-MUSIC.

도 18(b)은 4-KR-MUSIC 및 c-4-KR-MUSIC을 비교한 그래프이다. 도 18(b)은 c-4-KR-MUSIC의 2개 피크가 4-KR-MUSIC의 2개 피크보다 더 명확하게 보여준다. 따라서, 도 18(b)은 c-4-KR-MUSIC이 4-KR-MUSIC보다 더 많은 음원 신호를 추출할 수 있다는 것을 보여준다.
18 (b) is a graph comparing 4-KR-MUSIC and c-4-KR-MUSIC. Figure 18 (b) shows two peaks of c-4-KR-MUSIC more clearly than two peaks of 4-KR-MUSIC. Thus, FIG. 18 (b) shows that c-4-KR-MUSIC can extract more source signals than 4-KR-MUSIC.

도 19는 본 발명의 일 실시예 따른 방향 추정 방법을 도시한 순서도이다.19 is a flowchart illustrating a direction estimation method according to an embodiment of the present invention.

도 19를 참조하면, 방향 추정 장치(1)는 음원의 신호를 분석하여 음원이 출력되는 방향을 추정하는 장치일 수 있다.Referring to FIG. 19, the direction estimating apparatus 1 may be a device for estimating a direction in which a sound source is output by analyzing a signal of a sound source.

센서부(220)는 신호를 감지한다(S100). 상기 감지된 신호는 음원으로부터 출력된 음원 신호 및 잡음 신호 중 적어도 하나를 포함할 수 있다. 상기 음원 신호는 비고정 신호이고, 상기 잡음 신호은 고정 신호일 수 있다.The sensor unit 220 senses a signal (S100). The sensed signal may include at least one of a sound source signal and a noise signal output from a sound source. The sound source signal may be a non-fixed signal, and the noise signal may be a fixed signal.

센서부(220)는 음원(110), 음원(120), 음원(130) 및 음원(140) 중 적어도 하나의 음원에서 출력하는 신호를 감지할 수 있다. 또한 센서부(220)는 센서의 개수가 음원의 개수보다 적을 수 있다.The sensor unit 220 can sense a signal output from at least one of the sound source 110, the sound source 120, the sound source 130, and the sound source 140. In addition, the sensor unit 220 may have a smaller number of sensors than the number of sound sources.

전처리부(320)는 아날로그 신호인 신호를 디지털 신호인 센서 신호로 ADC 변환을 한다(S110). 전처리부(320)는 신호를 샘플링하여 디지털 신호인 센서 신호로 변환할 수 있다. The preprocessing unit 320 performs an ADC conversion of a signal that is an analog signal to a sensor signal that is a digital signal (S110). The preprocessing unit 320 may convert the signal into a sensor signal, which is a digital signal.

신호 분석부(340)는 변환된 센서 신호에 포함되어 있는 잡음 신호를 필터링한다(S120). 신호 분석부(340)는 전처리부(320)에서 변화된 신호의 통계학적 분포 데이터를 산출할 수 있다. 또한 신호 분석부(340)는 고정 신호인 잡음 신호를 제거하고 비고정 신호인 음원 신호의 통계학적 분포 데이터만 추출할 수 있다. 신호 분석부(340)는 저역 통과 필터 및 대역 통과 필터 중 적어도 하나를 포함할 수 있다.The signal analyzer 340 filters the noise signal included in the converted sensor signal (S120). The signal analyzer 340 may calculate statistical distribution data of the signal changed by the preprocessor 320. Also, the signal analyzer 340 can remove the noise signal, which is a fixed signal, and extract only statistical distribution data of the sound source signal, which is a non-fixed signal. The signal analyzer 340 may include at least one of a low pass filter and a band pass filter.

신호 분석부(340)는 음원의 개수가 정해져 있는지 확인한다(S130). 신호 분석부(340)는 음원의 개수가 정해져 있는지 확인하고, 정해져 있을 경우와 정해지지 않은 경우에 따라 다른 알고리즘을 이용할 수 있다.The signal analyzer 340 checks whether the number of sound sources is fixed (S130). The signal analyzer 340 may check whether the number of sound sources is fixed, and use a different algorithm depending on whether the number of sound sources is fixed or not.

신호 분석부(340)는 음원의 개수가 정해져 있는 경우, c-2p-KR-MUSIC 알고리즘을 실행한다(S140). 신호 분석부(340)는 MUSIC 알고리즘 기반의 c-2p-KR-MUSIC 알고리즘을 이용하여 비특이 값을 산출할 수 있다.If the number of sound sources is determined, the signal analyzing unit 340 executes the c-2p-KR-MUSIC algorithm (S140). The signal analyzer 340 can calculate the nonspecific value using the c-2p-KR-MUSIC algorithm based on the MUSIC algorithm.

신호 분석부(340)는 음원의 개수가 정해지지 않은 경우, c-2p-KR-Capon 알고리즘을 실행한다(S150). 신호 분석부(340)는 Capon 알고리즘 기반의 c-2p-KR-Capon 알고리즘을 이용하여 비특이 값을 산출할 수 있다. If the number of sound sources is not determined, the signal analyzing unit 340 executes the c-2p-KR-Capon algorithm (S150). The signal analysis unit 340 can calculate the non-singular value using the c-2p-KR-Capon algorithm based on the Capon algorithm.

방향 추정부(360)는 산출된 비특이값을 이용하여 음원 방향을 추정한다(S160). 방향 추정부(360)는 단계 S140 및 단계 S150에서 산출된 비특이값의 가장 큰 값에 해당하는 음원 신호를 음원의 방향으로 추정할 수 있다.
The direction estimating unit 360 estimates the direction of the sound source using the calculated non-singular value (S160). The direction estimating unit 360 may estimate the sound source signal corresponding to the largest non-singular value calculated in steps S140 and S150 in the direction of the sound source.

도 20은 도 19의 S140을 더 상세하게 도시한 순서도이다.20 is a flowchart showing S140 in Fig. 19 in more detail.

도 20을 참조하면, 신호 분석부(340)는 음원 개수가 정해져 있는 경우에는 c-2p-KR-MUSIC 알고리즘을 실행할 수 있다.Referring to FIG. 20, the signal analyzer 340 can execute the c-2p-KR-MUSIC algorithm when the number of sound sources is fixed.

신호 분석부(340)는

Figure 112013042004143-pat00491
를 산출한다(S200). 신호 분석부(340)는 [수학식16a]를 이용하여 비특이 행렬
Figure 112013042004143-pat00492
을 산출할 수 있다. The signal analysis unit 340
Figure 112013042004143-pat00491
(S200). The signal analyzing unit 340 uses the equation (16a) to calculate a non-singular matrix
Figure 112013042004143-pat00492
Can be calculated.

신호 분석부(340)는

Figure 112013042004143-pat00493
를 산출한다(S210). 신호 분석부(340)는 [수학식 22]를 이용하여 라그랑주 승수
Figure 112013042004143-pat00494
을 산출할 수 있다. 신호 분석부(340)는 단계 S200에서 산출된
Figure 112013042004143-pat00495
를 이용하여
Figure 112013042004143-pat00496
을 산출할 수 있다.The signal analysis unit 340
Figure 112013042004143-pat00493
(S210). The signal analysis unit 340 uses the equation (22) to calculate the Lagrange multiplier
Figure 112013042004143-pat00494
Can be calculated. The signal analyzing unit 340 analyzes the signal
Figure 112013042004143-pat00495
Using
Figure 112013042004143-pat00496
Can be calculated.

신호 분석부(340)는

Figure 112013042004143-pat00497
를 산출한다(S220). 신호 분석부(340)는 [수학식 28] 또는 [수학식 29]을 이용하여 최적의 가중치 벡터
Figure 112013042004143-pat00498
을 산출할 수 있다. 신호 분석부(340)는 단계 S210에서 산출된
Figure 112013042004143-pat00499
을 이용하여
Figure 112013042004143-pat00500
을 산출할 수 있다.The signal analysis unit 340
Figure 112013042004143-pat00497
(S220). The signal analyzing unit 340 may calculate the optimal weight vector yk using Equation (28) or Equation (29)
Figure 112013042004143-pat00498
Can be calculated. The signal analyzing unit 340 analyzes the signal
Figure 112013042004143-pat00499
Using
Figure 112013042004143-pat00500
Can be calculated.

신호 분석부(340)는

Figure 112013042004143-pat00501
를 산출한다(S230). 신호 분석부(340)는 [수학식 35]를 이용하여 음원 신호를 나타내는 고유벡터
Figure 112013042004143-pat00502
및 잡음 신호를 나타내는 고유벡터
Figure 112013042004143-pat00503
에 모두 해당하는 고유값에 관련된 고유벡터
Figure 112013042004143-pat00504
을 산출할 수 있다. 신호 분석부(340)는 단계 S220에서 산출된
Figure 112013042004143-pat00505
를 이용하여
Figure 112013042004143-pat00506
를 산출할 수 있다.
The signal analysis unit 340
Figure 112013042004143-pat00501
(S230). The signal analyzing unit 340 uses the equation (35) to calculate the eigenvector representing the excitation signal
Figure 112013042004143-pat00502
And eigenvectors representing the noise signal
Figure 112013042004143-pat00503
Eigenvectors associated with all eigenvalues corresponding to
Figure 112013042004143-pat00504
Can be calculated. The signal analyzing unit 340 analyzes the signal
Figure 112013042004143-pat00505
Using
Figure 112013042004143-pat00506
Can be calculated.

도 21은 도 19의 S150을 더 상세하게 도시한 순서도이다.21 is a flowchart showing S150 in Fig. 19 in more detail.

도 21을 참조하면, 신호 분석부(340)는 음원의 개수가 정해져 있지 않은 경우에는 c-2p-KR-Capon 알고리즘을 실행할 수 있다.Referring to FIG. 21, the signal analyzer 340 can execute the c-2p-KR-Capon algorithm when the number of sound sources is not fixed.

신호 분석부(340)는

Figure 112013042004143-pat00507
를 산출한다(S300). 신호 분석부(340)는 [수학식16b]를 이용하여 비특이 행렬
Figure 112013042004143-pat00508
을 산출할 수 있다. The signal analysis unit 340
Figure 112013042004143-pat00507
(S300). The signal analyzing unit 340 uses the equation (16b) to calculate a non-singular matrix
Figure 112013042004143-pat00508
Can be calculated.

신호 분석부(340)는

Figure 112013042004143-pat00509
를 산출한다(S310). 신호 분석부(340)는 [수학식 22]를 이용하여 라그랑주 승수
Figure 112013042004143-pat00510
을 산출할 수 있다. 신호 분석부(340)는 단계 S300에서 산출된
Figure 112013042004143-pat00511
를 이용하여
Figure 112013042004143-pat00512
을 산출할 수 있다.The signal analysis unit 340
Figure 112013042004143-pat00509
(S310). The signal analysis unit 340 uses the equation (22) to calculate the Lagrange multiplier
Figure 112013042004143-pat00510
Can be calculated. The signal analyzing unit 340 analyzes the signal
Figure 112013042004143-pat00511
Using
Figure 112013042004143-pat00512
Can be calculated.

신호 분석부(340)는

Figure 112013042004143-pat00513
를 산출한다(S320). 신호 분석부(340)는 [수학식 28] 또는 [수학식 29]을 이용하여 최적의 가중치 벡터
Figure 112013042004143-pat00514
을 산출할 수 있다. 신호 분석부(340)는 단계 S310에서 산출된
Figure 112013042004143-pat00515
을 이용하여
Figure 112013042004143-pat00516
을 산출할 수 있다.The signal analysis unit 340
Figure 112013042004143-pat00513
(S320). The signal analyzing unit 340 may calculate the optimal weight vector yk using Equation (28) or Equation (29)
Figure 112013042004143-pat00514
Can be calculated. The signal analyzing unit 340 analyzes the signal
Figure 112013042004143-pat00515
Using
Figure 112013042004143-pat00516
Can be calculated.

신호 분석부(340)는

Figure 112013042004143-pat00517
를 산출한다(S330). 신호 분석부(340)는 [수학식 36]를 이용하여 음원 신호를 나타내는 고유벡터
Figure 112013042004143-pat00518
및 잡음 신호를 나타내는 고유벡터
Figure 112013042004143-pat00519
에 모두 해당하는 고유값에 관련된 고유벡터
Figure 112013042004143-pat00520
을 산출할 수 있다. 신호 분석부(340)는 단계 S320에서 산출된
Figure 112013042004143-pat00521
를 이용하여
Figure 112013042004143-pat00522
를 산출할 수 있다.
The signal analysis unit 340
Figure 112013042004143-pat00517
(S330). The signal analyzing unit 340 uses eq. (36) to calculate eigenvectors representing the excitation signal
Figure 112013042004143-pat00518
And eigenvectors representing the noise signal
Figure 112013042004143-pat00519
Eigenvectors associated with all eigenvalues corresponding to
Figure 112013042004143-pat00520
Can be calculated. The signal analyzing unit 340 analyzes the signal
Figure 112013042004143-pat00521
Using
Figure 112013042004143-pat00522
Can be calculated.

본 발명은 또한 컴퓨터로 읽을 수 있는 기록매체에 컴퓨터가 읽을 수 있는 코드로서 구현하는 것이 가능하다. 컴퓨터가 읽을 수 있는 기록매체는 컴퓨터 장치에 의하여 읽혀질 수 있는 데이터가 저장되는 모든 종류의 기록장치를 포함한다. 컴퓨터가 읽을 수 있는 기록매체의 예로는 ROM, RAM, CD-ROM, 자기 테이프, 플로피디스크, 광데이터 저장장치 등이 있으며, 또한 캐리어 웨이브(예를 들어 인터넷을 통한 전송)의 형태로 구현되는 것도 포함한다. 또한 컴퓨터가 읽을 수 있는 기록매체는 네트워크로 연결된 컴퓨터 장치에 분산되어 분산방식으로 컴퓨터가 읽을 수 있는 코드가 저장되고 실행될 수 있다.The present invention can also be embodied as computer-readable codes on a computer-readable recording medium. A computer-readable recording medium includes all kinds of recording apparatuses in which data that can be read by a computer apparatus is stored. Examples of the computer-readable recording medium include a ROM, a RAM, a CD-ROM, a magnetic tape, a floppy disk, an optical data storage device, and the like, and may be implemented in the form of a carrier wave (for example, transmission via the Internet) . The computer-readable recording medium may also be distributed to networked computer devices so that computer readable code can be stored and executed in a distributed manner.

이상에서 본 발명의 바람직한 실시예에 대해 도시하고 설명하였으나, 본 발명은 상술한 특정의 바람직한 실시예에 한정되지 아니하며, 청구범위에서 청구하는 본 발명의 요지를 벗어남이 없이 당해 발명이 속하는 기술분야에서 통상의 지식을 가진 자라면 누구든지 다양한 변형 실시가 가능한 것은 물론이고, 그와 같은 변경은 청구범위 기재의 범위 내에 있게 된다.
While the present invention has been particularly shown and described with reference to exemplary embodiments thereof, it is clearly understood that the same is by way of illustration and example only and is not to be taken by way of limitation in the embodiment in which said invention is directed. It will be understood by those skilled in the art that various changes in form and detail may be made therein without departing from the scope of the appended claims.

1: 방향 추정 장치 220: 센서부
240: 제어부 260: 출력부
280: 저장부 320: 전처리부
340: 신호 분석부 360: 방향 추정부
1: direction estimating device 220:
240: Control section 260: Output section
280: storage unit 320: preprocessing unit
340: Signal analysis unit 360: Direction estimation unit

Claims (12)

신호를 감지하고, 상기 감지한 신호에 대한 감지 신호인 센서 신호를 출력하는 적어도 두 개의 센서를 포함하는 센서부;
상기 적어도 두 개의 센서가 각각 출력한 센서 신호별로 상기 센서 신호의 통계학적 분포를 지시하는 통계학적 분포 데이터를 산출하고, 상기 산출된 통계학적 분포 데이터에서 상기 신호에 포함된 비고정(non-stationary) 신호인 음원 신호의 통계학적 분포를 지시하는 통계학적 분포 데이터를 추출하며, 상기 추출된 통계학적 분포 데이터를 기초로 상기 음원 신호를 출력한 음원의 방향을 추정하는 제어부를 포함하되,
상기 제어부는 상기 산출된 통계학적 분포 데이터로 커뮬런트(cumulant) 행렬을 산출하고, 상기 커뮬런트 행렬을 하기 수학식을 이용하여 산출하는 것을 특징으로 하는 방향 추정 장치.

[수학식]
Figure 112014039075711-pat00590

(여기서,
Figure 112014039075711-pat00591
는 k 번째 주파수 빈(frequency bin)의 2p차원 커뮬런트 행렬을 나타내고,
Figure 112014039075711-pat00592
는 k 번째 주파수 빈의 가상 배열 매니폴드(manifold) 벡터를 나타내며,
Figure 112014039075711-pat00593
는 고정 신호인 잡음 신호를 나타냄)
A sensor unit including at least two sensors for sensing a signal and outputting a sensor signal as a sensing signal for the sensed signal;
Wherein the at least two sensors output statistical distribution data indicating a statistical distribution of the sensor signals for each of the sensor signals outputted from the at least two sensors, A controller for extracting statistical distribution data indicating a statistical distribution of a sound source signal as a signal and estimating a direction of a sound source for outputting the sound source signal based on the extracted statistical distribution data,
Wherein the controller calculates a cumulant matrix using the calculated statistical distribution data and calculates the cumulant matrix using the following equation.

[Mathematical Expression]
Figure 112014039075711-pat00590

(here,
Figure 112014039075711-pat00591
Denotes a 2-dimensional convolution matrix of the k-th frequency bin,
Figure 112014039075711-pat00592
Denotes a virtual array manifold vector of the k-th frequency bin,
Figure 112014039075711-pat00593
Represents a noise signal which is a fixed signal)
제 1항에 있어서,
상기 센서부에 포함된 센서의 개수는 상기 음원의 개수보다 같거나 적은 것을 특징으로 하는 방향 추정 장치.
The method according to claim 1,
Wherein the number of sensors included in the sensor unit is equal to or less than the number of the sound sources.
제 1항에 있어서,
상기 통계학적 분포 데이터는 상기 음원 신호의 시간에 따른 변화 및 특성 변화를 지시하는 데이터를 포함하는 것을 특징으로 하는 방향 추정 장치.
The method according to claim 1,
Wherein the statistical distribution data includes data indicating a change with time and a change in a characteristic of the sound source signal.
제 1항에 있어서,
상기 산출된 통계학적 분포는 가우시안 분포, 비 가우시안 분포, 라플라스 분포 및 빔포밍 분포 중 적어도 하나인 것을 특징으로 하는 방향 추정 장치.
The method according to claim 1,
Wherein the calculated statistical distribution is at least one of a Gaussian distribution, a non-Gaussian distribution, a Laplacian distribution, and a beamforming distribution.
삭제delete 제 1항에 있어서,
상기 제어부는,
상기 센서 신호를 디지털 신호로 변환하는 전처리부;
상기 변환된 디지털 신호의 통계학적 분포를 지시하는 통계학적 분포 데이터를 산출하고, 상기 산출된 통계학적 분포 데이터에서 상기 신호에 포함된 잡음 신호에 대한 데이터를 제거하여 상기 음원 신호의 통계학적 분포를 지시하는 통계학적 분포 데이터를 추출하며, 상기 추출된 통계학적 분포 데이터를 이용하여 상기 디지털 신호의 음원의 개수 및 방향에 대한 공간 스펙트럼(spatial spectrum)을 산출하는 신호 분석부; 및
상기 산출된 디지털 신호의 공간 스펙트럼의 피크(peak)를 상기 음원의 방향인 것으로 추정하는 방향 추정부를 포함하는 것을 특징으로 하는 방향 추정 장치.
The method according to claim 1,
Wherein,
A preprocessor for converting the sensor signal into a digital signal;
Calculating statistical distribution data indicative of a statistical distribution of the converted digital signal, removing data on a noise signal included in the signal from the calculated statistical distribution data to indicate a statistical distribution of the sound source signal A signal analyzer for calculating a spatial spectrum of the number and direction of sound sources of the digital signal using the extracted statistical distribution data; And
And a direction estimator for estimating a peak of the spatial spectrum of the calculated digital signal as a direction of the sound source.
제 6항에 있어서,
상기 신호 분석부는 상기 공간 스펙트럼을 하기에 기재된 수학식 및 조건식을 이용하여 산출하는 것을 특징으로 하는 방향 추정 장치:
[수학식]
Figure 112013042004143-pat00527

[조건식]
Figure 112013042004143-pat00528

여기서,
Figure 112013042004143-pat00529
는 k 번째 주파수 빈의 가중치 벡터를 나타내고,
Figure 112013042004143-pat00530
는 k 번째 주파수 빈에서
Figure 112013042004143-pat00531
의 가상 배열 매니폴드(manifold) 벡터를 나타낸다. 또한
Figure 112013042004143-pat00532
는 비특이 행렬을 나타내고,
Figure 112013042004143-pat00533
은 임의의 0이 아닌 실제 상수이다.
The method according to claim 6,
And the signal analyzer calculates the spatial spectrum using the following equations and conditional expressions:
[Mathematical Expression]
Figure 112013042004143-pat00527

[Conditional expression]
Figure 112013042004143-pat00528

here,
Figure 112013042004143-pat00529
Represents the weight vector of the k-th frequency bin,
Figure 112013042004143-pat00530
Lt; RTI ID = 0.0 > k &
Figure 112013042004143-pat00531
Manifold < / RTI > Also
Figure 112013042004143-pat00532
Represents a non-singular matrix,
Figure 112013042004143-pat00533
Is an arbitrary non-zero real constant.
제 6항 또는 제 7항에 있어서,
상기 신호 분석부는 음원(I)가 정해져있는 경우 및 정해지지 않은 경우에 따라 하기에 기재된 수학식을 이용하여, 상기 비특이 행렬
Figure 112013042004143-pat00534
을 산출하는 것을 특징으로 하는 방향 추정 장치:
[수학식]
Figure 112013042004143-pat00535

Figure 112013042004143-pat00536
는 고유벡터
Figure 112013042004143-pat00537
이고, 영이 아닌 고유값에 해당하는 고유벡터이다.
Figure 112013042004143-pat00538
는 고유벡터
Figure 112013042004143-pat00539
이고, 영인 고유값에 해당하는 고유벡터이다.
Figure 112013042004143-pat00540
는 음원의 개수이고,
Figure 112013042004143-pat00541
Figure 112013042004143-pat00542
단위 행렬이다.
Figure 112013042004143-pat00543
는 음원 신호를 나타내는 고유벡터
Figure 112013042004143-pat00544
및 잡음 신호를 나타내는 고유벡터
Figure 112013042004143-pat00545
에 모두 해당하는 고유값에 관련된 고유벡터이고,
Figure 112013042004143-pat00546
는 잡음 신호 제거 및 치수 조정된 2p차원 커뮬런트 행렬이다.
8. The method according to claim 6 or 7,
The signal analyzing unit may use the mathematical formulas described below according to whether the sound source (I) is fixed or not, and the non-singular matrix
Figure 112013042004143-pat00534
The direction estimating apparatus comprising:
[Mathematical Expression]
Figure 112013042004143-pat00535

Figure 112013042004143-pat00536
Eigenvectors
Figure 112013042004143-pat00537
And is an eigenvector corresponding to a non-zero eigenvalue.
Figure 112013042004143-pat00538
Eigenvectors
Figure 112013042004143-pat00539
And is an eigenvector corresponding to an eigenvalue of zero.
Figure 112013042004143-pat00540
Is the number of sound sources,
Figure 112013042004143-pat00541
The
Figure 112013042004143-pat00542
Unit matrix.
Figure 112013042004143-pat00543
Is an eigenvector
Figure 112013042004143-pat00544
And eigenvectors representing the noise signal
Figure 112013042004143-pat00545
Is an eigenvector related to eigenvalues corresponding to all eigenvectors,
Figure 112013042004143-pat00546
Is a 2p-dimensional com- plement matrix with noise cancellation and dimension adjustment.
제 8항에 있어서,
상기 신호 분석부는 상기 음원의 개수가 사전에 정해진 경우에는,
상기 비특이 행렬
Figure 112013042004143-pat00547
를 상기 고유벡터
Figure 112013042004143-pat00548
및 상기 고유벡터
Figure 112013042004143-pat00549
를 이용하여 산출하고, 상기 산출된 비특이 행렬
Figure 112013042004143-pat00550
를 이용하여 라그랑주 승수
Figure 112013042004143-pat00551
를 산출하며, 상기 산출된
Figure 112013042004143-pat00552
를 이용하여 최적의 가중치 벡터
Figure 112013042004143-pat00553
를 산출하고, 상기 산출된
Figure 112013042004143-pat00554
및 상기 고유 벡터
Figure 112013042004143-pat00555
를 이용하여 고유벡터
Figure 112013042004143-pat00556
를 산출하는 것을 특징으로 하는 방향 추정 장치.
9. The method of claim 8,
Wherein the signal analyzing unit, when the number of the sound sources is predetermined,
The non-singular matrix
Figure 112013042004143-pat00547
Lt; / RTI >
Figure 112013042004143-pat00548
And the eigenvector
Figure 112013042004143-pat00549
, And the calculated non-specific matrix
Figure 112013042004143-pat00550
Using the Lagrange multiplier
Figure 112013042004143-pat00551
, And the calculated
Figure 112013042004143-pat00552
The optimal weight vector < RTI ID = 0.0 >
Figure 112013042004143-pat00553
, And the calculated
Figure 112013042004143-pat00554
And the eigenvector
Figure 112013042004143-pat00555
Using eigenvectors
Figure 112013042004143-pat00556
Of the direction estimating device.
제 8항에 있어서,
상기 신호 분석부는 상기 음원의 개수가 사전에 정해지지 않은 경우에는,
상기 비특이 행렬
Figure 112013042004143-pat00557
를 2p차원 커뮬런트 행렬
Figure 112013042004143-pat00558
를 이용하여 산출하고, 상기 산출된 비특이 행렬
Figure 112013042004143-pat00559
를 이용하여 라그랑주 승수
Figure 112013042004143-pat00560
를 산출하며, 상기 산출된
Figure 112013042004143-pat00561
를 이용하여 최적의 가중치 벡터
Figure 112013042004143-pat00562
를 산출하고, 상기 산출된
Figure 112013042004143-pat00563
및 상기 2p차원 커뮬런트 행렬
Figure 112013042004143-pat00564
를 이용하여 고유벡터
Figure 112013042004143-pat00565
를 산출하는 것을 특징으로 하는 방향 추정 장치.
9. The method of claim 8,
Wherein the signal analyzing unit, when the number of the sound sources is not predetermined,
The non-singular matrix
Figure 112013042004143-pat00557
A 2p-dimensional convolution matrix
Figure 112013042004143-pat00558
, And the calculated non-specific matrix
Figure 112013042004143-pat00559
Using the Lagrange multiplier
Figure 112013042004143-pat00560
, And the calculated
Figure 112013042004143-pat00561
The optimal weight vector < RTI ID = 0.0 >
Figure 112013042004143-pat00562
, And the calculated
Figure 112013042004143-pat00563
And the 2p-dimensional convolution matrix
Figure 112013042004143-pat00564
Using eigenvectors
Figure 112013042004143-pat00565
Of the direction estimating device.
제 8항에 있어서,
상기 방향 추정부는 상기 2p차원 커뮬런트 행렬
Figure 112013042004143-pat00566
를 이용하여 산출된 비특이값들 중 가장 큰 비특이 값을 가지는 상기 고유벡터
Figure 112013042004143-pat00567
에 해당하는 상기 음원 신호의 방향각을 음원의 방향으로 추정하는 것을 특징으로 하는 방향 추정 장치.
9. The method of claim 8,
The direction estimating unit may calculate the 2p-dimensional convolution matrix
Figure 112013042004143-pat00566
The eigenvector having the largest non-singular value among the non-singular values calculated using the eigenvectors
Figure 112013042004143-pat00567
Estimates the direction angle of the sound source signal corresponding to the direction of the sound source in the direction of the sound source.
신호를 감지하고, 상기 감지한 신호에 대한 감지 신호인 센서 신호를 출력하는 단계;
상기 출력한 센서 신호별로 상기 센서 신호의 통계학적 분포를 지시하는 통계학적 분포 데이터를 산출하고, 상기 산출된 통계학적 분포 데이터에서 상기 신호에 포함된 비고정(non-stationary) 신호인 음원 신호의 통계학적 분포를 지시하는 통계학적 분포 데이터를 추출하는 단계;
상기 추출된 통계학적 분포 데이터를 기초로 상기 음원 신호를 출력한 음원의 방향을 추정하는 단계를 포함하되,
상기 산출된 센서 신호의 통계학적 분포를 지시하는 통계학적 분포 데이터로 커뮬런트(cumulant) 행렬을 산출하고, 상기 커뮬런트 행렬을 하기 수학식을 이용하여 산출하는 것을 특징으로 하는 방향 추정 방법.

[수학식]
Figure 112014039075711-pat00594

(여기서,
Figure 112014039075711-pat00595
는 k 번째 주파수 빈(frequency bin)의 2p차원 커뮬런트 행렬을 나타내고,
Figure 112014039075711-pat00596
는 k 번째 주파수 빈의 가상 배열 매니폴드(manifold) 벡터를 나타내며,
Figure 112014039075711-pat00597
는 고정 신호인 잡음 신호를 나타냄)
Detecting a signal and outputting a sensor signal as a sensing signal for the sensed signal;
The statistical distribution data indicating the statistical distribution of the sensor signals is calculated for each of the output sensor signals, and the statistical distribution data of the source signal, which is a non-stationary signal included in the signal, Extracting statistical distribution data indicative of the distribution;
Estimating a direction of a sound source that has output the sound source signal based on the extracted statistical distribution data,
A cumulant matrix is calculated from statistical distribution data indicating a statistical distribution of the sensor signals, and the cumulant matrix is calculated using the following equation.

[Mathematical Expression]
Figure 112014039075711-pat00594

(here,
Figure 112014039075711-pat00595
Denotes a 2-dimensional convolution matrix of the k-th frequency bin,
Figure 112014039075711-pat00596
Denotes a virtual array manifold vector of the k-th frequency bin,
Figure 112014039075711-pat00597
Represents a noise signal which is a fixed signal)
KR20130053828A 2013-05-13 2013-05-13 DOA estimation Device and Method KR101413229B1 (en)

Priority Applications (2)

Application Number Priority Date Filing Date Title
KR20130053828A KR101413229B1 (en) 2013-05-13 2013-05-13 DOA estimation Device and Method
US14/070,716 US20140334265A1 (en) 2013-05-13 2013-11-04 Direction of Arrival (DOA) Estimation Device and Method

Applications Claiming Priority (1)

Application Number Priority Date Filing Date Title
KR20130053828A KR101413229B1 (en) 2013-05-13 2013-05-13 DOA estimation Device and Method

Publications (1)

Publication Number Publication Date
KR101413229B1 true KR101413229B1 (en) 2014-08-06

Family

ID=51748601

Family Applications (1)

Application Number Title Priority Date Filing Date
KR20130053828A KR101413229B1 (en) 2013-05-13 2013-05-13 DOA estimation Device and Method

Country Status (2)

Country Link
US (1) US20140334265A1 (en)
KR (1) KR101413229B1 (en)

Cited By (5)

* Cited by examiner, † Cited by third party
Publication number Priority date Publication date Assignee Title
CN105301557A (en) * 2015-11-06 2016-02-03 中国石油大学(华东) Direction-of-arrival estimate configuration method
KR20180056391A (en) * 2016-11-16 2018-05-28 고려대학교 산학협력단 Device and method for detecting ultrasonic-sensor attack
KR20190023463A (en) 2017-08-29 2019-03-08 현대오트론 주식회사 Apparatus and method for identifying object in vehicel
CN109959891A (en) * 2019-04-11 2019-07-02 南京航空航天大学 The dimensionality reduction spectrum peak search method of Space Angle and polarization parameter in L gusts of electromagnetic vector
CN112379327A (en) * 2020-12-01 2021-02-19 北京工业大学 Two-dimensional DOA estimation and cross coupling correction method based on rank loss estimation

Families Citing this family (18)

* Cited by examiner, † Cited by third party
Publication number Priority date Publication date Assignee Title
CN105676168B (en) * 2015-12-02 2018-03-06 江苏科技大学 A kind of acoustic vector sensor array direction estimation method
CN106526565B (en) * 2016-12-06 2019-02-22 哈尔滨工业大学 A kind of single-bit Estimation of Spatial Spectrum method based on support vector machines
US11079462B2 (en) 2017-10-24 2021-08-03 International Business Machines Corporation Facilitation of efficient signal source location employing a coarse algorithm and high-resolution computation
KR102323655B1 (en) * 2018-01-08 2021-11-09 현대모비스 주식회사 Method and apparatus for estimating direction of arrival using generation of virtual received signals
CN108713323B (en) * 2018-05-30 2019-11-15 歌尔股份有限公司 Estimate the method and apparatus of arrival direction
CN109188345B (en) * 2018-08-27 2023-03-10 电子科技大学 Coherent signal source DOA estimation method based on pre-delay space-time structure removal
CN109781791A (en) * 2019-02-22 2019-05-21 广西大学 Electrical impedance imaging method based on spatial spectral estimation algorithm
CN109932679B (en) * 2019-02-28 2020-11-06 南京航空航天大学 Method for estimating maximum likelihood angle resolution of sensor array system
CN110161452B (en) * 2019-04-28 2023-03-21 西安电子科技大学 Direction-of-arrival estimation method based on cross-prime L-shaped electromagnetic vector sensor array
CN110927664B (en) * 2019-05-16 2023-07-11 陕西理工大学 Near-field sound source parameter estimation based on cyclic third-order moment and compressed sensing
CN110927663A (en) * 2019-05-16 2020-03-27 陕西理工大学 Three-dimensional compressed sensing dimension reduction method for near-field sound source parameter estimation
CN110927662A (en) * 2019-05-16 2020-03-27 陕西理工大学 Near-field multi-parameter fourth-order cumulant estimation method based on acoustic vector sensor
KR20210093550A (en) * 2020-01-20 2021-07-28 삼성전자주식회사 Object detection device and vehicle control system including the same
CN111665469B (en) * 2020-06-11 2022-08-23 浙江大学 Underwater multipath signal parameter estimation method based on spatial time-frequency distribution
CN112363109B (en) * 2020-11-12 2023-06-23 西安科技大学 Weighted direction of arrival estimation method based on broadband strong and weak adjacent signals
CN112363110B (en) * 2020-11-30 2021-12-21 海南大学 Grid-free single-bit DOA estimation method based on nested cross dipole array
CN116054909B (en) * 2022-12-16 2023-08-08 广东工业大学 Satellite communication anti-interference method based on improved propagation operator
CN116299150B (en) * 2022-12-27 2023-12-01 南京航空航天大学 Two-dimensional DOA estimation method of dimension-reduction propagation operator in uniform area array

Citations (3)

* Cited by examiner, † Cited by third party
Publication number Priority date Publication date Assignee Title
KR20030087373A (en) * 2002-05-08 2003-11-14 삼성전자주식회사 Vector quantization and inverse vector quantization apparatus for the speech signal and method thereof
KR20100065811A (en) * 2008-12-09 2010-06-17 한국전자통신연구원 Apparatus and method for speech recognition by using source separation and source identification
KR20110002533A (en) * 2009-07-02 2011-01-10 세종대학교산학협력단 Apparatus and method for quantizing speech signal

Patent Citations (3)

* Cited by examiner, † Cited by third party
Publication number Priority date Publication date Assignee Title
KR20030087373A (en) * 2002-05-08 2003-11-14 삼성전자주식회사 Vector quantization and inverse vector quantization apparatus for the speech signal and method thereof
KR20100065811A (en) * 2008-12-09 2010-06-17 한국전자통신연구원 Apparatus and method for speech recognition by using source separation and source identification
KR20110002533A (en) * 2009-07-02 2011-01-10 세종대학교산학협력단 Apparatus and method for quantizing speech signal

Cited By (6)

* Cited by examiner, † Cited by third party
Publication number Priority date Publication date Assignee Title
CN105301557A (en) * 2015-11-06 2016-02-03 中国石油大学(华东) Direction-of-arrival estimate configuration method
KR20180056391A (en) * 2016-11-16 2018-05-28 고려대학교 산학협력단 Device and method for detecting ultrasonic-sensor attack
KR102045286B1 (en) * 2016-11-16 2019-11-18 고려대학교 산학협력단 Device and method for detecting ultrasonic-sensor attack
KR20190023463A (en) 2017-08-29 2019-03-08 현대오트론 주식회사 Apparatus and method for identifying object in vehicel
CN109959891A (en) * 2019-04-11 2019-07-02 南京航空航天大学 The dimensionality reduction spectrum peak search method of Space Angle and polarization parameter in L gusts of electromagnetic vector
CN112379327A (en) * 2020-12-01 2021-02-19 北京工业大学 Two-dimensional DOA estimation and cross coupling correction method based on rank loss estimation

Also Published As

Publication number Publication date
US20140334265A1 (en) 2014-11-13

Similar Documents

Publication Publication Date Title
KR101413229B1 (en) DOA estimation Device and Method
Mao et al. Rnn-based room scale hand motion tracking
KR101238362B1 (en) Method and apparatus for filtering the sound source signal based on sound source distance
JP4248445B2 (en) Microphone array method and system, and voice recognition method and apparatus using the same
US10127922B2 (en) Sound source identification apparatus and sound source identification method
US20170140771A1 (en) Information processing apparatus, information processing method, and computer program product
US9420368B2 (en) Time-frequency directional processing of audio signals
EP2530484B1 (en) Sound source localization apparatus and method
WO2016100460A1 (en) Systems and methods for source localization and separation
CN111418012B (en) Method for processing an audio signal and audio processing device
US9971012B2 (en) Sound direction estimation device, sound direction estimation method, and sound direction estimation program
US9549274B2 (en) Sound processing apparatus, sound processing method, and sound processing program
JP2019117055A (en) Estimation method, estimation device and program
EP3050056B1 (en) Time-frequency directional processing of audio signals
JP2022135451A (en) Acoustic processing device, acoustic processing method, and program
US20180188104A1 (en) Signal detection device, signal detection method, and recording medium
Salvati et al. Diagonal unloading beamforming in the spherical harmonic domain for acoustic source localization in reverberant environments
KR100621076B1 (en) Microphone array method and system, and speech recongnition method and system using the same
CN112346012A (en) Sound source position determining method and device, readable storage medium and electronic equipment
US11646009B1 (en) Autonomously motile device with noise suppression
CN108713323B (en) Estimate the method and apparatus of arrival direction
JP5387442B2 (en) Signal processing device
Vasylyshyn et al. Speech enhancement using modified SSA
Lim et al. Time delay estimation based on log-sum and lp-norm penalized minor component analysis
JP2017151216A (en) Sound source direction estimation device, sound source direction estimation method, and program

Legal Events

Date Code Title Description
E701 Decision to grant or registration of patent right
GRNT Written decision to grant
FPAY Annual fee payment

Payment date: 20170530

Year of fee payment: 4

FPAY Annual fee payment

Payment date: 20180525

Year of fee payment: 5

FPAY Annual fee payment

Payment date: 20191230

Year of fee payment: 6

R401 Registration of restoration