JP7448476B2 - System and method for fast neural network-based image segmentation and radiopharmaceutical uptake determination - Google Patents
System and method for fast neural network-based image segmentation and radiopharmaceutical uptake determination Download PDFInfo
- Publication number
- JP7448476B2 JP7448476B2 JP2020537168A JP2020537168A JP7448476B2 JP 7448476 B2 JP7448476 B2 JP 7448476B2 JP 2020537168 A JP2020537168 A JP 2020537168A JP 2020537168 A JP2020537168 A JP 2020537168A JP 7448476 B2 JP7448476 B2 JP 7448476B2
- Authority
- JP
- Japan
- Prior art keywords
- image
- volume
- subject
- prostate
- processor
- Prior art date
- Legal status (The legal status is an assumption and is not a legal conclusion. Google has not performed a legal analysis and makes no representation as to the accuracy of the status listed.)
- Active
Links
- 238000000034 method Methods 0.000 title claims description 277
- 239000012217 radiopharmaceutical Substances 0.000 title claims description 86
- 229940121896 radiopharmaceutical Drugs 0.000 title claims description 85
- 230000002799 radiopharmaceutical effect Effects 0.000 title claims description 85
- 238000003709 image segmentation Methods 0.000 title description 26
- 238000013528 artificial neural network Methods 0.000 title description 18
- 210000001519 tissue Anatomy 0.000 claims description 301
- 210000002307 prostate Anatomy 0.000 claims description 288
- 230000011218 segmentation Effects 0.000 claims description 203
- 238000002603 single-photon emission computed tomography Methods 0.000 claims description 185
- 238000013527 convolutional neural network Methods 0.000 claims description 184
- 208000000236 Prostatic Neoplasms Diseases 0.000 claims description 110
- 206010060862 Prostate cancer Diseases 0.000 claims description 109
- 238000003384 imaging method Methods 0.000 claims description 77
- 101000892862 Homo sapiens Glutamate carboxypeptidase 2 Proteins 0.000 claims description 73
- 102100041003 Glutamate carboxypeptidase 2 Human genes 0.000 claims description 72
- 210000004197 pelvis Anatomy 0.000 claims description 59
- 239000011230 binding agent Substances 0.000 claims description 58
- 210000003205 muscle Anatomy 0.000 claims description 54
- 210000003049 pelvic bone Anatomy 0.000 claims description 53
- 230000015654 memory Effects 0.000 claims description 45
- 230000006870 function Effects 0.000 claims description 43
- 238000012545 processing Methods 0.000 claims description 37
- 210000000988 bone and bone Anatomy 0.000 claims description 33
- 206010028980 Neoplasm Diseases 0.000 claims description 27
- 238000009206 nuclear medicine Methods 0.000 claims description 27
- 210000000664 rectum Anatomy 0.000 claims description 26
- 230000004044 response Effects 0.000 claims description 26
- 238000009877 rendering Methods 0.000 claims description 23
- 238000004891 communication Methods 0.000 claims description 21
- 238000002405 diagnostic procedure Methods 0.000 claims description 20
- 230000002452 interceptive effect Effects 0.000 claims description 18
- 230000005855 radiation Effects 0.000 claims description 18
- 238000004364 calculation method Methods 0.000 claims description 17
- 230000037406 food intake Effects 0.000 claims description 17
- 238000001514 detection method Methods 0.000 claims description 12
- 230000000007 visual effect Effects 0.000 claims description 8
- 239000013066 combination product Substances 0.000 claims description 6
- 229940127555 combination product Drugs 0.000 claims description 6
- 230000000877 morphologic effect Effects 0.000 claims description 4
- 229920001481 poly(stearyl methacrylate) Polymers 0.000 claims description 4
- 238000002591 computed tomography Methods 0.000 description 253
- 230000000875 corresponding effect Effects 0.000 description 176
- 210000003932 urinary bladder Anatomy 0.000 description 174
- 238000004458 analytical method Methods 0.000 description 80
- 238000010801 machine learning Methods 0.000 description 74
- 238000012549 training Methods 0.000 description 50
- 238000003908 quality control method Methods 0.000 description 44
- 238000013473 artificial intelligence Methods 0.000 description 41
- 210000001981 hip bone Anatomy 0.000 description 39
- 238000010586 diagram Methods 0.000 description 36
- 230000008569 process Effects 0.000 description 36
- 201000010099 disease Diseases 0.000 description 32
- 208000037265 diseases, disorders, signs and symptoms Diseases 0.000 description 32
- 238000013459 approach Methods 0.000 description 31
- 230000004807 localization Effects 0.000 description 30
- 238000012360 testing method Methods 0.000 description 30
- 238000012552 review Methods 0.000 description 29
- 230000035945 sensitivity Effects 0.000 description 28
- 238000002600 positron emission tomography Methods 0.000 description 27
- 238000010191 image analysis Methods 0.000 description 26
- 210000003484 anatomy Anatomy 0.000 description 25
- 210000000056 organ Anatomy 0.000 description 24
- 238000007781 pre-processing Methods 0.000 description 22
- 238000003860 storage Methods 0.000 description 22
- 150000003839 salts Chemical class 0.000 description 21
- 239000002872 contrast media Substances 0.000 description 19
- 239000010949 copper Substances 0.000 description 18
- 238000010200 validation analysis Methods 0.000 description 16
- 201000011510 cancer Diseases 0.000 description 15
- 238000013170 computed tomography imaging Methods 0.000 description 15
- 238000011282 treatment Methods 0.000 description 14
- 238000003745 diagnosis Methods 0.000 description 13
- 238000004422 calculation algorithm Methods 0.000 description 12
- 229910052751 metal Inorganic materials 0.000 description 11
- 239000002184 metal Substances 0.000 description 11
- 238000011472 radical prostatectomy Methods 0.000 description 11
- FIHVIDKDARACGD-VABKMULXSA-N (2s)-2-[[(1s)-4-[[(1s)-5-[bis[[1-[2-[bis(carboxymethyl)amino]-2-oxoethyl]imidazol-2-yl]methyl]amino]-1-carboxypentyl]amino]-1-carboxy-4-oxobutyl]carbamoylamino]pentanedioic acid Chemical compound N=1C=CN(CC(=O)N(CC(O)=O)CC(O)=O)C=1CN(CCCC[C@H](NC(=O)CC[C@H](NC(=O)N[C@@H](CCC(=O)O)C(O)=O)C(O)=O)C(O)=O)CC1=NC=CN1CC(=O)N(CC(O)=O)CC(O)=O FIHVIDKDARACGD-VABKMULXSA-N 0.000 description 10
- 238000001574 biopsy Methods 0.000 description 10
- 230000003993 interaction Effects 0.000 description 10
- 238000002595 magnetic resonance imaging Methods 0.000 description 10
- 210000004872 soft tissue Anatomy 0.000 description 10
- 238000012879 PET imaging Methods 0.000 description 9
- 238000012937 correction Methods 0.000 description 9
- 238000005259 measurement Methods 0.000 description 9
- 238000011002 quantification Methods 0.000 description 9
- 150000001875 compounds Chemical class 0.000 description 8
- 238000001914 filtration Methods 0.000 description 8
- 238000010606 normalization Methods 0.000 description 8
- 241000489861 Maximus Species 0.000 description 7
- 238000009826 distribution Methods 0.000 description 7
- 230000001629 suppression Effects 0.000 description 7
- 238000002604 ultrasonography Methods 0.000 description 7
- OLWVRJUNLXQDSP-RYUDHWBXSA-N (2s)-2-[[(1s)-1-carboxy-5-[(6-fluoropyridine-3-carbonyl)amino]pentyl]carbamoylamino]pentanedioic acid Chemical compound OC(=O)CC[C@@H](C(O)=O)NC(=O)N[C@H](C(O)=O)CCCCNC(=O)C1=CC=C(F)N=C1 OLWVRJUNLXQDSP-RYUDHWBXSA-N 0.000 description 6
- RYGMFSIKBFXOCR-UHFFFAOYSA-N Copper Chemical compound [Cu] RYGMFSIKBFXOCR-UHFFFAOYSA-N 0.000 description 6
- 230000008901 benefit Effects 0.000 description 6
- 238000004590 computer program Methods 0.000 description 6
- 229910052802 copper Inorganic materials 0.000 description 6
- 210000001165 lymph node Anatomy 0.000 description 6
- 230000002829 reductive effect Effects 0.000 description 6
- WUAPFZMCVAUBPE-NJFSPNSNSA-N 188Re Chemical compound [188Re] WUAPFZMCVAUBPE-NJFSPNSNSA-N 0.000 description 5
- GYHNNYVSQQEPJS-UHFFFAOYSA-N Gallium Chemical compound [Ga] GYHNNYVSQQEPJS-UHFFFAOYSA-N 0.000 description 5
- 229910052765 Lutetium Inorganic materials 0.000 description 5
- 230000009471 action Effects 0.000 description 5
- 238000011156 evaluation Methods 0.000 description 5
- 229910052733 gallium Inorganic materials 0.000 description 5
- 230000006872 improvement Effects 0.000 description 5
- 229910052738 indium Inorganic materials 0.000 description 5
- APFVFJFRJDLVQX-UHFFFAOYSA-N indium atom Chemical compound [In] APFVFJFRJDLVQX-UHFFFAOYSA-N 0.000 description 5
- 210000004072 lung Anatomy 0.000 description 5
- OHSVLFRHMCKCQY-UHFFFAOYSA-N lutetium atom Chemical compound [Lu] OHSVLFRHMCKCQY-UHFFFAOYSA-N 0.000 description 5
- 238000004393 prognosis Methods 0.000 description 5
- 102000005962 receptors Human genes 0.000 description 5
- 108020003175 receptors Proteins 0.000 description 5
- WUAPFZMCVAUBPE-IGMARMGPSA-N rhenium-186 Chemical compound [186Re] WUAPFZMCVAUBPE-IGMARMGPSA-N 0.000 description 5
- 150000003384 small molecules Chemical class 0.000 description 5
- 229910052727 yttrium Inorganic materials 0.000 description 5
- VWQVUPCCIRVNHF-UHFFFAOYSA-N yttrium atom Chemical compound [Y] VWQVUPCCIRVNHF-UHFFFAOYSA-N 0.000 description 5
- -1 111 In) Chemical compound 0.000 description 4
- 210000004027 cell Anatomy 0.000 description 4
- 230000002596 correlated effect Effects 0.000 description 4
- 229940079593 drug Drugs 0.000 description 4
- 239000003814 drug Substances 0.000 description 4
- 238000012333 histopathological diagnosis Methods 0.000 description 4
- 230000001976 improved effect Effects 0.000 description 4
- 239000003550 marker Substances 0.000 description 4
- 206010061289 metastatic neoplasm Diseases 0.000 description 4
- 102000004169 proteins and genes Human genes 0.000 description 4
- 108090000623 proteins and genes Proteins 0.000 description 4
- 230000002285 radioactive effect Effects 0.000 description 4
- 238000002560 therapeutic procedure Methods 0.000 description 4
- 210000000115 thoracic cavity Anatomy 0.000 description 4
- 206010061728 Bone lesion Diseases 0.000 description 3
- 102000004190 Enzymes Human genes 0.000 description 3
- 108090000790 Enzymes Proteins 0.000 description 3
- 206010027476 Metastases Diseases 0.000 description 3
- GKLVYJBZJHMRIY-OUBTZVSYSA-N Technetium-99 Chemical compound [99Tc] GKLVYJBZJHMRIY-OUBTZVSYSA-N 0.000 description 3
- 239000000427 antigen Substances 0.000 description 3
- 102000036639 antigens Human genes 0.000 description 3
- 108091007433 antigens Proteins 0.000 description 3
- 230000008859 change Effects 0.000 description 3
- 238000002059 diagnostic imaging Methods 0.000 description 3
- 238000005516 engineering process Methods 0.000 description 3
- 239000000284 extract Substances 0.000 description 3
- 230000000977 initiatory effect Effects 0.000 description 3
- 238000002372 labelling Methods 0.000 description 3
- 238000013507 mapping Methods 0.000 description 3
- 208000010658 metastatic prostate carcinoma Diseases 0.000 description 3
- 230000003287 optical effect Effects 0.000 description 3
- 238000005457 optimization Methods 0.000 description 3
- 230000007170 pathology Effects 0.000 description 3
- 238000012805 post-processing Methods 0.000 description 3
- 229910052702 rhenium Inorganic materials 0.000 description 3
- WUAPFZMCVAUBPE-UHFFFAOYSA-N rhenium atom Chemical compound [Re] WUAPFZMCVAUBPE-UHFFFAOYSA-N 0.000 description 3
- 238000001356 surgical procedure Methods 0.000 description 3
- 230000004083 survival effect Effects 0.000 description 3
- 229910052713 technetium Inorganic materials 0.000 description 3
- 229940056501 technetium 99m Drugs 0.000 description 3
- GKLVYJBZJHMRIY-UHFFFAOYSA-N technetium atom Chemical compound [Tc] GKLVYJBZJHMRIY-UHFFFAOYSA-N 0.000 description 3
- 238000011179 visual inspection Methods 0.000 description 3
- RSTDSVVLNYFDHY-IOCOTODDSA-K 2-[4-[2-[[4-[[(2S)-1-[[(5S)-5-carboxy-5-[[(1S)-1,3-dicarboxypropyl]carbamoylamino]pentyl]amino]-3-naphthalen-2-yl-1-oxopropan-2-yl]carbamoyl]cyclohexyl]methylamino]-2-oxoethyl]-7,10-bis(carboxylatomethyl)-1,4,7,10-tetrazacyclododec-1-yl]acetate lutetium-177(3+) Chemical compound [177Lu+3].OC(=O)CC[C@H](NC(=O)N[C@@H](CCCCNC(=O)[C@H](Cc1ccc2ccccc2c1)NC(=O)C1CCC(CNC(=O)CN2CCN(CC([O-])=O)CCN(CC([O-])=O)CCN(CC([O-])=O)CC2)CC1)C(O)=O)C(O)=O RSTDSVVLNYFDHY-IOCOTODDSA-K 0.000 description 2
- ORILYTVJVMAKLC-UHFFFAOYSA-N Adamantane Natural products C1C(C2)CC3CC1CC2C3 ORILYTVJVMAKLC-UHFFFAOYSA-N 0.000 description 2
- 206010061818 Disease progression Diseases 0.000 description 2
- 241001326189 Gyrodactylus prostae Species 0.000 description 2
- 108010083158 PSMA-1007 Proteins 0.000 description 2
- 108010037516 PSMA-617 Proteins 0.000 description 2
- 108010072866 Prostate-Specific Antigen Proteins 0.000 description 2
- 230000002159 abnormal effect Effects 0.000 description 2
- 238000009825 accumulation Methods 0.000 description 2
- 230000007321 biological mechanism Effects 0.000 description 2
- 230000017531 blood circulation Effects 0.000 description 2
- 210000004556 brain Anatomy 0.000 description 2
- 238000012790 confirmation Methods 0.000 description 2
- 230000001186 cumulative effect Effects 0.000 description 2
- 238000013500 data storage Methods 0.000 description 2
- 230000007423 decrease Effects 0.000 description 2
- 230000003247 decreasing effect Effects 0.000 description 2
- 230000010339 dilation Effects 0.000 description 2
- 230000005750 disease progression Effects 0.000 description 2
- 230000000694 effects Effects 0.000 description 2
- 238000003703 image analysis method Methods 0.000 description 2
- 230000000670 limiting effect Effects 0.000 description 2
- 239000004973 liquid crystal related substance Substances 0.000 description 2
- 210000004185 liver Anatomy 0.000 description 2
- 230000003211 malignant effect Effects 0.000 description 2
- 239000000463 material Substances 0.000 description 2
- 239000011159 matrix material Substances 0.000 description 2
- 230000001394 metastastic effect Effects 0.000 description 2
- 238000012986 modification Methods 0.000 description 2
- 230000004048 modification Effects 0.000 description 2
- 230000006855 networking Effects 0.000 description 2
- 238000003062 neural network model Methods 0.000 description 2
- 230000001151 other effect Effects 0.000 description 2
- 239000000047 product Substances 0.000 description 2
- 238000005070 sampling Methods 0.000 description 2
- 239000000126 substance Substances 0.000 description 2
- JBHPLHATEXGMQR-LFWIOBPJSA-N vipivotide tetraxetan Chemical group OC(=O)CC[C@H](NC(=O)N[C@@H](CCCCNC(=O)[C@H](CC1=CC=C2C=CC=CC2=C1)NC(=O)[C@H]1CC[C@H](CNC(=O)CN2CCN(CC(O)=O)CCN(CC(O)=O)CCN(CC(O)=O)CC2)CC1)C(O)=O)C(O)=O JBHPLHATEXGMQR-LFWIOBPJSA-N 0.000 description 2
- XOJYSFPEJAILJZ-LCERUKBVSA-M (2s)-2-[[(1s)-4-[[(1s)-5-[bis[[1-[2-[bis(carboxymethyl)amino]-2-oxoethyl]imidazol-2-yl]methyl]amino]-1-carboxypentyl]amino]-1-carboxy-4-oxobutyl]carbamoylamino]pentanedioic acid;methanone;technetium-99(4+);chloride Chemical compound [Cl-].[99Tc+4].O=[CH-].O=[CH-].O=[CH-].N=1C=CN(CC(=O)N(CC(O)=O)CC(O)=O)C=1CN(CCCC[C@H](NC(=O)CC[C@H](NC(=O)N[C@@H](CCC(=O)O)C(O)=O)C(O)=O)C(O)=O)CC1=NC=CN1CC(=O)N(CC(O)=O)CC(O)=O XOJYSFPEJAILJZ-LCERUKBVSA-M 0.000 description 1
- LKKMLIBUAXYLOY-UHFFFAOYSA-N 3-Amino-1-methyl-5H-pyrido[4,3-b]indole Chemical compound N1C2=CC=CC=C2C2=C1C=C(N)N=C2C LKKMLIBUAXYLOY-UHFFFAOYSA-N 0.000 description 1
- 102100030310 5,6-dihydroxyindole-2-carboxylic acid oxidase Human genes 0.000 description 1
- 101710163881 5,6-dihydroxyindole-2-carboxylic acid oxidase Proteins 0.000 description 1
- 206010006187 Breast cancer Diseases 0.000 description 1
- 208000026310 Breast neoplasm Diseases 0.000 description 1
- 206010009944 Colon cancer Diseases 0.000 description 1
- 208000001333 Colorectal Neoplasms Diseases 0.000 description 1
- 241000699800 Cricetinae Species 0.000 description 1
- 101150029707 ERBB2 gene Proteins 0.000 description 1
- 241000283073 Equus caballus Species 0.000 description 1
- 241000282326 Felis catus Species 0.000 description 1
- 102100031413 L-dopachrome tautomerase Human genes 0.000 description 1
- 101710093778 L-dopachrome tautomerase Proteins 0.000 description 1
- 238000012307 MRI technique Methods 0.000 description 1
- 241000124008 Mammalia Species 0.000 description 1
- 102000018697 Membrane Proteins Human genes 0.000 description 1
- 108010052285 Membrane Proteins Proteins 0.000 description 1
- RFFFFGRYVZESLB-CXODGJKXSA-N OC(=O)CC[C@H](NC(=O)N[C@@H](CCCCNC(=O)[C@H](Cc1ccc2ccccc2c1)NC(=O)c1ccc(CNC(=O)[C@H](CCC(O)=O)NC(=O)[C@H](CCC(O)=O)NC(=O)c2ccc([18F])nc2)cc1)C(O)=O)C(O)=O Chemical compound OC(=O)CC[C@H](NC(=O)N[C@@H](CCCCNC(=O)[C@H](Cc1ccc2ccccc2c1)NC(=O)c1ccc(CNC(=O)[C@H](CCC(O)=O)NC(=O)[C@H](CCC(O)=O)NC(=O)c2ccc([18F])nc2)cc1)C(O)=O)C(O)=O RFFFFGRYVZESLB-CXODGJKXSA-N 0.000 description 1
- 241000283973 Oryctolagus cuniculus Species 0.000 description 1
- 206010033128 Ovarian cancer Diseases 0.000 description 1
- 206010061535 Ovarian neoplasm Diseases 0.000 description 1
- 241000009328 Perro Species 0.000 description 1
- 241000288906 Primates Species 0.000 description 1
- 238000012952 Resampling Methods 0.000 description 1
- 241000283984 Rodentia Species 0.000 description 1
- 101710173693 Short transient receptor potential channel 1 Proteins 0.000 description 1
- 101710173694 Short transient receptor potential channel 2 Proteins 0.000 description 1
- 241000282898 Sus scrofa Species 0.000 description 1
- LVTKHGUGBGNBPL-UHFFFAOYSA-N Trp-P-1 Chemical compound N1C2=CC=CC=C2C2=C1C(C)=C(N)N=C2C LVTKHGUGBGNBPL-UHFFFAOYSA-N 0.000 description 1
- 238000010521 absorption reaction Methods 0.000 description 1
- 230000006978 adaptation Effects 0.000 description 1
- 239000000654 additive Substances 0.000 description 1
- 230000000996 additive effect Effects 0.000 description 1
- 230000002411 adverse Effects 0.000 description 1
- 230000004931 aggregating effect Effects 0.000 description 1
- 238000003491 array Methods 0.000 description 1
- 238000012550 audit Methods 0.000 description 1
- 230000003416 augmentation Effects 0.000 description 1
- 230000003190 augmentative effect Effects 0.000 description 1
- 230000004071 biological effect Effects 0.000 description 1
- 239000008280 blood Substances 0.000 description 1
- 210000004369 blood Anatomy 0.000 description 1
- 230000008081 blood perfusion Effects 0.000 description 1
- 238000007469 bone scintigraphy Methods 0.000 description 1
- 210000000481 breast Anatomy 0.000 description 1
- 210000001217 buttock Anatomy 0.000 description 1
- 230000001413 cellular effect Effects 0.000 description 1
- 210000001175 cerebrospinal fluid Anatomy 0.000 description 1
- 238000012512 characterization method Methods 0.000 description 1
- 238000006243 chemical reaction Methods 0.000 description 1
- 239000003795 chemical substances by application Substances 0.000 description 1
- OEYIOHPDSNJKLS-UHFFFAOYSA-N choline Chemical compound C[N+](C)(C)CCO OEYIOHPDSNJKLS-UHFFFAOYSA-N 0.000 description 1
- 229960001231 choline Drugs 0.000 description 1
- 238000004883 computer application Methods 0.000 description 1
- 229940039231 contrast media Drugs 0.000 description 1
- 230000005574 cross-species transmission Effects 0.000 description 1
- 238000007405 data analysis Methods 0.000 description 1
- 238000013434 data augmentation Methods 0.000 description 1
- 238000013135 deep learning Methods 0.000 description 1
- 238000013136 deep learning model Methods 0.000 description 1
- 238000011161 development Methods 0.000 description 1
- 230000018109 developmental process Effects 0.000 description 1
- 238000007435 diagnostic evaluation Methods 0.000 description 1
- 238000002224 dissection Methods 0.000 description 1
- 238000001647 drug administration Methods 0.000 description 1
- 238000013213 extrapolation Methods 0.000 description 1
- 230000002349 favourable effect Effects 0.000 description 1
- AEBYHKKMCWUMKX-LNTZDJBBSA-K gallium (68Ga) gozetotide Chemical group [68Ga+3].OC(=O)CC[C@@H](C(O)=O)NC(=O)N[C@H](C(O)=O)CCCCNC(=O)CCCCCNC(=O)CCC1=CC=C(O)C(CN(CCN(CC([O-])=O)CC=2C(=CC=C(CCC([O-])=O)C=2)O)CC([O-])=O)=C1 AEBYHKKMCWUMKX-LNTZDJBBSA-K 0.000 description 1
- PCHJSUWPFVWCPO-UHFFFAOYSA-N gold Chemical compound [Au] PCHJSUWPFVWCPO-UHFFFAOYSA-N 0.000 description 1
- 239000005556 hormone Substances 0.000 description 1
- 229940088597 hormone Drugs 0.000 description 1
- 102000046689 human FOLH1 Human genes 0.000 description 1
- 239000003112 inhibitor Substances 0.000 description 1
- 230000005764 inhibitory process Effects 0.000 description 1
- 238000002347 injection Methods 0.000 description 1
- 239000007924 injection Substances 0.000 description 1
- 230000010354 integration Effects 0.000 description 1
- 238000001361 intraarterial administration Methods 0.000 description 1
- 238000001990 intravenous administration Methods 0.000 description 1
- 238000007477 logistic regression Methods 0.000 description 1
- 230000000873 masking effect Effects 0.000 description 1
- 230000007246 mechanism Effects 0.000 description 1
- MBKDYNNUVRNNRF-UHFFFAOYSA-N medronic acid Chemical compound OP(O)(=O)CP(O)(O)=O MBKDYNNUVRNNRF-UHFFFAOYSA-N 0.000 description 1
- 201000001441 melanoma Diseases 0.000 description 1
- 239000012528 membrane Substances 0.000 description 1
- 230000004060 metabolic process Effects 0.000 description 1
- 230000009401 metastasis Effects 0.000 description 1
- 230000003278 mimic effect Effects 0.000 description 1
- 239000000203 mixture Substances 0.000 description 1
- 238000010295 mobile communication Methods 0.000 description 1
- 230000008450 motivation Effects 0.000 description 1
- 230000035772 mutation Effects 0.000 description 1
- IDTMSHGCAZPVLC-RYUDHWBXSA-N n-({(1r)-1-carboxy-2-[(4-fluorobenzyl)sulfanyl]ethyl}carbamoyl)-l-glutamic acid Chemical compound OC(=O)CC[C@@H](C(O)=O)NC(=O)N[C@H](C(O)=O)CSCC1=CC=C(F)C=C1 IDTMSHGCAZPVLC-RYUDHWBXSA-N 0.000 description 1
- 230000011164 ossification Effects 0.000 description 1
- 230000036961 partial effect Effects 0.000 description 1
- 238000002360 preparation method Methods 0.000 description 1
- 238000003672 processing method Methods 0.000 description 1
- 230000001902 propagating effect Effects 0.000 description 1
- 208000016691 refractory malignant neoplasm Diseases 0.000 description 1
- 230000001105 regulatory effect Effects 0.000 description 1
- 230000001953 sensory effect Effects 0.000 description 1
- PUZPDOWCWNUUKD-UHFFFAOYSA-M sodium fluoride Chemical compound [F-].[Na+] PUZPDOWCWNUUKD-UHFFFAOYSA-M 0.000 description 1
- 239000007787 solid Substances 0.000 description 1
- 238000000638 solvent extraction Methods 0.000 description 1
- 230000003595 spectral effect Effects 0.000 description 1
- 238000007920 subcutaneous administration Methods 0.000 description 1
- 239000013589 supplement Substances 0.000 description 1
- 230000000153 supplemental effect Effects 0.000 description 1
- 230000008093 supporting effect Effects 0.000 description 1
- 238000011477 surgical intervention Methods 0.000 description 1
- 238000010998 test method Methods 0.000 description 1
- 230000001225 therapeutic effect Effects 0.000 description 1
- 239000010409 thin film Substances 0.000 description 1
- 230000000699 topical effect Effects 0.000 description 1
- 238000012546 transfer Methods 0.000 description 1
- 230000000472 traumatic effect Effects 0.000 description 1
- 210000004881 tumor cell Anatomy 0.000 description 1
- 210000002700 urine Anatomy 0.000 description 1
- 238000012795 verification Methods 0.000 description 1
- 238000012800 visualization Methods 0.000 description 1
- 239000011782 vitamin Substances 0.000 description 1
- 229940088594 vitamin Drugs 0.000 description 1
- 229930003231 vitamin Natural products 0.000 description 1
- 235000013343 vitamin Nutrition 0.000 description 1
- 150000003722 vitamin derivatives Chemical class 0.000 description 1
Images


Classifications
-
- G—PHYSICS
- G06—COMPUTING; CALCULATING OR COUNTING
- G06T—IMAGE DATA PROCESSING OR GENERATION, IN GENERAL
- G06T7/00—Image analysis
- G06T7/60—Analysis of geometric attributes
- G06T7/62—Analysis of geometric attributes of area, perimeter, diameter or volume
-
- G—PHYSICS
- G06—COMPUTING; CALCULATING OR COUNTING
- G06T—IMAGE DATA PROCESSING OR GENERATION, IN GENERAL
- G06T7/00—Image analysis
-
- G—PHYSICS
- G06—COMPUTING; CALCULATING OR COUNTING
- G06T—IMAGE DATA PROCESSING OR GENERATION, IN GENERAL
- G06T7/00—Image analysis
- G06T7/0002—Inspection of images, e.g. flaw detection
- G06T7/0012—Biomedical image inspection
-
- G—PHYSICS
- G06—COMPUTING; CALCULATING OR COUNTING
- G06T—IMAGE DATA PROCESSING OR GENERATION, IN GENERAL
- G06T7/00—Image analysis
- G06T7/10—Segmentation; Edge detection
- G06T7/11—Region-based segmentation
-
- G—PHYSICS
- G06—COMPUTING; CALCULATING OR COUNTING
- G06T—IMAGE DATA PROCESSING OR GENERATION, IN GENERAL
- G06T2207/00—Indexing scheme for image analysis or image enhancement
- G06T2207/10—Image acquisition modality
- G06T2207/10072—Tomographic images
-
- G—PHYSICS
- G06—COMPUTING; CALCULATING OR COUNTING
- G06T—IMAGE DATA PROCESSING OR GENERATION, IN GENERAL
- G06T2207/00—Indexing scheme for image analysis or image enhancement
- G06T2207/10—Image acquisition modality
- G06T2207/10072—Tomographic images
- G06T2207/10084—Hybrid tomography; Concurrent acquisition with multiple different tomographic modalities
-
- G—PHYSICS
- G06—COMPUTING; CALCULATING OR COUNTING
- G06T—IMAGE DATA PROCESSING OR GENERATION, IN GENERAL
- G06T2207/00—Indexing scheme for image analysis or image enhancement
- G06T2207/20—Special algorithmic details
- G06T2207/20084—Artificial neural networks [ANN]
-
- G—PHYSICS
- G06—COMPUTING; CALCULATING OR COUNTING
- G06T—IMAGE DATA PROCESSING OR GENERATION, IN GENERAL
- G06T2207/00—Indexing scheme for image analysis or image enhancement
- G06T2207/20—Special algorithmic details
- G06T2207/20112—Image segmentation details
- G06T2207/20132—Image cropping
-
- G—PHYSICS
- G06—COMPUTING; CALCULATING OR COUNTING
- G06T—IMAGE DATA PROCESSING OR GENERATION, IN GENERAL
- G06T2207/00—Indexing scheme for image analysis or image enhancement
- G06T2207/30—Subject of image; Context of image processing
- G06T2207/30004—Biomedical image processing
- G06T2207/30081—Prostate
Landscapes
- Engineering & Computer Science (AREA)
- Physics & Mathematics (AREA)
- Theoretical Computer Science (AREA)
- Computer Vision & Pattern Recognition (AREA)
- General Physics & Mathematics (AREA)
- Health & Medical Sciences (AREA)
- Geometry (AREA)
- General Health & Medical Sciences (AREA)
- Medical Informatics (AREA)
- Nuclear Medicine, Radiotherapy & Molecular Imaging (AREA)
- Radiology & Medical Imaging (AREA)
- Quality & Reliability (AREA)
- Apparatus For Radiation Diagnosis (AREA)
- Nuclear Medicine (AREA)
- Image Analysis (AREA)
Description
関連出願の相互参照
この出願は、2018年1月8日出願の米国仮出願第62/614,935号、2018年6月7日出願の米国特許出願第16/003,006号、および2018年10月23日出願の米国仮出願第62/749,574号の優先権および利益を主張するものであり、これらの各々の内容の全体が参照によって本明細書に組み込まれる。
CROSS-REFERENCE TO RELATED APPLICATIONS This application is filed in U.S. Provisional Application No. 62/614,935, filed January 8, 2018, U.S. Patent Application No. 16/003,006, filed June 7, 2018, and Claims priority and benefit from U.S. Provisional Application No. 62/749,574, filed Oct. 23, each of which is incorporated herein by reference in its entirety.
本発明は、一般に、医用画像データの自動解析および/または表現のための方法、システム、およびアーキテクチャに関する。より具体的には、本発明は、ある特定の実施形態において、対象の画像の内部の(たとえば特定の器官または組織に対応する)1つまたは複数の特定の目的領域の自動識別と、たとえば前立腺がんといった疾患の、たとえば識別および/または疾患分類のための、そのような領域の内部の放射性医薬品摂取の判定とに関するものである。 The present invention generally relates to methods, systems, and architectures for automatic analysis and/or representation of medical image data. More specifically, the present invention provides, in certain embodiments, automatic identification of one or more specific regions of interest (e.g., corresponding to a particular organ or tissue) within an image of a subject, and The present invention relates to the determination of radiopharmaceutical uptake within such areas, for example for identification and/or disease classification of diseases such as cancer.
標的の画像解析は、疾患の進展中に変化した体内の特定の受容体、酵素およびタンパク質と結合する、放射性標識小分子の使用を包含する。これらの分子は、患者に投与された後、意図された標的を見いだすまで血液の中を循環する。結合された放射性医薬品は疾患の部位に残るが、作用薬の残りは身体から消える。分子の放射性の部分は、単一光子放射型コンピュータ断層撮影法(SPECT)カメラまたは陽電子放射型断層撮影法(PET)カメラとして公知の、世界中のほとんどの病院にある、一般に利用可能な核医学カメラを使用して、疾患のロケーションおよび集積を表す画像を取得するようにビーコンとして働く。そこで、医師は、患者における疾患の存在および程度を判定するためにこの情報を使用することができる。医師は、患者に治療の推奨コースを提供したり、疾患の進行を追跡したりするためにこの情報を使用することができる。 Targeted image analysis involves the use of radiolabeled small molecules that bind to specific receptors, enzymes and proteins in the body that are altered during the development of the disease. After these molecules are administered to a patient, they circulate in the blood until they find their intended target. The bound radiopharmaceutical remains at the site of disease, but the remainder of the active drug disappears from the body. The radioactive portion of the molecule is captured in a commonly available nuclear medicine system in most hospitals around the world, known as a single photon emission computed tomography (SPECT) or positron emission tomography (PET) camera. A camera is used to act as a beacon to capture images representing the location and accumulation of disease. Physicians can then use this information to determine the presence and extent of disease in a patient. Physicians can use this information to provide patients with recommended courses of treatment and to track disease progression.
PET画像およびSPECT画像の解析および拡張機能のために利用可能な、放射線技師または医師によって使用され得る種々のソフトウェアベースの解析技法がある。特定の種類のがんの撮像のために利用可能な複数の放射性医薬品もある。たとえば、小分子診断用の1404は、前立腺特異的膜抗原(PSMA)の細胞外ドメイン、前立腺がん細胞の95%超の表面で増殖したタンパク質、ならびに原発性前立腺がんおよび転移性前立腺がんを検知するための確認された標的を標的とするものである。1404は、テクネチウム-99m(比較的低コストで広く利用可能かつ効率的準備が容易な、核医学撮像用途にとって好ましいスペクトル特性を有するガンマ放射性同位体)で標識される。 There are various software-based analysis techniques available for analysis and enhancement of PET and SPECT images that can be used by radiologists or physicians. There are also multiple radiopharmaceuticals available for imaging certain types of cancer. For example, 1404 for small molecule diagnostics has been shown to target the extracellular domain of prostate-specific membrane antigen (PSMA), a protein grown on the surface of >95% of prostate cancer cells, as well as primary and metastatic prostate cancer. It targets confirmed targets for detection. 1404 is labeled with technetium-99m, a gamma radioisotope with favorable spectral properties for nuclear medicine imaging applications that is relatively low cost, widely available, and easy to efficiently prepare.
放射性医薬品の別の例にはPyL(商標)([18F]DCFPyLとしても公知である)があり、これは、臨床疾患での前立腺がんに関するフッ素化されたPSMAを標的とするPET造影剤である。Journal of Molecular Imaging and Biologyの2015年4月号で発表された概念明示研究は、PyL(商標)を用いるPET撮像が、想定される転移性疾患および原発性腫瘍の部位における高レベルのPyL(商標)摂取を示すことを明示し、前立腺がんの検知における高い感度および特異度の可能性を示唆している。 Another example of a radiopharmaceutical is PyL™ (also known as [ 18 F]DCFPyL), which is a PET contrast agent that targets fluorinated PSMA for prostate cancer in clinical disease. It is. A proof-of-concept study published in the April 2015 issue of the Journal of Molecular Imaging and Biology shows that PET imaging with PyL™ can detect high levels of PyL™ at sites of assumed metastatic disease and primary tumors. ), demonstrating the potential for high sensitivity and specificity in the detection of prostate cancer.
腫瘍学者は、患者にたとえば前立腺がんといった特定の疾患があるか、疾患の明白なステージは何か、(存在する場合には)治療の推奨コースは何か、外科的介入が指示されているか、可能性の高い予後、といった査定における入力として、患者の標的とされたPET試験またはSPECT試験からの画像を使用し得る。腫瘍学者は、この査定において放射線技師の報告を使用し得る。放射線技師の報告は、撮像試験を要求した医師向けに放射線技師によって準備されたPET画像またはSPECT画像の技術的評価であり、たとえば、実行された試験のタイプ、病歴、画像間の比較、試験を遂行するために使用された技術、放射線技師の観測および所見、ならびに撮像試験の結果に基づいて放射線技師が有し得る全体的な印象および推奨を含む。医師の再検討のための試験を命じた医師に、放射線技師の署名入り報告が送られ、結果および治療のための推奨について医師と患者との間の協議がこれに続く。 The oncologist will ask whether the patient has a specific disease, for example prostate cancer, what is the apparent stage of the disease, what is the recommended course of treatment (if any), and whether surgical intervention is indicated. Images from a targeted PET or SPECT study of the patient may be used as input in the assessment of the patient's diagnosis, likely prognosis, etc. The oncologist may use the radiologist's report in this assessment. A radiologist's report is a technical evaluation of PET or SPECT images prepared by a radiologist for the physician who requested the imaging study, e.g., the type of study performed, medical history, comparisons between images, Includes the technique used to perform, the radiologist's observations and findings, and the overall impression and recommendations the radiologist may have based on the results of the imaging exam. The radiologist's signed report is sent to the physician who ordered the test for physician review, followed by discussion between physician and patient regarding the results and recommendations for treatment.
したがって、このプロセスは、放射線技師が患者に対する撮像試験を遂行するステップと、得られた画像を解析するステップと、放射線技師の報告を生成するステップと、要求した医師に報告を転送するステップと、医師が査定および治療の推奨を策定するステップと、医師が、結果、推奨、およびリスクを患者に伝えるステップとを包含している。このプロセスは、要領を得ない結果のために撮像試験を繰り返すステップ、または初期の結果に基づいてさらなるテストを命じるステップも包含し得る。 The process thus includes the steps of a radiologist performing an imaging study on a patient, analyzing the resulting images, generating a radiologist's report, and forwarding the report to the requesting physician. It involves the physician developing an assessment and treatment recommendations, and the physician communicating the results, recommendations, and risks to the patient. The process may also include repeating the imaging test due to unreliable results, or ordering further testing based on initial results.
患者に特定の疾患または状態(たとえばがん)があることを撮像試験が示す場合、医師は、手術すること、ならびに、手術なしで何もしないかまたは経過観察もしくは積極的監視手法を採用することのリスクを含む様々な治療の選択肢について検討する。 If imaging tests indicate that a patient has a particular disease or condition (e.g., cancer), the physician may choose to operate, as well as do nothing without surgery or adopt a wait-and-see or active surveillance approach. Consider various treatment options, including risks.
医師の観点と患者の観点の両方から、このプロセスに関連した制約がある。放射線技師の報告は確かに役立つものであるが、医師は、患者のための査定および推奨を策定するのに、最終的には自分の経験に頼らなければならない。その上、患者は、医師に多大な信頼を寄せなければならない。医師は、患者のPET画像/SPECT画像を示して、様々な治療選択肢に関連した数的リスクまたは特定の予後の可能性を患者に告げ得るが、患者は、この情報の意味を理解しようと非常に苦心するであろう。その上に、特に、がんが診断されても患者が手術を受けないことを選ぶと、患者の家族は恐らく疑問を抱くであろう。患者および/またはその家族は、補足情報を求めてオンライン検索して、診断された状態のリスクについて誤解する可能性がある。困難な試練がさらなる精神的外傷になりかねない。 There are constraints associated with this process, both from the physician's perspective and from the patient's perspective. Although the radiologist's report is certainly helpful, the physician must ultimately rely on his or her experience to formulate an assessment and recommendation for the patient. Moreover, patients must have a great deal of trust in their doctors. A physician may show a patient's PET/SPECT images and tell the patient the numerical risks associated with various treatment options or the likelihood of a particular prognosis, but the patient is very reluctant to make sense of this information. You will have a hard time. Additionally, the patient's family will likely have questions, especially if the patient chooses not to undergo surgery once cancer is diagnosed. Patients and/or their families may search online for supplemental information and misunderstand the risks of the diagnosed condition. Difficult ordeals can become even more traumatic.
したがって、医用撮像試験の解析を改善するためのシステムおよび方法と、それらの結果、診断、予後、治療の推奨、および関連するリスクを患者に伝えることとの必要性が残されている。 Therefore, there remains a need for systems and methods to improve the analysis of medical imaging tests and the communication of their results, diagnosis, prognosis, treatment recommendations, and associated risks to patients.
本明細書で提示されるシステムおよび方法は、特定の器官および/または組織に対応する3D画像の内部の特定の3Dボリュームを自動的に識別するための、対象の3次元(3D)医用画像の自動解析を提供するものである。ある特定の実施形態では、1つまたは複数のそのようなボリュームの正確な識別は、特定の器官および/または組織領域における放射性医薬品の摂取を表す量的メトリックを自動的に判定するために使用される。これらの摂取メトリックは、対象の病状を査定するため、対象の予後を判定するため、および/または治療法の効能を判定するために使用され得る。 The systems and methods presented herein describe a three-dimensional (3D) medical image of a subject for automatically identifying specific 3D volumes within the 3D image that correspond to specific organs and/or tissues. It provides automatic analysis. In certain embodiments, accurate identification of one or more such volumes is used to automatically determine quantitative metrics representative of radiopharmaceutical uptake in particular organs and/or tissue regions. Ru. These intake metrics may be used to assess a subject's medical condition, determine a subject's prognosis, and/or determine the efficacy of a treatment.
本明細書で説明されたシステムおよび方法は、特に、医用画像における3Dボリュームを識別して摂取メトリックを自動的に判定することにより、精度、一貫性、および結果の再現性における改善とともに、合理化された医用画像解析ワークフローに道を開くものである。たとえば、本明細書で説明された画像解析技術の実施形態は、患者のがん状態の、初期の全自動の査定を遂行するために使用され得る。次いで、医師は全自動解析を再検討して、(i)自動の査定を受け入れること、または(ii)画像解析システムの案内の下で、パラメータを半自動で調整することを選択する。この手法により、医師および/または支援技術者は、自動3Dセグメント化も初期の状態査定も遂行しない従来の手法と比較して、最終的な診断のための画像を準備して再検討するのに必要な負担が軽減される。これらの従来の手法では、医師および/または技術者は、代わりに、3D画像をスライスごとに丹念にスクロールして、2次元の目的領域を手動で識別しなければならない。そのような従来の手法は、時間がかかることに加えて、画像評者(たとえば医師および/または技術者)の主観的判断に重度に基づくものであり、したがって閲覧者間の変動性および/または閲覧者内の変動性の傾向がある。対照的に、本明細書で説明された画像解析のワークフロー、システムおよび方法に基づく結果は、主観的変動性をすっかり解消するかまたは劇的に低減する全自動または半自動のやり方で得られる。 The systems and methods described herein, among other things, are streamlined with improvements in accuracy, consistency, and reproducibility of results by identifying 3D volumes in medical images to automatically determine uptake metrics. This opens the door to new medical image analysis workflows. For example, embodiments of the image analysis techniques described herein may be used to perform an initial fully automated assessment of a patient's cancer status. The physician then reviews the fully automatic analysis and chooses to (i) accept the automatic assessment or (ii) adjust the parameters semi-automatically under the guidance of the image analysis system. This technique allows physicians and/or assistive technicians to prepare and review images for final diagnosis compared to traditional techniques that perform neither automatic 3D segmentation nor initial condition assessment. The necessary burden is reduced. In these traditional approaches, the physician and/or technician must instead manually identify the two-dimensional region of interest by painstakingly scrolling through the 3D image slice by slice. In addition to being time-consuming, such traditional techniques are heavily based on the subjective judgment of image reviewers (e.g., physicians and/or technicians) and are therefore subject to inter-viewer variability and/or There is a tendency for within-person variability. In contrast, results based on the image analysis workflows, systems and methods described herein are obtained in a fully automated or semi-automated manner that completely eliminates or dramatically reduces subjective variability.
たとえば、本明細書で説明されたシステムおよび方法は、対象の前立腺の内部の、放射性核種で標識されたPSMA結合剤(たとえば99mTc-MIP-1404、たとえば[18F]DCFPyL)などの放射性医薬品の摂取の定量的測度をもたらす摂取メトリックを判定するための医用画像の自動解析のために使用され得る。そのような摂取メトリックは、対象の内部の前立腺がんおよび/または前立腺がんの重要度/ステージに関する患者のリスクを評価することに関連するものである。たとえば、臨床的に重要な前立腺がん対臨床的に重要でない前立腺がんに関する自動分類のための高い感度および特異度を達成し得ることが発見されている。 For example, the systems and methods described herein can be used to detect a radiopharmaceutical agent, such as a radionuclide-labeled PSMA binding agent (e.g., 99m Tc-MIP-1404, e.g., [ 18 F]DCFPyL), within the prostate of a subject. can be used for automated analysis of medical images to determine uptake metrics that yield quantitative measures of uptake. Such intake metrics are relevant to assessing the patient's risk for prostate cancer within the subject and/or severity/stage of prostate cancer. For example, it has been discovered that high sensitivity and specificity can be achieved for automated classification of clinically significant versus clinically insignificant prostate cancer.
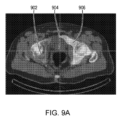
本明細書で説明された画像解析手法は、ある特定の実施形態では、対象について得られた3Dの解剖学的画像と機能的画像の組合せを利用する。X線コンピュータ断層撮影法(CT)画像などの解剖学的画像は、詳細な解剖学的/構造的情報をもたらす。機能的画像は、代謝、血流、局所的化学組成、および/または吸収など、特定の器官および/または組織の内部の生理活性に関する情報を伝える。特に関連するのは、単一光子放射型コンピュータ断層撮影法(SPECT)画像および/または陽電子放射型断層撮影法(PET)画像などの核医学画像であり、これらは、対象から放射された放射線を検知することによって取得され、対象の内部に投与された放射性医薬品の空間分布を推測するために使用され得るものである。 The image analysis techniques described herein, in certain embodiments, utilize a combination of 3D anatomical and functional images obtained of a subject. Anatomical images such as X-ray computed tomography (CT) images provide detailed anatomical/structural information. Functional images convey information about the internal biological activity of a particular organ and/or tissue, such as metabolism, blood flow, local chemical composition, and/or absorption. Of particular relevance are nuclear medicine images, such as single photon emission computed tomography (SPECT) and/or positron emission tomography (PET) images, which capture the radiation emitted by an object. can be obtained by sensing and used to infer the spatial distribution of a radiopharmaceutical administered inside a subject.
たとえば、SPECT撮像は、放射性医薬品99mTc-MIP-1404(99mTcで標識された1404)の摂取を評価するために使用され得る。ある特定の実施形態では、対象の前立腺における99mTc-MIP-1404の摂取を評価するために、CT画像の解剖学的情報/構造的情報が、対応するSPECT画像の機能情報に相関し得るように、対象のCT画像および対応するSPECT画像が得られる。多くの場合、CT画像およびSPECT画像は、単一の多モード撮像システムを使用して、2つの別個のスキャン(たとえばCT画像のための第1のスキャンおよびSPECT画像のための第2のスキャン)によって取得され、対象は2つのスキャン期間にわたって実質的に固定された位置にある。このように、CT画像のボクセルとSPECT画像のボクセルとの間のマッピングが確立され、特定の器官および/または組織領域に対応するものとして識別されたCT画像の内部のボリュームが、SPECT画像の内部の同じ特定の器官および/または組織領域に対応するボクセルを識別するために使用され得る。 For example, SPECT imaging can be used to assess uptake of the radiopharmaceutical 99m Tc-MIP-1404 (1404 labeled with 99m Tc). In certain embodiments, anatomical/structural information in a CT image may be correlated with functional information in a corresponding SPECT image to assess uptake of 99m Tc-MIP-1404 in a subject's prostate. Then, a CT image and a corresponding SPECT image of the object are obtained. CT and SPECT images are often separated into two separate scans (e.g., a first scan for the CT image and a second scan for the SPECT image) using a single multimode imaging system. , and the object is in a substantially fixed position over the two scan periods. In this way, a mapping between voxels of the CT image and voxels of the SPECT image is established such that volumes internal to the CT image identified as corresponding to specific organs and/or tissue regions are can be used to identify voxels that correspond to the same specific organ and/or tissue region.
したがって、本明細書で説明された画像解析手法は、ある特定の実施形態では、対象の前立腺に対応するCT画像の内部の前立腺ボリュームを正確に識別するために畳み込みニューラルネットワーク(CNN)を利用する。識別された前立腺ボリュームは、これも対象の前立腺に対応する、SPECT画像のボクセルを識別するために使用され得る。したがって、前立腺の中の造影剤(たとえば標識されたPSMA結合剤、たとえば99mTc-MIP-1404または[18F]DCFPyL)の摂取の測度をもたらす摂取メトリックは、対象の前立腺に対応するSPECT画像ボクセルの強度を使用して計算され得る。摂取メトリックは、次いで、対象が前立腺がんを有するか否かの識別、および/または対象が前立腺がんを有するリスクの定量化、および/または(たとえば疾患の経時的追跡の一部分として)疾患分類に変換され得、これらは、医師によって、たとえば処置の選択肢を助言するため、および/または与えられた療法の効能を監視するために使用され得る。 Accordingly, the image analysis techniques described herein, in certain embodiments, utilize convolutional neural networks (CNNs) to accurately identify the prostate volume within a CT image that corresponds to the prostate of interest. . The identified prostate volume may be used to identify voxels in the SPECT image that also correspond to the prostate of interest. Therefore, an uptake metric that provides a measure of the uptake of a contrast agent (e.g., a labeled PSMA binder, e.g., 99m Tc-MIP-1404 or [ 18F ]DCFPyL) within the prostate is determined by the SPECT image voxel corresponding to the prostate of interest. can be calculated using the intensity of Intake metrics can then be used to identify whether a subject has prostate cancer, and/or quantify the risk that a subject has prostate cancer, and/or disease classification (e.g., as part of tracking the disease over time). These can be used by a physician, for example, to advise treatment options and/or to monitor the efficacy of a given therapy.
この複数画像の手法、すなわち3D機能的画像と組み合わせて3D解剖学的画像を解析する手法による、前立腺(または、さらに広く見れば、目的の特定の器官もしくは組織領域)における摂取メトリックの自動測定の性能を改善する様々な進歩が、本明細書で説明される。これらの進歩には、たとえば前立腺がある骨盤領域を識別するための、3D解剖学的画像の内部の境界ボックスの(たとえば第1の畳み込みニューラルネットワーク(CNN)を使用する)自動識別が含まれる。 This multi-image approach, which analyzes 3D anatomical images in combination with 3D functional images, allows automated measurement of uptake metrics in the prostate (or more broadly, specific organs or tissue regions of interest). Various advances that improve performance are described herein. These advances include automatic identification (eg, using a first convolutional neural network (CNN)) of internal bounding boxes of 3D anatomical images, eg, to identify the pelvic region where the prostate is located.
第1のCNNが対象の3D解剖学的画像における骨盤領域を自動的に識別するために使用され得るように、骨盤領域の境界を表すポイント(たとえば直方体の境界ボックスの頂点)に対して第1のCNNを訓練するために、たとえば、識別された生理機能(たとえば識別された骨盤領域)を有する3D解剖学的画像のセットが使用される。これによって、たとえば境界ボックスが対象の前立腺および/または膀胱および/または直腸および/または殿筋に対応する画像の領域の境界を示す、3D解剖学的画像のより標準的なサイズの初期の体積領域がもたらされ、次に、初期の体積領域の範囲内の目的領域の詳細なセグメント化のために(たとえば第2のCNNによって)処理される。次いで、3D解剖学的画像の識別された領域のうち1つまたは複数にマッピングする3D機能的画像の部分から、造影剤摂取メトリックが判定され得る。「境界ボックス」は、本明細書で使用されるように、必ずしも直方体ではなく他の形状を有し得ることに留意されたい。ある特定の実施形態では、境界ボックスは直方体である。 A first CNN for points representing the boundaries of the pelvic region (e.g. vertices of a bounding box of a cuboid) such that the first CNN can be used to automatically identify the pelvic region in a 3D anatomical image of interest. For example, a set of 3D anatomical images with identified physiological features (eg, identified pelvic regions) is used to train the CNN. This allows for an initial volumetric region of a more standard size of a 3D anatomical image, for example a bounding box delimiting the region of the image corresponding to the prostate and/or bladder and/or rectum and/or gluteal muscles of interest. is generated and then processed (e.g., by a second CNN) for fine segmentation of the region of interest within the initial volumetric region. A contrast uptake metric may then be determined from the portion of the 3D functional image that maps to one or more of the identified regions of the 3D anatomical image. Note that a "bounding box," as used herein, is not necessarily a rectangular parallelepiped and may have other shapes. In certain embodiments, the bounding box is a cuboid.
第1のCNNによる境界ボックスの判定は、第2のCNNによって境界ボックスの内部の前立腺および/または他の器官のセグメント化のために使用されるものよりも大幅に低い解像度を入力として使用してよい。たとえば、境界ボックスを見いだすために、第1のCNNが、第1の数のボクセル(たとえば81×68×96ボクセル)を有する全身の3D解剖学的画像を処理してよく、次いで、第2のCNNが、境界ボックス領域に対応する、第1の数のボクセルよりも多くのボクセル(たとえば94×138×253ボクセル)を有する、より高い解像度の画像を処理してよい。 The determination of the bounding box by the first CNN uses as input a significantly lower resolution than that used by the second CNN for segmentation of the prostate and/or other organs inside the bounding box. good. For example, to find a bounding box, a first CNN may process a 3D anatomical image of the whole body having a first number of voxels (e.g., 81x68x96 voxels), and then a second The CNN may process a higher resolution image having more than the first number of voxels (eg, 94 x 138 x 253 voxels) corresponding to a bounding box region.
たとえば(詳細なセグメント化のために)第2のCNNを適用する前に、当面の解析に関連する3D解剖学的画像の1つまたは複数の部分を識別する「境界ボックス」の手法は、より計算集約的な後続の処理の前に初期の3D解剖学的画像の大部分を除去することによって計算効率を改善するものである。この手法は、たとえば骨盤領域(たとえば直方体の境界ボックスの頂点)の識別は、前立腺、膀胱、および/または目的の他の組織の詳細なセグメント化よりも簡単であるため、全体の初期の3D解剖学的画像に対して詳細なセグメント化を遂行するよりも計算上効率的である。この手法は、計算上より効率的であるばかりでなく、たとえば第2のCNNによってもたらされるより詳細なセグメント化といった、より正確な後続の処理も得られる。これは、たとえば、異なる健診機関において異なる機械を使用して得られた3D解剖学的画像はサイズが異なり(たとえば、サイズが異なると、画像のボクセルの異なる数および/または画像において表現された患者の組織の異なるボリュームがあることを意味する)、また、前立腺の自動の詳細なセグメント化のために、器官および目的の他の組織領域が内在する、より標準化された画像ボリュームサイズの3D解剖学的訓練画像の各部分を使用して第2のCNNを訓練すると、より頑健かつ正確なセグメント化が得られるためである。 For example, a "bounding box" approach that identifies one or more parts of a 3D anatomical image that are relevant to the analysis at hand before applying a second CNN (for detailed segmentation) is more It improves computational efficiency by removing most of the initial 3D anatomical image before computationally intensive subsequent processing. This technique is useful because the identification of the pelvic region (e.g. the apex of the bounding box of a cuboid) is easier than detailed segmentation of the prostate, bladder, and/or other tissues of interest. It is computationally more efficient than performing detailed segmentation on a logical image. This approach is not only computationally more efficient, but also provides more accurate subsequent processing, e.g. more detailed segmentation provided by the second CNN. This means, for example, that 3D anatomical images obtained using different machines at different medical institutions may have different sizes (e.g. different sizes may result in different numbers of voxels in the image and/or representation in the image). 3D anatomy of organs and other tissue areas of interest for automatic detailed segmentation of the prostate (meaning there are different volumes of patient tissue), as well as a more standardized image volume size This is because training the second CNN using each part of the logical training image results in more robust and accurate segmentation.
この複数画像の手法(すなわち3D機能的画像と組み合わせて3D解剖学的画像を解析する)による、前立腺(または、さらに広く見れば、目的の特定の器官もしくは組織領域)における摂取メトリックの自動測定の性能を改善する、本明細書で説明される別の進歩には、前立腺に加えて1つまたは複数の組織領域が正確に識別されることと、(i)前立腺における摂取メトリック、ならびに/あるいは(ii)前立腺がんの識別および/または疾患分類の判定において、それらの領域における造影剤の摂取が明らかになることとがある。PSMA結合剤を含むある特定の造影剤は、ある特定の器官における摂取が大きく、このことが病変組織(たとえば前立腺がん)の識別に影響を及ぼす可能性がある。たとえば、膀胱による、放射性核種で標識されたPSMA結合剤の摂取が、3D機能的画像における散乱をもたらして、膀胱の近くにある前立腺において測定される造影剤強度の精度が低下する可能性がある。対象の前立腺と膀胱の両方の詳細なセグメント化のために第2のCNNを訓練することにより、「ブリードスルー」もしくは「クロストーク」の影響および/または膀胱による造影剤の摂取に起因する他の影響を、自動的かつ正確に明らかにすることが可能になる。その上、第2のCNNを、3D解剖学的画像の内部のたとえば殿筋といった基準領域を識別するように訓練することにより、造影剤の強度測定値をより正確に重み付け/正規化して、対象の前立腺における摂取測定の精度および診断値を改善することが可能になる。 This multi-image approach (i.e., analyzing 3D anatomical images in combination with 3D functional images) allows automated measurement of uptake metrics in the prostate (or more broadly, specific organs or tissue regions of interest). Other advances described herein that improve performance include accurately identifying one or more tissue regions in addition to the prostate and (i) uptake metrics in the prostate; ii) In determining prostate cancer identification and/or disease classification, contrast uptake in those areas may be evident. Certain contrast agents containing PSMA binders have high uptake in certain organs, which can affect the identification of diseased tissue (eg, prostate cancer). For example, uptake of radionuclide-labeled PSMA binding agents by the bladder can result in scattering in 3D functional images, reducing the accuracy of contrast agent intensity measured in the prostate near the bladder. . By training a second CNN for detailed segmentation of both the prostate and bladder of interest, we eliminate "bleed-through" or "cross-talk" effects and/or other effects due to contrast uptake by the bladder. It becomes possible to automatically and accurately clarify the impact. Furthermore, by training the second CNN to identify reference regions, e.g. the gluteal muscles, inside the 3D anatomical image, contrast agent intensity measurements can be more accurately weighted/normalized to It becomes possible to improve the accuracy and diagnostic value of uptake measurements in the prostate gland.
したがって、本明細書で説明されたシステムおよび方法は、ある特定の実施形態では2つのCNNモジュールの独特な組合せを利用し、第1のCNNモジュールがCT画像の内部の初期の目的ボリューム(VOI)を識別し、第2のCNNモジュールがVOIを入力として受け取り、その中の前立腺ボリュームを識別する。本明細書で説明されたように、この手法によって、第2のCNNモジュールが、より小さい入力サイズ(たとえば全体のCT画像とは対照的なVOI)に対して動作することが可能になる。このようにして入力サイズを低減することによる計算リソース(たとえばメモリ、たとえば処理時間)の節約は、第2のCNNモジュールの精度の改善に割り当てられ得、かつ/または画像処理手法の速度を改善するために使用され得る。 Accordingly, the systems and methods described herein utilize a unique combination of two CNN modules in certain embodiments, where the first CNN module captures an initial volume of interest (VOI) inside a CT image. A second CNN module receives the VOI as input and identifies a prostate volume therein. As described herein, this approach allows the second CNN module to operate on smaller input sizes (eg, VOIs as opposed to entire CT images). Savings in computational resources (e.g. memory, e.g. processing time) by reducing the input size in this way can be allocated to improving the accuracy of the second CNN module and/or improving the speed of the image processing method. can be used for
ある特定の実施形態では、本明細書で説明されたシステムおよび方法は、前立腺とともに、CT画像の内部の様々なその他の組織のボリュームを識別する。たとえば、前立腺に加えて、対象の骨盤骨、膀胱、直腸、および殿筋に対応するその他の組織のボリュームが識別され得る。本明細書で説明されたように、そのようなその他の組織のボリュームの識別は種々の機能のために使用され得て、CT画像のボクセルが前立腺に対応するものと識別されるか否か、といった2項分類の手法など他の手法に対する利点を与える。詳細には、その他の組織ボリュームの識別は、たとえば、(i)CNNモジュールがCT画像の内部の前立腺ボリュームを識別する精度を改善すること、(ii)摂取メトリックを計算するための正規化値を計算するために使用され得る基準領域の識別をもたらすこと、および(iii)前立腺に対応するSPECT画像ボクセルの強度が、たとえば膀胱の内部の放射性医薬品の蓄積に起因するクロストークに関して補正され得ること、が可能である。 In certain embodiments, the systems and methods described herein identify the prostate as well as various other tissue volumes within a CT image. For example, in addition to the prostate, other tissue volumes may be identified that correspond to the subject's pelvic bones, bladder, rectum, and gluteal muscles. As described herein, identification of such other tissue volumes may be used for a variety of functions, including whether a voxel in a CT image is identified as corresponding to the prostate; This provides advantages over other methods such as binary classification methods. In particular, the identification of other tissue volumes may, for example, (i) improve the accuracy with which the CNN module identifies prostate volumes inside CT images; (ii) improve normalization values for calculating uptake metrics; (iii) the intensity of SPECT image voxels corresponding to the prostate can be corrected for cross-talk due to e.g. radiopharmaceutical accumulation inside the bladder; is possible.
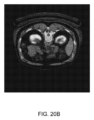
本明細書で説明された画像解析手法は、ある特定の実施形態では種々の解剖学的画像および機能的画像を解析するために使用され得、CT画像およびSPECT画像に限定されない。たとえば、陽電子放射型断層撮影法(PET)は、対象の内部の放射性医薬品の分布に関する情報をもたらす別の機能的撮像診断法である。PET画像は、SPECT画像と同様に、目的の様々な器官および組織領域に関する摂取メトリックを判定するためにCT画像と組み合わせて使用され得る。本明細書で説明された手法は、骨、リンパ節、肝臓、および肺など、目的の種々の器官および/または組織領域にも適用され得る。 The image analysis techniques described herein may be used to analyze a variety of anatomical and functional images in certain embodiments, and are not limited to CT and SPECT images. For example, positron emission tomography (PET) is another functional imaging modality that provides information regarding the distribution of radiopharmaceuticals within a subject. PET images, like SPECT images, can be used in conjunction with CT images to determine uptake metrics for various organs and tissue regions of interest. The techniques described herein may also be applied to various organs and/or tissue areas of interest, such as bones, lymph nodes, liver, and lungs.
したがって、本明細書で説明されたシステムおよび方法は、医用画像の内部の特定の器官および組織領域の迅速かつ正確な識別を提供することにより、対象の内部の様々な器官および組織領域の内部の放射性医薬品の摂取の定量的測度をもたらす摂取メトリックの正確な自動判定を提供するものである。この自動判定された摂取メトリックは、患者の内部の疾患リスク、状態、および進行、ならびに治効を査定するための有益なツールをもたらす。 Accordingly, the systems and methods described herein provide rapid and accurate identification of specific organs and tissue regions within a medical image, thereby providing a quick and accurate identification of various organs and tissue regions within a subject. It provides accurate automated determination of uptake metrics that yield quantitative measures of radiopharmaceutical uptake. This automatically determined intake metric provides a valuable tool for assessing a patient's internal disease risk, status, and progression, as well as treatment efficacy.
一態様では、本発明は、3D画像を自動的に処理して、対象の前立腺に対応する3D画像の内部の3Dボリュームを識別し、そこにおける(すなわち前立腺における)放射性医薬品の摂取を表す1つまたは複数の摂取メトリックを判定するための方法に向けられ、この方法は、(a)解剖学的撮像診断法[たとえばX線コンピュータ断層撮影法(CT)(たとえば全身CT画像、たとえば身体の局所CT画像)、たとえば磁気共鳴映像法(MRI)、たとえば3D超音波]を使用して得られた対象の3D解剖学的画像をコンピューティングデバイスのプロセッサによって受け取るステップであって、3D解剖学的画像に含まれる対象の内部の組織(たとえば柔組織および/または骨)のグラフィカル表現の少なくとも一部分が対象の骨盤領域に対応する、ステップと、(b)機能的撮像診断法[たとえば単一光子放射型コンピュータ断層撮影法(SPECT)、たとえば陽電子放射型断層撮影法(PET)]を使用して得られた対象の3D機能的画像をプロセッサによって受け取るステップであって、3D機能的画像に含まれる複数のボクセルが、それぞれ対象の内部の特定の物理ボリュームを表し、また、特定の物理ボリュームから放射されて検知された放射線を表す強度値を有し、3D機能的画像の複数のボクセルの少なくとも一部分が、対象の骨盤領域の内部の物理ボリュームを表す、ステップと、(c)プロセッサによって、第1のモジュール(たとえば第1の機械学習モジュール)を使用して、3D解剖学的画像(たとえば平行六面体、たとえば直方体)の内部の初期の目的ボリューム(VOI)を判定するステップであって、初期のVOIが、対象の骨盤領域の内部の組織に対応し、対象の骨盤領域の外部の組織を除外したものである(たとえば、3D解剖学的画像の、このVOIから除外されたボクセルは、含まれるボクセルよりもより多く、たとえば、3D解剖学的画像の、このVOIに含まれるボクセルは25%未満であり、たとえば、VOIの内部のボクセルの大多数が、対象の骨盤領域の内部の物理ボリュームを表す)、ステップと、(d)プロセッサによって、第2のモジュール(たとえば第2の機械学習モジュール)を使用して、対象の前立腺に対応する初期のVOIの内部の前立腺ボリュームを識別するステップと、(e)プロセッサによって、3D機能的画像および3D解剖学的画像の初期のVOIの内部で識別された前立腺ボリュームを使用して、1つまたは複数の摂取メトリックを判定する(たとえば判定して表示する)ステップ[たとえば3D解剖学的画像の初期のVOIの内部で識別された前立腺ボリュームに対応する3D機能的画像のボクセルの強度値に基づいて、対象の前立腺における放射性医薬品の量を計算するステップ、たとえば対象の前立腺が占有する物理ボリュームを表す3D機能的画像のボクセルの強度の合計(たとえば加重和)、平均値、および/または最大値を計算するステップ]とを含む[たとえば1つまたは複数の摂取メトリックが、腫瘍の背景に対する比(TBR)の値を含み、かつ/または、この方法は、TBR値に少なくとも部分的に基づいて、前立腺がんの分類状態を、(i)臨床的に重要である、または(ii)臨床的に重要でない、のいずれかに判定する(たとえば判定して表示する)ステップを含む]。 In one aspect, the invention automatically processes a 3D image to identify a 3D volume within the 3D image that corresponds to the subject's prostate and represents uptake of a radiopharmaceutical therein (i.e., in the prostate). or to a method for determining a plurality of uptake metrics, the method comprising: (a) anatomical imaging diagnostic methods [e.g., X-ray computed tomography (CT) (e.g., whole body CT images, e.g. receiving by a processor of the computing device a 3D anatomical image of the object obtained using a magnetic resonance imaging (MRI), e.g. 3D ultrasound; (b) at least a portion of the graphical representation of internal tissue (e.g., parenchyma and/or bone) of the subject that is included corresponds to a pelvic region of the subject; receiving, by the processor, a 3D functional image of the object obtained using a CT scan (SPECT), e.g., positron emission tomography (PET), the plurality of voxels included in the 3D functional image; each represents a particular physical volume within the object and has an intensity value representing the detected radiation emitted from the particular physical volume, and at least a portion of the plurality of voxels of the 3D functional image are located within the object. (c) a 3D anatomical image (e.g. a parallelepiped, e.g. a cuboid) using a first module (e.g. a first machine learning module) by the processor; ), the initial VOI corresponding to tissue internal to the pelvic region of interest and excluding tissue external to the pelvic region of interest; (For example, more voxels of a 3D anatomical image are excluded from this VOI than are included, e.g. less than 25% of voxels of a 3D anatomical image are included in this VOI, e.g. (d) by the processor using a second module (e.g., a second machine learning module); , identifying a prostate volume within the initial VOI corresponding to the prostate of interest; and (e) identifying, by the processor, the prostate volume identified within the initial VOI of the 3D functional image and the 3D anatomical image. determining (e.g., determining and displaying) one or more uptake metrics using (e.g., determining and displaying) one or more uptake metrics [e.g., of the 3D functional image corresponding to the prostate volume identified within the initial VOI of the 3D anatomical image Calculating the amount of radiopharmaceutical in the subject's prostate based on voxel intensity values, e.g. a sum (e.g. weighted sum) of voxel intensities of a 3D functional image representing the physical volume occupied by the subject's prostate, an average value , and/or calculating a maximum value]. determining (e.g., determining and displaying) a classification status of the prostate cancer as either (i) clinically significant, or (ii) clinically unimportant, based in part on the include].
ある特定の実施形態では、第1のモジュールは、3D解剖学的画像を入力として受け取り、3D解剖学的画像の内部の長方形ボリュームの向かい合ったコーナーを表す複数の座標値(たとえば長方形ボリュームの向かい合ったコーナーを表す座標値の2つのセット)を出力する。 In certain embodiments, the first module receives as input a 3D anatomical image and a plurality of coordinate values representing opposite corners of a rectangular volume within the 3D anatomical image (e.g., opposite corners of the rectangular volume). outputs two sets of coordinate values representing corners).
ある特定の実施形態では、ステップ(c)は、第1のモジュールを使用して、対象の骨盤骨(たとえば、仙骨、尾骨、左寛骨、および右寛骨のうち1つまたは複数(すべて))に対応する3D解剖学的画像のボリュームを識別する3D骨盤骨マスクを判定するステップを含む。 In certain embodiments, step (c) uses the first module to identify one or more (all) of the target pelvic bones (e.g., sacrum, coccyx, left hipbone, and right hipbone). ) of the 3D anatomical image.
ある特定の実施形態では、第1のモジュールは、畳み込みニューラルネットワーク(CNN)モジュール(たとえば1つまたは複数の畳み込み層を利用するニューラルネットワークモジュール)である。 In certain embodiments, the first module is a convolutional neural network (CNN) module (eg, a neural network module that utilizes one or more convolutional layers).
ある特定の実施形態では、ステップ(d)は、第2のモジュールを使用して、3D解剖学的画像の内部の、それぞれが対象の内部の特定の組織領域に対応する1つまたは複数のその他の組織ボリュームを識別するステップであって、1つまたは複数のその他の組織ボリュームが、対象の骨盤骨(たとえば仙骨、たとえば尾骨、たとえば左寛骨、たとえば右寛骨)と、対象の膀胱と、対象の直腸と、対象の殿筋(たとえば左殿筋、たとえば右殿筋)とからなる群から選択される1つまたは複数の特定の組織領域に対応する、ステップを含む。 In certain embodiments, step (d) uses the second module to generate one or more other tissue regions within the 3D anatomical image, each corresponding to a particular tissue region within the subject. identifying a tissue volume of the subject, wherein the one or more other tissue volumes include a pelvic bone of interest (e.g., sacrum, e.g., coccyx, left hipbone, e.g., right hipbone), a bladder of interest, and corresponding to one or more specific tissue regions selected from the group consisting of the subject's rectum and the subject's gluteal muscles (eg, left gluteus muscle, eg, right gluteus muscle).
ある特定の実施形態では、ステップ(d)は、第2のモジュールを使用して、初期のVOIの内部の各ボクセルを、対象の内部の(所定の)異なる組織領域のセット{たとえば、このセットは、前立腺と、必要に応じて、1つまたは複数のその他の組織領域[たとえば対象の骨盤骨(たとえば仙骨、たとえば尾骨、たとえば左寛骨、たとえば右寛骨)、対象の膀胱、対象の直腸、および殿筋(たとえば左殿筋、たとえば右の殿筋]とを含む}のうち特定の組織領域に対応するものとして分類するステップを含む。ある特定の実施形態では、初期のVOIの内部の各ボクセルを分類するステップは、第2のモジュールによって、初期のVOIの内部の複数のボクセルの各々について尤度値のセットを判定するステップであって、尤度値のセットが、組織領域セットのうち1つまたは複数の組織領域の各々について、ボクセルが、組織領域の内部の物理ボリュームを表す尤度(たとえば第2のモジュールによって計算される)を表す対応する尤度値を含む、ステップと、初期のVOIの内部の複数のボクセルの各々について、ボクセルについて判定された尤度値のセットに基づいて、ボクセルを特定の組織領域に対応するものとして分類するステップとを含む。ある特定の実施形態では、第2のモジュールは、初期のVOI(たとえば全体の初期のVOI)を入力として受け取り、初期のVOIの内部の各ボクセルについて、(i)ボクセルを分類する値[たとえば、ボクセルを、たとえば異なる組織領域の所定のセット(たとえば対象の前立腺)から選択された領域といった特定の組織領域、たとえば対象の骨盤骨(たとえば仙骨、たとえば尾骨、たとえば左寛骨、たとえば右側寛骨)、対象の膀胱、対象の直腸、および対象の殿筋(たとえば左殿筋、たとえば右殿筋)に対応するものとして分類する値]と、(ii)ボクセルに関する尤度値のセット[たとえば、たとえば対象の前立腺、たとえば対象の骨盤骨(たとえば仙骨、たとえば尾骨、たとえば左寛骨、たとえば右寛骨)、対象の膀胱、対象の直腸、および対象の殿筋(たとえば左殿筋、たとえば右殿筋)といった異なる組織領域の所定のセットから選択された領域といった特定の組織領域にボクセルが対応する尤度]と、(iii)(たとえば、第2のモジュールが、各ボクセルに対して一度に1つずつ動作するのとは対照的に、1回で全体のVOIに関する尤度値を分類し、かつ/または計算するように)ボクセルを、異なる組織領域の所定のセットのうちいかなるものにも対応しないものとして識別する値(たとえば対応しそうもないものとして識別する値、またはボクセルが対応しない尤度を識別する値)(たとえば、ボクセルを、たとえば診断用ではない背景エリアに対応するもの、もしくは背景エリアに対応しそうなものとして識別する値、またはボクセルが背景エリアに対応する尤度を識別する値)とのうち、少なくとも1つを含む複数の値を出力する。ある特定の実施形態では、異なる組織領域の(所定の)セットは、対象の前立腺と、対象の骨盤骨(たとえば仙骨、たとえば尾骨、たとえば左寛骨、たとえば右寛骨)と、対象の膀胱と、対象の直腸と、対象の殿筋(たとえば左殿筋、たとえば右殿筋)とからなる群から選択される1つまたは複数の組織領域を含む。 In certain embodiments, step (d) uses a second module to associate each voxel within the initial VOI with a set of (predetermined) different tissue regions within the subject {e.g. includes the prostate and, optionally, one or more other tissue regions [e.g., the subject's pelvic bones (e.g., sacrum, e.g., coccyx, e.g., left hip bone, e.g., right hip bone), the subject's bladder, the subject's rectum; , and gluteal muscles (e.g., left gluteus muscle, e.g., right gluteus muscle)} as corresponding to a particular tissue region. The step of classifying each voxel includes determining, by a second module, a set of likelihood values for each of the plurality of voxels within the initial VOI, wherein the set of likelihood values is of a set of tissue regions. for each of the one or more tissue regions, the voxel includes a corresponding likelihood value representing a likelihood (e.g., calculated by the second module) representing a physical volume within the tissue region; for each of the plurality of voxels within the initial VOI, classifying the voxel as corresponding to a particular tissue region based on the set of likelihood values determined for the voxel. Certain embodiments , the second module takes as input an initial VOI (e.g., the entire initial VOI) and, for each voxel inside the initial VOI, (i) a value that classifies the voxel [e.g. a particular tissue region, such as a region selected from a predetermined set of tissue regions (e.g., the subject's prostate), the subject's pelvic bones (e.g., the sacrum, e.g., the coccyx, the left hipbone, the right hipbone, for example), the subject's bladder; (ii) a set of likelihood values for the voxel [e.g., the subject's prostate, e.g. Different tissue regions such as the target pelvic bones (e.g. sacrum, e.g. coccyx, left hipbone, right hipbone), the target bladder, the target rectum, and the target gluteal muscles (e.g. left gluteus, right gluteus) (iii) the likelihood that a voxel corresponds to a particular tissue region, such as a region selected from a predetermined set of (as opposed to classifying and/or calculating a likelihood value for the entire VOI at once) that identifies a voxel as not corresponding to any of a predetermined set of different tissue regions. (e.g., a value that identifies a voxel as unlikely to correspond, or a value that identifies the likelihood that the voxel does not correspond) or a value identifying the likelihood that the voxel corresponds to the background area). In certain embodiments, the (predetermined) set of different tissue regions includes the subject's prostate, the subject's pelvic bones (e.g., sacrum, e.g., coccyx, e.g., left hip bone, e.g., right hip bone), and the subject's bladder. , the subject's rectum, and the subject's gluteal muscles (e.g., left gluteus muscle, e.g., right gluteus muscle).
ある特定の実施形態では、ステップ(d)は、第2のモジュールを使用して、識別された前立腺ボリュームおよび1つまたは複数のその他の組織ボリュームを含む1つまたは複数の基底組織ボリュームのセットを識別するステップを含み、この方法は、プロセッサによって、1つまたは複数の補助モジュール(たとえば補助機械学習モジュール)を使用して、3D解剖学的画像の内部の1つまたは複数の補助組織ボリュームを識別するステップであって、それぞれの補助組織ボリュームが、第2のモジュールによって識別された基底組織ボリュームに対応する{たとえば、同じ特定の組織領域[たとえば対象の前立腺、たとえば対象の骨盤骨(たとえば仙骨、たとえば尾骨、たとえば左寛骨、たとえば右寛骨)、対象の膀胱、対象の直腸、および殿筋(たとえば左殿筋、たとえば右の殿筋)]が、この基底組織ボリュームとして表される}、ステップと、プロセッサによって、それぞれの補助組織ボリュームを、第2のモジュールによって識別された対応する基底組織ボリュームと合併させる(たとえば、本来の基底組織ボリュームに含まれていなかった対応する補助組織ボリュームの部分を組み込むことによって対応する基底組織ボリュームを増大させる)ステップとをさらに含む。 In certain embodiments, step (d) uses the second module to generate a set of one or more ground tissue volumes that includes the identified prostate volume and one or more other tissue volumes. identifying, by the processor, one or more auxiliary tissue volumes within the 3D anatomical image using one or more auxiliary modules (e.g., auxiliary machine learning modules); each supplementary tissue volume corresponds to the underlying tissue volume identified by the second module {e.g., the same specific tissue region [e.g., the subject's prostate, e.g., the subject's pelvic bone (e.g., the sacrum, the subject's bladder, the subject's rectum, and the gluteal muscles (e.g., the left gluteus, e.g., the right gluteus)] are represented as this ground tissue volume}; merging, by the processor, each supplementary tissue volume with the corresponding basal tissue volume identified by the second module (e.g., portions of the corresponding supplementary tissue volume that were not included in the original basal tissue volume); and increasing the corresponding ground tissue volume by incorporating.
この方法は、ある特定の実施形態では、プロセッサによって(たとえば、第2のモジュールを使用して)、対象の内部の基準組織領域(たとえば殿筋)に対応する、3D解剖学的画像の内部の(たとえば初期のVOIの内部の)基準ボリュームを識別するステップと、ステップ(e)において、3D機能的画像と3D解剖学的画像の内部で識別された基準ボリュームとを使用して、1つまたは複数の摂取メトリックのうち少なくとも1つを判定する(たとえば、3D解剖学的画像の内部で識別された基準ボリュームに対応する3D機能的画像のボクセルの強度値に基づいて正規化値を計算する)ステップとを含む。ある特定の実施形態では、3D機能的画像および基準ボリュームを使用して判定された1つまたは複数の摂取メトリックのうち少なくとも1つが、腫瘍の背景に対する比(TBR)の値を含み、TBR値を判定するステップは、3D解剖学的画像の初期のVOIの内部で識別された前立腺ボリュームに対応する、3D機能的画像の1つまたは複数のボクセルの強度値を使用して、標的強度値(たとえば、標的強度値は、前立腺ボリュームに対応する、3D機能的画像のボクセルの強度の最大値である)を判定するステップと、3D解剖学的画像の内部で識別された基準ボリュームに対応する、3D機能的画像の1つまたは複数のボクセルの強度値を使用して、背景強度値[たとえば、背景強度値は、識別された基準ボリュームに対応する、3D機能的画像の複数の(たとえばすべての)ボクセルの平均強度である]を判定するステップと、標的強度値の背景強度値に対する比をTBR値として判定するステップとを含む。この方法は、ある特定の実施形態では、1つまたは複数の閾値(たとえば所定の閾値)と比較したTBR値に基づいて対象の前立腺がんの状態を判定するステップを含む。ある特定の実施形態では、1つまたは複数の閾値は、複数の基準TBR値[たとえば、各基準TBR値は、基準画像の対応するセット(たとえば基準3D解剖学的画像および基準3D機能的画像、たとえばCT画像/SPECT画像のセット)から判定されている]を使用して判定され、各基準TBR値は、特定の分類の前立腺がんの状態に関連づけられている(たとえば医師によって割り当てられている)[たとえば、基準TBR値を判定された同じ対象に対して(たとえば前立腺全摘出術からの病理組織診断に基づいて)グリーソン分類が判定されている]。ある特定の実施形態では、受信者動作特性(ROC)曲線を使用して[たとえば特定の感度値および/または特定の特異度値をもたらすために、たとえば曲線下面積(AUC)解析を使用して]1つまたは複数の閾値が判定される。ある特定の実施形態では、1つまたは複数の閾値は、TBR値を複数の閾値と比較して、前立腺がんの状態を非2値スケール上のレベル[たとえば、スケールには、3つまたはそれよりも多くのレベル(たとえば、陰性、多分陰性、多分陽性、陽性)がある]として判定するための複数の閾値(たとえば各閾値は平均的なグリーソンスコアに相関している)を含む。この方法は、ある特定の実施形態では、対象の前立腺がんの状態を、(i)TBR値がカットオフ閾値を超えていたら臨床的に重要であると判定し、または(ii)TBR値がカットオフ閾値未満であれば臨床的に重要でないと判定する、ステップを含む。 In certain embodiments, the method includes determining, by the processor (e.g., using a second module), an area of the interior of the 3D anatomical image that corresponds to a reference tissue region (e.g., the gluteal muscle) of the interior of the subject. identifying a reference volume (e.g., within the initial VOI); and in step (e), using the reference volume identified within the 3D functional image and the 3D anatomical image, one or more determining at least one of a plurality of uptake metrics (e.g., calculating a normalization value based on intensity values of voxels in the 3D functional image that correspond to a reference volume identified within the 3D anatomical image); step. In certain embodiments, at least one of the one or more uptake metrics determined using the 3D functional image and the reference volume includes a tumor-to-background ratio (TBR) value; The determining step uses intensity values of one or more voxels of the 3D functional image that correspond to the prostate volume identified within the initial VOI of the 3D anatomical image to determine the target intensity value (e.g. , the target intensity value is the maximum value of the intensity of a voxel in the 3D functional image that corresponds to the prostate volume; The intensity value of one or more voxels of the functional image is used to determine the background intensity value [e.g. and determining the ratio of the target intensity value to the background intensity value as the TBR value. The method, in certain embodiments, includes determining the subject's prostate cancer status based on the TBR value compared to one or more thresholds (eg, a predetermined threshold). In certain embodiments, the one or more thresholds include a plurality of reference TBR values [e.g., each reference TBR value is determined by a corresponding set of reference images (e.g., a reference 3D anatomical image and a reference 3D functional image, each reference TBR value is associated with a particular classification of prostate cancer status (e.g., assigned by a physician). ) [eg, Gleason classification has been determined (eg, based on histopathology from radical prostatectomy) for the same subject for whom a baseline TBR value has been determined]. In certain embodiments, a receiver operating characteristic (ROC) curve is used [e.g., using area under the curve (AUC) analysis to yield a particular sensitivity value and/or a particular specificity value]. ] One or more threshold values are determined. In certain embodiments, the one or more thresholds compare the TBR value to the plurality of thresholds to determine prostate cancer status at a level on a non-binary scale [e.g., the scale includes three or more (e.g., each threshold is correlated with the average Gleason score) In certain embodiments, the method determines that a subject's prostate cancer status is (i) clinically significant if the TBR value is above a cutoff threshold, or (ii) the TBR value is above a cutoff threshold; It includes the step of determining that it is not clinically significant if it is less than a cutoff threshold.
この方法は、ある特定の実施形態では、プロセッサによって(たとえば第2のモジュールを使用して)、対象の膀胱に対応する3D解剖学的画像の内部の(たとえば初期のVOIの内部の)膀胱のボリュームを識別するステップと、ステップ(e)において、3D解剖学的画像の内部の識別された膀胱ボリュームに対応する3D機能的画像のボクセルの強度を使用して、膀胱からのクロストーク(たとえば膀胱における放射性医薬品の摂取が、散乱および/または部分ボリューム効果によって、前立腺の内部の物理ボリュームを表す3D機能的画像のボクセルの強度値に影響を及ぼす)を、[たとえば、前立腺ボリュームに対応する3D機能的画像のボクセルの強度を、識別された膀胱ボリュームに同ボクセルが近いことおよび/または(たとえば膀胱ボリュームに対応する3D機能的画像のボクセルの強度に基づいて判定された)膀胱の摂取に基づいて、調整することによって、たとえば、膀胱からの放射散乱のモデルを確立し、このモデルに基づいて3D機能的画像のボクセルの強度を調整するように、3D機能的画像のボクセルの強度を使用することによって]補正するステップとを含む。ある特定の実施形態では、膀胱からのクロストークを補正するステップは、識別された膀胱ボリュームの外部にある、3D解剖学的画像の1つまたは複数の領域に対応する3D機能的画像の1つまたは複数のボクセルの強度に対する、対象の膀胱の内部の放射性医薬品に由来する強度の寄与をモデル化する、1つまたは複数の膀胱強度ブリード関数を判定するステップであって、1つまたは複数の膀胱強度ブリード関数[たとえば、1つまたは複数の膀胱強度ブリード関数の各々が、3D解剖学的画像の内部の識別された膀胱ボリュームに対応する3D機能的画像のボクセルの特定の方向に沿った強度にテンプレート関数(たとえばn次多項式)を当てはめることによって得られるものであり、特定の方向に沿った強度ブリードをモデル化する]が、前記寄与を、識別された膀胱ボリュームからの距離の関数としてモデル化する、ステップと、3D解剖学的画像の内部の識別された前立腺ボリュームに対応する3D機能的画像の1つまたは複数のボクセルの各々について、1つまたは複数の膀胱強度ブリード関数を使用して、[たとえば、1つまたは複数の膀胱強度ブリード関数を評価し、ボクセルに対する膀胱強度ブリード値を判定して、ボクセルの強度から膀胱強度ブリード値を差し引くことにより、補正されたボクセル強度を得ることによって]膀胱クロストークに関してボクセルの強度を調整するステップとを含む。 In certain embodiments, the method includes, by a processor (e.g., using a second module) an image of a bladder within a 3D anatomical image (e.g., within an initial VOI) corresponding to a bladder of interest; identifying a volume and, in step (e), using the intensities of voxels in the 3D functional image that correspond to the identified bladder volume inside the 3D anatomical image to identify crosstalk from the bladder, e.g. [e.g., the ingestion of a radiopharmaceutical at determining the intensity of a voxel in the target image based on the voxel's proximity to the identified bladder volume and/or bladder uptake (e.g. determined based on the intensity of the voxel in the 3D functional image corresponding to the bladder volume). , using the voxel intensities of the 3D functional image to establish, for example, a model of radiation scattering from the bladder and adjust the voxel intensities of the 3D functional image based on this model, by adjusting ]. In certain embodiments, correcting for crosstalk from the bladder comprises one of the 3D functional images corresponding to one or more regions of the 3D anatomical image that are external to the identified bladder volume. or determining one or more bladder intensity bleed functions that model the intensity contribution from a radiopharmaceutical within the subject's bladder to the intensity of the plurality of voxels, the one or more bladder intensity bleed functions Intensity bleed functions [e.g., each of the one or more bladder intensity bleed functions corresponds to the intensity along a particular direction of a voxel in the 3D functional image that corresponds to an identified bladder volume within the 3D anatomical image. (obtained by fitting a template function (e.g., an n-dimensional polynomial) that models the intensity bleed along a particular direction) and models the contribution as a function of distance from the identified bladder volume. using one or more bladder intensity bleed functions for each of the one or more voxels of the 3D functional image corresponding to the identified prostate volume within the 3D anatomical image; [For example, by evaluating one or more bladder strength bleed functions, determining a bladder strength bleed value for the voxel, and obtaining a corrected voxel intensity by subtracting the bladder strength bleed value from the intensity of the voxel] and adjusting voxel intensities with respect to bladder crosstalk.
この方法は、ある特定の実施形態では、プロセッサによって(たとえば第2のモジュールを使用して)、対象の膀胱に対応する3D解剖学的画像の内部の(たとえば初期のVOIの内部の)膀胱のボリュームを識別するステップと、プロセッサによって、識別された膀胱ボリュームに対して形態学的拡張操作を適用することにより、拡張された膀胱ボリュームを判定するステップと、ステップ(e)において、3D機能的画像のボクセルの強度値を使用して、1つまたは複数の摂取メトリックが、(i)3D解剖学的画像のVOIの内部で識別された前立腺ボリュームに対応する、しかし(ii)拡張された膀胱ボリュームの内部の3D解剖学的画像の領域には対応しないと判定する(それによって、たとえば、1つまたは複数の摂取メトリックの計算から、識別された膀胱ボリュームから所定の距離内の3D解剖学的画像におけるロケーションに対応する、したがって、識別された膀胱ボリュームに過度に接近している、3D機能的画像のボクセルを省く)ステップとを含む。 In certain embodiments, the method includes, by a processor (e.g., using a second module), an image of a bladder within a 3D anatomical image (e.g., within an initial VOI) corresponding to a bladder of interest; identifying the volume; and determining, by the processor, an expanded bladder volume by applying a morphological expansion operation to the identified bladder volume; in step (e), the 3D functional image; The one or more uptake metrics are determined using the intensity values of the voxels corresponding to (i) the prostate volume identified within the VOI of the 3D anatomical image, but (ii) the expanded bladder volume. 3D anatomical image within a predetermined distance from the identified bladder volume, e.g., from the calculation of one or more intake metrics. omitting voxels of the 3D functional image that correspond to locations in the 3D functional image and are therefore too close to the identified bladder volume.
ある特定の実施形態では、3D機能的画像は、対象に放射性医薬品を投与した後の対象の核医学画像(たとえば単一光子放射型コンピュータ断層撮影法(SPECT)スキャン、たとえば陽電子放射型断層撮影法(PET)スキャン)である。ある特定の実施形態では、放射性医薬品はPSMA結合剤(たとえば99mTc-MIP-1404、たとえば[18F]DCFPyL)を含む。ある特定の実施形態では、核医学画像は、対象に放射性医薬品を投与した後に得られる、対象の単一光子放射型コンピュータ断層撮影法(SPECT)スキャンである。ある特定の実施形態では、放射性医薬品は99mTc-MIP-1404を含む。 In certain embodiments, the 3D functional image comprises a nuclear medicine image (e.g., a single photon emission computed tomography (SPECT) scan, e.g., a positron emission tomography scan) of the subject after administration of the radiopharmaceutical to the subject. (PET scan). In certain embodiments, the radiopharmaceutical includes a PSMA binding agent (eg, 99m Tc-MIP-1404, eg, [ 18 F]DCFPyL). In certain embodiments, the nuclear medicine image is a single photon emission computed tomography (SPECT) scan of the subject obtained after administering a radiopharmaceutical to the subject. In certain embodiments, the radiopharmaceutical comprises 99m Tc-MIP-1404.
この方法は、ある特定の実施形態では、1つまたは複数の摂取メトリックの少なくとも一部分に基づいて、対象に関する1つまたは複数の診断値または予後値[たとえば対象の病状、疾患の進行、平均余命(たとえば全生存期間)、治効等の測度をもたらす値(たとえばグリーソンスコア)]を判定するステップを含む。ある特定の実施形態では、1つまたは複数の診断値または予後値のうち少なくとも1つを判定するステップは、摂取メトリックを1つまたは複数の閾値と比較するステップを含む。ある特定の実施形態では、1つまたは複数の診断値または予後値のうち少なくとも1つが、対象における臨床的に重要な前立腺がんに関するリスクを推定する。 In certain embodiments, the method provides one or more diagnostic or prognostic values for a subject based at least in part on one or more intake metrics [e.g., the subject's medical condition, disease progression, life expectancy ( e.g., overall survival), therapeutic efficacy, etc. (e.g., Gleason score)]. In certain embodiments, determining at least one of the one or more diagnostic or prognostic values includes comparing the intake metric to one or more threshold values. In certain embodiments, at least one of the one or more diagnostic or prognostic values estimates the risk for clinically significant prostate cancer in the subject.
この方法は、ある特定の実施形態では、(f)3D解剖学的画像および/または3D機能的画像の視覚表示をユーザに提示するために、プロセッサによって、対話型グラフィカルユーザインターフェース(GUI)を表示するステップと、(g)プロセッサによって、GUIの内部に、3D解剖学的画像および/または3D機能的画像のグラフィカルレンダリングを、いずれかが(たとえば対応するユーザ選択可能なグラフィカル制御要素(たとえばトグル要素)によって)表示用に選択されて個別にレンダリングされ得るように、または両方が表示用に選択されて、3D解剖学的画像に3D機能的画像を重ね合わせることによって一緒にレンダリングされ得るように、選択可能かつスーパーインポーズ可能な層としてもたらすステップとを含む。ある特定の実施形態では、ステップ(g)は、3D解剖学的画像の内部の1つまたは複数の識別された特定の組織ボリュームを含む選択可能かつスーパーインポーズ可能なセグメント化層のグラフィカルレンダリングをもたらすステップを含み、表示用のセグメント化層が選択されると、1つまたは複数の特定の組織ボリュームを表すグラフィックスが、(たとえば輪郭として、たとえば半透明の色分けされたボリュームとして)3D解剖学的画像および/または3D機能的画像に重ね合わされる。ある特定の実施形態では、1つまたは複数の特定の組織ボリュームは識別された前立腺ボリュームを含む。この方法は、ある特定の実施形態では、ステップ(g)において、2D断面図の位置がユーザによって調整され得るように、対話型2Dビューアの内部に、3D解剖学的画像および/または3D機能的画像の2D断面図をレンダリングするステップを含む。この方法は、ある特定の実施形態では、ステップ(g)において、3D解剖学的画像および/または3D機能的画像の対話型(たとえば回転可能、たとえばスライス可能)3Dビューをレンダリングするステップを含む。この方法は、ある特定の実施形態では、GUIの内部に、識別された前立腺ボリュームのボクセルに対応するロケーション(たとえば、前記ロケーションは、たとえば識別された前立腺ボリュームに対応する3D機能的画像の他のボクセルと比較した最大の補正強度といった、3D機能的画像の最大の強度を有するボクセルにも対応する)を指示するグラフィカル要素(たとえば十字マーク、標的、有色のマーカなど)を表示するステップを含み、それによって、この方法の、ユーザの再検討および/または品質制御が容易になる(たとえば、医師は、識別されたロケーションが対象の前立腺の予期された物理的位置に対応することを検証し得る)。この方法は、ある特定の実施形態では、GUIの内部に、1つまたは複数の摂取メトリックの再検討および/または更新のための品質制御および報告ワークフローによってユーザを導くための品質制御グラフィカルウィジェット(たとえば、品質制御グラフィカルウィジェットは、ユーザの(i)プロセッサによって自動的に判定された1つまたは複数の摂取メトリックの承認に対応する入力、または(ii)1つまたは複数の摂取メトリックの自動判定の不承認に対応する入力を受け取るための選択可能なグラフィカル制御要素を含む)とともに、ステップ(e)で判定された1つまたは複数の摂取メトリック(および、たとえば、必要に応じて、そこから判定された1つまたは複数の予後値)を表すテキストおよび/またはグラフィックスを表示するステップを含む。この方法は、ある特定の実施形態では、品質制御グラフィカルウィジェットによって、1つまたは複数の摂取メトリック(および、たとえばそこから判定された何らかの予後値)の自動判定の承認に対応するユーザ入力を受け取るステップと、1つまたは複数の摂取メトリックの自動判定の承認に対応するユーザ入力を受け取るのに応答して、プロセッサによって、1つまたは複数の自動的に判定された摂取メトリックの表現を含めた対象向けの報告[たとえば、報告は、対象の識別(たとえば匿名化された患者ID番号)と、1つまたは複数の判定された摂取メトリック(および、たとえばそこから判定された何らかの予後値)の表現(たとえばテキスト)と、1つまたは複数の摂取メトリック(および、たとえばそこから判定された何らかの予後値)の自動判定に対するユーザの承認の表現(たとえばグラフィックスおよび/またはテキスト)とを含む]を生成するステップとを含む。 In certain embodiments, the method includes: (f) displaying, by the processor, an interactive graphical user interface (GUI) to present a visual display of the 3D anatomical image and/or the 3D functional image to the user; (g) displaying by the processor within the GUI a graphical rendering of the 3D anatomical image and/or the 3D functional image, either by means of a corresponding user-selectable graphical control element (e.g. a toggle element); ) so that they can be selected for display and rendered separately, or both can be selected for display and rendered together by superimposing the 3D functional image on the 3D anatomical image. providing as a selectable and superimposable layer. In certain embodiments, step (g) includes graphical rendering of a selectable and superimposable segmentation layer that includes one or more identified specific tissue volumes within the 3D anatomical image. Once a segmentation layer is selected for display, graphics representing one or more specific tissue volumes (e.g., as outlines, e.g., as semi-transparent, color-coded volumes) are generated to represent the 3D anatomy. and/or 3D functional images. In certain embodiments, the one or more specific tissue volumes include an identified prostate volume. In certain embodiments, the method includes, in step (g), displaying a 3D anatomical image and/or a 3D functional Rendering a 2D cross-section of the image. In certain embodiments, the method includes, in step (g), rendering an interactive (eg, rotatable, eg, slicable) 3D view of the 3D anatomical image and/or the 3D functional image. The method includes, in certain embodiments, a location within the GUI that corresponds to a voxel of the identified prostate volume (e.g., the location is located within a GUI of another voxel of the 3D functional image that corresponds to the identified prostate volume). displaying a graphical element (e.g., a crosshair, a target, a colored marker, etc.) indicating a voxel having a maximum intensity of the 3D functional image, such as a maximum correction intensity compared to the voxel; Thereby, user review and/or quality control of the method is facilitated (e.g., the physician may verify that the identified location corresponds to the expected physical location of the subject's prostate). . The method includes, in certain embodiments, a quality control graphical widget (e.g., , the quality control graphical widget receives an input corresponding to the user's (i) approval of one or more intake metrics automatically determined by the processor, or (ii) disapproval of the automatic determination of one or more intake metrics. the one or more intake metrics determined in step (e) (and, optionally, the one determined therefrom), together with a selectable graphical control element for receiving input corresponding to the displaying text and/or graphics representing one or more prognostic values). In certain embodiments, the method includes the step of receiving user input corresponding to approval of automatic determination of one or more intake metrics (and, e.g., any prognostic value determined therefrom) by a quality control graphical widget. and a representation of the one or more automatically determined intake metrics by the processor in response to receiving user input corresponding to approval of the automatic determination of the one or more intake metrics. [For example, the report may include a subject's identity (e.g., an anonymized patient ID number) and a representation of one or more determined intake metrics (and, e.g., any prognostic value determined therefrom) (e.g., a representation (e.g., graphics and/or text) of the user's approval for automatic determination of the one or more intake metrics (and, e.g., any prognostic value determined therefrom). including.
この方法は、ある特定の実施形態では、品質制御グラフィカルウィジェットによって、1つまたは複数の摂取メトリック(および、たとえばそこから判定された何らかの予後値)の自動判定の不承認に対応するユーザ入力を受け取るステップと、1つまたは複数の摂取メトリックの自動判定の不承認に対応するユーザ入力を受け取るのに応答して、プロセッサによって、1つまたは複数の摂取メトリックの更新された値を判定するのに使用する3D機能的画像の1つまたは複数のボクセルの(たとえば、直接的または間接的に、たとえば3D解剖学的画像のボクセルを選択し、続いて、3D機能的画像の対応するボクセルを判定することによる)ユーザ選択のためのボクセル選択グラフィカル要素(たとえばカーソル、たとえば調整可能な十字マーク)を表示するステップと、ボクセル選択グラフィカル要素によって、1つまたは複数の摂取メトリックの更新された値を判定するのに使用する3D機能的画像の1つまたは複数のボクセルのユーザ選択[たとえば、ユーザ選択は、1つまたは複数の補正された背景強度測定ロケーションおよび/または1つまたは複数の補正された前立腺強度ロケーションであり、ここでは、ユーザによって、たとえば前立腺のロケーションの自動識別、および/またはたとえば殿筋といった背景エリアのロケーションの自動識別が優先される]を受け取るステップと、プロセッサによって、ユーザ選択のボクセルを使用して、1つまたは複数の摂取メトリックの値を更新するステップと、プロセッサによって、1つまたは複数の更新された摂取メトリックの表現(たとえばテキスト)を含む対象向けの報告[たとえば、報告は、対象の識別(たとえば匿名化された患者ID番号)と、1つまたは複数の判定された摂取メトリック(および、たとえばそこから判定された何らかの予後値)の表現(たとえばテキスト)と、ユーザ選択のボクセルを使用する1つまたは複数の摂取メトリック(および、たとえばそこから判定された何らかの予後値)の判定のユーザ承認の表現(たとえばグラフィックスおよび/またはテキスト)(たとえば摂取メトリックがユーザからのボクセルの手動選択を伴う半自動解析によって判定されたことを指示するテキスト)とを含む]を生成するステップとを含む。 In certain embodiments, the method includes the step of receiving user input corresponding to disapproval of an automated determination of one or more intake metrics (and, e.g., any prognostic value determined therefrom) by a quality control graphical widget. and, in response to receiving user input corresponding to a disapproval of the automatic determination of the one or more intake metrics, the 3D used to determine, by the processor, an updated value of the one or more intake metrics. of one or more voxels of the functional image (e.g., directly or indirectly, e.g. by selecting a voxel of the 3D anatomical image and subsequently determining the corresponding voxel of the 3D functional image) displaying a voxel selection graphical element (e.g., a cursor, e.g., an adjustable crosshair) for user selection and use by the voxel selection graphical element to determine updated values of the one or more intake metrics; [e.g., the user selection is one or more corrected background intensity measurement locations and/or one or more corrected prostate intensity locations; , wherein automatic identification of the location of the prostate, for example, and/or automatic identification of the location of the background area, e.g. the gluteal muscles, is preferred by the user] and by the processor using the user-selected voxels. , updating the values of one or more intake metrics by the processor, and a report for the subject that includes a representation (e.g., text) of the one or more updated intake metrics (e.g., an anonymized patient ID number) and a representation (e.g., text) of one or more determined uptake metrics (and, e.g., any prognostic value determined therefrom) and user-selected voxels. a user-approved representation (e.g., graphics and/or text) of the determination of one or more uptake metrics (and, e.g., any prognostic value determined therefrom) (e.g., where the uptake metric involves manual selection of voxels from the user; and a text indicating that the semi-automatic analysis has been performed.
この方法は、ある特定の実施形態では、品質制御グラフィカルウィジェットによって、1つまたは複数の摂取メトリック(および、たとえばそこから判定された何らかの予後値)の自動判定の不承認に対応するユーザ入力を受け取るステップと、品質制御グラフィカルウィジェットによって、品質制御の(たとえば低画質による)不合格に対応するユーザ入力を受け取るステップと、プロセッサによって、品質制御の不合格の識別を含む、対象向けの報告を生成するステップとを含む。 In certain embodiments, the method includes the step of receiving user input corresponding to a disapproval of an automated determination of one or more intake metrics (and, e.g., any prognostic value determined therefrom) by a quality control graphical widget. and receiving, by the quality control graphical widget, user input corresponding to a quality control failure (e.g., due to poor image quality); and generating, by the processor, a targeted report including identification of the quality control failure. including.
ある特定の実施形態では、3D機能的画像のボクセルは、既知の関係によって3D解剖学的画像のボクセルに関連づけられている[たとえば3D機能的画像の各ボクセルが3D解剖学的画像の1つまたは複数のボクセルに関連づけられており、たとえば3D機能的画像の1つまたは複数のボクセルの複数のセットの各々が3D解剖学的画像の1つまたは複数のボクセルのセットに関連づけられており、たとえば3D機能的画像のボクセルに関連づけられた座標が、既知の機能的関係によって(たとえば第1の撮像診断法と第2の撮像診断法との間の既知の空間的関係によって)解剖学的3D画像のボクセルに関連づけられた座標に関係している]。 In certain embodiments, voxels of the 3D functional image are related to voxels of the 3D anatomical image by known relationships [e.g., each voxel of the 3D functional image is associated with one or more voxels of the 3D anatomical image. associated with a plurality of voxels, e.g., each of the plurality of sets of one or more voxels of the 3D functional image is associated with a set of one or more voxels of the 3D anatomical image, e.g. The coordinates associated with the voxels of the functional image are determined by a known functional relationship (e.g., by a known spatial relationship between the first imaging modality and the second imaging modality) of the anatomical 3D image. related to the coordinates associated with the voxel].
ある特定の実施形態では、第1のモジュールは第1のCNN(畳み込みニューラルネットワーク)モジュールであり、第2モジュールは第2のCNNモジュールであり、第1のCNNモジュールは、第2のCNNモジュールよりも多くの(たとえば少なくとも1.5倍、たとえば少なくとも2倍、たとえば約2倍、たとえば少なくとも3倍、たとえば約3倍の)畳み込みフィルタを含む。 In certain embodiments, the first module is a first CNN (Convolutional Neural Network) module, the second module is a second CNN module, and the first CNN module is more complex than the second CNN module. as many (eg, at least 1.5 times, eg, at least 2 times, eg, about 2 times, eg, at least 3 times, eg, about 3 times as many) convolution filters.
この方法は、ある特定の実施形態では、複数の3D解剖学的画像の各々についてステップ(a)および(c)を遂行して、それぞれが複数の3D解剖学的画像のうち1つの内部にある複数の初期のVOIを判定するステップを含み、初期のVOIのサイズにおける変動性は、(たとえば実質的に)3D解剖学的画像のサイズにおける変動性未満である(たとえば、「サイズ」における変動性は、(i)画像の中に表された解剖学的ボリュームの、たとえばmmで測定された1つまたは複数の次元における変動性と、(ii)画像の1つまたは複数の次元の各々に沿った、画像の中のボクセルの数における変動性との一方または両方を意味する)[たとえば、3D解剖学的画像(各VOIが判定されるそれぞれの全体画像)の、1つまたは複数の次元の各々に沿ったサイズの変動は、少なくとも200mm、および/または少なくとも300mm、および/または少なくとも400mm、および/または少なくとも500mm、および/または400mm程度、および/または500mm程度、および/または1000mm程度、および/または1500mm程度であり、たとえば、3D解剖学的画像(各VOIが判定されるそれぞれの全体画像)の、1つまたは複数の次元の各々に沿ったサイズの変動は、少なくとも25ボクセル、および/または少なくとも50ボクセル、および/または少なくとも100ボクセル、および/または少なくとも250ボクセル、および/または少なくとも300ボクセル、および/または250ボクセル程度、および/または300ボクセル程度、および/または500ボクセル程度であり、たとえば、VOIの、1つまたは複数の次元の各々に沿ったサイズの変動は、200mmまたはそれ未満(たとえば100mmまたはそれ未満、たとえば50mmまたはそれ未満)であり、たとえば、VOIの、1つまたは複数の次元の各々に沿ったサイズの変動は、250ボクセルまたはそれ未満(たとえば200ボクセルまたはそれ未満、たとえば150ボクセルまたはそれ未満)である]。 In certain embodiments, the method includes performing steps (a) and (c) for each of the plurality of 3D anatomical images, each within one of the plurality of 3D anatomical images. determining a plurality of initial VOIs, wherein the variability in size of the initial VOI is (e.g., substantially) less than the variability in size of the 3D anatomical image (e.g., the variability in "size" (i) the variability in one or more dimensions, e.g., measured in mm, of the anatomical volume represented in the image; and (ii) along each of the one or more dimensions of the image. and/or variability in the number of voxels in the image) [e.g., variability in one or more dimensions of the 3D anatomical image (the respective global image from which each VOI is determined) The variation in size along each is at least 200 mm, and/or at least 300 mm, and/or at least 400 mm, and/or at least 500 mm, and/or as much as 400 mm, and/or as much as 500 mm, and/or as much as 1000 mm, and/or or 1500 mm, for example, the variation in size along each of the one or more dimensions of the 3D anatomical image (the respective global image from which each VOI is determined) is at least 25 voxels, and/or at least 50 voxels, and/or at least 100 voxels, and/or at least 250 voxels, and/or at least 300 voxels, and/or on the order of 250 voxels, and/or on the order of 300 voxels, and/or on the order of 500 voxels, e.g. The variation in size along each of the one or more dimensions of the VOI is 200 mm or less (e.g. 100 mm or less, e.g. 50 mm or less), e.g. is 250 voxels or less (eg, 200 voxels or less, eg, 150 voxels or less)].
ある特定の実施形態では、第1のモジュールは、3D解剖学的画像のダウンサンプリングされた第1の解像度のバージョン(たとえば3D解剖学的画像の低解像度バージョン)を入力として受け取って、これに対して動作するCNNモジュールであり、第2のモジュールは、初期のVOIへとクロップされた、3D解剖学的画像の、第2の解像度を有する高解像度バージョンを入力として受け取って、これに対して動作するCNNモジュールであり、第2の解像度は第1の解像度よりも(たとえば少なくとも2倍、たとえば少なくとも4倍、たとえば少なくとも8倍)高い。ある特定の実施形態では、第1のモジュールは、3D解剖学的画像の少なくとも一部分を入力として受け取り、第1のモジュールに対する入力によって表される物理ボリュームは、(i)初期のVOIによって表される物理ボリュームよりも少なくとも2倍(たとえば4倍、たとえば8倍)大きく、かつ/または(ii)初期のVOIによって少なくとも1つの次元に沿って表された物理ボリュームよりも2倍(たとえば4倍、たとえば8倍)大きい。 In certain embodiments, the first module receives as input a downsampled first resolution version of the 3D anatomical image (e.g., a lower resolution version of the 3D anatomical image), and a second module that receives as input a high-resolution version of the 3D anatomical image, cropped to the initial VOI, having a second resolution and operates on it; the second resolution is higher (eg, at least 2 times, eg, at least 4 times, eg, at least 8 times) higher than the first resolution. In certain embodiments, the first module receives as input at least a portion of the 3D anatomical image, and the physical volume represented by the input to the first module is: (i) represented by the initial VOI; (ii) at least two times (e.g., four times, e.g., eight times) larger than the physical volume, and/or (ii) two times (e.g., four times, e.g., 8 times) larger.
ある特定の実施形態では、第1のモジュールは、3D解剖学的画像の内部の骨盤領域のグラフィカル表現を識別するように訓練されたCNNモジュールであり、第2モジュールは、3D解剖学的画像の内部の前立腺組織のグラフィカル表現を識別するように訓練されたCNNモジュールである。 In certain embodiments, the first module is a CNN module trained to identify a graphical representation of a pelvic region within a 3D anatomical image, and the second module is a CNN module trained to identify a graphical representation of a pelvic region within a 3D anatomical image. A CNN module trained to identify graphical representations of internal prostate tissue.
別の態様では、本発明は、3D画像を自動的に処理して、対象の内部の標的組織領域に対応する、3D画像の内部の3Dボリュームを識別し、そこにおける放射性医薬品の摂取を表す1つまたは複数の摂取メトリックを判定するための方法に向けられ、この方法は、(a)コンピューティングデバイスのプロセッサによって、解剖学的撮像診断法[たとえばX線コンピュータ断層撮影法(CT)、たとえば磁気共鳴映像法(MRI)、たとえば超音波]を使用して得られた対象の3D解剖学的画像を受け取るステップであって、3D解剖学的画像が対象の特定の解剖学的領域(たとえば骨盤領域、胸部領域、頭部領域および/または頸部領域等の関連した組織の特定の群)の内部の組織(たとえば柔組織および/または骨)のグラフィカル表現を含み、特定の解剖学的領域が標的組織領域を含む、ステップと、(b)機能的撮像診断法[たとえば単一光子放射型コンピュータ断層撮影法(SPECT)、たとえば陽電子放射型断層撮影法(PET)]を使用して得られた対象の3D機能的画像をプロセッサによって受け取るステップであって、3D機能的画像に含まれる複数のボクセルが、それぞれ、対象の内部の特定の物理ボリュームを表し、また、特定の物理ボリュームから放射されて検知された放射線を表す強度値を有し、3D機能的画像の複数のボクセルの少なくとも一部分が、対象の特定の解剖学的領域の内部の物理ボリュームを表す、ステップと、(c)プロセッサによって、第1のモジュール(たとえば第1の機械学習モジュール)を使用して、3D解剖学的画像(たとえば直角プリズム)の内部の初期の目的ボリューム(VOI)を判定するステップであって、初期のVOI(たとえば、3D解剖学的画像の、このVOIから除外されたボクセルは、含まれるボクセルよりもより多く、たとえば、3D解剖学的画像の、このVOIに含まれるボクセルは25%未満であり、たとえば、VOIの内部のボクセルの大多数が、特定の解剖学的領域の内部の物理ボリュームを表す)が、標的組織領域を含む特定の解剖学的領域(たとえば骨盤領域、胸部領域、頭部領域および/または頸部領域等の関連した組織の群)に対応する、ステップと、(d)プロセッサによって、第2のモジュール(たとえば第2の機械学習モジュール)を使用して、対象の標的組織領域に対応する初期のVOIの内部の標的ボリュームを識別するステップと、(e)プロセッサによって、3D機能的画像と、3D解剖学的画像のVOIの内部で識別された標的ボリュームとを使用して、1つまたは複数の摂取メトリックを判定するステップ[たとえば3D解剖学的画像のVOIの内部で識別された標的ボリュームに対応する3D機能的画像のボクセルの強度値に基づいて、対象の標的組織領域における放射性医薬品の量を計算するステップ、たとえば対象の標的組織領域が占有する物理ボリュームを表す3D機能的画像のボクセルの強度の合計(たとえば加重和)、平均値、および/または最大値を計算するステップ]とを含む。 In another aspect, the invention automatically processes a 3D image to identify a 3D volume within the 3D image that corresponds to a target tissue region within the subject and represents the uptake of the radiopharmaceutical therein. The method is directed to a method for determining one or more uptake metrics, the method comprising: (a) a processor of a computing device performing an anatomical imaging diagnostic procedure [e.g., X-ray computed tomography (CT), e.g. receiving a 3D anatomical image of the subject obtained using resonance imaging (MRI), e.g. , a specific group of related tissues such as the thoracic region, head region and/or neck region), including a graphical representation of internal tissues (e.g. soft tissues and/or bones), in which specific anatomical regions are targeted. (b) an object obtained using a functional imaging modality [e.g., single photon emission computed tomography (SPECT), e.g. positron emission tomography (PET)], including a tissue region; receiving by the processor a 3D functional image of the object, each of the plurality of voxels included in the 3D functional image representing a particular physical volume within the object and emanating from the particular physical volume to be detected; (c) by the processor, the 3D functional image has an intensity value representative of the radiation of the 3D functional image; 1 (e.g., a first machine learning module) to determine an initial volume of interest (VOI) inside a 3D anatomical image (e.g., a rectangular prism), , of the 3D anatomical image, the voxels excluded from this VOI are more than the included voxels, e.g. less than 25% of the voxels of the 3D anatomical image are included in this VOI, e.g. The majority of voxels within the area represent the internal physical volume of a specific anatomical region), but the majority of voxels within the (d) by the processor, using a second module (e.g., a second machine learning module) to correspond to a target tissue region of interest; (e) by the processor, using the 3D functional image and the target volume identified within the VOI of the 3D anatomical image, identifying a target volume within the initial VOI; determining a plurality of uptake metrics [e.g., based on intensity values of voxels in the 3D functional image that correspond to target volumes identified within the VOI of the 3D anatomical image, of the radiopharmaceutical in the target tissue region of interest; calculating a quantity, e.g., a sum (e.g., a weighted sum), average, and/or maximum value of the intensities of voxels of the 3D functional image representing the physical volume occupied by the target tissue region of interest]; include.
この方法は、ある特定の実施形態では、段落[0027]~[0045]において明瞭に表現された特徴のうち1つまたは複数を有する。 The method, in certain embodiments, has one or more of the features articulated in paragraphs [0027]-[0045].
本発明は、別の態様では、膀胱の放射性医薬品の摂取からのクロストークに対して前立腺ボクセル強度を補正するために、3D機能的画像[たとえば核医学画像(たとえばSPECT画像、たとえばPET画像)]を自動的に解析する方法に向けられ、この方法は、(a)コンピューティングデバイスのプロセッサによって、解剖学的撮像診断法[たとえばX線コンピュータ断層撮影法(CT)、たとえば磁気共鳴映像法(MRI)、たとえば3D超音波]を使用して得られた対象の3D解剖学的画像を受け取るステップであって、3D解剖学的画像に含まれる対象の内部の組織(たとえば柔組織および/または骨)のグラフィカル表現の少なくとも一部分が対象の膀胱および前立腺に対応する、ステップと、(b)プロセッサによって対象の3D機能的画像を受け取るステップであって、3D機能的画像に含まれる複数のボクセルが、それぞれ、対象の内部の特定の物理ボリュームを表し、また、特定の物理ボリュームから放射されて検知された放射線を表す強度値を有し、3D機能的画像の複数のボクセルの少なくとも一部分が、対象の膀胱および/または前立腺の内部の物理ボリュームを表す、ステップと、(c)プロセッサによって、3D解剖学的画像の内部で、(i)対象の前立腺に対応する前立腺ボリューム、および(ii)対象の膀胱に対応する膀胱ボリュームを自動的に識別するステップと、(d)プロセッサによって、3D機能的画像の内部で、(i)識別された前立腺ボリュームに対応する複数の前立腺ボクセル、および(ii)識別された膀胱ボリュームに対応する複数の膀胱ボクセルを自動的に識別するステップと、(e)プロセッサによって、膀胱ボクセルの1つまたは複数の測定された強度(たとえば、識別された膀胱ボリュームならびに/あるいは識別された膀胱ボリュームの複数の領域の、各々および/または累積に対応する強度の、1つまたは複数の累積測定値および/またはピーク測定値および/または平均測定値および/または中央測定値)に基づいて、前立腺ボクセルの1つまたは複数の測定された強度(たとえば、識別された前立腺ボリュームならびに/あるいは識別された前立腺ボリュームの複数の領域の、各々および/または累積に対応する強度の、1つまたは複数の累積測定値および/またはピーク測定値および/または平均測定値および/または中央測定値)を調整するステップと、(f)プロセッサによって、前立腺ボクセルの調整された強度を使用して、対象の前立腺の内部の放射性医薬品の摂取を表す1つまたは複数の摂取メトリックを判定するステップとを含む。 In another aspect, the present invention provides 3D functional images [e.g., nuclear medicine images (e.g., SPECT images, e.g., PET images)] to correct prostate voxel intensities for cross-talk from bladder radiopharmaceutical ingestion. (a) a processor of a computing device automatically analyzes anatomical imaging modalities [e.g., X-ray computed tomography (CT), e.g., magnetic resonance imaging (MRI); ), e.g. 3D ultrasound], the 3D anatomical image comprising internal tissues (e.g. soft tissue and/or bone) of the object; (b) receiving a 3D functional image of the subject by the processor, wherein at least a portion of the graphical representation of the subject corresponds to a bladder and a prostate of the subject, wherein each of the plurality of voxels included in the 3D functional image , representing a particular physical volume within the subject and having intensity values representative of detected radiation emitted from the particular physical volume, at least a portion of the plurality of voxels of the 3D functional image being located within the subject's bladder. and/or representing a physical volume within the prostate; (d) by the processor, within the 3D functional image, (i) a plurality of prostate voxels corresponding to the identified prostate volume; and (ii) a plurality of prostate voxels corresponding to the identified prostate volume; (e) automatically identifying a plurality of bladder voxels corresponding to the bladder volume; and (e) determining, by the processor, one or more measured intensities of the bladder voxels (e.g. one or more cumulative and/or peak and/or average and/or median measurements of intensity corresponding to each and/or cumulative of a plurality of regions of bladder volume; one or more measured intensities of the prostate voxel (e.g., one or more of the intensities corresponding to each and/or cumulatively of the identified prostate volume and/or multiple regions of the identified prostate volume) (f) adjusting, by the processor, the adjusted intensities of the prostate voxels of the subject's prostate using the adjusted intensities of the prostate voxels; determining one or more uptake metrics representative of uptake of the internal radiopharmaceutical.
この方法は、ある特定の実施形態では、段落[0027]~[0045]において明瞭に表現された特徴のうち1つまたは複数を有する。 The method, in certain embodiments, has one or more of the features articulated in paragraphs [0027]-[0045].
本発明は、別の態様では、対象の一部分の3D機能的画像(たとえばSPECT画像)の自動解析に基づいて、対象の前立腺がんの状態を検知し、かつ/または前立腺がんのリスクを定量化する方法に向けられ、この方法は、(a)対象に、PSMA結合剤を含む放射性医薬品を投与した後に、3D機能的画像(たとえばSPECT画像)を取得するステップと、(b)コンピューティングデバイスのプロセッサによって、3D機能的画像の内部の、対象の前立腺に対応する3D標的ボリュームを識別するステップと、(c)プロセッサによって、3D標的ボリュームのボクセルの強度を使用して、標的の背景に対する比(TBR)の値を判定するステップと、(d)プロセッサによって、対話型グラフィカルユーザインターフェース(GUI)の内部に表示するように、判定されたTBR値を表すテキストおよび/またはグラフィックスのグラフィカルレンダリングをもたらすステップとを含む[たとえば、この方法は、TBR値に少なくとも部分的に基づいて、前立腺がんの(i)臨床的に重要な分類状態、または(ii)臨床的に重要でない分類状態を判定する(たとえば判定して表示する)ステップを含む]。 In another aspect, the invention provides methods for detecting prostate cancer status and/or quantifying prostate cancer risk in a subject based on automated analysis of 3D functional images (e.g., SPECT images) of a portion of the subject. (a) obtaining a 3D functional image (e.g., a SPECT image) after administering to a subject a radiopharmaceutical comprising a PSMA binding agent; and (b) a computing device. (c) identifying, by the processor, a 3D target volume within the 3D functional image that corresponds to the prostate of interest; and (c) determining, by the processor, a ratio of the target to the background using voxel intensities of the 3D target volume. (d) graphically rendering, by the processor, text and/or graphics representative of the determined TBR value for display within an interactive graphical user interface (GUI); [For example, the method includes determining (i) a clinically significant classification status, or (ii) a clinically unimportant classification status of prostate cancer based at least in part on the TBR value. (e.g., determining and displaying)].
この方法は、ある特定の実施形態では、段落[0027]~[0045]において明瞭に表現された特徴のうち1つまたは複数を有する。 The method, in certain embodiments, has one or more of the features articulated in paragraphs [0027]-[0045].
本発明は、別の態様では、3D画像を自動的に処理して、対象の前立腺に対応する、3D画像の内部の3Dボリュームを識別し、そこにおける(すなわち前立腺における)放射性医薬品の摂取を表す1つまたは複数の摂取メトリックを判定するためのシステムに向けられ、このシステムは、プロセッサと、命令を記憶したメモリ(たとえばプロセッサの外部にあるか、またはプロセッサに組み込まれている)とを備え、プロセッサは、これらの命令を実行することによって、(a)解剖学的撮像診断法[たとえばX線コンピュータ断層撮影法(CT)(たとえば全身CT画像、たとえば身体の局所CT画像)、たとえば磁気共鳴映像法(MRI)、たとえば3D超音波]を使用して得られた対象の3D解剖学的画像を受け取るステップであって、3D解剖学的画像に含まれる対象の内部の組織(たとえば柔組織および/または骨)のグラフィカル表現の少なくとも一部分が対象の骨盤領域に対応する、ステップと、(b)機能的撮像診断法[たとえば単一光子放射型コンピュータ断層撮影法(SPECT)、たとえば陽電子放射型断層撮影法(PET)]を使用して得られた対象の3D機能的画像を受け取るステップであって、3D機能的画像に含まれる複数のボクセルが、それぞれ、対象の内部の特定の物理ボリュームを表し、また、特定の物理ボリュームから放射されて検知された放射線を表す強度値を有し、3D機能的画像の複数のボクセルの少なくとも一部分が、対象の骨盤領域の内部の物理ボリュームを表す、ステップと、(c)第1のモジュール(たとえば第1の機械学習モジュール)を使用して、3D解剖学的画像(たとえば平行六面体、たとえば直方体)の内部の初期の目的ボリューム(VOI)を判定するステップであって、初期のVOIが、対象の骨盤領域の内部の組織に対応し、対象の骨盤領域の外部の組織を除外したものである(たとえば、3D解剖学的画像の、このVOIから除外されたボクセルは、含まれるボクセルよりもより多く、たとえば、3D解剖学的画像の、このVOIに含まれるボクセルは25%未満であり、たとえば、VOIの内部のボクセルの大多数が、対象の骨盤領域の内部の物理ボリュームを表す)、ステップと、(d)第2のモジュール(たとえば第2の機械学習モジュール)を使用して、対象の前立腺に対応する初期のVOIの内部の前立腺ボリュームを識別するステップと、(e)3D機能的画像および3D解剖学的画像の初期のVOIの内部で識別された前立腺ボリュームを使用して、1つまたは複数の摂取メトリックを判定する(たとえば判定して表示する)ステップ[たとえば3D解剖学的画像の初期のVOIの内部で識別された前立腺ボリュームに対応する3D機能的画像のボクセルの強度値に基づいて、対象の前立腺における放射性医薬品の量を計算するステップ、たとえば対象の前立腺が占有する物理ボリュームを表す3D機能的画像のボクセルの強度の合計(たとえば加重和)および/または平均値および/または最大値を計算するステップ]とを行う[たとえば1つまたは複数の摂取メトリックは腫瘍の背景に対する比(TBR)の値を含み、プロセッサは、命令を実行することにより、TBR値に少なくとも部分的に基づいて、前立腺がんの分類状態を、(i)臨床的に重要である、または(ii)臨床的に重要でない、のいずれかに判定する(たとえば判定して表示する)]。 In another aspect, the present invention automatically processes a 3D image to identify a 3D volume within the 3D image that corresponds to the subject's prostate and represents uptake of the radiopharmaceutical therein (i.e., in the prostate). A system for determining one or more intake metrics, the system comprising a processor and a memory (e.g., external to or embedded in the processor) storing instructions; By executing these instructions, the processor may perform (a) anatomical imaging diagnostic procedures [e.g. receiving a 3D anatomical image of the object obtained using a 3D ultrasound technique (MRI), e.g. 3D ultrasound; (b) a functional imaging modality [e.g. single photon emission computed tomography (SPECT), e.g. positron emission tomography; a plurality of voxels included in the 3D functional image each representing a particular physical volume within the object; and having intensity values representative of detected radiation emitted from a particular physical volume, at least a portion of the plurality of voxels of the 3D functional image representing a physical volume within the pelvic region of interest; (c) determining an initial volume of interest (VOI) inside a 3D anatomical image (e.g. a parallelepiped, e.g. a cuboid) using a first module (e.g. a first machine learning module); , the initial VOI corresponds to tissue inside the pelvic region of interest and excludes tissue outside the pelvic region of interest (e.g. voxels excluded from this VOI of the 3D anatomical image). contains more voxels, e.g. less than 25% of the voxels of the 3D anatomical image are contained in this VOI, e.g. the majority of voxels inside the VOI are inside the pelvic region of interest. (d) using a second module (e.g., a second machine learning module) to identify a prostate volume within the initial VOI corresponding to the prostate of interest; , (e) determining (e.g., determining and displaying) one or more uptake metrics using the prostate volume identified within the initial VOI of the 3D functional image and the 3D anatomical image. [calculating the amount of radiopharmaceutical in the prostate of the subject, e.g. calculating the sum (e.g., weighted sum) and/or mean and/or maximum value of the intensities of voxels of the 3D functional image representing the physical volume occupied by the prostate gland] [e.g., one or more intakes] The metric includes a tumor-to-background ratio (TBR) value, and the processor, by executing instructions, determines the classification status of the prostate cancer based at least in part on the TBR value as (i) clinically significant; or (ii) not clinically significant (e.g., determined and displayed)].
このシステムは、ある特定の実施形態では、段落[0027]~[0045]において明瞭に表現された特徴のうち1つまたは複数を有する。 The system, in certain embodiments, has one or more of the features articulated in paragraphs [0027]-[0045].
本発明は、別の態様では、3D画像を自動的に処理して、対象の内部の標的組織領域に対応する、3D画像の内部の3Dボリュームを識別し、そこにおける(すなわち標的組織領域における)放射性医薬品の摂取を表す1つまたは複数の摂取メトリックを判定するためのシステムに向けられ、このシステムは、プロセッサと、命令を記憶したメモリ(たとえばプロセッサの外部にあるか、またはプロセッサに組み込まれている)とを備え、プロセッサは、これらの命令を実行することによって、(a)解剖学的撮像診断法[たとえばX線コンピュータ断層撮影(CT)、たとえば磁気共鳴映像法(MRI)、たとえば超音波]を使用して得られた対象の3D解剖学的画像を受け取るステップであって、3D解剖学的画像が対象の特定の解剖学的領域(たとえば骨盤領域、胸部領域、頭部領域および/または頸部領域等の関連した組織の特定の群)の内部の組織(たとえば柔組織および/または骨)のグラフィカル表現を含み、特定の解剖学的領域が標的組織領域を含む、ステップと、(b)機能的撮像診断法[たとえば単一光子放射型コンピュータ断層撮影法(SPECT)、たとえば陽電子放射型断層撮影法(PET)]を使用して得られた対象の3D機能的画像を受け取るステップであって、3D機能的画像に含まれる複数のボクセルが、それぞれ、対象の内部の特定の物理ボリュームを表し、また、特定の物理ボリュームから放射されて検知された放射線を表す強度値を有し、3D機能的画像の複数のボクセルの少なくとも一部分が、対象の特定の解剖学的領域の内部の物理ボリュームを表す、ステップと、(c)第1のモジュール(たとえば第1の機械学習モジュール)を使用して、3D解剖学的画像(たとえば直角プリズム)の内部の初期の目的ボリューム(VOI)を判定するステップであって、初期のVOI(たとえば、3D解剖学的画像の、このVOIから除外されたボクセルは、含まれるボクセルよりもより多く、たとえば、3D解剖学的画像の、このVOIに含まれるボクセルは25%未満であり、たとえば、VOIの内部のボクセルの大多数が、特定の解剖学的領域の内部の物理ボリュームを表す)が、標的組織領域を含む特定の解剖学的領域(たとえば骨盤領域、胸部領域、頭部領域および/または頸部領域等の関連した組織の群)に対応する、ステップと、(d)第2のモジュール(たとえば第2の機械学習モジュール)を使用して、対象の標的組織領域に対応する初期のVOIの内部の標的ボリュームを識別するステップと、(e)3D機能的画像と、3D解剖学的画像のVOIの内部で識別された標的ボリュームとを使用して、1つまたは複数の摂取メトリックを判定するステップ[たとえば3D解剖学的画像のVOIの内部で識別された標的ボリュームに対応する3D機能的画像のボクセルの強度値に基づいて、対象の標的組織領域における放射性医薬品の量を計算するステップ、たとえば対象の標的組織領域が占有する物理ボリュームを表す3D機能的画像のボクセルの強度の合計(たとえば加重和)、および/または平均値、および/または最大値を計算するステップ]とを行う[たとえば1つまたは複数の摂取メトリックは腫瘍の背景に対する比(TBR)の値を含み、プロセッサは、命令を実行することにより、TBR値に少なくとも部分的に基づいて、がんの分類状態を、(i)臨床的に重要である、または(ii)臨床的に重要でない、のいずれかに判定する(たとえば判定して表示する)]。 In another aspect, the present invention automatically processes a 3D image to identify a 3D volume within the 3D image that corresponds to a target tissue region within the object, and where (i.e., in the target tissue region) A system for determining one or more ingestion metrics representative of ingestion of a radiopharmaceutical, the system comprising a processor and a memory storing instructions (e.g., external to the processor or embedded in the processor). Execution of these instructions causes the processor to perform (a) anatomical imaging diagnostic procedures such as X-ray computed tomography (CT), magnetic resonance imaging (MRI), ultrasound ] receiving a 3D anatomical image of the subject obtained using a (b) the specific anatomical region includes a target tissue region; ) receiving a 3D functional image of the subject obtained using a functional imaging modality [e.g. single photon emission computed tomography (SPECT), e.g. positron emission tomography (PET)]; The plurality of voxels included in the 3D functional image each represent a particular physical volume inside the object and have an intensity value representing the detected radiation emitted from the particular physical volume; (c) using a first module (e.g., a first machine learning module), wherein at least a portion of the plurality of voxels of the functional image represent a physical volume within a particular anatomical region of interest; determining an initial volume of interest (VOI) within the 3D anatomical image (e.g., a rectangular prism), the step of determining an initial volume of interest (VOI) within the 3D anatomical image (e.g., a rectangular prism); contains more voxels, e.g. less than 25% of the voxels of a 3D anatomical image are contained in this VOI, e.g. the majority of voxels inside the VOI are in a particular anatomical region. corresponding to a particular anatomical region (e.g., a group of related tissues such as a pelvic region, a thoracic region, a head region and/or a neck region) containing the target tissue region; (d) using a second module (e.g., a second machine learning module) to identify a target volume within the initial VOI that corresponds to a target tissue region of interest; and (e) 3D determining one or more uptake metrics using the functional image and a target volume identified within a VOI of the 3D anatomical image [e.g. calculating the amount of radiopharmaceutical in a target tissue region of interest based on the intensity values of voxels of the 3D functional image corresponding to the target volume identified, e.g., a 3D feature representing the physical volume occupied by the target tissue region of interest; calculating the sum (e.g., weighted sum) and/or mean and/or maximum of the intensities of the voxels of the target image] ), the processor determines, based at least in part on the TBR value, the classification status of the cancer as (i) clinically significant; or (ii) clinically significant. Judgment as unimportant (for example, judge and display)]
このシステムは、ある特定の実施形態では、段落[0027]~[0045]において明瞭に表現された特徴のうち1つまたは複数を有する。 The system, in certain embodiments, has one or more of the features articulated in paragraphs [0027]-[0045].
本発明は、別の態様では、対象の一部分の3D機能的画像(たとえばSPECT画像)の自動解析に基づいて、対象の前立腺がんの状態を検知し、かつ/または前立腺がんのリスクを定量化するシステムに向けられ、このシステムは、プロセッサと、命令を記憶したメモリ(たとえばプロセッサの外部にあるか、またはプロセッサに組み込まれている)とを備え、プロセッサは、これらの命令を実行することによって、(a)対象に、PSMA結合剤を含む放射性医薬品を投与した後に、対象の(たとえばいずれかまたはすべての)部分の3D機能的画像(たとえばSPECT画像)を受け取るステップと、(b)3D機能的画像の内部の、対象の前立腺に対応する3D標的ボリュームを識別するステップと、(c)3D標的ボリュームのボクセルの強度を使用して、標的の背景に対する比(TBR)の値を判定するステップと、(d)対話型グラフィカルユーザインターフェース(GUI)の内部に表示するように、判定されたTBR値を表すテキストおよび/またはグラフィックスのグラフィカルレンダリングをもたらすステップとを行う[たとえば、プロセッサは、これらの命令を実行することによって、TBR値に少なくとも部分的に基づいて、前立腺がんの(i)臨床的に重要な分類状態、または(ii)臨床的に重要でない分類状態を判定する(たとえば判定して表示する)ステップを行う]。 In another aspect, the invention provides methods for detecting prostate cancer status and/or quantifying prostate cancer risk in a subject based on automated analysis of 3D functional images (e.g., SPECT images) of a portion of the subject. The system is directed to a system that includes a processor and a memory (e.g., external to the processor or embedded in the processor) storing instructions, the processor having the ability to execute the instructions. (a) receiving a 3D functional image (e.g., a SPECT image) of (e.g., any or all) a portion of the subject after administering to the subject a radiopharmaceutical comprising a PSMA binding agent; identifying a 3D target volume within the functional image that corresponds to the prostate of interest; and (c) using voxel intensities of the 3D target volume to determine a target-to-background ratio (TBR) value. and (d) effecting a graphical rendering of text and/or graphics representative of the determined TBR value for display within an interactive graphical user interface (GUI) [e.g. Executing these instructions determines (i) a clinically significant classification status, or (ii) a clinically unimportant classification status of prostate cancer based at least in part on the TBR value (e.g. perform the step].
このシステムは、ある特定の実施形態では、段落[0027]~[0045]において明瞭に表現された特徴のうち1つまたは複数を有する。 The system, in certain embodiments, has one or more of the features articulated in paragraphs [0027]-[0045].
本発明は、ある特定の実施形態では、本明細書で説明されたシステムのうち任意のものを備えるコンピュータ支援検知(CADe)デバイスに向けられる。ある特定の実施形態では、プロセッサは、命令によって、対象の臨床的に重要な前立腺がんまたは臨床的に重要でない前立腺がんのいずれかの分類を識別する。 The present invention, in certain embodiments, is directed to computer-aided sensing (CADe) devices comprising any of the systems described herein. In certain embodiments, the instructions identify a classification of the subject as either clinically significant or clinically insignificant prostate cancer.
本発明は、ある特定の実施形態では、本明細書で説明されたシステムのうち任意のものを備えるコンピュータ支援診断(CADx)デバイスに向けられる。ある特定の実施形態では、プロセッサは、命令によって、対象の臨床的に重要な前立腺がんまたは臨床的に重要でない前立腺がんのいずれかの分類を識別する。 The present invention, in certain embodiments, is directed to a computer-aided diagnostics (CADx) device comprising any of the systems described herein. In certain embodiments, the instructions identify a classification of the subject as either clinically significant or clinically insignificant prostate cancer.
本発明は、ある特定の実施形態では、(a)放射性標識PSMA結合剤(たとえば99mTc-MIP-1404、たとえば[18F]DCFPyL、たとえば他の公知のPSMA結合剤)と、(b)本明細書で説明されたシステムのうち任意のものを備えるコンピュータ支援検知(CADe)デバイスとを含む組合せ製品に向けられる。ある特定の実施形態では、組合せ製品は、コンピュータ支援検知デバイスを用いる放射性標識PSMA結合剤の使用を規定する標識を含む。 In certain embodiments, the present invention provides a combination of (a) a radiolabeled PSMA binder (e.g., 99m Tc-MIP-1404, e.g., [ 18 F]DCFPyL, e.g., other known PSMA binders); and a computer-aided detection (CADe) device comprising any of the systems described herein. In certain embodiments, the combination product includes a label that provides for the use of a radiolabeled PSMA binding agent using a computer-assisted detection device.
本発明は、別の態様では、標的組織領域(たとえば前立腺、たとえば肺、たとえば1つまたは複数の骨、たとえばリンパ節、たとえば脳)に対応する3D画像の内部の3Dボリュームを識別するために3D画像を自動的に処理するための方法に向けられ、この方法は、(a)コンピューティングデバイスのプロセッサによって、解剖学的撮像診断法[たとえばX線コンピュータ断層撮影法(CT)、たとえば磁気共鳴映像法(MRI)、たとえば超音波]を使用して得られた対象の3D解剖学的画像を受け取るステップであって、3D解剖学的画像が対象の内部の組織(たとえば柔組織および/または骨)のグラフィカル表現を含む、ステップと、(b)プロセッサによって、第1のモジュール(たとえば第1の機械学習モジュール)を使用して、3D解剖学的画像(たとえば直角プリズム)の内部の初期の目的ボリューム(VOI)を判定するステップであって、初期のVOI(たとえば、3D解剖学的画像の、このVOIから除外されたボクセルは、含まれるボクセルよりもより多く、たとえば、3D解剖学的画像の、このVOIに含まれるボクセルは25%未満であり、たとえば、VOIの内部のボクセルの大多数が、特定の解剖学的領域の内部の物理ボリュームを表す)が、標的領域を含む特定の解剖学的領域(たとえば骨盤領域、胸部領域、頭部領域および/または頸部領域等の関連した組織の群)に対応する、ステップと、(c)プロセッサによって、第2のモジュール(たとえば第2の機械学習モジュール)を使用して、対象の標的組織領域に対応する初期のVOIの内部の標的ボリュームを識別するステップと、(d)識別された標的ボリュームに対応する3Dセグメント化マスクを、表示しかつ/またはさらに処理するために、プロセッサによって、記憶しかつ/または供給するステップとを含む。 In another aspect, the present invention provides a 3D image for identifying a 3D volume within a 3D image corresponding to a target tissue region (e.g. prostate, e.g. lung, e.g. one or more bones, e.g. lymph nodes, e.g. brain). A method for automatically processing images, the method comprising: (a) a processor of a computing device performing an anatomical imaging diagnostic procedure [e.g., X-ray computed tomography (CT), e.g., magnetic resonance imaging; receiving a 3D anatomical image of the object obtained using a magnetic resonance imaging technique (MRI), e.g. (b) by the processor, using the first module (e.g., the first machine learning module), an initial target volume inside the 3D anatomical image (e.g., a rectangular prism); determining an initial VOI (e.g., of the 3D anatomical image, in which more voxels are excluded from this VOI than are included, e.g., of the 3D anatomical image); This VOI contains less than 25% of the voxels (e.g., the majority of voxels inside the VOI represent the internal physical volume of a particular anatomical region), but the (c) a second module (e.g. a second machine learning module) corresponding to a region (e.g. a group of related tissues such as a pelvic region, a thoracic region, a head region and/or a neck region); (d) displaying and/or a 3D segmentation mask corresponding to the identified target volume; or storing and/or providing by a processor for further processing.
ある特定の実施形態では、第1のモジュールは、3D解剖学的画像を入力として受け取り、3D解剖学的画像の内部の長方形ボリュームの向かい合ったコーナーを表す複数の座標値(たとえば長方形ボリュームの向かい合ったコーナーを表す座標値の2つのセット)を出力する。 In certain embodiments, the first module receives as input a 3D anatomical image and a plurality of coordinate values representing opposite corners of a rectangular volume within the 3D anatomical image (e.g., opposite corners of the rectangular volume). outputs two sets of coordinate values representing corners).
ある特定の実施形態では、第1のモジュールは、畳み込みニューラルネットワーク(CNN)モジュール(たとえば1つまたは複数の畳み込み層を利用するニューラルネットワークモジュール)である。 In certain embodiments, the first module is a convolutional neural network (CNN) module (eg, a neural network module that utilizes one or more convolutional layers).
ある特定の実施形態では、ステップ(c)は、第2のモジュールを使用して、3D解剖学的画像の内部の、それぞれが対象の内部の特定の組織領域に対応する1つまたは複数のその他の組織のボリュームを識別するステップを含む。 In certain embodiments, step (c) uses the second module to generate one or more other tissue regions within the 3D anatomical image, each corresponding to a particular tissue region within the subject. identifying a tissue volume of the tissue.
ある特定の実施形態では、ステップ(c)は、第2のモジュールを使用して、初期のVOIの内部の各ボクセルを、対象の内部の(所定の)異なる組織領域のセット{たとえば、このセットは、標的組織領域と、必要に応じて、1つまたは複数のその他の組織領域[たとえば対象の骨盤骨(たとえば仙骨、たとえば尾骨、たとえば左寛骨、たとえば右寛骨)、対象の膀胱、対象の直腸、および殿筋(たとえば左殿筋、たとえば右の殿筋]とを含む}のうち特定の組織領域に対応するものとして分類するステップを含む。 In certain embodiments, step (c) uses a second module to associate each voxel within the initial VOI with a set of (predetermined) different tissue regions within the subject {e.g. The target tissue region and, optionally, one or more other tissue regions [e.g., the target's pelvic bone (e.g., sacrum, e.g., coccyx, e.g., left hip bone, e.g., right hip bone), the target's bladder, the target's rectum, and gluteal muscles (e.g., left gluteus muscle, e.g., right gluteus muscle)} as corresponding to a particular tissue region.
ある特定の実施形態では、初期のVOIの内部の各ボクセルを分類するステップは、第2のモジュールによって、初期のVOIの内部の複数のボクセルの各々について尤度値のセットを判定するステップであって、尤度値のセットが、組織領域セットのうち1つまたは複数の組織領域の各々について、ボクセルが、組織領域の内部の物理ボリュームを表す尤度(たとえば第2のモジュールによって計算される)を表す対応する尤度値を含む、ステップと、初期のVOIの内部の複数のボクセルの各々について、ボクセルについて判定された尤度値のセットに基づいて、ボクセルを特定の組織領域に対応するものとして分類するステップとを含む。 In certain embodiments, classifying each voxel within the initial VOI comprises determining, by a second module, a set of likelihood values for each of the plurality of voxels within the initial VOI. and the set of likelihood values determines, for each of the one or more tissue regions of the tissue region set, the likelihood (e.g., computed by the second module) that the voxel represents a physical volume inside the tissue region. for each of the plurality of voxels within the initial VOI, including a corresponding likelihood value representing the voxel as corresponding to a particular tissue region based on the set of likelihood values determined for the voxel. and classifying as.
ある特定の実施形態では、第2のモジュールは、初期のVOI(たとえば全体の初期のVOI)を入力として受け取り、初期のVOIの内部の各ボクセルについて、(i)ボクセルを分類する値[たとえば、ボクセルを、たとえば異なる組織領域の所定のセットから選択された領域、たとえば標的組織領域を含む所定のセット、たとえば対象の前立腺、たとえば対象の骨盤骨(たとえば仙骨、たとえば尾骨、たとえば左寛骨、たとえば右側寛骨)、対象の膀胱、対象の直腸、対象の殿筋(たとえば左殿筋、たとえば右殿筋)といった特定の組織領域に対応するものとして分類する値]と、(ii)ボクセルに関する尤度値のセット[たとえば、たとえば対象の前立腺、たとえば対象の骨盤骨(たとえば仙骨、たとえば尾骨、たとえば左寛骨、たとえば右寛骨)、対象の膀胱、対象の直腸、および対象の殿筋(たとえば左殿筋、たとえば右殿筋)といった異なる組織領域の所定のセットから選択された領域といった特定の組織領域にボクセルが対応する尤度]と、(iii)(たとえば、第2のモジュールが、各ボクセルに対して一度に1つずつ動作するのとは対照的に、1回で全体のVOIに関する尤度値を分類し、かつ/または計算するように)ボクセルを、異なる組織領域の所定のセットのうちいかなるものにも対応しないものとして識別する値(たとえば対応しそうもないものとして識別する値、またはボクセルが対応しない尤度を識別する値)(たとえば、ボクセルを、たとえば診断用ではない背景エリアに対応するもの、もしくは背景エリアに対応しそうなものとして識別する値、またはボクセルが背景エリアに対応する尤度を識別する値)とのうち、少なくとも1つを含む複数の値を出力する。 In certain embodiments, the second module receives as input an initial VOI (e.g., an overall initial VOI) and, for each voxel within the initial VOI, determines (i) a value that classifies the voxel [e.g. The voxels are selected from a predetermined set of different tissue regions, e.g. (ii) the likelihood of the voxel; A set of degree values [e.g., the subject's prostate, the subject's pelvic bones (e.g., the sacrum, the coccyx, the left hipbone, for example, the right hipbone), the subject's bladder, the subject's rectum, and the subject's gluteal muscles (e.g., (iii) the likelihood that a voxel corresponds to a particular tissue region, such as a region selected from a predetermined set of different tissue regions, such as left gluteus muscle, e.g. right gluteus muscle; voxels in a predetermined set of different tissue regions (to classify and/or calculate likelihood values for the entire VOI in one go, as opposed to operating on voxels one at a time). (e.g., a value that identifies the voxel as unlikely to correspond to, or a value that identifies the likelihood that the voxel does not correspond to, for example, a non-diagnostic background area) or a value identifying the voxel as likely to correspond to the background area, or a value identifying the likelihood that the voxel corresponds to the background area).
ある特定の実施形態では、ステップ(c)は、第2のモジュールを使用して、識別された標的ボリュームおよび1つまたは複数のその他の組織ボリュームを含む1つまたは複数の基底組織ボリュームのセットを識別するステップを含み、この方法は、プロセッサによって、1つまたは複数の補助モジュール(たとえば補助機械学習モジュール)を使用して、3D解剖学的画像の内部の1つまたは複数の補助組織ボリュームを識別するステップであって、それぞれの補助組織ボリュームが、第2のモジュールによって識別された基底組織ボリュームに対応する{たとえば、同じ特定の組織領域[たとえば対象の前立腺、たとえば対象の骨盤骨(たとえば仙骨、たとえば尾骨、たとえば左寛骨、たとえば右寛骨)、対象の膀胱、対象の直腸、および殿筋(たとえば左殿筋、たとえば右の殿筋)]が、この基底組織ボリュームとして表される}、ステップと、プロセッサによって、それぞれの補助組織ボリュームを、第2のモジュールによって識別された対応する基底組織ボリュームと合併させる(たとえば、本来の基底組織ボリュームに含まれていなかった対応する補助組織ボリュームの部分を組み込むことによって対応する基底組織ボリュームを増大させる)ステップとをさらに含む。 In certain embodiments, step (c) uses the second module to generate a set of one or more ground tissue volumes that includes the identified target volume and one or more other tissue volumes. identifying, by the processor, one or more auxiliary tissue volumes within the 3D anatomical image using one or more auxiliary modules (e.g., auxiliary machine learning modules); each supplementary tissue volume corresponds to the underlying tissue volume identified by the second module {e.g., the same specific tissue region [e.g., the subject's prostate, e.g., the subject's pelvic bone (e.g., the sacrum, the subject's bladder, the subject's rectum, and the gluteal muscles (e.g., the left gluteus, e.g., the right gluteus)] are represented as this underlying tissue volume}; merging, by the processor, each supplementary tissue volume with the corresponding basal tissue volume identified by the second module (e.g., portions of the corresponding supplementary tissue volume that were not included in the original basal tissue volume); and increasing the corresponding ground tissue volume by incorporating.
この方法は、ある特定の実施形態では、(e)3D解剖学的画像の視覚表示をユーザに提示するために、プロセッサによって、対話型グラフィカルユーザインターフェース(GUI)を表示するステップと、(f)プロセッサによって、GUIの内部に、3D解剖学的画像の内部の1つまたは複数の識別された特定の組織ボリュームを含む選択可能かつスーパーインポーズ可能なセグメント化層とともに3D解剖学的画像のグラフィカルレンダリングをもたらすステップであって、表示用のセグメント化層が選択されると、1つまたは複数の特定の組織ボリュームを表すグラフィックスが、(たとえば輪郭として、たとえば半透明の色分けされたボリュームとして)3D解剖学的画像に重ね合わされる、ステップとを含む。 In certain embodiments, the method includes (e) displaying, by the processor, an interactive graphical user interface (GUI) to present a visual representation of the 3D anatomical image to the user; and (f) Graphical rendering of the 3D anatomical image by the processor within the GUI with selectable and superimposable segmentation layers containing one or more identified specific tissue volumes within the 3D anatomical image Once the segmentation layer is selected for display, graphics representing the one or more specific tissue volumes (e.g., as outlines, e.g., as translucent color-coded volumes) are displayed in 3D. superimposed on the anatomical image.
ある特定の実施形態では、1つまたは複数の特定の組織ボリュームは識別された標的ボリュームを含む。 In certain embodiments, the one or more specific tissue volumes include the identified target volume.
この方法は、ある特定の実施形態では、ステップ(f)において、2D断面図の位置がユーザによって調整され得るように、対話型2Dビューアの内部に、3D解剖学的画像の2D断面図をレンダリングするステップを含む。 In certain embodiments, the method, in step (f), renders a 2D cross-section view of the 3D anatomical image within an interactive 2D viewer such that the position of the 2D cross-section view can be adjusted by the user. including steps to
この方法は、ある特定の実施形態では、ステップ(f)において、3D解剖学的画像の対話型(たとえば回転可能、たとえばスライス可能)3Dビューをレンダリングするステップを含む。 In certain embodiments, the method includes rendering an interactive (eg, rotatable, eg, slicable) 3D view of the 3D anatomical image in step (f).
ある特定の実施形態では、第1のモジュールは第1のCNN(畳み込みニューラルネットワーク)モジュールであり、第2モジュールは第2のCNNモジュールであり、第1のCNNモジュールは、第2のCNNモジュールよりも多くの(たとえば少なくとも1.5倍、たとえば少なくとも2倍、たとえば約2倍、たとえば少なくとも3倍、たとえば約3倍の)畳み込みフィルタを含む。 In certain embodiments, the first module is a first CNN (Convolutional Neural Network) module, the second module is a second CNN module, and the first CNN module is more complex than the second CNN module. as many (eg, at least 1.5 times, eg, at least 2 times, eg, about 2 times, eg, at least 3 times, eg, about 3 times as many) convolution filters.
この方法は、ある特定の実施形態では、複数の3D解剖学的画像の各々についてステップ(a)および(b)を遂行して、それぞれが複数の3D解剖学的画像のうち1つの内部にある複数の初期のVOIを判定するステップを含み、初期のVOIのサイズにおける変動性は、(たとえば実質的に)3D解剖学的画像のサイズにおける変動性未満である(たとえば、「サイズ」における変動性は、(i)画像の中に表された解剖学的ボリュームの、たとえばmmで測定された1つまたは複数の次元における変動性と、(ii)画像の1つまたは複数の次元の各々に沿った、画像の中のボクセルの数における変動性との一方または両方を意味する)[たとえば、3D解剖学的画像(各VOIが判定されるそれぞれの全体画像)の、1つまたは複数の次元の各々に沿ったサイズの変動は、少なくとも200mm、および/または少なくとも300mm、および/または少なくとも400mm、および/または少なくとも500mm、および/または400mm程度、および/または500mm程度、および/または1000mm程度、および/または1500mm程度であり、たとえば、3D解剖学的画像(各VOIが判定されるそれぞれの全体画像)の、1つまたは複数の次元の各々に沿ったサイズの変動は、少なくとも25ボクセル、および/または少なくとも50ボクセル、および/または少なくとも100ボクセル、および/または少なくとも250ボクセル、および/または少なくとも300ボクセル、および/または250ボクセル程度、および/または300ボクセル程度、および/または500ボクセル程度であり、たとえば、VOIの、1つまたは複数の次元の各々に沿ったサイズの変動は、200mmまたはそれ未満(たとえば100mmまたはそれ未満、たとえば50mmまたはそれ未満)であり、たとえば、VOIの、1つまたは複数の次元の各々に沿ったサイズの変動は、250ボクセルまたはそれ未満(たとえば200ボクセルまたはそれ未満、たとえば150ボクセルまたはそれ未満)である]。 In certain embodiments, the method includes performing steps (a) and (b) for each of the plurality of 3D anatomical images, each within one of the plurality of 3D anatomical images. determining a plurality of initial VOIs, wherein the variability in size of the initial VOI is (e.g., substantially) less than the variability in size of the 3D anatomical image (e.g., the variability in "size" (i) the variability in one or more dimensions, e.g., measured in mm, of the anatomical volume represented in the image; and (ii) along each of the one or more dimensions of the image. and/or variability in the number of voxels in the image) [e.g., variability in one or more dimensions of the 3D anatomical image (the respective global image from which each VOI is determined) The variation in size along each is at least 200 mm, and/or at least 300 mm, and/or at least 400 mm, and/or at least 500 mm, and/or as much as 400 mm, and/or as much as 500 mm, and/or as much as 1000 mm, and/or or 1500 mm, for example, the variation in size along each of the one or more dimensions of the 3D anatomical image (the respective global image from which each VOI is determined) is at least 25 voxels, and/or at least 50 voxels, and/or at least 100 voxels, and/or at least 250 voxels, and/or at least 300 voxels, and/or on the order of 250 voxels, and/or on the order of 300 voxels, and/or on the order of 500 voxels, e.g. The variation in size along each of the one or more dimensions of the VOI is 200 mm or less (e.g. 100 mm or less, e.g. 50 mm or less), e.g. is 250 voxels or less (eg, 200 voxels or less, eg, 150 voxels or less)].
ある特定の実施形態では、第1のモジュールは、3D解剖学的画像のダウンサンプリングされた第1の解像度のバージョン(たとえば3D解剖学的画像の低解像度バージョン)を入力として受け取って、これに対して動作するCNNモジュールであり、第2のモジュールは、初期のVOIへとクロップされた、3D解剖学的画像の、第2の解像度を有する高解像度バージョンを入力として受け取って、これに対して動作するCNNモジュールであり、第2の解像度は第1の解像度よりも(たとえば少なくとも2倍、たとえば少なくとも4倍、たとえば少なくとも8倍)高い。 In certain embodiments, the first module receives as input a downsampled first resolution version of the 3D anatomical image (e.g., a lower resolution version of the 3D anatomical image), and a second module that receives as input a high-resolution version of the 3D anatomical image, cropped to the initial VOI, having a second resolution and operates on it; the second resolution is higher (eg, at least 2 times, eg, at least 4 times, eg, at least 8 times) higher than the first resolution.
ある特定の実施形態では、第1のモジュールは、3D解剖学的画像の少なくとも一部分を入力として受け取り、第1のモジュールに対する入力によって表される物理ボリュームは、(i)初期のVOIによって表される物理ボリュームよりも少なくとも2倍(たとえば4倍、たとえば8倍)大きく、かつ/または(ii)初期のVOIによって少なくとも1つの次元に沿って表された物理ボリュームよりも2倍(たとえば4倍、たとえば8倍)大きい。 In certain embodiments, the first module receives as input at least a portion of the 3D anatomical image, and the physical volume represented by the input to the first module is: (i) represented by the initial VOI; (ii) at least two times (e.g., four times, e.g., eight times) larger than the physical volume, and/or (ii) two times (e.g., four times, e.g., 8 times) larger.
ある特定の実施形態では、第1のモジュールは、3D解剖学的画像の内部の特定の解剖学的領域のグラフィカル表現を識別するように訓練されたCNNモジュールであり、第2モジュールは、3D解剖学的画像の内部の標的組織領域のグラフィカル表現を識別するように訓練されたCNNモジュールである。 In certain embodiments, the first module is a CNN module trained to identify a graphical representation of a particular anatomical region within a 3D anatomical image, and the second module is a CNN module trained to identify a graphical representation of a particular anatomical region within a 3D anatomical image. A CNN module trained to identify a graphical representation of a target tissue region within a medical image.
この方法は、ある特定の実施形態では、機能的撮像診断法[たとえば単一光子放射型コンピュータ断層撮影法(SPECT)、たとえば陽電子放射型断層撮影法(PET)]を使用して得られた対象の3D機能的画像をプロセッサによって受け取るステップであって、3D機能的画像に含まれる複数のボクセルが、それぞれ、対象の内部の特定の物理ボリュームを表し、また、特定の物理ボリュームから放射されて検知された放射線を表す強度値を有し、3D機能的画像の複数のボクセルの少なくとも一部分が、特定の解剖学的領域の内部の物理ボリュームを表す、ステップと、3D機能的画像の内部で、3Dセグメント化マスクを使用して(たとえば3Dセグメント化マスクを3D機能的画像にマッピングすることによって)、識別された標的ボリュームに対応する3Dボリュームを識別するステップとをさらに含む。 The method, in certain embodiments, includes a method for detecting a target image obtained using a functional imaging modality [e.g., single photon emission computed tomography (SPECT), e.g., positron emission tomography (PET)]. receiving by the processor a 3D functional image of the object, each of the plurality of voxels included in the 3D functional image representing a particular physical volume within the object and radiating from the particular physical volume to be detected; the 3D functional image has an intensity value representative of the radiation radiated from the 3D functional image, at least a portion of the plurality of voxels of the 3D functional image representing a physical volume within the particular anatomical region; identifying a 3D volume corresponding to the identified target volume using the segmentation mask (eg, by mapping the 3D segmentation mask to the 3D functional image).
ある特定の実施形態では、3D機能的画像のボクセルは、既知の関係によって3D解剖学的画像のボクセルに関連づけられている[たとえば3D機能的画像の各ボクセルが3D解剖学的画像の1つまたは複数のボクセルに関連づけられており、たとえば3D機能的画像の1つまたは複数のボクセルの複数のセットの各々が3D解剖学的画像の1つまたは複数のボクセルのセットに関連づけられており、たとえば3D機能的画像のボクセルに関連づけられた座標が、既知の機能的関係によって(たとえば第1の撮像診断法と第2の撮像診断法との間の既知の空間的関係によって)解剖学的3D画像のボクセルに関連づけられた座標に関係している]。 In certain embodiments, voxels of the 3D functional image are related to voxels of the 3D anatomical image by known relationships [e.g., each voxel of the 3D functional image is associated with one or more voxels of the 3D anatomical image. associated with a plurality of voxels, e.g., each of the plurality of sets of one or more voxels of the 3D functional image is associated with a set of one or more voxels of the 3D anatomical image, e.g. The coordinates associated with the voxels of the functional image are determined by a known functional relationship (e.g., by a known spatial relationship between the first imaging modality and the second imaging modality) of the anatomical 3D image. related to the coordinates associated with the voxel].
本発明は、別の態様では、標的組織領域(たとえば前立腺、たとえば肺、たとえば1つまたは複数の骨、たとえばリンパ節、たとえば脳)に対応する3D画像の内部の3Dボリュームを識別するために3D画像を自動的に処理するためのシステムに向けられ、このシステムは、コンピューティングデバイスのプロセッサと、命令を記憶したメモリとを備え、プロセッサは、これらの命令を実行することによって、(a)解剖学的撮像診断法[たとえばX線コンピュータ断層撮影法(CT)、たとえば磁気共鳴映像法(MRI)、たとえば超音波]を使用して得られた対象の3D解剖学的画像を受け取るステップであって、3D解剖学的画像が対象の内部の組織(たとえば柔組織および/または骨)のグラフィカル表現を含む、ステップと、(b)第1のモジュール(たとえば第1の機械学習モジュール)を使用して、3D解剖学的画像(たとえば直角プリズム)の内部の初期の目的ボリューム(VOI)を判定するステップであって、初期のVOI(たとえば、3D解剖学的画像の、このVOIから除外されたボクセルは、含まれるボクセルよりもより多く、たとえば、3D解剖学的画像の、このVOIに含まれるボクセルは25%未満であり、たとえば、VOIの内部のボクセルの大多数が、特定の解剖学的領域の内部の物理ボリュームを表す)が、標的領域を含む特定の解剖学的領域(たとえば骨盤領域、胸部領域、頭部領域および/または頸部領域等の関連した組織の群)に対応する、ステップと、(c)第2のモジュール(たとえば第2の機械学習モジュール)を使用して、対象の標的組織領域に対応する初期のVOIの内部の標的ボリュームを識別するステップと、(d)識別された標的ボリュームに対応する3Dセグメント化マスクを、表示しかつ/またはさらに処理するために、記憶しかつ/または供給するステップとを行う。 In another aspect, the present invention provides a 3D image for identifying a 3D volume within a 3D image corresponding to a target tissue region (e.g. prostate, e.g. lung, e.g. one or more bones, e.g. lymph nodes, e.g. brain). A system for automatically processing images, the system comprising a processor of a computing device and a memory storing instructions, the processor executing the instructions to: (a) perform dissection; receiving a 3D anatomical image of the object obtained using a medical imaging modality (e.g. X-ray computed tomography (CT), e.g. magnetic resonance imaging (MRI), e.g. ultrasound); , the 3D anatomical image includes a graphical representation of internal tissue (e.g., soft tissue and/or bone) of the object; and (b) using a first module (e.g., a first machine learning module). , determining an initial volume of interest (VOI) within the 3D anatomical image (e.g., a rectangular prism), wherein voxels of the initial VOI (e.g., the 3D anatomical image) that are excluded from this VOI are , more than the included voxels, e.g., of a 3D anatomical image, this VOI contains less than 25% of the voxels, e.g., the majority of voxels inside the VOI are in a particular anatomical region. the internal physical volume) corresponds to a particular anatomical region containing the target region (e.g. a group of related tissues such as the pelvic region, thoracic region, head region and/or neck region); , (c) using a second module (e.g., a second machine learning module) to identify a target volume within the initial VOI that corresponds to a target tissue region of interest; and (d) identifying a target volume within the initial VOI that corresponds to a target tissue region of interest. storing and/or providing a 3D segmentation mask corresponding to the target volume for display and/or further processing.
このシステムは、ある特定の実施形態では、段落[0062]~[0079]において明瞭に表現された特徴のうち1つまたは複数を有する。 The system, in certain embodiments, has one or more of the features articulated in paragraphs [0062]-[0079].
本発明の一態様に関して説明された実施形態の特徴は、本発明の別の態様に関して適用され得る。
本発明は、例えば、以下の項目を提供する。
(項目1)
3D画像を自動的に処理して、対象の前立腺に対応する、前記3D画像の内部の3Dボリュームを識別し、そこにおける放射性医薬品の摂取を表す1つまたは複数の摂取メトリックを判定するための方法であって、
(a)解剖学的撮像診断法を使用して得られた前記対象の3D解剖学的画像をコンピューティングデバイスのプロセッサによって受け取るステップであって、前記3D解剖学的画像が含む対象の内部の組織のグラフィカル表現の少なくとも一部分が前記対象の骨盤領域に対応する、ステップと、
(b)機能的撮像診断法を使用して得られた前記対象の3D機能的画像を前記プロセッサによって受け取るステップであって、前記3D機能的画像に含まれる複数のボクセルが、それぞれ、前記対象の内部の特定の物理ボリュームを表し、また、前記特定の物理ボリュームから放射されて検知された放射線を表す強度値を有し、前記3D機能的画像の前記複数のボクセルの少なくとも一部分が、前記対象の前記骨盤領域の内部の物理ボリュームを表す、ステップと、
(c)前記プロセッサによって、第1のモジュールを使用して、前記3D解剖学的画像の内部の初期の目的ボリューム(VOI)を判定するステップであって、前記初期のVOIが、前記対象の前記骨盤領域の内部の組織に対応し、前記対象の前記骨盤領域の外部の組織は除外する、ステップと、
(d)前記プロセッサによって、第2のモジュールを使用して、前記対象の前記前立腺に対応する前記初期のVOIの内部の前立腺ボリュームを識別するステップと、
(e)前記プロセッサによって、前記3D機能的画像と、前記3D解剖学的画像の前記初期のVOIの内部で識別された前記前立腺ボリュームとを使用して、前記1つまたは複数の摂取メトリックを判定するステップとを含む方法。
(項目2)
前記第1のモジュールが、前記3D解剖学的画像を入力として受け取って、前記3D解剖学的画像の内部の長方形ボリュームの向かい合ったコーナーを表す複数の座標値を出力する、項目1に記載の方法。
(項目3)
ステップ(c)が、前記第1のモジュールを使用して、前記対象の骨盤骨に対応する前記3D解剖学的画像のボリュームを識別する3D骨盤骨マスクを判定するステップを含む、項目1または2に記載の方法。
(項目4)
前記第1のモジュールが畳み込みニューラルネットワーク(CNN)モジュールである、先行する項目のいずれか一項に記載の方法。
(項目5)
ステップ(d)が、前記第2のモジュールを使用して、前記3D解剖学的画像の内部の、それぞれが前記対象の内部の特定の組織領域に対応する1つまたは複数のその他の組織ボリュームを識別するステップを含み、前記1つまたは複数のその他の組織ボリュームが、
前記対象の骨盤骨、
前記対象の膀胱、
前記対象の直腸、および
前記対象の殿筋からなる群から選択される1つまたは複数の特定の組織領域に対応する、先行する項目のいずれか一項に記載の方法。
(項目6)
ステップ(d)が、前記第2のモジュールを使用して、前記初期のVOIの内部の各ボクセルを、前記対象の内部の(所定の)異なる組織領域のセットのうち特定の組織領域に対応するものとして分類するステップを含む、先行する項目のいずれか一項に記載の方法。
(項目7)
前記初期のVOIの内部の各ボクセルを分類するステップが、
前記第2のモジュールによって、前記初期のVOIの内部の複数のボクセルの各々について、尤度値のセットを判定するステップであって、前記尤度値のセットが、前記組織領域セットのうち1つまたは複数の組織領域の各々について、前記ボクセルが前記組織領域の内部の物理ボリュームを表すことの尤度を表す対応する尤度値を含む、ステップと、
前記初期のVOIの内部の前記複数のボクセルの各々について、前記ボクセルについて判定された前記尤度値のセットに基づいて、前記ボクセルを前記特定の組織領域に対応するものとして分類するステップとを含む、項目6に記載の方法。
(項目8)
前記第2のモジュールが、前記初期のVOIを入力として受け取って、前記初期のVOIの内部の各ボクセルについて、
(i)前記ボクセルを分類する値と、
(ii)前記ボクセルに関する尤度値のセットと、
(iii)前記ボクセルを、異なる組織領域の所定のセットのうちいかなるものにも対応しないものとして識別する値とのうち少なくとも1つを含む複数の値を出力する、項目6または7に記載の方法。
(項目9)
前記異なる組織領域の(所定の)セットが、
前記対象の前記前立腺と、
前記対象の骨盤骨と、
前記対象の膀胱と、
前記対象の直腸と、
前記対象の殿筋とからなる群から選択される1つまたは複数の組織領域を含む、項目6から8のいずれか一項に記載の方法。
(項目10)
ステップ(d)が、前記第2のモジュールを使用して1つまたは複数の基底組織ボリュームのセットを識別するステップを含み、前記1つまたは複数の基底組織ボリュームが、前記識別された前立腺ボリュームおよび前記1つまたは複数のその他の組織ボリュームを含み、前記方法は、
前記プロセッサによって、1つまたは複数の補助モジュールを使用して、前記3D解剖学的画像の内部の1つまたは複数の補助組織ボリュームを識別するステップであって、それぞれの補助組織ボリュームが、前記第2のモジュールによって識別された基底組織ボリュームに対応する、ステップと、
前記プロセッサによって、それぞれの補助組織ボリュームを、前記第2のモジュールによって識別された前記対応する基底組織ボリュームと合併させるステップとをさらに含む、項目5から9のいずれか一項に記載の方法。
(項目11)
前記プロセッサによって、前記対象の内部の基準組織領域に対応する、前記3D解剖学的画像の内部の基準ボリュームを識別するステップと、
ステップ(e)において、前記3D機能的画像と、前記3D解剖学的画像の内部で識別された前記基準ボリュームとを使用して、前記1つまたは複数の摂取メトリックのうち少なくとも1つを判定するステップとを含む、先行する項目のいずれか一項に記載の方法。
(項目12)
前記3D機能的画像および前記基準ボリュームを使用して判定された前記1つまたは複数の摂取メトリックのうち少なくとも1つが、腫瘍の背景に対する比(TBR)の値を含み、前記TBR値を判定するステップが、
前記3D解剖学的画像の前記初期のVOIの内部で識別された前記前立腺ボリュームに対応する前記3D機能的画像の1つまたは複数のボクセルの強度値を使用して、標的強度値を判定するステップと、
前記3D解剖学的画像の内部で識別された前記基準ボリュームに対応する前記3D機能的画像の1つまたは複数のボクセルの強度値を使用して、背景強度値を判定するステップと、
前記標的強度値の前記背景強度値に対する比を前記TBR値として判定するステップとを含む、項目11に記載の方法。
(項目13)
前記TBR値の、1つまたは複数の閾値との比較に基づいて、前記対象の前立腺がんの状態を判定するステップを含む、項目12に記載の方法。
(項目14)
前記1つまたは複数の閾値が複数の基準TBR値を使用して判定される、項目13に記載の方法。
(項目15)
前記1つまたは複数の閾値が受信者動作特性(ROC)曲線を使用して判定される、項目13または14に記載の方法。
(項目16)
前記1つまたは複数の閾値が複数の閾値を含み、前記TBR値を前記複数の閾値と比較することによって、前記前立腺がんの状態が非2値スケール上のレベルとして判定される、項目13から15のいずれか一項に記載の方法。
(項目17)
前記対象の前記前立腺がんの状態を、(i)前記TBR値がカットオフ閾値を超えていたら臨床的に重要であると判定し、または(ii)前記TBR値が前記カットオフ閾値未満であれば臨床的に重要でないと判定する、ステップを含む、項目13に記載の方法。
(項目18)
前記プロセッサによって、前記対象の膀胱に対応する、前記3D解剖学的画像の内部の膀胱ボリュームを識別するステップと、
ステップ(e)において、前記3D解剖学的画像の内部の前記識別された膀胱ボリュームに対応する前記3D機能的画像のボクセルの強度を使用して、前記膀胱からのクロストークを補正するステップとを含む、先行する項目のいずれか一項に記載の方法。
(項目19)
前記膀胱からのクロストークを補正するステップが、
前記識別された膀胱ボリュームの外部にある、前記3D解剖学的画像の1つまたは複数の領域に対応する前記3D機能的画像の1つまたは複数のボクセルの強度に対する、前記対象の前記膀胱の内部の放射性医薬品に由来する強度の寄与をモデル化する、1つまたは複数の膀胱強度ブリード関数を判定するステップであって、前記1つまたは複数の膀胱強度ブリード関数が、前記寄与を、前記識別された膀胱ボリュームからの距離の関数としてモデル化する、ステップと、
前記3D解剖学的画像の内部の前記識別された前立腺ボリュームに対応する前記3D機能的画像の1つまたは複数のボクセルの各々について、前記1つまたは複数の膀胱強度ブリード関数を使用して、前記ボクセルの強度を膀胱クロストークに対して調整するステップとを含む、項目18に記載の方法。
(項目20)
前記プロセッサによって、前記対象の膀胱に対応する前記3D解剖学的画像の内部の膀胱ボリュームを識別するステップと、
前記プロセッサによって、前記識別された膀胱ボリュームに対して形態学的拡張操作を適用することにより、拡張された膀胱ボリュームを判定するステップと、
ステップ(e)において、前記3D機能的画像のボクセルの強度値を使用して、前記1つまたは複数の摂取メトリックを、(i)前記3D解剖学的画像の前記VOIの内部で識別された前記前立腺ボリュームに対応するが、(ii)前記拡張された膀胱ボリュームの内部の前記3D解剖学的画像の領域には対応しないと判定するステップとを含む、先行する項目のいずれか一項に記載の方法。
(項目21)
前記3D機能的画像が前記対象に前記放射性医薬品を投与した後の前記対象の核医学画像である、先行する項目のいずれか一項に記載の方法。
(項目22)
前記放射性医薬品がPSMA結合剤を含む、項目21に記載の方法。
(項目23)
前記核医学画像が、前記対象に前記放射性医薬品を投与した後に得られた、前記対象の単一光子放射型コンピュータ断層撮影法(SPECT)スキャンである、項目21に記載の方法。
(項目24)
前記放射性医薬品が
99m
Tc-MIP-1404を含む、項目21に記載の方法。
(項目25)
前記1つまたは複数の摂取メトリックの少なくとも一部分に基づいて前記対象の1つまたは複数の診断値または予後値を判定するステップを含む、先行する項目のいずれか一項に記載の方法。
(項目26)
前記1つまたは複数の診断値または予後値のうち少なくとも1つを判定するステップが、摂取メトリックを1つまたは複数の閾値と比較するステップを含む、項目25に記載の方法。
(項目27)
前記1つまたは複数の診断値または予後値のうち少なくとも1つが、前記対象の臨床的に重要な前立腺がんに関するリスクを推定する、項目25または26に記載の方法。
(項目28)
(f)前記3D解剖学的画像および/または前記3D機能的画像の視覚表示を前記ユーザに提示するために、前記プロセッサによって、対話型グラフィカルユーザインターフェース(GUI)を表示するステップと、
(g)前記プロセッサによって、前記GUIの内部に、前記3D解剖学的画像および/または前記3D機能的画像を、いずれかが表示用に選択されて個別にレンダリングされ得るように、あるいは両方が表示用に選択されて、3D解剖学的画像に3D機能的画像を重ね合わせることによって一緒にレンダリングされ得るように、選択可能かつスーパーインポーズ可能な層としてグラフィカルレンダリングをもたらすステップとを含む、先行する項目のいずれか一項に記載の方法。
(項目29)
ステップ(g)が、前記3D解剖学的画像の内部の1つまたは複数の識別された特定の組織ボリュームを含む選択可能かつスーパーインポーズ可能なセグメント化層のグラフィカルレンダリングをもたらすステップを含み、前記表示用のセグメント化層の選択に際して、前記1つまたは複数の特定の組織ボリュームを表すグラフィックスが、前記3D解剖学的画像および/または前記3D機能的画像に重ね合わされる、項目28に記載の方法。
(項目30)
前記1つまたは複数の特定の組織ボリュームが前記識別された前立腺ボリュームを含む、項目29に記載の方法。
(項目31)
ステップ(g)において、2D断面図の位置が前記ユーザによって調整され得るように、対話型2Dビューアの内部に、前記3D解剖学的画像および/または前記3D機能的画像の前記2D断面図をレンダリングするステップを含む、項目28から30のいずれか一項に記載の方法。
(項目32)
ステップ(g)において、前記3D解剖学的画像および/または前記3D機能的画像の対話型3Dビューをレンダリングするステップを含む、項目28から31のいずれか一項に記載の方法。
(項目33)
前記GUIの内部に、前記識別された前立腺ボリュームのボクセルに対応するロケーションを指示するグラフィカル要素を表示することにより、前記方法のユーザ再検討および/または品質制御を容易にするステップを含む、項目28から32のいずれか一項に記載の方法。
(項目34)
前記GUIの内部に、前記1つまたは複数の摂取メトリックの再検討および/または更新のための品質制御および報告のワークフローによって前記ユーザを導くための品質制御グラフィカルウィジェットとともに、ステップ(e)において判定された前記1つまたは複数の摂取メトリックを表すテキストおよび/またはグラフィックスを表示するステップを含む、項目28から33のいずれか一項に記載の方法。
(項目35)
前記品質制御グラフィカルウィジェットを介して、前記1つまたは複数の摂取メトリックの自動判定の承認に対応するユーザ入力を受け取るステップと、
前記1つまたは複数の摂取メトリックの前記自動判定の前記承認に対応する前記ユーザ入力の前記受取りに応答して、前記プロセッサによって、前記対象向けに、前記1つまたは複数の自動判定された摂取メトリックの表現を含む報告を生成するステップとを含む、項目34に記載の方法。
(項目36)
前記品質制御グラフィカルウィジェットを介して、前記1つまたは複数の摂取メトリックの自動判定の不承認に対応するユーザ入力を受け取るステップと、
前記1つまたは複数の摂取メトリックの前記自動判定の前記不承認に対応するユーザ入力の受取りに応答して、前記プロセッサによって、前記1つまたは複数の摂取メトリックの更新された値を判定するのに使用する前記3D機能的画像の1つまたは複数のボクセルのユーザ選択のためのボクセル選択グラフィカル要素を表示するステップと、
前記ボクセル選択グラフィカル要素を介して、前記1つまたは複数の摂取メトリックの更新された値を判定するのに使用する前記3D機能的画像の1つまたは複数のボクセルの前記ユーザ選択を受け取るステップと、
前記プロセッサによって、前記ユーザ選択のボクセルを使用して、前記1つまたは複数の摂取メトリックの値を更新するステップと、
前記プロセッサによって、前記対象向けに、前記1つまたは複数の更新された摂取メトリックの表現を含む報告を生成するステップとを含む、項目34に記載の方法。
(項目37)
前記品質制御グラフィカルウィジェットを介して、前記1つまたは複数の摂取メトリックの自動判定の不承認に対応するユーザ入力を受け取るステップと、
前記品質制御グラフィカルウィジェットを介して、品質制御の不合格に対応するユーザ入力を受け取るステップと、
前記プロセッサによって、前記品質制御の不合格の識別を含む、前記対象向けの報告を生成するステップとを含む、項目34に記載の方法。
(項目38)
前記3D機能的画像のボクセルが、既知の関係によって前記3D解剖学的画像のボクセルに関連づけられている、先行する項目のいずれか一項に記載の方法。
(項目39)
複数の3D解剖学的画像の各々についてステップ(a)および(c)を遂行して、それぞれが前記複数の3D解剖学的画像のうち1つの内部にある複数の初期のVOIを判定するステップであって、前記初期のVOIのサイズの変動性が、前記3D解剖学的画像のサイズの変動性よりも小さい、ステップを含む、先行する項目のいずれか一項に記載の方法。
(項目40)
前記第1のモジュールが、第1の解像度を有する、前記3D解剖学的画像のダウンサンプリングされたバージョンを入力として受け取って、これに対して動作するCNNモジュールであり、前記第2のモジュールが、前記初期のVOIへとクロップされた、前記3D解剖学的画像の、前記第1の解像度よりも高い第2の解像度を有する高解像度バージョンを入力として受け取って、これに対して動作するCNNモジュールである、先行する項目のいずれか一項に記載の方法。
(項目41)
前記第1のモジュールが、前記3D解剖学的画像の少なくとも一部分を入力として受け取り、前記第1のモジュールに対する入力によって表される物理ボリュームが、(i)前記初期のVOIによって表される物理ボリュームよりも少なくとも2倍大きく、かつ/または(ii)少なくとも1つの次元に沿って、前記初期のVOIによって表される前記物理ボリュームよりも2倍大きい、先行する項目のいずれか一項に記載の方法。
(項目42)
前記第1のモジュールが、3D解剖学的画像の内部の骨盤領域のグラフィカル表現を識別するように訓練されたCNNモジュールであり、前記第2のモジュールが、3D解剖学的画像の内部の前立腺組織のグラフィカル表現を識別するように訓練されたCNNモジュールである、先行する項目のいずれか一項に記載の方法。
(項目43)
3D画像を自動的に処理して、対象の内部の標的組織領域に対応する、3D画像の内部の3Dボリュームを識別し、そこにおける放射性医薬品の摂取を表す1つまたは複数の摂取メトリックを判定するための方法であって、
(a)解剖学的撮像を使用して得られた前記対象の3D解剖学的画像をコンピューティングデバイスのプロセッサによって受け取るステップであって、前記3D解剖学的画像が、前記対象の前記標的組織領域を含む特定の解剖学的領域の内部の組織のグラフィカル表現を含む、ステップと、
(b)機能的撮像診断法を使用して得られた前記対象の3D機能的画像を前記プロセッサによって受け取るステップであって、前記3D機能的画像に含まれる複数のボクセルが、それぞれ、前記対象の内部の特定の物理ボリュームを表し、また、前記特定の物理ボリュームから放射されて検知された放射線を表す強度値を有し、前記3D機能的画像の前記複数のボクセルの少なくとも一部分が、前記対象の前記特定の解剖学的領域の内部の物理ボリュームを表す、ステップと、
(c)前記プロセッサによって、第1のモジュールを使用して、前記3D解剖学的画像の内部の初期の目的ボリューム(VOI)を判定するステップであって、前記初期のVOIが、前記標的組織領域を含む前記特定の解剖学的領域に対応する、ステップと、
(d)前記プロセッサによって、第2のモジュールを使用して、前記対象の前記標的組織領域に対応する前記初期のVOIの内部の標的ボリュームを識別するステップと、
(e)前記プロセッサによって、前記3D機能的画像と、前記3D解剖学的画像の前記VOIの内部で識別された前記標的ボリュームとを使用して、前記1つまたは複数の摂取メトリックを判定するステップとを含む方法。
(項目44)
膀胱への放射性医薬品摂取からのクロストークに対して前立腺ボクセル強度を補正するために3D機能的画像を自動的に解析する方法であって、
(a)解剖学的撮像診断法を使用して得られた前記対象の3D解剖学的画像をコンピューティングデバイスのプロセッサによって受け取るステップであって、前記3D解剖学的画像が含む対象の内部の組織のグラフィカル表現の少なくとも一部分が前記対象の膀胱および前立腺に対応する、ステップと、
(b)前記プロセッサによって前記対象の前記3D機能的画像を受け取るステップであって、前記3D機能的画像に含まれる複数のボクセルが、それぞれ、前記対象の内部の特定の物理ボリュームを表し、また、前記特定の物理ボリュームから放射されて検知された放射線を表す強度値を有し、前記3D機能的画像の前記複数のボクセルの少なくとも一部分が、前記対象の前記膀胱および/または前立腺の内部の物理ボリュームを表す、ステップと、
(c)前記プロセッサによって、前記3D解剖学的画像の内部で、(i)前記対象の前立腺に対応する前立腺ボリューム、および(ii)前記対象の膀胱に対応する膀胱ボリュームを自動的に識別するステップと、
(d)前記プロセッサによって、前記3D機能的画像の内部で、(i)前記識別された前立腺ボリュームに対応する複数の前立腺ボクセル、および(ii)前記識別された膀胱ボリュームに対応する複数の膀胱ボクセルを自動的に識別するステップと、
(e)前記プロセッサによって、前記膀胱ボクセルの1つまたは複数の測定された強度に基づいて、前記前立腺ボクセルの1つまたは複数の測定された強度を調整するステップと、
(f)前記プロセッサによって、前記前立腺ボクセルの前記調整された強度を使用して、前記対象の前記前立腺の内部の放射性医薬品の摂取を表す1つまたは複数の摂取メトリックを判定するステップとを含む方法。
(項目45)
対象の一部分の3D機能的画像の自動解析に基づいて、前記対象の前立腺がんの状態を検知し、かつ/または前立腺がんのリスクを定量化する方法であって、
(a)前記対象にPSMA結合剤を含む放射性医薬品を投与した後に3D機能的画像を取得するステップと、
(b)コンピューティングデバイスのプロセッサによって、前記3D機能的画像の内部の、前記対象の前立腺に対応する3D標的ボリュームを識別するステップと、
(c)前記プロセッサによって、前記3D標的ボリュームのボクセルの強度を使用して、標的の背景に対する比(TBR)の値を判定するステップと、
(d)前記プロセッサによって、対話型グラフィカルユーザインターフェース(GUI)の内部に表示するように、前記判定されたTBR値を表すテキストおよび/またはグラフィックスのグラフィカルレンダリングをもたらすステップとを含む方法。
(項目46)
3D画像を自動的に処理して、対象の前立腺に対応する、3D画像の内部の3Dボリュームを識別し、そこにおける放射性医薬品の摂取を表す1つまたは複数の摂取メトリックを判定するためのシステムであって、
プロセッサと、
命令を記憶したメモリとを備えるシステムにおいて、前記プロセッサが、前記命令を実行することにより、
(a)解剖学的撮像診断法を使用して得られた前記対象の3D解剖学的画像を受け取るステップであって、前記3D解剖学的画像が含む対象の内部の組織のグラフィカル表現の少なくとも一部分が前記対象の骨盤領域に対応する、ステップと、
(b)機能的撮像診断法を使用して得られた前記対象の3D機能的画像を受け取るステップであって、前記3D機能的画像に含まれる複数のボクセルが、それぞれ、前記対象の内部の特定の物理ボリュームを表し、また、前記特定の物理ボリュームから放射されて検知された放射線を表す強度値を有し、前記3D機能的画像の前記複数のボクセルの少なくとも一部分が、前記対象の前記骨盤領域の内部の物理ボリュームを表す、ステップと、
(c)第1のモジュールを使用して、前記3D解剖学的画像の内部の初期の目的ボリューム(VOI)を判定するステップであって、前記初期のVOIが、前記対象の前記骨盤領域の内部の組織に対応し、前記対象の前記骨盤領域の外部の組織は除外する、ステップと、
(d)第2のモジュールを使用して、前記対象の前記前立腺に対応する前記初期のVOIの内部の前立腺ボリュームを識別するステップと、
(e)前記3D機能的画像と、前記3D解剖学的画像の前記初期のVOIの内部で識別された前記前立腺ボリュームとを使用して、前記1つまたは複数の摂取メトリックを判定するステップとを行う、システム。
(項目47)
3D画像を自動的に処理して、対象の内部の標的組織領域に対応する、3D画像の内部の3Dボリュームを識別し、そこにおける放射性医薬品の摂取を表す1つまたは複数の摂取メトリックを判定するためのシステムであって、
プロセッサと、
命令を記憶したメモリとを備えるシステムにおいて、前記プロセッサが、前記命令を実行することにより、
(a)解剖学的撮像診断法を使用して得られた前記対象の3D解剖学的画像を受け取るステップであって、前記3D解剖学的画像が、前記対象の前記標的組織領域を含む特定の解剖学的領域の内部の組織のグラフィカル表現を含む、ステップと、
(b)機能的撮像診断法を使用して得られた前記対象の3D機能的画像を受け取るステップであって、前記3D機能的画像に含まれる複数のボクセルが、それぞれ、前記対象の内部の特定の物理ボリュームを表し、また、前記特定の物理ボリュームから放射されて検知された放射線を表す強度値を有し、前記3D機能的画像の前記複数のボクセルの少なくとも一部分が、前記特定の解剖学的領域の内部の物理ボリュームを表す、ステップと、
(c)第1のモジュールを使用して、前記3D解剖学的画像の内部の初期の目的ボリューム(VOI)を判定するステップであって、前記初期のVOIが、前記標的組織領域を含む前記特定の解剖学的領域に対応する、ステップと、
(d)第2のモジュールを使用して、前記対象の前記標的組織領域に対応する前記初期のVOIの内部の標的ボリュームを識別するステップと、
(e)前記3D機能的画像と、前記3D解剖学的画像の前記VOIの内部で識別された前記標的ボリュームとを使用して、前記1つまたは複数の摂取メトリックを判定するステップとを行う、システム。
(項目48)
対象の一部分の3D機能的画像の自動解析に基づいて、前記対象の前立腺がんの状態を検知し、かつ/または前立腺がんのリスクを定量化するためのシステムであって、
プロセッサと、
命令を記憶したメモリとを備えるシステムにおいて、前記プロセッサが、前記命令を実行することにより、
(a)PSMA結合剤を含む放射性医薬品を前記対象に投与した後に、前記対象の前記一部分の前記3D機能的画像を受け取るステップと、
(b)前記3D機能的画像の内部の、前記対象の前立腺に対応する3D標的ボリュームを識別するステップと、
(c)前記3D標的ボリュームのボクセルの強度を使用して、標的の背景に対する比(TBR)の値を判定するステップと、
(d)対話型グラフィカルユーザインターフェース(GUI)の内部に表示するように、前記判定されたTBR値を表すテキストおよび/またはグラフィックスのグラフィカルレンダリングをもたらすステップとを行う、システム。
(項目49)
項目46から48のいずれか一項に記載のシステムを備えるコンピュータ支援検知(CADe)デバイス。
(項目50)
項目46から48のいずれか一項に記載のシステムを備えるコンピュータ支援診断(CADx)デバイス。
(項目51)
前記プロセッサが、前記命令によって、前記対象の臨床的に重要な前立腺がんまたは臨床的に重要でない前立腺がんのいずれかの分類を識別する、項目49に記載のCADeデバイス。
(項目52)
前記プロセッサが、前記命令によって、前記対象の臨床的に重要な前立腺がんまたは臨床的に重要でない前立腺がんのいずれかの分類を識別する、項目50に記載のCADxデバイス。
(項目53)
(a)放射性標識PSMA結合剤と、
(b)項目46から48のいずれか一項に記載のシステムを備えるコンピュータ支援検知(CADe)デバイスとを含む組合せ製品。
(項目54)
コンピュータ支援検知デバイスを用いる放射性標識PSMA結合剤の使用を規定する標識を含む、項目53に記載の組合せ製品。
(項目55)
3D画像を自動的に処理して、標的組織領域に対応する前記3D画像の内部の3Dボリュームを識別するための方法であって、
(a)解剖学的撮像診断法を使用して得られた対象の3D解剖学的画像をコンピューティングデバイスのプロセッサによって受け取るステップであって、前記3D解剖学的画像が前記対象の内部の組織のグラフィカル表現を含む、ステップと、
(b)前記プロセッサによって、第1のモジュールを使用して、前記3D解剖学的画像の内部の初期の目的ボリューム(VOI)を判定するステップであって、前記初期のVOIが、前記標的領域を含む特定の解剖学的領域に対応する、ステップと、
(c)前記プロセッサによって、第2のモジュールを使用して、前記対象の前記標的組織領域に対応する前記初期のVOIの内部の標的ボリュームを識別するステップと、
(d)前記識別された標的ボリュームに対応する3Dセグメント化マスクを、表示しかつ/またはさらに処理するために、前記プロセッサによって、記憶しかつ/または供給するステップとを含む方法。
(項目56)
前記第1のモジュールが、前記3D解剖学的画像を入力として受け取って、前記3D解剖学的画像の内部の長方形ボリュームの向い合ったコーナーを表す複数の座標値を出力する、項目5に記載の方法。
(項目57)
前記第1のモジュールが畳み込みニューラルネットワーク(CNN)モジュールである、項目55または56に記載の方法。
(項目58)
ステップ(c)が、前記第2のモジュールを使用して、前記3D解剖学的画像の内部の、それぞれが前記対象の内部の特定の組織領域に対応する1つまたは複数のその他の組織ボリュームを識別するステップを含む、項目55から57のいずれか一項に記載の方法。
(項目59)
ステップ(c)が、前記第2のモジュールを使用して、前記初期のVOIの内部の各ボクセルを、前記対象の内部の(所定の)異なる組織領域のセットのうち特定の組織領域に対応するものとして分類するステップを含む、項目55から58のいずれか一項に記載の方法。
(項目60)
前記初期のVOIの内部の各ボクセルを分類するステップが、
前記第2のモジュールによって、前記初期のVOIの内部の複数のボクセルの各々について、尤度値のセットを判定するステップであって、前記尤度値のセットが、前記組織領域セットのうち1つまたは複数の組織領域の各々について、前記ボクセルが前記組織領域の内部の物理ボリュームを表すことの尤度を表す対応する尤度値を含む、ステップと、
前記初期のVOIの内部の前記複数のボクセルの各々について、前記ボクセルについて判定された尤度値のセットに基づいて、前記ボクセルを前記特定の組織領域に対応するものとして分類するステップとを含む、項目59に記載の方法。
(項目61)
前記第2のモジュールが、前記初期のVOIを入力として受け取って、前記初期のVOIの内部の各ボクセルについて、
(i)前記ボクセルを分類する値と、
(ii)前記ボクセルに関する尤度値のセットと、
(iii)前記ボクセルを、異なる組織領域の所定のセットのうちいかなるものにも対応しないものとして識別する値とのうち少なくとも1つを含む複数の値を出力する、項目59または60に記載の方法。
(項目62)
ステップ(c)が、前記第2のモジュールを使用して1つまたは複数の基底組織ボリュームのセットを識別するステップを含み、前記1つまたは複数の基底組織ボリュームが、前記識別された標的ボリュームおよび前記1つまたは複数のその他の組織のボリュームを含み、
前記プロセッサによって、1つまたは複数の補助モジュールを使用して、前記3D解剖学的画像の内部の1つまたは複数の補助組織ボリュームを識別するステップであって、それぞれの補助組織ボリュームが、前記第2のモジュールによって識別された基底組織ボリュームに対応する、ステップと、
前記プロセッサによって、それぞれの補助組織ボリュームを、前記第2のモジュールによって識別された前記対応する基底組織ボリュームと合併させるステップとをさらに含む、項目55から61のいずれか一項に記載の方法。
(項目63)
(e)前記3D解剖学的画像の視覚表示を前記ユーザに提示するために、前記プロセッサによって、対話型グラフィカルユーザインターフェース(GUI)を表示するステップと、
(f)前記プロセッサによって、前記GUIの内部に、前記3D解剖学的画像の内部の1つまたは複数の識別された特定の組織ボリュームを含む選択可能かつスーパーインポーズ可能なセグメント化層とともに前記3D解剖学的画像のグラフィカルレンダリングをもたらすステップであって、前記表示用のセグメント化層の選択に際して、前記1つまたは複数の特定の組織ボリュームを表すグラフィックスが前記3D解剖学的画像上に重ね合わされる、ステップとを含む、項目55から62のいずれか一項に記載の方法。
(項目64)
前記1つまたは複数の特定の組織ボリュームが前記識別された標的ボリュームを含む、項目63に記載の方法。
(項目65)
ステップ(f)において、2D断面図の位置が前記ユーザによって調整され得るように、対話型2Dビューアの内部に、前記3D解剖学的画像の前記2D断面図をレンダリングするステップを含む、項目63または64に記載の方法。
(項目66)
ステップ(f)において、前記3D解剖学的画像の対話型3Dビューをレンダリングするステップを含む、項目63から65のいずれか一項に記載の方法。
(項目67)
複数の3D解剖学的画像の各々についてステップ(a)および(b)を遂行して、それぞれが前記複数の3D解剖学的画像のうち1つの内部にある複数の初期のVOIを判定するステップであって、前記初期のVOIのサイズの変動性が前記3D解剖学的画像のサイズの変動性よりも小さい、ステップを含む、項目55から66のいずれか一項に記載の方法。
(項目68)
前記第1のモジュールが、第1の解像度を有する、前記3D解剖学的画像のダウンサンプリングされたバージョンを入力として受け取って、これに対して動作するCNNモジュールであり、前記第2のモジュールが、前記初期のVOIへとクロップされた、前記3D解剖学的画像の、前記第1の解像度よりも高い第2の解像度を有する高解像度バージョンを入力として受け取って、これに対して動作するCNNモジュールである、先行する項目55から67のいずれか一項に記載の方法。
(項目69)
前記第1のモジュールが、前記3D解剖学的画像の少なくとも一部分を入力として受け取り、前記第1のモジュールに対する前記入力によって表される物理ボリュームが、(i)前記初期のVOIによって表される物理ボリュームよりも少なくとも2倍大きく、かつ/または(ii)少なくとも1つの次元に沿って、前記初期のVOIによって表される前記物理ボリュームよりも2倍大きい、項目55から68のいずれか一項に記載の方法。
(項目70)
前記第1のモジュールが、3D解剖学的画像の内部の特定の解剖学的領域のグラフィカル表現を識別するように訓練されたCNNモジュールであり、前記第2のモジュールが、3D解剖学的画像の内部の前記標的組織領域のグラフィカル表現を識別するように訓練されたCNNモジュールである、項目55から69のいずれか一項に記載の方法。
(項目71)
機能的撮像診断法を使用して得られた前記対象の3D機能的画像を前記プロセッサによって受け取るステップであって、前記3D機能的画像に含まれる複数のボクセルが、それぞれ、前記対象の内部の特定の物理ボリュームを表し、また、前記特定の物理ボリュームから放射されて検知された放射線を表す強度値を有し、前記3D機能的画像の前記複数のボクセルの少なくとも一部分が、前記特定の解剖学的領域の内部の物理ボリュームを表す、ステップと、
前記3D機能的画像の内部で、前記3Dセグメント化マスクを使用して識別された前記標的ボリュームに対応する3Dボリュームを識別するステップとをさらに含む、項目55から70のいずれか一項に記載の方法。
(項目72)
前記3D機能的画像のボクセルが、既知の関係によって前記3D解剖学的画像のボクセルに関連づけられている、項目71に記載の方法。
(項目73)
3D画像を自動的に処理して、標的組織領域に対応する前記3D画像の内部の3Dボリュームを識別するためのシステムであって、
コンピューティングデバイスのプロセッサと、
命令を記憶したメモリとを備えるシステムにおいて、前記プロセッサが、前記命令を実行することにより、
(a)解剖学的撮像診断法を使用して得られた前記対象の3D解剖学的画像を受け取るステップであって、前記3D解剖学的画像が前記対象の内部の組織のグラフィカル表現を含む、ステップと、
(b)第1のモジュールを使用して、前記3D解剖学的画像の内部の初期の目的ボリューム(VOI)を判定するステップであって、前記初期のVOIが、前記標的領域を含む特定の解剖学的領域に対応する、ステップと、
(c)第2のモジュールを使用して、前記対象の前記標的組織領域に対応する前記初期のVOIの内部の標的ボリュームを識別するステップと、
(d)前記識別された標的ボリュームに対応する3Dセグメント化マスクを、表示しかつ/またはさらに処理するために、記憶しかつ/または供給するステップとを行う、システム。
Features of embodiments described with respect to one aspect of the invention may be applied with respect to another aspect of the invention.
The present invention provides, for example, the following items.
(Item 1)
A method for automatically processing a 3D image to identify a 3D volume within the 3D image corresponding to a prostate of a subject and to determine one or more uptake metrics representative of uptake of a radiopharmaceutical therein. And,
(a) receiving, by a processor of a computing device, a 3D anatomical image of the object obtained using an anatomical imaging diagnostic method, the 3D anatomical image including internal tissue of the object; at least a portion of the graphical representation corresponds to a pelvic region of the subject;
(b) receiving by the processor a 3D functional image of the object obtained using a functional imaging diagnostic method, wherein a plurality of voxels included in the 3D functional image are each of the object; at least a portion of the plurality of voxels of the 3D functional image are representative of a particular physical volume within the object and have intensity values representative of detected radiation emitted from the particular physical volume; a step representing a physical volume inside the pelvic region;
(c) determining, by the processor, using a first module, an initial volume of interest (VOI) within the 3D anatomical image, wherein the initial VOI corresponding to tissue internal to the pelvic region and excluding tissue external to the pelvic region of the subject;
(d) identifying, by the processor, using a second module, a prostate volume within the initial VOI corresponding to the prostate of the subject;
(e) determining, by the processor, the one or more uptake metrics using the 3D functional image and the prostate volume identified within the initial VOI of the 3D anatomical image; and the steps of doing so.
(Item 2)
The method of item 1, wherein the first module receives as input the 3D anatomical image and outputs a plurality of coordinate values representing opposing corners of a rectangular volume within the 3D anatomical image. .
(Item 3)
Item 1 or 2, wherein step (c) comprises using the first module to determine a 3D pelvic bone mask that identifies a volume of the 3D anatomical image that corresponds to the pelvic bone of interest. The method described in.
(Item 4)
A method according to any of the preceding items, wherein the first module is a convolutional neural network (CNN) module.
(Item 5)
step (d) using the second module to create one or more other tissue volumes within the 3D anatomical image, each corresponding to a particular tissue region within the object; identifying the one or more other tissue volumes;
the target pelvic bone;
the subject's bladder;
said subject's rectum, and
The method of any one of the preceding items, corresponding to one or more specific tissue regions selected from the group consisting of the subject's gluteal muscles.
(Item 6)
step (d) using said second module to correspond each voxel inside said initial VOI to a particular tissue region among a set of (predetermined) different tissue regions inside said object; A method according to any one of the preceding items, comprising the step of classifying as an object.
(Item 7)
classifying each voxel within the initial VOI,
determining, by the second module, a set of likelihood values for each of a plurality of voxels within the initial VOI, the set of likelihood values being one of the tissue region sets; or comprising, for each of a plurality of tissue regions, a corresponding likelihood value representing the likelihood that the voxel represents a physical volume within the tissue region;
for each of the plurality of voxels within the initial VOI, classifying the voxel as corresponding to the particular tissue region based on the set of likelihood values determined for the voxel. , the method described in item 6.
(Item 8)
the second module receives the initial VOI as input and for each voxel within the initial VOI;
(i) a value for classifying the voxel;
(ii) a set of likelihood values for said voxel;
(iii) outputting a plurality of values including at least one of a value identifying the voxel as not corresponding to any of a predetermined set of different tissue regions; .
(Item 9)
said (predetermined) set of different tissue regions,
the prostate of the subject;
the target pelvic bone;
the subject's bladder;
the rectum of the subject;
9. The method of any one of items 6-8, comprising one or more tissue regions selected from the group consisting of the subject's gluteal muscles.
(Item 10)
step (d) includes identifying a set of one or more ground tissue volumes using the second module, the one or more ground tissue volumes being the identified prostate volume and the one or more other tissue volumes, the method comprising:
identifying, by the processor, one or more auxiliary tissue volumes within the 3D anatomical image using one or more auxiliary modules, each auxiliary tissue volume a step corresponding to the ground tissue volume identified by the module of 2;
10. The method of any one of items 5-9, further comprising merging, by the processor, each auxiliary tissue volume with the corresponding underlying tissue volume identified by the second module.
(Item 11)
identifying, by the processor, a reference volume within the 3D anatomical image that corresponds to a reference tissue region within the object;
in step (e), determining at least one of the one or more intake metrics using the 3D functional image and the reference volume identified within the 3D anatomical image; A method according to any one of the preceding items, comprising the steps of:
(Item 12)
at least one of the one or more uptake metrics determined using the 3D functional image and the reference volume includes a tumor-to-background ratio (TBR) value, and determining the TBR value. but,
determining a target intensity value using intensity values of one or more voxels of the 3D functional image corresponding to the prostate volume identified within the initial VOI of the 3D anatomical image; and,
determining a background intensity value using intensity values of one or more voxels of the 3D functional image that correspond to the reference volume identified within the 3D anatomical image;
and determining a ratio of the target intensity value to the background intensity value as the TBR value.
(Item 13)
13. The method of item 12, comprising determining prostate cancer status of the subject based on a comparison of the TBR value with one or more threshold values.
(Item 14)
14. The method of item 13, wherein the one or more threshold values are determined using a plurality of reference TBR values.
(Item 15)
15. The method of item 13 or 14, wherein the one or more threshold values are determined using a receiver operating characteristic (ROC) curve.
(Item 16)
From item 13, wherein the one or more thresholds include a plurality of thresholds, and by comparing the TBR value with the plurality of thresholds, the prostate cancer status is determined as a level on a non-binary scale. 16. The method according to any one of 15.
(Item 17)
The prostate cancer status of the subject is determined to be clinically significant if (i) the TBR value is above the cutoff threshold, or (ii) the TBR value is below the cutoff threshold. The method according to item 13, comprising the step of determining that the method is clinically insignificant.
(Item 18)
identifying, by the processor, a bladder volume within the 3D anatomical image that corresponds to the subject's bladder;
in step (e), using the intensities of voxels in the 3D functional image that correspond to the identified bladder volume within the 3D anatomical image to correct for crosstalk from the bladder; A method according to any one of the preceding items, including.
(Item 19)
the step of correcting crosstalk from the bladder,
inside the bladder of the subject relative to the intensity of one or more voxels of the 3D functional image corresponding to one or more regions of the 3D anatomical image that are outside the identified bladder volume; determining one or more bladder strength bleed functions that model the intensity contribution from the identified radiopharmaceutical, the one or more bladder strength bleed functions modeling the contribution from the identified radiopharmaceutical; model the step as a function of distance from the bladder volume;
using the one or more bladder intensity bleed functions for each one or more voxels of the 3D functional image that correspond to the identified prostate volume within the 3D anatomical image; and adjusting voxel intensities for bladder crosstalk.
(Item 20)
identifying, by the processor, a bladder volume within the 3D anatomical image that corresponds to the subject's bladder;
determining, by the processor, a dilated bladder volume by applying a morphological dilation operation to the identified bladder volume;
In step (e), intensity values of voxels of the 3D functional image are used to determine the one or more uptake metrics (i) of the identified within the VOI of the 3D anatomical image; and (ii) determining that the 3D anatomical image corresponds to a prostate volume but does not correspond to a region of the 3D anatomical image inside the expanded bladder volume. Method.
(Item 21)
12. The method of any one of the preceding items, wherein the 3D functional image is a nuclear medicine image of the subject after administration of the radiopharmaceutical to the subject.
(Item 22)
22. The method of item 21, wherein the radiopharmaceutical comprises a PSMA binding agent.
(Item 23)
22. The method of item 21, wherein the nuclear medicine image is a single photon emission computed tomography (SPECT) scan of the subject obtained after administering the radiopharmaceutical to the subject.
(Item 24)
22. The method of item 21, wherein the radiopharmaceutical comprises 99m Tc-MIP-1404.
(Item 25)
12. The method of any one of the preceding items, comprising determining one or more diagnostic or prognostic values for the subject based at least in part on the one or more intake metrics.
(Item 26)
26. The method of item 25, wherein determining at least one of the one or more diagnostic or prognostic values comprises comparing an intake metric to one or more threshold values.
(Item 27)
27. The method of item 25 or 26, wherein at least one of the one or more diagnostic or prognostic values estimates the subject's risk for clinically significant prostate cancer.
(Item 28)
(f) displaying an interactive graphical user interface (GUI) by the processor to present a visual representation of the 3D anatomical image and/or the 3D functional image to the user;
(g) Displaying, by said processor, said 3D anatomical image and/or said 3D functional image within said GUI such that either one can be selected for display and individually rendered, or both; and providing the graphical rendering as selectable and superimposable layers such that the 3D functional image may be selected for use and rendered together by superimposing the 3D functional image on the 3D anatomical image. The method described in any one of the items.
(Item 29)
step (g) comprises providing a graphical rendering of a selectable and superimposable segmentation layer containing one or more identified specific tissue volumes within the 3D anatomical image; 29. Upon selection of a segmentation layer for display, graphics representative of the one or more specific tissue volumes are superimposed on the 3D anatomical image and/or the 3D functional image. Method.
(Item 30)
30. The method of item 29, wherein the one or more specific tissue volumes include the identified prostate volume.
(Item 31)
In step (g), rendering the 2D cross-section view of the 3D anatomical image and/or the 3D functional image within an interactive 2D viewer, such that the position of the 2D cross-section view can be adjusted by the user. 31. The method of any one of items 28-30, comprising the step of:
(Item 32)
32. A method according to any one of items 28 to 31, comprising, in step (g), rendering an interactive 3D view of the 3D anatomical image and/or the 3D functional image.
(Item 33)
Item 28, comprising facilitating user review and/or quality control of the method by displaying within the GUI a graphical element indicating locations corresponding to voxels of the identified prostate volume. 33. The method according to any one of 32 to 32.
(Item 34)
within said GUI with a quality control graphical widget for guiding said user through a quality control and reporting workflow for reviewing and/or updating said one or more intake metrics determined in step (e); 34. A method according to any one of items 28 to 33, comprising displaying text and/or graphics representing said one or more intake metrics.
(Item 35)
receiving, via the quality control graphical widget, user input corresponding to approval of automatic determination of the one or more intake metrics;
the one or more automatically determined intake metrics for the subject by the processor in response to the receipt of the user input corresponding to the acceptance of the automatic determination of the one or more intake metrics; and generating a report containing a representation of.
(Item 36)
receiving user input corresponding to a disapproval of the automatic determination of the one or more intake metrics via the quality control graphical widget;
used by the processor to determine updated values for the one or more intake metrics in response to receipt of user input corresponding to the disapproval of the automatic determination of the one or more intake metrics; displaying a voxel selection graphical element for user selection of one or more voxels of the 3D functional image;
receiving, via the voxel selection graphical element, the user selection of one or more voxels of the 3D functional image for use in determining updated values of the one or more uptake metrics;
updating, by the processor, the value of the one or more intake metrics using the user-selected voxels;
and generating, by the processor, a report for the subject that includes a representation of the one or more updated intake metrics.
(Item 37)
receiving user input corresponding to a disapproval of the automatic determination of the one or more intake metrics via the quality control graphical widget;
receiving user input corresponding to a quality control failure via the quality control graphical widget;
and generating, by the processor, a report for the subject that includes an identification of the quality control failure.
(Item 38)
A method according to any of the preceding items, wherein voxels of the 3D functional image are related to voxels of the 3D anatomical image by a known relationship.
(Item 39)
performing steps (a) and (c) for each of a plurality of 3D anatomical images to determine a plurality of initial VOIs, each within one of said plurality of 3D anatomical images; The method of any one of the preceding items, wherein the initial VOI size variability is less than the 3D anatomical image size variability.
(Item 40)
the first module is a CNN module that receives as input and operates on a downsampled version of the 3D anatomical image having a first resolution; a CNN module that receives as input and operates on a high resolution version of the 3D anatomical image cropped to the initial VOI, having a second resolution higher than the first resolution; A method as described in any one of the preceding items.
(Item 41)
The first module receives as input at least a portion of the 3D anatomical image, and the physical volume represented by the input to the first module is (i) smaller than the physical volume represented by the initial VOI; and/or (ii) along at least one dimension is at least twice as large as the physical volume represented by the initial VOI.
(Item 42)
The first module is a CNN module trained to identify a graphical representation of a pelvic region within a 3D anatomical image, and the second module is a CNN module trained to identify a graphical representation of a pelvic region within a 3D anatomical image; A method according to any one of the preceding items, wherein the CNN module is trained to identify a graphical representation of a CNN module.
(Item 43)
The 3D image is automatically processed to identify a 3D volume within the 3D image that corresponds to a target tissue region within the subject and to determine one or more uptake metrics representing uptake of the radiopharmaceutical therein. A method for
(a) receiving by a processor of a computing device a 3D anatomical image of the object obtained using anatomical imaging, wherein the 3D anatomical image is the target tissue region of the object; a graphical representation of tissue within a particular anatomical region;
(b) receiving by the processor a 3D functional image of the object obtained using a functional imaging diagnostic method, wherein a plurality of voxels included in the 3D functional image are each of the object; at least a portion of the plurality of voxels of the 3D functional image are representative of a particular physical volume within the object and have intensity values representative of detected radiation emitted from the particular physical volume; representing a physical volume within the particular anatomical region;
(c) determining, by the processor, using a first module, an initial volume of interest (VOI) within the 3D anatomical image, wherein the initial VOI is the target tissue region; corresponding to the specific anatomical region comprising;
(d) identifying, by the processor, using a second module, a target volume within the initial VOI that corresponds to the target tissue region of the subject;
(e) determining, by the processor, the one or more uptake metrics using the 3D functional image and the target volume identified within the VOI of the 3D anatomical image; and a method including.
(Item 44)
A method for automatically analyzing 3D functional images to correct prostate voxel intensities for crosstalk from radiopharmaceutical ingestion into the bladder, the method comprising:
(a) receiving, by a processor of a computing device, a 3D anatomical image of the object obtained using an anatomical imaging diagnostic method, the 3D anatomical image including internal tissue of the object; at least a portion of the graphical representation corresponds to the bladder and prostate of the subject;
(b) receiving by the processor the 3D functional image of the object, each voxel included in the 3D functional image representing a particular physical volume within the object; at least a portion of the plurality of voxels of the 3D functional image have intensity values representative of detected radiation emitted from the specific physical volume, and at least a portion of the plurality of voxels of the 3D functional image are located within the physical volume of the bladder and/or prostate of the subject. a step representing
(c) automatically identifying, by the processor, within the 3D anatomical image: (i) a prostate volume corresponding to the subject's prostate; and (ii) a bladder volume corresponding to the subject's bladder; and,
(d) by said processor, within said 3D functional image: (i) a plurality of prostate voxels corresponding to said identified prostate volume; and (ii) a plurality of bladder voxels corresponding to said identified bladder volume; a step of automatically identifying the
(e) adjusting, by the processor, one or more measured intensities of the prostate voxels based on the one or more measured intensities of the bladder voxels;
(f) determining, by the processor, one or more uptake metrics representative of uptake of a radiopharmaceutical within the prostate of the subject using the adjusted intensities of the prostate voxels. .
(Item 45)
A method for detecting prostate cancer status and/or quantifying prostate cancer risk in a subject based on automated analysis of 3D functional images of a portion of the subject, the method comprising:
(a) acquiring a 3D functional image after administering to the subject a radiopharmaceutical comprising a PSMA binding agent;
(b) identifying, by a processor of a computing device, a 3D target volume within the 3D functional image that corresponds to the subject's prostate;
(c) determining, by the processor, a target-to-background ratio (TBR) value using the intensities of voxels of the 3D target volume;
(d) providing, by the processor, a graphical rendering of text and/or graphics representative of the determined TBR value for display within an interactive graphical user interface (GUI).
(Item 46)
A system for automatically processing a 3D image to identify a 3D volume within the 3D image that corresponds to a prostate of interest and to determine one or more uptake metrics representative of uptake of a radiopharmaceutical therein. There it is,
a processor;
In a system comprising a memory storing instructions, the processor executes the instructions, thereby
(a) receiving a 3D anatomical image of the object obtained using an anatomical imaging diagnostic method, the 3D anatomical image including at least a portion of a graphical representation of tissue within the object; corresponds to the pelvic region of the target;
(b) receiving a 3D functional image of the object obtained using a functional imaging diagnostic method, wherein a plurality of voxels included in the 3D functional image each identify an interior of the object; and has an intensity value representative of detected radiation emitted from said particular physical volume, wherein at least a portion of said plurality of voxels of said 3D functional image is located in said pelvic region of said subject. a step representing the internal physical volume of
(c) using a first module to determine an initial volume of interest (VOI) within the 3D anatomical image, wherein the initial VOI is within the pelvic region of the subject; , excluding tissue outside the pelvic region of the subject;
(d) using a second module to identify a prostate volume within the initial VOI that corresponds to the prostate of the subject;
(e) determining the one or more uptake metrics using the 3D functional image and the prostate volume identified within the initial VOI of the 3D anatomical image. Do, system.
(Item 47)
The 3D image is automatically processed to identify a 3D volume within the 3D image that corresponds to a target tissue region within the subject and to determine one or more uptake metrics representing uptake of the radiopharmaceutical therein. A system for
a processor;
In a system comprising a memory storing instructions, the processor executes the instructions, thereby
(a) receiving a 3D anatomical image of the object obtained using an anatomical imaging diagnostic method, wherein the 3D anatomical image includes a particular target tissue region of the object; including a graphical representation of tissue within the anatomical region;
(b) receiving a 3D functional image of the object obtained using a functional imaging diagnostic method, wherein a plurality of voxels included in the 3D functional image each identify an interior of the object; and has an intensity value representative of detected radiation emitted from said particular physical volume, and at least a portion of said plurality of voxels of said 3D functional image is associated with said particular anatomical volume. a step representing a physical volume inside the region;
(c) using a first module to determine an initial volume of interest (VOI) within the 3D anatomical image, the initial VOI containing the target tissue region; a step corresponding to an anatomical region of
(d) using a second module to identify a target volume within the initial VOI that corresponds to the target tissue region of the subject;
(e) determining the one or more uptake metrics using the 3D functional image and the target volume identified within the VOI of the 3D anatomical image; system.
(Item 48)
A system for detecting prostate cancer status and/or quantifying prostate cancer risk in a subject based on automated analysis of 3D functional images of a portion of the subject, the system comprising:
a processor;
In a system comprising a memory storing instructions, the processor executes the instructions, thereby
(a) receiving the 3D functional image of the portion of the subject after administering to the subject a radiopharmaceutical comprising a PSMA binding agent;
(b) identifying a 3D target volume within the 3D functional image that corresponds to the subject's prostate;
(c) using the intensities of voxels of the 3D target volume to determine a target-to-background ratio (TBR) value;
(d) providing a graphical rendering of text and/or graphics representing the determined TBR value for display within an interactive graphical user interface (GUI).
(Item 49)
A computer-aided detection (CADe) device comprising a system according to any one of items 46 to 48.
(Item 50)
A computer-aided diagnostics (CADx) device comprising a system according to any one of items 46 to 48.
(Item 51)
50. The CADe device of item 49, wherein the processor identifies, by the instructions, a classification of either clinically significant prostate cancer or clinically insignificant prostate cancer of the subject.
(Item 52)
51. The CADx device of
(Item 53)
(a) a radiolabeled PSMA binder;
(b) a computer-aided detection (CADe) device comprising a system according to any one of items 46 to 48.
(Item 54)
54. A combination product according to item 53, comprising a label providing for the use of a radiolabeled PSMA binder using a computer-assisted detection device.
(Item 55)
A method for automatically processing a 3D image to identify a 3D volume within the 3D image corresponding to a target tissue region, the method comprising:
(a) receiving by a processor of a computing device a 3D anatomical image of the object obtained using an anatomical imaging diagnostic method, wherein the 3D anatomical image is of internal tissue of the object; steps, including a graphical representation;
(b) determining, by the processor, using a first module, an initial volume of interest (VOI) within the 3D anatomical image, the initial VOI defining the target region; a step corresponding to a specific anatomical region including;
(c) identifying, by the processor, using a second module, a target volume within the initial VOI that corresponds to the target tissue region of the subject;
(d) storing and/or providing, by the processor, a 3D segmentation mask corresponding to the identified target volume for display and/or further processing.
(Item 56)
Item 5, wherein the first module receives as input the 3D anatomical image and outputs a plurality of coordinate values representing opposing corners of an internal rectangular volume of the 3D anatomical image. Method.
(Item 57)
57. A method according to
(Item 58)
step (c) using the second module to create one or more other tissue volumes within the 3D anatomical image, each corresponding to a particular tissue region within the object; 58. The method of any one of items 55-57, comprising the step of identifying.
(Item 59)
step (c) using said second module to correspond each voxel within said initial VOI to a particular tissue region among a set of (predetermined) different tissue regions within said object; 59. The method according to any one of
(Item 60)
classifying each voxel within the initial VOI,
determining, by the second module, a set of likelihood values for each of a plurality of voxels within the initial VOI, the set of likelihood values being one of the tissue region sets; or comprising, for each of a plurality of tissue regions, a corresponding likelihood value representing the likelihood that the voxel represents a physical volume within the tissue region;
for each of the plurality of voxels within the initial VOI, classifying the voxel as corresponding to the particular tissue region based on a set of likelihood values determined for the voxel; The method described in item 59.
(Item 61)
the second module receives the initial VOI as input and for each voxel within the initial VOI;
(i) a value for classifying the voxel;
(ii) a set of likelihood values for said voxel;
and (iii) outputting a plurality of values including at least one of a value identifying the voxel as not corresponding to any of a predetermined set of different tissue regions. .
(Item 62)
step (c) includes identifying a set of one or more ground tissue volumes using the second module, the one or more ground tissue volumes being the identified target volume and the set of one or more ground tissue volumes; said one or more other tissue volumes;
identifying, by the processor, one or more auxiliary tissue volumes within the 3D anatomical image using one or more auxiliary modules, each auxiliary tissue volume a step corresponding to the ground tissue volume identified by the module of 2;
62. The method of any one of items 55-61, further comprising merging, by the processor, each auxiliary tissue volume with the corresponding underlying tissue volume identified by the second module.
(Item 63)
(e) displaying an interactive graphical user interface (GUI) by the processor to present a visual representation of the 3D anatomical image to the user;
(f) by the processor, the 3D image with a selectable and superimposable segmentation layer within the GUI that includes one or more identified specific tissue volumes within the 3D anatomical image; providing a graphical rendering of an anatomical image, wherein upon selection of said segmentation layer for display, graphics representative of said one or more specific tissue volumes are superimposed on said 3D anatomical image; 63. The method of any one of items 55-62, comprising the steps of:
(Item 64)
64. The method of item 63, wherein the one or more specific tissue volumes include the identified target volume.
(Item 65)
Item 63 or 63 or 70, comprising, in step (f), rendering the 2D cross-section view of the 3D anatomical image within an interactive 2D viewer such that the position of the 2D cross-section view can be adjusted by the user. 64.
(Item 66)
66. The method of any one of items 63-65, comprising, in step (f), rendering an interactive 3D view of the 3D anatomical image.
(Item 67)
performing steps (a) and (b) for each of a plurality of 3D anatomical images to determine a plurality of initial VOIs, each within one of said plurality of 3D anatomical images; 67. The method of any one of items 55-66, wherein the initial VOI size variability is less than the 3D anatomical image size variability.
(Item 68)
the first module is a CNN module that receives as input and operates on a downsampled version of the 3D anatomical image having a first resolution; a CNN module that receives as input and operates on a high resolution version of the 3D anatomical image cropped to the initial VOI, having a second resolution higher than the first resolution; 68. The method of any one of the preceding items 55-67.
(Item 69)
the first module receives as input at least a portion of the 3D anatomical image, and the physical volume represented by the input to the first module is: (i) the physical volume represented by the initial VOI; and/or (ii) at least twice as large as the physical volume represented by the initial VOI along at least one dimension. Method.
(Item 70)
The first module is a CNN module trained to identify a graphical representation of a particular anatomical region within a 3D anatomical image, and the second module is a CNN module trained to identify a graphical representation of a particular anatomical region within a 3D anatomical image. 70. The method of any one of items 55-69, wherein the method is a CNN module trained to identify a graphical representation of the target tissue region within.
(Item 71)
receiving, by the processor, a 3D functional image of the object obtained using a functional imaging diagnostic method, wherein a plurality of voxels included in the 3D functional image each represent a specific area within the object; and has an intensity value representative of detected radiation emitted from said particular physical volume, and at least a portion of said plurality of voxels of said 3D functional image is associated with said particular anatomical volume. a step representing a physical volume inside the region;
and identifying a 3D volume within the 3D functional image that corresponds to the target volume identified using the 3D segmentation mask. Method.
(Item 72)
72. The method of item 71, wherein voxels of the 3D functional image are related to voxels of the 3D anatomical image by a known relationship.
(Item 73)
A system for automatically processing a 3D image to identify a 3D volume within the 3D image corresponding to a target tissue region, the system comprising:
a processor of a computing device;
In a system comprising a memory storing instructions, the processor executes the instructions, thereby
(a) receiving a 3D anatomical image of the object obtained using an anatomical imaging diagnostic method, the 3D anatomical image including a graphical representation of tissue within the object; step and
(b) using a first module to determine an initial volume of interest (VOI) within the 3D anatomical image, wherein the initial VOI is a specific anatomical volume containing the target region; Steps corresponding to academic areas;
(c) using a second module to identify a target volume within the initial VOI that corresponds to the target tissue region of the subject;
(d) storing and/or providing a 3D segmentation mask corresponding to the identified target volume for display and/or further processing.
この特許または出願のファイルは少なくとも1つのカラー図面を含有している。この特許または特許出願の公刊資料のカラー図面を伴うコピーは、請求して必要な料金を支払えば、官庁によって提供されるはずである。 The patent or application file contains at least one drawing in color. Copies of this patent or patent application publication with color drawings will be provided by the Office upon request and payment of the necessary fee.
本開示の、前述の目的、態様、特徴、および利点、ならびに他の目的、態様、特徴、および利点は、添付の図面とともに以下の説明を参照することによって、より明らかになり、よりよく理解されるであろう。 The foregoing objects, aspects, features, and advantages of the present disclosure, as well as other objects, aspects, features, and advantages, will become more apparent and better understood by reference to the following description in conjunction with the accompanying drawings. There will be.
本開示の特徴および利点は、以下で説明される詳細な説明から図面とともに理解されたとき、より明らかになるはずであり、図面の全体にわたって、類似の参照文字は対応する要素を識別するものである。図面では、類似の参考番号は、一般に、同一の要素、機能的に類似の要素、および/または構造的に類似の要素を指示する。 The features and advantages of the present disclosure will become more apparent when taken from the detailed description set forth below in conjunction with the drawings, throughout which like reference characters identify corresponding elements. be. In the drawings, like reference numbers generally indicate identical, functionally similar, and/or structurally similar elements.
特許請求された発明のシステム、アーキテクチャ、デバイス、方法、およびプロセスは、本明細書で説明した実施形態からの情報を使用して開発された変形形態および改造を包含することが企図されている。この説明によって企図されるように、本明細書で説明されたシステム、アーキテクチャ、デバイス、方法、およびプロセスの改造および/または修正が遂行され得る。 The systems, architectures, devices, methods, and processes of the claimed invention are intended to encompass variations and modifications developed using the information from the embodiments described herein. Adaptations and/or modifications of the systems, architectures, devices, methods, and processes described herein may be effected as contemplated by this description.
説明の全体にわたって、用品、デバイス、システム、およびアーキテクチャが、特定の構成要素を有するか、含むか、もしくは備えると説明される場合、またはプロセスおよび方法が、特定のステップを有するか、含むか、もしくは備えると説明される場合、加えて、列挙された構成要素からなる、もしくは本質的になる、本発明の用品、デバイス、システムおよびアーキテクチャがあること、ならびに列挙された処理ステップからなる、もしくは本質的になる、本発明によるプロセスおよび方法があることが企図されている。 Throughout the description, when articles, devices, systems, and architectures are described as having, including, or comprising certain components, or when processes and methods have, include, or include certain steps, When described as comprising or comprising, in addition, there is an article, device, system, and architecture of the invention consisting of or consisting essentially of the recited components and consisting of or consisting of the recited processing steps. It is contemplated that there will be processes and methods according to the present invention that will be of interest.
ステップまたはある特定のアクションを遂行するための順番は、本発明が動作可能である限り重要ではないことを理解されたい。その上に、2つまたはそれよりも多くのステップまたはアクションが同時に行われてよい。 It is to be understood that the order of performing steps or certain actions is not important so long as the invention is operable. Additionally, two or more steps or actions may be performed simultaneously.
本明細書の、たとえば背景技術の節における何らかの出版物の言及は、その出版物が、本明細書で提示された請求項のうちいずれかに対する従来技術として働くことを承認するものではない。背景技術の節は明瞭さのために提示されたものであり、いずれかの請求項に対する従来技術の説明を意味するものではない。 Mention of any publication herein, eg, in the Background section, is not an admission that the publication serves as prior art to any of the claims presented herein. The background section is presented for clarity and is not meant to be a discussion of the prior art with respect to any claim.
明記されたように、文献が参照によって本明細書に組み込まれている。特定の用語の意味に何らかの相違がある場合には、上記の定義の節において与えられた意味が支配する。 Documents are incorporated herein by reference as indicated. In the event of any discrepancy in the meaning of a particular term, the meaning given in the Definitions section above will control.
閲覧者の便宜のために見出しが設けられているが、見出しの存在および/または配置は、本明細書で説明された主題の範囲を限定するように意図されたものではない。 Although headings are provided for the convenience of the reader, the presence and/or arrangement of headings is not intended to limit the scope of the subject matter described herein.
「放射性核種」は、本明細書で使用されるように、少なくとも1つの要素の放射性同位元素を含む部分を指す。例示の適切な放射性核種は、それだけではないが、本明細書で説明されたものを含む。一部の実施形態では、放射性核種は陽電子放射型断層撮影法(PET)において使用される放射性核種である。一部の実施形態では、放射性核種は単一光子放射型コンピュータ断層撮影法(SPECT)において使用される放射性核種である。一部の実施形態では、放射性核種の非限定的なリストは、99mTc、111In、64Cu、67Ga、68Ga、186Re、188Re、153Sm、177Lu、67Cu、123I、124I、125I、126I、131I、11C、13N、15O、18F、153Sm、166Ho、177Lu、149Pm、90Y、213Bi、103Pd、109Pd、159Gd、140La、198Au、199Au、169Yb、175Yb、165Dy、166Dy、105Rh、111Ag、89Zr、225Ac、82Rb、75Br、76Br、77Br、80Br、80mBr、82Br、83Br、211Atおよび192Irを含む。 "Radionuclide," as used herein, refers to a moiety that includes a radioactive isotope of at least one element. Exemplary suitable radionuclides include, but are not limited to, those described herein. In some embodiments, the radionuclide is a radionuclide used in positron emission tomography (PET). In some embodiments, the radionuclide is a radionuclide used in single photon emission computed tomography (SPECT). In some embodiments, a non-limiting list of radionuclides is: 99m Tc, 111 In, 64 Cu, 67 Ga, 68 Ga, 186 Re, 188 Re, 153 Sm, 177 Lu, 67 Cu, 123 I, 124 I, 125 I, 126 I, 131 I, 11 C, 13 N, 15 O, 18 F, 153 Sm, 166 Ho, 177 Lu, 149 Pm, 90 Y, 213 Bi, 103 Pd, 109 Pd, 159 Gd , 140 La , 198 Au, 199 Au, 169 Yb, 175 Yb, 165 Dy, 166 Dy, 105 Rh, 111 Ag, 89 Zr, 225 Ac , 82 Rb , 75 Br, 76 Br, 77 Br, 80 B r, 80m Br, 82 Br, 83 Br, 211 At and 192 Ir.
「放射性医薬品」という用語は、本明細書で使用されるように、放射性核種を含む化合物を指す。ある特定の実施形態では、診断および/または治療のために放射性医薬品が使用される。ある特定の実施形態では、放射性医薬品は、1つまたは複数の放射性核種で標識された小分子、1つまたは複数の放射性核種で標識された抗体、および1つまたは複数の放射性核種で標識された抗体の抗原結合部分を含む。 The term "radiopharmaceutical," as used herein, refers to a compound that includes a radionuclide. In certain embodiments, radiopharmaceuticals are used for diagnosis and/or therapy. In certain embodiments, the radiopharmaceuticals include small molecules labeled with one or more radionuclides, antibodies labeled with one or more radionuclides, and antibodies labeled with one or more radionuclides. Contains the antigen-binding portion of an antibody.
「画像」の参照を伴う「3D」または「3次元」は、本明細書で使用されるように、3次元に関する情報を伝えることを意味する。3D画像は、3次元のデータセットとしてレンダリングされてよく、かつ/または2次元表現のセットもしくは3次元表現として表示されてよい。 "3D" or "three-dimensional" with reference to "image", as used herein, means to convey information regarding three dimensions. A 3D image may be rendered as a three-dimensional data set and/or displayed as a set of two-dimensional representations or a three-dimensional representation.
たとえば対象の3D画像といった「画像」は、本明細書で使用されるように、写真、ビデオフレーム、ストリームビデオなどの任意の視覚表示、ならびに、写真、ビデオフレーム、またはストリームビデオの、任意の電子的類自体、デジタル類自体または数学的類自体を含む。本明細書で説明されたあらゆる装置が、ある特定の実施形態では、プロセッサによって生成された画像または何らかの他の結果を表示するためのディスプレイを含む。本明細書で説明されたあらゆる方法が、ある特定の実施形態では、この方法によって生成された画像または何らかの他の結果を表示するステップを含む。 An "image" as used herein, such as a 3D image of an object, is any visual representation of a photograph, video frame, streamed video, etc., as well as any electronic representation of a photograph, video frame, or streamed video. including the physical class itself, the digital class itself, or the mathematical class itself. Any device described herein, in certain embodiments, includes a display for displaying images or some other results produced by the processor. Any method described herein, in certain embodiments, includes displaying an image or some other result produced by the method.
「対象」は、本明細書で使用されるように、人間または他の哺乳動物(たとえばげっ歯動物(マウス、ラット、ハムスター)、ブタ、猫、犬、馬、霊長類、ウサギ等)を意味する。 "Subject," as used herein, means a human or other mammal, such as a rodent (mouse, rat, hamster), pig, cat, dog, horse, primate, rabbit, etc. do.
薬品を「投与すること」は、本明細書で使用されるように、対象に物質(たとえば造影剤)を導入することを意味する。一般に、たとえば、非経口(たとえば静脈内)、経口、局所的、皮下、腹膜、動脈内、吸入、膣、直腸、鼻、脳脊髄液への導入、または身体区画への点滴注入を含む任意の投与経路が利用され得る。 "Administering" a drug, as used herein, means introducing a substance (eg, a contrast agent) into a subject. Generally, any method including, for example, parenteral (e.g., intravenous), oral, topical, subcutaneous, peritoneal, intraarterial, inhalation, vaginal, rectal, nasal, introduction into the cerebrospinal fluid, or instillation into a body compartment. Any route of administration may be utilized.
「フィルタリング機能」または「フィルタ」におけるような「フィルタ」および「フィルタリング」という用語は、本明細書で使用されるように、本明細書で「サブパッチ」と称される、データ(たとえば画像データ、たとえばCNNの層によって計算される値)の入力配列(たとえば多次元配列)の局所に対して動作して、所与のサブパッチに対して応答値を計算する機能を指す。一般に、配列に対する複数の応答値を計算するために、フィルタは、配列にわたって、スライディングウィンドウのやり方で適用される。詳細には、所与の多次元配列に関して、配列のサブパッチは、特定のサイズ(たとえば配列と同一の次元数を有する)を有する配列の長方形領域であり得る。たとえば、6×3×3の配列については、所与の3×3×3のサブパッチは、6×3×3の配列の中に5つの別個の3×3×3のサブパッチがあるように、配列の隣接した値(たとえば近傍)の所与の3×3×3のセットを指すものである(各パッチが第1の次元に沿って位置を1つシフトされる)。 The terms "filter" and "filtering," as in "filtering function" or "filter," as used herein, refer to data (e.g., image data, Refers to the function of operating locally on an input array (eg, a multidimensional array) to compute a response value for a given subpatch (eg, a value computed by a layer of a CNN). Generally, to compute multiple response values for an array, a filter is applied in a sliding window fashion across the array. In particular, for a given multidimensional array, a subpatch of the array may be a rectangular region of the array having a particular size (eg, having the same number of dimensions as the array). For example, for a 6 x 3 x 3 array, a given 3 x 3 x 3 subpatch is created such that there are 5 separate 3 x 3 x 3 subpatches within the 6 x 3 x 3 array. Refers to a given 3x3x3 set of contiguous values (eg, neighborhoods) of an array (with each patch shifted one position along the first dimension).
たとえば、フィルタリング機能は、サブパッチの値を使用して、配列の所与のサブパッチに対して応答値を計算することができる。フィルタリング機能は、配列の複数のサブパッチの各々について応答値を計算するのに、配列にわたってスライディングウィンドウのやり方で適用され得る。計算された応答値は、応答値と入力配列のサブパッチとの間の位置の対応が維持されるように、出力配列に記憶され得る。 For example, a filtering function can use the subpatch values to calculate a response value for a given subpatch of the array. The filtering function may be applied in a sliding window manner across the array to calculate response values for each of multiple subpatches of the array. The calculated response values may be stored in the output array such that positional correspondence between the response values and subpatches of the input array is maintained.
たとえば、第1のステップにおいて、フィルタは、入力配列のコーナーのサブパッチから始めて、第1の応答値を計算して、出力配列の対応するコーナーに第1の応答値を記憶することができる。ある特定の実施形態では、次いで、第2のステップにおいて、フィルタは、入力配列の特定の次元に沿って位置を1つシフトされ、第2のサブパッチに対する第2の応答値を計算する。第2の応答値は、出力配列の対応する位置、すなわち出力配列の同一の次元に沿って1つシフトされた位置に記憶され得る。サブパッチの位置をシフトし、応答値を計算して、出力配列の対応する位置に応答値を記憶するステップは、全体の入力配列に対して、入力配列の各次元に沿って繰り返され得る。ある特定の実施形態(たとえばストライドされるフィルタリング手法(strided filtering approach))では、フィルタが応答値を計算するサブパッチは所与の次元に沿って1度に1つよりも多くの位置をシフトされ、入力配列のすべての可能性のあるサブパッチについて応答値が計算されるわけではない。 For example, in a first step, the filter may calculate a first response value starting from a corner subpatch of the input array and store the first response value in a corresponding corner of the output array. In certain embodiments, then in a second step, the filter is shifted one position along a particular dimension of the input array and calculates a second response value for the second subpatch. The second response value may be stored in a corresponding position of the output array, ie, a position shifted by one along the same dimension of the output array. The steps of shifting the positions of sub-patches, calculating response values, and storing response values in corresponding positions of the output array may be repeated for the entire input array and along each dimension of the input array. In certain embodiments (e.g., strided filtering approaches), the subpatches for which the filter calculates response values are shifted more than one position at a time along a given dimension; Response values are not calculated for all possible subpatches of the input array.
「畳み込みニューラルネットワーク」(CNN)という用語は、本明細書で使用されるように、少なくとも1つの層が1つまたは複数のフィルタリング機能を遂行するタイプの人工ニューラルネットワークを指す。「畳み込み層」という用語は、本明細書で使用されるように、入力配列を入力として受け取って出力配列を計算するCNNの層を指し、出力配列の値は、入力配列に1つまたは複数のフィルタを適用することによって計算される。詳細には、畳み込み層は、ある特定の実施形態では、n+1の次元を有する入力配列を入力として受け取って、これもn+1の次元を有する出力配列を生成する。CNNのフィルタリング層によって作用される第1のnの次元の入力配列および出力配列は、本明細書では「空間次元」と称される。入力の(n+1)番目の次元は、本明細書では「入力チャネル」の次元と称される。入力チャネルの次元のサイズは、本明細書では「入力チャネルの数」と称される。出力の(n+1)番目次元は、本明細書では「出力チャネル」の次元と称される。入力チャネルの次元のサイズは、本明細書では「出力チャネルの数」と称される。 The term "convolutional neural network" (CNN), as used herein, refers to a type of artificial neural network in which at least one layer performs one or more filtering functions. The term "convolutional layer," as used herein, refers to a layer of a CNN that receives an input array as input and computes an output array, where the values of the output array are Calculated by applying a filter. In particular, the convolutional layer, in one particular embodiment, receives as input an input array having dimensions n+1 and produces an output array also having dimensions n+1. The first n-dimensional input and output arrays acted upon by the filtering layers of the CNN are referred to herein as "spatial dimensions." The (n+1)th dimension of the input is referred to herein as the "input channel" dimension. The size of the input channel dimension is referred to herein as the "number of input channels." The (n+1)th dimension of the output is referred to herein as the "output channel" dimension. The dimensional size of the input channels is referred to herein as the "number of output channels."
ある特定の実施形態では、畳み込み層は、サブパッチに対して動作するフィルタを適用することによって応答値を計算し、サブパッチは、空間次元に沿って入力配列よりも小さいが、全出力チャネルの次元にわたって及ぶ。たとえば、N×M×L×K0のサイズの入力配列は、3つの空間次元およびK0の出力チャネルを有する。畳み込み層のフィルタは、Nf×Mf×Lf×K0のサイズを有するサブパッチに対して動作し得、Nf≦N、Mf≦MおよびLf≦Lである。多くの場合、畳み込み層のフィルタは、Nf<N、Mf<Mおよび/またはLf<Lのサイズを有するサブパッチに対して動作する。たとえば、ある特定の実施形態では、Nf<<N、Mf<<Mおよび/またはLf<<Lである。 In one particular embodiment, the convolutional layer computes the response value by applying a filter that operates on subpatches that are smaller than the input array along the spatial dimension, but across the entire output channel dimension. Extends. For example, an input array of size N×M×L×K 0 has three spatial dimensions and K 0 output channels. The filter of the convolutional layer may operate on subpatches with size N f ×M f ×L f ×K 0 , with N f ≦N, M f ≦M and L f ≦L. Often, filters of convolutional layers operate on subpatches with sizes N f <N, M f < M and/or L f <L. For example, in certain embodiments, N f <<N, M f <<M and/or L f <<L.
したがって、畳み込み層によって適用される1つまたは複数のフィルタの各々について、所与のフィルタによって計算された応答値は、対応する出力チャネルに記憶される。したがって、n+1の次元を有する入力配列を受け取る畳み込み層は、これもn+1の次元を有する出力配列を計算し、(n+1)番目の次元は、畳み込み層によって適用される1つまたは複数のフィルタに対応する出力チャネルを表す。このように、所与の畳み込み層によって計算された出力配列は、後続の畳み込み層によって入力として受け取られ得る。 Thus, for each of the one or more filters applied by the convolutional layer, the response value calculated by a given filter is stored in the corresponding output channel. Thus, a convolutional layer that receives an input array with dimensions n+1 computes an output array that also has dimensions n+1, where the (n+1)th dimension corresponds to one or more filters applied by the convolutional layer. represents the output channel. In this way, the output array computed by a given convolutional layer can be received as input by a subsequent convolutional layer.
畳み込み層のフィルタに関連した「サイズ」という用語は、本明細書で使用されるように、フィルタが作用するサブパッチの、空間の次元に沿ったサイズを指す(たとえば、出力チャネルの次元に沿ったサブパッチのサイズは出力チャネルの定数と解釈される)。本明細書で使用されるように、「畳み込み層のサイズ」のように、畳み込み層に関連した「サイズ」という用語は、畳み込み層のフィルタ(たとえば畳み込み層の同一のサイズを有する各フィルタ)のサイズを指す。ある特定の実施形態では、畳み込み層のフィルタは、機械学習トレーニングプロセスによって判定された複数の変数パラメータを有する。ある特定の実施形態では、所与のフィルタのパラメータ数は、所与のフィルタが動作するサブパッチの中の値の数と等しい。たとえば、K0の出力チャネルを有する入力配列に対して動作するサイズNf×Mf×Lfのフィルタは、Nf×Mf×Lf×K0のパラメータを有する。ある特定の実施形態では、フィルタは配列として実施され、所与のサブパッチに対してフィルタによって判定される応答値は、フィルタと所与のサブパッチとの間の内積として計算される。 The term "size" in the context of a convolutional layer filter, as used herein, refers to the size along the spatial dimension of the subpatch on which the filter acts (e.g., along the output channel dimension The subpatch size is interpreted as a constant for the output channel). As used herein, the term "size" in relation to a convolutional layer, such as "size of a convolutional layer," refers to the size of the filters of the convolutional layer (e.g., each filter having the same size of the convolutional layer). Refers to size. In certain embodiments, the filters of the convolutional layer have multiple variable parameters determined by a machine learning training process. In certain embodiments, the number of parameters for a given filter is equal to the number of values in the subpatch on which the given filter operates. For example, a filter of size N f ×M f ×L f operating on an input array with K 0 output channels has parameters of N f ×M f ×L f ×K 0 . In certain embodiments, the filter is implemented as an array, and the response value determined by the filter for a given subpatch is computed as the dot product between the filter and the given subpatch.
「全層畳み込みニューラルネットワーク」(FCNN)という用語は、本明細書で使用されるように、CNNの各層が畳み込み層であるCNNを指す。 The term "full-layer convolutional neural network" (FCNN), as used herein, refers to a CNN in which each layer of the CNN is a convolutional layer.
「ボリューム」という用語は、本明細書では、CNNの層の入力または出力に関連して使用されるように、CNN層が受け取った入力配列またはCNN層によって計算された出力配列を指す。 The term "volume", as used herein in connection with the input or output of a layer of a CNN, refers to an input sequence received by a CNN layer or an output sequence computed by a CNN layer.
「CNNモジュール」という用語は、本明細書で使用されるように、画像(たとえば2D画像、たとえば3D画像)などの所与の入力に対して1つまたは複数の出力値を判定するために特定のCNNを実施するコンピュータ実施プロセスを指す。たとえば、CNNモジュールは、対象の3D画像(たとえばCT画像、たとえばMRI)を入力として受け取って、画像の各ボクセルについて、そのボクセルが、対象の特定の器官または組織の表現に対応する3D画像の領域の内部に存在する尤度を表す値を判定する。CNNモジュールはソフトウェアおよび/またはハードウェアでよい。たとえば、CNNモジュールは完全にソフトウェアとして実施されてよく、または、CNNモジュールのある特定の機能が、特化されたハードウェア(たとえば特定用途向け集積回路(ASIC))によって実行されてもよい。 The term "CNN module," as used herein, is a computer network module specifically designed to determine one or more output values for a given input, such as an image (e.g., a 2D image, e.g., a 3D image). refers to the computer-implemented process that implements the CNN. For example, the CNN module receives as input a 3D image of an object (e.g., a CT image, e.g., an MRI), and for each voxel of the image, the region of the 3D image that corresponds to a representation of a particular organ or tissue of the object. Determine the value representing the likelihood that exists inside. CNN modules may be software and/or hardware. For example, the CNN module may be implemented entirely as software, or certain functions of the CNN module may be performed by specialized hardware (eg, an application specific integrated circuit (ASIC)).
「組織」という用語は、本明細書で使用されるように、骨(骨組織)ならびに柔組織を指す。 The term "tissue" as used herein refers to bone (bone tissue) as well as soft tissue.
本明細書で説明されたシステムおよび方法は、画像の中に表された特定の器官および/または組織に対応する目的領域を自動的に識別するための、対象の医用画像の自動解析を提供するものである。ある特定の実施形態では、画像を正確にセグメント化するために畳み込みニューラルネットワーク(CNN)モジュールが採用される。ある特定の実施形態では、対象の画像の中の特定の器官および/または組織の正確な自動識別により、判定されるべき特定の器官における放射性医薬品(たとえば放射性標識小分子、たとえば放射性標識抗体、たとえば抗体の放射性標識の抗原結合部分)の摂取を測定する量的メトリックが可能になる。 The systems and methods described herein provide automated analysis of medical images of interest to automatically identify regions of interest corresponding to particular organs and/or tissues represented in the images. It is something. In certain embodiments, a convolutional neural network (CNN) module is employed to accurately segment images. In certain embodiments, accurate automatic identification of specific organs and/or tissues in images of a subject allows the identification of radiopharmaceuticals (e.g., radiolabeled small molecules, e.g., radiolabeled antibodies, e.g. A quantitative metric measuring the uptake of the radiolabeled antigen-binding portion of the antibody) becomes possible.
ある特定の実施形態では、本明細書で説明されたシステムおよび方法により、腫瘍および/または腫瘍転移が存在する可能性がある特定の器官または組織に対応する目的領域の自動識別が容易になる。特定の腫瘍細胞の表面蛋白に対して選択的に結合する、放射性核種で標識された分子は、本明細書で説明された腫瘍の撮像のための手法と組み合わせて利用され得る。たとえば、分子1404は、特に、多くのがん細胞において過剰発現している前立腺特異的膜抗原(PSMA)に結合する。分子1404は、単一光子放射型コンピュータ断層撮影法(SPECT)の撮像において使用するために、99mTcなどの放射性核種で標識され得る。 In certain embodiments, the systems and methods described herein facilitate automatic identification of regions of interest corresponding to particular organs or tissues where tumors and/or tumor metastases may reside. Radionuclide-labeled molecules that selectively bind to specific tumor cell surface proteins can be utilized in conjunction with the techniques for tumor imaging described herein. For example, molecule 1404 specifically binds to prostate-specific membrane antigen (PSMA), which is overexpressed in many cancer cells. Molecule 1404 can be labeled with a radionuclide, such as 99m Tc, for use in single photon emission computed tomography (SPECT) imaging.
ある特定の実施形態では、放射性医薬品の摂取メトリックは、対象の病状および予後の査定に関連する。
A.前立腺ボリュームの識別および摂取メトリックの判定
In certain embodiments, the radiopharmaceutical uptake metric is related to assessing a subject's medical condition and prognosis.
A. Identifying prostate volume and determining uptake metrics
図1に示すプロセス100は、対象の前立腺に対応する3Dボリュームを識別して、そこにおける放射性医薬品の摂取を表す1つまたは複数の摂取メトリックを判定するように3D画像を自動的に処理するためのものである。
The
図1におけるプロセス100のステップ102および104を参照する。図2の様々なパネルは、骨および柔組織を示すCT画像(図2Aおよび図2B)を図示し、骨盤骨(図2Cおよび図2Dにおける緑色202および青色206)および前立腺(図2Cおよび図2Dにおける紫色204)を強調している。強調された領域は、本明細書で説明されたシステムおよび方法によって自動的に生成されており、骨盤骨および前立腺を識別するものである。図2Eは、CT画像上に重ね合わせたSPECT画像(明るいピンクの領域および紫色の領域252、254、および256)を示す。見られるように、CT画像は詳細な解剖学的情報をもたらすが、SPECT画像における解剖学的/構造的情報はより制限されている。したがって、CT画像をセグメント化し、CT画像のボクセルとSPECT画像のボクセルとの間のマッピングを使用して、たとえば前立腺、膀胱、直腸、および殿筋などの組織の目的ボリュームに対応する、SPECT画像の特定のボクセルを識別することが可能である。
See steps 102 and 104 of
図1におけるプロセス100のステップ106および108を参照する。CT画像の内部の前立腺ボリュームを識別する手法は、最初に第1の機械学習モジュール(たとえばCNNモジュール)を使用して、CT画像の内部の初期の目的ボリュームを識別する。これは、前立腺ボリュームの識別を引き受ける第2の機械学習モジュール(たとえば第2のCNNモジュール)に対する標準化された入力を生成する。第2のCNNモジュールは、骨盤骨、殿筋、直腸、および膀胱など他の組織ボリュームも識別し得る。第1の機械学習モジュールと第2の機械学習モジュールは、単一のモジュールおよび/または単一のソフトウェアアプリケーションとして組み合わせて実施されてよい。第1機械学習モジュールと第2の機械学習モジュールは、たとえば個別のソフトウェアアプリケーションとして個別に実施されてもよい。
See steps 106 and 108 of
ある特定の実施形態では、本明細書で説明されたように、第1の機械学習モジュールによって実施されるCNNのアーキテクチャ(たとえば層のタイプおよび機構)と第2の機械学習モジュールによって実施されるCNNのアーキテクチャは同一であるが、様々な層におけるフィルタの数などのパラメータおよび入力サイズは、2つのCNNの間で異なり得る。加えて、2つのCNNは、異なる機能を遂行するように訓練される。詳細には、第1のCNNは、種々の3D解剖学的画像の内部のたとえば骨盤領域といった特定の解剖学的領域のグラフィカル表現を認識するように訓練される。第2のCNNは、より標準化された入力(初期の目的ボリューム)の内部のたとえば前立腺といった特定の標的組織を認識するように訓練される。このようにして2つのCNNを各様に訓練すると、各CNNを構成するフィルタに、異なった加重値およびバイアスが生成され、各CNNが異なる機能を遂行することが可能になる。
i.境界ボックスの生成(局所化機械)
In certain embodiments, the architecture (e.g., layer type and mechanism) of a CNN implemented by a first machine learning module and the CNN implemented by a second machine learning module as described herein. Although the architecture of the CNN is the same, parameters such as the number of filters in various layers and the input size may be different between the two CNNs. Additionally, the two CNNs are trained to perform different functions. In particular, the first CNN is trained to recognize graphical representations of particular anatomical regions, such as the pelvic region, within various 3D anatomical images. The second CNN is trained to recognize a specific target tissue, such as the prostate, within a more standardized input (initial target volume). Training the two CNNs differently in this way creates different weights and biases for the filters that make up each CNN, allowing each CNN to perform different functions.
i. Bounding box generation (localization machine)
図3~図5は様々なCT画像の処理の例を提示するものであり、第1に、初期の目的ボリューム(VOI)の識別を示し(パネルA)、第2に、前立腺および骨盤骨のセグメント化を示す(前立腺ボリュームは青緑色のボリュームによって中央に表されている)。これらの例に示されるように、初期のCT画像のサイズは、使用される撮像システム、放射線技師が辿る撮像プロトコール、および他の要因に実質的に依拠し得るが、初期のVOIサイズはかなり標準的である。 Figures 3-5 present examples of processing various CT images, firstly showing the initial volume of interest (VOI) identification (panel A) and secondly showing the identification of the prostate and pelvic bones. Segmentation is shown (prostate volume is represented in the center by the blue-green volume). As shown in these examples, although the initial CT image size can depend substantially on the imaging system used, the imaging protocol followed by the radiologist, and other factors, the initial VOI size is fairly standard. It is true.
たとえば、初期の3D解剖学的画像のサイズは、700mm×700mm×1870mm(深さ×幅×高さ)(すなわち全身スキャン)またはさらに大きいものから、180mm×240mm×290mm(骨盤骨を対象として含むもの)またはさらに小さいものにまで及び得る。本明細書で説明された例では、初期の3D解剖学的画像のテストされたマトリクスの最小サイズは256×256×76ピクセルである。本明細書で説明された例の境界ボックス(たとえば第1のCNNによって識別されるもの)のサイズの範囲は、おおよそ180~220mm×240~320mm×290~380mmである。本明細書で説明された例示の境界ボックスのマトリクスサイズの範囲は、80~220×150~390×50~300ピクセルである。 For example, initial 3D anatomical image sizes range from 700mm x 700mm x 1870mm (depth x width x height) (i.e. whole body scan) or even larger to 180mm x 240mm x 290mm (including pelvic bones) ) or even smaller. In the example described herein, the minimum size of the initial 3D anatomical image tested matrix is 256x256x76 pixels. The size range of the example bounding boxes (eg, those identified by the first CNN) described herein is approximately 180-220 mm x 240-320 mm x 290-380 mm. The exemplary bounding box matrix sizes described herein range from 80 to 220 x 150 to 390 x 50 to 300 pixels.
この例では、第1のCNNを、骨盤領域の境界ボックスを検知するように訓練するための3D解剖学的画像は以下の画像寸法であった。
訓練画像(3D解剖学的画像):
行数:247~512(sp 1.37)、サイズ(mm):340~700
列数:319~512(sp 1.37)、サイズ(mm):430~700
スライス数:274~624(sp 3.0)、サイズ(mm):820~1870
In this example, the 3D anatomical image for training the first CNN to detect bounding boxes of the pelvic region had the following image dimensions:
Training images (3D anatomical images):
Number of lines: 247-512 (sp 1.37), size (mm): 340-700
Number of rows: 319-512 (sp 1.37), size (mm): 430-700
Number of slices: 274-624 (sp 3.0), size (mm): 820-1870
この例では、境界ボックスの検知に関して第1のCNNを確認するための3D解剖学的画像は以下の画像寸法であり、結果として第1のCNNによって識別される境界ボックスの寸法の範囲を伴う。
確認画像(3D解剖学的画像):
行数:256~512、サイズ(mm):500~600
列数:256~512、サイズ(mm):500~600
スライス数:76~427、サイズ(mm):380~1070
境界ボックス:
行数:82~222、サイズ(mm):180~220
列数:146~386、サイズ(mm):240~320
スライス数:50~295、サイズ(mm):290~380
In this example, the 3D anatomical image for validating the first CNN for bounding box detection has the following image dimensions, resulting in a range of bounding box dimensions identified by the first CNN.
Confirmation image (3D anatomical image):
Number of lines: 256-512, size (mm): 500-600
Number of rows: 256-512, size (mm): 500-600
Number of slices: 76-427, size (mm): 380-1070
Bounding box:
Number of lines: 82-222, size (mm): 180-220
Number of rows: 146-386, size (mm): 240-320
Number of slices: 50-295, size (mm): 290-380
以下は、初期の3D解剖学的画像から、前立腺を詳細に識別するために後続の処理で使用する骨盤領域用の境界ボックス(直方体)を自動的に生成するための3つの例示の手法である。 Below are three example techniques for automatically generating, from an initial 3D anatomical image, a bounding box (cuboid) for the pelvic region to be used in subsequent processing to identify the prostate in detail. .
第1の手法では、第1のCNNは、グレースケールCT画像(1つの入力チャネル)を入力として受け取って、境界ボックスの向かい合ったコーナーの座標を出力する。 In the first approach, the first CNN receives as input a grayscale CT image (one input channel) and outputs the coordinates of opposite corners of the bounding box.
第2の手法では、グレースケールCT画像が閾値適用によって処理され、骨盤領域の大まかな識別を伴う閾値適用された画像を生成する。この第2の手法では、第1のCNNは、グレースケールCT画像と閾値適用された画像との2つの入力チャネルを受け取る。第2のCNNは、境界ボックスの向い合ったコーナーの座標を出力する。 In the second approach, grayscale CT images are processed by thresholding to generate a thresholded image with rough identification of the pelvic region. In this second approach, the first CNN receives two input channels: a grayscale CT image and a thresholded image. The second CNN outputs the coordinates of opposite corners of the bounding box.
第3の手法では、第1のCNNは基本的に第2のCNNの粗いバージョンであり、すなわち、第1のCNNは前立腺、骨盤骨、および仙骨(および背景)を識別する。境界ボックスは、識別された骨盤骨を使用して(たとえば骨盤骨に適合する最も小さいボックスを取り出すか、または恐らくいくらかのバッファ距離を加えることによって)生成される。これの相違は、第1のCNNの出力が単に直方体の頂点の座標ではないことである。この手法では、尤度値は、たとえば、ボクセルがたとえば前立腺、左骨盤骨/右骨盤骨、仙骨、または背景であるかどうかといった、ボクセルが分類される様子に関する尤度を示す画像の各ボクセルについて、自動的に判定される。 In a third approach, the first CNN is essentially a coarse-grained version of the second CNN, ie, the first CNN identifies the prostate, pelvic bone, and sacrum (and background). A bounding box is generated using the identified pelvic bone (eg, by taking the smallest box that fits the pelvic bone, or perhaps adding some buffer distance). The difference here is that the output of the first CNN is not simply the coordinates of the vertices of the rectangular parallelepiped. In this technique, the likelihood value is for each voxel of the image indicating the likelihood of how the voxel is classified, e.g., whether it is prostate, left/right pelvic bone, sacrum, or background. , is automatically determined.
この第3の手法の1つの例示的実施形態では、局所化ネットワークとセグメント化ネットワークはよく似ている。局所化ネットワークは、大いにダウンサンプリングされた画像において左骨盤骨、右骨盤骨、仙骨および背景(全部で4つのクラス)をセグメント化する。境界ボックスは、骨盤骨のこの粗いセグメント化に基づいて生成される。次いで、セグメント化ネットワークは、この境界ボックスの内部の骨盤骨、前立腺および背景を、より高い解像度でセグメント化する。局所化CNNとセグメント化CNNは同一のアーキテクチャを有する。差異は、必要とされる入力形状にあり、局所化ネットワークが画像をサイズ(81、68、96)にサイズ変更し、セグメント化CNNが(局所化ネットワークからの出力としての)骨盤の画像をサイズ(94、138、253)にサイズ変更する。畳み込みフィルタの数も異なる。セグメント化ネットワークには第1の層に20の畳み込みフィルタがあるが、局所化ネットワークには8つしかない。本明細書の流れ図で示されたように、後続の層のフィルタのサイズおよび数がスケーリングされる。この方法は、局所化ネットワークの後に境界ボックスを生成するために、第1のセグメント化のコーナーを見いだし、そのまわりにマージンを伴って正方形を取り出す。局所化ネットワークに対する入力画像は、より低い解像度にダウンサンプリングされているために小さいものであるが、セグメント化は、CT画像のクロップされたバージョンを元の解像度で処理する。 In one exemplary embodiment of this third approach, the localization network and the segmentation network are very similar. The localization network segments the left pelvic bone, right pelvic bone, sacrum, and background (four classes in total) in the heavily downsampled image. A bounding box is generated based on this coarse segmentation of the pelvic bone. The segmentation network then segments the pelvic bone, prostate and background inside this bounding box at higher resolution. Localized CNN and segmented CNN have the same architecture. The difference lies in the required input shape, where the localization network resizes the image to size (81, 68, 96) and the segmentation CNN resizes the image of the pelvis (as output from the localization network). Resize to (94, 138, 253). The number of convolution filters is also different. The segmentation network has 20 convolutional filters in the first layer, while the localization network has only 8. As shown in the flowcharts herein, the size and number of filters in subsequent layers are scaled. This method finds the corners of the first segmentation and takes out a square with a margin around it to generate a bounding box after the localization network. The input image to the localization network is small because it has been downsampled to a lower resolution, but the segmentation processes a cropped version of the CT image at its original resolution.
図6Aは手法1の例を示す。図6Bおよび図6Cは、手法1と手法3との間の比較を示す。 FIG. 6A shows an example of method 1. 6B and 6C show a comparison between method 1 and method 3.
図7A~図7Eは、本明細書で説明された第1のCNNネットワークの例示のアーキテクチャ700を示す。CNNモジュールのアーキテクチャ(局所化ネットワーク)は、対象のCT画像の内部の骨盤領域に対応する目的ボリューム(たとえばVOI)を識別するために使用される(VOIは、前立腺および/または骨盤領域の内部の他の組織のより詳細なセグメント化/識別のために、後に、第2の機械学習モジュール(たとえば第2のCNNモジュール)によって処理される)。
ii.前立腺ボリュームおよびその他の組織ボリュームの判定(単一のセグメント化機械)
7A-7E illustrate an example architecture 700 of the first CNN network described herein. The architecture of the CNN module (localization network) is used to identify a volume of interest (e.g. VOI) that corresponds to the internal pelvic region of the CT image of interest (VOI is the internal pelvic region of the prostate and/or pelvic region later processed by a second machine learning module (e.g. a second CNN module) for more detailed segmentation/identification of other tissues).
ii. Determination of prostate volume and other tissue volumes (single segmentation machine)
図7A~図7Jは、本明細書で説明された第2のCNNネットワークの例示のアーキテクチャ750を示す。前述のように、第2のCNNは、前立腺ボリュームならびにその他の様々な組織ボリュームを識別するようにVOIに対して動作する。その他の組織ボリュームには、左/右の骨盤骨、仙骨、膀胱、殿筋、および直腸が含まれ得る。(たとえばボクセルが前立腺または背景として単純に識別される)2項分類の遂行とは対照的に、複数の組織ボリュームを識別することによって分類手法の精度が改善される。 7A-7J illustrate an example architecture 750 of the second CNN network described herein. As mentioned above, the second CNN operates on the VOI to identify the prostate volume as well as various other tissue volumes. Other tissue volumes may include left/right pelvic bones, sacrum, bladder, gluteal muscles, and rectum. As opposed to performing binary classification (eg, where voxels are simply identified as prostate or background), identifying multiple tissue volumes improves the accuracy of the classification approach.
図8Aは、左骨盤骨(青色の806)、右骨盤骨(黄色の802)および仙骨(赤色の804)を2Dで示し、図8Bは同じものを3Dで示す。 Figure 8A shows the left pelvic bone (blue 806), right pelvic bone (yellow 802) and sacrum (red 804) in 2D, and Figure 8B shows the same in 3D.
図9Aは、左骨盤骨(赤色の902)、右骨盤骨(黄色の906)および前立腺(青色の904)を示す。 Figure 9A shows the left pelvic bone (red 902), right pelvic bone (yellow 906) and prostate (blue 904).
図9Bは、左骨盤骨および右骨盤骨(2つの薄緑色の領域952および956)、前立腺(暗緑色の958)、膀胱(緑がかったベージュの960)、直腸(茶色の962)、および殿筋(青色の964および赤色の966)のセグメント化を示す。
Figure 9B shows the left and right pelvic bones (two light
図10はセグメント化が作動中の低品質CT画像を示す。
iii.セグメント化モジュールのアーキテクチャ
データの入出力
Figure 10 shows a low quality CT image with segmentation in action.
iii. Segmentation module architecture data input/output
図11が示す例示のアーキテクチャ1100では、クライアントに対面するモジュール(Pioneer Web 1102)から画像を処理する(たとえば本明細書で説明されたようなセグメント化を遂行する)ようにとの要求を受け取るセグメント化サービスモジュール1104によって、本明細書で説明されたような画像セグメント化が遂行される。
FIG. 11 depicts an
図11に示された特定の例のアーキテクチャ1100は、本明細書で説明した画像のセグメント化および解析のシステムおよび方法の一実施形態、詳細にはPioneerと称されるクラウドベースのソフトウェアアプリケーションにおいて使用されるものである。Pioneerは、MIP-1404のSPECT画像データ/CT画像データを使用して前立腺における前立腺がんの査定および特性指摘を支援するためのソフトウェアデバイスである。このソフトウェアは、人工知能を使用して、画像データを別個の解剖学的領域へと自動的にセグメント化し、次いで目的の体積領域(ROI)を解析するものである。Pioneerは、臨床的に重要な前立腺がんの存否の判定を支援するために、ROIから量的データを抽出する。
The
図11に示されたアーキテクチャおよびモジュール構成ならびにPioneerに関して本明細書で説明された他のアーキテクチャおよびモジュール構成は、他の撮像診断法および/または他の放射性医薬品とともに使用するように適合され得る。たとえば、SPECT撮像とともに使用するのに適切な種々の放射性医薬品は、本明細書では、以下の節Mにおける「造影剤」で説明されている。対象における放射性医薬品の摂取を撮像するために、様々な3D機能的撮像診断法が、それだけではないがCT撮像などの3D解剖学的撮像診断法と組み合わせて使用されてもよく、本明細書でPioneerに関して説明された手法の適合されたバージョンによって解析され得る。たとえば、放射性医薬品の摂取を撮像するために、PET撮像などの様々な核医学撮像診断法が使用され得る。PET撮像は、PET画像およびCT画像を含む画像セット(CT/PET画像)を得るために、SPECT撮像のように、CT撮像と組み合わせて遂行され得る。したがって、Pioneerに関して本明細書で説明された手法、およびCT画像/SPECT画像は、CT画像/PET画像とともに使用するようにも適合され得る。PET撮像とともに使用するのに適切な様々な放射性医薬品も、以下の節Mの「造影剤」で説明される。 The architecture and modular configuration shown in FIG. 11 and other architectures and modular configurations described herein with respect to Pioneer may be adapted for use with other diagnostic imaging modalities and/or other radiopharmaceuticals. For example, various radiopharmaceuticals suitable for use with SPECT imaging are described herein under "Contrast Agents" in Section M below. Various 3D functional imaging modalities may be used in combination with 3D anatomical imaging modalities, such as, but not limited to, CT imaging, to image the uptake of radiopharmaceuticals in a subject, as described herein. It can be analyzed by an adapted version of the technique described for Pioneer. For example, various nuclear medicine imaging modalities such as PET imaging may be used to image radiopharmaceutical uptake. PET imaging can be performed in combination with CT imaging, like SPECT imaging, to obtain an image set that includes PET and CT images (CT/PET images). Accordingly, the techniques described herein for Pioneer and CT/SPECT images may also be adapted for use with CT/PET images. Various radiopharmaceuticals suitable for use with PET imaging are also described in Section M, "Contrast Media," below.
再び図11に移って、図11に示されるように、Pioneerは、要求を扱うためにSimple Notification Service(SNS)およびSimple Queue Service(SQS)メッセージが利用されるアマゾンウェブサービスを使用するクラウドベースのサービスとして実施される。セグメント化サービス1104は、専用のSQSキューに関する要求をリッスンする。Pioneerウェブ1102において生じたイベントは専用のSNSトピック「Pioneerイベント」1106に公開される。並列非同期処理を可能にするために、SNSメッセージがトピックに送られ、次いで複製されて複数のアマゾンSQSキュー、1108a、1108b(セグメント化サービスはこれらの消費者である)にプッシュされるように、ファンアウトパターンが使用され得る。 Turning again to Figure 11, as shown in Figure 11, Pioneer is a cloud-based service that uses Amazon Web Services where Simple Notification Service (SNS) and Simple Queue Service (SQS) messages are utilized to handle requests. Implemented as a service. Segmentation service 1104 listens for requests on a dedicated SQS queue. Events that occur on the Pioneer web 1102 are published in a dedicated SNS topic “Pioneer Event” 1106. To enable parallel asynchronous processing, SNS messages are sent to a topic and then replicated and pushed to multiple Amazon SQS queues, 1108a, 1108b (of which the segmentation service is a consumer). A fan-out pattern may be used.
セグメント化サービス1104は、要求側(たとえばPioneerウェブ1102)によって提供された、ローカルファイルシステムのデータセットにリンクしている、ソースのユニフォームリソースロケータ(URL)から、入力データ(たとえば画像データ)をダウンロードしてよい。ある特定の実施形態では、入力データは、CT画像および3D機能的画像など、SPECTスキャンなど、事前処理された3D解剖学的画像を含む。3D解剖学的画像および3D機能的画像とともに、画像メタデータも含まれ得る。 Segmentation service 1104 downloads input data (e.g., image data) from a source uniform resource locator (URL) provided by a requester (e.g., Pioneer web 1102) that links to a dataset in a local file system. You may do so. In certain embodiments, the input data includes preprocessed 3D anatomical images, such as SPECT scans, such as CT images and 3D functional images. Along with the 3D anatomical and 3D functional images, image metadata may also be included.
ある特定の実施形態では、CT画像およびSPECT画像は、システムに関して確立された特定の要件を満たす解像度を有する。たとえば、×方向およびy方向における1.0~2.2mmの解像度範囲およびz(スライス)方向における1.0~5.0mmの解像度範囲を有するCT画像が使用され得る。ある特定の実施形態では、全方向において2.9~4.8mmの解像度範囲を有するSPECT画像が使用される。 In certain embodiments, the CT and SPECT images have a resolution that meets certain requirements established for the system. For example, CT images with a resolution range of 1.0 to 2.2 mm in the x and y directions and 1.0 to 5.0 mm in the z (slice) direction may be used. In one particular embodiment, SPECT images with a resolution range of 2.9-4.8 mm in all directions are used.
セグメント化サービス1104は、本明細書で説明されたように、特定のCT画像における前立腺ボリュームおよび任意のその他の組織のボリュームを識別するための画像セグメント化を遂行してから、記憶および/またはさらなる処理(たとえばGUIにおける表示、たとえば摂取メトリックの計算)のために、特定のCT画像の内部の前立腺ボリュームを識別するセグメント化出力データを提供する。ある特定の実施形態では、セグメント化サービス1104に対して発行される要求は、セグメント化出力データの記憶ロケーションを規定するターゲットURLを含む。したがって、セグメント化サービス1104は、要求の中に含まれたターゲットURLにセグメント化出力データをアップロードし得る。 Segmentation service 1104 performs image segmentation to identify prostate volumes and any other tissue volumes in a particular CT image before storing and/or further processing, as described herein. Segmented output data is provided that identifies the prostate volume within a particular CT image for processing (eg, display in a GUI, eg, calculation of uptake metrics). In certain embodiments, requests issued to segmentation service 1104 include a target URL that defines a storage location for segmented output data. Accordingly, segmentation service 1104 may upload segmented output data to the target URL included in the request.
セグメント化出力データが含み得るセグメント化マスクセットなどのデータは、本明細書で説明した第2の機械学習モジュールによって判定されるように、3D解剖学的画像(たとえばCT画像)の各ボクセルを、特定の組織領域または背景に対応するものとして識別する。セグメント化マスクセットは、それぞれの特定の組織領域について、その特定の組織領域に属するものとして分類されたCT画像のボクセルを識別する対応するセグメント化マスクを含んでよく、またはこのマスクを判定するように使用されてよい。たとえば、セグメント化マスクセットは、異なる特定の組織領域または背景を識別する異なる数的な標識で標識されたボクセルとともに、.tiled.pngフォーマットで記憶されてよい。様々な組織領域に対する標識の例示のセットが以下に示され、背景として識別されたボクセルは0で標識される。
{‘prostate’: 1,
‘gluteus_maximus_left’: 2,
‘gluteus_maximus_right’: 3,
‘rectum’: 4,
‘urinary_bladder’: 5,
‘sacrum_and_coccyx’: 6,
‘hip_bone_left’: 7,
‘hip_bone_right’: 8
}
Data, such as a segmentation mask set, that the segmented output data may include segment each voxel of a 3D anatomical image (e.g., a CT image) as determined by the second machine learning module described herein. Identification as corresponding to a specific tissue region or context. The segmentation mask set may include, for each particular tissue region, a corresponding segmentation mask that identifies voxels of the CT image that are classified as belonging to that particular tissue region, or a method for determining this mask. may be used for. For example, a segmentation mask set may have voxels labeled with different numerical markers that identify different specific tissue regions or backgrounds. tiled. It may be stored in png format. An example set of labels for various tissue regions is shown below, with voxels identified as background being labeled with 0.
{'prostate': 1,
'gluteus_maximus_left': 2,
'gluteus_maximus_right': 3,
'rectum': 4,
'urinary_bladder': 5,
'sacrum_and_coccyx': 6,
'hip_bone_left': 7,
'hip_bone_right': 8
}
ある特定の実施形態では、セグメント化マスクセットは、前立腺ボリュームおよび基準ボリューム(たとえば左殿筋)を識別し、すべての他のボクセルを背景として標識する。 In certain embodiments, the segmentation mask set identifies the prostate volume and the reference volume (eg, left gluteus muscle) and marks all other voxels as background.
ある特定の実施形態では、セグメント化出力データにはセグメント化マスクのメタデータも含まれる。セグメント化マスクのメタデータは、各方向におけるボクセルの数(たとえば行数、列数、およびスライス数)およびボクセルの間隔など、処理された特定の画像に関する情報を記憶するために使用され得る。 In certain embodiments, the segmented output data also includes segmentation mask metadata. Segmentation mask metadata may be used to store information about the particular image processed, such as the number of voxels in each direction (eg, number of rows, number of columns, and number of slices) and the spacing of the voxels.
ある特定の実施形態では、セグメント化サービス1104はまた、識別された前立腺ボリュームおよび基準ボリュームなどのセグメント化の結果、および3D機能的画像(たとえばSPECT画像)のボクセルの強度を使用して定量化を遂行する。この定量化は、本明細書では、たとえば以下の「摂取メトリック」という名称のサブセクションにおいてより詳細に論じられる。たとえば、本明細書で説明されたように、セグメント化サービス1104は、対象に関する標的の背景に対する比(TBR)の値を計算するのに使用するために、背景値とともに前立腺の最大強度ボクセルを識別し得る。前立腺の最大強度ボクセルは、識別された前立腺ボリュームに対応する3D機能的画像のボクセルのセットの内部の最大の強度を有するものと識別されたボクセルである。ある特定の実施形態では、本明細書で説明されたように、識別された前立腺ボリュームに対応する3D機能的画像のボクセルは、対象の膀胱からのクロストーク(ブリードとも称される)を補正され、前立腺の最大強度ボクセルは、膀胱のクロストークに対する補正の後に識別される。TBR値を判定するために使用される背景値は、3D解剖学的画像の内部の対象の左殿筋に対応するボリュームなどの基準ボリュームに対応する3D機能的画像の複数のボクセルの強度にわたる平均値である。本明細書で説明されたように、一般的には、識別された基準ボリュームに対応するすべてのボクセルが背景値を計算するために使用される。 In certain embodiments, the segmentation service 1104 also performs quantification using the segmentation results, such as the identified prostate volume and reference volume, and voxel intensities of the 3D functional image (e.g., SPECT image). carry out. This quantification is discussed in more detail herein, for example in the subsection entitled "Intake Metrics" below. For example, as described herein, the segmentation service 1104 identifies maximum intensity voxels of the prostate along with background values for use in calculating a target-to-background ratio (TBR) value for the subject. It is possible. The maximum intensity voxel of the prostate is the voxel identified as having the greatest intensity within the set of voxels of the 3D functional image that corresponds to the identified prostate volume. In certain embodiments, voxels of the 3D functional image corresponding to the identified prostate volume are corrected for crosstalk (also referred to as bleed) from the subject's bladder, as described herein. , the maximal intensity voxel of the prostate is identified after correction for bladder crosstalk. The background value used to determine the TBR value is the average over the intensity of multiple voxels of the 3D functional image corresponding to a reference volume, such as the volume corresponding to the left gluteus muscle of interest inside the 3D anatomical image. It is a value. As described herein, generally all voxels corresponding to the identified reference volume are used to calculate the background value.
セグメント化サービス1104によって遂行された定量化に対応するデータは、セグメント化出力データに含まれ得る。たとえば、定量化の結果は、以下の.jsonフォーマットの例に示されるように、定量化の結果の辞書に含まれ得る。
{
“prostate_max”: 988.0,
“prostate_max_pos”: {
“z”: 92,
“y”: 74,
“x”: 67
},
“background”: 9.056859205776174,
}
Data corresponding to the quantification performed by segmentation service 1104 may be included in the segmentation output data. For example, the quantification results are as follows. json format may be included in the dictionary of quantification results.
{
“prostate_max”: 988.0,
“prostate_max_pos”: {
"z": 92,
"y": 74,
“x”: 67
},
“background”: 9.056859205776174,
}
上記の例における定量化の結果の辞書のキーは以下の通りである。「prostate_max」は前立腺の最大強度ボクセルの強度を記憶する。「prostate_max_pos」はSPECT画像における前立腺の最大強度ボクセルのロケーションを記憶する。「背景」は背景の値を記憶する。
CNNモジュールの構成および相互作用を含む例示のセグメント化サービスアーキテクチャ
The keys of the dictionary of quantification results in the above example are as follows: "prostate_max" stores the intensity of the maximum intensity voxel of the prostate. "prostate_max_pos" stores the location of the maximum intensity voxel of the prostate in the SPECT image. "Background" stores the background value.
Example Segmentation Service Architecture Including CNN Module Configuration and Interaction
図12は、本明細書で説明されたようなCNNベースの画像セグメント化を遂行するためのモジュールの例示のアーキテクチャ1200を示すものである。例示のアーキテクチャ1200は、初期のVOIを識別するための第1の機械学習モジュール(図12では「局所化機械」と称される)1204と、本明細書で説明されたような前立腺ボリューム、その他の組織ボリューム、および基準ボリュームを識別するための第2の機械学習モジュール(図12における「ベースの単一セグメント化機械」の略記で「SingleSegMachine」(base)と称される)1208とを含む。第1および第2の機械学習モジュールの入力および出力も、補助の機械学習モジュール(図12では「補助の単一セグメント化機械」の略記でSingleSegMachine(aux)と称される)1212と、第2の機械学習モジュール(ベースの単一セグメント化機械)の出力と任意の補助の機械学習モジュール(補助の単一セグメント化機械)の出力とを合併させて後処理を遂行するためのモジュール1214とを含むいくつかの追加モジュールとともに示されている。図12に示されるモジュール構成によって生成された出力は、3D解剖学的画像(たとえばCT画像)における様々な組織ボリュームを識別するセグメント化マスクセット1216と、セグメント化メタデータ1218とを含む。 FIG. 12 illustrates an example architecture 1200 of modules for performing CNN-based image segmentation as described herein. The example architecture 1200 includes a first machine learning module (referred to as a "localization machine" in FIG. 12) 1204 for identifying an initial VOI, a prostate volume, etc., as described herein. a tissue volume, and a second machine learning module (referred to as "SingleSegMachine" (base) for shorthand for "base single segmentation machine" in FIG. 12) 1208 for identifying a reference volume. The inputs and outputs of the first and second machine learning modules are also connected to an auxiliary machine learning module (referred to as SingleSegMachine (aux) in FIG. 12 for "auxiliary single segmentation machine") 1212 and a second a module 1214 for merging the output of the machine learning module (the base single segmentation machine) with the output of any auxiliary machine learning module (the auxiliary single segmentation machine) to perform post-processing; Shown with some additional modules included. The output produced by the modular configuration shown in FIG. 12 includes a segmentation mask set 1216 that identifies various tissue volumes in a 3D anatomical image (eg, a CT image) and segmentation metadata 1218.
本明細書で説明されたように、第1の機械学習モジュール1204は、CT画像1202を入力として受け取って、対象の骨盤領域に対応する初期のVOIを識別する境界ボックスを生成する。第2の機械学習モジュール1208は、CT画像1202とともに初期のVOIを入力として受け取る。第2の機械学習モジュール1208は、初期のVOIにクロップマージンを加えて(たとえば、初期の境界ボックスのまわりにマージンを加えて境界ボックスを拡大して)、補助の機械学習モジュールにクロップ終点を供給してよい。本明細書で説明されたように、第2の機械学習モジュール1208は初期のVOIの内部の前立腺ボリュームを識別する。第2の機械学習モジュール1208は、左殿筋、膀胱、ならびに左寛骨および右寛骨など、対象の内部のその他の組織領域に対応するその他の組織のボリュームも識別し得る。対象の左殿筋に対応する組織ボリュームは、本明細書で説明されたように、たとえば、対象に関するTBR値を判定する際に背景値を計算するための基準ボリュームとして使用され得る。対象の膀胱に対応する組織ボリュームは、たとえば本明細書の節Bにおける「膀胱強度のブリードスルーに対する補正」で説明されているように、膀胱のクロストークに対してSPECT画像のボクセルの強度値を補正するために使用され得る。対象の左寛骨および右寛骨に対応する識別された組織ボリュームは後処理のために使用され得る。 As described herein, the first machine learning module 1204 receives the CT image 1202 as input and generates a bounding box that identifies an initial VOI that corresponds to the pelvic region of interest. A second machine learning module 1208 receives the initial VOI along with the CT image 1202 as input. A second machine learning module 1208 adds a crop margin to the initial VOI (e.g., adds a margin around the initial bounding box to enlarge the bounding box) and provides a crop end point to an auxiliary machine learning module. You may do so. As described herein, the second machine learning module 1208 identifies the prostate volume within the initial VOI. The second machine learning module 1208 may also identify other tissue volumes corresponding to other tissue regions within the subject, such as the left gluteus muscle, the bladder, and the left and right hip bones. The tissue volume corresponding to the subject's left gluteus muscle may be used, for example, as a reference volume for calculating a background value in determining a TBR value for the subject, as described herein. The tissue volume corresponding to the bladder of interest adjusts the voxel intensity values of the SPECT image for bladder crosstalk, as described, for example, in "Correction for Bladder Intensity Bleed-Through" in Section B herein. Can be used to correct. The identified tissue volumes corresponding to the left and right hip bones of the subject may be used for post-processing.
ある特定の実施形態では、本明細書で説明されたように、第2の機械学習モジュール1208に加えて、第2の機械学習モジュールと類似のやり方で画像セグメント化を遂行して前立腺ボリュームおよびその他の組織ボリュームを識別する(たとえば図12の1208および1212に示されるような)1つまたは複数の補助の機械学習モジュール1212を使用することによって性能が改善され得る。補助の機械学習モジュールによって識別されたこれらの補助組織ボリュームは、第2の機械学習モジュール1208を使用して識別された基底組織ボリューム(前立腺ボリュームおよび任意のその他の組織のボリューム)と、モジュール1214によって合併されてよい。 In certain embodiments, in addition to the second machine learning module 1208, perform image segmentation in a manner similar to the second machine learning module to determine prostate volume and other Performance may be improved by using one or more auxiliary machine learning modules 1212 (eg, as shown at 1208 and 1212 in FIG. 12) to identify tissue volumes of . These auxiliary tissue volumes identified by the auxiliary machine learning module are combined with the underlying tissue volumes (prostate volume and any other tissue volumes) identified using the second machine learning module 1208 and by the module 1214. May be merged.
ある特定の実施形態では、第1および第2の機械学習モジュールおよび任意の補助の機械学習モジュールが、訓練されたCNNモジュールとして実施される。それぞれの訓練されたCNNモジュールは、モデル構造および重みを有する関連する訓練されたニューラルネットワークを備えるディレクトリとして(たとえばコンピュータコードによって)表され得る。このようにして訓練されたCNNモジュールを表すために、Kerasなどのニューラルネットワークライブラリが使用され得る。特定のCNNモジュールを表す辞書は、画像が特定のCNNモジュールに入力として供給される前に画像に対して遂行される何らかの前処理を記述するメタデータを含み得る。ニューラルネットワークモデルがどのように構築されて訓練されたかを記述するメタデータも含まれ得る。 In certain embodiments, the first and second machine learning modules and any auxiliary machine learning modules are implemented as trained CNN modules. Each trained CNN module may be represented (eg, by computer code) as a directory comprising associated trained neural networks with model structures and weights. A neural network library such as Keras may be used to represent a CNN module trained in this way. A dictionary representing a particular CNN module may include metadata that describes any preprocessing performed on the image before it is provided as input to the particular CNN module. Metadata may also be included that describes how the neural network model was built and trained.
したがって、特定のCNNモジュールは、(1)画像ファイル名および画像メタデータを所与として、画像をロードして前処理するステップ、(2)(たとえば特定のCNNモジュールを表すディレクトリに含まれるものとして)関連する訓練されたニューラルネットワークによって未処理の予測出力(たとえば、CT画像の1つまたは複数のボクセルの各々について、そのボクセルが、訓練されたニューラルネットワークによって判定されるような特定のカテゴリに属する尤度(たとえば確率)を含むマップ)を得るために、前処理された画像を供給するステップ、および(3)未処理の予測出力を後処理するステップなどのステップを遂行してよい。本明細書で説明されたように、第1の機械学習モジュール1204は、その関連する訓練されたニューラルネットワークが生成した未処理の予測出力を後処理して、初期のVOIに対応する境界ボックスのクロップ終点を判定してよい。第2の機械学習モジュール1208は、その関連する訓練されたニューラルネットワークによって生成された未処理の予測出力を後処理して、CT画像のボクセルを標識するセグメント化マスクセットを判定してよく、このセグメント化マスクセットは、第2の機械学習モジュールによって判定されるように、ボクセルが対応する特定の組織ボリュームを指示する値(たとえば数値)またはボクセルを背景として識別する値を伴う。 Thus, a particular CNN module can: (1) load and preprocess an image given the image file name and image metadata; (2) (e.g., as contained in a directory representing the particular CNN module) ) raw prediction output by the associated trained neural network (e.g., for each voxel or voxels in a CT image, that voxel belongs to a particular category as determined by the trained neural network) Steps such as providing a pre-processed image to obtain a map containing likelihoods (eg, probabilities), and (3) post-processing the raw prediction output may be performed. As described herein, the first machine learning module 1204 post-processes the raw prediction output produced by its associated trained neural network to form a bounding box corresponding to the initial VOI. The end point of the crop may be determined. A second machine learning module 1208 may post-process the raw prediction output generated by its associated trained neural network to determine a set of segmentation masks that label voxels of the CT image; The segmentation mask set is accompanied by a value (eg, a numerical value) that indicates a particular tissue volume to which the voxel corresponds or a value that identifies the voxel as background, as determined by the second machine learning module.
図13には、第1の機械学習モジュール(図12の局所化機械)1204のCNNモジュールの実装形態の例示のモデル構造が示されている。図14には、第2の機械学習モジュール(図12の単一セグメント化機械)1208のCNNモジュールの実装形態の例示のモデル構造が示されている。
例示の第1の機械学習モジュール(局所化機械)の実装形態
FIG. 13 shows an example model structure of a CNN module implementation of the first machine learning module (the localization machine of FIG. 12) 1204. FIG. 14 shows an example model structure of a CNN module implementation of the second machine learning module (single segmentation machine of FIG. 12) 1208.
Example implementation of the first machine learning module (localized machine)
本明細書で説明されたように、第1の機械学習モジュールが識別する初期のVOIは、たとえば、前立腺、膀胱、直腸、左殿筋および右殿筋などの組織領域とともに対象の骨盤骨を含む、対象の骨盤領域に対応するCT画像の領域を識別する「境界ボックス」である。第2の機械学習モジュールならびに任意の補助の機械学習モジュールは、境界ボックスの識別(たとえばクロップ終点)を与えられることにより、全体のCT画像に動作して処理しなければならないのとは対照的に、小さい特定のCT画像の標的領域に処理を限定することができる。これによって、計算集約的で精細なセグメント化を遂行するこれらの機械学習モジュールは、処理するべきデータ量が低減されることにより、性能および効率が改善する。 As described herein, the initial VOI that the first machine learning module identifies includes, for example, the pelvic bone of interest along with tissue regions such as the prostate, bladder, rectum, left gluteus muscle, and right gluteus muscle. , a "bounding box" that identifies the region of the CT image that corresponds to the pelvic region of interest. As opposed to the second machine learning module as well as any auxiliary machine learning module having to operate and process the entire CT image by being given bounding box identification (e.g. crop endpoints). , the processing can be limited to a small specific target region of the CT image. This improves the performance and efficiency of these machine learning modules that perform computationally intensive and fine-grained segmentation by reducing the amount of data they must process.
本明細書で説明されたような手法3による第1の機械学習モジュールの例示の実装形態では、図12の局所化機械1204は局所化CNNと称され、その関連する訓練されたニューラルネットワーク(CNN)によって遂行されたCT画像の粗いセグメント化から、境界ボックス(初期のVOIの識別)を抽出する。 In an example implementation of the first machine learning module according to Approach 3 as described herein, the localization machine 1204 of FIG. 12 is referred to as a localization CNN and its associated trained neural network (CNN Extract the bounding box (identification of the initial VOI) from the coarse segmentation of the CT image performed by ).
ある特定の実施形態では、局所化CNNは、CT画像を前処理して、セグメント化に向けて準備する。前処理ステップおよびパラメータを規定するために構成ファイルが使用され得る。前処理は、CT画像をクロップして周囲の空気に対応する1つまたは複数の領域を除去するステップ、CT画像におけるボクセルの強度を正規化するステップ、および(たとえば局所化CNNが予期する固定された入力サイズに準拠するサイズ変更されたCT画像を生成するために)CT画像のサイズを変更するステップなどを含み得る。強度正規化の前処理ステップは、CT画像のすべてのボクセルにわたって強度の特定の平均値および標準偏差を生成するために、CT画像のボクセルの強度を調整する。たとえば、CT画像のボクセル強度は、すべてのボクセルにわたる平均強度が特定の平均値(たとえば0)になってすべてのボクセルにわたる強度の標準偏差が特定の標準偏差値(たとえば1)になるCT画像を生成するために、第1の固定値を差し引いてから第2の固定値で割ることによって正規化され得る。サイズ変更ステップは、CT画像をサンプリングすることによって遂行され得る。 In certain embodiments, a localized CNN preprocesses CT images to prepare them for segmentation. A configuration file may be used to define preprocessing steps and parameters. Preprocessing includes cropping the CT image to remove one or more regions corresponding to the surrounding air, normalizing the intensities of voxels in the CT image, and resizing the CT image (to generate a resized CT image that conforms to the specified input size). The intensity normalization preprocessing step adjusts the intensities of the voxels of the CT image to produce a certain mean value and standard deviation of intensity across all voxels of the CT image. For example, the voxel intensity of a CT image is defined as a CT image in which the average intensity across all voxels has a certain mean value (e.g., 0) and the standard deviation of the intensity across all voxels has a certain standard deviation value (e.g., 1). To generate it, it may be normalized by subtracting a first fixed value and then dividing by a second fixed value. The resizing step may be accomplished by sampling the CT image.
局所化CNNは、前処理されたCT画像を入力として受け取り、これを図13に示されるような一連の層に通す。局所化CNNの出力は、たとえば第1のセグメント化マスクセットによって表される粗いセグメント化であり、第1のセグメント化マスクセットは、前処理されたCT画像のボクセルを、(i)仙骨および尾骨、(ii)左寛骨、(iii)右寛骨といった特定の組織領域を表す3つのカテゴリと、(iv)背景(たとえば他のものすべて)といった第4のカテゴリとの4つのカテゴリのうちの1つに属するものとして分類する。この粗いセグメント化は、局所化CNNによって生成された未処理の予測マップから得られるものである。未処理の予測マップは、入力として受け取られる前処理されたCT画像のボクセルと同一のセットであって同一の形状を有するが、4つのチャネルで受け取られる。各チャネルが、(i)仙骨および尾骨、(ii)左寛骨、(iii)右寛骨、ならびに(iv)背景といった特定の分類カテゴリに対応する。各チャネルが、対応する分類カテゴリに関する確率マップを表す。すなわち、特定の分類カテゴリに対応するそれぞれの特定のチャンネルは、前処理されたCT画像の各ボクセルについて、ボクセルがその特定のカテゴリ(たとえば、カテゴリが表す組織領域の内部の物理ボリュームを表すか、または背景を表す)に属する確率を表す尤度値を含む。したがって、各ボクセルについて、各チャネルにおいてそのボクセルに関する尤度値にわたる合計は1である。 The localized CNN takes the preprocessed CT image as input and passes it through a series of layers as shown in FIG. The output of the localized CNN is a coarse segmentation, e.g. represented by a first segmentation mask set, which divides the voxels of the preprocessed CT image into (i) sacrum and coccyx. , (ii) left hipbone, (iii) right hipbone, three categories representing specific tissue regions, and (iv) a fourth category such as background (e.g. everything else). Classify as belonging to one category. This coarse segmentation is obtained from the raw prediction map produced by the localized CNN. The raw prediction map is the same set of voxels and has the same shape as the preprocessed CT image voxels received as input, but in four channels. Each channel corresponds to a particular classification category: (i) sacrum and coccyx, (ii) left hip bone, (iii) right hip bone, and (iv) background. Each channel represents a probability map for the corresponding classification category. That is, each particular channel corresponding to a particular classification category is defined for each voxel of the preprocessed CT image, whether the voxel represents a physical volume within that particular category (e.g., a tissue region that the category represents; or background). Therefore, for each voxel, the sum over the likelihood values for that voxel in each channel is 1.
各ボクセルを特定のカテゴリに属するものとして分類する第1のセグメント化マスクセットを判定するために、前処理されたCT画像の各ボクセルは、そのボクセルに関して最大の尤度値(たとえば確率)を有するカテゴリ(たとえば組織領域または背景)に割り当てられる。判定された第1のセグメント化マスクセットは、前処理されたCT画像と同一の形状を有し、このセットによって標識される各ボクセルは、それが属すると分類されるカテゴリを識別する値を有する。たとえば、特定のボクセルは、前述のように、カテゴリ(i)、(ii)、および(iii)に対応する1、2、または3などの数値で標識されてよく、または背景ボクセルとして分類される場合には値0で標識されてよい。
To determine a first set of segmentation masks that classify each voxel as belonging to a particular category, each voxel of the preprocessed CT image has the largest likelihood value (e.g., probability) for that voxel. Assigned to a category (e.g. tissue area or background). The determined first set of segmentation masks has the same shape as the preprocessed CT image, and each voxel labeled by this set has a value identifying the category to which it is classified to belong. . For example, certain voxels may be labeled with numerical values such as 1, 2, or 3, corresponding to categories (i), (ii), and (iii), or classified as background voxels, as described above. may be marked with the
初期のVOIを識別する境界ボックスは、第1のセグメント化マスクセットから、カテゴリ(i)~(iii)に属するものとして標識されたすべてのボクセルを含む最も小さいボックス(たとえば長方形ボリューム)として判定され得る。境界ボックスを識別する座標(たとえば境界ボックスに対応する長方形ボリュームの向かい合ったコーナーの座標)が判定され、クロップ終点として出力される。ある特定の実施形態では、局所化CNNに入力される前処理されたCT画像が元のCT画像のサイズ変更されたバージョンであり、境界ボックスを識別する座標が元のCT画像の座標系に変換され、クロップ終点として出力される。
例示の第2の機械学習モジュール(セグメント化機械)の実装形態
A bounding box identifying the initial VOI is determined from the first segmentation mask set as the smallest box (e.g., a rectangular volume) containing all voxels labeled as belonging to categories (i) to (iii). obtain. Coordinates identifying the bounding box (eg, coordinates of opposite corners of the rectangular volume corresponding to the bounding box) are determined and output as crop endpoints. In certain embodiments, the preprocessed CT image input to the localized CNN is a resized version of the original CT image, and the coordinates identifying the bounding box are transformed to the coordinate system of the original CT image. and output as the crop end point.
Example implementation of the second machine learning module (segmentation machine)
図12の例示のアーキテクチャでは、ベースの単一セグメント化機械1208(図12のSingleSegMachine(BASE))とも称される第2の機械学習モジュールは、対象の前立腺に対応する前立腺ボリュームを、特定の組織領域に対応する左殿筋および右殿筋、直腸、膀胱、仙骨および尾骨、ならびに左寛骨および右寛骨などその他の組織ボリュームとともに識別するために、CT画像の高解像度のセグメント化を遂行する。 In the example architecture of FIG. 12, a second machine learning module, also referred to as a base single segmentation machine 1208 (SingleSegMachine (BASE) of FIG. Perform high-resolution segmentation of the CT image to identify areas corresponding to the left and right gluteal muscles, rectum, bladder, sacrum and coccyx, along with other tissue volumes such as left and right hip bones. .
ある特定の実施形態では、CT画像は、第2の機械学習モジュールによって、セグメント化の準備のために前処理される。局所化機械1204と同様に、前処理ステップおよびパラメータを規定するために構成ファイルが使用され得る。前処理ステップは、局所化機械1204に関して、前述の手法と同様に、CT画像の強度を正規化するステップを含み得る。CT画像は、初期のVOI(境界ボックス)を識別するクロップ終点を使用してクロップされてもよく、単一セグメント化機械1208に関連づけられて同機械において実施された訓練されたニューラルネットワーク(訓練されたCNN)に入力として供給する、低減された固定サイズの前処理されたCT画像入力を生成するために、局所化機械1204によって出力される。前処理はサイズ変更するステップも含み得る。 In certain embodiments, the CT images are preprocessed in preparation for segmentation by a second machine learning module. Similar to localization machine 1204, configuration files may be used to define preprocessing steps and parameters. The preprocessing step may include normalizing the intensity of the CT image, similar to the techniques described above with respect to localization machine 1204. The CT image may be cropped using crop endpoints that identify the initial VOI (bounding box) and a trained neural network associated with and implemented in the single segmentation machine 1208. output by the localization machine 1204 to generate a reduced fixed size preprocessed CT image input to be provided as input to a CNN). Preprocessing may also include resizing steps.
単一セグメント化機械は、局所化機械の局所化CNNと同様に、セグメント化CNNと称される訓練されたCNNを実施し、これは前処理されたCT画像を入力として受け取る。セグメント化CNNは、前処理されたCT画像を一連の層に通して、第2の未処理の予測マップを出力する。第2の未処理の予測マップは、局所化CNNによって生成された未処理の予測マップと同様に、入力CT画像の各ボクセルが分類される別々の特定のカテゴリにそれぞれ対応する複数のチャネルを含む。各チャネルが、対応する分類カテゴリに関する確率マップを表し、前処理されたCT画像の各ボクセルについて、(セグメント化CNNによって判定されたものとして)ボクセルがそのカテゴリに属する確率に対応する尤度値を含む。 The single segmentation machine implements a trained CNN, called a segmentation CNN, similar to the localization CNN of the localization machine, which receives the preprocessed CT images as input. The segmented CNN passes the preprocessed CT image through a series of layers and outputs a second raw prediction map. The second raw prediction map, similar to the raw prediction map generated by the localized CNN, includes multiple channels, each corresponding to a separate specific category into which each voxel of the input CT image is classified. . Each channel represents a probability map for the corresponding classification category, and for each voxel in the preprocessed CT image, we assign a likelihood value corresponding to the probability that the voxel belongs to that category (as determined by the segmented CNN). include.
前述のように、セグメント化CNNによって出力された第2の未処理の予測マップは、対象の前立腺に対応するチャネルを含む。第2の未処理の予測マップは、左殿筋、右殿筋、直腸、膀胱、仙骨および尾骨、左寛骨、および右寛骨などの様々なその他の組織領域に対応する他のチャネルを含み得る。第2の未処理の予測マップは背景チャネルも含み得る。 As mentioned above, the second raw prediction map output by the segmented CNN includes a channel corresponding to the prostate of interest. The second raw prediction map includes other channels corresponding to various other tissue regions such as left gluteus, right gluteus, rectum, bladder, sacrum and coccyx, left hipbone, and right hipbone. obtain. The second raw prediction map may also include a background channel.
高解像度セグメント化CNNのある特定の変形形態は、ネットワークの複数のレベルからの予測を与え、1つのカテゴリにつき複数の確率マップをもたらす。これらの複数の確率マップは補助予測と称される。図13に示されるCNNのモデル構造は補助予測を生成しないモデル構造に対応するものであり、図14に示されるCNNのモデル構造は補助予測を生成するモデル向けである。ある特定の実施形態では、最上層におけるフィルタの数(たとえば図13には20のフィルタがあり、図14には28のフィルタがある)は変化し得るが、後続の下部層におけるフィルタの数は層を下がるごとに倍になる。ある特定の実施形態では、セグメント化CNNは単一の確率マップを生成し、補助予測は生成しない。ある特定の実施形態では、セグメント化CNNは補助予測を生成する。 Certain variants of high-resolution segmented CNNs provide predictions from multiple levels of the network, resulting in multiple probability maps per category. These multiple probability maps are called auxiliary predictions. The CNN model structure shown in FIG. 13 corresponds to a model structure that does not generate auxiliary predictions, and the CNN model structure shown in FIG. 14 is for a model that generates auxiliary predictions. In certain embodiments, the number of filters in the top layer (e.g., there are 20 filters in FIG. 13 and 28 filters in FIG. 14) may vary, but the number of filters in subsequent bottom layers may vary. It doubles each time you go down a layer. In certain embodiments, the segmented CNN generates a single probability map and no auxiliary predictions. In certain embodiments, the segmented CNN generates auxiliary predictions.
ある特定の実施形態では、セグメント化CNNが補助予測マップを生成するとき、各カテゴリに関する尤度値は第2の未処理の予測マップに含まれており、特定のボクセルについて各カテゴリに関する単一の尤度値が判定されるように、それぞれの補助確率マップが一緒に平均される。 In certain embodiments, when the segmented CNN generates the auxiliary prediction map, the likelihood values for each category are included in the second raw prediction map, and a single likelihood value for each category for a particular voxel is included. Each auxiliary probability map is averaged together so that a likelihood value is determined.
ある特定の実施形態では、各ボクセルを特定のカテゴリに属するものとして分類する第2の精細なセグメント化マスクセットを判定するために、前処理されたCT画像の各ボクセルは最も高い確率値に割り当てられる。ある特定の実施形態では、前立腺ボリュームおよび基準ボリューム(たとえば左殿筋ボリューム)などのある特定の組織ボリュームのみが精細なセグメント化マスクセットに含まれるように、精細なセグメント化マスクセットにおける標識の数が低減される。
補助の単一セグメント化機械
In certain embodiments, each voxel of the preprocessed CT image is assigned the highest probability value to determine a second set of fine segmentation masks that classify each voxel as belonging to a particular category. It will be done. In certain embodiments, the number of landmarks in the fine segmentation mask set is such that only certain tissue volumes, such as the prostate volume and the reference volume (e.g., left gluteus muscle volume), are included in the fine segmentation mask set. is reduced.
Auxiliary single segmentation machine
ある特定の実施形態では、第2の機械学習モジュールによって生成された精細なセグメント化マスクセットと同様に、補助の精細なセグメント化マスクセットを生成するために1つまたは複数の補助の機械学習モジュールが使用される。これら補助の精細なセグメント化マスクセットは、第2の機械学習モジュールによって生成された精細なセグメント化マスクセットと同一の組織ボリュームのセットを識別する。このように、第2の機械学習モジュールがベースの精細なセグメント化マスクセットを生成し、1つまたは複数の補助の機械学習モジュールのそれぞれが補助の精細なセグメント化マスクセットを生成し、それによってCT画像のボクセルに関する分類の並列セットをもたらす。 In certain embodiments, one or more auxiliary machine learning modules to generate an auxiliary fine segmentation mask set similar to the fine segmentation mask set generated by the second machine learning module. is used. These supplementary fine segmentation mask sets identify the same set of tissue volumes as the fine segmentation mask set generated by the second machine learning module. Thus, the second machine learning module generates a base fine segmentation mask set, and each of the one or more auxiliary machine learning modules generates an auxiliary fine segmentation mask set, thereby It yields a parallel set of classifications for voxels of a CT image.
ある特定の実施形態では、特定の組織領域を表す各カテゴリについて、(たとえばベースの単一セグメント化機械によって判定されたCT画像におけるボリュームを特定の組織領域に対応するものとして識別する)ベースの精細なセグメント化マスクセットの対応するベースの精細なセグメント化マスク、またはベースの精細なセグメント化マスクセットを使用して判定された対応するベースの精細なセグメント化マスクと、1つまたは複数の対応する補助の精細なセグメント化マスク(たとえば、それぞれが、補助の単一セグメント化機械によって判定されたCT画像のボリュームを、同一の特定の組織領域に対応するものとして識別する)とが合併されて、合併された精細なセグメント化マスクを生成する。たとえば、特定のカテゴリについて、1つまたは複数の補助の精細なセグメント化マスクにおけるある特定のボクセルは、特定のカテゴリに属するが、この特定のカテゴリに属するものとして識別されたベースの精細なセグメント化マスクにおけるボクセルのセットには属さないものとして識別され得る(たとえば標識され得る)。これらのボクセルは、最終的な合併された精細なセグメント化マスクを生成するために、ベースの精細なセグメント化マスクにおける特定のカテゴリに属するものとして識別されたボクセルのセットに(たとえばそのように標識されることによって)加えられてよい。たとえば、図12に示されるアーキテクチャでは、ベースの単一セグメント化機械1208がベースの精細なセグメント化マスクを生成し、1つまたは複数の補助の単一セグメント化機械1212のそれぞれが補助のセグメント化マスクを生成する。ベースの単一セグメント化機械1208によって生成されたベースの精細なセグメント化マスクは、各カテゴリ向けの最後の精細なセグメント化マスクを含む最後の精細なセグメント化マスクセット1216を生成するために、モジュール1214によって、補助の単一セグメント化機械1212によって生成された1つまたは複数の補助の精細なセグメント化マスクと合併される。 In certain embodiments, for each category representing a particular tissue region, a base definition (e.g., identifying a volume in a CT image determined by a base single segmentation machine as corresponding to a particular tissue region) a corresponding base fine segmentation mask of the base segmentation mask set, or a corresponding base fine segmentation mask determined using the base fine segmentation mask set, and one or more corresponding base fine segmentation masks. auxiliary fine segmentation masks (e.g., each identifying the volume of the CT image determined by the auxiliary single segmentation machine as corresponding to the same specific tissue region) are merged; Generate a merged fine segmentation mask. For example, for a particular category, a particular voxel in one or more auxiliary fine segmentation masks belongs to a particular category, but the base fine segmentation mask identified as belonging to this particular category The voxels in the mask may be identified (e.g., labeled) as not belonging to the set of voxels. These voxels are merged into a set of voxels identified as belonging to a particular category (e.g. labeled as such) in the base fine segmentation mask to generate the final merged fine segmentation mask. may be added by For example, in the architecture shown in FIG. 12, a base single segmentation machine 1208 generates a base fine segmentation mask, and one or more auxiliary single segmentation machines 1212 each generate an auxiliary segmentation mask. Generate a mask. The base fine segmentation masks generated by the base single segmentation machine 1208 are then processed by the module to generate a final fine segmentation mask set 1216 that includes a final fine segmentation mask for each category. 1214 with one or more auxiliary fine segmentation masks generated by auxiliary single segmentation machine 1212 .
ある特定の実施形態では、最後の精細なセグメント化マスクのうち1つまたは複数が、最大の接続された部分のみ保存されるようにフィルタリングされる。ある特定の実施形態では、前立腺セグメント化マスク(たとえば、対象の前立腺に対応するCT画像のボリュームを識別する最後の精細なセグメント化マスク)の最大の接続された構成要素のみを保存するためにフィルタリングが遂行されるとき、前立腺セグメント化マスクの接続された構成要素のサブセットが考慮に入れられる。このサブセットに含まれる構成要素は、(i)軸面の左右方向(x方向)において左寛骨の質量中心と右寛骨の質量中心との間に質量中心を有するもの、および(ii)左寛骨および右寛骨をきっかり含有するように定義された境界ボックスの内部のあるもの、のみである。
iv.摂取メトリック
In certain embodiments, one or more of the final fine segmentation masks are filtered such that only the largest connected portions are preserved. In certain embodiments, filtering to preserve only the largest connected components of the prostate segmentation mask (e.g., the last fine segmentation mask that identifies the volume of the CT image that corresponds to the prostate of interest) is performed, a subset of the connected components of the prostate segmentation mask is taken into account. Components included in this subset are those that (i) have a center of mass between the center of mass of the left hipbone and the center of mass of the right hipbone in the left-right direction (x direction) of the axial plane, and (ii) the left hipbone. Only those inside the bounding box defined to contain exactly the hip bone and the right hip bone.
iv. intake metric
図1におけるプロセス100のステップ110を参照して、1つまたは複数の摂取メトリックが判定され、これから、状態(たとえば前立腺がん)の診断または疾患分類が通知されるかまたは自動的にレンダリングされ得る。3D機能的画像と3D解剖学的画像のVOIの内部で識別された前立腺ボリュームとを使用して、1つまたは複数の摂取メトリックが判定される。たとえば、対象の前立腺における放射性医薬品の量は、3D解剖学的画像のVOIの内部で識別された前立腺ボリュームに対応する3D機能的画像のボクセルの強度値に基づいて計算され得る。これは、対象の前立腺が占有する物理ボリュームを表す3D機能的画像のボクセルの強度の合計(たとえば加重和)、平均値、および/または最大値を計算するステップを包含してよい。ある特定の実施形態では、これは、3D解剖学的画像の内部で識別された基準ボリュームに対応する3D機能的画像のボクセルの強度値に基づいて正規化値を計算するステップを含む。たとえば、前立腺において識別された強度に関する正規化値は、殿筋に対応する1つまたは複数のボクセル、またはVOIの内部の別の基準ボリューム(または、ある特定の実施形態では3D解剖学的画像の内部のどこか他のところ)の強度値を使用して正規化されてよい。次いで、摂取メトリックが、対象における前立腺がんの有無の識別、および/または対象が前立腺がんを有するリスクの定量化、および/または(たとえば疾患を経時的に追跡することの一部分としての)疾患分類に変換され得、医師によって、たとえば治療の選択肢を助言するため、および/または施された療法の効能を監視するために使用され得る。
標的の背景に対する比
With reference to step 110 of
Ratio of target to background
ある特定の実施形態では、判定された1つまたは複数の摂取メトリックは、対象に関する、標的の背景に対する比(TBR)の値を含む。TBR値を判定するステップは、(i)3D解剖学的画像(たとえばCT画像)の初期のVOIの内部で識別された前立腺ボリュームに対応する3D機能的画像(たとえばPET画像またはSPECT画像)の1つまたは複数のボクセルの強度値を使用して標的強度値を判定するステップと、(ii)識別された基準ボリュームに対応する3D機能的画像の1つまたは複数のボクセルの強度値を使用して背景強度値を判定するステップとを含む。TBR値は、標的強度値の背景強度値に対する比として計算される。 In certain embodiments, the one or more uptake metrics determined include a target-to-background ratio (TBR) value for the subject. The step of determining the TBR value includes (i) one of the 3D functional images (e.g., PET image or SPECT image) corresponding to the prostate volume identified within the initial VOI of the 3D anatomical image (e.g., the CT image); (ii) determining a target intensity value using the intensity values of the one or more voxels of the 3D functional image corresponding to the identified reference volume; determining a background intensity value. The TBR value is calculated as the ratio of the target intensity value to the background intensity value.
詳細には、ある特定の実施形態では、標的強度値は、識別された前立腺ボリュームに対応する3D機能的画像(たとえばPET画像またはSPECT画像)のボクセルの強度の最大値である。前述のように、前立腺の最大強度ボクセルは、識別された前立腺ボリュームに対応する3D機能的画像のボクセルのセットの内部の最大の強度を有するものと識別されたボクセルに対応する。そこで、標的値は、前立腺の最大強度ボクセルの強度として得られてよい。背景強度値は、識別された基準ボリュームに対応する、3D機能的画像の複数のボクセルの各強度にわたる平均値として計算され得る。本明細書で説明されたように、左殿筋などの殿筋またはその一部分が、識別された基準ボリュームとして使用され得る。 In particular, in certain embodiments, the target intensity value is the maximum value of the intensity of a voxel in a 3D functional image (eg, a PET image or a SPECT image) that corresponds to the identified prostate volume. As mentioned above, the maximum intensity voxel of the prostate corresponds to the voxel identified as having the maximum intensity within the set of voxels of the 3D functional image that corresponds to the identified prostate volume. The target value may then be obtained as the intensity of the maximal intensity voxel of the prostate. The background intensity value may be calculated as an average value over each intensity of a plurality of voxels of the 3D functional image corresponding to the identified reference volume. As described herein, the gluteal muscle or a portion thereof, such as the left gluteus muscle, may be used as the identified reference volume.
たとえば、TBR値は、対象に1404などの放射性医薬品を投与した後に記録された対象のSPECT画像/CT画像から計算され得る。SPECT画像は3D機能的画像に対応し、CT画像は解剖学的画像に対応する。本明細書で説明された画像セグメント化手法は、CT画像の内部で、対象の左殿筋に対応する基準ボリュームとともに前立腺ボリュームを識別するために使用され得るものである。前立腺セグメント化マスクおよび左殿筋セグメント化マスクは、それぞれ前立腺ボリュームおよび左殿筋基準ボリュームを識別するために使用され得る。 For example, TBR values may be calculated from SPECT/CT images of a subject recorded after administering a radiopharmaceutical such as 1404 to the subject. SPECT images correspond to 3D functional images, and CT images correspond to anatomical images. The image segmentation techniques described herein may be used to identify a prostate volume within a CT image along with a reference volume corresponding to the left gluteus muscle of interest. A prostate segmentation mask and a left gluteus muscle segmentation mask may be used to identify the prostate volume and left gluteus muscle reference volume, respectively.
前立腺ボリュームセグメント化マスクは、本明細書で説明された機械学習セグメント化手法によって対象の前立腺に属するものと分類されたCT画像のボクセルを識別する。ある特定の実施形態では、CT画像の内部の識別された前立腺ボリュームに対応するSPECT画像のボクセルを識別するために、前立腺セグメント化マスクのボクセルがSPECT画像の対応するボクセルにマッピングされる。前立腺セグメント化マスクがCT画像のボクセルを識別するので、これは、(たとえばSPECT画像とCT画像が異なる解像度を有し得るので)SPECT画像からのものと異なる解像度を有する可能性がある。前立腺セグメント化マスクのマップの各ボクセルがSPECT画像の特定の対応するボクセルにマッピングされるように、前立腺セグメント化マスクの解像度をSPECT画像の解像度に一致させるために、補間(たとえば双線形補間)および/またはサンプリングが使用され得る。このように、CT画像の内部で識別された前立腺ボリュームに対応するSPECT画像のボクセルを識別するSPECT前立腺マスクが得られる。CT画像において識別された左殿筋基準ボリュームに対応するSPECT画像のボクセルを識別するSPECT左殿筋マスクは、類似のやり方で得られてよい。 The prostate volume segmentation mask identifies voxels in the CT image that are classified as belonging to the prostate of interest by the machine learning segmentation techniques described herein. In certain embodiments, voxels of the prostate segmentation mask are mapped to corresponding voxels of the SPECT image to identify voxels of the SPECT image that correspond to identified prostate volumes within the CT image. Since the prostate segmentation mask identifies voxels in the CT image, this may have a different resolution than from the SPECT image (eg, since SPECT and CT images may have different resolutions). To match the resolution of the prostate segmentation mask to that of the SPECT image, interpolation (e.g. bilinear interpolation) and /or sampling may be used. In this way, a SPECT prostate mask is obtained that identifies voxels of the SPECT image that correspond to prostate volumes identified within the CT image. A SPECT left gluteus mask that identifies voxels in the SPECT image that correspond to the left gluteus reference volume identified in the CT image may be obtained in a similar manner.
SPECT左殿筋マスクは、背景強度値を判定するために使用され得る。詳細には、SPECT左殿筋マスクによって識別されたSPECT画像におけるボクセルの強度が抽出されて四分値へと分割される。背景値は、抽出された左殿筋ボクセルの、第1の四分値と第3の四分値の範囲に入る強度にわたる平均値として計算される。すべての抽出された左殿筋のボクセル強度にわたる全体の平均値または中央値の計算など、背景値を計算するための他の手法も使用され得る。抽出された左殿筋のボクセル強度を四分値へと分割する前述の手法は、(たとえば強度が離散的であり、多くが同一の値を有するので)全体の平均値を計算するよりも異常値に対してより安定しており、全体の中央値を計算するよりも正確であることが判明した。判定された背景強度値は、たとえばキー「background」の下で出力され、結果の辞書に記憶され得る。 A SPECT left gluteus mask may be used to determine background intensity values. In particular, the intensities of voxels in the SPECT image identified by the SPECT left gluteus mask are extracted and divided into quadrants. The background value is calculated as the average value over the intensities of the extracted left gluteus muscle voxels that fall between the first and third quartiles. Other techniques for calculating the background value may also be used, such as calculating an overall mean or median value over all extracted left gluteus voxel intensities. The aforementioned method of dividing the extracted voxel intensities of the left gluteus muscle into quartiles is less likely to be abnormal than calculating the overall average value (e.g., since the intensities are discrete and many have the same value). It was found to be more stable for values and more accurate than calculating the overall median. The determined background intensity value may be output under the key "background" and stored in the result dictionary, for example.
標的強度値はSPECT前立腺マスクを使用して計算され得る。前立腺の最大強度ボクセルは、SPECT前立腺マスクのボクセルとして識別されてよく、最大のSPECT画像強度を有する。標的強度値は、前立腺の最大強度ボクセルの強度として判定される。標的強度値と前立腺の最大強度ボクセルのロケーションとの両方が記憶され得る。たとえば、結果の辞書は、「prostate_max」および「prostate_max_position」などのキーの下で、それぞれ標的強度値および前立腺の最大強度ボクセルのロケーションを記憶してよい。ある特定の実施形態では、たとえば、記憶される最大の強度は最大の補正強度であるように、また、記憶される前立腺の最大強度ボクセルは最大の補正強度を有するSPECT前立腺マスクのボクセルであるように、以下の節Bで説明されるように、識別された前立腺ボリュームに対応するSPECT画像のボクセルの強度は、標的強度値を判定する前に膀胱の「クロストーク」または「ブリード」を補正されてよい。 Target intensity values may be calculated using the SPECT prostate mask. The maximal intensity voxel of the prostate may be identified as the voxel of the SPECT prostate mask and has the largest SPECT image intensity. The target intensity value is determined as the intensity of the most intense voxel of the prostate. Both the target intensity value and the location of the maximal intensity voxel of the prostate may be stored. For example, the resulting dictionary may store the target intensity value and the location of the maximum intensity voxel of the prostate under keys such as "prostate_max" and "prostate_max_position," respectively. In certain embodiments, for example, the maximum intensity stored is the maximum correction intensity, and the maximum intensity voxel of the prostate stored is the voxel of the SPECT prostate mask that has the maximum correction intensity. As described in Section B below, the intensities of the SPECT image voxels corresponding to the identified prostate volumes are corrected for bladder "crosstalk" or "bleed" before determining the target intensity values. It's fine.
ある特定の実施形態では、対象の前立腺がんの状態は、対象に関して判定されたTBR値を1つまたは複数の閾値と比較することによって判定され得る。詳細には、臨床的に重要な前立腺がんのある(たとえば臨床的に重要な状態を割り当てられた)患者と臨床的に重要な前立腺がんのない(たとえば臨床的に重要でない状態を割り当てられた)患者とを区別するために、判定されたTBR値が特定の閾値(たとえばカットオフ閾値)と比較されてよい。以下の例4は、所望の感度および特異度を得るために、基準画像から計算されたTBR値に基づいてTBR閾値を判定するための例示の手法を示すものである。
B.膀胱強度のブリードスルーに対する補正
In certain embodiments, a subject's prostate cancer status may be determined by comparing the TBR value determined for the subject to one or more threshold values. Specifically, patients with clinically significant prostate cancer (e.g., assigned a clinically significant condition) and patients without clinically significant prostate cancer (e.g., assigned a clinically unimportant condition) The determined TBR value may be compared to a particular threshold (eg, a cut-off threshold) in order to distinguish between patients (e.g., cut-off threshold). Example 4 below illustrates an exemplary approach for determining a TBR threshold based on a TBR value calculated from a reference image to obtain the desired sensitivity and specificity.
B. Correction for bladder strength bleed-through
図15は膀胱から対象の前立腺への造影剤強度のクロストークを図示する概略図である。この図では、基準1502は膀胱であり、1506は膀胱からのクロストーク/ブリードの強度であって、1504は前立腺である。PSMA結合剤を含むある特定の造影剤は、膀胱における摂取が大きく、このことが病変組織(たとえば前立腺がん)の識別に影響を及ぼす可能性がある。たとえば、膀胱による、放射性核種で標識されたPSMA結合剤の摂取が、3D機能的画像における散乱をもたらして、膀胱の近くにある前立腺において測定される造影剤強度の精度が低下する可能性がある。対象の前立腺と膀胱の両方の詳細なセグメント化のために第2のCNNを訓練することにより、「ブリードスルー」もしくは「クロストーク」の影響および/または膀胱による造影剤の摂取に起因する他の影響を、自動的かつ正確に明らかにすることが可能になる。その上、第2のCNNを、3D解剖学的画像の内部のたとえば殿筋といった基準領域を識別するように訓練することにより、造影剤の強度測定値をより正確に重み付け/正規化して、対象の前立腺における摂取測定の精度および診断値を改善することが可能になる。
i.膀胱拡張
FIG. 15 is a schematic diagram illustrating contrast agent intensity crosstalk from the bladder to the subject's prostate. In this figure,
i. bladder expansion
ある特定の実施形態では、膀胱のクロストーク補正に含まれるステップにおいて、識別された膀胱のボリュームが2つの繰返しを用いて(たとえば形態学的膨張によって)拡張される。この拡張は、(たとえば最大の強度として選択される)TBR値を計算する際に標的強度値を判定するために使用されるセグメント化された膀胱にかなり接近した高い強度を予防するとともに、以下で説明される膀胱抑制手法を安定化するために使用され得る。
ii.膀胱の抑制計算
In certain embodiments, in the steps involved in bladder crosstalk correction, the identified bladder volume is expanded (eg, by morphological dilation) using two iterations. This expansion prevents high intensities fairly close to the segmented bladder that are used to determine the target intensity values when calculating the TBR value (e.g. selected as the maximum intensity) and below. It may be used to stabilize the bladder restraint techniques described.
ii. Bladder restraint calculation
ある特定の実施形態では、膀胱から機能的画像の他の領域への強度ブリードを除去するために膀胱抑制方法が使用される。抑制の量、すなわち機能的画像の特定のボクセルから除去するべき強度ブリードは、そのボクセルからコア膀胱領域(高強度のボクセルを有する膀胱の領域に対応する)までの距離に依拠するものである。 In certain embodiments, a bladder suppression method is used to remove intensity bleed from the bladder to other areas of the functional image. The amount of suppression, ie, the intensity bleed to be removed from a particular voxel of the functional image, depends on the distance from that voxel to the core bladder region (corresponding to the region of the bladder with high intensity voxels).
ある特定の実施形態では、膀胱(たとえば3D解剖学的画像の内部で識別された膀胱ボリュームに対応するもの、たとえば膀胱マスクによって識別されたもの)に対応するものとして識別された機能的画像のボリュームの内部の最大の機能的画像強度が、判定された背景強度値に特定の数を掛けたものよりも大きければ、膀胱抑制が行われる。本明細書で説明されたように、背景強度値は、たとえば殿筋ボリュームといった3D解剖学的画像の内部で識別された基準ボリュームに対応する3D機能的画像のボクセルの強度に基づいて判定されてよい。たとえば、識別された膀胱ボリュームに対応する領域の内部の最大の機能的画像強度が判定された背景値の15倍(たとえば膀胱の背景に対する比が少なくとも15)であれば、膀胱抑制が遂行されてよい。 In certain embodiments, the volume of the functional image identified as corresponding to the bladder (e.g., corresponding to the bladder volume identified within the 3D anatomical image, e.g., identified by the bladder mask) Bladder suppression occurs if the maximum functional image intensity within the is greater than the determined background intensity value multiplied by a certain number. As described herein, the background intensity value is determined based on the intensity of a voxel in the 3D functional image that corresponds to a reference volume identified within the 3D anatomical image, such as the gluteal muscle volume. good. For example, if the maximum functional image intensity within the region corresponding to the identified bladder volume is 15 times the determined background value (e.g., the bladder to background ratio is at least 15), bladder suppression is accomplished. good.
ある特定の実施形態では、膀胱抑制は、識別された膀胱ボリュームのまわりの特定のサイズの膀胱抑制境界ボックスの内部にある3D機能的画像の一部分から計算され、この部分に適用される。たとえば、特定の方向に所定のサイズ(たとえば垂直方向に40mm)のマージンのある膀胱を含有して、他の方向に同数のボクセルがある膀胱抑制境界ボックスが判定されてよい。 In certain embodiments, bladder restraint is calculated from and applied to a portion of the 3D functional image that is within a bladder restraint bounding box of a particular size around the identified bladder volume. For example, a bladder-containment bounding box may be determined that contains a bladder with a margin of a predetermined size (eg, 40 mm vertically) in a particular direction and the same number of voxels in other directions.
たとえば、3D機能的画像の前立腺に対応する領域をマスクアウトした後に、コア膀胱領域は、境界ボックス(たとえばマスクアウトされた前立腺領域のボクセルは含まない)の内部の最大強度の特定の割合の範囲内の強度を有するボクセルを含む膀胱抑制境界ボックスの内部の3D機能的画像の領域として判定され得る。たとえば、コア膀胱領域は、膀胱抑制境界ボックスの内部の最大強度の50%より大きいかまたはそれと等しい強度を有するボクセルを含む領域として判定され得る。コア膀胱領域は、元の膀胱マスクには含まれていなかった高強度領域を含む可能性がある。 For example, after masking out the region corresponding to the prostate in a 3D functional image, the core bladder region ranges within a certain percentage of the maximum intensity inside the bounding box (e.g. does not include voxels of the masked out prostate region). Bladder restraint may be determined as the region of the 3D functional image inside the bounding box that includes voxels with an intensity within . For example, a core bladder region may be determined as a region that includes voxels with an intensity greater than or equal to 50% of the maximum intensity inside the bladder restraint bounding box. The core bladder region may include areas of high intensity that were not included in the original bladder mask.
ある特定の実施形態では、膀胱抑制を遂行することにより、膀胱のクロストークに対して3D機能的画像のボクセルの強度を補正するために、1つまたは複数の膀胱強度ブリード関数が判定される。たとえば、膀胱抑制境界ボックスを使用して3D機能的画像がクロップされ、クロップされた画像領域の内部のボクセルの強度から、判定された背景強度値が差し引かれてよい。次いで、膀胱から1つが離れたときどれだけ膀胱強度(たとえば、対象の膀胱の内部の放射性医薬品の摂取に由来する強度)が低下するかを判定するために試料強度が収集される。試料は、コア膀胱領域の上の先端、前の先端、右の先端、および左の先端において始まって、次いで、まっすぐに上、前、右、または左へ、それぞれ一度に1つのボクセルが収集される。クロップされた画像領域のエッジに遭遇した場合には、たとえば以前の2つまたはそれよりも多くの試料から線形外挿法によって外挿された強度が試料として使用されてよい。 In certain embodiments, one or more bladder intensity bleed functions are determined to correct the voxel intensity of the 3D functional image for bladder crosstalk by performing bladder suppression. For example, a 3D functional image may be cropped using a bladder restraint bounding box, and the determined background intensity value may be subtracted from the intensity of voxels within the cropped image region. Sample intensities are then collected to determine how much bladder strength (eg, strength resulting from ingestion of radiopharmaceutical inside the subject's bladder) decreases when one is removed from the bladder. Samples are collected starting at the upper tip, anterior tip, right tip, and left tip of the core bladder region, then straight up, anterior, right, or left, one voxel at a time each. Ru. If an edge of a cropped image region is encountered, the intensity extrapolated by linear extrapolation from, for example, two or more previous samples may be used as the sample.
強度試料は、膀胱コアから強度が低下する4つの曲線(たとえばサンプリングされた強度データポイントのセット)をもたらし、その各々に、コア膀胱領域からの距離の関数として膀胱強度変化をモデル化する4つの膀胱強度ブリード関数を確立するために、テンプレート関数が当てはめられてよい。当てはめなどのさらなる解析の前に、たとえば、他のものから最も遠く離れた曲線を除去するために異常値除去が遂行されてよい。残りの3つの曲線におけるデータポイントにn次多項式(たとえば5次多項式)などのテンプレート関数が当てはめられて、膀胱強度ブリードをコア膀胱に対する距離の関数としてモデル化する関数がもたらされる。この膀胱強度ブリード関数は、補正強度を得るために、コア膀胱領域に対する距離に依拠して、元の強度からどのくらい引き去るべきかを説明するものである。 The intensity sample yields four curves (e.g., a set of sampled intensity data points) of decreasing intensity from the bladder core, each of which has four curves that model bladder intensity changes as a function of distance from the core bladder region. A template function may be fitted to establish a bladder strength bleed function. Before further analysis such as fitting, outlier removal may be performed, for example, to remove the curves that are furthest apart from others. A template function, such as an n-order polynomial (eg, a 5-order polynomial), is fitted to the data points in the remaining three curves to yield a function that models bladder strength bleed as a function of distance to the core bladder. This bladder strength bleed function describes how much to subtract from the original strength, depending on the distance to the core bladder region, to obtain a corrected strength.
ある特定の実施形態では、膀胱強度ブリード関数が膀胱の方向のブリードを過小評価する(ブリードは異なる方向の間である程度変化する可能性がある)リスクを低減するために、サンプリングされた強度データポイントに当てはめる前に、距離に膨張係数(たとえば1から2の範囲でたとえば1.2)が掛けられ、その結果、当てはめられる膀胱強度ブリード関数が伸ばされる。膀胱強度ブリードを過小評価するリスクも、サンプリングされた強度データポイントに換算係数を掛けることによって低減され得る。換算係数は、膀胱の背景に対する強度比に依拠する値を有する可変の換算係数でよい。使用される換算係数は、たとえば膀胱の背景に対する比が十分に大きいとき特定の値を有し、膀胱の背景に対する比が低下するのにつれて(たとえば直線的に)増加するものでよい。たとえば、膀胱の背景に対する比が十分に大きいときにはサンプル強度に係数1.2を掛けてよく、より低い膀胱の背景に対する比向けには、膀胱の背景に対する比15向けの0から直線的に増加する。サンプリングされた強度データポイントに換算係数を掛けるこの手法により、膀胱抑制手法の頑健性も改善される。 In certain embodiments, to reduce the risk that the bladder strength bleed function underestimates bleed in the direction of the bladder (bleed can vary to some extent between different directions), the sampled strength data points Before fitting, the distance is multiplied by an expansion factor (eg, 1.2 in a range of 1 to 2), so that the fitted bladder strength bleed function is stretched. The risk of underestimating bladder strength bleed may also be reduced by multiplying the sampled strength data points by a conversion factor. The scaling factor may be a variable scaling factor with a value depending on the intensity ratio of the bladder to the background. The scaling factor used may, for example, have a certain value when the bladder-to-background ratio is sufficiently large, and increase (eg, linearly) as the bladder-to-background ratio decreases. For example, the sample intensity may be multiplied by a factor of 1.2 when the bladder-to-background ratio is large enough, increasing linearly from 0 for a bladder-to-background ratio of 15 for lower bladder-to-background ratios. . This technique of multiplying the sampled intensity data points by a scaling factor also improves the robustness of the bladder suppression method.
ある特定の実施形態では、膀胱抑制の範囲、すなわち膀胱抑制が適用される、膀胱から最も遠い距離は、関数の減衰率が十分に小さいところに基づく。減衰率が十分に小さくならない場合、この距離は強度試料ベクトルの長さに選ばれる。ある特定の実施形態では、すべての距離における膀胱抑制が負にならないことが保証される。 In certain embodiments, the range of bladder restraint, ie, the furthest distance from the bladder to which bladder restraint is applied, is based on where the rate of decay of the function is sufficiently small. If the attenuation rate does not become small enough, this distance is chosen to be the length of the intensity sample vector. Certain embodiments ensure that bladder inhibition at all distances is not negative.
膀胱強度ブリード関数は、一旦判定されると、それぞれの特定のボクセルロケーションについて膀胱強度ブリード値を判定するために、たとえば対象の前立腺の内部のロケーションに対応するボクセルロケーションといった、3D機能的画像の様々なボクセルのロケーションにおいて評価され得る。したがって、特定のボクセルの強度は、特定のボクセルの強度から特定のボクセルのロケーションにおいて判定された膀胱強度ブリード値を差し引くことによって、膀胱クロストークを補正され得る。たとえば識別された(たとえば3D解剖学的画像の内部の識別された)前立腺ボリュームに対応するロケーションといった3D機能的画像の内部の様々なロケーションにおけるボクセルの強度は、このようにして膀胱クロストークを補正され得る。
iii.補正された前立腺の最大強度およびロケーション
Once determined, the bladder intensity bleed function can be used to determine the bladder intensity bleed value for each specific voxel location, such as a voxel location corresponding to a location inside the prostate of interest. voxel locations. Therefore, the intensity of a particular voxel may be corrected for bladder crosstalk by subtracting the bladder intensity bleed value determined at the location of the particular voxel from the intensity of the particular voxel. The intensities of voxels at various locations inside the 3D functional image, e.g. locations corresponding to identified prostate volumes (e.g. inside the 3D anatomical image), thus correct for bladder crosstalk. can be done.
iii. Corrected prostate maximum intensity and location
本明細書で説明された膀胱抑制手法は、ある特定の実施形態では、3D解剖学的画像の内部で識別された前立腺ボリュームに対応する3D機能的画像のボクセルの強度値を補正するために使用され、TBR値などの摂取メトリックは補正強度値を使用して判定される。
C.画像データおよび計算された摂取メトリックの視覚化
The bladder suppression techniques described herein, in certain embodiments, are used to correct the intensity values of voxels in a 3D functional image that correspond to prostate volumes identified within a 3D anatomical image. and intake metrics such as TBR values are determined using the corrected intensity values.
C. Visualization of image data and calculated intake metrics
図16Aは、2人の対象(患者)を列記したGUIインターフェースのウィンドウを示すものである。ユーザは、所望の対象を選択して、対象の画像データを処理したり観察したりすることができる。 FIG. 16A shows a GUI interface window listing two subjects (patients). A user can select a desired object and process or observe image data of the object.
図16Bは、対象のデータを処理したりナビゲートしたりするためのグラフィカル制御要素を伴う例示的GUIを示し、これはユーザが対象「John Doe」を選択した後に出現する。ユーザは、選択された対象に関する画像データの処理を完了するために選択可能なボタン要素をクリックする。 FIG. 16B shows an example GUI with graphical control elements for manipulating and navigating the object's data, which appears after the user selects the object "John Doe." The user clicks on the selectable button element to complete processing of the image data for the selected object.
図16Cにおいて、選択された対象の画像データの処理が完了した後に、ユーザは、処理された画像データを観察するために、別の選択可能なボタンをクリックして摂取メトリックを計算した。 In FIG. 16C, after the processing of the image data of the selected object was completed, the user clicked another selectable button to view the processed image data and calculate the ingestion metric.
図17A~図17Eには2Dビューアが表示されている。図17A~図17Eは、SPECT画像ならびに識別された組織ボリューム(具体的には前立腺および骨盤骨)を表すグラフィックスを重ね合わされたCT画像データの2D断面図のセットを示すものである。ユーザは、図に示されるように、断面の各スライスを通してスキャンすることができる。 A 2D viewer is displayed in FIGS. 17A to 17E. 17A-17E depict a set of 2D cross-sectional views of CT image data overlaid with SPECT images and graphics representing identified tissue volumes (specifically, the prostate and pelvic bones). The user can scan through each slice of the cross section as shown.
CT画像およびSPECT画像は、オン/オフを切り換えることができる選択可能な層としてレンダリングされる。識別された組織ボリュームを表すグラフィックスも、選択可能なセグメント化層としてレンダリングされる。図18Aでは、ユーザは、CT画像およびセグメント化層のみが表示されるようにSPECT画像層を非表示に切り換える。図18B~図18Fでは、ユーザは各断面を通してスキャンする。 CT and SPECT images are rendered as selectable layers that can be turned on/off. Graphics representing the identified tissue volumes are also rendered as selectable segmentation layers. In FIG. 18A, the user hides the SPECT image layer so that only the CT image and segmentation layer are displayed. In Figures 18B-18F, the user scans through each cross section.
図19Aでは、ユーザは、SPECT画像層を表示に切り換え、セグメント化層を非表示にする。図19B~図19Dでは、ユーザは再び各断面図を通してスキャンし、このときはCT画像およびSPECT画像層のみが表示される。 In FIG. 19A, the user switches to display the SPECT image layer and hides the segmentation layer. In FIGS. 19B-19D, the user again scans through each cross-sectional view, this time only the CT and SPECT image layers are displayed.
図20A~図20Cには、SPECT画像データを重ね合わせたCT画像を観察するための回転可能かつスライス可能な3Dビューアが示されており、CT画像は柔組織のグラフィカル表現を含む。 20A-20C depict a rotatable and slicable 3D viewer for viewing a CT image overlaid with SPECT image data, the CT image containing a graphical representation of soft tissue.
図21A~図21Bも回転可能かつスライス可能な3Dビューアを示すものであるが、CT画像に表示されているのは骨のグラフィカル表現のみである。 21A-21B also illustrate a rotatable and slicable 3D viewer, but only a graphical representation of the bone is displayed in the CT image.
図22A~図22Fは、ユーザが画像データと前立腺およびその他の組織領域の自動識別とを検査するためにこの3Dビューアを使用することができる様子を示すものである。ユーザは、図22Bの骨盤領域を注視するためにスライスをめくり、識別されてCT画像上に重ね合わされた前立腺ボリュームおよび骨盤骨ボリュームを色付けされた領域として表すグラフィックスを表示するためにセグメント化層を表示に切り換える。ユーザは、画像をスライスしたり回転させたりして前立腺領域(紫色のボリューム)におけるSPECT画像強度の輝点を観察することができる。 22A-22F illustrate how a user can use this 3D viewer to examine image data and automatic identification of prostate and other tissue regions. The user flips through the slices to gaze at the pelvic region in Figure 22B and clicks the segmentation layer to display graphics representing the identified prostate volume and pelvic bone volume as colored regions overlaid on the CT image. Switch to display. The user can slice and rotate the image to observe bright spots of SPECT image intensity in the prostate region (purple volume).
図23Aおよび図23Bに示されたビューアは、コントラストを改善するとともに放射線技師によるスキャンを模倣するために黒背景を伴うものである。 The viewer shown in FIGS. 23A and 23B is with a black background to improve contrast and mimic scanning by a radiologist.
図24は、様々な摂取メトリックを用いた報告(たとえば自動生成された報告)を示すものである。
D.ユーザインターフェース、品質制御、および報告
FIG. 24 shows a report (eg, an automatically generated report) using various intake metrics.
D. User interface, quality control, and reporting
本明細書で説明されたシステムおよび方法は、ある特定の実施形態では、医師などのユーザ(たとえば放射線技師、技術者)が、患者(対象)の画像をアップロードして、本明細書で説明した手法による自動解析を開始することを可能にする、GUIベースのワークフローの一部分として実施されるものであり、この手法では、前立腺ボリュームが、3D解剖学的画像において識別され、3D機能的画像の対応するボクセルを使用して摂取メトリックを判定するために使用される。次いで、ユーザは、判定された摂取メトリックと、そこから判定された何らかの予後値とを含む、自動解析の結果を観察し得る。ユーザは、品質制御ワークフローを通って導かれ得、自動解析の結果の承認/不承認を選択し、結果が承認された場合には患者向けの報告を生成する。この品質制御ワークフローにより、ユーザは、たとえばGUIとの相互作用によって、自動解析の結果を手動で調整したり更新したりすることができ、手動で更新された結果に基づいて報告を生成することができる。 The systems and methods described herein may, in certain embodiments, allow a user, such as a physician (e.g., radiologist, technician), to upload an image of a patient (subject) and perform the procedures described herein. It is performed as part of a GUI-based workflow that allows automatic analysis to be initiated by the method, in which the prostate volume is identified in the 3D anatomical image and the corresponding 3D functional image. used to determine uptake metrics using voxels. The user may then view the results of the automated analysis, including the determined intake metrics and any prognostic values determined therefrom. The user may be guided through a quality control workflow, selecting to accept/disapprove the results of the automated analysis, and generating a report for the patient if the results are approved. This quality control workflow allows users to manually adjust or update the results of an automated analysis, for example by interacting with a GUI, and to generate a report based on the manually updated results. can.
図25は、ある特定の実施形態においてSPECT画像/CT画像を解析するために使用される例示のワークフロー2500を示すものである。図25に示されるように、ユーザは、2504において、特定の容認された標準フォーマット2502(具体的には図25の例におけるDICOM規格)に準拠するSPECT画像/CT画像をアップロードし得る。図26Aは、2504においてユーザが画像をアップロードすることを可能にするウェブベースのポータルの例示のGUIウィンドウ2600aを示す。図26Bに示す、図26AのGUIウィンドウの更新されたビュー2600bでは、いくつかの画像がアップロード用に選択されて、DICOM規格に準拠することが確認されている。1つの画像がDICOM規格に準拠しないと識別され、2602bに、アップロードできなかったと指示されている。 FIG. 25 illustrates an example workflow 2500 used to analyze SPECT/CT images in certain embodiments. As shown in FIG. 25, a user may upload, at 2504, a SPECT image/CT image that conforms to a particular accepted standard format 2502 (specifically the DICOM standard in the example of FIG. 25). FIG. 26A shows an example GUI window 2600a of a web-based portal that allows users to upload images at 2504. In the updated view 2600b of the GUI window of FIG. 26A, shown in FIG. 26B, several images have been selected for upload and confirmed to be compliant with the DICOM standard. One image is identified as non-compliant with the DICOM standard and indicated at 2602b that it could not be uploaded.
図25に戻って、別のステップ2506において、ユーザは、画像がアップロードされた患者のリストを観察し得る。図27Aは、匿名化された数的識別子によって患者を列記するGUIウィンドウのビュー2700aを示すものである。図27Bは、図27Aに示されたGUIウィンドウの別のビュー2700bを示すものであり、特定の患者に対応する患者のリストの行が選択のために強調されている。図27Cは、このGUIの別のビュー2700cを示すものであり、この特定の患者に対応する行が選択されると、この特定の患者に対して遂行された試験を列記するメニューが、ユーザが試験に関する画像データを再検討したり報告を生成したりすることを可能にする選択可能なボタンを含めて表示される。 Returning to FIG. 25, in another step 2506, the user may view a list of patients whose images have been uploaded. FIG. 27A shows a view 2700a of a GUI window that lists patients by anonymized numerical identifier. FIG. 27B shows another view 2700b of the GUI window shown in FIG. 27A, with the patient list row corresponding to a particular patient highlighted for selection. FIG. 27C shows another view 2700c of this GUI in which, when the row corresponding to this particular patient is selected, a menu listing the tests performed on this particular patient is displayed for the user to select. Displays include selectable buttons that allow review of image data and generation of reports regarding the study.
ある特定の実施形態では、ユーザによる画像データの再検討は、画像データを使用して遂行された任意の自動解析結果とともに、報告を生成するための先行条件である。画像セグメント化の精度を確認するために、ユーザによる画像データおよび自動解析の再検討が必要とされることがある。たとえば、図25に示されるように、ユーザは、2506で患者のリストを観察して患者を選択した後に、次のステップ2508において、本明細書で説明されたように患者の画像データおよび自動処理の結果を再検討する。 In certain embodiments, review of the image data by the user, along with the results of any automated analysis performed using the image data, is a prerequisite to generating the report. A review of the image data and automated analysis by the user may be required to confirm the accuracy of the image segmentation. For example, as shown in FIG. 25, after a user views a list of patients and selects a patient at 2506, in a next step 2508, the user selects the patient's image data and automatically processes the patient as described herein. Reconsider the results.
詳細には、図25に示されるワークフロー2500の再検討ステップ2508において、ユーザは、GUIベースのビューアを使用して、選択された患者に関するSPECT画像データ/CT画像データを診査する。ユーザは、SPECT画像データ/CT画像データを、観察したり診査したりするために、2Dスライスのセットまたは3Dレンダリングとして選択し得る。図28Aに示されたGUIビューア2800のビューでは、SPECT画像データ/CT画像データが2Dスライスのセット2802aとして表示されている。図28Bに示されたGUIベースのビューア2800のビューでは、SPECT画像データ/CT画像データが3Dレンダリング2802bとして表示されている。 In particular, in the review step 2508 of the workflow 2500 shown in FIG. 25, the user uses a GUI-based viewer to examine SPECT/CT image data for the selected patient. A user may select SPECT/CT image data as a set of 2D slices or a 3D rendering for viewing or examination. In the GUI viewer 2800 view shown in FIG. 28A, SPECT image data/CT image data is displayed as a set of 2D slices 2802a. In the view of the GUI-based viewer 2800 shown in FIG. 28B, SPECT image data/CT image data is displayed as a 3D rendering 2802b.
図28Aおよび図28Bに示されるように、GUIビューア2800には、SPECT画像とCT画像が、互いに重ね合わされた選択可能な層として表示されている。ユーザは、SPECT画像および/またはCT画像を単独で観察するために一度に1つの層を選択してよく、またはCT画像上に重ね合わせたSPECT画像を観察するためにCT層とSPECT層の両方を選択してもよい。ユーザは、たとえば、CT画像上に重ね合わされたSPECT画像の特徴を強調するように/強調しないように、SPECT画像の不透明度を調整し得る。ユーザは、本明細書で説明されたように第2の機械学習モジュールによってCT画像の内部の識別された様々な組織領域のロケーションを示すセグメント化層を観察してもよい。このように、ユーザは、第2の機械学習モジュールによって遂行された画像セグメント化を、たとえばCT画像層およびセグメント化層の外観検査によって確認してよい。 As shown in FIGS. 28A and 28B, GUI viewer 2800 displays SPECT images and CT images as selectable layers overlaid on each other. The user may select one layer at a time to view the SPECT and/or CT images alone, or both the CT and SPECT layers to view the SPECT image superimposed on the CT image. may be selected. The user may, for example, adjust the opacity of the SPECT image to emphasize/de-emphasize features of the SPECT image superimposed on the CT image. The user may observe a segmentation layer indicating the location of various tissue regions identified within the CT image by the second machine learning module as described herein. In this way, the user may verify the image segmentation performed by the second machine learning module, for example by visual inspection of the CT image layer and the segmentation layer.
ユーザは、本明細書で説明した自動画像解析手法によって判定された1つまたは複数の摂取メトリックを観察したり確認したりしてもよい。たとえば、図29Aに示されたGUIビュー2900では、GUIのパネル2902が、患者に関して自動的に判定されたTBR値2904を表示している。パネルには、TBR値が臨床的に重要な前立腺がんに関連するものであることを指示する判定されたTBRベースの分類2906も表示されている。 A user may observe or review one or more intake metrics determined by the automated image analysis techniques described herein. For example, in the GUI view 2900 shown in FIG. 29A, a panel 2902 of the GUI displays an automatically determined TBR value 2904 for a patient. The panel also displays a determined TBR-based classification 2906 indicating that the TBR value is associated with clinically significant prostate cancer.
ある特定の実施形態では、ユーザが判定された摂取メトリックを確認するのを支援するために、識別された前立腺ボリュームのボクセルのロケーションを指示するグラフィカル要素がGUIの内部に表示される。たとえば、本明細書で説明されたように、標的強度値の背景強度値に対する比としてTBR値が計算されるとき、識別された前立腺ボリュームに対応するSPECT画像におけるボクセルの最大強度が識別される。したがって、GUIは、SPECT画像の識別された前立腺ボリュームに対応する他のボクセルと比較して、SPECT画像の識別された前立腺ボリュームに対応する、最大の強度を有するボクセルのロケーションを指示するグラフィカル要素を表示し得る。このように、前立腺ボリュームの内部のロケーションに対応する最大のSPECT強度ボクセルの位置がユーザに表示される。次いで、ユーザは、たとえばCT画像と比較したグラフィカル要素の関係を検査することによって、この最大のSPECT強度ボクセルが、実際に対象の前立腺の内部にあることを視覚的に検証し得る。たとえば、図29Aに示されるように、最大のSPECT強度ボクセルのロケーションを識別する十字マークのグラフィカル要素2950、2952、および2954のセットが、画像ビューアに示された2Dスライス上に重ね合わされている。 In certain embodiments, graphical elements are displayed within the GUI that indicate the voxel location of the identified prostate volume to assist the user in confirming the determined uptake metrics. For example, when the TBR value is calculated as the ratio of the target intensity value to the background intensity value, as described herein, the maximum intensity of the voxel in the SPECT image that corresponds to the identified prostate volume is identified. Therefore, the GUI includes a graphical element indicating the location of the voxel with the greatest intensity, corresponding to the identified prostate volume of the SPECT image, compared to other voxels corresponding to the identified prostate volume of the SPECT image. can be displayed. In this way, the location of the maximum SPECT intensity voxel corresponding to the location within the prostate volume is displayed to the user. The user may then visually verify that this maximum SPECT intensity voxel is actually within the subject's prostate, for example by inspecting the relationship of the graphical element compared to the CT image. For example, as shown in FIG. 29A, a set of crosshair graphical elements 2950, 2952, and 2954 identifying the location of the maximum SPECT intensity voxel are superimposed on the 2D slice shown in the image viewer.
図25に戻って、別のステップ2510において、ユーザは、アップロードされたSPECT画像/CT画像を使用して、患者について遂行された解析を要約する報告を生成することを選択してよく、品質制御ワークフローを通って導かれ得る。たとえば、図29Aに示されるように、ユーザはGUIの報告生成ボタン2908を選択してよい(たとえばクリックしてよい)。ユーザが報告生成ボタン2908を選択すると、図29Bに示されるように、品質制御グラフィカルウィジェット2910が表示される。品質制御グラフィカルウィジェット2910は、ユーザを、様々な容認基準が満たされるかどうかを確認するように導き得る。たとえば、品質制御グラフィカルウィジェット2910は、ユーザを、画像要件が満たされていること、およびTBR値を判定するのに使用される標的値および背景値が正確であることを確認するように導く。ユーザは、自動解析の結果を、ボタン2912を選択することによって承認してよく、またはボタン2914を選択することによって不承認としてもよい。 Returning to FIG. 25, in another step 2510, the user may elect to use the uploaded SPECT/CT images to generate a report summarizing the analysis performed on the patient, including quality control Can be guided through the workflow. For example, as shown in FIG. 29A, a user may select (eg, click) a generate report button 2908 in the GUI. When the user selects the generate report button 2908, a quality control graphical widget 2910 is displayed, as shown in FIG. 29B. Quality control graphical widget 2910 may guide the user to confirm whether various acceptance criteria are met. For example, quality control graphical widget 2910 guides the user to ensure that image requirements are met and that target and background values used to determine TBR values are accurate. The user may approve the results of the automatic analysis by selecting button 2912 or disapprove by selecting button 2914.
図25に示されるように、品質制御確認のユーザ承認2512の後に、患者に関する報告2532を生成するために、自動査定の結果2514が使用される。図29Cに示されるように、ユーザは、報告を生成する前に、品質制御の承認を確認することを要求するウィジェット2916が提示され得る。図29Dは例示の報告2900dを示すものである。報告は、品質制御を承認して報告2920に署名したユーザの識別とともに、品質制御の基準2918の識別を含み得る。 As shown in FIG. 25, after user approval 2512 of quality control confirmation, the results 2514 of the automated assessment are used to generate a report 2532 regarding the patient. As shown in FIG. 29C, the user may be presented with a widget 2916 requesting to confirm quality control approval before generating the report. FIG. 29D shows an example report 2900d. The report may include the identification of the quality control criteria 2918 along with the identification of the user who approved the quality control and signed the report 2920.
図25に示されるように、2516において、ユーザが、摂取メトリックの自動判定(たとえばTBR)を不承認とすると、品質制御ウィジェットは、導かれた査定2518のワークフローを開始してよい。導かれた査定のワークフローでは、ユーザは、GUIとの手動の相互作用によって、1つまたは複数の摂取メトリックを判定するのに使用される値を手動で更新し得る。ユーザは、患者に関する画像が、摂取メトリックを正確に判定するためには使用することができないと指示する入力も与えてよく、品質制御ウィジェットによって受け取られてもよい。たとえば、品質制御の不承認に対応するユーザ入力に続いて、図29Eに示されるものなどのGUI要素がユーザに提示されてよい。図29Eに示されるGUI要素2900eにより、ユーザは、ボタン2922を選択することによって、患者向けにTBR値が判定され得ないことを選択すること、またはボタン2924を選択することによって、TBR値を計算するために使用される標的強度値および背景強度値を手動で更新することを選択することが可能になる。 As shown in FIG. 25, at 2516, if the user disapproves the automatic determination of an intake metric (eg, TBR), the quality control widget may initiate a guided assessment 2518 workflow. In a guided assessment workflow, a user may manually update the values used to determine one or more intake metrics through manual interaction with the GUI. The user may also provide input, which may be received by the quality control widget, indicating that images associated with the patient cannot be used to accurately determine uptake metrics. For example, following user input corresponding to a quality control disapproval, a GUI element such as that shown in FIG. 29E may be presented to the user. GUI element 2900e shown in FIG. 29E allows the user to select that a TBR value cannot be determined for the patient by selecting button 2922 or to calculate a TBR value by selecting button 2924. It will be possible to choose to manually update the target and background intensity values used to
たとえば、ユーザは、(たとえば画像の外観検査によって)画像を、TBR値を正確に判定するために使用するには品質が低すぎると判定した場合には、GUI要素2900eにおけるボタン2922を選択して、この事例を評価できないものと識別し得る。図25に示されるように、2520において、この事例は評価できないとのユーザの識別を受け取るのに続いて、2530において、この事例は評価できないものと印をつけられ、品質制御が不合格とされたものと識別する報告2532が生成される。図29Fは、品質制御が不合格とされたものとして識別するような報告に含まれ得るグラフィックスおよびテキスト2900fの例を示すものである。 For example, if the user determines (e.g., by visual inspection of the image) that the image is of too low quality to be used to accurately determine the TBR value, the user may select button 2922 in GUI element 2900e. , this case can be identified as unevaluable. As shown in FIG. 25, following receiving the user's identification that this case cannot be evaluated at 2520, the case is marked as not evaluable and quality control is failed at 2530. A report 2532 is generated that identifies the FIG. 29F shows an example of graphics and text 2900f that may be included in a report that quality control identifies as failed.
ある特定の実施形態では、ユーザは、GUIとの手動の相互作用によってTBR値を判定するために使用される標的強度値および/または背景強度値を更新することを決定してよい。2522において、ユーザが標的強度値および/または背景強度値を更新しようとしていることを指示するユーザ入力が受け取られると、ユーザは、2524における標的値の手動設定および/または2526における背景値の手動設定に導かれる。図29Gは、ユーザに表示された、標的値および/または背景値を設定することを可能にする手動入力のグラフィカルウィジェットのビュー2900gを示す。ユーザは、ボタン2926をクリックして、GUIとの相互作用によって手動で標的強度値を設定し得る。ユーザがボタン2926を選択すると、TBR値を計算する際に最大の強度ボクセルとして使用されるSPECT画像のボクセルを選択することを可能にする、ボクセル選択のグラフィカル要素が提示される。たとえば、ユーザには、SPECT画像およびCT画像における位置決めを可能にする、図29Aに示される十字マークなど可動の十字マークが提供され得る。ユーザは、十字マークを移動させ、かつ/またはビューアの内部のロケーションをクリックして、最大の強度ボクセルとして使用する特定のボクセルを選択し得る。図29Hに示されるように、更新された手動入力のグラフィカルウィジェットのビュー2900hには、更新されたTBR値を計算するための更新された標的強度値として使用される、選択された最大強度ボクセルの強度値2930が示されている。 In certain embodiments, a user may decide to update the target intensity value and/or background intensity value used to determine the TBR value by manual interaction with the GUI. At 2522, when user input is received indicating that the user is updating the target intensity value and/or background intensity value, the user manually sets the target value at 2524 and/or manually sets the background value at 2526. guided by. FIG. 29G shows a view 2900g of a manual input graphical widget displayed to the user that allows the user to set target and/or background values. A user may click button 2926 to manually set the target intensity value by interacting with the GUI. When the user selects button 2926, a voxel selection graphical element is presented that allows the user to select the voxel of the SPECT image to be used as the maximum intensity voxel in calculating the TBR value. For example, the user may be provided with a moveable cross mark, such as the cross mark shown in FIG. 29A, that allows positioning in SPECT and CT images. The user may move the crosshair and/or click a location within the viewer to select a particular voxel to use as the maximum intensity voxel. As shown in FIG. 29H, the updated manual input graphical widget view 2900h includes the selected maximum intensity voxels that are used as updated target intensity values to calculate the updated TBR value. An intensity value of 2930 is shown.
ユーザは、ボタン2928を選択して、TBR値を計算する際に使用する背景値を設定してもよい。ユーザがボタン2928を選択するとボクセル選択要素が提示され、ユーザは、左殿筋に属するものとして識別する複数のボクセルを(たとえばGUIビューアに表示されたCT画像層および/またはセグメント化層の外観検査に基づいて)選択するように導かれ得る。TBRを計算するための背景強度値が左殿筋の内部の物理的位置に対応するSPECT画像の複数のボクセルの強度にわたる平均値であるので、ユーザは、正確な背景強度値が判定されることを保証するために十分な数のボクセルを選択するように導かれてよい。たとえば、図29Hの手動入力のグラフィカルウィジェットのビュー2900hに示されるように、ユーザが更新の背景強度値を判定する際に使用するボクセルを選択しているとき、複数の試料が背景強度2932の更新された値とともに表示され得る。ある特定の実施形態では、ユーザは、少なくとも所定の数(たとえば100)の試料を選択することを要求され、表示された背景強度値および試料の数2932は、十分な数の試料が選択されたことをユーザに知らせるための可視指示(たとえば発色変化)を含む。 The user may select button 2928 to set a background value to use when calculating the TBR value. When the user selects button 2928, a voxel selection element is presented, and the user selects a plurality of voxels that he identifies as belonging to the left gluteus muscle (e.g., by visual inspection of the CT image layer and/or segmentation layer displayed in the GUI viewer). (based on). Since the background intensity value for calculating TBR is an average value over the intensity of multiple voxels of the SPECT image corresponding to the physical location inside the left gluteus muscle, the user can determine the exact background intensity value. may be guided to select a sufficient number of voxels to ensure that For example, as shown in manual input graphical widget view 2900h of FIG. 29H, when a user is selecting voxels to use in determining background intensity values for updates, multiple samples may be used to update background intensity 2932. may be displayed with the specified value. In certain embodiments, the user is required to select at least a predetermined number (e.g., 100) of samples, and the displayed background intensity value and number of samples 2932 indicate that a sufficient number of samples have been selected. Contains a visual indication (for example, a color change) to notify the user.
図25に戻って、ユーザが、更新された標的値および/または更新された背景強度値の手動入力を完了すると、更新された値を使用して、更新されたTBR値が計算され、半自動査定2528として記憶される。次いで、半自動査定の結果を使用して報告2532が生成され得る。
E.例示のクラウドベースアーキテクチャおよびサービス構成
Returning to FIG. 25, once the user completes manual input of the updated target value and/or updated background intensity value, the updated values are used to calculate the updated TBR value and semi-automated assessment. 2528. A report 2532 may then be generated using the results of the semi-automated assessment.
E. Example cloud-based architecture and service configuration
本明細書で説明されたシステムおよび方法は、ある特定の実施形態ではクラウドベースのアプリケーションとして実施される。クラウドベースのアプリケーションは、ユーザから入力を受け取って画像データおよび結果を提示するためのインターフェースをもたらす、クライアントと対面するモジュールなどの様々な機能性を実施するために、複数のモジュールを使用し得る。クライアントと対面するモジュールは、次に、本明細書で説明されたように前立腺ボリュームを識別して摂取メトリックを計算するように自動化された画像セグメント化を遂行するためのセグメント化サービスモジュールなど、他のモジュールとインターフェースをとってよい。 The systems and methods described herein are implemented as cloud-based applications in certain embodiments. A cloud-based application may use multiple modules to implement various functionality, such as a client-facing module that receives input from a user and provides an interface for presenting image data and results. The client-facing module then performs other operations, such as a segmentation service module to perform automated image segmentation to identify prostate volume and calculate uptake metrics as described herein. may interface with other modules.
図30は、本明細書でクラウドベースのアプリケーションとして説明されたシステムおよび方法を実施するための例示のマイクロサービスネットワークアーキテクチャ3000を示すものである。この特定の例示のマイクロサービスネットワークは、本明細書で説明されたようなPioneerと称される例示のクラウドベースのアプリケーションに使用されるものである。図30の例示のマイクロサービスネットワークアーキテクチャ3000では、マイクロサービスPioneerウェブ3016はクライアントと対面するモジュールであり、(たとえばjavascriptおよびHTMLなどのコード命令にサーブすることによって)クライアント3026に対して記憶画像および解析結果と相互作用するためのインターフェースを提供するものである。図30に示されるように、Pioneerウェブ3016はまた、他のマイクロサービスと通信する。監査サービス3014は、イベントをログし、イベントログをログファイル記憶データベース3012に保存する。Cognito 3020はユーザを記憶し認証する。Authサービス3022はユーザ群およびカスタマ製品登録を追跡する。署名による登録サービス3024は、ユーザが、たとえばクラウドベースのシステムの使用に参加することを可能にするフロントエンドのサービスである。スライスボックス3004は、CT画像などの3D解剖学的画像ならびにSPECT画像およびPET画像などの3D機能的画像を含む、標準化されたDICOMフォーマットの画像ファイルを記憶する。画像は画像記憶データベース3002に記憶される。画像サービス3006は、画像(たとえばDICOMファイル)を読み取って特定の(たとえば好都合な、たとえば標準化された)フォーマットで画像および画像メタデータを記憶する。セグメント化サービス3010は、本明細書で説明されたような自動化された画像セグメント化および摂取メトリック判定を遂行する。セグメント化サービス3010は、画像サービス3006によって準備された画像データをデータ記憶データベース3008から取り出し、画像セグメント化および摂取メトリック判定を遂行して、結果をデータ記憶データベース3008に記憶する。 FIG. 30 illustrates an example microservices network architecture 3000 for implementing the systems and methods described herein as cloud-based applications. This particular example microservices network is that used for an example cloud-based application called Pioneer as described herein. In the example microservice network architecture 3000 of FIG. 30, the microservice Pioneer web 3016 is a client-facing module that stores images and analyzes data for the client 3026 (e.g., by serving code instructions such as javascript and HTML). It provides an interface for interacting with the results. As shown in Figure 30, Pioneer web 3016 also communicates with other microservices. Audit service 3014 logs events and saves the event log in log file storage database 3012 . Cognito 3020 remembers and authenticates users. Auth service 3022 tracks user populations and customer product registrations. Registration by signature service 3024 is a front-end service that allows users to participate in the use of, for example, a cloud-based system. Slice box 3004 stores image files in standardized DICOM format, including 3D anatomical images such as CT images and 3D functional images such as SPECT and PET images. Images are stored in image storage database 3002. Image service 3006 reads images (eg, DICOM files) and stores images and image metadata in a particular (eg, convenient, eg, standardized) format. Segmentation service 3010 performs automated image segmentation and ingestion metric determination as described herein. Segmentation service 3010 retrieves image data prepared by image service 3006 from data storage database 3008, performs image segmentation and ingestion metric determination, and stores the results in data storage database 3008.
図30に示されるアーキテクチャは、公的に利用可能なデータセンタを含む種々のデータセンタにおいて、本明細書で説明されたアプリケーションおよびプラットフォームを実施するために使用され得るものである。データセンタは、サーバおよびネットワークの形態のインフラストラクチュアを提供し、たとえばネットワーキング、メッセージング、認証、ロギング、および記憶ためのサービスを提供する。アプリケーション用のアーキテクチャ3000は、マイクロサービスと称される範囲を限定された一連の機能ユニットを使用する。各マイクロサービスは、画像記憶、リスク指数の計算、医用画像タイプの識別、および他のタスクなどタスクの孤立集合を扱う。サービス(たとえばマイクロサービス)は、ハイパーテキスト転送プロトコル(HTTP)などの標準プロトコールを使用して互いに通信することができる。図30のアーキテクチャ3000に示されるように、アプリケーションをマイクロサービスのネットワークへと編成すると、プラットフォームの各部分が、高需要を満たすとともに最小限のダウンタイムを保証するように、個々にスケーリングされ得る。ある特定の実施形態では、そのようなアーキテクチャにより、アプリケーションの他の部分、または他のものとともにアプリケーションを含むプラットフォームに影響を及ぼすことなく、構成要素の改善または交換が可能になる。 The architecture shown in FIG. 30 may be used to implement the applications and platforms described herein in a variety of data centers, including publicly available data centers. Data centers provide infrastructure in the form of servers and networks, providing services such as networking, messaging, authentication, logging, and storage. The architecture 3000 for applications uses a set of limited scope functional units called microservices. Each microservice handles an isolated set of tasks, such as image storage, risk index calculation, medical image type identification, and other tasks. Services (eg, microservices) may communicate with each other using standard protocols such as Hypertext Transfer Protocol (HTTP). As shown in architecture 3000 of FIG. 30, by organizing applications into a network of microservices, each part of the platform can be scaled individually to meet high demands and ensure minimal downtime. In certain embodiments, such an architecture allows improvements or replacement of components without affecting other parts of the application or the platform that includes the application along with others.
図31は、図30に示されたものなどのマイクロサービスネットワークを使用してCT画像/SPECT画像の自動セグメント化および解析を遂行するための、例示のデータフロー3100を示すブロック流れ図である。ユーザによってアップロードされた画像はスライスボックス3110に記憶される。ユーザは、たとえばクライアント3102aによるPioneerウェブ3104aとの相互作用によって、自動化された画像セグメント化および解析を開始するために試験(たとえば患者の画像)の処理を開始してよい。試験の処理は、(たとえば画像のアップロードに続いて、たとえば一定の時間間隔で)自動的に開始されてもよい。図31に示されるように、試験の処理が開始されると、Pioneerウェブ3104aは、自動セグメント化および解析のための画像データの準備(たとえば前処理、たとえばフォーマッティング)を開始するために画像サービス3106と相互作用する。画像サービス3106は、前処理された画像をデータベースS3 3112に保存する。Pioneerウェブ3104aは、(たとえばSQSメッセージを送ることによって)セグメント化サービスによる画像セグメント化および解析を開始する。セグメント化サービス3108は、S3 3112から、CT画像/SPECT画像など、3D解剖学的画像および3D機能的画像を含む画像データを取り込む。セグメント化サービス3108は、本明細書で説明されたように、3D解剖学的画像の内部で前立腺ボリュームを含む組織ボリュームを識別するための画像セグメント化を遂行し、識別された組織ボリュームおよび3D機能的画像を使用して1つまたは複数の摂取メトリックを計算する。自動化された画像セグメント化および摂取メトリック判定の結果はS3 3112に保存される。セグメント化サービスは、結果がうまく得られたかそれとも誤り/例外が生じたかということを指示するコールバックをPioneerウェブ3104aにポストする。Pioneerウェブ3104aは、コールバックを受け取ると、チャネルPubsub 3118上に、試験に関する更新された状態を公開する。複数のPioneerウェブサービス3104aおよび3104bは、試験に関する状態更新を受け取ってクライアント3102aおよび3102bに状態更新を通知してよく、こうすることによってクライアント3102aおよび3102bと相互作用する。 FIG. 31 is a block flow diagram illustrating an example data flow 3100 for performing automatic segmentation and analysis of CT/SPECT images using a microservices network such as that shown in FIG. Images uploaded by the user are stored in slice box 3110. A user may initiate processing of a study (eg, a patient image) to initiate automated image segmentation and analysis, eg, by interaction with Pioneer web 3104a by client 3102a. Test processing may be initiated automatically (eg, following image upload, eg, at regular time intervals). As shown in FIG. 31, once processing of the test begins, the Pioneer web 3104a sends the image service 3106 to begin preparing (e.g., preprocessing, e.g., formatting) the image data for automated segmentation and analysis. interact with Image service 3106 stores the preprocessed images in database S3 3112. Pioneer web 3104a initiates image segmentation and analysis with the segmentation service (eg, by sending an SQS message). Segmentation service 3108 captures image data from S3 3112, including 3D anatomical and 3D functional images, such as CT images/SPECT images. Segmentation service 3108 performs image segmentation to identify tissue volumes, including prostate volumes, within a 3D anatomical image, and identifies identified tissue volumes and 3D features, as described herein. calculate one or more intake metrics using the target image. The results of automated image segmentation and ingestion metric determination are stored in S3 3112. The segmentation service posts a callback to the Pioneer web 3104a indicating whether the result was successful or an error/exception occurred. Upon receiving the callback, Pioneer web 3104a publishes updated status regarding the exam on channel Pubsub 3118. Pioneer web services 3104a and 3104b may receive status updates regarding the exam and notify clients 3102a and 3102b of the status updates, thereby interacting with clients 3102a and 3102b.
図32は、マイクロサービス間のデータの流れ3200を示すものであり、クライアントが、図31を参照しながら上記で説明されたのと類似のやり方で試験の状態を要求して、試験状態更新の通知を受け得る様子を示す。図32に示されるように、クライアント3202は、Pub/Subチャネル3212を介して状態更新を受け取るPioneerウェブサービスインスタンス3204に試験idを送ってよい。Pioneerウェブには、あらゆるセグメント化サービス3208から、完了した計算(たとえば、本明細書で説明されたように完了した画像セグメント化および摂取メトリック解析)に関するコールバックが入り得る。試験のための完了した計算に関する状態はデータベース3210に保存されてよく、試験に関する更新された状態はPub/Subチャネル3212に送られる。すべてのPioneerウェブインスタンス(たとえば3204および3206)が状態更新を申し込み、相互作用するクライアント3202に状態更新(たとえば試験のための完了した計算の通知)を供給してよい。 FIG. 32 shows data flow 3200 between microservices in which a client requests the state of a test in a manner similar to that described above with reference to FIG. Indicates how you can receive notifications. As shown in FIG. 32, client 3202 may send the test id to Pioneer web service instance 3204, which receives state updates via Pub/Sub channel 3212. Pioneer Web may receive callbacks from any segmentation service 3208 regarding completed calculations (eg, completed image segmentation and ingestion metric analysis as described herein). Status regarding completed calculations for the test may be saved in database 3210 and updated status regarding the test is sent to Pub/Sub channel 3212. All Pioneer web instances (eg, 3204 and 3206) may subscribe to state updates and provide state updates (eg, notifications of completed computations for testing) to interacting clients 3202.
たとえば図30および図31に関して上記で説明されたようなある特定の実施形態では、本明細書で説明されたシステムおよび方法の実装形態が含み得る画像サービスモジュールは、たとえば自動化された画像セグメント化および摂取メトリック判定を遂行するセグメント化サービスに対して、適切にフォーマットされた画像データを供給するために、画像データの前処理およびフォーマッティングを遂行する。 In certain embodiments, such as those described above with respect to FIGS. 30 and 31, image services modules that implementations of the systems and methods described herein may include, e.g., automated image segmentation and Preprocessing and formatting of the image data is performed to provide appropriately formatted image data to the segmentation service that performs the ingestion metric determination.
画像サービスモジュールは、画像を標準化したりフォーマットしたりするために、3D機能的画像および3D解剖学的画像を含む様々なモダリティからの異なった画像を前処理してよい。たとえば、3D機能的画像(たとえばSPECT画像などの核医学画像)を前処理するステップは、基本的コンプライアンスチェックを遂行するステップと、ボクセル強度値を、標準フォーマット(たとえばDICOM PS3 NM画像IOD)において規定されているように解釈するステップとを含み得る。3D機能的画像のフレームは、頭部から足への順番など、対象に沿った方向に対応する特定の順番に配置されてよい。位置は第1のボクセルの外側コーナーを表すように調整されてよい。さらなる処理に必要となる可能性がある3D機能的画像からの属性も抽出されてよい。 The image services module may preprocess different images from various modalities, including 3D functional images and 3D anatomical images, to standardize and format the images. For example, preprocessing a 3D functional image (e.g., a nuclear medicine image, such as a SPECT image) includes performing basic compliance checks and defining voxel intensity values in a standard format (e.g., DICOM PS3 NM Image IOD). and a step of interpreting it as if it were. The frames of the 3D functional image may be arranged in a particular order that corresponds to a direction along the object, such as from head to feet. The position may be adjusted to represent the outer corner of the first voxel. Attributes from the 3D functional image that may be required for further processing may also be extracted.
CT画像など3D解剖学的画像の前処理は、基本的コンプライアンスチェックを遂行するステップと、ボクセル強度値を標準フォーマット(たとえばDICOM PS3 NM画像IOD)において規定されているように解釈するステップとを含み得る。3D解剖学的画像のスライスは、頭部から足への順番など、対象に沿った方向に対応する特定の順番に配置されてよい。撮像された患者のまわりの空気に対応する3D解剖学的画像の1つまたは複数の領域を除去するためのクロップする境界も判定されてよい。位置は第1のボクセルの外側コーナーを表すように調整されてよい。さらなる処理に必要となる可能性がある3D解剖学的画像からの属性も抽出されてよい。 Pre-processing of 3D anatomical images, such as CT images, includes performing basic compliance checks and interpreting voxel intensity values as specified in a standard format (e.g. DICOM PS3 NM Image IOD). obtain. The slices of the 3D anatomical image may be arranged in a particular order that corresponds to a direction along the object, such as from head to feet. Cropping boundaries may also be determined to remove one or more regions of the 3D anatomical image that correspond to air around the imaged patient. The position may be adjusted to represent the outer corner of the first voxel. Attributes from the 3D anatomical image that may be required for further processing may also be extracted.
図33が示すアーキテクチャ3300は、クラウドベースのアプリケーションが本明細書で説明された画像セグメント化および解析手法を実施する様子を例示するものであり、クライアント/ユーザによって複数の画像解析アプリケーションのために使用され得るクラウドベースのプラットフォームを提供するために、他のタイプの画像解析を遂行するための他のシステムと組み合わされ得る。図33に示されるアーキテクチャ3300は、2つまたはそれよりも多くのアプリケーション間で共用のマイクロサービスのセット3320を含む。左側のパネル3310および右側のパネル3330は2つのアプリケーションにおけるマイクロサービスを示す。マイクロサービスネットワーク3330は、本明細書で説明されたようなPioneerクラウドベースアプリケーションのバージョンを実施して、CT画像/SPECT画像の自動解析と、TBRなどの摂取メトリックの計算と、報告の生成とを提供するものである。左パネルに示されたマイクロサービスネットワーク3310によって実施されるウェブベースのアプリケーションは、aBSIと称され、ガンマカメラで得られる全身スキャンを解析して、自動化された骨スキャンインデックス(BSI)を計算するものである。aBSIおよび自動BSI判定に関するさらなる詳細は、2017年10月10日出願の米国特許出願第15/794,220号に与えられており、その内容の全体が参照によって本明細書に組み込まれる。
F.他の目的標的ボリュームの識別および摂取メトリックの計算
FIG. 33 depicts an architecture 3300 illustrating how a cloud-based application implements the image segmentation and analysis techniques described herein and may be used by a client/user for multiple image analysis applications. can be combined with other systems to perform other types of image analysis to provide a cloud-based platform that can be used to perform other types of image analysis. The architecture 3300 shown in FIG. 33 includes a set of microservices 3320 that are shared between two or more applications. Left panel 3310 and right panel 3330 show microservices in two applications. Microservices network 3330 implements a version of the Pioneer cloud-based application as described herein to perform automated analysis of CT/SPECT images, calculation of uptake metrics such as TBR, and generation of reports. This is what we provide. The web-based application implemented by the microservices network 3310 shown in the left panel, called aBSI, analyzes whole body scans obtained with a gamma camera to calculate an automated bone scan index (BSI). It is. Further details regarding aBSI and automated BSI determination are provided in U.S. patent application Ser. No. 15/794,220, filed October 10, 2017, the entire contents of which are incorporated herein by reference.
F. Identification of other objective target volumes and calculation of uptake metrics
図34に関して、本明細書で説明された手法は他の標的ボリューム(たとえば肺、リンパ節、骨、肝臓)を識別するために使用されてよい。他の画像タイプが使用され得る。3D機能的画像を生成するために様々な放射性医薬品が使用され得る。たとえば、ある特定の実施形態ではSPECT画像用に使用される造影剤は1404であり、ある特定の実施形態ではPET画像用に使用される造影剤はPyLである。一実施形態では、たとえばリンパ節といった組織における疾患(たとえば腫瘍)を検知するために、対象の全身にわたって撮像が遂行される。腫瘍の総数および/またはサイズならびに/あるいは病変組織(たとえばがん)の転移および/または量に関連した別のメトリックが、本明細書で説明した方法を使用して自動的に判定される。たとえば、プロセス3400では、ステップ3402において3D解剖学的画像が受け取られ、ステップ3404において対応する3D機能的画像が受け取られる。3408における第2のCNNによる詳細なセグメント化のために、3406において、初期の3D解剖学的画像の1つまたは複数の小領域を効率的に識別するように第1のCNNが使用されてよく、3410において、全体の造影剤摂取を定量化するため、ならびに/あるいは対象の疾患のレベルおよび/または程度を表す計算されたメトリックを提供するために、対応する3D機能的画像が、識別された1つまたは複数の小領域の内部で解析される。 With respect to FIG. 34, the techniques described herein may be used to identify other target volumes (eg, lungs, lymph nodes, bone, liver). Other image types may be used. Various radiopharmaceuticals can be used to generate 3D functional images. For example, in certain embodiments, the contrast agent used for SPECT images is 1404, and in certain embodiments, the contrast agent used for PET images is PyL. In one embodiment, imaging is performed throughout the subject's entire body to detect disease (eg, a tumor) in tissue, such as a lymph node. Other metrics related to the total number and/or size of tumors and/or metastasis and/or amount of diseased tissue (eg, cancer) are automatically determined using the methods described herein. For example, in process 3400, a 3D anatomical image is received at step 3402 and a corresponding 3D functional image is received at step 3404. The first CNN may be used to efficiently identify one or more subregions of the initial 3D anatomical image at 3406 for detailed segmentation by the second CNN at 3408. , 3410, corresponding 3D functional images were identified to quantify overall contrast uptake and/or to provide calculated metrics representative of the level and/or extent of the disease of interest. Analyzed within one or more subregions.
(実施例1)
G.実施例1:SPECT撮像/CT撮像からの前立腺のPSMA摂取の自動検出および定量化
この例では、前立腺がんの臨床的に重要な疾患を検知するために、前立腺特異的膜抗原(PSMA)の小分子抑制剤である99mTc MIP-1404が使用された。この例の目的は、SPECT画像/CT画像における前立腺のMIP-1404摂取を自動検出して定量化するための深層学習モデルを開発することであった。
(Example 1)
G. Example 1: Automated detection and quantification of prostate PSMA uptake from SPECT/CT imaging In this example, prostate specific membrane antigen (PSMA) A small molecule inhibitor, 99mTc MIP-1404, was used. The purpose of this example was to develop a deep learning model to automatically detect and quantify prostate MIP-1404 uptake in SPECT/CT images.
CT画像から前立腺および骨盤骨を自動的にセグメント化するための畳み込みニューラルネットワークに基づいて深層学習アルゴリズムが開発された。このアルゴリズムは、手動の相互作用を必要とすることなく、高用量および低用量のCT画像ならびに身体の全体および一部分の視野を処理するように設計されたものである。訓練資料は、関連する解剖学的領域に対して手動で遂行された完全なセグメント化および別個のセグメント化を伴う100の診断用CT画像(すべて男性)からなるものであった。このアルゴリズムは、全員が前立腺全摘出術前にPSMA撮像を経験した危険度の高い102人の前立腺がん患者を含むMIP-1404の第2相試験で確認された。すべての確認スキャンは、OsiriX医用画像ビューア(Pixmeo SARL)を手動で使用して、前立腺の内部で視覚的に判定された最大の摂取値を有するスライスおよび領域に配置された円形のROIにおける最大の摂取を測定することによって定量化された。この自動化アルゴリズムは、前立腺のすべてのボクセルにおける摂取を測定するために自動化アルゴリズムの体積セグメント化を使用するものであり、最大の摂取を記録する。前立腺の摂取の手動定量化と自動定量化との間の一致を査定するためにピアソンの相関係数を使用した。 A deep learning algorithm was developed based on convolutional neural networks to automatically segment the prostate and pelvic bones from CT images. The algorithm was designed to process high-dose and low-dose CT images and whole and partial body views without the need for manual interaction. The training material consisted of 100 diagnostic CT images (all male) with complete segmentation and separate segmentation performed manually on the relevant anatomical regions. This algorithm was validated in a phase 2 trial of MIP-1404, which included 102 high-risk prostate cancer patients, all of whom underwent PSMA imaging prior to radical prostatectomy. All validation scans were performed manually using the OsiriX medical image viewer (Pixmeo SARL) to determine the maximum in a circular ROI placed in the slice and region with the maximum uptake value determined visually inside the prostate. Quantified by measuring uptake. This automated algorithm uses volume segmentation of the automated algorithm to measure uptake in every voxel of the prostate, recording the maximum uptake. Pearson's correlation coefficient was used to assess agreement between manual and automated quantification of prostate uptake.
この訓練資料に基づくアルゴリズムは270万のパラメータを有しており、Adam(勾配降下の変異)を使用して最適化された。テストセットにおいて、過度のCTアーチファクト、不完全なデータ、および/またはデータフォーマットの問題のために、34人の患者(33%、34/102)の1404の画像が除外された。評価できる患者(N=68)の計算時間は、商品ハードウェアに対して(1つの事例ごとに)13秒であった。自動化された最大の摂取値は、前立腺において手動で得られた値に対してかなり相関があった(相関係数=0.95、95%信頼区間=[0.91,0.97];勾配=0.89、95%信頼区間=[0.80,0.98];p<0.0001)。このアルゴリズムは決定性であって完全に自動化され、再現性は100%であった。 The algorithm based on this training material has 2.7 million parameters and was optimized using Adam (Mutation of Gradient Descent). In the test set, 1404 images of 34 patients (33%, 34/102) were excluded due to excessive CT artifacts, incomplete data, and/or data format issues. Computation time for evaluable patients (N=68) was 13 seconds (per case) for commodity hardware. The automated maximum uptake values were significantly correlated to the manually obtained values in the prostate (correlation coefficient = 0.95, 95% confidence interval = [0.91, 0.97]; slope = 0.89, 95% confidence interval = [0.80, 0.98]; p < 0.0001). The algorithm was deterministic and fully automated, with 100% reproducibility.
この例は、前立腺におけるMIP-1404摂取の客観的かつ自動化された測定の実現可能性を明示するものである。
(実施例2)
H.実施例2:自動セグメント化および摂取メトリック判定の技術的性能および臨床成績
This example demonstrates the feasibility of objective and automated measurement of MIP-1404 uptake in the prostate.
(Example 2)
H. Example 2: Technical performance and clinical performance of automatic segmentation and intake metric determination
実施例2は、Pioneerと称される例示のクラウドベースのアプリケーションによって実施される、本明細書で説明した自動化された画像セグメント化および摂取メトリック判定手法の一実施形態の技術的性能および臨床成績の評価を示すものである。Pioneer用のアルゴリズムを生成する仮説を確立するために、健康なボランティア(第1相試験:MIP-1404-1301)と前立腺全摘出術の後に入手可能な病理組織診断データを有する前立腺がん患者(第2相試験:MIP-1404-201)とを含む2つの臨床研究からのMIP-1404のSPECT画像データ/CT画像データが使用された。Pioneerによって生成された、受信者動作特性プロット(ROC)、感度、特異度、正負予測値を、従来の手読みによって得られたものと比較するデータは、PioneerがMIP-1404の画像解釈において放射線技師を支援する有効なツールであり得、それによって前立腺がん患者の評価が容易になることを示した。
i.技術的性能
Example 2 describes the technical performance and clinical performance of one embodiment of the automated image segmentation and uptake metric determination technique described herein, implemented by an exemplary cloud-based application called Pioneer. It shows the evaluation. To establish the hypotheses that generate the algorithms for Pioneer, we tested healthy volunteers (Phase 1 study: MIP-1404-1301) and prostate cancer patients with available histopathology data after radical prostatectomy ( SPECT/CT image data of MIP-1404 from two clinical studies including Phase 2 study: MIP-1404-201) was used. Data comparing receiver operating characteristic plots (ROC), sensitivity, specificity, and positive and negative predictive values generated by Pioneer with those obtained by traditional manual reading show that Pioneer We have shown that it can be an effective tool to support technicians, thereby facilitating the evaluation of prostate cancer patients.
i. technical performance
このアルゴリズムのセグメント化および定量化の性能基準の解析的検証および動機付けは、それぞれOTHA-2262およびOTHA-2263において詳述されているようにあらかじめ定義されていた。総計61の1404のSPECT画像/CT画像および核医学医師から読み取れた医療のための基準が、解析的性能を評価するためのベンチマークとして使用された。すべての手読みは、別々に、技術的性能の容認基準に対して盲検的に行われた。 Analytical validation and motivation for the segmentation and quantification performance criteria of this algorithm were previously defined as detailed in OTHA-2262 and OTHA-2263, respectively. A total of 61 1404 SPECT/CT images and medical standards read from nuclear medicine physicians were used as benchmarks to evaluate analytical performance. All manual readings were performed independently and blinded to technical performance acceptance criteria.
前立腺セグメント化の性能テストは、0.77の平均ダイスおよび0.012の標準偏差を明示した。片側95%信頼区間の下限点は0.75であり、OTHA-2262における既定の閾値(0.70)よりも大きい。背景(左大臀筋)セグメント化の性能テストは、0.94の平均ダイスおよび0.002の標準偏差を明示した。片側95%信頼区間の下限点は0.94であり、OTHA-2262における既定の閾値(0.80)よりも大きい。 Prostate segmentation performance testing revealed a mean die of 0.77 and a standard deviation of 0.012. The lower limit of the one-sided 95% confidence interval is 0.75, which is greater than the default threshold (0.70) in OTHA-2262. Performance testing of the background (left gluteus maximus) segmentation revealed a mean die of 0.94 and a standard deviation of 0.002. The lower limit of the one-sided 95% confidence interval is 0.94, which is greater than the default threshold (0.80) in OTHA-2262.
自動化されたPioneerソフトウェアによって予測された合計61の標的ロケーションのうち、人間の熟達者(核医学閲覧者)によって不完全なものと分類されたのは4つ(6.6%)だけであった。この結果は、OTHA-2263の規定(10%の不合格)よりも優れたものであった。
ii.臨床成績
Of a total of 61 target locations predicted by the automated Pioneer software, only 4 (6.6%) were classified as incomplete by human experts (nuclear medicine viewers). . This result was better than the specification of OTHA-2263 (10% fail).
ii. Clinical results
臨床成績の後ろ向きアドホック解析において、14人の健康なボランティア(第1相試験MIP-1404-1301)と前立腺がんを有する105人の対象(第2相試験MIP-1404-201)が、Pioneerを用いる解析のために単一の集団に組み合わされた。MIP-1404-201における、前立腺がんに対する事前の療法を受けた対象は除外された。 In a retrospective ad hoc analysis of clinical results, 14 healthy volunteers (Phase 1 study MIP-1404-1301) and 105 subjects with prostate cancer (Phase 2 study MIP-1404-201) received Pioneer. were combined into a single population for analysis used. Subjects in MIP-1404-201 who had received prior therapy for prostate cancer were excluded.
CTアーチファクトのある画像または自動解析のための再構成が不可能な画像も除外された。前立腺がんのある61人の対象と14人の健常ボランティアとの合計75人の画像が評価された。 Images with CT artifacts or images that could not be reconstructed for automated analysis were also excluded. A total of 75 images were evaluated: 61 subjects with prostate cancer and 14 healthy volunteers.
Pioneerの自動査定は、前立腺がんと診察されてMIP-1404のSPECT撮像/CT撮像の後に前立腺全摘出術を経験した患者に関する病理組織診断の真標準に対して評価された。健康なボランティアについては、試験したときの正常なPSAおよび骨盤MRIに基づいて前立腺がんがないと想定された。グリーソンスコアとの相関を査定するためにスピアマンのローが使用された。前立腺における前立腺がんを検知するアルゴリズムの性能を判定するために受信者動作特性(ROC)曲線の下のエリアが採用された。感度および特異度は、ROC曲線からの最適な閾値/カットオフ値から判定された。 Pioneer's automated assessment was evaluated against the gold standard for histopathology on patients diagnosed with prostate cancer and undergoing radical prostatectomy following MIP-1404 SPECT/CT imaging. Healthy volunteers were assumed to be free of prostate cancer based on normal PSA and pelvic MRI at the time of testing. Spearman's rho was used to assess correlation with Gleason score. The area under the receiver operating characteristic (ROC) curve was taken to determine the performance of the algorithm in detecting prostate cancer in the prostate. Sensitivity and specificity were determined from the optimal threshold/cutoff values from the ROC curve.
1404の画像の自動化された量的査定は、グリーソンスコア(ロー:0.54;p<0.0001)と相関している。このROC曲線は0.80のAUC(95%信頼区間:67~94)を明示した。臨床的に重要な前立腺がんと臨床的に重要でないがんまたは正常な前立腺とを区別する際の、2値のTBRベースの結果に関する最適な閾値は25と判定された。Pioneerは、この閾値を使用して、MIP-1404-1301およびMIP-1404-201の試験からの1404のSPECT画像/CT画像を使用して、臨床的に重要な前立腺がんと臨床的に重要でない前立腺がんまたは正常な前立腺を、75%の感度および80%の特異度で区別した。 Automated quantitative assessment of 1404 images correlates with Gleason score (rho: 0.54; p<0.0001). This ROC curve demonstrated an AUC of 0.80 (95% confidence interval: 67-94). The optimal threshold for binary TBR-based results in distinguishing clinically significant prostate cancer from clinically unimportant cancer or normal prostate was determined to be 25. Using this threshold, Pioneer used 1404 SPECT/CT images from the MIP-1404-1301 and MIP-1404-201 trials to identify clinically significant prostate cancer and different prostate cancer or normal prostate with a sensitivity of 75% and a specificity of 80%.
したがって、Pioneerは、(i)すべての診断の終点にわたって、より客観的かつより再現可能な読取り性能をもたらすこと、および(ii)たとえば感度、特異度といった重要な診断パラメータに関する点推定(病理組織診断を真標準として使用して、一貫して>70%であることが示された)によって、手読みを改善するものである。
(実施例3)
I.実施例3:1404のCT画像/SPECT画像の自動解析および半自動解析のための例示のクラウドベースソフトウェア
Pioneer therefore (i) provides more objective and more reproducible readout performance across all diagnostic endpoints, and (ii) provides point estimates (histopathology (shown to be consistently >70% using the standard as a true standard) improves manual reading.
(Example 3)
I. Example 3: Exemplary cloud-based software for automatic and semi-automatic analysis of 1404 CT images/SPECT images
実施例3は、Pioneerと称される、本明細書で説明した自動化された画像解析手法の一実施形態を実施するクラウドベースのソフトウェアプラットホームの例である。Pioneerは、規制基準およびデータ安全基準に従って実施されたクラウドベースのソフトウェアプラットホームであり、ユーザは、1404のSPECT画像データ/CT画像データをアップロードし、ユーザの通常のインターネットブラウザによってアクセスされる2次元や3次元の医用画像ビューアを使用してこれを観察し、TBR値を再検討してエクスポートすることができる。このソフトウェアは品質制御ワークフローも提供するものであり、ユーザは、自動解析の不合格および/または調整といった選択肢を持って解析の品質を査定することができる。 Example 3 is an example of a cloud-based software platform called Pioneer that implements one embodiment of the automated image analysis method described herein. Pioneer is a cloud-based software platform implemented in accordance with regulatory and data safety standards that allows users to upload 1404 SPECT/CT image data and create two-dimensional and This can be viewed using a three-dimensional medical image viewer and the TBR value can be reviewed and exported. The software also provides a quality control workflow, allowing the user to assess the quality of the analysis with the option of automatically failing and/or adjusting the analysis.
したがって、このソフトウェアは、ユーザの監督の下で目的領域(ROI)を自動的に識別して解析するために人工知能アルゴリズムを採用するものである。Pioneerは、前立腺および背景における摂取に基づく客観的な解析(標的の背景に対する比(TBR))をもたらすために、ROIから画像データを抽出する。多くの場合、前立腺におけるシグナルが膀胱(尿の中に排泄されているMIP-1404)からのシグナルによって不明瞭になるので、このソフトウェアは膀胱をセグメント化して膀胱に関連したシグナルを抑制する能力も内蔵しており、したがって前立腺のシグナルがより正確に測定され得る。 Therefore, this software employs artificial intelligence algorithms to automatically identify and analyze regions of interest (ROI) under the supervision of the user. Pioneer extracts image data from the ROI to provide an objective analysis based on uptake in the prostate and background (target-to-background ratio (TBR)). The software also has the ability to segment the bladder and suppress bladder-related signals, as signals in the prostate are often obscured by signals from the bladder (MIP-1404, which is excreted in the urine). built-in, so prostate signals can be measured more accurately.
Pioneerの非臨床成績データは、テスト方法の定義を含む検証と確認(V&V)の査定を含む。所定の容認規準は、最低でも現況技術(手動査定)と同等の性能を保証するように設計された。検証は、ソフトウエアユニットテストと、結合テストと、すべてのソフトウェア要件の機能テストを伴うソフトウェアシステムテストとを含むものであった。システムがユーザ要求仕様を満たすことを保証するために確認プロセスが遂行された。V&Vテスト結果は、Pioneerが目的の用途、ユーザ要件およびソフトウェア要件を満たすことを示した。
(実施例4)
J.実施例4:臨床的に重要な所見に関するTBR閾値の選択
Pioneer's non-clinical performance data includes validation and validation (V&V) assessments, including test method definitions. The predetermined acceptance criteria were designed to ensure performance that is at least equivalent to current technology (manual assessment). Verification included software unit testing, integration testing, and software system testing with functional testing of all software requirements. A validation process was performed to ensure that the system met user requirements. V&V test results showed that Pioneer meets the intended application, user requirements, and software requirements.
(Example 4)
J. Example 4: Selection of TBR thresholds for clinically significant findings
実施例4は、患者の前立腺がんの病状を臨床的に重要な分類と臨床的に重要でない分類とに区分するためのTBR閾値が判定され得る様子を示す例である。 Example 4 is an example illustrating how a TBR threshold for classifying a patient's prostate cancer condition into clinically important and clinically unimportant categories can be determined.
適切な閾値を選択するために、SPECT画像/CT画像の2つのデータセットが組み合わされた。第1のデータセットは、1404薬物の第1相試験から得られた健常人の画像を含むものであった。このデータセットは、当初は14の画像を含有していた。本明細書で説明された手法によって画像の内部の前立腺のセグメント化が遂行され、前立腺のセグメント化が明らかに失敗した2つの画像が除外され、12の画像が残った。第2のデータセットは、1404薬物の第2相試験由来の、前立腺がんのある個人の画像を含むものであった。画像は、対象の前立腺全摘出術からの病理組織診断に関するグリーソン分類に基づいて区分された。グリーソンスコアの合計が7またはそれよりも大きければ臨床的に重要であると見なされ、6またはそれ未満であれば臨床的に重要でないと見なされた。このデータセットには、当初は65の画像(臨床的に重要なものが63、臨床的に重要でないものが2)が含有されていたが、全体の骨盤領域をカバーしていない1つの画像と、前立腺のセグメント化が明らかに失敗した1つの画像とが除外され、63の画像(臨床的に重要なものが61、臨床的に重要でないものが2)が残った。 Two datasets of SPECT/CT images were combined to select an appropriate threshold. The first data set contained images of healthy subjects from the Phase 1 trial of the 1404 drug. This dataset originally contained 14 images. Segmentation of the prostate within the image was performed by the techniques described herein, and two images in which prostate segmentation clearly failed were excluded, leaving 12 images. The second dataset contained images of individuals with prostate cancer from the Phase 2 trial of the 1404 drug. Images were segmented based on Gleason classification for histopathology from the subject's radical prostatectomy. A total Gleason score of 7 or greater was considered clinically significant; a sum of 6 or less was considered clinically unimportant. This dataset originally contained 65 images (63 clinically significant and 2 clinically unimportant), but one image that did not cover the entire pelvic region and , and one image in which prostate segmentation clearly failed, leaving 63 images (61 clinically significant and 2 clinically unimportant).
要約すると、臨床的に重要な病状のない14の画像および臨床的に重要な病状を伴う61の画像が使用された。 In summary, 14 images without clinically significant pathology and 61 images with clinically significant pathology were used.
画像に関するTBR値を計算するために、本明細書で説明された、自動化された画像セグメント化および摂取メトリック判定手法の一実施形態を実施するソフトウェアパッケージ(ctsegパッケージのバージョン1.0.0rcIII)が使用された。 To calculate TBR values for images, a software package (version 1.0.0rcIII of the ctseg package) implementing one embodiment of the automated image segmentation and uptake metric determination method described herein was used. used.
図35Aは、臨床的に重要でない画像(x軸上で6≦)および臨床的に重要な画像(x軸上で≧7)のスウォームプロットを示す。閾値25は、テストデータ上で0.77の感度(ジェフリーズ片側95%信頼区間の下限点は0.67である)、および0.71の特異度(ジェフリーズ片側95%信頼区間の下限点は0.50である)を与える。図35Bは、TBR閾値を変化させることに基づくROC曲線を示す。TBR閾値25の点は、3502(赤い円形マーカ)とマークされている。 Figure 35A shows a swarm plot of clinically unimportant images (6≦ on the x-axis) and clinically significant images (≧7 on the x-axis). A threshold of 25 has a sensitivity of 0.77 (the lower bound of the Jeffries one-sided 95% confidence interval is 0.67) and a specificity of 0.71 (the lower bound of the Jeffries one-sided 95% confidence interval) on the test data. is 0.50). FIG. 35B shows ROC curves based on varying the TBR threshold. The TBR threshold 25 point is marked 3502 (red circular marker).
図35Aおよび図35Bに示されるように、閾値25は、臨床的に重要な前立腺がんのある患者をそうでない人と区別するための値をもたらした。しかしながら、閾値のすぐ近くにはデータポイントがほとんどないので、感度および特異度の推定は、データにおける小さい不規則変動に対して頑健ではない。より頑健な推定を得るために、それぞれ臨床的に重要でない画像と重要な画像に関するTBR値の対数の分布に対して滑らかな単一モードの密度を推定するように、Rパッケージ「scdensity」が使用された。これから、異なるTBR閾値に関して感度および特異度の推定値が計算されており、表1を参照されたい。
したがって、この例で説明された解析に基づいて、所望の特異度および感度に基づいてTBR閾値25が選択された。相1のデータおよび相2のデータに基づくこれらの予備試験により、自動化法を使用するMIP-1404のSPECT/CTの診断精度の、手読みに対する改善が示された。
(実施例5)
K.実施例5:第3相試験からの画像の、AIを用いる解析
Therefore, based on the analysis described in this example, a TBR threshold of 25 was selected based on desired specificity and sensitivity. These preliminary studies based on Phase 1 and Phase 2 data demonstrated improved diagnostic accuracy of MIP-1404 SPECT/CT using automated methods versus manual reading.
(Example 5)
K. Example 5: Analysis of images from Phase 3 study using AI
この例は、相3の複数センタ、複数閲覧者の、非盲検試験の状況で、本明細書で説明された人工知能(AI)ベースの画像解析システムおよび方法の一実施形態の使用を明示するものである。詳細には、この例は、「A Phase 3 Study to Evaluate the Safety and Efficacy of 99mTC-MIP-1404 SPECT/CT Imaging and PIONEER as a combination product to Detect Clinically Significant Prostate Cancer in Men with Biopsy Proven Low-Grade Prostate Cancer (proSPECT-A1)」という名称のMIP-1404-3302試験(以下「3302試験」)によって得られた結果を説明するものである。3302試験では、医師が、(SPECT撮像用の)造影剤として99mTC-MIP-1404を使用して得られたSPECT画像/CT画像の解析および解釈に基づいて臨床的に重要な前立腺がんのある対象とない対象を識別するのを支援するために、本明細書で説明された(「PIONEER」と称される)画像解析技術のクラウドベースの実装形態が使用された。本明細書で使用されるように、「1404のSPECT画像/CT画像」および「1404のSPECT撮像/CT撮像」は、それぞれ、SPECT用の造影剤として99mTC-MIP-1404を使用して得られたSPECT画像/CT画像またはそのような画像を得るための撮像プロセスを参照する語句である。 This example demonstrates the use of one embodiment of the artificial intelligence (AI)-based image analysis system and method described herein in the context of a Phase 3, multi-center, multi-viewer, open-label study. It is something to do. In detail, this example is shown in "A Phase 3 Study to Evaluate the Safety and Efficacy of 99m TC-MIP-1404 SPECT/CT Imaging and PIONEER as a combination product to Detect Clinically Significant Prostate Cancer in Men with Biopsy Proven Low-Grade This paper describes the results obtained by the MIP-1404-3302 study (hereinafter "3302 study") entitled "Prostate Cancer (proSPECT-A1)". In the 3302 study, physicians diagnosed clinically significant prostate cancer based on analysis and interpretation of SPECT/CT images obtained using 99m TC-MIP-1404 as a contrast agent (for SPECT imaging). A cloud-based implementation of the image analysis technology described herein (referred to as "PIONEER") was used to help identify objects that are present and objects that are not. As used herein, "1404 SPECT image/CT image" and "1404 SPECT image/CT image" are respectively obtained using 99m TC-MIP-1404 as a contrast agent for SPECT. A phrase that refers to a SPECT/CT image that has been imaged or an imaging process for obtaining such an image.
3302試験は、「A Phase 3 Study to Evaluate the Safety and Efficacy of 1404 SPECT/CT Imaging to Detect Clinically Significant Prostate Cancer in Men with Biopsy Proven Low-Grade Prostate Cancer who are Candidates for Active Surveillance」という名称の第3相試験MIP-1404-3301(以下「3301試験」)に基づくものである。3301試験は、臨床的に重要な前立腺がんがある対象とない対象を識別するための1404のSPECT撮像/CT撮像の使用も査定する。しかしながら、3301試験では、医師は、PIONEERの支援なしで、従来の手読み手法(本明細書でより詳細に説明する)を使用して診断を遂行する。 The 3302 study is a Phase 3 study entitled "A Phase 3 Study to Evaluate the Safety and Efficacy of 1404 SPECT/CT Imaging to Detect Clinically Significant Prostate Cancer in Men with Biopsy Proven Low-Grade Prostate Cancer who are Candidates for Active Surveillance." It is based on test MIP-1404-3301 (hereinafter referred to as "3301 test"). The 3301 study will also assess the use of 1404 SPECT/CT imaging to distinguish between subjects with and without clinically significant prostate cancer. However, in the 3301 test, the physician performs the diagnosis using traditional hand-reading techniques (described in more detail herein) without the assistance of PIONEER.
この例は、2つの手法によって得られた結果を要約し、3302試験で遂行されたAI支援の診断の結果を3301試験の従来の手読み診断と比較するものである。 This example summarizes the results obtained by the two approaches and compares the results of the AI-assisted diagnosis performed in the 3302 study with the traditional hand-read diagnosis in the 3301 study.
要するに、3301試験および3302試験は、病理組織診断結果も入手可能な対象から得られた1404のSPECT画像/CT画像の共通データセットを利用した。3301試験と3302試験のどちらにおいても、臨床的に重要な前立腺がんの状態の有/無すなわち陽性/陰性を割り当てるために、それぞれの対象のSPECT画像/CT画像が解析された。1404のSPECT撮像/CT撮像の感度および特異度を査定して臨床的に重要な前立腺がんを識別するために、1404のSPECT画像/CT画像の解析から得られた結果が、グラウンドトルース病理組織診断結果と比較された。 In summary, the 3301 and 3302 studies utilized a common dataset of 1404 SPECT/CT images obtained from subjects for whom histopathology results were also available. In both the 3301 and 3302 studies, each subject's SPECT/CT images were analyzed to assign clinically significant prostate cancer status (positive/negative). To assess the sensitivity and specificity of 1404 SPECT/CT images to identify clinically significant prostate cancer, the results obtained from the analysis of 1404 SPECT/CT images were analyzed using ground truth histopathology. The results were compared with the diagnosis results.
3301試験では、1404のSPECT画像/CT画像が従来の手読み手法で解析され、医師は、2次元のCT画像およびSPECT画像のスライスを通してスクロールするための標準的な撮像観察ソフトウェアを使用してマーカを手動で位置決めし、目的領域を識別してTBR値を計算した。対照的に、3302試験では、医師は、本明細書で説明したシステムおよび方法の一実施形態を使用してAI支援の再検討を遂行した。詳細には、3302試験のAI支援の手法では、図25に示されたものと類似のワークフローが使用され、医師はPIONEERソフトウェアの助けを借りて画像解析を遂行した。PIONEERソフトウェアは、各画像について、前立腺の3Dセグメント化を全自動で遂行し、初期のTBR値を計算して、初期のTBR値の所定の閾値との比較に基づいて、対象に初期の前立腺がんの状態を割り当てた。PIONEERソフトウェアによって実施され、図26A~図29Hに関して上記で説明された、GUIの若干修正されたバージョンによる再検討のためのこの自動解析の結果が、医師に提示された。医師は、全自動解析の結果を容認するかまたは不合格とし、標的および/または背景値を更新し、半自動のやり方でTBRを再計算するために、GUIを使用することができた。 In the 3301 study, 1404 SPECT/CT images were analyzed using traditional hand-reading techniques, and physicians used standard imaging and viewing software to scroll through slices of the two-dimensional CT images and SPECT images to mark markers. was manually positioned to identify the region of interest and calculate the TBR value. In contrast, in the 3302 study, physicians performed an AI-assisted review using one embodiment of the systems and methods described herein. In particular, the AI-assisted approach for the 3302 study used a workflow similar to that shown in Figure 25, with physicians performing image analysis with the help of PIONEER software. The PIONEER software performs fully automatic 3D segmentation of the prostate for each image, calculates the initial TBR value, and determines whether the subject has an initial prostate based on the comparison of the initial TBR value with a predetermined threshold. Assigned the status of The results of this automated analysis were presented to the physician for review with a slightly modified version of the GUI, performed by the PIONEER software and described above with respect to FIGS. 26A-29H. The physician could use the GUI to accept or reject the results of the fully automated analysis, update target and/or background values, and recalculate the TBR in a semi-automated manner.
以下で詳細に説明されるように、3302試験において使用されたAI支援の手法の結果は、3301試験の従来の手読み手法よりも正確であることが判明した。その上に、主観的な人間の判断に頼ることを低減するか、または実質的に解消することにより、3302試験のAI支援の手法は、高度に一貫した再現可能な結果を迅速にもたらし、医師は大多数の場合において全自動解析を承認するのみであった。
i.3301試験、試験の母集団、撮像、および手読みプロトコール。
As explained in detail below, the results of the AI-assisted approach used in the 3302 study were found to be more accurate than the traditional hand-reading approach in the 3301 study. Moreover, by reducing or essentially eliminating reliance on subjective human judgment, the 3302 trial's AI-assisted approach will quickly deliver highly consistent and reproducible results, allowing physicians to only approved fully automated analysis in the majority of cases.
i. 3301 Study, Study Population, Imaging, and Manual Reading Protocol.
3301試験は、複数センタ、複数閲覧者の非盲検試験であった。3301試験は2015年12月に開始された。3301試験は2017年12月に登録および再調査を完了した。結果の解析は本明細書に含まれている。 Study 3301 was a multicenter, multiviewer, open-label study. The 3301 study began in December 2015. Study 3301 completed enrollment and review in December 2017. Analysis of the results is included herein.
3301試験の目的は、3+4またはそれ未満の合計グリーソンスコアの病理組織診断の所見があり、かつ/または積極的監視の候補である、診断用の経直腸超音波(TRUS)ガイド下生検を受けたことがある男性の臨床的に重要な前立腺がんを検知するために1404のCT撮像/SPECT撮像を査定することである。 The purpose of the 3301 study was to identify patients undergoing diagnostic transrectal ultrasound (TRUS)-guided biopsy with histopathological findings of a total Gleason score of 3+4 or less and/or candidates for active surveillance. The purpose of this study is to assess 1404 CT/SPECT imaging to detect clinically significant prostate cancer in men who have experienced cancer.
対象の2つの集団が登録された。「集団A」と称される第1の集団は、低悪性度~中悪性度の前立腺がんであることが生検で証明された(すなわち生検で3+3または3+4の合計グリーソンスコアを割り当てられた)、積極的監視の候補であったが前立腺全摘出術(RP)を受けることが決定した男性であった。「集団B」と称される第2の集団は、非常に低リスクの前立腺がんであることが生検で証明された、定期的な積極的監視の一部として定期的再生検を受ける予定の患者であった。 Two populations of subjects were enrolled. The first population, referred to as "Population A," had biopsy-proven low-to-intermediate-grade prostate cancer (i.e., was assigned a total Gleason score of 3+3 or 3+4 on biopsy). ), the man was a candidate for active surveillance but decided to undergo radical prostatectomy (RP). A second population, referred to as "Population B," is a population with biopsy-proven very low-risk prostate cancer scheduled to undergo a routine re-biopsy as part of regular active surveillance. He was a patient.
試験目的は、(1)臨床的に重要な前立腺がんのない(たとえば3+4またはそれ未満の合計グリーソンスコアの)対象を識別するための1404のSPECT撮像/CT撮像の特異度と、(2)臨床的に重要な前立腺がんのある(たとえば3+4よりも大きい合計グリーソンスコアの)対象を識別するための1404のSPECT撮像/CT撮像の感度とを評価することであった。 The study objectives were to (1) determine the specificity of 1404 SPECT/CT imaging to identify subjects without clinically significant prostate cancer (e.g., with a total Gleason score of 3+4 or less); and (2) The objective was to evaluate the sensitivity of 1404 SPECT/CT imaging for identifying subjects with clinically significant prostate cancer (eg, total Gleason score greater than 3+4).
すべての登録された対象が、20±3mCi(740±111MBq)99mTC-MIP-1404の1回量を注射され、注射後3~6時間後にSPECT撮像/CT撮像および全身2次元撮像によって1404のSPECT撮像/CT撮像が遂行された。治療手順の基準に従って、対象は、試験薬物投与後の42日以内に随意のRP手術(集団A)または前立腺生検(集団B)を受け、その後に検体が組織学的に査定された。各患者のグラウンドトルース前立腺がんの状態を確立するために、前立腺検体(集団A)または生検材料(集団B)に対して病理組織診断が遂行された。主要な病理学者は、撮像結果を含むすべての臨床データを知らされていなかった。 All enrolled subjects were injected with a single dose of 20±3 mCi (740±111 MBq) 99m TC-MIP-1404, and 3-6 hours post-injection, the 1404 SPECT/CT imaging was performed. According to the criteria for treatment procedures, subjects underwent optional RP surgery (Population A) or prostate biopsy (Population B) within 42 days after study drug administration, after which specimens were assessed histologically. Histopathology was performed on prostate specimens (population A) or biopsy specimens (population B) to establish the ground truth prostate cancer status of each patient. The primary pathologist was blinded to all clinical data, including imaging results.
従来の手読み手法を使用して画像が解析された。このようにして遂行された画像解析および診断は、以下で「単独」とも称される。単独解析は、ほとんどの病院において一般に見られるような、たとえば、この場合はMIM Software Inc.のMIMvistaといった従来のSPECT撮像/CT撮像ワークステーションソフトウェアを使用して遂行された。図38Aは、従来の単独ワークフローで使用されるようなMIMvista GUIのスクリーンショットを示すものである。単独ワークフローでは、画像閲覧者(たとえば医師または技術者)はCT画像およびSPECT画像を2Dスライスとして観察した。図38Aに示されるように、CTスライスのセット3802a、3802b、および3802cが、対応するSPECT画像スライス3804a、3804b、および3804cとともに示されている。閲覧者は、CT画像スライス(たとえば3802a)の中に前立腺を(たとえば手動で)配置した。次いで、閲覧者は、SPECT画像における最大の摂取スライスを識別するために、最大の摂取をとらえるように、スライスを通して手動でスクロールした。閲覧者は、この最大の摂取スライスを識別すると、目的領域を識別するために、図38Bに示されるように、CT画像における対応するスライスの中に固定サイズの円形マーカ3806を(手動で)配置した。次いで、この目的領域における(すなわち円の内部の)最大の摂取が記録された(MIMvistaなど従来のソフトウェアは、この数値を、平均摂取など他の値とともに表示するのみである)。
Images were analyzed using traditional manual reading techniques. Image analysis and diagnosis performed in this way will also be referred to below as "single". A stand-alone analysis is performed by, for example, MIM Software Inc. in this case, as is commonly found in most hospitals. was performed using conventional SPECT imaging/CT imaging workstation software such as MIMvista. FIG. 38A shows a screenshot of the MIMvista GUI as used in a conventional standalone workflow. In a single workflow, an image viewer (eg, a physician or technician) viewed CT and SPECT images as 2D slices. As shown in FIG. 38A, a set of
図38Cに移って、閲覧者は背景値を判定するために類似の手順を遂行した。閲覧者は、目的領域3808を識別するために前立腺の近くの閉鎖筋に円形マーカを配置し、この領域における摂取の平均値を背景値として記録した。次いで、最大の摂取値の背景値に対する比としてTBRが計算された。特に、この従来の手法では、自動の3Dセグメント化は遂行されなかった。代わりに、閲覧者は、CT画像スライスの内部の2次元目的領域を最終的に識別するためにSPECT画像/CT画像をスライスごとに診査した。加えて、PIONEERシステムを使用して行われるように背景値を判定するための基準組織として殿筋を使用するのとは対照的に、基準組織領域として閉鎖筋が使用された。
Moving to FIG. 38C, the viewer performed a similar procedure to determine the background value. The viewer placed a circular marker on the obturator muscle near the prostate to identify the region of
3301試験では、3人の独立した、盲検化された医師の閲覧者が、判定されたTBR値に基づいて1404のSPECT画像/CT画像を解析して、それぞれの対象に、前立腺がんの臨床的に重要な状態/臨床的に重要でない状態のいずれかを割り当てた。主要な病理組織診断の評価は、病理組織診断結果と比較した画像ベース解析の結果とともに、1404のSPECT撮像/CT撮像の診断性能を査定するためのグラウンドトルースとして使用された。
ii.3302試験
In the 3301 study, three independent, blinded physician viewers analyzed 1404 SPECT/CT images based on determined TBR values to determine whether each subject had prostate cancer. A clinically important/clinically unimportant condition was assigned. The primary histopathological diagnostic evaluations, along with the results of image-based analysis compared with the histopathological diagnostic results, were used as the ground truth to assess the diagnostic performance of 1404 SPECT/CT imaging.
ii. 3302 exam
3302試験は3301試験に基礎を置き、同一の患者集団および画像データを使用するが、本明細書で説明されたAI支援の画像解析手法の性能を評価して、臨床的に重要な前立腺がんを検知するものである。詳細には、3302試験は、3301試験から得られたデータセット(SPECT画像/CT画像および病理組織診断)の解析に基づいてあらかじめ定義された後ろ向き試験である。3301試験のように、また本明細書で説明されたように、主要な病理組織診断の評価が、性能の査定のためのグラウンドトルースとして使用された。3302試験の2つの主要終点は、
・臨床的に重要な前立腺がんを検知するための組合せ製品としての99mTc-MIP-1404とPIONEERの、前立腺全摘出術(集団A)または前立腺生検(集団B)のいずれかの後の病理組織診断と比較されたときの特異度と、
・臨床的に重要な前立腺がんを検知するための組合せ製品としての99mTc-MIP-1404とPIONEERの、前立腺全摘出術(集団A)または前立腺生検(集団B)のいずれかの後の病理組織診断と比較されたときの感度とである。
The 3302 study builds on the 3301 study and uses the same patient population and imaging data, but evaluates the performance of the AI-assisted image analysis method described herein to identify clinically important prostate cancer patients. It is used to detect. In detail, the 3302 study is a predefined retrospective study based on the analysis of the dataset (SPECT/CT images and histopathology) obtained from the 3301 study. As in the 3301 study and as described herein, primary histopathology evaluations were used as ground truth for performance assessment. The two primary endpoints of the 3302 study are:
- 99m Tc-MIP-1404 and PIONEER as a combination product to detect clinically significant prostate cancer after either radical prostatectomy (Population A) or prostate biopsy (Population B) Specificity when compared with histopathological diagnosis,
- 99m Tc-MIP-1404 and PIONEER as a combination product to detect clinically significant prostate cancer after either radical prostatectomy (Population A) or prostate biopsy (Population B) Sensitivity when compared with histopathological diagnosis.
使用された特定のワークフロー、解析プロトコール、および3302試験のAI支援の手法の性能を3301試験の単独手動手法と比較した結果が、本明細書で説明される。
iii.AI支援の画像解析ワークフロー
The specific workflows used, analysis protocols, and results comparing the performance of the AI-assisted approach of the 3302 study to the solely manual approach of the 3301 study are described herein.
iii. AI-assisted image analysis workflow
3302試験におけるPIONEERの支援を伴う画像の解析は、品質制御のバージョンおよび本明細書で(たとえば図25に関して)説明された報告ワークフローを使用して遂行された。図39は、3302試験において使用された特定のワークフロー3900のブロック流れ図を示すものである。示されるように、技術者が、PIONEERソフトウェアによる初期の自動解析をアップロードして開始するためのステップの群3902を遂行し、その後に、医師が、解析を再検討して品質制御の各ステップおよび報告ワークフロー3904を遂行した。 Analysis of images with the assistance of PIONEER in the 3302 study was accomplished using the quality control version and reporting workflow described herein (eg, with respect to FIG. 25). FIG. 39 depicts a block flow diagram of the particular workflow 3900 used in the 3302 test. As shown, a technician performs a set of steps 3902 for uploading and initiating an initial automated analysis with the PIONEER software, after which a physician reviews the analysis and performs each step of quality control and Report workflow 3904 was executed.
技術者は、1404のSPECT画像データ/CT画像データをアップロードし、撮像要件が満たされていることを保証することを担った。次いで、自動解析が開始され、図40A~図40Cに示されるように解析GUIのウィンドウによって提示される3つの結果のうち1つをもたらす。図40Aは、自動解析が首尾よく完了して(たとえば医師による)画像再検討のための準備ができたことを指示するように使用される解析GUIのウィンドウのスクリーンショットを示す。図40Bは、自動解析が解析誤差のために完了しなかったことを指示する解析GUIのウィンドウのスクリーンショットを示し、この場合、解析を完了するために、医師が遂行する手動の案内が使用される(そのような場合も再検討の準備ができているものと見なされた)。図40Cは、不完全なデータのために自動解析が完了せず、撮像問題の補正および/または技術者によるデータの再アップロードが必要であることを指示するように使用される解析GUIのウィンドウのスクリーンショットを示す。 The technician was responsible for uploading the 1404 SPECT image data/CT image data and ensuring that the imaging requirements were met. An automatic analysis is then initiated, resulting in one of three results presented by the analysis GUI window as shown in FIGS. 40A-40C. FIG. 40A shows a screenshot of an analysis GUI window used to indicate that automated analysis has been successfully completed and the image is ready for review (eg, by a physician). FIG. 40B shows a screenshot of the analysis GUI window indicating that the automated analysis was not completed due to analysis errors, in which case manual guidance performed by the clinician was used to complete the analysis. (such cases were also considered ready for reconsideration). FIG. 40C shows a window of the analysis GUI used to indicate that automatic analysis is not complete due to incomplete data and requires correction of imaging issues and/or data re-upload by the technician. Show screenshot.
医師は、画像を再検討するために、本明細書で説明されたものと類似のGUIを使用して図39のワークフローを辿った。図41~図44は、医師が画像を解析して診断を遂行するために使用するGUIの様々なウィンドウのスクリーンショットを示すものである。図41は、医師によって再検討されるべき患者のリストを示すスクリーンショットである。医師の閲覧者は、患者のデータを再検討して前立腺がんの状態を割り当てるために特定の患者を選択した。 The physician followed the workflow of Figure 39 using a GUI similar to that described herein to review the images. 41-44 show screenshots of various windows of the GUI that a physician uses to analyze images and perform a diagnosis. FIG. 41 is a screen shot showing a list of patients to be reviewed by a physician. Physician viewers selected specific patients to review patient data and assign prostate cancer status.
医師の閲覧者は、患者を選択して自動解析の結果を再検討した。図42A~図42Eは、PIONEERソフトウェアによって遂行された自動解析の結果を再検討するために医師によって使用された解析GUIのビューのスクリーンショットを示すものである。3302試験で使用されたPIONEERソフトウェアにおいて実施された解析GUIは、本明細書で図29A~図29Hに示されて説明されたものに類似である。図42Aは、医師に提示された解析GUIのビューのスクリーンショットである。図42Aのスクリーンショットは、図29Aに示されたビューに類似であり、CT画像データ上にSPECT画像データを重ね合わせた2Dスライスと、前立腺を識別するセグメント化マスクとを表示している。図29Aと同様に、図42AのGUIのビューは、自動的に判定されたTBR値、および本明細書で説明されたようにTBR値と閾値との比較に基づく(たとえば「臨床的に重要」といった)前立腺がんの状態の割り当ても示す。図42Bが示す、図42Aに示されたビューアの別のスクリーンショットは、医師がSPECT画像データ/CT画像データおよびセグメント化マスクの3D体積ビューに切り換えたものである。 Physician viewers selected patients and reviewed the results of the automated analysis. 42A-42E show screenshots of views of the analysis GUI used by the physician to review the results of the automated analysis performed by the PIONEER software. The analysis GUI implemented in the PIONEER software used in the 3302 study is similar to that shown and described herein in FIGS. 29A-29H. FIG. 42A is a screenshot of a view of the analysis GUI presented to the physician. The screen shot of FIG. 42A is similar to the view shown in FIG. 29A, displaying a 2D slice of SPECT image data overlaid on CT image data and a segmentation mask identifying the prostate. Similar to FIG. 29A, the view of the GUI in FIG. 42A is based on automatically determined TBR values and comparisons of TBR values with thresholds as described herein (e.g., "clinically significant"). (e.g.) prostate cancer status assignments are also shown. FIG. 42B shows another screenshot of the viewer shown in FIG. 42A with the physician switching to a 3D volumetric view of SPECT image data/CT image data and a segmentation mask.
図42Aに示されるように、また図42Cにはより詳細に示されるように、3302試験において使用された解析GUIは、対象の結果を、臨床的重要度の4つのカテゴリのうち1つに割り当てる尤度の重症度スケールも含む。詳細には、臨床的に重要であるか否かの2項分類に加えて、対象の前立腺がんの状態が、計算されたTBR値の3つの閾値との比較に基づいて4つのカテゴリのうち1つに割り当てられた。尤度の重症度スケールにおいて、第1の閾値未満のTBR値には「可能性が非常に低い」状態が割り当てられ、第1の閾値またはそれよりも大きく第2の閾値未満のTBR値には「可能性が低い」状態が割り当てられ、第2の閾値から第3の閾値までのTBR値には「可能性が高い」状態が割り当てられ、第3の閾値よりも大きい値には「可能性が非常に高い」状態が割り当てられた。 As shown in FIG. 42A and shown in more detail in FIG. 42C, the analysis GUI used in the 3302 study assigns the results of interest to one of four categories of clinical importance. Also includes a likelihood severity scale. In detail, in addition to the binary classification of clinically significant or not, the subject's prostate cancer status is classified into four categories based on comparison of the calculated TBR value with three thresholds. assigned to one. On the likelihood severity scale, TBR values below a first threshold are assigned a "very unlikely" status, and TBR values below the first threshold or greater but less than a second threshold are assigned a "very unlikely" status. A “unlikely” status is assigned, TBR values between the second and third thresholds are assigned a “likely” status, and values greater than the third threshold are assigned a “likely” status. "Very High" status was assigned.
対象を尤度の重症度スケールのカテゴリに割り当てるために使用された3つのTBR閾値は、図35Aおよび図35Bを参照しながら実施例4で説明されたROC解析を使用して判定されたものである。3つの閾値の各々が、特定の感度値と特異度値の対をもたらすように選択された。以下の表2は表1と同一のデータを示すものであるが、追加のTBR閾値に関する特異度および感度のデータを示すために使われた。図45Aおよび図45Bは、図35Aおよび図35Bに示されたデータを再プロットするものであるが、対象を、指示された尤度の重症度スケールのカテゴリに割り当てるために3つのTBR閾値が使用された。表2ならびに図45Aおよび図45Bに示されるように、第1の小さい閾値として12が選択されて0.95の標的感度をもたらし、第2の中間の閾値として25が選択されて0.75の感度および0.75の特異度をもたらし、第3の大きい閾値として45が選択されて0.9の特異度をもたらした。以下の表3は、これらの3つの閾値の各々に関して、ジェフリーズ片側95%信頼区間(CI)の下限点を示す。
図45Cおよび図45Dは、尤度の重症度スケール上のこれらの閾値および対応するカテゴリが、閾値を判定するために使用された第1相試験のおよび第2相試験の母集団の中の対象の合計グリーソンスコア(2から10の範囲)に関係する様子を示すものである。図45Cおよび図45Dに示された結果は、指示された4つのカテゴリの標識方式を用いた尤度の重症度スケールを示し、これは、後に、図42Aおよび図42Cに示された4つの等価カテゴリに更新された。「陰性」(図42Cに示されたスケールでは「可能性が非常に低い」と称される)のカテゴリ4501は12未満のTBR値に対応する。「多分陰性」(図42Cに示されたスケールでは「可能性が低い」と称される)のカテゴリ4502は12から25までの範囲のTBR値に対応する。図45Aおよび図45Bに示されるように、TBR値に基づいて「陰性」4501および「多分陰性」4502のカテゴリに割り当てられた患者は、一般的には7未満の合計グリーソンスコアを有する。「多分陽性」(図42Cに示されたスケールでは「可能性が高い」と称される)のカテゴリ4503は、25から45までの範囲のTBR値に対応し、7および8の合計グリーソンスコアを取り込む。45を超えるTBR値を有する患者は、「陽性」(図42Cに示されたスケールでは「可能性が非常に高い」と称される)のカテゴリ4504に割り当てられ、一般的には9または10の合計グリーソンスコアを有することになる。 FIGS. 45C and 45D show that these thresholds and corresponding categories on the likelihood severity scale were used to determine the thresholds for subjects in the Phase 1 trial and Phase 2 trial populations. Figure 2 shows the relationship between total Gleason score (range 2 to 10). The results shown in FIGS. 45C and 45D show a likelihood severity scale using an indicated four-category labeling scheme, which is later expanded into four equivalents shown in FIGS. 42A and 42C. Categories were updated. The "negative" (referred to as "very unlikely" on the scale shown in FIG. 42C) category 4501 corresponds to a TBR value of less than 12. The "probably negative" (referred to as "unlikely" on the scale shown in FIG. 42C) category 4502 corresponds to TBR values ranging from 12 to 25. As shown in FIGS. 45A and 45B, patients assigned to the "negative" 4501 and "probably negative" 4502 categories based on TBR values generally have a total Gleason score of less than 7. The "probably positive" (referred to as "likely" in the scale shown in FIG. 42C) category 4503 corresponds to TBR values ranging from 25 to 45, with a total Gleason score of 7 and 8. take in. Patients with TBR values greater than 45 are assigned to the "Positive" (referred to as "Very Likely" on the scale shown in Figure 42C) category 4504, typically a score of 9 or 10. You will have a total Gleason score.
本明細書で以前に説明されたように、医師は、自動査定を承認するか、または全自動の査定を上書きしてTBR計算のために使用された標的(最大の摂取)値および背景値を更新するための選択肢を与えられていた。図42Dは、TBRを計算するために使用された標的値および背景値を更新するために医師によって使用されたGUIビューのスクリーンショットを示す。図42Eに示されるように、医師は臨床的重要度の分類を更新するための選択肢も与えられていた。 As previously described herein, the physician can approve the automated assessment or override the fully automated assessment to modify the target (maximum intake) and background values used for TBR calculations. I was given the option to update. FIG. 42D shows a screenshot of the GUI view used by the physician to update the target and background values used to calculate the TBR. As shown in Figure 42E, the physician was also given the option to update the clinical importance classification.
図39に示されるように、医師が品質制御ワークフローを完了すると、3903において報告が生成された。図43Aが示す全自動査定によって生成された報告では、医師は、PIONEERソフトウェアの自動解析によって判定されたTBR計算および臨床の重要度状態を承認するのみであった。図43Bが示す半自動解析によって生成された報告では、医師は、ソフトウェアによって支援されたが、標的値および背景値を更新した。図44は評価できない事例に関して生成された報告を示す。
iv.3302試験結果
As shown in FIG. 39, once the physician completed the quality control workflow, a report was generated at 3903. In the report generated by the fully automated assessment shown in Figure 43A, the physician only approved the TBR calculation and clinical significance status determined by the automated analysis of the PIONEER software. In the report generated by the semi-automated analysis shown in Figure 43B, the physician, assisted by the software, updated the target and background values. Figure 44 shows the report generated for cases that cannot be evaluated.
iv. 3302 test results
3302試験では、本明細書で説明されたワークフローによって1404のSPECT/CT画像を解析して、患者の臨床的に重要な前立腺がんの状態の有無を識別するために、(3301試験でデータ解析を遂行した者とは別の)3人の独立した新規閲覧者を使用した。3301試験における464の事例のうち13が、病状の見落とし(3つの事例)または技術的問題(10の事例)のために除外され、3302試験における解析向けに合計451の事例が残った。「AI閲覧者1」と称される第1の閲覧者が451の事例を解析し、「AI閲覧者2」と称される第2の閲覧者が450の事例を解析し、「AI閲覧者3」と称される第3の閲覧者が441の事例を解析した。 In the 3302 study, 1404 SPECT/CT images were analyzed by the workflow described herein to identify the presence or absence of clinically significant prostate cancer status in patients (data analysis in the 3301 study). We used three independent new viewers (separate from those who performed the test). Thirteen of the 464 cases in the 3301 study were excluded due to missed pathology (3 cases) or technical problems (10 cases), leaving a total of 451 cases for analysis in the 3302 study. A first viewer referred to as “AI viewer 1” analyzes 451 cases, a second viewer referred to as “AI viewer 2” analyzes 450 cases, and “AI viewer A third viewer, designated ``3'', analyzed 441 cases.
図46に示されるように、本明細書で説明されたAI支援の解析手法により、医師は、PIONEERソフトウェアによって生成された全自動査定に主として基づき、各患者の前立腺がんの臨床的な重要度および重症度を迅速に査定することができた。図46のヒストグラムは、各閲覧者が特定の時間内に処理できた事例の数を示すものである。PIONEERソフトウェアの実施形態を使用した閲覧者が3302試験において1つの事例に要した時間は、平均すると3.5分であった。対照的に、3301試験の手読み手法では、各事例について、技術者が、約5~10分を費やして、上記で説明されたように前立腺および背景(閉鎖膜)における目的領域を手動で配置し、その後、放射線技師が、これを評価して症例報告書に書き込むのにさらに5~10分を費やした。したがって、1つの事例ごとに20分程度も費やされていたのが、AI支援の手法によって平均3.5分に短縮され、効率における顕著な改善がもたらされた。 As shown in Figure 46, the AI-assisted analysis approach described herein allows physicians to assess the clinical significance of each patient's prostate cancer based primarily on a fully automated assessment generated by the PIONEER software. and severity could be assessed quickly. The histogram in FIG. 46 shows the number of cases each viewer was able to process within a specific time. Viewers using embodiments of the PIONEER software averaged 3.5 minutes per instance in the 3302 study. In contrast, with the manual reading approach of the 3301 study, for each case, the technician spent approximately 5-10 minutes manually locating the region of interest in the prostate and background (obturator membrane) as described above. The radiologist then spent an additional 5-10 minutes evaluating this and writing it into the case report form. Thus, the AI-assisted approach reduced the time spent on the order of 20 minutes per case to an average of 3.5 minutes, resulting in a significant improvement in efficiency.
その上に、図47に示されるように、3302試験のAI支援の手法によって画像解析および前立腺がんの状態の診断を遂行すると、高度に一貫した再現可能な結果を得ることができた。結果における一貫性は、別々の閲覧者にわたる結果の類似性を指す。再現性は閲覧者内の変動性を指すものであり、すなわち、一人の閲覧者が解析を繰り返すことによって生成された結果の間の類似性の程度である。 Moreover, as shown in Figure 47, the AI-assisted approach of the 3302 study was able to perform image analysis and diagnosis of prostate cancer status with highly consistent and reproducible results. Consistency in results refers to the similarity of results across different viewers. Reproducibility refers to intra-viewer variability, ie, the degree of similarity between results produced by a single viewer repeating an analysis.
図47におけるグラフのセットは、3302試験のAI支援の手法によって得られた結果の一貫性および再現性を明示するものである。特に、図のヒストグラム4702に示されるように、69%~85%といった大多数の事例が全自動で処理され、医師の閲覧者は、PIONEERシステムによって遂行された2項分類を承認するだけであった。残りの事例は、医師が最大の摂取標的値を更新するために介入して半自動で処理された。 The set of graphs in Figure 47 demonstrate the consistency and reproducibility of the results obtained by the AI-assisted approach of the 3302 study. In particular, as shown in histogram 4702 in the figure, the majority of cases, between 69% and 85%, are processed fully automatically, and the physician viewer only has to approve the binary classification performed by the PIONEER system. Ta. The remaining cases were processed semi-automatically with physician intervention to update the maximum uptake target value.
閲覧者が標的値に関する新規の最大強度の画像ボクセルを選択するために介入する主要な理由は、SPECT画像における前立腺領域への膀胱強度流出によるものであった。これは主としてコンプトン散乱によって生じたものと考えられる。PIONEERシステムは、本明細書で説明されたように膀胱流出補正機能を含んでいた。しかしながら、ある特定の事例では(特に、3301試験および3302試験において診査された、前立腺における摂取が小さい軽度の患者集団では)、閲覧者が(たとえば標的ボクセルの自動選別が不正確であると考えて)自動解析に反対し、PIONEERシステムからの支援を用いて標的ボクセルの選択を更新した。 The primary reason for the viewer's intervention to select the new maximum intensity image voxel for the target value was due to bladder intensity spillover into the prostate region in the SPECT image. This is considered to be mainly caused by Compton scattering. The PIONEER system included a bladder outflow correction feature as described herein. However, in certain cases (particularly in the mild patient population with small prostate uptake examined in studies 3301 and 3302), viewers (e.g., believing that the automatic selection of target voxels is inaccurate) ) Opposed to automatic analysis and updated target voxel selection using assistance from the PIONEER system.
全自動診断によって閲覧者内の変動性および閲覧者間の変動性が解消する(完全に一貫した再現可能な結果が可能になる)ので、全自動の結果が容認された割合が大きいことは注目すべきである。 It is interesting to note that a large percentage of fully automated results were accepted, as fully automated diagnostics eliminates within-viewer and inter-viewer variability (enabling completely consistent and reproducible results). Should.
図4710a、図4710b、および図4710c(総称して図4710)の右側ならびに図4720a、図4720b、および図4720c(総称して図4720)の散布図は、閲覧者にわたる変動性を示す。各プロットは、特定のAI支援の閲覧者によって得られたTBR結果を、内部の基準閲覧者(この人もPIONEERソフトウェアを使用し、3302試験の3人の閲覧者と同一のプロトコールに従った)によって得られたものと比較したものである。各点が事例を表し、y軸の値は内部閲覧者によって計算されたTBR値を与え、x軸の値は特定の閲覧者によって計算されたTBR値を与える。散布図4700は全自動査定によって遂行された事例を示すものであり、完全な相関係数(r=1)によって明示されるように閲覧者間の変動性が解消され、完全に一貫した結果が可能になる。本明細書で説明された半自動のやり方で解析された事例がプロット4720に示されている。散布図および(r=0.95よりも優れている)大きい相関係数は、閲覧者が標的ボクセルの選択を更新するために介入したときさえ高度に一貫した結果が得られたことを示す。したがって、この標的ボクセルの配置は主観的なものであったが、PIONEERシステムの支援により、高度に一貫した結果が可能になった。 The scatter plots on the right side of diagrams 4710a, 4710b, and 4710c (collectively diagram 4710) and in diagrams 4720a, 4720b, and 4720c (collectively diagram 4720) illustrate variability across viewers. Each plot shows the TBR results obtained by a specific AI-assisted viewer, compared to an internal reference viewer (who also used PIONEER software and followed the same protocol as the three viewers in the 3302 study). This is a comparison with that obtained by. Each point represents an instance, the y-axis value gives the TBR value calculated by the internal viewer, and the x-axis value gives the TBR value calculated by the particular viewer. Scatterplot 4700 shows an example performed by a fully automated assessment, where inter-viewer variability is eliminated and results are completely consistent, as evidenced by a perfect correlation coefficient (r=1). It becomes possible. An example analyzed in the semi-automated manner described herein is shown in plot 4720. The scatter plot and the large correlation coefficient (better than r=0.95) indicate that highly consistent results were obtained even when the viewer intervened to update the target voxel selection. Therefore, although the placement of this target voxel was subjective, the assistance of the PIONEER system enabled highly consistent results.
3302試験において画像を解析した3人のAI支援の閲覧者の成績が、3301試験からの3人の手動閲覧者の成績とともに、図48Aおよび図48Bに示されている。図48Aは、3302試験の3人のAI支援の閲覧者および3301試験の3人の手動閲覧者の各々に関する受信者動作特性(ROC)曲線を示すものである。ROC曲線は、患者の臨床的に重要な前立腺がんの陽性/陰性の2項分類を遂行するために使用されるTBR閾値を変化させたとき感度および特異度が変化する様子を示すものである。本明細書で説明されたように、病理組織診断は、3301試験と3302試験の両方において、感度および特異度を解析するためのグラウンドトルースとして使用された。以下の表4は、それぞれの特定の事例について、撮像結果が真陽性(TP)、真陰性(TN)、偽陽性(FP)、または偽陰性(FN)のうちどれであったかを判定するために、1404のSPECT撮像/CT撮像の結果を病理組織診断と比較した様子を示すものである。
陽性の前立腺病理組織の診断結果は、MIP-1404のSPECT撮像/CT撮像の後に(i)(集団Aについては)少なくとも1つの前立腺葉における、または(ii)(集団Bについては)前立腺生検における、臨床的に重要な疾患として電子的症例報告書に報告されるものと定義された。集団Aについては、臨床的に重要な疾患の主要な病理組織診断の実験的査定は、
・前立腺の内部の3+4を超える分類のあらゆるグリーソン分類の疾患、
・前立腺の内部の3+4の分類のあらゆるグリーソン分類の疾患で、分類4が10%を上回るかまたはそれと等しい疾患、
・前立腺の内部のステージT3(前立腺がんのステージ評価システムによるpT3)またはそれよりも重症のあらゆる疾患、といった所見のうち少なくとも1つによって支持された。
A positive prostate histopathology result is determined after MIP-1404 SPECT/CT imaging (i) (for population A) in at least one prostatic lobe, or (ii) (for population B) prostate biopsy. was defined as a clinically significant disease reported in an electronic case report form. For population A, the experimental assessment of the primary histopathological diagnosis of clinically significant disease was
・All Gleason classification diseases of more than 3+4 inside the prostate;
・Any Gleason classification disease in the 3+4 classification inside the prostate, with classification 4 exceeding or equal to 10%;
Supported by at least one of the following findings: stage T3 (pT3 according to the Prostate Cancer Staging System) or more severe disease within the prostate.
集団Bの対象が後にRPを受けた場合には、次いで、対象をサブグループ解析のために集団Bに残したまま、前立腺検体から得られた病理組織診断結果が参照基準として使用された。 If subjects in population B subsequently underwent RP, the histopathology results obtained from the prostate specimens were then used as the reference standard, leaving the subjects in population B for subgroup analysis.
陽性の撮像査定は、撮像閲覧者の裁定による(すなわち1404のSPECT撮像データ/CT撮像データの評価に基づく)前立腺がんの存在を指示する。 A positive imaging assessment indicates the presence of prostate cancer at the discretion of the imaging viewer (ie, based on evaluation of the SPECT/CT imaging data of 1404).
特異度は、病理組織診断で定義された臨床的に重要でない前立腺がんの対象(すなわち3+4またはそれ未満の合計グリーソンスコアを有する対象)の中の真陰性(TN)の割合として定義された。特異度は次式で計算された。
特異度=TN/(FP+TN)
Specificity was defined as the proportion of true negatives (TN) among subjects with clinically insignificant prostate cancer (ie, subjects with a total Gleason score of 3+4 or less) as defined by histopathology. Specificity was calculated using the following formula.
Specificity = TN/(FP+TN)
感度は、病理組織診断で定義された臨床的に重要な前立腺がんの対象(すなわち3+4を超える合計グリーソンスコアを有する対象)の中の真陽性(TP)の割合である。特異度は次式で計算された。
感度=TP/(TP+FN)
Sensitivity is the proportion of true positives (TP) among subjects with clinically significant prostate cancer (ie, subjects with a total Gleason score greater than 3+4) as defined by histopathology. Specificity was calculated using the following formula.
Sensitivity=TP/(TP+FN)
TBR閾値を変化させると、TP、FP、FN、およびTNの割合が異なったものになり、したがって感度および特異度も異なるものになった。図48Aに示されるROC曲線は、各閲覧者について、TBR閾値を変化させたとき、感度および特異度に結果として生じた変化をプロットしたものである。図に示されるように、すべてのAI支援の閲覧者の曲線が手動閲覧者の曲線の上にあり、AI支援の手法は性能が改善されたことを指示している。その上に、図48Bに示されるように、各閲覧者について曲線下面積(AUC)値が計算され、AI支援の閲覧者の成績は、手動閲覧者の成績と比較して改善されていた(3人の手動閲覧者のうち1人と3人のAI支援の閲覧者のうち1人との間の9つの可能な比較のうち5つについてp<0.05のp値)。加えて、特定のTBR閾値に関して、3302試験のAI支援の手法によって計算されたTBR値をこのTBR閾値と比較すると、臨床的に重要な前立腺がんに対して陽性または陰性の2項分類を遂行する際の高い特異度が与えられた。詳細には、前立腺がんに関する非常に低いリスク、低いリスク、中位のリスクを有する患者について、それぞれ95%、96%、および96%の特異度が21%の感度で見いだされた。 Varying the TBR threshold resulted in different proportions of TP, FP, FN, and TN, and therefore different sensitivities and specificities. The ROC curve shown in FIG. 48A plots the resulting changes in sensitivity and specificity as the TBR threshold is varied for each viewer. As shown, all AI-assisted viewers' curves are above the manual viewers' curve, indicating that the AI-assisted approach has improved performance. Moreover, as shown in Figure 48B, the area under the curve (AUC) value was calculated for each viewer, and the performance of the AI-assisted viewer was improved compared to that of the manual viewer ( p-value of p<0.05 for 5 of 9 possible comparisons between 1 of 3 manual viewers and 1 of 3 AI-assisted viewers). In addition, for a specific TBR threshold, comparing the TBR value calculated by the AI-assisted approach in the 3302 study to this TBR threshold performs a binary classification of positive or negative for clinically significant prostate cancer. This gave a high degree of specificity. Specifically, specificities of 95%, 96%, and 96% were found with a sensitivity of 21% for patients with very low risk, low risk, and intermediate risk for prostate cancer, respectively.
図49A~図49Cは、内部基準閲覧者(3302試験の3人のAI支援の閲覧者は図47においてこの人と比較された)の成績を3301試験の手動閲覧者の各々の成績と比較するものである。図47に示されたデータによって明示されるように、内部基準閲覧者の成績は、3302試験の3人のAI支援の閲覧者と高い相関関係があり、この3人を代表するものである。図49A~図49Cは、AI支援の内部基準閲覧者(図では「PIONEER読取り」と称される)と3301試験のそれぞれの手動閲覧者の間の2項分類(TBR値の閾値との比較に基づく臨床的に重要な疾患に関する陽性/陰性)のための個々のROCモデルを比較するものである。各事例において、手動閲覧者と比較したAI支援の閲覧者のAUCメトリックにおける改善は統計的に有意であった(0.01、0.02、および0.045のp値)。 Figures 49A-49C compare the performance of internal reference readers (the three AI-assisted viewers of the 3302 exam were compared to this person in Figure 47) with the performance of each of the manual viewers of the 3301 exam. It is something. As evidenced by the data shown in Figure 47, the performance of the internal reference viewers is highly correlated with and representative of the three AI-assisted viewers of the 3302 exam. Figures 49A-49C show the binary classification between the AI-assisted internal reference viewer (referred to as "PIONEER reader" in the figure) and the respective manual viewer of the 3301 study (comparison with the TBR value threshold). It compares individual ROC models for positive/negative results for clinically important diseases based on clinically relevant diseases. In each case, the improvement in the AUC metric for AI-assisted viewers compared to manual viewers was statistically significant (p-values of 0.01, 0.02, and 0.045).
図49A~図49Cに示されるように、AI支援の内部基準閲覧者に関するAUCは0.66(95% CI:0.61~0.71)であった。ロジスティク回帰は、感度65%(95% CI:61%~70%)および特異度62%(95% CI:58%~67%)で、最適なTBR閾値が14.4であることを指示した。自動化された性能は、手動閲覧者1(AUC 0.63、p=0.0445)、手動閲覧者2(AUC 0.62、p=0.0201)、および手動閲覧者3(AUC 0.62、p=0.0122)よりも大幅に優れていた。加えて、(患者の年齢、体重、およびPSAスコアを考慮に入れた)ベースライン共変量を含む多変数モデルが使用されたとき、3302試験のAI支援の手法の性能が3301試験の手読み手法と比較された。多変数モデルに対して、AI支援の内部基準閲覧者(AUC 0.80)は、臨床的に重要な疾患を手読み手法(AUC 0.77)よりも高い精度で予測することを明示した(p=0.0014)。 As shown in Figures 49A-49C, the AUC for the AI-assisted internal reference viewer was 0.66 (95% CI: 0.61-0.71). Logistic regression indicated that the optimal TBR threshold was 14.4, with a sensitivity of 65% (95% CI: 61% to 70%) and specificity of 62% (95% CI: 58% to 67%). . Automated performance was significantly lower for manual viewer 1 (AUC 0.63, p=0.0445), manual viewer 2 (AUC 0.62, p=0.0201), and manual viewer 3 (AUC 0.62). , p=0.0122). In addition, when a multivariable model including baseline covariates (taking into account patient age, weight, and PSA score) was used, the AI-assisted method in the 3302 study outperformed the hand-reading method in the 3301 study. was compared with. For multivariable models, AI-assisted internal reference readers (AUC 0.80) demonstrated higher accuracy in predicting clinically important diseases than manual reading methods (AUC 0.77). p=0.0014).
したがって、この例は、医師に支援されたPIONEER査定と1404の撮像データとの組合せが、前立腺がんの臨床的重要度を査定する際に、特異度および感度において手動閲覧者に対する著しい改善を表すことを明示するものである。加えて、PIONEERに支援された医師は非常に効率的であり、撮像データを解析するとき、診断の臨床的悪性度に関する有益な情報と併せて、高度に再現可能な結果をもたらす。
(実施例6)
L.実施例6:第1の機械学習モジュール(局所化機械)および第2の機械学習モジュール(セグメント化機械)によって実施された畳み込みニューラルネットワークの訓練および確認
Thus, this example shows that the combination of physician-assisted PIONEER assessment and 1404 imaging data represents a significant improvement over manual viewers in specificity and sensitivity in assessing the clinical significance of prostate cancer. This clearly indicates that In addition, PIONEER-assisted physicians are highly efficient and produce highly reproducible results when analyzing imaging data, along with useful information regarding the clinical grade of the diagnosis.
(Example 6)
L. Example 6: Training and validation of a convolutional neural network performed by a first machine learning module (localization machine) and a second machine learning module (segmentation machine)
実施例6は、本明細書で説明された態様および実施形態によって前立腺ボリュームを含む様々な組織ボリュームを識別するためにCT画像をセグメント化するのに使用されるCNNモジュールの訓練および確認を示す例である。この例では、ニューラルネットワークは、Tensorflowバックエンドを伴うKerasフレームワークを使用して定義されかつ訓練された。
i.訓練および確認データ
Example 6 is an example illustrating the training and validation of a CNN module used to segment CT images to identify various tissue volumes, including prostate volumes, according to aspects and embodiments described herein. It is. In this example, a neural network was defined and trained using the Keras framework with a Tensorflow backend.
i. Training and validation data
訓練および確認のデータは、(i)前立腺、(ii)膀胱、(iii)直腸、(iv)左大臀筋、(v)右大臀筋、(vi)左寛骨、(vii)右寛骨、ならびに(viii)仙骨および尾骨といった身体部分のすべてまたはいくつかを輪郭づける放射線技師によって補正される半自動セグメント化と結合されたCT画像を含むものであった。 Training and validation data included: (i) prostate, (ii) bladder, (iii) rectum, (iv) left gluteus maximus, (v) right gluteus maximus, (vi) left hipbone, (vii) right hipbone. It included CT images combined with semi-automatic segmentation corrected by a radiologist to contour all or some of the body parts such as bones and (viii) sacrum and coccyx.
局所化CNNを訓練するために、90の高品質のCT画像が、すべての上記身体部分のセグメント化を伴って使用された。左大臀筋の高解像度セグメント化用にセグメント化CNNを訓練するために、これらのCT画像および同じタイプの10の画像が使用された。前立腺の高解像度セグメント化用にセグメント化CNNを訓練するために、前立腺および膀胱において(疾患による)より多くの解剖的変異がある73のより低品質の画像の追加データセットが使用された。これらの追加画像は前立腺および膀胱のセグメント化とのみ対応させた。これらの73の画像に対して、直腸、左寛骨および右寛骨、ならびに仙骨および尾骨に関する仮標識が生成された。仮標識は、あらかじめ訓練されたネットワーク(100の高品質のCT画像に対して訓練されたネットワーク)を使用して生成された、予測された標識である。仮標識は、訓練の前に手動の標識と合併された。
ii.訓練の構成
To train the localized CNN, 90 high quality CT images were used with segmentation of all the above body parts. These CT images and 10 images of the same type were used to train a segmented CNN for high-resolution segmentation of the left gluteus maximus. An additional dataset of 73 lower quality images with more anatomical variation (due to disease) in the prostate and bladder was used to train the segmented CNN for high-resolution segmentation of the prostate. These additional images corresponded only to the segmentation of the prostate and bladder. For these 73 images, temporary landmarks were generated for the rectum, left and right hip bones, and sacrum and coccyx. Preliminary markers are predicted markers generated using a pre-trained network (network trained on 100 high quality CT images). Temporary markings were merged with manual markings prior to training.
ii. Training structure
各訓練実行は、config.jsonという名の構成ファイルによって定義された。構成ファイルには、(i)どのデータセットを使用するかということ、(ii)データの前処理、(iii)データを訓練および確認のセットへと区分すること、(iv)モデル構造、および(v)訓練のハイパーパラメータ、に関するパラメータが含まれていた。 Each training run uses config. Defined by a configuration file named json. The configuration file contains (i) which datasets to use, (ii) data preprocessing, (iii) partitioning of the data into training and validation sets, (iv) model structure, and ( v) Training hyperparameters.
この構成ファイルは、訓練されたモデルが推論のために使用されるとき、推論中に訓練中と同一の画像前処理が行われることを保証するために使用される。
iii.前処理
This configuration file is used when the trained model is used for inference to ensure that the same image preprocessing is done during inference as during training.
iii. Preprocessing
構成ファイルは、訓練中に適用される前処理ステップを定義する。いくつかの前処理ステップが含まれていた。局所化訓練のために周囲の空気を除去し、骨盤骨、膀胱、直腸、および前立腺によって画定された境界ボックスをセグメント化のために露出させる、クロップの前処理ステップが遂行された。固定値を引き去り、次いで別の固定値で割ることによって、一定の強度正規化ステップが遂行されたが、これらの値は、平均して画像におけるボクセルの強度が平均強度0および標準偏差1を有するように選択される。画像も、リサンプリングすることによって固定サイズに再形成される。局所化のために、各方向の解像度は、各方向においてメジアン径を有する画像に関して1/4に減少された。高解像度のセグメント化に関して、解像度は、各次元においてメジアン径を有する画像については変化しない。他の前処理ステップには、セグメント化標識のone-hotエンコーディングと、以下の節ivの「最適化」で定義されるようなセグメント化標識の再重み付けと、以下の節ivの「最適化」で定義されるようなデータ拡大とが含まれていた。 The configuration file defines the preprocessing steps applied during training. Several preprocessing steps were included. A crop preprocessing step was performed that removed the surrounding air for localization training and exposed the bounding box defined by the pelvic bone, bladder, rectum, and prostate for segmentation. A constant intensity normalization step was performed by subtracting a fixed value and then dividing by another fixed value such that on average the intensity of a voxel in the image has a mean intensity of 0 and a standard deviation of 1. selected as follows. Images are also reshaped to a fixed size by resampling. For localization, the resolution in each direction was reduced by a factor of 4 for images with a median diameter in each direction. For high resolution segmentation, the resolution does not change for images with a median diameter in each dimension. Other preprocessing steps include one-hot encoding of the segmentation indicators and reweighting of the segmentation indicators as defined in Section iv below, “Optimization”; This included data augmentation as defined in .
いくつかの前処理ステップは訓練を速めるためにオフラインで遂行され、前処理されたデータセットをもたらした。訓練に属するconfig.jsonが定義するのは、オンラインで行われる前処理ステップのみである。 Some preprocessing steps were performed offline to speed up training, resulting in a preprocessed dataset. config that belongs to training. json only defines a preprocessing step that is done online.
局所化訓練のために、オフライン前処理用の前処理ステップは、訓練されたCNNのディレクトリの中の個別のファイルmeta_data/prep_config.jsonに記憶されている。
iv.最適化
For localization training, the preprocessing step for offline preprocessing involves creating a separate file meta_data/prep_config.in the trained CNN's directory. json.
iv. optimization
訓練のために使用される損失関数は、(真の標識付けにおける)1つのクラスに一緒に属するすべてのボクセルが、(標識度数がデータセットにわたって中央度数と等しいとき)任意の他のクラスに属するすべてのボクセルと同一の重みを有するように重み付けされた、ボクセルに関する分類別の交差エントロピーである。この手法はクラスのバランスをとるものであり、前立腺がたとえば背景と比較して非常に小さいので、前立腺のセグメント化に重要である。 The loss function used for training is such that all voxels that belong together to one class (in the true labeling) belong to any other class (when the labeling frequency is equal to the median frequency across the dataset) The cross-entropy by classification for voxels, weighted to have the same weight for all voxels. This technique is class-balanced and is important for prostate segmentation, since the prostate is very small compared to the background, for example.
損失は、およそ2000~3000のエポックに対してAdam最適化プログラムを用いるミニバッチ勾配降下法を使用して最適化される。バッチサイズは1である。バッチサイズが1であることは、(バッチがたった1つの試料であるため)バッチ正規化がインスタンス正規化になることを意味する。性能を改善するために、インスタンス正規化は推論中にも強化される。 Loss is optimized using mini-batch gradient descent using the Adam optimization program for approximately 2000-3000 epochs. The batch size is 1. A batch size of 1 means that the batch normalization will be an instance normalization (as the batch is only one sample). Instance normalization is also enhanced during inference to improve performance.
学習率は、最初の少数エポックについては非常に低い学習率(たとえば1×10⁻⁵)の学習率スケジュールによって判定され、次いで、高い学習率(たとえば1×10⁻²)から各ステップにおいて低下する。学習率は、250エポックの後に半分にされ、次いで、続く500エポックの後に再び半分にされ、次いで、続く1000エポックの後に再び半分にされた。過剰適合を減少させるためにドロップアウトが使用される。ドロップアウト率は別々のネットワークに対して0.2~0.5の間で変化する(しかし、たとえば図13および図14に示されるように、ドロップアウト率は、所与のネットワークに適用される場合にはすべての位置において同一である)。適切なドロップアウト率は、複数の訓練の経験と、ドロップアウトが訓練および確認のセットに関する性能の差異に影響を及ぼす様子とに基づくものとなる。 The learning rate is determined by a learning rate schedule with a very low learning rate (e.g., 1×10 −5 ) for the first few epochs, and then decreasing at each step from a higher learning rate (e.g., 1×10 −2 ). . The learning rate was halved after 250 epochs, then halved again after the next 500 epochs, then halved again after the next 1000 epochs. Dropout is used to reduce overfitting. The dropout rate varies between 0.2 and 0.5 for separate networks (but the dropout rate applies to a given network, as shown for example in Figures 13 and 14). (in all cases, it is the same in all positions). Appropriate dropout rates will be based on experience with multiple trainings and how dropouts affect performance differences on training and validation sets.
ランダムな歪みを加えることによって増強された訓練画像データを使用する訓練手法より、ニューラルネットワークが画像の中の細かい詳細に的を絞ってしまうのが防止される。このように訓練されたニューラルネットワーク(たとえば局所化CNNおよびセグメント化CNN)は、画像アーチファクトのある画像に対して、アーチファクトを、訓練データに存在しないものまたは一般的でないものとして扱う(たとえば有効な局所化および/またはセグメント化を遂行する)ことができる。 Training techniques that use training image data augmented by adding random distortions prevent the neural network from honing in on small details in the images. Neural networks trained in this way (e.g., localized CNNs and segmented CNNs), for images with image artifacts, treat the artifacts as absent or uncommon in the training data (e.g., with valid localized CNNs). segmentation and/or segmentation).
訓練データを増強するために加えられるランダムな歪みは、付加的または増殖性のノイズを含み、平滑化された塩ノイズを加えられた。これらのランダムな歪みは、ある特定の確率で別々に適用される。これらのランダムな歪みは、ネットワークが最初にアーチファクトのない画像を扱うことを学習し、次いでノイズレベルが徐々に増加されるように、第1の数百のエポックには使用されないようにスケジュールされている。強度歪みは、100の高品質のCT画像にのみ適用され、73の低品質画像には既にアーチファクトがあるので適用されない。 Random distortions added to augment the training data include additive or multiplying noise, plus smoothed salt noise. These random distortions are applied separately with certain probabilities. These random distortions are scheduled not to be used for the first few hundred epochs so that the network first learns to work with artifact-free images and then the noise level is gradually increased. There is. Intensity distortion is only applied to the 100 high quality CT images and not to the 73 low quality images as they already have artifacts.
局所化CNNは、全身画像ならびに異なる身体部分の画像を扱う(たとえば入力として受け取る)ように訓練される。この目的のために、画像の(常に骨盤の境界ボックス全体を維持した)ランダムなクロップを用いる増強が使用される。
v.計算リソース
A localized CNN is trained to handle (eg, receive as input) whole-body images as well as images of different body parts. For this purpose, augmentation with a random crop of the image (always preserving the entire bounding box of the pelvis) is used.
v. computational resources
局所化訓練はNvidia GeForce GTX 1050上で行われ、訓練に数時間かかった。 Localization training was performed on a Nvidia GeForce GTX 1050 and took several hours to train.
高解像度のセグメント化訓練はNvidia GeForce GTX 1080 Ti上で行われ、訓練に2~3日かかった。
vi.モデル選択
High-resolution segmentation training was performed on a Nvidia GeForce GTX 1080 Ti and took 2-3 days to train.
vi. model selection
ニューラルネットワーク構造を最適化し、訓練のためのハイパーパラメータを選択するために、性能を測定するメトリックを得る必要がある。訓練の進度を評価するための主要なメトリックはソレンセン-ダイススコア(今後「ダイススコア」と称される)であり、重み付け(上記の節iv「最適化」で説明された重み付け)されたスコア、または個別の身体部分(前立腺または左大臀筋)に関するスコアである。 In order to optimize the neural network structure and select hyperparameters for training, it is necessary to obtain metrics to measure performance. The primary metric for evaluating training progress is the Sorensen-Dice score (hereafter referred to as the "Dice score"), which is a weighted (weighted as described in section iv. "Optimization" above) score, or scores for individual body parts (prostate or left gluteus maximus).
複数の画像にわたる結果を集約するとき、ほとんどの場合、評価されたダイススコアの平均値が(たとえばメトリックとして)使用される。ある特定の事例では、一定レベル未満のダイススコアを有する画像の度数が使用される。 When aggregating results across multiple images, the average value of the evaluated dice scores is most often used (e.g., as a metric). In one particular case, the frequency of images with dice scores below a certain level is used.
それぞれの局所化訓練の実行のために、訓練画像に関して最善の平均重み付けをされたダイススコアを有するモデルが選択された。前立腺をセグメント化するセグメント化ニューラルネットワークを訓練するために使用されるセグメント化訓練のために、選択の基礎として前立腺に関するダイススコアが使用された。左大臀筋をセグメント化するセグメント化ニューラルネットワークを訓練するために使用されるセグメント化訓練のために、左大臀筋に関するダイススコアが選択の基礎であった。補助の予測を用いるセグメント化訓練のために、ダイススコアは、メイン出力(補助の予測がないときにも存在する出力)からの予測に基づくものとされた。 For each localization training run, the model with the best average weighted dice score on the training images was selected. Dice scores for the prostate were used as the basis for selection for the segmentation training used to train the segmentation neural network to segment the prostate. The dice score for the left gluteus maximus was the basis of selection for the segmentation training used to train the segmentation neural network to segment the left gluteus maximus. For segmentation training with auxiliary predictions, the dice scores were based on predictions from the main output (the output that is also present in the absence of auxiliary predictions).
局所化CNNを訓練するとき、局所化CNNが訓練されていない画像を使用して局所化CNNの性能を評価することができるように、90のCT画像のうち30%が確認用に取っておかれた。高解像度の前立腺セグメント化用にセグメント化CNNを訓練するのに低品質画像のうち50しか使用されないように、低品質CT画像のうち23が確認用にとっておかれた(訓練用のCT画像は合計150になった)。 When training the localized CNN, 30% of the 90 CT images are set aside for validation so that the images on which the localized CNN is not trained can be used to evaluate the performance of the localized CNN. It was written. Twenty-three of the low-quality CT images were set aside for validation so that only 50 of the low-quality images were used to train the segmented CNN for high-resolution prostate segmentation (the training CT images were It became 150).
異なる局所化訓練の間で選択するとき、クロップの精度に対応するメトリックが使用された。クロップの精度はいくつかのメトリック/アスペクトに基づいて評価された。詳細には、1つのメトリックは、90の訓練および確認の画像のうち、全体の骨盤骨を包含するために0.1を超えるクロップマージンを必要とする画像をできるだけ少なくする、というものであった。別のメトリックは、境界ボックスの壁まで距離の誤差(誤りのボックスプロットを調べることによって評価された)をできるだけ小さくする、というものであった。別のメトリックは、(利用可能なグラウンドトルースセグメント化のない)102の低品質CT画像において、それらに対する粗いセグメント化の2D投影および重ね合わされた最終的な境界ボックスが、セグメント化と解剖学的構造との間の優れた一致を示すべきであり、特に、適切な領域をカバーするべきである、というものであった。 When choosing between different localization trainings, a metric corresponding to the accuracy of the crop was used. Crop accuracy was evaluated based on several metrics/aspects. In detail, one metric was to minimize the number of images out of 90 training and validation images that required a crop margin greater than 0.1 to encompass the entire pelvic bone. . Another metric was to make the error in the distance to the bounding box walls (assessed by examining the error boxplot) as small as possible. Another metric is that on 102 low-quality CT images (with no ground truth segmentation available), the 2D projection of the coarse segmentation and the superimposed final bounding box on them and, in particular, should cover the right areas.
異なる高解像度のセグメント化訓練の間で選択するとき、(i)訓練および確認のデータに関するダイススコア、(ii)訓練および確認のデータに関する前立腺の精度および再現度、(iii)グラウンドトルース膀胱と予測された前立腺との間のオーバラップ、および(iv)矢状方向面、軸面、および前額面においてスライスを通してスクロールすることができるCT画像ビューアにおけるCT画像に重ね合わせたセグメント化の例といったメトリック/アスペクトが考慮に入れられた。 When choosing between different high-resolution segmentation training, consider (i) Dice score on training and validation data, (ii) Prostate accuracy and recall on training and validation data, (iii) Ground truth bladder and prediction and (iv) an example of segmentation superimposed on the CT image in a CT image viewer that can scroll through the slice in the sagittal, axial, and coronal planes. Aspects were taken into account.
したがって、この例が提供する手法の例は、本明細書で説明された局所化機械学習モジュール(第1の機械学習モジュール)およびセグメント化機械学習モジュール(第2の機械学習モジュールおよび何らかの補助のセグメント化機械学習モジュール)において使用されるニューラルネットワークモデルを訓練するために使用され得るものである。
M.造影剤
Therefore, this example provides an example of a technique that includes the localized machine learning module (the first machine learning module) and the segmented machine learning module (the second machine learning module and any auxiliary segmentation machine learning module) described herein. It can be used to train neural network models used in computerized machine learning modules.
M. contrast agent
ある特定の実施形態では、3D機能的画像は、放射性医薬品を含む造影剤を使用する核医学画像である。核医学画像は、患者に放射性医薬品を投与した後に得られ、患者の内部の放射性医薬品の分布に関する情報をもたらす。放射性医薬品は放射性核種を含む化合物である。 In certain embodiments, the 3D functional image is a nuclear medicine image using a contrast agent that includes a radiopharmaceutical. Nuclear medicine images are obtained after administering a radiopharmaceutical to a patient and provide information about the distribution of the radiopharmaceutical within the patient. Radiopharmaceuticals are compounds that contain radionuclides.
核医学画像(たとえばPETスキャン、たとえばSPECTスキャン、たとえば全身スキャン、たとえば複合PET-CT画像、たとえば複合SPECT-CT画像)は、放射性医薬品の放射性核種から放出された放射を検知して画像を形成するものである。患者の内部の特定の放射性医薬品の分布は、血流または潅流などの生物学的機構、ならびに特定の酵素または受容体の結合相互作用によって判定され得る。異なる放射性医薬品は、異なる生物学的機構および/または特定の特殊な酵素もしくは受容体の結合相互作用を利用するように設計されてよく、したがって、患者に投与されたとき、患者の内部の特定のタイプの組織および/または領域の内部に選択的に集中する。患者の内部の、放射性医薬品の濃度が他の領域よりも高い領域から多量の放射線が放射され、これらの領域は、核医学画像において、より明るく見える。したがって、核医学画像の内部の強度変化は、患者の内部の放射性医薬品の分布をマッピングするために使用され得る。患者の内部の放射性医薬品のこのマッピングされた分布は、たとえば、患者の身体の様々な領域の内部のがん組織の存在を推測するために使用され得る。 Nuclear medicine images (e.g., PET scans, e.g., SPECT scans, e.g., whole body scans, e.g., combined PET-CT images, e.g., combined SPECT-CT images) detect radiation emitted by radionuclides of a radiopharmaceutical to form an image. It is something. The distribution of a particular radiopharmaceutical within a patient can be determined by biological mechanisms such as blood flow or perfusion, as well as specific enzyme or receptor binding interactions. Different radiopharmaceuticals may be designed to take advantage of different biological mechanisms and/or specific specialized enzyme or receptor binding interactions, and therefore, when administered to a patient, induce specific reactions within the patient. selectively concentrating within types of tissues and/or regions. Areas within the patient that have higher concentrations of radiopharmaceuticals emit more radiation than other areas, and these areas appear brighter in nuclear medicine images. Intensity changes within the nuclear medicine image can therefore be used to map the distribution of the radiopharmaceutical inside the patient. This mapped distribution of radiopharmaceuticals within a patient can be used, for example, to infer the presence of cancerous tissue within various regions of the patient's body.
たとえば、テクネチウム-99mメチレンヂホスホン酸(99mTc MDP)は、患者に投与されると、患者の骨格領域の内部で、特に悪性の骨病変に関連した異常な骨形成を有する部位に選択的に蓄積する。これらの部位における放射性医薬品の選択的な集中は、識別可能なホットスポット(核医学画像における高強度の局所的領域)を生成する。したがって、患者の全身スキャンの内部のそのようなホットスポットを識別することによって、転移性前立腺がんに関連した悪性の骨病変の存在が推測され得る。患者の全生存期間と、病状、進行、治効等を表す他の予後のメトリックとに相関するリスク指標は、患者に99mTc MDPを投与した後に得られた全身スキャンにおける強度変化の自動解析に基づいて計算され得る。ある特定の実施形態では、99mTc MDPと類似のやり方で他の放射性医薬品も使用され得る。 For example, technetium-99m methylene diphosphonic acid ( 99m Tc MDP), when administered to a patient, selectively acts within the patient's skeletal region, particularly in areas with abnormal bone formation associated with malignant bone lesions. accumulate. Selective concentration of the radiopharmaceutical at these sites produces discernible hotspots (localized areas of high intensity in nuclear medicine images). Therefore, by identifying such hotspots within a patient's whole body scan, the presence of malignant bone lesions associated with metastatic prostate cancer may be inferred. A risk index that correlates with a patient's overall survival and other prognostic metrics representing disease status, progression, treatment response, etc., was developed through automated analysis of intensity changes in whole-body scans obtained after administering 99m Tc MDP to patients. It can be calculated based on In certain embodiments, other radiopharmaceuticals may also be used in a similar manner as 99m Tc MDP.
ある特定の実施形態では、使用される特定の放射性医薬品は、使用される特定の核医学撮像診断法に依拠する。たとえば、18Fフッ化ナトリウム(NaF)は、これも99mTc MDPと同様に骨病変に蓄積するが、PET撮像とともに使用され得る。ある特定の実施形態では、PET撮像は、前立腺がん細胞によって容易に吸収される放射性ビタミンコリンを利用してよい。 In certain embodiments, the particular radiopharmaceutical used will depend on the particular nuclear medicine imaging modality used. For example, 18 F sodium fluoride (NaF), which also accumulates in bone lesions like 99m Tc MDP, can be used with PET imaging. In certain embodiments, PET imaging may utilize the radioactive vitamin choline, which is readily absorbed by prostate cancer cells.
ある特定の実施形態では、特定のタンパク質または目的の受容体に対して選択的に結合して特にがん組織における発現が増加する放射性医薬品が使用され得る。そのようなタンパク質または目的の受容体は、それだけではないが、結腸直腸がんにおいて発現するCEA、多発がんにおいて発現するHer2/neu、乳がんおよび卵巣がんにおいて発現するBRCA 1およびBRCA 2、ならびに黒色腫において発現するTRP-1およびTRP-2などの腫瘍抗原を含む。 In certain embodiments, radiopharmaceuticals may be used that selectively bind to particular proteins or receptors of interest, particularly increasing expression in cancer tissue. Such proteins or receptors of interest include, but are not limited to, CEA expressed in colorectal cancer, Her2/neu expressed in multiple cancers, BRCA 1 and BRCA 2 expressed in breast and ovarian cancer, and melanoma. including tumor antigens such as TRP-1 and TRP-2, which are expressed in tumors.
たとえば、人間の前立腺特異的膜抗原(PSMA)は、転移性疾患を含む前立腺がんにおいて上方調節される。PSMAは実質的にすべての前立腺がんによって発現し、その発現は、分化の乏しい転移性癌およびホルモン抵抗性癌においてさらに増加する。したがって、患者の核医学画像を得るために、1つまたは複数の放射性核種で標識されたPSMA結合剤(たとえばPSMAに対する親和性が高い化合物)に対応する放射性医薬品が使用され得、これから、患者の種々の領域(たとえば、それだけではないが、骨格領域を含む)の内部の前立腺がんの存在および/または状態を査定することができる。ある特定の実施形態では、PSMA結合剤を使用して得られる核医学画像は、前立腺がんが局在化状態のとき、前立腺の内部のがん組織の存在を識別するために使用される。ある特定の実施形態では、PSMA結合剤を含む放射性医薬品を使用して得られる核医学画像は、疾患が転移性のとき適切であるので、前立腺ばかりでなく、肺、リンパ節、および骨なども含む他の器官および組織領域の内部の種々の領域のがん組織の存在を識別するために使用される。 For example, human prostate-specific membrane antigen (PSMA) is upregulated in prostate cancer, including metastatic disease. PSMA is expressed by virtually all prostate cancers, and its expression is further increased in poorly differentiated metastatic and hormone-resistant cancers. Therefore, to obtain nuclear medicine images of a patient, a radiopharmaceutical corresponding to a PSMA binding agent (e.g. a compound with high affinity for PSMA) labeled with one or more radionuclides can be used, from which The presence and/or status of prostate cancer within various regions (eg, including, but not limited to, skeletal regions) can be assessed. In certain embodiments, nuclear medicine images obtained using PSMA binding agents are used to identify the presence of cancerous tissue within the prostate when prostate cancer is localized. In certain embodiments, nuclear medicine images obtained using radiopharmaceuticals containing PSMA binding agents are appropriate when the disease is metastatic, so that they can be used to image not only the prostate but also the lungs, lymph nodes, and bones. It is used to identify the presence of cancerous tissue in various areas within other organs and tissue areas including.
詳細には、放射性核種で標識されたPSMA結合剤は、患者に投与されると、PSMAに対する親和性に基づいてがん組織の内部に選択的に蓄積する。患者の内部の特定の部位における放射性核種で標識されたPSMA結合剤の選択的な集中は、99mTc MDPに関して上記で説明されたのと同様に、核医学画像における検知可能なホットスポットを生成する。PSMA結合剤は、PSMAを表現している身体の種々のがん組織および領域の内部に集中するので、患者の前立腺の内部の局所的ながんおよび/または患者の身体の様々な領域における転移がんが検知され、かつ評価され得る。以下で説明されるように、患者の全生存期間と、病状、進行、治効等を表す他の予後のメトリックとに相関するリスク指標は、患者にPSMA結合剤の放射性医薬品を投与した後に得られた核医学画像における強度変化の自動解析に基づいて計算され得る。 Specifically, when a radionuclide-labeled PSMA binding agent is administered to a patient, it selectively accumulates within cancer tissue based on its affinity for PSMA. Selective concentration of radionuclide-labeled PSMA binder at specific sites inside the patient produces detectable hot spots in nuclear medicine images, similar to that described above for 99m Tc MDP. . The PSMA binding agent is concentrated within various cancerous tissues and areas of the body expressing PSMA, thus preventing localized cancer within the patient's prostate and/or metastases in various areas of the patient's body. Cancer can be detected and evaluated. As explained below, risk indicators that correlate with overall patient survival and other prognostic metrics representing disease state, progression, treatment response, etc., are obtained after administering a PSMA-binding agent radiopharmaceutical to a patient. can be calculated based on automatic analysis of intensity changes in acquired nuclear medicine images.
種々の放射性核種で標識されたPSMA結合剤が、前立腺がんを検知して評価するための核医学撮像用の放射性医薬品造影剤として使用され得る。ある特定の実施形態では、特定の撮像診断法(たとえばPET、たとえばSPECT)および撮像される患者の特定の領域(たとえば器官)などの要因に依拠して、特定の放射性核種で標識されたPSMA結合剤が使用される。たとえば、PET撮像用には、ある特定の放射性核種で標識されたPSMA結合剤が適するが、SPECT撮像用には他のものが適する。たとえば、ある特定の放射性核種で標識されたPSMA結合剤は、患者の前立腺の撮像を容易にするものであり、主として疾患が局在化されるとき使用され、一方、他の結合剤は、患者の身体の全体にわたって器官および領域を撮像することを容易にし、転移性前立腺がんを評価するのに有効である。 PSMA binding agents labeled with various radionuclides can be used as radiopharmaceutical contrast agents for nuclear medicine imaging to detect and evaluate prostate cancer. In certain embodiments, depending on factors such as the particular imaging modality (e.g., PET, e.g., SPECT) and the particular region (e.g., organ) of the patient being imaged, the PSMA conjugate labeled with a particular radionuclide agent is used. For example, PSMA binders labeled with certain radionuclides are suitable for PET imaging, while others are suitable for SPECT imaging. For example, certain radionuclide-labeled PSMA binding agents facilitate imaging of a patient's prostate and are primarily used when the disease is localized, whereas other binding agents facilitates imaging organs and regions throughout the body and is effective in evaluating metastatic prostate cancer.
種々のPSMA結合剤と、これらの結合剤の放射性核種で標識されたバージョンとが、米国特許第8,778,305号、米国特許第8,211,401号、および米国特許第8,962,799号に説明されており、これらの各々の全体が参照によって本明細書に組み込まれる。
i.放射性核種で標識されたPSMA結合剤のPET撮像
Various PSMA binding agents and radionuclide-labeled versions of these binding agents are described in U.S. Pat. No. 8,778,305, U.S. Pat. No. 8,211,401, and U.S. Pat. No. 799, each of which is incorporated herein by reference in its entirety.
i. PET imaging of PSMA binder labeled with radionuclide
ある特定の実施形態では、放射性核種で標識されたPSMA結合剤は、PET撮像用に適切な、放射性核種で標識されたPSMA結合剤である。 In certain embodiments, the radionuclide-labeled PSMA binding agent is a radionuclide-labeled PSMA binding agent suitable for PET imaging.
ある特定の実施形態では、放射性核種で標識されたPSMA結合剤は[18F]DCFPyL(PyL(商標)とも称される、DCFPyL-18Fとも称される):
ある特定の実施形態では、放射性核種で標識されたPSMA結合剤は、[18F]DCFBC:
ある特定の実施形態では、放射性核種で標識されたPSMA結合剤は、68Ga-PSMA-HBED-CC(68Ga-PSMA-11とも称される):
ある特定の実施形態では、放射性核種で標識されたPSMA結合剤は、PSMA-617:
ある特定の実施形態では、放射性核種で標識されたPSMA結合剤は、PSMA-I&T:
ある特定の実施形態では、放射性核種で標識されたPSMA結合剤は、PSMA-1007:
ii.放射性核種で標識されたPSMA結合剤のSPECT撮像
In certain embodiments, the radionuclide-labeled PSMA binding agent is PSMA-1007:
ii. SPECT imaging of PSMA binder labeled with radionuclide
ある特定の実施形態では、放射性核種で標識されたPSMA結合剤は、SPECT撮像用に適切な、放射性核種で標識されたPSMA結合剤である。 In certain embodiments, the radionuclide-labeled PSMA binding agent is a radionuclide-labeled PSMA binding agent suitable for SPECT imaging.
ある特定の実施形態では、放射性核種で標識されたPSMA結合剤は1404(MIP-1404とも称される):
ある特定の実施形態では、放射性核種で標識されたPSMA結合剤は1405(MIP-1405とも称される):
ある特定の実施形態では、放射性核種で標識されたPSMA結合剤は1427(MIP-1427とも称される):
ある特定の実施形態では、放射性核種で標識されたPSMA結合剤は1428(MIP-1428とも称される):
ある特定の実施形態では、PSMA結合剤は、金属の放射性同位元素[たとえばテクネチウム(Tc)の放射性同位元素(たとえばテクネチウム-99m(99mTc))、たとえばレニウム(Re)の放射性同位元素(たとえばレニウム-188(188Re)、たとえばレニウム-186(186Re))、たとえばイットリウム(Y)の放射性同位元素(たとえば90Y)、たとえばルテチウム(Lu)の放射性同位元素(たとえば177Lu)、たとえばガリウム(Ga)の放射性同位元素(たとえば68Ga、たとえば67Ga)、たとえばインジウムの放射性同位元素(たとえば111In)、たとえば銅(Cu)の放射性同位元素(たとえば67Cu)]とキレート化することによって放射性核種で標識される。 In certain embodiments, the PSMA binder comprises a radioisotope of a metal [e.g., a radioisotope of technetium (Tc) (e.g., technetium-99m ( 99m Tc)), a radioisotope of rhenium (Re) (e.g., rhenium -188 ( 188 Re), e.g. rhenium -186 ( 186 Re)), e.g. a radioisotope of yttrium (Y) (e.g. 90 Y), e.g. a radioisotope of lutetium (Lu) (e.g. 177 Lu), e.g. gallium ( radioactive isotopes (e.g. 68 Ga, e.g. 67 Ga), e.g. radioisotopes of indium (e.g. 111 In), e.g. radioisotopes of copper (Cu) (e.g. 67 Cu)]. Labeled with a nuclide.
ある特定の実施形態では、1404は、放射性核種で標識される(たとえば金属の放射性同位元素とキレート化される)。ある特定の実施形態では、放射性核種で標識されたPSMA結合剤は、99mTcで標識された(たとえばキレート化された)1404である99mTc-MIP-1404:
ある特定の実施形態では、1405は、放射性核種で標識される(たとえば金属の放射性同位元素とキレート化される)。ある特定の実施形態では、放射性核種で標識されたPSMA結合剤は、99mTcで標識された(たとえばキレート化された)1405である99mTc-MIP-1405:
ある特定の実施形態では、1427は、金属の放射性同位元素で標識されて(たとえばキレート化されて)次式による化合物:
ある特定の実施形態では、1428は、金属の放射性同位元素で標識されて(たとえばキレート化されて)次式による化合物:
ある特定の実施形態では、放射性核種で標識されたPSMA結合剤は、PSMA-I&S:
N.コンピュータシステムおよびネットワークアーキテクチャ
In certain embodiments, the radionuclide-labeled PSMA binding agent is PSMA-I&S:
N. computer systems and network architecture
図36に示されるように、本明細書で説明されたシステム、方法、およびアーキテクチャを提供するのに使用するネットワーク環境3600の実装形態が示されて説明される。概要では、ここで図36を参照して、例示的クラウドコンピューティング環境3600のブロック図が示されて説明される。クラウドコンピューティング環境3600は1つまたは複数のリソースプロバイダ3602a、3602b、3602c(総称して3602)を含み得る。それぞれのリソースプロバイダ3602がコンピューティングリソースを含み得る。いくつかの実装形態では、コンピューティングリソースは、データを処理するのに使用されるあらゆるハードウェアおよび/またはソフトウェアを含み得る。たとえば、コンピューティングリソースに含まれ得るハードウェアおよび/またはソフトウェアは、アルゴリズム、コンピュータプログラム、および/またはコンピュータアプリケーションを実行することができる。いくつかの実装形態では、例示的コンピューティングリソースは、記憶および検索の能力を有するアプリケーションサーバおよび/またはデータベースを含み得る。それぞれのリソースプロバイダ3602は、クラウドコンピューティング環境3600における任意の他のリソースプロバイダ3602に接続され得る。いくつかの実装形態では、リソースプロバイダ3602はコンピュータネットワーク3608を通じて接続され得る。それぞれのリソースプロバイダ3602は、コンピュータネットワーク3608を通じて、1つまたは複数のコンピューティングデバイス3604a、3604b、3604c(総称して3604)に接続され得る。 As shown in FIG. 36, an implementation of a network environment 3600 used to provide the systems, methods, and architectures described herein is shown and described. In summary, with reference now to FIG. 36, a block diagram of an example cloud computing environment 3600 is shown and described. Cloud computing environment 3600 may include one or more resource providers 3602a, 3602b, 3602c (collectively 3602). Each resource provider 3602 may include computing resources. In some implementations, computing resources may include any hardware and/or software used to process data. For example, computing resources may include hardware and/or software that may execute algorithms, computer programs, and/or computer applications. In some implementations, example computing resources may include an application server and/or database with storage and retrieval capabilities. Each resource provider 3602 may be connected to any other resource provider 3602 in the cloud computing environment 3600. In some implementations, resource provider 3602 may be connected through computer network 3608. Each resource provider 3602 may be connected to one or more computing devices 3604a, 3604b, 3604c (collectively 3604) through a computer network 3608.
クラウドコンピューティング環境3600はリソースマネージャ3606を含み得る。リソースマネージャ3606は、コンピュータネットワーク3608を通じて、リソースプロバイダ3602およびコンピューティングデバイス3604に接続され得る。いくつかの実装形態では、リソースマネージャ3606は、1つまたは複数のリソースプロバイダ3602が1つまたは複数のコンピューティングデバイス3604にコンピューティングリソースを提供するのを容易にし得る。リソースマネージャ3606は、特定のコンピューティングデバイス3604からコンピューティングリソースに関する要求を受け取ってよい。リソースマネージャ3606は、コンピューティングデバイス3604によって要求されたコンピューティングリソースを提供することができる1つまたは複数のリソースプロバイダ3602を識別し得る。リソースマネージャ3606は、コンピューティングリソースを提供するためにリソースプロバイダ3602を選択してよい。リソースマネージャ3606は、リソースプロバイダ3602と特定のコンピューティングデバイス3604との間の接続を容易にし得る。いくつかの実装形態では、リソースマネージャ3606は、特定のリソースプロバイダ3602と特定のコンピューティングデバイス3604との間の接続を確立し得る。いくつかの実装形態では、リソースマネージャ3606は、特定のコンピューティングデバイス3604を、要求されたコンピューティングリソースを有する特定のリソースプロバイダ3602に向け直してよい。 Cloud computing environment 3600 may include resource manager 3606. Resource manager 3606 may be connected to resource provider 3602 and computing device 3604 through computer network 3608. In some implementations, resource manager 3606 may facilitate one or more resource providers 3602 to provide computing resources to one or more computing devices 3604. Resource manager 3606 may receive requests for computing resources from particular computing devices 3604. Resource manager 3606 may identify one or more resource providers 3602 that can provide computing resources requested by computing device 3604. Resource manager 3606 may select resource provider 3602 to provide computing resources. Resource manager 3606 may facilitate connections between resource provider 3602 and particular computing device 3604. In some implementations, resource manager 3606 may establish a connection between a particular resource provider 3602 and a particular computing device 3604. In some implementations, resource manager 3606 may redirect a particular computing device 3604 to a particular resource provider 3602 that has the requested computing resource.
図37は、本開示で説明された技術を実施するために使用され得るコンピューティングデバイス3700およびモバイルコンピューティングデバイス3750の例を示すものである。コンピューティングデバイス3700は、ラップトップコンピュータ、デスクトップコンピュータ、ワークステーション、携帯情報端末、サーバ、ブレードサーバ、メインフレーム、および他の適切なコンピュータなどのデジタルコンピュータの様々な形態を表すように意図されている。モバイルコンピューティングデバイス3750は、携帯情報端末、携帯電話、スマートフォン、および他の類似のコンピューティングデバイスなどのモバイルデバイスの様々な形態を表すように意図されている。ここに示された構成要素、それらの接続および関係、ならびにそれらの機能は単なる例示であり、限定することを意味するわけではない。
FIG. 37 illustrates examples of a
コンピューティングデバイス3700は、プロセッサ3702と、メモリ3704と、記憶デバイス3706と、メモリ3704および複数の高速拡張ポート3710に接続する高速インターフェース3708と、低速拡張ポート3714および記憶デバイス3706に接続する低速インターフェース3712とを含む。プロセッサ3702、メモリ3704、記憶デバイス3706、高速インターフェース3708、高速拡張ポート3710、および低速インターフェース3712の各々が、様々なバスを使用して相互接続されており、共通のマザーボード上に、または他の適切なやり方で、取り付けられてよい。プロセッサ3702は、高速インターフェース3708に結合されたディスプレイ3716などの外部入出力デバイス上のGUI向けのグラフィカル情報を表示する命令を含む、コンピューティングデバイス3700の内部で実行するための、メモリ3704または記憶デバイス3706に記憶された命令を処理することができる。他の実装形態では、複数のメモリおよび複数のタイプのメモリと併せて、必要に応じて複数のプロセッサおよび/または複数のバスが使用され得る。また、複数のコンピューティングデバイスが接続されてよく、各デバイスが、(たとえばサーババンク、一群のブレードサーバ、またはマルチプロセッサシステムとしての)必要な動作の一部分をもたらす。したがって、複数の機能が「プロセッサ」によって遂行されるものとして説明される場合、この用語が本明細書で使用されるように、これは、複数の機能が、任意数のコンピューティングデバイス(1つまたは複数)の任意数のプロセッサ(1つまたは複数)によって遂行される実施形態を包含する。その上、機能が「プロセッサ」によって遂行されると説明される場合、これは(たとえば分散コンピューティングシステムにおける)任意数のコンピューティングデバイス(1つまたは複数)の任意数のプロセッサ(1つまたは複数)によって機能が遂行される実施形態を包含する。
The
メモリ3704は、コンピューティングデバイス3700の内部の情報を記憶する。いくつかの実装形態では、メモリ3704は揮発性メモリユニットである。いくつかの実装形態では、メモリ3704は不揮発性メモリユニットである。メモリ3704は、磁気ディスクまたは光ディスクなど、コンピュータ可読媒体の別の形態でもよい。
記憶デバイス3706は、コンピューティングデバイス3700に大量記憶をもたらすことができる。いくつかの実装形態では、記憶デバイス3706は、ストレージエリアネットワークにおけるデバイスまたは他の構成を含めて、フロッピー(登録商標)ディスクデバイス、ハードディスクデバイス、光ディスクデバイス、テープデバイス、フラッシュメモリもしくは他の類似の固体メモリデバイス、またはデバイスの配列などのコンピュータ可読媒体でよく、またはこれらを含有してよい。命令は情報担体に記憶され得る。命令は、1つまたは複数の処理デバイス(たとえばプロセッサ3702)によって実行されたとき、上記で説明されたものなどの1つまたは複数の方法を遂行する。命令は、コンピュータ可読媒体または機械可読媒体(たとえばメモリ3704、記憶デバイス3706、またはプロセッサ3702上のメモリ)などの1つまたは複数の記憶デバイスによって記憶され得る。
高速インターフェース3708は、コンピューティングデバイス3700に関する帯域幅に集中する動作を管理し、低速インターフェース3712はより低い帯域幅に集中する動作を管理する。そのような機能の割り当ては単なる例である。いくつかの実装形態では、高速インターフェース3708に結合されるのは、メモリ3704、ディスプレイ3716(たとえばグラフィックスプロセッサまたはアクセラレータを介して)、および様々な拡張カード(図示せず)を受け入れ得る高速拡張ポート3710である。この実装形態では、低速インターフェース3712は、記憶デバイス3706および低速拡張ポート3714に結合されている。様々な通信ポート(たとえばUSB、Bluetooth(登録商標)、イーサネット(登録商標)、無線イーサネット(登録商標))を含み得る低速拡張ポート3714は、たとえばネットワークアダプタを介して、キーボード、ポインティングデバイス、スキャナ、またはスイッチもしくはルータなどのネットワーキングデバイスなど1つまたは複数の入出力デバイスに結合され得る。
コンピューティングデバイス3700は、図に示されるように、複数の異なる形態で実施され得る。たとえば、コンピューティングデバイス3700は、標準的なサーバ3720として実施されてよく、またはそのようなサーバの群において複数回実施されてもよい。加えて、コンピューティングデバイス3700はラップトップコンピュータ3722などのパーソナルコンピュータで実施され得る。コンピューティングデバイス3700はラックサーバシステム3724の一部分として実施されてもよい。あるいは、コンピューティングデバイス3700の構成要素は、モバイルコンピューティングデバイス3750などのモバイルデバイス(図示せず)の他の構成要素と組み合わされてよい。そのようなデバイスの各々が、コンピューティングデバイス3700およびモバイルコンピューティングデバイス3750のうち1つまたは複数を含有してよく、全体のシステムは、互いに通信する複数のコンピューティングデバイスで構成され得る。
モバイルコンピューティングデバイス3750は、数ある構成要素のなかで、プロセッサ3752、メモリ3764、ディスプレイ3754などの入出力デバイス、通信インターフェース3766、およびトランシーバ3768を含む。モバイルコンピューティングデバイス3750は、追加記憶機構を設けるために、マイクロドライブまたは他のデバイスなどの記憶デバイスも備え得る。プロセッサ3752、メモリ3764、ディスプレイ3754、通信インターフェース3766、およびトランシーバ3768の各々が、様々なバスを使用して相互接続されており、構成要素のうちいくつかが、必要に応じて、共通のマザーボード上に、または他のやり方で、取り付けられてよい。
プロセッサ3752は、メモリ3764に記憶された命令を含めて、モバイルコンピューティングデバイス3750の内部の命令を実行することができる。プロセッサ3752は、複数の個別のアナログプロセッサおよびデジタルプロセッサを含むチップのチップセットとして実施され得る。プロセッサ3752は、たとえばユーザインターフェースの制御、モバイルコンピューティングデバイス3750によって実行されるアプリケーション、およびモバイルコンピューティングデバイス3750による無線通信など、モバイルコンピューティングデバイス3750の他の構成要素の協調をもたらし得る。
プロセッサ3752は、制御インターフェース3758、およびディスプレイ3754に結合されたディスプレイインターフェース3756を通じて、ユーザと通信し得る。ディスプレイ3754は、たとえばTFT(薄膜トランジスタ駆動液晶ディスプレイ)ディスプレイもしくはOLED(有機発光ダイオード)ディスプレイ、または他の適切なディスプレイ技術でよい。ディスプレイインターフェース3756は、ユーザにグラフィカル情報や他の情報を提示するために、ディスプレイ3754を駆動するための適切な回路を備え得る。制御インターフェース3758は、ユーザからコマンドを受け取って、プロセッサ3752に対するサブミッションに変換してよい。加えて、外部インターフェース3762は、モバイルコンピューティングデバイス3750の他のデバイスとの至近エリア通信を可能にするように、プロセッサ3752との通信をもたらし得る。外部インターフェース3762は、たとえば、いくつかの実装形態では有線通信を提供してよく、または他の実装形態では無線通信を提供してよく、複数のインターフェースが使用されてもよい。
メモリ3764は、モバイルコンピューティングデバイス3750の内部の情報を記憶する。メモリ3764は、コンピュータ可読媒体、揮発性メモリユニット、または不揮発性メモリユニットのうち1つまたは複数として実施され得る。たとえばSIMM(シングルインラインメモリモジュール)カードインターフェースを含み得る拡張メモリ3774も設けられてよく、拡張インターフェース3772を介してモバイルコンピューティングデバイス3750に接続され得る。拡張メモリ3774は、モバイルコンピューティングデバイス3750のために追加の記憶空間をもたらしてよく、またはモバイルコンピューティングデバイス3750のためにアプリケーションもしくは他の情報を記憶してもよい。具体的には、増設メモリ3774は、上記で説明された処理を実行するかまたは補足するための命令を含み得、安全情報も含み得る。したがって、たとえば、拡張メモリ3774はモバイルコンピューティングデバイス3750のためのセキュリティモジュールとして設けられてよく、モバイルコンピューティングデバイス3750の安全な使用を可能にする命令を用いてプログラムされ得る。加えて、セキュアアプリケーションが、付加情報とともに、SIMMカード上にハッキング不可能なやり方で識別情報を配置するように、SIMMカードによって与えられてよい。
以下で論じられるように、メモリは、たとえばフラッシュメモリおよび/またはNVRAMメモリ(不揮発性ランダムアクセスメモリ)を含み得る。いくつかの実装形態では、情報担体に記憶された命令が1つまたは複数の処理デバイス(たとえばプロセッサ3752)によって実行されたとき、上記で説明されたものなどの1つまたは複数の方法を遂行する。命令は、1つまたは複数のコンピュータ可読媒体または機械可読媒体(たとえばメモリ3764、拡張メモリ3774、またはプロセッサ3752上のメモリ)などの1つまたは複数の記憶デバイスによって記憶され得る。いくつかの実装形態では、命令は、伝播するシグナルで、たとえばトランシーバ3768または外部インターフェース3762を通じて受け取られ得る。
As discussed below, the memory may include, for example, flash memory and/or NVRAM memory (non-volatile random access memory). In some implementations, the instructions stored on the information carrier, when executed by one or more processing devices (e.g., processor 3752), perform one or more methods such as those described above. . The instructions may be stored by one or more storage devices, such as one or more computer-readable media or machine-readable media (eg,
モバイルコンピューティングデバイス3750は、必要に応じてデジタル信号処理回路を含み得る通信インターフェース3766を介して無線通信してよい。通信インターフェース3766は、とりわけ、GSM(登録商標)音声通話(グローバル移動体通信システム)、SMS(ショートメッセージサービス)、EMS(拡張メッセージサービス)、またはMMSメッセージ(マルチメディアメッセージングサービス)、CDMA(符号分割多元接続)、TDMA(時分割多重アクセス)、PDC(パーソナルデジタルセルラー)、WCDMA(登録商標)(広帯域符号分割多元接続)、CDMA2000、またはGPRS(汎用パケット無線システム)など、様々なモードまたはプロトコールの下で通信をもたらし得る。そのような通信は、たとえば、トランシーバ3768を通じて無線周波数を使用して生じ得る。加えて、Bluetooth(登録商標)、Wi-FiTMまたは他のそのようなトランシーバ(図示せず)などを使用して、近距離通信が生じ得る。加えて、GPS(全地球測位システム)受信器モジュール3770が、モバイルコンピューティングデバイス3750に、さらなるナビゲーション関連、ロケーション関連の無線データを供給してよく、これはモバイルコンピューティングデバイス3750上で実行されるアプリケーションによって必要に応じて使用され得る。
モバイルコンピューティングデバイス3750は、ユーザが話した情報を受け取って使用可能なデジタル情報に変換し得る音声コーデック3760を使用して音声通信してもよい。音声コーデック3760は、たとえばモバイルコンピューティングデバイス3750のハンドセットの中のスピーカなどを通じて、ユーザ向けの可聴音を同様に生成してよい。そのような音は、音声電話発呼からの音、録音された音(たとえば音声メール、音楽ファイルなど)、およびモバイルコンピューティングデバイス3750上で動作するアプリケーションによって生成された音も含み得る。
モバイルコンピューティングデバイス3750は、図に示されるように、複数の異なる形態で実施され得る。たとえば、モバイルコンピューティングデバイス3750は携帯電話3780として実施され得る。モバイルコンピューティングデバイス3750は、スマートフォン3782、携帯情報端末、または他の類似のモバイルデバイスの一部分としても実施され得る。
ここで説明したシステムおよび技術の様々な実装形態は、デジタル電子回路、集積回路、特別に設計されたASIC(特定用途向け集積回路)、コンピュータハードウェア、ファームウェア、ソフトウェア、および/またはそれらの組合せで実現され得る。これらの様々な実装形態は、記憶システム、少なくとも1つの入力デバイス、および少なくとも1つの出力デバイスに対して命令およびデータを送受するように結合された特殊用途または汎用の少なくとも1つのプログラマブルプロセッサを含むプログラマブルシステム上で実行可能かつ/または解釈可能な1つまたは複数のコンピュータプログラムにおける実装形態を含み得る。 Various implementations of the systems and techniques described herein may include digital electronic circuits, integrated circuits, specially designed ASICs (Application Specific Integrated Circuits), computer hardware, firmware, software, and/or combinations thereof. It can be realized. These various implementations include a storage system, at least one input device, and at least one programmable processor, special purpose or general purpose, coupled to transmit instructions and data to and from at least one output device. It may include implementation in one or more computer programs executable and/or interpretable on the system.
(プログラム、ソフトウェア、ソフトウェアアプリケーションまたはコードとしても公知である)これらのコンピュータプログラムは、プログラマブルプロセッサ向けの機械命令を含み、高レベルの手続き型プログラミング言語および/またはオブジェクト指向プログラミング言語、および/またはアセンブリ言語/機械語で実施され得るものである。本明細書で使用されるように、機械可読媒体およびコンピュータ可読媒体という用語は、プログラマブルプロセッサに対して、機械命令および/またはデータを供給するために使用される任意のコンピュータプログラム製品、装置および/またはデバイス(たとえば磁気ディスク、光ディスク、メモリ、プログラマブル論理デバイス(PLD))を指すものであり、機械可読シグナルとして機械命令を受け取る機械可読媒体を含む。機械可読シグナルという用語は、プログラマブルプロセッサに機械命令および/またはデータを供給するために使用される任意のシグナルを指す。 These computer programs (also known as programs, software, software applications, or code) include machine instructions for a programmable processor and are implemented in high-level procedural and/or object-oriented programming languages, and/or assembly languages. /Can be implemented in machine language. As used herein, the terms machine-readable medium and computer-readable medium refer to any computer program product, device, and/or device that is used to provide machine instructions and/or data to a programmable processor. or device (eg, magnetic disk, optical disk, memory, programmable logic device (PLD)), including a machine-readable medium that receives machine instructions as machine-readable signals. The term machine-readable signal refers to any signal used to provide machine instructions and/or data to a programmable processor.
ここで説明したシステムおよび技術は、ユーザとの相互作用をもたらすために、ユーザに情報を表示するためのディスプレイデバイス(たとえばCRT(ブラウン管)またはLCD(液晶ディスプレイ)モニタ)、キーボード、およびユーザがコンピュータに入力を供給することができるポインティングデバイス(たとえばマウスまたはトラックボール)を有するコンピュータ上で実施され得る。ユーザとの相互作用もたらすために他の種類のデバイスも使用され得、たとえば、ユーザに与えられるフィードバックは任意の形態の感覚フィードバック(たとえば視覚フィードバック、聴覚フィードバック、または触覚フィードバック)であり得て、ユーザからの入力は、音響入力、音声入力、または触覚入力を含む任意の形態で受け取られ得る。 The systems and techniques described herein may include a display device (e.g., a CRT (cathode ray tube) or LCD (liquid crystal display) monitor) for displaying information to the user, a keyboard, and a computer that the user uses to provide interaction with the user. The computer may be implemented on a computer having a pointing device (eg, a mouse or trackball) that can provide input to the computer. Other types of devices may also be used to provide interaction with the user; for example, the feedback provided to the user may be any form of sensory feedback (e.g., visual, auditory, or tactile feedback); Input from may be received in any form, including acoustic, audio, or tactile input.
ここで説明したシステムおよび技術を実施することができるコンピューティングシステムは、(たとえばデータサーバとしての)バックエンド構成要素を含むもの、またはミドルウェア構成要素(たとえばアプリケーションサーバ)を含むもの、またはフロントエンド構成要素(たとえばユーザがここで説明されたシステムおよび技術の実装形態と相互作用することができるグラフィカルユーザインターフェースまたはウエブブラウザを有するクライアントコンピュータ)を含むもの、あるいはそのようなバックエンド構成要素、ミドルウェア構成要素、またはフロントエンド構成要素の任意の組合せであり得る。システムの構成要素は、デジタルデータ通信の任意の形態または媒体(たとえば通信ネットワーク)によって相互接続され得る。通信ネットワークの例には、ローカルエリアネットワーク(LAN)、広域ネットワーク(WAN)、およびインターネットが含まれる。 A computing system capable of implementing the systems and techniques described herein includes a back-end component (e.g., as a data server), or a middleware component (e.g., an application server), or a front-end component. elements (e.g., a client computer having a graphical user interface or web browser that allows a user to interact with implementations of the systems and techniques described herein), or such back-end components, middleware components; , or any combination of front-end components. The components of the system may be interconnected by any form or medium of digital data communication (eg, a communication network). Examples of communication networks include local area networks (LANs), wide area networks (WANs), and the Internet.
コンピューティングシステムはクライアントおよびサーバを含むことができる。クライアントとサーバは一般に互いにから遠隔であり、一般的には通信ネットワークを介して相互作用する。クライアントとサーバの関係は、互いにクライアントとサーバの関係を有するそれぞれのコンピュータ上で実行されるコンピュータプログラムによって生じる。 A computing system can include clients and servers. Clients and servers are generally remote from each other and typically interact via a communications network. The client-server relationship is created by computer programs running on respective computers that have a client-server relationship with each other.
いくつかの実装形態では、本明細書で説明された様々なモジュールは、単一のモジュールまたは組み合わされたモジュールへと分離すること、組み合わせること、または組み込むことができる。図に表されたモジュールは、本明細書で説明されたシステムを、そこに示されたソフトウェアアーキテクチャに限定するようには意図されていない。 In some implementations, the various modules described herein can be separated, combined, or combined into a single module or combined modules. The modules depicted in the figures are not intended to limit the systems described herein to the software architecture illustrated therein.
本明細書で説明された異なる実装形態の要素は、上記で具体的には説明されていない他の実装形態を形成するために組み合わされてよい。本明細書で説明された処理、コンピュータプログラム、データベースなどから、それらの動作に悪影響を及ぼすことなく、要素が省略され得る。加えて、図に表された論理の流れは、望ましい結果を達成するために、示された特定の順番または順序を必要とするわけではない。本明細書で説明された機能を遂行するために、様々な個別要素が、1つまたは複数の個々の要素へと組み合わされてよい。 Elements of different implementations described herein may be combined to form other implementations not specifically described above. Elements may be omitted from the processes, computer programs, databases, etc. described herein without adversely affecting their operation. Additionally, the logic flows depicted in the figures do not require the particular order or order shown to achieve desirable results. Various individual elements may be combined into one or more individual elements to perform the functions described herein.
説明の全体にわたって、装置およびシステムが、特定の構成要素を有するか、含むか、もしくは備えると説明された場合、またはプロセスおよび方法が、特定のステップを有するか、含むか、もしくは備えると説明された場合には、列挙された構成要素からなる、もしくは本質的になる、本発明の装置、およびシステムがさらにあること、ならびに列挙された処理ステップからなる、もしくは本質的になる、本発明によるプロセスおよび方法がさらにあることが企図されている。 Throughout the description, when devices and systems are described as having, including, or comprising particular components, or processes and methods are described as having, including, or comprising particular steps. If so, there are further apparatuses and systems according to the invention consisting of or consisting essentially of the listed components, and processes according to the invention consisting of or consisting essentially of the listed processing steps. Further methods and methods are contemplated.
ステップの順番またはある特定のアクションを遂行するための順番は、本発明が動作可能である限り重要ではないことを理解されたい。その上に、2つまたはそれよりも多くのステップまたはアクションが同時に行われてよい。 It is to be understood that the order of steps or order of performing certain actions is not important so long as the invention is operable. Additionally, two or more steps or actions may be performed simultaneously.
本発明が、特定の好ましい実施形態を参照しながら詳細に示されて説明されてきたが、添付の特許請求の範囲によって定義されるような本発明の趣旨および範囲から逸脱することなく、形態および詳細における様々な変更形態が作製され得ることが当業者には理解されるはずである。 While the invention has been shown and described in detail with reference to certain preferred embodiments, the present invention may be made in form and description without departing from the spirit and scope of the invention as defined by the appended claims. It should be understood by those skilled in the art that various changes in detail may be made.
Claims (47)
(a)コンピューティングデバイスの前記プロセッサが、解剖学的撮像診断法を使用して得られた前記対象の3D解剖学的画像を受け取るステップであって、前記3D解剖学的画像が、対象の内部の組織のグラフィカル表現を含み、前記グラフィカル表現の少なくとも一部分が、前記対象の骨盤領域に対応する、ステップと、
(b)前記プロセッサが、機能的撮像診断法を使用して得られた前記対象の3D機能的画像を受け取るステップであって、前記3D機能的画像が、複数のボクセルを含み、前記複数のボクセルが、それぞれ、前記対象の内部の特定の物理ボリュームを表し、かつ、前記特定の物理ボリュームから放射されて検知された放射線を表す強度値を有し、前記3D機能的画像の前記複数のボクセルの少なくとも一部分が、前記対象の前記骨盤領域の内部の物理ボリュームを表す、ステップと、
(c)前記プロセッサが、第1のモジュールを使用して、前記3D解剖学的画像の内部の初期の目的ボリューム(VOI)を識別するステップであって、前記初期のVOIが、前記対象の前記骨盤領域の内部の組織に対応し、前記対象の前記骨盤領域の外部の組織は除外する、ステップと、
(d)前記プロセッサが、第2のモジュールを使用して、前記対象の前記前立腺に対応する前記初期のVOIの内部の前立腺ボリュームを識別するステップと、
(e)前記プロセッサが、前記3D機能的画像と、前記3D解剖学的画像の前記初期のVOIの内部で識別された前記前立腺ボリュームとを使用して、前記摂取メトリックを計算するステップと
を含む、方法。 automatically processing a 3D anatomical image to identify a 3D volume within said 3D anatomical image corresponding to the prostate of interest and to calculate an uptake metric representative of uptake of the radiopharmaceutical therein; A method, the method being performed in a computer comprising and/or in communication with a processor, the method comprising:
(a) the processor of a computing device receives a 3D anatomical image of the object obtained using an anatomical imaging diagnostic method, wherein the 3D anatomical image is an internal image of the object; a graphical representation of tissue of the subject, at least a portion of the graphical representation corresponding to a pelvic region of the subject;
(b) the processor receiving a 3D functional image of the subject obtained using a functional imaging diagnostic method, the 3D functional image comprising a plurality of voxels, the plurality of voxels of the plurality of voxels of the 3D functional image, each representing a particular physical volume within the object and having an intensity value representing the detected radiation emitted from the particular physical volume; at least a portion representing a physical volume within the pelvic region of the subject;
(c) the processor using a first module to identify an initial volume of interest (VOI) within the 3D anatomical image, the initial VOI corresponding to tissue internal to the pelvic region and excluding tissue external to the pelvic region of the subject;
(d) the processor uses a second module to identify a prostate volume within the initial VOI that corresponds to the prostate of the subject;
(e) the processor calculates the uptake metric using the 3D functional image and the prostate volume identified within the initial VOI of the 3D anatomical image. ,Method.
前記対象の骨盤骨、
前記対象の膀胱、
前記対象の直腸、および
前記対象の殿筋
からなる群から選択される1つまたは複数の特定の組織に対応する、請求項1~4のいずれか一項に記載の方法。 Step (d) includes the step of the processor using the second module to identify one or more additional tissue volumes within the initial VOI that are separate from the prostate volume. , the one or more additional tissue volumes comprising:
the target pelvic bone;
the subject's bladder;
5. The method of any one of claims 1 to 4, corresponding to one or more specific tissues selected from the group consisting of: the subject's rectum; and the subject's gluteal muscles.
前記プロセッサが、前記第2のモジュールによって、前記初期のVOIの内部の複数のボクセルの各々について、尤度値のセットを計算するステップであって、前記尤度値のセットが、前記組織のセットのうち1つまたは複数の組織の各々について、前記ボクセルが前記組織の内部の物理ボリュームを表すことの尤度を表す対応する尤度値を含む、ステップと、
前記初期のVOIの内部の前記複数のボクセルの各々について、前記プロセッサが、前記ボクセルについて計算された前記尤度値のセットに基づいて、前記ボクセルを前記特定の組織に対応するものとして分類するステップと
を含む、請求項6に記載の方法。 classifying each voxel within the initial VOI,
the processor calculating, by the second module, a set of likelihood values for each of a plurality of voxels within the initial VOI, the set of likelihood values being equal to the set of tissue values; including, for each one or more of the tissues, a corresponding likelihood value representing the likelihood that the voxel represents an internal physical volume of the tissue;
for each of the plurality of voxels within the initial VOI, the processor classifies the voxel as corresponding to the particular tissue based on the set of likelihood values calculated for the voxel; 7. The method of claim 6, comprising: and.
(i)異なる組織の所定のセットから選択された特定の組織に対応するものとして前記特定のボクセルを識別する値、または
(ii)前記異なる組織の所定のセットのうちいかなるものにも対応しない背景組織エリアとして前記特定のボクセルを識別する値
を出力する、請求項6に記載の方法。 The second module receives the initial VOI as input, and for each particular voxel within the initial VOI:
(i) a value identifying said particular voxel as corresponding to a particular tissue selected from a predetermined set of different tissues; or (ii) a background that does not correspond to any of said predetermined set of different tissues. 7. The method of claim 6, outputting a value identifying the particular voxel as a tissue area.
前記対象の骨盤骨と、
前記対象の膀胱と、
前記対象の直腸と、
前記対象の殿筋と
からなる群から選択される1つまたは複数の組織と、前記対象の前記前立腺とを含む、請求項6から8のいずれか一項に記載の方法。 The set of different tissues is
the target pelvic bone;
the subject's bladder;
the rectum of the subject;
9. The method of any one of claims 6 to 8, comprising one or more tissues selected from the group consisting of: gluteal muscle of the subject; and the prostate of the subject.
ステップ(e)において、前記プロセッサが、前記3D機能的画像と、前記基準ボリュームと、前記前立腺ボリュームとを使用して、前記摂取メトリックを計算するステップと
を含む、請求項1~9のいずれか一項に記載の方法。 the processor identifying a reference volume within the 3D anatomical image, the reference volume corresponding to a reference tissue region other than the prostate within the subject;
and, in step (e), the processor calculates the uptake metric using the 3D functional image, the reference volume, and the prostate volume. The method described in paragraph 1.
前記プロセッサが、前記3D解剖学的画像の前記初期のVOIの内部で識別された前記前立腺ボリュームに対応する前記3D機能的画像の1つまたは複数のボクセルの強度値を使用して、標的強度値を識別するステップと、
前記プロセッサが、前記3D解剖学的画像の内部で識別された前記基準ボリュームに対応する前記3D機能的画像の1つまたは複数のボクセルの強度値を使用して、背景強度値を計算するステップと、
ステップ(e)において、前記プロセッサが、前記標的強度値の前記背景強度値に対する比を前記摂取メトリックの前記TBR値として計算するステップと
を含む、請求項10に記載の方法。 The uptake metric includes a tumor-to-background ratio (TBR) value, and calculating the TBR value comprises:
The processor determines a target intensity value using intensity values of one or more voxels of the 3D functional image corresponding to the prostate volume identified within the initial VOI of the 3D anatomical image. a step of identifying
the processor calculating a background intensity value using intensity values of one or more voxels of the 3D functional image corresponding to the reference volume identified within the 3D anatomical image; ,
and, in step (e), the processor calculates a ratio of the target intensity value to the background intensity value as the TBR value of the intake metric.
ステップ(e)の前に、前記プロセッサが、前記3D解剖学的画像の内部の前記識別された膀胱ボリュームに対応する前記3D機能的画像のボクセルの強度を使用して、前記膀胱からのクロストークを補正するステップと
を含む、請求項1~16のいずれか一項に記載の方法。 the processor identifying a bladder volume within the 3D anatomical image that corresponds to the subject's bladder;
Prior to step (e), the processor uses the intensities of voxels of the 3D functional image corresponding to the identified bladder volume within the 3D anatomical image to reduce crosstalk from the bladder. 17. A method according to any one of claims 1 to 16, comprising the step of correcting.
前記プロセッサが、前記識別された膀胱ボリュームの外部にある、前記3D解剖学的画像の1つまたは複数の領域に対応する前記3D機能的画像の1つまたは複数のボクセルの強度に対する、前記対象の前記膀胱の内部の放射性医薬品に由来する強度の寄与をモデル化する、1つまたは複数の膀胱強度ブリード関数を確立するステップであって、前記1つまたは複数の膀胱強度ブリード関数が、前記寄与を、前記識別された膀胱ボリュームからの距離の関数としてモデル化する、ステップと、
前記3D解剖学的画像の内部の前記識別された前立腺ボリュームに対応する前記3D機能的画像の1つまたは複数のボクセルの各々について、前記プロセッサが、前記1つまたは複数の膀胱強度ブリード関数を使用して、前記ボクセルの強度を膀胱クロストークに対して調整するステップと
を含む、請求項17に記載の方法。 the step of correcting crosstalk from the bladder,
the processor is configured to determine the intensity of one or more voxels of the 3D functional image corresponding to one or more regions of the 3D anatomical image that are external to the identified bladder volume; establishing one or more bladder intensity bleed functions that model an intensity contribution from a radiopharmaceutical within the bladder, the one or more bladder intensity bleed functions , as a function of distance from the identified bladder volume;
For each one or more voxels of the 3D functional image that correspond to the identified prostate volume within the 3D anatomical image, the processor uses the one or more bladder intensity bleed functions. and adjusting the voxel intensity for bladder crosstalk.
前記プロセッサが、前記識別された膀胱ボリュームに対して形態学的拡張操作を適用することにより、拡張された膀胱ボリュームを識別するステップと、
ステップ(e)において、前記プロセッサが、前記3D機能的画像のボクセルの強度値を使用して、(i)前記3D解剖学的画像の前記VOIの内部で識別された前記前立腺ボリュームに対応するが、(ii)前記拡張された膀胱ボリュームの内部の前記3D解剖学的画像の領域には対応しない前記摂取メトリックを計算するステップと
を含む、請求項1~16のいずれか一項に記載の方法。 the processor identifying a bladder volume within the 3D anatomical image that corresponds to the subject's bladder;
the processor identifying an expanded bladder volume by applying a morphological expansion operation to the identified bladder volume;
In step (e), the processor uses intensity values of voxels of the 3D functional image to (i) correspond to the prostate volume identified within the VOI of the 3D anatomical image; (ii) calculating the intake metric that does not correspond to a region of the 3D anatomical image inside the expanded bladder volume. .
(g)前記プロセッサが、前記GUIの内部に、前記3D解剖学的画像および/または前記3D機能的画像を、いずれかが表示用に選択されて個別にレンダリングされ得るように、あるいは両方が表示用に選択されて、3D解剖学的画像に3D機能的画像を重ね合わせることによって一緒にレンダリングされ得るように、選択可能かつスーパーインポーズ可能な層としてグラフィカルレンダリングをもたらすステップと
を含む、請求項1~26のいずれか一項に記載の方法。 (f) the processor provides a display of an interactive graphical user interface (GUI) to present a visual representation of the 3D anatomical image and/or the 3D functional image to a user ;
(g) the processor displays the 3D anatomical image and/or the 3D functional image within the GUI such that either one can be selected for display and individually rendered, or both; and providing the graphical rendering as selectable and superimposable layers such that the 3D anatomical image can be rendered together by superimposing the 3D functional image on the 3D anatomical image. 27. The method according to any one of 1 to 26.
前記摂取メトリックの前記計算の前記承認に対応する前記ユーザ入力の前記受取りに応答して、前記プロセッサが、前記対象向けに、前記計算された摂取メトリックを含む報告を生成するステップと
を含む、請求項33に記載の方法。 the processor receiving, via the graphical widget, user input corresponding to approval of the calculation of the intake metric;
and in response to the receipt of the user input corresponding to the approval of the calculation of the intake metric, the processor generates a report for the subject that includes the calculated intake metric. The method according to item 33.
前記摂取メトリックの前記計算の前記不承認に対応するユーザ入力の受取りに応答して、前記プロセッサが、前記摂取メトリックの更新された値を計算するのに使用する前記3D機能的画像の1つまたは複数のボクセルのユーザ選択のためのボクセル選択グラフィカル要素の表示をもたらすステップと、
前記プロセッサが、前記ボクセル選択グラフィカル要素を介して、前記摂取メトリックの更新された値を計算するのに使用する前記3D機能的画像の1つまたは複数のボクセルの前記ユーザ選択を受け取るステップと、
前記プロセッサが、前記ユーザ選択のボクセルを使用して、前記摂取メトリックの値を更新するステップと、
前記プロセッサが、前記対象向けに、前記更新された摂取メトリックを含む報告を生成するステップと
を含む、請求項33に記載の方法。 the processor receiving, via the graphical widget, user input corresponding to a disapproval of the calculation of the intake metric;
one or more of the 3D functional images that the processor uses to calculate an updated value of the ingestion metric in response to receiving a user input corresponding to the disapproval of the calculation of the ingestion metric; providing a display of a voxel selection graphical element for a user selection of voxels of;
the processor receiving, via the voxel selection graphical element, the user selection of one or more voxels of the 3D functional image for use in calculating an updated value of the uptake metric;
the processor updating the value of the intake metric using the user-selected voxels;
and generating a report for the subject that includes the updated intake metric.
前記プロセッサが、前記不承認の識別を含む、前記対象向けの報告を生成するステップと
を含む、請求項33に記載の方法。 the processor receiving, via the graphical widget, user input corresponding to a disapproval of the calculation of the intake metric;
34. The method of claim 33, wherein the processor generates a report for the subject that includes an identification of the disapproval.
プロセッサと、
命令を記憶したメモリと
を備え、前記命令は、前記プロセッサによって実行されると、
(a)解剖学的撮像診断法を使用して得られた前記対象の3D解剖学的画像を受け取るステップであって、前記3D解剖学的画像が、対象の内部の組織のグラフィカル表現を含み、前記グラフィカル表現の少なくとも一部分が、前記対象の骨盤領域に対応する、ステップと、
(b)機能的撮像診断法を使用して得られた前記対象の3D機能的画像を受け取るステップであって、前記3D機能的画像が、複数のボクセルを含み、前記複数のボクセルが、それぞれ、前記対象の内部の特定の物理ボリュームを表し、かつ、前記特定の物理ボリュームから放射されて検知された放射線を表す強度値を有し、前記3D機能的画像の前記複数のボクセルの少なくとも一部分が、前記対象の前記骨盤領域の内部の物理ボリュームを表す、ステップと、
(c)第1のモジュールを使用して、前記3D解剖学的画像の内部の初期の目的ボリューム(VOI)を識別するステップであって、前記初期のVOIが、前記対象の前記骨盤領域の内部の組織に対応し、前記対象の前記骨盤領域の外部の組織は除外する、ステップと、
(d)第2のモジュールを使用して、前記対象の前記前立腺に対応する前記初期のVOIの内部の前立腺ボリュームを識別するステップと、
(e)前記3D機能的画像と、前記3D解剖学的画像の前記初期のVOIの内部で識別された前記前立腺ボリュームとを使用して、前記摂取メトリックを計算するステップと
を前記プロセッサに行わせる、システム。 automatically processing a 3D anatomical image to identify a 3D volume within said 3D anatomical image corresponding to the prostate of interest and to calculate an uptake metric representative of uptake of the radiopharmaceutical therein; A system,
a processor;
a memory storing instructions, and when executed by the processor, the instructions include:
(a) receiving a 3D anatomical image of the object obtained using an anatomical imaging diagnostic method, the 3D anatomical image including a graphical representation of internal tissue of the object; at least a portion of the graphical representation corresponds to a pelvic region of the subject;
(b) receiving a 3D functional image of the subject obtained using a functional imaging diagnostic method, the 3D functional image comprising a plurality of voxels, each of the plurality of voxels comprising: at least a portion of the plurality of voxels of the 3D functional image represent a particular physical volume within the object and have intensity values representative of detected radiation emitted from the particular physical volume; representing a physical volume within the pelvic region of the subject;
(c) using a first module to identify an initial volume of interest (VOI) within the 3D anatomical image, wherein the initial VOI is within the pelvic region of the subject; , excluding tissue outside the pelvic region of the subject;
(d) using a second module to identify a prostate volume within the initial VOI that corresponds to the prostate of the subject;
(e) calculating the uptake metric using the 3D functional image and the prostate volume identified within the initial VOI of the 3D anatomical image. ,system.
(b)請求項41に記載のシステムを備えるコンピュータ支援検知(CADe)デバイスと
を含む組合せ製品。 (a) a radiolabeled PSMA binder;
(b) a computer-aided detection (CADe) device comprising the system of claim 41 .
Priority Applications (1)
| Application Number | Priority Date | Filing Date | Title |
|---|---|---|---|
| JP2023083859A JP2023116486A (en) | 2018-01-08 | 2023-05-22 | System for and method of segmenting image on high-speed neural network basis and determining intake of radiopharmaceutical |
Applications Claiming Priority (7)
| Application Number | Priority Date | Filing Date | Title |
|---|---|---|---|
| US201862614935P | 2018-01-08 | 2018-01-08 | |
| US62/614,935 | 2018-01-08 | ||
| US16/003,006 | 2018-06-07 | ||
| US16/003,006 US10973486B2 (en) | 2018-01-08 | 2018-06-07 | Systems and methods for rapid neural network-based image segmentation and radiopharmaceutical uptake determination |
| US201862749574P | 2018-10-23 | 2018-10-23 | |
| US62/749,574 | 2018-10-23 | ||
| PCT/US2019/012486 WO2019136349A2 (en) | 2018-01-08 | 2019-01-07 | Systems and methods for rapid neural network-based image segmentation and radiopharmaceutical uptake determination |
Related Child Applications (1)
| Application Number | Title | Priority Date | Filing Date |
|---|---|---|---|
| JP2023083859A Division JP2023116486A (en) | 2018-01-08 | 2023-05-22 | System for and method of segmenting image on high-speed neural network basis and determining intake of radiopharmaceutical |
Publications (3)
| Publication Number | Publication Date |
|---|---|
| JP2021509721A JP2021509721A (en) | 2021-04-01 |
| JP2021509721A5 JP2021509721A5 (en) | 2022-01-11 |
| JP7448476B2 true JP7448476B2 (en) | 2024-03-12 |
Family
ID=67144460
Family Applications (2)
| Application Number | Title | Priority Date | Filing Date |
|---|---|---|---|
| JP2020537168A Active JP7448476B2 (en) | 2018-01-08 | 2019-01-07 | System and method for fast neural network-based image segmentation and radiopharmaceutical uptake determination |
| JP2023083859A Pending JP2023116486A (en) | 2018-01-08 | 2023-05-22 | System for and method of segmenting image on high-speed neural network basis and determining intake of radiopharmaceutical |
Family Applications After (1)
| Application Number | Title | Priority Date | Filing Date |
|---|---|---|---|
| JP2023083859A Pending JP2023116486A (en) | 2018-01-08 | 2023-05-22 | System for and method of segmenting image on high-speed neural network basis and determining intake of radiopharmaceutical |
Country Status (6)
| Country | Link |
|---|---|
| EP (1) | EP3738097A2 (en) |
| JP (2) | JP7448476B2 (en) |
| CN (1) | CN111602174A (en) |
| AU (1) | AU2019205766A1 (en) |
| CA (1) | CA3085441A1 (en) |
| WO (1) | WO2019136349A2 (en) |
Families Citing this family (29)
| Publication number | Priority date | Publication date | Assignee | Title |
|---|---|---|---|---|
| EP3533063A1 (en) | 2016-10-27 | 2019-09-04 | Progenics Pharmaceuticals, Inc. | Network for medical image analysis, decision support system, and related graphical user interface (gui) applications |
| US10973486B2 (en) | 2018-01-08 | 2021-04-13 | Progenics Pharmaceuticals, Inc. | Systems and methods for rapid neural network-based image segmentation and radiopharmaceutical uptake determination |
| TW202040518A (en) | 2019-01-07 | 2020-11-01 | 瑞典商艾西尼診斷公司 | Systems and methods for platform agnostic whole body image segmentation |
| JP2022530040A (en) | 2019-04-24 | 2022-06-27 | プロジェニクス ファーマシューティカルズ, インコーポレイテッド | Systems and methods for bidirectional adjustment of intensity window processing in nuclear medicine imaging |
| AU2020261370A1 (en) | 2019-04-24 | 2021-10-14 | Exini Diagnostics Ab | Systems and methods for automated and interactive analysis of bone scan images for detection of metastases |
| WO2021030629A1 (en) * | 2019-08-14 | 2021-02-18 | Genentech, Inc. | Three dimensional object segmentation of medical images localized with object detection |
| US11544407B1 (en) | 2019-09-27 | 2023-01-03 | Progenics Pharmaceuticals, Inc. | Systems and methods for secure cloud-based medical image upload and processing |
| US11900597B2 (en) | 2019-09-27 | 2024-02-13 | Progenics Pharmaceuticals, Inc. | Systems and methods for artificial intelligence-based image analysis for cancer assessment |
| US11564621B2 (en) | 2019-09-27 | 2023-01-31 | Progenies Pharmacenticals, Inc. | Systems and methods for artificial intelligence-based image analysis for cancer assessment |
| TWI709147B (en) * | 2019-10-16 | 2020-11-01 | 中國醫藥大學附設醫院 | System of deep learning neural network in prostate cancer bone metastasis identification based on whole body bone scan images |
| CN110942439B (en) * | 2019-12-05 | 2023-09-19 | 北京华恒盛世科技有限公司 | Image restoration and enhancement method based on satellite picture defects |
| CN111325714B (en) * | 2020-01-21 | 2024-03-26 | 上海联影智能医疗科技有限公司 | Method for processing region of interest, computer device and readable storage medium |
| US11282601B2 (en) | 2020-04-06 | 2022-03-22 | International Business Machines Corporation | Automatic bounding region annotation for localization of abnormalities |
| US11321844B2 (en) | 2020-04-23 | 2022-05-03 | Exini Diagnostics Ab | Systems and methods for deep-learning-based segmentation of composite images |
| US11386988B2 (en) | 2020-04-23 | 2022-07-12 | Exini Diagnostics Ab | Systems and methods for deep-learning-based segmentation of composite images |
| AU2021305935A1 (en) | 2020-07-06 | 2023-02-02 | Exini Diagnostics Ab | Systems and methods for artificial intelligence-based image analysis for detection and characterization of lesions |
| US11721428B2 (en) * | 2020-07-06 | 2023-08-08 | Exini Diagnostics Ab | Systems and methods for artificial intelligence-based image analysis for detection and characterization of lesions |
| RU2743316C1 (en) * | 2020-08-14 | 2021-02-17 | Автономная некоммерческая образовательная организация высшего образования Сколковский институт науки и технологий | Method for identification of binding sites of protein complexes |
| EP4016453B1 (en) * | 2020-12-21 | 2023-08-09 | Siemens Healthcare GmbH | Method and system for automated segmentation of biological object parts in mri |
| CN112767299B (en) * | 2021-04-07 | 2021-07-06 | 成都真实维度科技有限公司 | Multi-mode three-dimensional image registration and fusion method |
| CN113256784B (en) * | 2021-07-02 | 2021-09-28 | 武大吉奥信息技术有限公司 | Method for performing super-efficient drawing of GIS space three-dimensional voxel data based on GPU |
| CA3226515A1 (en) * | 2021-07-30 | 2023-02-02 | Desmond Hirson | System, method and/or computer-readable medium for mapping and displaying anatomical structures in a user-friendly manner |
| CN113781636B (en) * | 2021-09-14 | 2023-06-20 | 杭州柳叶刀机器人有限公司 | Pelvic bone modeling method and system, storage medium, and computer program product |
| WO2023092124A1 (en) * | 2021-11-22 | 2023-05-25 | Genentech, Inc. | Machine-learning based segmentation of biological objects in medical images |
| CN114119558B (en) * | 2021-11-29 | 2024-05-03 | 桂林电子科技大学 | Method for automatically generating nasopharyngeal carcinoma image diagnosis structured report |
| WO2023117740A1 (en) * | 2021-12-21 | 2023-06-29 | Koninklijke Philips N.V. | System and method for classifying lesions |
| EP4202827A1 (en) * | 2021-12-21 | 2023-06-28 | Koninklijke Philips N.V. | System and method for classifying lesions |
| WO2023232897A1 (en) * | 2022-06-02 | 2023-12-07 | Antaros Medical Ab | Automated image inference from whole-body medical images |
| CN116259414B (en) * | 2023-05-09 | 2023-08-18 | 南京诺源医疗器械有限公司 | Metastatic lymph node distinguishing model, construction method and application |
Citations (1)
| Publication number | Priority date | Publication date | Assignee | Title |
|---|---|---|---|---|
| JP2017500537A (en) | 2013-10-18 | 2017-01-05 | モレキュラ インサイト ファーマシューティカルズ インコーポレイテッド | Method of using SPECT / CT analysis to determine cancer stage |
Family Cites Families (10)
| Publication number | Priority date | Publication date | Assignee | Title |
|---|---|---|---|---|
| US7935055B2 (en) * | 2003-09-19 | 2011-05-03 | Siemens Medical Solutions Usa, Inc. | System and method of measuring disease severity of a patient before, during and after treatment |
| CA2732632C (en) | 2008-08-01 | 2018-01-09 | The Johns Hopkins University | Psma-binding agents and uses thereof |
| EP2389361B1 (en) | 2008-12-05 | 2016-08-24 | Molecular Insight Pharmaceuticals, Inc. | Technetium- and rhenium-bis(heteroaryl) complexes and methods of use thereof for inhibiting psma |
| WO2010065899A2 (en) | 2008-12-05 | 2010-06-10 | Molecular Insight Pharmaceuticals, Inc. | Technetium-and rhenium-bis(heteroaryl)complexes and methods of use thereof |
| US20100158332A1 (en) * | 2008-12-22 | 2010-06-24 | Dan Rico | Method and system of automated detection of lesions in medical images |
| CN101639937B (en) * | 2009-09-03 | 2011-12-14 | 复旦大学 | Super-resolution method based on artificial neural network |
| US9547061B2 (en) * | 2012-01-27 | 2017-01-17 | Koninklijke Philips N.V. | Tumor segmentation and tissue classification in 3D multi-contrast |
| WO2014113786A1 (en) * | 2013-01-18 | 2014-07-24 | H. Lee Moffitt Cancer Center And Research Institute, Inc. | Quantitative predictors of tumor severity |
| EP2816525A1 (en) * | 2013-06-18 | 2014-12-24 | Thomson Licensing | Method and apparatus for generating a super-resolved image from a single image |
| CN106127819B (en) * | 2016-06-30 | 2019-10-08 | 上海联影医疗科技有限公司 | The method and device thereof of vessel centerline are extracted in medical image |
-
2019
- 2019-01-07 WO PCT/US2019/012486 patent/WO2019136349A2/en unknown
- 2019-01-07 AU AU2019205766A patent/AU2019205766A1/en active Pending
- 2019-01-07 EP EP19702719.6A patent/EP3738097A2/en active Pending
- 2019-01-07 JP JP2020537168A patent/JP7448476B2/en active Active
- 2019-01-07 CA CA3085441A patent/CA3085441A1/en active Pending
- 2019-01-07 CN CN201980007207.2A patent/CN111602174A/en active Pending
-
2023
- 2023-05-22 JP JP2023083859A patent/JP2023116486A/en active Pending
Patent Citations (1)
| Publication number | Priority date | Publication date | Assignee | Title |
|---|---|---|---|---|
| JP2017500537A (en) | 2013-10-18 | 2017-01-05 | モレキュラ インサイト ファーマシューティカルズ インコーポレイテッド | Method of using SPECT / CT analysis to determine cancer stage |
Non-Patent Citations (6)
| Title |
|---|
| I.Frank Ciernik, M.D. et al.,"3D-Segmentation of the 18F-choline PET Signal for Target Volume Definition in Radiation Therapy of the Prostate",Technology in Cancer Research and Treatment ,Volume 6, Number 1,2007年02月,pp.23-30,ISSN 1533-0346 |
| Kelei He et al.,"Pelvic Organ Segmentation Using Distinctive Curve Guided Fully Convolutional Networks",IEEE TRANSACTIONS ON MEDICAL IMAGING,VOL. 38, NO. 2,2019年02月,pp.585-595 |
| LITJENS GEERT; ET AL,A SURVEY ON DEEP LEARNING IN MEDICAL IMAGE ANALYSIS,MEDICAL IMAGE ANALYSIS,2017年07月25日,VOL:42,PAGE(S):60 - 88,http://dx.doi.org/10.1016/j.media.2017.07.005 |
| MA LING; ET AL,AUTOMATIC SEGMENTATION OF THE PROSTATE ON CT IMAGES USING DEEP LEARNING AND MULTI-ATLAS FUSION,PROCEEDINGS OF SPIE,米国,2017年02月24日,VOL:10133,PAGE(S):101332O(1 - 9),http://dx.doi.org/10.1117/12.2255755 |
| May Sadik et al.,"Automated 3D segmentation of the prostate gland in CT images - a first step towards objective measurements of prostate uptake in PET and SPECT images",Journal of Nuclear Medicine,2017年05月,vol.50(supplement 1),1074,インターネット<URL:https://jnm.snmjournals.org/content/58/supplement_1/1074.short> |
| Payel Ghosh et al.,"Prostate segmentation on pelvic CT images using a genetic algorithm",PROCEEDINGS OF SPIE 6914,Medical Imaging 2008: Image Processing,2008年03月11日,691442,doi: 10.1117/12.770834 |
Also Published As
| Publication number | Publication date |
|---|---|
| CN111602174A (en) | 2020-08-28 |
| CA3085441A1 (en) | 2019-07-11 |
| JP2023116486A (en) | 2023-08-22 |
| JP2021509721A (en) | 2021-04-01 |
| EP3738097A2 (en) | 2020-11-18 |
| WO2019136349A2 (en) | 2019-07-11 |
| AU2019205766A1 (en) | 2020-06-18 |
| TW201941218A (en) | 2019-10-16 |
| WO2019136349A3 (en) | 2019-08-15 |
Similar Documents
| Publication | Publication Date | Title |
|---|---|---|
| JP7448476B2 (en) | System and method for fast neural network-based image segmentation and radiopharmaceutical uptake determination | |
| US10973486B2 (en) | Systems and methods for rapid neural network-based image segmentation and radiopharmaceutical uptake determination | |
| US20200342600A1 (en) | Systems and methods for rapid neural network-based image segmentation and radiopharmaceutical uptake determination | |
| US11941817B2 (en) | Systems and methods for platform agnostic whole body image segmentation | |
| US11937962B2 (en) | Systems and methods for automated and interactive analysis of bone scan images for detection of metastases | |
| US20220375612A1 (en) | Network for medical image analysis, decision support system, and related graphical user interface (gui) applications | |
| US20210093249A1 (en) | Systems and methods for artificial intelligence-based image analysis for cancer assessment | |
| CA3163190A1 (en) | Systems and methods for artificial intelligence-based image analysis for detection and characterization of lesions | |
| US20230115732A1 (en) | Systems and methods for automated identification and classification of lesions in local lymph and distant metastases | |
| Velichko et al. | A Comprehensive Review of Deep Learning Approaches for Magnetic Resonance Imaging Liver Tumor Analysis | |
| TWI835768B (en) | Systems and methods for rapid neural network-based image segmentation and radiopharmaceutical uptake determination | |
| US20230351586A1 (en) | Systems and methods for artificial intelligence-based image analysis for detection and characterization of lesions | |
| US20230410985A1 (en) | Systems and methods for assessing disease burden and progression |
Legal Events
| Date | Code | Title | Description |
|---|---|---|---|
| A521 | Request for written amendment filed |
Free format text: JAPANESE INTERMEDIATE CODE: A523 Effective date: 20211206 |
|
| A621 | Written request for application examination |
Free format text: JAPANESE INTERMEDIATE CODE: A621 Effective date: 20211206 |
|
| A977 | Report on retrieval |
Free format text: JAPANESE INTERMEDIATE CODE: A971007 Effective date: 20221031 |
|
| A131 | Notification of reasons for refusal |
Free format text: JAPANESE INTERMEDIATE CODE: A131 Effective date: 20221122 |
|
| A601 | Written request for extension of time |
Free format text: JAPANESE INTERMEDIATE CODE: A601 Effective date: 20230214 |
|
| A521 | Request for written amendment filed |
Free format text: JAPANESE INTERMEDIATE CODE: A523 Effective date: 20230522 |
|
| A02 | Decision of refusal |
Free format text: JAPANESE INTERMEDIATE CODE: A02 Effective date: 20230825 |
|
| A521 | Request for written amendment filed |
Free format text: JAPANESE INTERMEDIATE CODE: A523 Effective date: 20231211 |
|
| A911 | Transfer to examiner for re-examination before appeal (zenchi) |
Free format text: JAPANESE INTERMEDIATE CODE: A911 Effective date: 20240119 |
|
| TRDD | Decision of grant or rejection written | ||
| A01 | Written decision to grant a patent or to grant a registration (utility model) |
Free format text: JAPANESE INTERMEDIATE CODE: A01 Effective date: 20240219 |
|
| A61 | First payment of annual fees (during grant procedure) |
Free format text: JAPANESE INTERMEDIATE CODE: A61 Effective date: 20240229 |
|
| R150 | Certificate of patent or registration of utility model |
Ref document number: 7448476 Country of ref document: JP Free format text: JAPANESE INTERMEDIATE CODE: R150 |