JP7267865B2 - Analysis device and analysis method - Google Patents
Analysis device and analysis method Download PDFInfo
- Publication number
- JP7267865B2 JP7267865B2 JP2019133863A JP2019133863A JP7267865B2 JP 7267865 B2 JP7267865 B2 JP 7267865B2 JP 2019133863 A JP2019133863 A JP 2019133863A JP 2019133863 A JP2019133863 A JP 2019133863A JP 7267865 B2 JP7267865 B2 JP 7267865B2
- Authority
- JP
- Japan
- Prior art keywords
- abnormality
- analysis
- analyzer
- unit
- potential
- Prior art date
- Legal status (The legal status is an assumption and is not a legal conclusion. Google has not performed a legal analysis and makes no representation as to the accuracy of the status listed.)
- Active
Links
Images


Classifications
-
- G—PHYSICS
- G01—MEASURING; TESTING
- G01N—INVESTIGATING OR ANALYSING MATERIALS BY DETERMINING THEIR CHEMICAL OR PHYSICAL PROPERTIES
- G01N27/00—Investigating or analysing materials by the use of electric, electrochemical, or magnetic means
- G01N27/26—Investigating or analysing materials by the use of electric, electrochemical, or magnetic means by investigating electrochemical variables; by using electrolysis or electrophoresis
- G01N27/416—Systems
- G01N27/4163—Systems checking the operation of, or calibrating, the measuring apparatus
-
- G—PHYSICS
- G01—MEASURING; TESTING
- G01N—INVESTIGATING OR ANALYSING MATERIALS BY DETERMINING THEIR CHEMICAL OR PHYSICAL PROPERTIES
- G01N27/00—Investigating or analysing materials by the use of electric, electrochemical, or magnetic means
- G01N27/26—Investigating or analysing materials by the use of electric, electrochemical, or magnetic means by investigating electrochemical variables; by using electrolysis or electrophoresis
- G01N27/28—Electrolytic cell components
- G01N27/30—Electrodes, e.g. test electrodes; Half-cells
- G01N27/333—Ion-selective electrodes or membranes
-
- G—PHYSICS
- G01—MEASURING; TESTING
- G01N—INVESTIGATING OR ANALYSING MATERIALS BY DETERMINING THEIR CHEMICAL OR PHYSICAL PROPERTIES
- G01N27/00—Investigating or analysing materials by the use of electric, electrochemical, or magnetic means
- G01N27/26—Investigating or analysing materials by the use of electric, electrochemical, or magnetic means by investigating electrochemical variables; by using electrolysis or electrophoresis
- G01N27/403—Cells and electrode assemblies
- G01N27/4035—Combination of a single ion-sensing electrode and a single reference electrode
Landscapes
- Chemical & Material Sciences (AREA)
- Life Sciences & Earth Sciences (AREA)
- Health & Medical Sciences (AREA)
- Physics & Mathematics (AREA)
- Chemical Kinetics & Catalysis (AREA)
- Electrochemistry (AREA)
- Molecular Biology (AREA)
- Analytical Chemistry (AREA)
- Biochemistry (AREA)
- General Health & Medical Sciences (AREA)
- General Physics & Mathematics (AREA)
- Immunology (AREA)
- Pathology (AREA)
- Automatic Analysis And Handling Materials Therefor (AREA)
- Investigating Or Analyzing Materials By The Use Of Electric Means (AREA)
Description
本開示は、分析装置及び分析方法に関する。 The present disclosure relates to analysis devices and analysis methods.
血液をはじめとする生体試料中のカリウム、ナトリウム、塩化物などのイオン(電解質)の濃度を迅速簡便に測定するために、検出するイオンに対応した複数のイオン選択性電極(Ion Selective Electrode:ISE)が分析装置に搭載される。 In order to quickly and easily measure the concentrations of ions (electrolytes) such as potassium, sodium and chloride in biological samples such as blood, a plurality of ion selective electrodes (Ion Selective Electrode: ISE) corresponding to the ions to be detected are used. ) is mounted on the analyzer.
イオン選択性電極を有する電解質分析ユニットは、例えば自動分析装置に搭載される。自動分析装置は自動、迅速、かつ連続的に臨床検査を行うために、単独で、あるいは生化学自動分析装置などの一要素として好適に用いられる。 An electrolyte analysis unit having ion-selective electrodes is mounted, for example, on an automatic analyzer. An automatic analyzer is preferably used alone or as an element of an automatic biochemical analyzer or the like, in order to automatically, rapidly, and continuously perform clinical examinations.
イオン選択性電極は参照電極と組み合わせて用いられ、イオン選択性電極と参照電極との間に生じる電位差を測定することにより、目的イオンの活量(濃度)が求められる。臨床検査の分野では、生体試料である血液、特に血清や血漿、尿などの検体に含まれる電解質の濃度を定量する必要性が高い。これらの検体をそのままイオン選択性電極を用いて測定する、いわゆる非希釈法を用いて測定する場合がある。また、所定量の検体に所定量の希釈液を添加、混合して希釈した後、イオン選択性電極を用いて測定する、いわゆる希釈法を用いる場合もある。 The ion-selective electrode is used in combination with a reference electrode, and the activity (concentration) of target ions is obtained by measuring the potential difference generated between the ion-selective electrode and the reference electrode. In the field of clinical examination, there is a great need to quantify the concentration of electrolytes contained in blood, which is a biological sample, particularly serum, plasma, urine, and other specimens. In some cases, these analytes are measured as they are using an ion-selective electrode, using a so-called non-dilution method. Also, a so-called dilution method may be used in which a predetermined amount of a sample is added to a predetermined amount of diluent, mixed and diluted, and then measured using an ion-selective electrode.
希釈法は、検体の必要量が少なく、また測定液中のタンパク質や脂質などの共存物の濃度が低く、共存物による汚れの影響が少なく、イオン選択性電極の安定性が高い特長をもつ。したがって、自動分析装置を用いた電解質濃度の分析において、フローセル型イオン選択性電極と希釈法の組み合わせが現在主流となっている。検体の希釈には希釈槽と呼ばれる容器が用いられ、希釈槽に準備した希釈済みの検体(測定液)は、配管を通してフローセル型イオン選択性電極へ送られて測定される。内部標準液を検体と交互に希釈槽に分注し、検体と交互に測定する。 The dilution method requires a small amount of sample, has low concentrations of coexisting substances such as proteins and lipids in the measurement solution, is less affected by contamination due to coexisting substances, and has the advantage of high stability of the ion-selective electrode. Therefore, in analysis of electrolyte concentration using an automatic analyzer, a combination of a flow cell type ion-selective electrode and a dilution method is currently mainstream. A container called a dilution tank is used for diluting the sample, and the diluted sample (measurement solution) prepared in the dilution tank is sent to the flow cell type ion selective electrode through a pipe and measured. Dispense the internal standard solution alternately with the sample into the dilution tank, and measure alternately with the sample.
生体中の電解質濃度は、通常、狭い濃度範囲に維持されており、臨床上や治療上、わずかな濃度変化でも重大な意味を持つ。したがって、イオン選択性電極には極めて高い測定精度が要求され、測定誤差を極力低減するために様々な技術開発が行われている。 Electrolyte concentrations in living organisms are usually maintained within a narrow concentration range, and even a slight change in concentration has a significant meaning clinically and therapeutically. Therefore, ion-selective electrodes are required to have extremely high measurement accuracy, and various techniques have been developed to reduce measurement errors as much as possible.
例えば特許文献1には、イオン選択性電極の測定値の誤差の原因を特定する方法として、構成要素の駆動タイミング時の電位を参照することで、不良な構成要素を特定する方法が記載されている。
For example,
測定値の誤差(異常)の原因としては、イオン選択性電極と参照電極との間の流路への気泡混入や、流路内の液体の振動、測定系への電気ノイズの混入などがあり、これらの誤差原因により正常な電位が出力されなくなる。また、これらの誤差原因は分析装置の構成要素の不具合や、分析装置の設置環境に由来するものと考えられ、誤差原因を取り除かない限り測定誤差が再発する虞がある。このため、精度の高い分析結果を得るためには、これらの誤差原因を特定して改善する必要がある。 Causes of measurement error (abnormality) include air bubbles in the channel between the ion-selective electrode and the reference electrode, liquid vibration in the channel, and electrical noise in the measurement system. , a normal potential is not output due to these error causes. In addition, the cause of these errors is considered to be due to defects in the constituent elements of the analyzer and the environment in which the analyzer is installed, and unless the cause of the error is eliminated, there is a risk of recurrence of the measurement error. Therefore, in order to obtain highly accurate analysis results, it is necessary to identify and improve these error causes.
しかし、特許文献1に代表される従来の分析装置においては、分析装置の設置環境に由来する誤差原因や、構成要素の駆動タイミング信号を取得できない構成要素の不具合に由来する誤差原因について特定することが難しい。
However, in conventional analyzers represented by
そこで、本開示は、イオン選択性電極を用いた分析装置における異常を解析する技術を提供する。 Accordingly, the present disclosure provides a technique for analyzing an abnormality in an analyzer using ion-selective electrodes.
本開示の分析装置は、試料中のイオン濃度を測定する分析装置であって、前記イオン濃度に基づく電位を得るイオン選択性電極と、参照液に基づく電位を得る参照電極と、前記イオン選択性電極と前記参照電極との間の起電力を測定する測定部と、所定の時間領域における前記起電力の電位変化についての解析を行う解析部と、前記電位変化と前記分析装置の異常との関係を示す異常解析データを格納する記憶部と、を備え、前記解析部は、前記測定部により測定された前記起電力の前記電位変化についてのパラメータを取得し、前記パラメータと、前記記憶部に格納された前記異常解析データとに基づいて、前記分析装置の異常を解析することを特徴とする。 An analysis device of the present disclosure is an analysis device for measuring ion concentration in a sample, comprising an ion-selective electrode that obtains a potential based on the ion concentration, a reference electrode that obtains a potential based on a reference solution, and the ion-selective A measurement unit that measures the electromotive force between the electrode and the reference electrode, an analysis unit that analyzes the potential change of the electromotive force in a predetermined time domain, and a relationship between the potential change and an abnormality of the analyzer. and a storage unit for storing abnormality analysis data indicating, the analysis unit acquires a parameter about the potential change of the electromotive force measured by the measurement unit, and stores the parameter in the storage unit The abnormality of the analyzer is analyzed based on the obtained abnormality analysis data.
本開示に関連する更なる特徴は、本明細書の記述、添付図面から明らかになるものである。また、本開示の態様は、要素及び多様な要素の組み合わせ及び以降の詳細な記述と添付される特許請求の範囲の様態により達成され実現される。
本明細書の記述は典型的な例示に過ぎず、本開示の特許請求の範囲又は適用例を如何なる意味に於いても限定するものではない。
Further features related to the present disclosure will become apparent from the description of the specification and the accompanying drawings. In addition, the aspects of the present disclosure will be achieved and attained by means of the elements and combinations of various elements and aspects of the detailed description that follows and the claims that follow.
The description herein is merely exemplary and is not intended to limit the scope or application of this disclosure in any way.
本開示による分析装置は、イオン選択性電極を用いた分析装置における異常を解析することができる。
上記した以外の課題、構成及び効果は、以下の実施形態の説明により明らかにされる。
The analyzer according to the present disclosure can analyze anomalies in analyzers using ion-selective electrodes.
Problems, configurations, and effects other than those described above will be clarified by the following description of the embodiments.
[第1の実施形態]
<分析装置の構成例>
図1は、第1の実施形態に係る分析装置100を示す概略図である。図1に示すように、分析装置100は、電解質分析ユニット1、電位測定部2(測定部)、入力部3、制御部4、濃度算出部5、データベース6、表示部7及び波形解析部8(解析部)を備える。
[First embodiment]
<Configuration example of analyzer>
FIG. 1 is a schematic diagram showing an
電解質分析ユニット1は、3種類のイオン選択性電極101(塩素イオン電極101a、カリウムイオン電極101b及びナトリウムイオン電極101c)、比較電極104(参照電極)、ピンチ弁105、真空吸引ノズル106、シッパーノズル107、希釈液供給ノズル108、内部標準液供給ノズル109、希釈槽110、廃液タンク111、真空ポンプ112、電磁弁121~127、内部標準液用シリンジポンプ131、希釈液用シリンジポンプ132、シッパーシリンジポンプ133、内部標準液ボトル141、希釈液ボトル151及び比較電極液ボトル161を備える。
The
イオン選択性電極101としては、例えばフローセル型イオン選択性電極を用いることができる。イオン選択性電極101の数は、測定対象となるイオン種の数に応じて変更することができる。また、イオン選択性電極101は全てのイオン種に適応可能である。イオン選択性電極101は、サンプル(試料)中のイオン濃度に応じた電位を発生させる。
As the ion
比較電極液ボトル161には比較電極液(参照液)が収容されており、比較電極液はシッパーシリンジポンプ133により比較電極104の流路に導入される。比較電極液として、例えば塩化カリウム水溶液などを用いることができる。比較電極104は、比較電極液中のイオン濃度に応じた電位を発生させる。
A reference electrode solution (reference solution) is stored in the reference
内部標準液ボトル141には内部標準液(IS)が収容されており、内部標準液は内部標準液用シリンジポンプ131及び内部標準液供給ノズル109により希釈槽110に分注される。
An internal standard solution (IS) is stored in the internal
検体は、図示しないサンプリング機構により希釈槽110に分注される。希釈液ボトル151には希釈液が収容されており、希釈液は希釈液用シリンジポンプ132及び希釈液供給ノズル108により希釈槽110に分注されて検体と混合される。
A sample is dispensed into the
このように、希釈槽110には、内部標準液、もしくは、検体と希釈液とが混合された測定液(以下、「サンプル(S)」という)が導入される。
In this way, the
ここで、希釈槽110内に満たされた液体を測定流路内へ充填する際の動作について説明する。まず、イオン選択性電極101の流路に希釈槽110内に満たされた液を導入する際は、電磁弁121と電磁弁125を閉じ、ピンチ弁105と電磁弁122を開け、シッパーノズル107を希釈槽110の中に降下させ、シッパーシリンジポンプ133を引く。
Here, the operation of filling the measurement channel with the liquid filled in the
続いて、比較電極104の流路に比較電極液を導入する際は、電磁弁121を開け、ピンチ弁105を閉じ、シッパーシリンジポンプ133を引くことで、比較電極液ボトル161から比較電極液が比較電極104の流路に導入される。また、シッパーシリンジポンプ133にたまった液を排出するために、電磁弁122を閉じ、電磁弁125を開け、シッパーシリンジポンプ133を押す。
Subsequently, when introducing the reference electrode solution into the channel of the
なお、比較電極104の流路に導入された比較電極液と、イオン選択性電極101に導入されたサンプルとは、液絡部120で接触し、イオン選択性電極101と比較電極104とが液を通じて電気的に接続された状態となる。
The reference electrode liquid introduced into the channel of the
イオン選択性電極101の流路にサンプルが導入され、比較電極104の流路に比較電極液が導入された後、真空吸引ノズル106を降下し、真空ポンプ112を駆動することにより、希釈槽110内に残った液体(サンプル又は内部標準液)が吸引され、廃液タンク111に廃棄される。比較電極104に導入された比較電極液は、電磁弁121、真空ポンプ112及びシッパーシリンジポンプ133を操作することにより廃液タンク111に廃棄される。
After the sample is introduced into the channel of the ion-
イオン選択性電極101の流路に導入されたサンプル中の分析対象のイオン濃度によって、比較電極104と各イオン選択性電極101との電位差(起電力)が変化する。電位測定部2は、その起電力を測定し、測定結果(起電力の時間推移など)を濃度算出部5及び波形解析部8に出力する。以下において、「起電力」を単に「電位」という場合がある。ここで、電位が測定される期間のうち、イオン濃度を算出するための時間を含む所定の時間幅を「所定の時間領域」という場合がある。所定の時間領域の取得開始時刻tiと取得終了時刻teとは、任意に設定可能である。
The potential difference (electromotive force) between the
電位測定部2による電位測定の時間間隔(サンプリングレート)は、例えば0.006秒以下とすることができる。サンプリングレートが高いほど、解析可能な周波数帯が高くなり、様々なノイズ源を解析できるようになるが、サンプリングレートが向上すると、データサイズが増大するというトレードオフの関係がある。そこで、上記のように電位測定の時間間隔を0.006秒以下とすることにより、一般的な回路に対するノイズ源である交流電源由来の周波数ノイズ(50~60Hz)や振幅の大きな振動ノイズ(~30Hz程度)などを解析することができ、かつデータサイズの増大も抑制できる。なお、解析可能な周波数F(Hz)及びサンプリングレートSrate(s)は、F=(1/S)/2.56で求めることができる。したがって、サンプリングレートが0.006秒である場合は65Hzの周波数を解析することができる。 The time interval (sampling rate) of potential measurement by the potential measurement unit 2 can be set to 0.006 seconds or less, for example. The higher the sampling rate, the higher the frequency band that can be analyzed and the more various noise sources can be analyzed. Therefore, by setting the time interval of potential measurement to 0.006 seconds or less as described above, frequency noise (50 to 60 Hz) derived from AC power sources and large-amplitude vibration noise (~ 30 Hz) can be analyzed, and an increase in data size can be suppressed. The analyzable frequency F (Hz) and sampling rate S rate (s) can be obtained by F=(1/S)/2.56. Therefore, a frequency of 65 Hz can be analyzed if the sampling rate is 0.006 seconds.
濃度算出部5は、電位測定部2による電位の測定結果に基づいてイオン濃度を算出する。イオン濃度の測定方法としては、公知の方法を採用することができる。また、後述するように、濃度算出部5は、所定の時間領域における電位の標準偏差σ、最大値と最小値の差ΔV及び平均値Vavgを算出する。
The
詳細は後述するが、波形解析部8は、電位測定部2が測定した電位の電位変化の波形について、回帰分析及び周波数解析(これらを「波形解析」という場合がある)を行い、分析装置100の異常の原因についての解析を行う。
Although the details will be described later, the waveform analysis unit 8 performs regression analysis and frequency analysis (these are sometimes referred to as “waveform analysis”) on the waveform of the potential change of the potential measured by the potential measurement unit 2, and analyzes the
入力部3は、例えばマウス、キーボード、タッチパネルなどの入力デバイスであり、ユーザが分析装置100に各種データや指示を入力するために用いられる。
The input unit 3 is an input device such as a mouse, keyboard, or touch panel, and is used by the user to input various data and instructions to the
制御部4は、分析装置100の全体を制御する。具体的には、制御部4は、電解質分析ユニット1の各構成の駆動制御、濃度算出部5及び波形解析部8における処理の制御、表示部7における表示の制御などを行う。また、制御部4は、入力部3からの入力を受け付ける。なお、制御部4、濃度算出部5及び波形解析部8における処理は、分析装置100に搭載された1つのプロセッサにより実行されてもよい。
The control unit 4 controls the
表示部7は、濃度算出部5及び波形解析部8における処理の結果や、GUI画面などを表示する。
The
データベース6(記憶部)は、濃度算出部5及び波形解析部8による処理に必要なデータや、濃度算出部5及び波形解析部8による処理の結果などを記憶する。波形解析部8による処理に必要なデータとして、データベース6は、電位測定部2により測定された電位変化と、分析装置100の異常の原因との関係を示すデータを格納する。
The database 6 (storage unit) stores data required for processing by the
図1において、データベース6が分析装置100内に内蔵されている形態が示されている。これに限定されず、データベース6は、インターネット上に接続する形態、分析装置100から取り外しが可能な形態、分析装置100に記憶媒体を接続する形態、あるいはそれぞれを組み合わせた形態など、あらゆる形態で用いることができる。データベース6と、濃度算出部5及び波形解析部8とは、それぞれデータの送受信が可能に構成され、例えばインターネット上に接続してオンラインで測定データを取得することもできる。
In FIG. 1, a form in which the database 6 is built in the
なお、電位測定部2、入力部3、制御部4、濃度算出部5、表示部7及び波形解析部8についても、全てが分析装置100内に内蔵されている必要はなく、これらのうち一部が他の装置に設けられ、他の装置と分析装置100とが通信することでデータのやり取りをするようにしてもよい。
Note that the potential measurement unit 2, the input unit 3, the control unit 4, the
<分析方法>
図2は、測定誤差が生じている場合の電位変化V(t)を示すグラフである。図2のグラフは、それぞれ電位測定部2が出力する電位の時間的変化である電位変化V(t)を示し、横軸は時間t(秒)であり、縦軸は起電力EMF(V)である。図2に示すように、電位変化V(t)は、測定誤差の原因(誤差原因)に応じた電位波形を示し、勾配、周波数に明確な違いが確認できる。誤差原因としては、例えば流路中に混入した気泡、電解質分析ユニット1の振動、電気ノイズなどが挙げられる。発明者らが誤差原因と電位波形について検討したところ、電位変化V(t)に関連するパラメータを取得して解析することで、誤差原因を特定することが可能であることが見出された。なお、図2には図示していないが、異常が発生していない場合(測定誤差の原因が混入していない場合)の電位波形は、ある一定の起電力に維持された直線状となる。
<Analysis method>
FIG. 2 is a graph showing potential change V(t) when a measurement error occurs. The graph of FIG. 2 shows the potential change V(t), which is the temporal change of the potential output from the potential measuring unit 2, the horizontal axis is time t (seconds), and the vertical axis is the electromotive force EMF (V). is. As shown in FIG. 2, the potential change V(t) shows a potential waveform corresponding to the cause of the measurement error (error cause), and a clear difference in slope and frequency can be confirmed. Error causes include, for example, air bubbles entrained in the flow path, vibration of the
(参考例に係る分析方法及びその課題)
ここで、まず、分析装置100を用いた参考例に係る分析方法について説明する。本分析方法は、実際には制御部4が電解質分析ユニット1、電位測定部2、濃度算出部5及び表示部7を制御することにより実施されるが、以下においては、これらの各構成を動作の主体として説明する。
(Analytical method according to reference example and its problem)
Here, first, an analysis method according to a reference example using the
図3は、参考例に係る分析方法を示すフローチャートである。まず、ステップS301において、ユーザが入力部3から動作開始の指示を入力することで、制御部4は、電解質分析ユニット1を駆動し、測定動作が開始される。
FIG. 3 is a flow chart showing an analysis method according to a reference example. First, in step S301, when the user inputs an operation start instruction from the input unit 3, the control unit 4 drives the
ステップS302において、電解質分析ユニット1は、内部標準液用シリンジポンプ131、電磁弁123及び126を駆動して、内部標準液供給ノズル109から、希釈槽110に内部標準液(IS)を導入し、測定流路に内部標準液を導入する。
In step S302, the
ステップS303において、電位測定部2は、比較電極104と各イオン選択性電極101との電位差(起電力)を測定し、濃度算出部5に内部標準液電位として出力する。ステップS304において、濃度算出部5は、内部標準液電位(IS電位)を取得する。
In step S303, the potential measurement section 2 measures the potential difference (electromotive force) between the
ステップS305において、濃度算出部5は、内部標準液電位の標準偏差σ(IS)、最大値と最小値の差ΔV(IS)及び平均値Vavg(IS)を算出し、データベース6を参照して、データベース6に格納されるこれらの閾値(異常閾値)と比較する。これにより、測定された内部標準液電位に異常があるか否かを判定する。データベース6には、σ(IS)、ΔV(IS)及びVavg(IS)のそれぞれの異常閾値として、例えば、異常が発生していないと判断できる値の最大値や値の範囲が格納されている。また、濃度算出部5は、異常があると判定された場合及び異常がないと判定された場合のいずれにおいても、内部標準液電位から算出した各パラメータ(標準偏差σ(IS)、最大値と最小値の差ΔV(IS)及び平均値Vavg(IS))をデータベース6に保存する。
In step S305, the
ステップS305において異常があると判定された場合(YES)、ステップS306において、表示部7は、ユーザに異常を報知するためのアラームを表示する。図示は省略しているが、次のステップS307を実施する前に、電解質分析ユニット1は、希釈槽110から残りの内部標準液を排出する。
If it is determined in step S305 that there is an abnormality (YES), in step S306 the
ステップS307において、電解質分析ユニット1は、図1には図示しないサンプリング機構により希釈槽110に検体を導入し、希釈液用シリンジポンプ132を駆動して希釈液供給ノズル108から希釈液を導入して、混合液であるサンプルを得る。その後、電磁弁121と電磁弁125を閉じ、ピンチ弁105と電磁弁122を開け、シッパーノズル107を希釈槽110の中に降下させ、シッパーシリンジポンプ133を駆動して、測定流路にサンプル(S)を導入する。
In step S307, the
ステップS308において、電位測定部2は、比較電極104と各イオン選択性電極101との電位差(起電力)を測定し、濃度算出部5にサンプル電位として出力する。ステップS309において、濃度算出部5は、サンプル電位(S電位)を取得する。図示は省略しているが、例えばステップS309の取得の後に、電解質分析ユニット1は、希釈槽110内の残りのサンプルを排出する。
In step S308, the potential measurement unit 2 measures the potential difference (electromotive force) between the
ステップS310において、濃度算出部5は、サンプル電位の標準偏差σ(S)、最大値と最小値の差ΔV(S)及び平均値Vavg(S)を算出し、データベース6に格納されるこれらの異常閾値と比較する。これにより、測定されたサンプル電位に異常があるか否かを判定する。また、濃度算出部5は、異常があると判定された場合及び異常がないと判定された場合のいずれにおいても、サンプル電位から算出した各パラメータ(標準偏差σ(S)、最大値と最小値の差ΔV(S)及び平均値Vavg(S))をデータベース6に保存する。
In step S310, the
ステップS310において異常があると判定された場合(YES)、ステップS311において、表示部7は、ユーザに異常を報知するためのアラームを表示する。
If it is determined in step S310 that there is an abnormality (YES), in step S311 the
ステップS312において、濃度算出部5は、内部標準液電位の平均値Vavg(IS)と、サンプル電位の平均値Vavg(S)とに基づいて、サンプル中のイオン濃度を算出する。また、濃度算出部5は、算出したイオン濃度をデータベース6に保存する。
In step S312, the
ステップS313において、表示部7は、算出されたイオン濃度(測定結果)を表示する。
In step S313, the
ステップS314において、制御部4は、次のサンプルがあるかどうかを判定する。例えば、ステップS301より前に、予め測定対象のサンプル数が分析装置100に入力されており、制御部4が測定対象のサンプル数と測定済みのサンプル数とを比較することにより、次のサンプルの有無を判定することができる。
At step S314, the control unit 4 determines whether or not there is a next sample. For example, before step S301, the number of samples to be measured is input in advance to the
次のサンプルがある場合(YES)、ステップS302へ戻り、同様にイオン濃度の測定を実施する。次のサンプルがない場合(NO)は、ステップS315に移行して測定を終了する。 If there is a next sample (YES), the process returns to step S302 to similarly measure the ion concentration. If there is no next sample (NO), the process proceeds to step S315 and the measurement ends.
以上説明した通り、参考例においては、異常が発生した場合は、ユーザが表示部7のアラーム表示を確認して再測定実施の可否を判断する必要がある。また、アラームが頻発する場合は、測定動作を中止して分析装置100のメンテナンスを実施する必要がある。この際、上述の標準偏差σ、最大値と最小値の差ΔV及び平均値Vavgに基づくアラーム表示のみでは、誤差原因が不明な場合があり、誤差原因を特定するための作業や復旧作業に時間を要してしまう。
As described above, in the reference example, when an abnormality occurs, it is necessary for the user to check the alarm display on the
(第1の実施形態に係る分析方法の詳細)
そこで、本実施形態の分析方法においては、参考例の測定操作に加えて、電位測定部2での電位測定後に波形解析部8で電位波形を解析し、電位波形に関連するパラメータを取得することにより、誤差原因を特定する。
(Details of the analysis method according to the first embodiment)
Therefore, in the analysis method of the present embodiment, in addition to the measurement operation of the reference example, the potential waveform is analyzed by the waveform analysis unit 8 after the potential measurement by the potential measurement unit 2, and parameters related to the potential waveform are acquired. Identify the cause of the error.
図4は、第1の実施形態に係る分析方法を示すフローチャートである。図4において、図3に示したステップと同様のステップについては同じ参照番号が付されている。以下、図3のフローチャートとの相違点についてのみ説明する。 FIG. 4 is a flow chart showing an analysis method according to the first embodiment. In FIG. 4, steps similar to those shown in FIG. 3 are given the same reference numerals. Only differences from the flowchart of FIG. 3 will be described below.
本実施形態の分析方法においては、ステップS303の後、電位測定部2による内部標準液電位(IS電位)の取得(ステップS304)と平行して、ステップS401及びS402が波形解析部8により実行される。 In the analysis method of the present embodiment, after step S303, steps S401 and S402 are executed by the waveform analysis unit 8 in parallel with the acquisition of the internal standard liquid potential (IS potential) by the potential measurement unit 2 (step S304). be.
ステップS401において、波形解析部8は、電位測定部2から、波形解析用の内部標準液電位を取得する。波形解析用の内部標準液電位は、所定の時間領域における電位である。波形解析用の内部標準液電位の取得開始時刻tiと取得終了時刻teは任意に設定することができる。 In step S<b>401 , the waveform analysis unit 8 acquires the internal standard liquid potential for waveform analysis from the potential measurement unit 2 . The internal standard liquid potential for waveform analysis is the potential in a predetermined time domain. The acquisition start time t i and the acquisition end time t e of the internal standard liquid potential for waveform analysis can be set arbitrarily.
ステップS402において、波形解析部8は、内部標準液電位の電位変化V(t)のパラメータ(勾配など)及び周波数に関するパラメータを波形解析により取得し、データベース6に保存する。これらのパラメータの取得方法の詳細については、後述する。 In step S<b>402 , the waveform analysis unit 8 acquires parameters (slope, etc.) of the potential change V(t) of the internal standard liquid potential and parameters related to frequency by waveform analysis, and stores them in the database 6 . Details of how to acquire these parameters will be described later.
次に、ステップS305において、濃度算出部5により算出された標準偏差σ(IS)、最大値と最小値の差ΔV(IS)及び平均値Vavg(IS)から内部標準液電位に異常があると判断された場合(YES)、ステップS306の代わりにステップS403~S405が実行される。
Next, in step S305, the standard deviation σ(IS) calculated by the
ここで、データベース6には、電位変化V(t)の勾配や周波数に関するパラメータの異常閾値や、あるパラメータが異常閾値を超過した場合の誤差原因、誤差原因に対する対処方法の記述、誤差原因を引き起こす構成要素や装置外の原因などの情報を示す異常特定データ(異常解析データ)が予め格納されている。なお、データベース6に格納されている異常特定データは、装置出荷時や連続運用時の電位変化V(t)の波形の情報に基づくものであってもよいし、任意に設定されたものであってもよい。ステップS403において、波形解析部8は、データベース6を参照して、ステップS402で算出した各パラメータと異常閾値とを比較する。 Here, in the database 6, there are descriptions of abnormal thresholds of parameters related to the slope and frequency of the potential change V(t), error causes when a certain parameter exceeds the abnormal thresholds, methods of coping with the error causes, and descriptions of error causes. Abnormality identification data (abnormality analysis data) indicating information such as components and external causes are stored in advance. The abnormality identification data stored in the database 6 may be based on waveform information of the potential change V(t) at the time of shipment of the device or during continuous operation, or may be arbitrarily set. may In step S403, the waveform analysis unit 8 refers to the database 6 and compares each parameter calculated in step S402 with the abnormality threshold.
ステップS404において、波形解析部8は、各パラメータと異常閾値との比較結果と、データベース6の異常特定データとに基づいて、誤差原因及びその対処方法を特定する。誤差原因の特定方法の詳細については、後述する。 In step S<b>404 , the waveform analysis unit 8 identifies the cause of the error and its coping method based on the result of comparison between each parameter and the abnormality threshold and the abnormality identification data in the database 6 . The details of the error cause identification method will be described later.
ステップS405において、表示部7は、特定した誤差原因及びその対処方法を表示して、ユーザへ報知する。
In step S405, the
その後、参考例と同様にステップS307及びS308が実行される。ステップS308の実行後、ステップS309と平行して、ステップS406及びS407が波形解析部8により実行される。上述のステップS401及び402においては、波形解析用の内部標準液電位の電位変化V(t)について取得されたが、ステップS406及びS407においては、波形解析用のサンプル電位を取得して、サンプル電位の電位変化V(t)のパラメータ(勾配など)及び周波数に関するパラメータを取得して、データベース6に保存する。 After that, steps S307 and S308 are executed as in the reference example. After executing step S308, steps S406 and S407 are executed by the waveform analysis unit 8 in parallel with step S309. In steps S401 and S402 described above, the potential change V(t) of the internal standard solution potential for waveform analysis is obtained. In steps S406 and S407, the sample potential for waveform analysis is obtained and the sample potential parameters (gradient, etc.) of the potential change V(t) and parameters related to frequency are acquired and stored in the database 6 .
次に、ステップS310において、濃度算出部5により算出された標準偏差σ(S)、最大値と最小値の差ΔV(S)及び平均値Vavg(S)からサンプル電位に異常があると判定された場合(YES)、ステップS311の代わりにステップS408~S410が実行される。
Next, in step S310, it is determined that there is an abnormality in the sample potential from the standard deviation σ(S), the difference ΔV(S) between the maximum value and the minimum value, and the average value V avg (S) calculated by the
ステップS408~S410においては、波形解析用の内部標準液電位の代わりに波形解析用のサンプル電位についての処理を行う点でのみステップS403~S405と異なっているため、説明を省略する。その後、参考例と同様にステップS312~S315が実行される。このように、濃度算出部5によるイオン濃度の算出と平行して、誤差原因を特定することにより、1測定あたりの処理の時間を短縮することができ、測定スループットを向上することができる。
Steps S408 to S410 are different from steps S403 to S405 only in that processing is performed on the sample potential for waveform analysis instead of the internal standard solution potential for waveform analysis, so description thereof will be omitted. After that, steps S312 to S315 are executed as in the reference example. By identifying the cause of the error in parallel with the calculation of the ion concentration by the
本実施形態の分析方法は、以上説明したステップに限らず、追加のステップを含んでいてもよい。例えば、ステップS313において表示部7に測定結果を表示した後に、制御部4により再測定の要否を判断して必要であれば再測定を実行することができる。あるいは、ステップS313の後に、表示部7に、ユーザに再測定の要否を入力するためのGUI画面を表示し、入力部3から再測定の要否を入力させて再測定を促すこともできる。これにより、イオン選択性電極の測定値の信頼性を確保することができる。
The analysis method of this embodiment is not limited to the steps described above, and may include additional steps. For example, after the measurement result is displayed on the
(電位変化V(t)のパラメータの取得方法)
ステップS402及びS407における、内部標準液電位とサンプル電位の電位変化V(t)の回帰分析によるパラメータ取得の方法について、より具体的に説明する。
(Method of Acquiring Parameter of Potential Change V(t))
A method of obtaining parameters by regression analysis of the potential change V(t) between the internal standard solution potential and the sample potential in steps S402 and S407 will be described more specifically.
図5は、電位変化V(t)のパラメータを取得する方法を示すフローチャートである。以下においては、電位変化V(t)のパラメータの一例として、勾配の指標であるSlopeを回帰分析により求める例について説明する。 FIG. 5 is a flow chart showing a method of obtaining parameters of potential change V(t). In the following, as an example of the parameter of the potential change V(t), an example in which Slope, which is an index of the gradient, is obtained by regression analysis will be described.
まず、ステップS501において、波形解析部8は、下記の近似式(1)を用いて電位変化V(t)(ti<t<te)の勾配の指標であるSlopeを求めるために、回帰分析を実施する。 First, in step S501, the waveform analysis unit 8 uses the following approximation formula (1) to obtain Slope, which is an index of the gradient of the potential change V(t) (t i <t<t e ). Conduct analysis.
![]()
![]()
上述の回帰分析操作では、ti<t<teの範囲において、取得した電位変化V(t)と計算式との差を最小にする最小二乗法や、パラメータが与えられたときの計算式が、取得した電位変化V(t)を回帰する確率を最大化する最尤推定法などを用いることができる。その他に、ベイズ推定、機械学習アルゴリズムなど近似式と実測値の差を最小にする手法も使用できる。本ステップS501における回帰分析の手法として、1種のみを用いてもよいし、複数の手法を用いてもよい。 In the above-described regression analysis operation, in the range of t i <t<t e , the least square method that minimizes the difference between the obtained potential change V(t) and the calculation formula, or the calculation formula when parameters are given However, a maximum likelihood estimation method or the like that maximizes the probability of regressing the acquired potential change V(t) can be used. In addition, techniques such as Bayesian estimation and machine learning algorithms that minimize the difference between approximate formulas and actual values can also be used. As the method of regression analysis in step S501, only one type may be used, or a plurality of methods may be used.
ステップS502において、波形解析部8は、上記の回帰分析の結果から、電位変化V(t)の勾配の指標であるSlopeをパラメータとして取得する。 In step S502, the waveform analysis unit 8 acquires Slope, which is an index of the gradient of the potential change V(t), as a parameter from the above regression analysis results.
ステップS503において、波形解析部8は、下記の数式(2)を用いて、補正された電位変化Vcorr(t)を求める。これにより、Slopeが0に近しいVcorr(t)が得られる。本ステップS503を行うことにより、電位変化V(t)の傾きが0に近い値に補正されるため、後述する電位変化V(t)の周波数解析を容易にすることができる。 In step S503, the waveform analysis unit 8 obtains the corrected potential change V corr (t) using the following formula (2). This yields V corr (t) with a Slope close to zero. By performing this step S503, the slope of the potential change V(t) is corrected to a value close to 0, so that the frequency analysis of the potential change V(t), which will be described later, can be facilitated.
![]()
![]()
ステップS504において、電位変化V(t)及びVcorr(t)、並びにパラメータV0及びSlopeがデータベース6に保存される。 In step S504, potential changes V(t) and V corr (t) and parameters V 0 and Slope are stored in database 6 .
データベース6にはSlopeの異常閾値が格納されている。波形解析部8は、ステップS403及びS408において、内部標準液電位とサンプル電位のそれぞれについて回帰分析から求めたSlopeの値と、データベース6に格納される異常閾値とを比較する。 The database 6 stores Slope abnormality thresholds. In steps S403 and S408, the waveform analysis unit 8 compares the Slope value obtained by regression analysis for each of the internal standard liquid potential and the sample potential with the abnormality threshold value stored in the database 6. FIG.
なお、ステップS501の回帰分析において、電位変化V(t)は式(1)のような線形近似式だけでなく、多項式関数、指数関数、対数関数、三角関数などの近似式を用いてもよく、電位変化V(t)のパラメータもSlopeに限らず自由に設定できる。また、使用する近似式の種類によって、Vcorr(t)も自由に設定することができる。 Note that, in the regression analysis of step S501, the potential change V(t) may use not only a linear approximation formula such as the formula (1), but also an approximation formula such as a polynomial function, an exponential function, a logarithmic function, or a trigonometric function. , the parameter of potential change V(t) can be freely set without being limited to Slope. Also, V corr (t) can be freely set depending on the type of approximation formula used.
ステップS502におけるパラメータの取得において、波形解析部8は、さらに、回帰分析の各手法(最小二乗法、最尤推定法、ベイズ推定、機械学習アルゴリズム)によって回帰した値と、実測値との相関性を評価する指標として、相関パラメータを取得してもよい。具体的には、相関パラメータは、最小二乗法などで用いられる決定係数、カイ二乗値などであり、回帰分析精度の信頼性の指標として用いられる。波形解析部8は、相関パラメータを取得して、回帰分析の結果と電位変化V(t)の相関性を評価することができる。例えば、波形解析部8は、回帰分析により得られるあるパラメータA(Slopeなど)と、相関パラメータとを参照して、相関パラメータ(信頼性)が低い場合は、パラメータAを採用しないという判断をすることができる。また、回帰分析の各手法において相関パラメータは複数取得することができ、それぞれを複合して用いることもできる。さらに、回帰分析の各手法によって用いる相関パラメータが異なるため、それぞれの手法について同時に相関パラメータを取得することもできる。 In acquiring the parameters in step S502, the waveform analysis unit 8 further determines the correlation between the values regressed by each regression analysis method (least squares method, maximum likelihood estimation method, Bayesian estimation, machine learning algorithm) and the measured values. A correlation parameter may be acquired as an index for evaluating the . Specifically, the correlation parameter is a coefficient of determination, a chi-square value, or the like used in the method of least squares or the like, and is used as an index of reliability of regression analysis accuracy. The waveform analysis unit 8 can acquire the correlation parameter and evaluate the correlation between the regression analysis result and the potential change V(t). For example, the waveform analysis unit 8 refers to a parameter A (such as Slope) obtained by regression analysis and the correlation parameter, and if the correlation parameter (reliability) is low, determines not to adopt the parameter A. be able to. In addition, a plurality of correlation parameters can be obtained in each method of regression analysis, and each of them can be combined and used. Furthermore, since the correlation parameters used are different for each method of regression analysis, the correlation parameters can be obtained for each method at the same time.
(電位変化V(t)の周波数に関連するパラメータの取得方法)
次に、図4のステップS402及びS407における、内部標準液電位とサンプル電位の電位変化V(t)の周波数に関連するパラメータの取得方法(周波数解析の方法)を説明する。
(Method for Acquiring Parameters Related to Frequency of Potential Change V(t))
Next, a method of acquiring parameters (frequency analysis method) related to the frequency of the potential change V(t) between the internal standard solution potential and the sample potential in steps S402 and S407 of FIG. 4 will be described.
図6は、電位変化V(t)の周波数に関連するパラメータを取得する方法を示すフローチャートである。まず、ステップS601において、波形解析部8は、電位変化V(t)の時間領域(ti<t<te)に対して、電位変化V(t)に含まれる周波数成分を解析する。このとき、ステップS502で取得したSlopeの値が大きい場合、上述の補正された電位変化Vcorr(t)を用いてもよい。周波数成分の解析において、例えば、高速フーリエ変換(FFT)や、スペクトルパワー密度変換など公知の手法を採用することができる。 FIG. 6 is a flowchart illustrating a method for obtaining frequency-related parameters of the potential change V(t). First, in step S601, the waveform analysis unit 8 analyzes frequency components included in the potential change V(t) in the time domain (t i <t<t e ) of the potential change V(t). At this time, if the value of Slope obtained in step S502 is large, the above-described corrected potential change V corr (t) may be used. In the analysis of frequency components, for example, known methods such as fast Fourier transform (FFT) and spectral power density transform can be employed.
ステップS602において、波形解析部8は、ステップS601において解析された各周波数成分の強度分布を算出し、周波数の強度分布の各ピークの中央値xnや強度In、幅Wnに関する情報をパラメータとして抽出する。 In step S602, the waveform analysis unit 8 calculates the intensity distribution of each frequency component analyzed in step S601, and uses information about the median value xn , intensity In , and width Wn of each peak of the frequency intensity distribution as parameters. Extract as
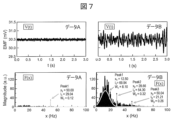
図7は、高速フーリエ変換による、電位変化V(t)に含まれる周波数成分の解析例を示す図である。図7の説明においては、2つの異なる電位変化V(t)(1ms<t<3000ms)を示すデータA及びデータB(図7の上段)を対象に、高速フーリエ変換により、それぞれの電位変化V(t)に含まれる周波数成分の強度分布F(x)(図7の下段)を抽出し、強度分布F(x)に対して下記式(3)による回帰分析を実施する。これにより、k個の強度分布それぞれに対する中央値xn、強度In、幅Wn、定数ynを求めることができる。 FIG. 7 is a diagram showing an analysis example of frequency components included in potential change V(t) by fast Fourier transform. In the description of FIG. 7, data A and data B (upper part of FIG. 7) showing two different potential changes V(t) (1 ms<t<3000 ms) are subjected to fast Fourier transform to obtain respective potential changes V The intensity distribution F(x) (lower part of FIG. 7) of the frequency components contained in (t) is extracted, and regression analysis is performed on the intensity distribution F(x) using the following equation (3). Thereby, the median x n , intensity I n , width W n , and constant y n for each of k intensity distributions can be obtained.

このとき、周波数の強度分布F(x)の解析において、強度分布F(x)の各ピークに対する中央値xn、強度In、幅Wnに相関する、あるいは関係するパラメータを抽出することができれば、高速フーリエ変換やスペクトルパワー密度変換に限らず、その他の方法を用いてもよい。 At this time, in the analysis of the frequency intensity distribution F(x), it is possible to extract parameters that are correlated or related to the median value x n , the intensity I n , and the width W n for each peak of the intensity distribution F(x). If possible, other methods may be used in addition to fast Fourier transform and spectral power density transform.
ステップS603において、各パラメータ値(k個の強度分布それぞれに対する中央値xn、強度In、幅Wn、定数yn)はデータベース6へ保存される。 In step S 603 , each parameter value (median x n , intensity I n , width W n , constant y n for each of k intensity distributions) is stored in database 6 .
(誤差原因の特定方法)
次に、図4のステップS403~S405及びS408~S410における、誤差原因の特定方法について説明する。誤差原因は、電位変化V(t)の標準偏差σ、最大値と最小値の差ΔV、平均値Vavg、回帰分析により得られたSlope、並びに周波数解析により得られた強度分布の中央値xn、強度In及び幅Wnなどのパラメータの相互関係と、それぞれのパラメータに設けられた異常閾値を用いて特定される。
(Method for identifying cause of error)
Next, a method for identifying the cause of error in steps S403 to S405 and S408 to S410 in FIG. 4 will be described. The error causes are the standard deviation σ of the potential change V(t), the difference ΔV between the maximum value and the minimum value, the average value V avg , the slope obtained by regression analysis, and the median value x of the intensity distribution obtained by frequency analysis. It is identified using the interrelationships of parameters such as n , intensity I n and width W n , and anomaly thresholds set for each parameter.
図8は、誤差原因の特定方法を説明する図である。図8の5つのグラフは、上から順に、複数のサンプルの測定で得られたパラメータΔV、Slope、周波数X1の強度Ix1、周波数X2の強度IX2、周波数X3の強度Ix3を縦軸としている。横軸は、各サンプルに測定順に付されたサンプル番号である。各グラフには、それぞれのパラメータに設けられた異常閾値Thが示されている。Slopeについては、上限と下限が異常閾値Th(Slope)として設けられている。 FIG. 8 is a diagram for explaining a method of identifying the cause of error. The five graphs in FIG. 8 show, from top to bottom, the parameters ΔV, Slope, the intensity I x1 at frequency X1 , the intensity I x2 at frequency X2 , and the intensity I x3 at frequency X3 obtained by measuring a plurality of samples. The vertical axis. The horizontal axis is the sample number assigned to each sample in order of measurement. Each graph shows an abnormality threshold Th set for each parameter. Regarding Slope, an upper limit and a lower limit are provided as an abnormality threshold Th (Slope).
例えばm番目のサンプル測定において、ΔVmが異常閾値Th(ΔV)を超過して異常と判定されたとき、ΔVmとIX1mに相関が認められると共に、IX1mも異常閾値Th(IX1)を超過している。一方、その他のパラメータについては、異常閾値Thを超過していない。この関係性から、ステップS310において異常が発生したと判断された(ΔVが異常閾値Th(ΔV)を超えた)原因が、IX1を増大させるような構成要素又は外乱であると特定することができる。 For example, in the m-th sample measurement, when ΔVm exceeds the abnormality threshold Th (ΔV) and is determined to be abnormal, a correlation is observed between ΔV m and I X1 m, and I X1 m is also the abnormality threshold Th (I X1 ) is exceeded. On the other hand, the other parameters do not exceed the abnormality threshold Th. From this relationship, it is possible to specify that the cause of the determination that an abnormality has occurred in step S310 (ΔV exceeds the abnormality threshold Th (ΔV)) is a component or disturbance that increases IX1 . can.
波形解析部8は、このように、各パラメータ、異常閾値Th及び複数のパラメータ間の関係性(複数のパラメータの組み合わせ)に基づいて異常の原因を特定する。また、例えば、波形解析部8は、ある2種のパラメータA及びBについて、aA+bB(a及びbは係数)の値が異常閾値Thを超えた場合に、ある構成要素Xに異常の原因があると特定することもできる。このように複数のパラメータを組み合わせる場合は、複数のパラメータの和に限らず、複数のパラメータの積などを用いて異常閾値Thと比較してもよい。もちろん、ある1種のパラメータAに基づいて、aAの値が異常閾値Thを超えた場合に、ある構成要素Yに異常の原因があると特定することもできる。 The waveform analysis unit 8 thus identifies the cause of the abnormality based on each parameter, the abnormality threshold Th, and the relationship between a plurality of parameters (combination of a plurality of parameters). Further, for example, the waveform analysis unit 8 determines that a component X is the cause of an abnormality when the value of aA+bB (a and b are coefficients) exceeds an abnormality threshold Th for two types of parameters A and B. can also be specified. When a plurality of parameters are combined in this way, not only the sum of the parameters but also the product of the parameters may be used for comparison with the abnormality threshold Th. Of course, if the value of aA exceeds the abnormality threshold value Th based on a certain type of parameter A, it is also possible to specify that a certain component Y is the cause of the abnormality.
なお、上述のように、各パラメータの異常閾値Thはデータベース6に格納されており、適宜変更することが可能である。また、上述のような異常閾値Thによる誤差原因の特定方法に限定されない。例えば、機械学習手法によって、ステップS305、S310、S402及びS407においてデータベース6に保存した各パラメータと誤差原因の関係性を学習させた判別モデルを用いて、誤差原因を特定してもよい。例えば、電解質分析ユニット1の構成要素X、Y又はZに異常の原因があることを特定する場合、波形解析部8は、波形解析により取得した各パラメータのうち1つ、あるいは複数のパラメータ間の関係性に基づいて、構成要素Xに異常の原因がある、構成要素X及びYに異常の原因がある、あるいは構成要素X及びZに異常の原因がある、などのように分類を行う。このように、構成要素X、Y及びZの異常の原因は、1つのパラメータに関する異常閾値Thだけでなく、複数のパラメータ間の関係性に関する異常閾値Thにより検知される。したがって、異常の原因の分類数は、複数個数設定される場合がある。
As described above, the abnormality threshold value Th for each parameter is stored in the database 6 and can be changed as appropriate. Further, the method of specifying the cause of the error by using the abnormal threshold value Th as described above is not limited. For example, the cause of error may be identified using a discriminant model in which the relationship between each parameter stored in the database 6 and the cause of error is learned in steps S305, S310, S402 and S407 by machine learning. For example, when identifying the cause of an abnormality in component X, Y, or Z of the
以上、具体的な測定手順と、電位変化の勾配や周波数に関連するパラメータ抽出による誤差原因の特定方法とを説明したが、この手順にかかわらず、イオン濃度の異なる2種類以上の液を流路に導入し、電位変化や周波数に関連するパラメータを取得できれば、V(t)の微分やピーク同定など、異なる手順を用いてもよい。 The specific measurement procedure and the method of identifying the cause of error by extracting parameters related to the slope and frequency of potential change have been described above. , and obtain parameters related to potential change and frequency, different procedures such as differentiation of V(t) and peak identification may be used.
また、図8において連続測定時の波形を解析して異常の原因を特定する方法を説明したが、連続測定時でなくともよく、予備動作やキャリブレーション時の動作時の電位変化についての波形を解析してもよい。さらに、波形解析時に、1種類のイオン選択性電極101の電位波形だけでなく、複数種類のイオン選択性電極101の電位波形を組み合わせて解析してもよい。これにより、解析精度を向上させることができる。
In addition, the method of identifying the cause of an abnormality by analyzing the waveform during continuous measurement has been described with reference to FIG. may be analyzed. Furthermore, during waveform analysis, not only the potential waveform of one type of ion-
さらに、分析装置100に対し、流路中の気泡を検知するセンサ(第1のセンサ)、電解質分析ユニット1の構成要素の振動を検知するセンサ(第2のセンサ)又は対象物の表面電位を測定するセンサ(第3のセンサ)等をさらに設け、上記パラメータ以外に、これらのセンサの出力値を併せて用いてもよい。この場合、データベース6には、各センサの出力値と誤差原因との関係を示すデータが格納されており、波形解析部8は、上記パラメータ及びセンサの出力値と、データベース6内の異常特定データを比較することで、誤差原因を特定することができる。なお、「対象物の表面電位」とは、電解質分析ユニット1の構成要素の表面電位を指す。電解質分析ユニット1の構成要素に表面電位が存在すると、微弱な電流が電位測定部2に混入し、測定値を変動させる可能性がある。したがって、電解質分析ユニット1の構成要素の表面電位をセンサ(第3のセンサ)によりモニタリングすることにより、誤差原因が電気ノイズによるものか否かをより容易に判別することができる。
Furthermore, for the
<技術的効果>
以上のように、本実施形態の分析装置100は、電位変化V(t)に関するパラメータ、電位変化V(t)の周波数に関するパラメータを求め、各パラメータと異常閾値とを比較し、複数のパラメータ間の関係性と異常特定データを参照することで、測定誤差の原因を特定することができる。これにより、ユーザに対して測定誤差を引き起こす恐れのある箇所や改善方法を促すことができる。このことから、誤差原因となる箇所の特定に要する時間を低減でき、ユーザの作業負担を低減することができる。
<Technical effect>
As described above, the
また、本実施形態の分析装置100は、内部標準液電位の測定、サンプル電位の測定及びイオン濃度の算出と並行して、異常があった場合の原因を特定することができる。したがって、測定スループットが低下することがない。
In addition, the
[第2の実施形態]
第1の実施形態においては、電位変化V(t)に関するパラメータ、電位変化V(t)の周波数に関するパラメータを求め、各パラメータについての異常閾値と複数のパラメータ間の関係性とに基づいて異常の原因を特定する方法について説明した。
[Second embodiment]
In the first embodiment, a parameter related to the potential change V(t) and a parameter related to the frequency of the potential change V(t) are obtained, and an abnormality is determined based on the abnormality threshold for each parameter and the relationship between the plurality of parameters. I explained how to identify the cause.
これに対し、第2の実施形態においては、電位変化V(t)に関するパラメータ、電位変化V(t)の周波数に関するパラメータについての閾値(予兆閾値)又はパラメータの経時変化に基づいて、異常(測定誤差の発生)の予兆を検知し、測定誤差が発生する可能性のある原因を特定する方法について説明する。 On the other hand, in the second embodiment, an abnormality (measured A method for detecting signs of occurrence of errors) and identifying possible causes of measurement errors will be described.
<分析装置>
第2の実施形態の分析装置としては、第1の実施形態で説明した分析装置100と同様のものを使用できる。
<Analyzer>
As the analyzer of the second embodiment, the same analyzer as the
<分析方法>
図9は、第2の実施形態に係る分析方法を示すフローチャートである。図9において、図3及び4(第1の実施形態)に示したステップと同様のステップについては同じ参照番号が付されている。以下、図4のフローチャートとの相違点について詳細に説明する。
<Analysis method>
FIG. 9 is a flow chart showing an analysis method according to the second embodiment. In FIG. 9, steps similar to those shown in FIGS. 3 and 4 (first embodiment) are given the same reference numerals. Differences from the flowchart of FIG. 4 will be described in detail below.
まず、ステップS303の後に実行されるステップS304及びステップS307と並行して、波形解析部8によりステップS401~S403が連続的に実行される。なお、本実施形態においては濃度算出部5によるステップS305が省略される。また、波形解析部8によるステップS404及びS405も省略される。
First, steps S401 to S403 are continuously executed by the waveform analysis unit 8 in parallel with steps S304 and S307 executed after step S303. Note that step S305 by the
具体的には、ステップS303及びS307と並行して、波形解析部8は、ステップS401において、波形解析用の内部標準液電位を取得する。ステップS402において、波形解析部8は、電位変化V(t)のパラメータ(勾配など)や周波数に関するパラメータ(強度分布F(x)に基づくパラメータなど)を取得し、データベース6に保存する。次に、ステップS403において、波形解析部8は、データベース6を参照して、算出された各パラメータと予兆閾値とを比較する。予兆閾値についての詳細は後述するが、例えば、異常の予兆があると判断できる値の最大値や値の範囲とすることができ、第1の実施形態における異常閾値よりも低い値に設定することができる。 Specifically, in parallel with steps S303 and S307, the waveform analysis unit 8 acquires an internal standard liquid potential for waveform analysis in step S401. In step S<b>402 , the waveform analysis unit 8 acquires parameters (eg, gradient) of the potential change V(t) and parameters related to frequency (eg, parameters based on the intensity distribution F(x)), and stores them in the database 6 . Next, in step S403, the waveform analysis unit 8 refers to the database 6 and compares each calculated parameter with the predictive threshold. Although the details of the sign threshold will be described later, for example, it can be set to a maximum value or a range of values that can be used to determine that there is a sign of abnormality, and can be set to a value lower than the abnormality threshold in the first embodiment. can be done.
次に、ステップS308において電解質分析ユニット1が測定流路にサンプルを導入した後、ステップS309及びステップS313と並行して、波形解析部8によりステップS406~S408及びS901が連続的に実行される。なお、本実施形態においては濃度算出部5によるステップS310が省略される。また、波形解析部8によるステップS409及びS410も省略される。
Next, after the
ステップS406~S408は、波形解析用の内部標準液電位の代わりに波形解析用のサンプル電位について処理が行われる点でのみ、ステップS401~S403と異なっているため、説明を省略する。 Steps S406 to S408 are different from steps S401 to S403 only in that processing is performed on the sample potential for waveform analysis instead of the internal standard solution potential for waveform analysis, so description thereof will be omitted.
その後、ステップS901において、波形解析部8は、ステップS403及びS408における、各パラメータ及び各パラメータに関する予兆閾値の比較の結果と、データベース6に格納された異常予兆データ(異常解析データ)に基づいて、異常の予兆があるかどうかを判定する。なお、第1の実施形態と同様に、ある1つのパラメータと予兆閾値とを比較してもよいし、複数のパラメータ間の関係性(複数のパラメータの和や積など)と予兆閾値とを比較するようにしてもよい。また、予兆閾値を超えるパラメータの組み合わせから異常の予兆があるかどうかを判定するようにしてもよい。 After that, in step S901, the waveform analysis unit 8, based on the results of the comparison of each parameter and the predictive threshold for each parameter in steps S403 and S408, and the abnormality predictive data (abnormality analysis data) stored in the database 6, Determine whether there is an anomaly sign. As in the first embodiment, one parameter may be compared with the predictive threshold, or the relationship between a plurality of parameters (such as the sum or product of a plurality of parameters) may be compared with the predictive threshold. You may make it Further, it may be determined whether or not there is a sign of abnormality from a combination of parameters exceeding the sign threshold.
ここで、予兆閾値の例について説明する。例えば、予兆閾値は段階的に設定することができる。この場合、波形解析部8は、各パラメータの値やパラメータ間の関係性が段階的な予兆閾値を超過する速度が所定の速度より大きい場合に、異常の予兆があると判定することができる。また、予兆閾値が、将来的に誤差を引き起こす可能性のある値に設定されていてもよく、この場合は、波形解析部8は、パラメータが予兆閾値を超過した際に異常の予兆があると判定することができる。 Here, an example of the predictor threshold will be described. For example, the portent threshold can be set stepwise. In this case, the waveform analysis unit 8 can determine that there is a sign of abnormality when the speed at which the value of each parameter or the relationship between the parameters exceeds the stepwise sign threshold is higher than a predetermined speed. Further, the portent threshold may be set to a value that may cause an error in the future. In this case, the waveform analysis unit 8 determines that there is a portent of abnormality when the parameter exceeds the portent threshold can judge.
データベース6には、各パラメータに関する予兆閾値と、各パラメータやパラメータ間の関係性が予兆閾値を超過した場合の、将来的に誤差を引き起こす可能性のある原因や、異常を引き起こす可能性のある構成要素の情報、装置外の原因、対処方法の記述、さらには発生時期などの予測時期などの情報を示す異常予兆データが保存されている。なお、データベース6に格納されている異常予兆データは、装置出荷時や連続運用時の電位波形の情報に基づくものであってもよいし、任意に設定されたものであってもよい。 The database 6 stores predictive thresholds for each parameter, causes that may cause errors in the future, and configurations that may cause anomalies when each parameter or the relationship between parameters exceeds the predictive threshold. Abnormality predictor data indicating information on elements, causes outside the device, descriptions of countermeasures, and prediction times such as occurrence times are stored. The abnormality predictor data stored in the database 6 may be based on the information of the potential waveform at the time of device shipment or continuous operation, or may be arbitrarily set.
ステップS901において異常の予兆があると判定された場合(YES)、ステップS902において、表示部7は、データベース6の異常予兆データに基づいて、異常予兆の状態及び対処方法を表示する。異常の予兆がないと判定された場合(NO)、ステップS313において、表示部7は、濃度算出部5により算出されたイオン濃度(測定結果)のみを表示する。その後、上記と同様にステップS314及びS315が実行される。
If it is determined in step S901 that there is a sign of abnormality (YES), the
なお、ステップS901における異常予兆の判定において、波形解析部8は、データベース6に格納された過去の電位波形やパラメータを参照することもできる。このとき、データベース6に保存されたそれぞれのパラメータの時系列変化の変化点や外れ値などを検知してもよい。具体的には、例えば、波形解析部8は、各パラメータを経時的に取得し、単位時間当たりのパラメータの変化量を算出して、該変化量の変化点又は外れ値が検知された場合に、異常の予兆があると判定することができる。この場合、データベース6には、各パラメータの変化量について変化点又は外れ値が検知された場合の、将来的に誤差を引き起こす可能性のある原因や、異常を引き起こす可能性のある構成要素の情報、装置外の原因、対処方法の記述、さらには発生時期などの予測時期などの情報を示す異常予兆データが保存されている。 It should be noted that the waveform analysis unit 8 can also refer to the past potential waveforms and parameters stored in the database 6 in determining the sign of abnormality in step S901. At this time, change points, outliers, and the like of time-series changes of the respective parameters stored in the database 6 may be detected. Specifically, for example, the waveform analysis unit 8 acquires each parameter over time, calculates the amount of change in the parameter per unit time, and when a change point or an outlier in the amount of change is detected, , it can be determined that there is a sign of abnormality. In this case, the database 6 contains information on factors that may cause errors in the future and components that may cause anomalies when a change point or an outlier is detected for the amount of change in each parameter. , a cause outside the device, a description of a coping method, and anomaly predictive data indicating information such as predicted time such as occurrence time is stored.
あるいは、機械学習手法によって、ステップS402及びS407においてデータベース6に保存した各パラメータと異常予兆の関係性を学習させた判別モデルを用いて、異常の予兆を検知してもよい。例えば、電解質分析ユニット1の構成要素X、Y及びZの異常予兆を検知する場合、波形解析部8は、波形解析により取得した各パラメータのうち1つ、あるいは複数のパラメータ間の関係性に基づいて、構成要素Xに異常予兆がある、構成要素X及びYに異常予兆がある、あるいは構成要素X及びZに異常予兆がある、などのように分類を行う。このように、構成要素X、Y及びZの異常予兆は、1つのパラメータに関する予兆閾値だけでなく、複数のパラメータ間の関係性に関する予兆閾値により検知される。したがって、異常予兆の分類数は、複数個数設定される場合がある。
Alternatively, a sign of abnormality may be detected using a discriminant model in which the relationship between each parameter stored in the database 6 and the sign of abnormality is learned by a machine learning technique in steps S402 and S407. For example, when detecting an abnormality sign of the components X, Y, and Z of the
また、ステップS901において異常の予兆があると判定された場合は、異常を引き起こす可能性のある構成要素や外乱原因の改善方法を表示部7に表示してユーザや保守管理者に対して報告するだけでなく、交換部品の発注、サポート会社への連絡などを自動で行うようにしてもよい。これにより、ユーザや保守管理者の作業負担を軽減することができる。
Further, when it is determined that there is a sign of abnormality in step S901, the component that may cause the abnormality and the method for improving the cause of the disturbance are displayed on the
本実施形態の異常の予兆の検知方法は、第1の実施形態にて説明した誤差原因の特定と組み合わせて使用してもよい。 The method of detecting a sign of abnormality according to this embodiment may be used in combination with the identification of the error cause described in the first embodiment.
図9のステップS401~S403、S406~S408及びS901は、毎測定実施することもできるが、実施間隔をユーザや保守管理者が任意に設定することもできる。実施間隔を設定する場合は、例えば表示部7に実施間隔を設定するためのGUI画面が表示され、入力部3からユーザが所望の実施間隔を入力することで、制御部4が設定された実施間隔に従って濃度算出部5及び波形解析部8による処理を制御する。例えば、分析装置100の保守点検の際(例えば1か月~2か月に一度)に本実施形態の異常の予兆の検知を実行することができる。
Steps S401 to S403, S406 to S408, and S901 in FIG. 9 can be performed every measurement, but the user or maintenance manager can arbitrarily set the intervals. When setting the implementation interval, for example, a GUI screen for setting the implementation interval is displayed on the
本実施形態においても、第1の実施形態と同様に、分析装置100に対し、流路中の気泡を検知するセンサ、電解質分析ユニット1の構成要素の振動を検知するセンサ又は対象物の表面電位を測定するセンサ等をさらに設け、上記パラメータ以外に、これらのセンサの出力値を併せて用いてもよい。この場合、データベース6には、各センサの出力値と異常の予兆との関係を示すデータが格納されており、波形解析部8は、上記パラメータ及びセンサの出力値と、データベース6内の異常予兆データを比較することで、異常を予兆することができる。
In the present embodiment, as in the first embodiment, the
<技術的効果>
以上のように、本実施形態の分析装置100は、電位変化V(t)に関するパラメータ、電位変化V(t)の周波数に関するパラメータを取得して、データベース6に格納された予兆閾値と比較し、複数のパラメータ間の関係性や異常予兆データを参照して異常発生の予兆を検知する。これにより、異常が発生する前に、将来的に異常を引き起こす可能性のある原因箇所や外乱をユーザに報知することができる。メンテナンス時期を前もって計画できることから、突発的な分析装置100の停止を回避し、分析装置100の稼動率が低い時期に保守管理作業を実施することができる。したがって、測定スループットの向上に寄与することができる。
<Technical effect>
As described above, the
[第3の実施形態]
第1の実施形態において、測定誤差の原因として、流路への気泡の混入が挙げられることを説明した。そこで、第3の実施形態においては、故意に気泡を流路に混入させる機構を設け、気泡が流路に混入した場合の電位変化V(t)の勾配や周波数への影響度合いを評価する方法について説明する。
[Third Embodiment]
In the first embodiment, it has been explained that the cause of the measurement error is the inclusion of air bubbles in the channel. Therefore, in the third embodiment, a mechanism for intentionally mixing air bubbles into the flow channel is provided, and a method of evaluating the degree of influence on the gradient and frequency of the potential change V(t) when air bubbles are mixed in the flow channel. will be explained.
<分析装置の構成例>
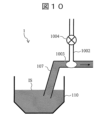
図10は、第3の実施形態に係る分析装置の一部の構成を示す概略図である。図10には、図1に示した電解質分析ユニット1の希釈槽110及びシッパーノズル107が示されている。図10に示すように、本実施形態の分析装置は、シッパーノズル107から分岐する流路1002と、流路1002の開閉を制御する電磁弁1004と、をさらに備える。流路1002の一端は大気開放されている。
<Configuration example of analyzer>
FIG. 10 is a schematic diagram showing the configuration of part of the analysis device according to the third embodiment. FIG. 10 shows the
希釈槽110には、内部標準液ISが収容されている。シッパーシリンジポンプ133(図10には不図示)の吸引動作により、シッパーノズル107の流路に内部標準液ISを送液することができる。
The
シッパーノズル107の流路に気泡を混入させる際は、電磁弁1004を開放し、シッパーシリンジポンプ133に吸引動作を行わせることにより、気泡1003を流路内に吸引することができる。気泡1003の最小直径は、流路内径を分断可能な大きさとすることができる。例えば流路の内径が1mmの場合、気泡1003の体積は0.52μLである。気泡1003のサイズは、シッパーシリンジポンプ133の吸引量に応じて制御することができる。さらに、気泡1003の移動距離(位置)は、電磁弁1004を閉め、シッパーシリンジポンプ133の吸引量を調整することによって変更することができる。
When air bubbles are mixed into the channel of the
電磁弁1004とシッパーシリンジポンプ133はそれぞれ制御部4と通信しており、制御部4により電磁弁1004の開閉操作やシッパーシリンジポンプ133による吸引吐出操作を制御することが可能である。
The
なお、電磁弁1004を有する流路1002は、シッパーノズル107に対し着脱可能に構成されていてもよい。
Note that the
<分析方法>
本実施形態の分析方法においては、大きさや位置が設定された気泡を流路に混入させ、例えば第1の実施形態に記載のサンプル測定操作と組み合わせる。波形解析部8は、気泡を敢えて混入させた場合の電位変化V(t)の解析結果と、データベース6に格納されるデータとを比較する。これにより、気泡サイズ、気泡混入位置による電位変化V(t)の勾配や周波数への影響度合いを検証することが可能である。
<Analysis method>
In the analysis method of the present embodiment, bubbles whose size and position are set are mixed into the channel, and combined with the sample measurement operation described in the first embodiment, for example. The waveform analysis unit 8 compares the analysis result of the potential change V(t) when air bubbles are intentionally mixed with the data stored in the database 6 . As a result, it is possible to verify the degree of influence on the gradient and frequency of the potential change V(t) due to the size of the bubble and the location of the bubble.
また、例えば、通常のサンプルの測定前に気泡を混入させ、そのときの電位変化V(t)の回帰分析や周波数解析により得られるパラメータを、パラメータの異常閾値としてデータベース6に格納することもできる。 Further, for example, air bubbles are mixed before measurement of a normal sample, and parameters obtained by regression analysis or frequency analysis of the potential change V(t) at that time can be stored in the database 6 as parameter abnormality thresholds. .
さらに、分析装置100に何らかの異常があると判断された場合にも、本実施形態は有用である。具体的には、異常時の電位変化V(t)のパラメータを第1の実施形態と同様に取得し、さらに、本実施形態の気泡を混入させる機構を分析装置100に取り付け、気泡を混入させた上で電位変化V(t)のパラメータを取得して、異常時のパラメータと、気泡混入時のパラメータとを比較する。異常時のパラメータと、気泡混入時のパラメータとに相関がある場合に、分析装置100に生じている異常が気泡の混入によるものであると判断することができる。
Furthermore, this embodiment is also useful when it is determined that the
<技術的効果>
以上のように、本実施形態の分析装置は、電解質分析ユニット1の流路に気泡を導入する構成を備え、気泡混入時の電位変化V(t)の勾配や周波数への影響度合いを試験し評価することができる。これにより、分析装置の状態を把握し異常が発生する前に分析装置の保守点検を実施し、突発的なダウンタイムを低減することができる。
<Technical effect>
As described above, the analysis apparatus of the present embodiment has a configuration for introducing air bubbles into the flow channel of the
[第4の実施形態]
第1の実施形態において、測定の誤差原因として、分析装置の振動が挙げられることを説明した。そこで、第4の実施形態においては、故意に分析装置100に振動を印加する機構を設け、振動が印加された場合の電位変化V(t)の勾配や周波数への影響度合いを評価するための構成及び分析方法について説明する。
[Fourth embodiment]
In the first embodiment, it has been described that the cause of measurement error is the vibration of the analyzer. Therefore, in the fourth embodiment, a mechanism for intentionally applying vibration to the
<分析装置の構成例>
図11は、第4の実施形態に係る分析装置の一部の構成を示す概略図である。図11に示すように、本実施形態の分析装置は、図1に示した電解質分析ユニット1のイオン選択性電極101、比較電極104及びピンチ弁105を収容する収容器1101、収容器1101を振動させる振動器1102をさらに備える。振動器1102は、3次元方向にそれぞれ0.01mm~3mmの振幅と10Hz~100Hzの周波数を任意に設定し、収容器1101を振動させる機能を有する。
<Configuration example of analyzer>
FIG. 11 is a schematic diagram showing a configuration of part of an analyzer according to the fourth embodiment. As shown in FIG. 11, the analyzer of this embodiment includes a
振動器1102を設ける代わりに、各種ノズルや電磁弁、ピンチ弁などの構成要素を意図的なタイミングで稼働させることによって、電解質分析ユニット1に振動を印加してもよい。
Instead of providing the
振動器1102や各種構成要素は制御部4と通信しており、制御部を介して振動条件を制御することが可能である。なお、振動器1102は、収容器1101から着脱可能に構成されていてもよい。
The
<分析方法>
本実施形態の分析方法においては、振幅、周波数及び振動方向が設定された振動を敢えて電解質分析ユニット1に印加し、例えば第1の実施形態に記載のサンプル測定操作と組み合わせる。波形解析部8は、振動を敢えて印加した場合の電位変化V(t)の解析結果と、データベース6に格納されるデータとを比較する。これにより、振動振幅と振動周波数の電位変化V(t)の勾配や周波数への影響度合いを検証することが可能である。
<Analysis method>
In the analysis method of the present embodiment, vibration with set amplitude, frequency, and vibration direction is purposely applied to the
また、例えば、通常のサンプルの測定前に電解質分析ユニット1に振動を印加して、そのときの電位変化V(t)の回帰分析や周波数解析により得られるパラメータを、パラメータの異常閾値としてデータベース6に格納することもできる。
Further, for example, vibration is applied to the
さらに、分析装置100に何らかの異常があると判断された場合にも、本実施形態は有用である。具体的には、異常時の電位変化V(t)のパラメータを第1の実施形態と同様に取得し、さらに、本実施形態の振動を印加させる機構を分析装置100に取り付け、振動を印加した上で電位変化V(t)のパラメータを取得して、異常時のパラメータと、振動印加時のパラメータとを比較する。異常時のパラメータと、振動印加時のパラメータとに相関がある場合に、分析装置100に生じている異常が振動によるものであると判断することができる。
Furthermore, this embodiment is also useful when it is determined that the
<技術的効果>
以上のように、本実施形態の分析装置は、電解質分析ユニット1に振動を印加する構成を備え、振動印加時の電位変化V(t)の勾配や周波数への影響度合いを試験し評価することができる。これにより、分析装置の状態を把握し異常が発生する前に分析装置の保守点検を実施し、突発的なダウンタイムを低減することができる。
<Technical effect>
As described above, the analysis apparatus of the present embodiment has a configuration for applying vibration to the
[第5の実施形態]
第1の実施形態において、測定の誤差原因として、電気ノイズの発生が挙げられることを説明した。そこで、第5の実施形態においては、故意に分析装置100に電気ノイズを印加する機構を設け、電気ノイズがある場合の電位変化V(t)の勾配や周波数への影響度合いを評価するための構成及び分析方法について説明する。
[Fifth embodiment]
In the first embodiment, it has been described that the cause of measurement error is the occurrence of electrical noise. Therefore, in the fifth embodiment, a mechanism for intentionally applying electrical noise to the
<分析装置の構成例>
図12は、第5の実施形態に係る分析装置の一部の構成を示す概略図である。図12に示すように、本実施形態の分析装置において、電解質分析ユニット1は、インピーダンス変換回路1201~1203、ADコンバータ1204、電磁シールド1205及び1206、電源装置1207、電圧発生装置1208をさらに備える。
<Configuration example of analyzer>
FIG. 12 is a schematic diagram showing the configuration of part of the analysis device according to the fifth embodiment. As shown in FIG. 12, in the analyzer of this embodiment, the
インピーダンス変換回路1201~1203は、比較電極104、イオン選択性電極101a~101cからそれぞれの電位を出力するOPアンプに基づく。ADコンバータ1204は、インピーダンス変換回路1201~1203の出力電位をデジタル変換する。
Impedance conversion circuits 1201-1203 are based on OP amplifiers that output respective potentials from the
電磁シールド1205は、イオン選択性電極101a~101c、比較電極104、ピンチ弁105を覆い、外部からの電気ノイズの混入を回避する。
An
電磁シールド1206は、インピーダンス変換回路1201~1203を覆い、外部からの電気ノイズの混入を回避する。
An
電源装置1207は、電磁シールド1205及び1206に対し、可変電流を印加する。電源装置1207は内部にコンバータ/インバータを搭載し、交流電流の周波数や電流値を変更することが可能である。
電圧発生装置1208は、電磁シールド1205の内部に設けられ、位置を任意に変更可能に構成される。電圧発生装置1208は、可変電圧を電磁シールド1205に印加する。
The
電源装置1207と電圧発生装置1208は制御部4と通信しており、制御部4により、電源装置1207の電流値や周波数、電圧発生装置1208の電圧値、電圧発生装置1208の位置を制御することが可能である。このように、電源装置1207及び電圧発生装置1208を制御することにより、電磁シールド1205及び1206に対し電気ノイズを印加することができる。
The
なお、電磁シールド1205及び1206、電源装置1207、電圧発生装置1208は、電解質分析ユニット1から着脱可能に構成されていてもよい。
The
<分析方法>
本実施形態の分析方法においては、設置環境や電圧値、電流値が既知の(設定された)電気ノイズを敢えて電解質分析ユニット1に印加し、例えば第1の実施形態に記載のサンプル測定操作と組み合わせる。波形解析部8は、電気ノイズを敢えて印加した場合の電位変化V(t)の解析結果と、データベース6に格納されるデータとを比較する。これにより、接地環境や電気ノイズによる電位変化V(t)の勾配や周波数への影響度合いを試験することが可能である。
<Analysis method>
In the analysis method of the present embodiment, an electrical noise whose installation environment, voltage value, and current value are known (set) is intentionally applied to the
また、例えば、通常のサンプルの測定前に電解質分析ユニット1に電気ノイズを印加して、そのときの電位変化V(t)の回帰分析や周波数解析により得られるパラメータを、パラメータの異常閾値としてデータベース6に格納することもできる。
Further, for example, electrical noise is applied to the
さらに、分析装置100に何らかの異常があると判断された場合にも、本実施形態は有用である。具体的には、異常時の電位変化V(t)のパラメータを第1の実施形態と同様に取得し、さらに、本実施形態の電気ノイズを印加させる機構を分析装置100に取り付け、電気ノイズを印加した上で電位変化V(t)のパラメータを取得して、異常時のパラメータと、電気ノイズ印加時のパラメータとを比較する。異常時のパラメータと、電気ノイズ印加時のパラメータとに相関がある場合に、分析装置100に生じている異常が電気ノイズによるものであると判断することができる。
Furthermore, this embodiment is also useful when it is determined that the
<技術的効果>
以上のように、本実施形態の分析装置は、電解質分析ユニット1に電気ノイズを印加する構成を備え、電気ノイズ印加時の電位変化V(t)の勾配や周波数への影響度合いを試験し評価することができる。これにより、分析装置の状態を把握し異常が発生する前に分析装置の保守点検を実施し、突発的なダウンタイムを低減することができる。
<Technical effect>
As described above, the analyzer of the present embodiment has a configuration for applying electrical noise to the
[変形例]
本開示は、上述した実施形態に限定されるものでなく、様々な変形例を含んでいる。例えば、上述した実施形態は、本開示を分かりやすく説明するために詳細に説明したものであり、必ずしも説明した全ての構成を備える必要はない。また、ある実施形態の一部を他の実施形態の構成に置き換えることができる。また、ある実施形態の構成に他の実施形態の構成を加えることもできる。また、各実施形態の構成の一部について、他の実施形態の構成の一部を追加、削除又は置換することもできる。
[Modification]
The present disclosure is not limited to the embodiments described above, and includes various modifications. For example, the above-described embodiments have been described in detail in order to explain the present disclosure in an easy-to-understand manner, and do not necessarily include all the configurations described. Also, part of an embodiment can be replaced with the configuration of another embodiment. Moreover, the configuration of another embodiment can be added to the configuration of one embodiment. Moreover, a part of the configuration of each embodiment can be added, deleted or replaced with a part of the configuration of another embodiment.
本開示の適用範囲は、電位差計測(イオン選択性電極)や比色(吸光度分析)の原理に基づく自動分析装置に限定されない。例えば、比濁や散乱光強度に基づくラテックス凝集分析装置、抗原抗体反応に基づく免疫分析装置など、一般に溶液状のサンプルを測定するため、あるいは、サンプルや試薬を供給したり排出したりするためのフローセルや配管を備える自動分析装置に広く適用可能である。 The scope of application of the present disclosure is not limited to automated analyzers based on potentiometric (ion-selective electrodes) or colorimetric (absorbance analysis) principles. For example, latex agglutination analyzers based on turbidity and scattered light intensity, immunoanalyzers based on antigen-antibody reactions, etc. It is widely applicable to automatic analyzers equipped with flow cells and piping.
1・・・電解質分析ユニット
2・・・電位測定部
3・・・入力部
4・・・制御部
5・・・濃度算出部
6・・・データベース
7・・・表示部
8・・・波形解析部
101・・・イオン選択性電極
104・・・比較電極
105・・・ピンチ弁
106・・・真空吸引ノズル
107・・・シッパーノズル
108・・・希釈液供給ノズル
109・・・内部標準液供給ノズル
110・・・希釈槽
111・・・廃液タンク
112・・・真空ポンプ
121~127・・・電磁弁
131・・・内部標準液用シリンジポンプ
132・・・希釈液用シリンジポンプ
133・・・シッパーシリンジポンプ
141・・・内部標準液ボトル
151・・・希釈液ボトル
161・・・比較電極液ボトル
Claims (19)
前記イオン濃度に基づく電位を得るイオン選択性電極と、
参照液に基づく電位を得る参照電極と、
前記イオン選択性電極と前記参照電極との間の起電力を測定する測定部と、
所定の時間領域における前記起電力の電位変化についての解析を行う解析部と、
前記電位変化と前記分析装置の異常との関係を示す異常解析データを格納する記憶部と、を備え、
前記解析部は、
前記測定部により測定された前記起電力の前記電位変化についてのパラメータを、前記時間領域における前記電位変化の周波数の強度分布を解析することにより取得し、前記パラメータと、前記記憶部に格納された前記異常解析データとに基づいて、前記分析装置の異常を解析することを特徴とする分析装置。 An analyzer for measuring the ion concentration in a sample,
an ion-selective electrode that obtains a potential based on the ion concentration;
a reference electrode for obtaining a potential based on the reference liquid;
a measurement unit that measures the electromotive force between the ion-selective electrode and the reference electrode;
an analysis unit that analyzes the potential change of the electromotive force in a predetermined time domain;
a storage unit that stores abnormality analysis data indicating the relationship between the potential change and the abnormality of the analyzer,
The analysis unit is
A parameter about the potential change of the electromotive force measured by the measuring unit is obtained by analyzing the intensity distribution of the frequency of the potential change in the time domain, and the parameter is stored in the storage unit. An analyzer that analyzes an abnormality of the analyzer based on the abnormality analysis data.
前記時間領域における前記電位変化の回帰分析をさらに行うことにより、前記パラメータを取得することを特徴とする請求項1に記載の分析装置。 The analysis unit is
2. The analyzer according to claim 1, wherein said parameter is obtained by further performing regression analysis of said potential change in said time domain.
前記回帰分析により得られる前記電位変化の近似式の勾配を前記パラメータとして取得することを特徴とする請求項2に記載の分析装置。 The analysis unit is
3. The analyzer according to claim 2, wherein a slope of the approximate expression of the potential change obtained by the regression analysis is obtained as the parameter.
前記分析装置は、
試料中のイオン濃度に基づく電位を得るイオン選択性電極と、
参照液に基づく電位を得る参照電極と、
前記イオン選択性電極と前記参照電極との間の起電力を測定する測定部と、
所定の時間領域における前記起電力の電位変化についての解析を行う解析部と、
前記電位変化と前記分析装置の異常との関係を示す異常解析データを格納する記憶部と、を備え、
前記異常解析データは、前記分析装置の異常の予兆を検知するための異常予兆データを含み、
前記測定部により、前記イオン選択性電極と前記参照電極との間の前記起電力を測定することと、
前記解析部により、前記時間領域における前記起電力の電位変化について、複数のパラメータを取得することと、
前記解析部により、前記複数のパラメータの組み合わせと、前記記憶部に格納された前記異常予兆データとに基づいて、前記分析装置の異常の予兆があるかを判定することと、を含む分析方法。 An analysis method using an analysis device,
The analysis device is
an ion-selective electrode that obtains a potential based on the concentration of ions in the sample;
a reference electrode for obtaining a potential based on the reference liquid;
a measurement unit that measures the electromotive force between the ion-selective electrode and the reference electrode;
an analysis unit that analyzes the potential change of the electromotive force in a predetermined time domain;
a storage unit that stores abnormality analysis data indicating the relationship between the potential change and the abnormality of the analyzer,
The abnormality analysis data includes abnormality sign data for detecting an abnormality sign of the analysis device,
measuring the electromotive force between the ion-selective electrode and the reference electrode by the measurement unit;
Acquiring a plurality of parameters with respect to the potential change of the electromotive force in the time domain by the analysis unit;
determining whether there is a sign of abnormality in the analysis device by the analysis unit based on the combination of the plurality of parameters and the abnormality sign data stored in the storage unit.
前記イオン濃度に基づく電位を得るイオン選択性電極と、
参照液に基づく電位を得る参照電極と、
前記イオン選択性電極と前記参照電極との間の起電力を測定する測定部と、
所定の時間領域における前記起電力の電位変化についての解析を行う解析部と、
前記電位変化と前記分析装置の異常との関係を示す異常解析データを格納する記憶部と、を備え、
前記異常解析データは、前記分析装置の異常の予兆を検知するための異常予兆データを含み、
前記解析部は、
前記測定部により測定された前記起電力の前記電位変化についての複数のパラメータを取得し、前記複数のパラメータの組み合わせと、前記記憶部に格納された前記異常予兆データとに基づいて、前記分析装置の異常の予兆があるかを判定することを特徴とする分析装置。 An analyzer for measuring the ion concentration in a sample,
an ion-selective electrode that obtains a potential based on the ion concentration;
a reference electrode for obtaining a potential based on the reference liquid;
a measurement unit that measures the electromotive force between the ion-selective electrode and the reference electrode;
an analysis unit that analyzes the potential change of the electromotive force in a predetermined time domain;
a storage unit that stores abnormality analysis data indicating the relationship between the potential change and the abnormality of the analyzer,
The abnormality analysis data includes abnormality sign data for detecting an abnormality sign of the analysis device,
The analysis unit is
obtaining a plurality of parameters regarding the potential change of the electromotive force measured by the measuring unit, and analyzing the analysis device based on the combination of the plurality of parameters and the abnormality sign data stored in the storage unit; An analysis device that determines whether there is a sign of an abnormality in the
前記時間領域における前記電位変化の回帰分析により、前記複数のパラメータのうち少なくとも1つのパラメータを取得し、
前記記憶部には、前記回帰分析により取得される前記少なくとも1つのパラメータの異常閾値が格納され、
前記解析部は、
前記少なくとも1つのパラメータと、前記異常閾値とを比較することにより、前記分析装置の異常の原因を特定することを特徴とする請求項5に記載の分析装置。 The analysis unit is
obtaining at least one of the plurality of parameters by regression analysis of the potential change in the time domain;
The storage unit stores an abnormality threshold of the at least one parameter obtained by the regression analysis,
The analysis unit is
6. The analysis device according to claim 5, wherein the cause of the abnormality of the analysis device is specified by comparing the at least one parameter and the abnormality threshold.
前記時間領域における前記電位変化の周波数を解析することにより、前記複数のパラメータのうち少なくとも1つのパラメータを取得し、
前記記憶部には、前記周波数を解析することにより取得される前記少なくとも1つのパラメータの異常閾値が格納され、
前記解析部は、
前記少なくとも1つのパラメータと、前記異常閾値とを比較することにより、前記分析装置の異常の原因を特定することを特徴とする請求項5に記載の分析装置。 The analysis unit is
obtaining at least one of the plurality of parameters by analyzing the frequency of the potential change in the time domain;
The storage unit stores an abnormality threshold of the at least one parameter obtained by analyzing the frequency,
The analysis unit is
6. The analysis device according to claim 5, wherein the cause of the abnormality of the analysis device is specified by comparing the at least one parameter and the abnormality threshold.
前記解析部は、
前記回帰分析により取得した前記少なくとも1つのパラメータと、前記記憶部に格納される前記予兆閾値とを比較することにより、前記分析装置の異常の予兆があるかを判定することを特徴とする請求項6に記載の分析装置。 The storage unit stores an omen threshold value of the at least one parameter obtained by the regression analysis,
The analysis unit is
3. A judgment is made as to whether or not there is a sign of abnormality in said analyzer by comparing said at least one parameter obtained by said regression analysis with said sign threshold value stored in said storage unit. 7. The analyzer according to 6.
前記解析部は、
前記周波数を解析することにより取得した前記少なくとも1つのパラメータと、前記記憶部に格納される前記予兆閾値とを比較することにより、前記分析装置の異常の予兆があるかを判定することを特徴とする請求項7に記載の分析装置。 The storage unit stores an omen threshold value of the at least one parameter obtained by analyzing the frequency,
The analysis unit is
The at least one parameter obtained by analyzing the frequency and the predictive threshold value stored in the storage unit are compared to determine whether there is a predictive sign of abnormality in the analysis device. The analysis device according to claim 7.
前記解析部は、
前記複数のパラメータの組み合わせと、前記異常特定データとに基づいて、前記分析装置の異常の原因を特定することを特徴とする請求項5に記載の分析装置。 The abnormality analysis data includes abnormality identification data for identifying the cause of the abnormality of the analysis device,
The analysis unit is
6. The analyzer according to claim 5, wherein the cause of the abnormality of said analyzer is identified based on said combination of said plurality of parameters and said abnormality identification data.
前記複数のパラメータをそれぞれ経時的に取得し、前記複数のパラメータの経時変化と、前記異常解析データとに基づいて、前記分析装置の異常の予兆があるかを判定することを特徴とする請求項5に記載の分析装置。 The analysis unit is
3. The apparatus of claim 1, wherein the plurality of parameters are acquired over time, and whether or not there is a sign of abnormality of the analyzer is determined based on the change over time of the plurality of parameters and the abnormality analysis data. 5. The analyzer according to 5.
前記時間領域において0.006秒以下の時間間隔で前記電位を測定することを特徴とする請求項5に記載の分析装置。 The measurement unit
6. The analyzer according to claim 5, wherein said potential is measured at time intervals of 0.006 seconds or less in said time domain.
前記流路に混入した気泡を検知する第1のセンサと、をさらに備え、
前記解析部は、
前記第1のセンサの出力値及び前記複数のパラメータと、前記記憶部に格納された前記異常解析データとに基づいて、前記分析装置の異常の原因を解析することを特徴とする請求項5に記載の分析装置。 a channel for supplying the sample to the ion-selective electrode;
and a first sensor that detects air bubbles mixed in the flow path,
The analysis unit is
6. The method according to claim 5, wherein the cause of the abnormality of the analyzer is analyzed based on the output value of the first sensor, the plurality of parameters, and the abnormality analysis data stored in the storage unit. The analyzer described.
前記解析部は、
前記第2のセンサの出力値及び前記複数のパラメータと、前記記憶部に格納された前記異常解析データとに基づいて、前記分析装置の異常の原因を解析することを特徴とする請求項5に記載の分析装置。 further comprising a second sensor that detects vibration of the analyzer,
The analysis unit is
6. The method according to claim 5, wherein the cause of the abnormality of the analyzer is analyzed based on the output value of the second sensor, the plurality of parameters, and the abnormality analysis data stored in the storage unit. The analyzer described.
前記解析部は、
前記第3のセンサの出力値及び前記複数のパラメータと、前記記憶部に格納された前記異常解析データとに基づいて、前記分析装置の異常の原因を解析することを特徴とする請求項5に記載の分析装置。 further comprising a third sensor that measures the surface potential of the object;
The analysis unit is
6. The method according to claim 5, wherein the cause of the abnormality of the analyzer is analyzed based on the output value of the third sensor, the plurality of parameters, and the abnormality analysis data stored in the storage unit. The analyzer described.
前記流路に気泡を混入させる機構と、をさらに備え、
前記解析部は、
前記気泡が前記流路に混入された際に前記測定部により測定された起電力の電位変化について前記複数のパラメータを取得して、
前記気泡が前記流路に混入された際の前記複数のパラメータと、前記記憶部に格納された前記パラメータの異常閾値とを比較して、前記気泡の混入の前記電位変化に対する影響度合いを評価することを特徴とする請求項5に記載の分析装置。 a channel for supplying the sample to the ion-selective electrode;
and a mechanism for mixing air bubbles into the channel,
The analysis unit is
Acquiring the plurality of parameters regarding the potential change of the electromotive force measured by the measurement unit when the bubbles are mixed in the flow path,
comparing the plurality of parameters when the air bubbles are mixed in the channel with an abnormality threshold value of the parameters stored in the storage unit to evaluate the degree of influence of the air bubble mixture on the potential change. 6. The analyzer according to claim 5, characterized in that:
前記解析部は、
前記振動が印加された際に前記測定部により測定された起電力の電位変化について前記パラメータを取得して、
前記振動が印加された際の前記複数のパラメータと、前記記憶部に格納された前記パラメータの異常閾値とを比較して、前記振動の前記電位変化に対する影響度合いを評価することを特徴とする請求項5に記載の分析装置。 Further comprising a mechanism for applying vibration to the analysis device,
The analysis unit is
Acquiring the parameter about the potential change of the electromotive force measured by the measuring unit when the vibration is applied,
A degree of influence of the vibration on the potential change is evaluated by comparing the plurality of parameters when the vibration is applied and an abnormality threshold value of the parameter stored in the storage unit. Item 6. The analyzer according to item 5.
前記解析部は、
前記電気ノイズが前記分析装置に印加された際に前記測定部により測定された起電力の電位変化について前記複数のパラメータを取得して、
前記電気ノイズが印加された際の前記複数のパラメータと、前記記憶部に格納された前記パラメータの異常閾値とを比較して、前記電気ノイズの前記電位変化に対する影響度合いを評価することを特徴とする請求項5に記載の分析装置。 Further comprising a mechanism for applying electrical noise to the analysis device,
The analysis unit is
Acquiring the plurality of parameters regarding the potential change of the electromotive force measured by the measurement unit when the electrical noise is applied to the analysis device,
The plurality of parameters when the electrical noise is applied and an abnormality threshold value of the parameter stored in the storage unit are compared to evaluate the degree of influence of the electrical noise on the potential change. The analysis device according to claim 5.
前記複数のパラメータをそれぞれ経時的に取得し、前記複数のパラメータの経時変化と、前記異常解析データとに基づいて、前記分析装置の異常の原因を特定することを特徴とする請求項5に記載の分析装置。 The analysis unit is
6. The method according to claim 5, wherein the plurality of parameters are acquired over time, and the cause of the abnormality of the analyzer is specified based on the change over time of the plurality of parameters and the abnormality analysis data. analyzer.
Priority Applications (5)
| Application Number | Priority Date | Filing Date | Title |
|---|---|---|---|
| JP2019133863A JP7267865B2 (en) | 2019-07-19 | 2019-07-19 | Analysis device and analysis method |
| EP20842677.5A EP4001910A4 (en) | 2019-07-19 | 2020-04-08 | Analysis device and analysis method |
| US17/627,910 US20220404310A1 (en) | 2019-07-19 | 2020-04-08 | Analysis device and analysis method |
| PCT/JP2020/015773 WO2021014695A1 (en) | 2019-07-19 | 2020-04-08 | Analysis device and analysis method |
| CN202080049766.2A CN114127549A (en) | 2019-07-19 | 2020-04-08 | Analysis device and analysis method |
Applications Claiming Priority (1)
| Application Number | Priority Date | Filing Date | Title |
|---|---|---|---|
| JP2019133863A JP7267865B2 (en) | 2019-07-19 | 2019-07-19 | Analysis device and analysis method |
Publications (3)
| Publication Number | Publication Date |
|---|---|
| JP2021018141A JP2021018141A (en) | 2021-02-15 |
| JP2021018141A5 JP2021018141A5 (en) | 2022-01-06 |
| JP7267865B2 true JP7267865B2 (en) | 2023-05-02 |
Family
ID=74194076
Family Applications (1)
| Application Number | Title | Priority Date | Filing Date |
|---|---|---|---|
| JP2019133863A Active JP7267865B2 (en) | 2019-07-19 | 2019-07-19 | Analysis device and analysis method |
Country Status (5)
| Country | Link |
|---|---|
| US (1) | US20220404310A1 (en) |
| EP (1) | EP4001910A4 (en) |
| JP (1) | JP7267865B2 (en) |
| CN (1) | CN114127549A (en) |
| WO (1) | WO2021014695A1 (en) |
Families Citing this family (3)
| Publication number | Priority date | Publication date | Assignee | Title |
|---|---|---|---|---|
| WO2022196713A1 (en) * | 2021-03-19 | 2022-09-22 | 京セラ株式会社 | Measurement system, analysis program, and measurement method |
| JP2023120955A (en) * | 2022-02-18 | 2023-08-30 | オムロンヘルスケア株式会社 | Electrolytic solution analysis device and electrolytic solution analysis method |
| JP2023166170A (en) * | 2022-05-09 | 2023-11-21 | 株式会社日立ハイテク | Analysis device and state detection method |
Citations (4)
| Publication number | Priority date | Publication date | Assignee | Title |
|---|---|---|---|---|
| JP2006258800A (en) | 2005-02-16 | 2006-09-28 | Ngk Spark Plug Co Ltd | Method and device for diagnosing abnormality of gas concentration detecting unit |
| JP2009121817A (en) | 2007-11-09 | 2009-06-04 | Olympus Corp | Analyzer |
| JP2014514093A (en) | 2011-04-15 | 2014-06-19 | デックスコム・インコーポレーテッド | Advanced analyte sensor calibration and error detection |
| JP2017500942A (en) | 2013-12-16 | 2017-01-12 | メドトロニック・ミニメッド・インコーポレーテッド | Method and system for improving the reliability of orthogonal redundant sensors |
Family Cites Families (14)
| Publication number | Priority date | Publication date | Assignee | Title |
|---|---|---|---|---|
| DE3115404A1 (en) * | 1981-04-16 | 1982-11-11 | Robert Bosch Gmbh, 7000 Stuttgart | METHOD AND DEVICE FOR MONITORING AND CALIBRATING LIMIT CURRENT PROBE |
| JPH0376161U (en) * | 1989-11-29 | 1991-07-30 | ||
| EP1906178A1 (en) * | 2006-09-26 | 2008-04-02 | F.Hoffmann-La Roche Ag | Method for detecting erroneous measurement results obtained with ion-selective electrodes |
| JP4918846B2 (en) * | 2006-11-22 | 2012-04-18 | 株式会社日立製作所 | Mass spectrometer and mass spectrometry method |
| GB0711780D0 (en) * | 2007-06-18 | 2007-07-25 | Oxford Biosensors Ltd | Electrochemical data rejection methodology |
| JP5297951B2 (en) * | 2009-09-04 | 2013-09-25 | 株式会社日立製作所 | Anticorrosion data analysis system |
| WO2011034169A1 (en) * | 2009-09-18 | 2011-03-24 | 日立化成工業株式会社 | Automatic analyzing device |
| JP5331669B2 (en) * | 2009-12-08 | 2013-10-30 | 株式会社日立ハイテクノロジーズ | Electrolyte analyzer |
| JP2012202948A (en) * | 2011-03-28 | 2012-10-22 | Dkk Toa Corp | Automatic measurement device |
| JP5845154B2 (en) * | 2012-08-08 | 2016-01-20 | 国立研究開発法人農業・食品産業技術総合研究機構 | Biological model generation device, biological model generation method, cytometer, and program |
| JP5965248B2 (en) * | 2012-08-22 | 2016-08-03 | 株式会社日立ハイテクノロジーズ | Electrolyte analyzer |
| JP2016114391A (en) * | 2014-12-11 | 2016-06-23 | 凸版印刷株式会社 | Electric copper plating solution analysis device and electric copper plating solution analysis method |
| JP2017536117A (en) * | 2014-11-25 | 2017-12-07 | アイトゥ バイオサイエンス インコーポレイテッドAytu BioScience,Inc. | Method for determining fertility based on redox potential of biological sample |
| JP6896684B2 (en) * | 2018-09-13 | 2021-06-30 | 株式会社日立ハイテク | Electrolyte concentration measuring device |
-
2019
- 2019-07-19 JP JP2019133863A patent/JP7267865B2/en active Active
-
2020
- 2020-04-08 CN CN202080049766.2A patent/CN114127549A/en active Pending
- 2020-04-08 US US17/627,910 patent/US20220404310A1/en active Pending
- 2020-04-08 EP EP20842677.5A patent/EP4001910A4/en active Pending
- 2020-04-08 WO PCT/JP2020/015773 patent/WO2021014695A1/en unknown
Patent Citations (4)
| Publication number | Priority date | Publication date | Assignee | Title |
|---|---|---|---|---|
| JP2006258800A (en) | 2005-02-16 | 2006-09-28 | Ngk Spark Plug Co Ltd | Method and device for diagnosing abnormality of gas concentration detecting unit |
| JP2009121817A (en) | 2007-11-09 | 2009-06-04 | Olympus Corp | Analyzer |
| JP2014514093A (en) | 2011-04-15 | 2014-06-19 | デックスコム・インコーポレーテッド | Advanced analyte sensor calibration and error detection |
| JP2017500942A (en) | 2013-12-16 | 2017-01-12 | メドトロニック・ミニメッド・インコーポレーテッド | Method and system for improving the reliability of orthogonal redundant sensors |
Non-Patent Citations (1)
| Title |
|---|
| TLV,ポータブル振動計(ハイエンド)ビブエキスパートII,カタログ,2019年06月20日,Rev. 2019/6/20,第1,3頁,[オンライン], 2019.6.20 [検索日 2020.06.18], インターネット:<URL: https://www.tlv.com/wp_tlv_handleWithCare/wp-content/themes/tlv/tlv_assets/product_v2/catalog/pdf/maintenance_apparatus_list.pdf >,第1,3頁 |
Also Published As
| Publication number | Publication date |
|---|---|
| WO2021014695A1 (en) | 2021-01-28 |
| CN114127549A (en) | 2022-03-01 |
| US20220404310A1 (en) | 2022-12-22 |
| EP4001910A4 (en) | 2023-08-02 |
| JP2021018141A (en) | 2021-02-15 |
| EP4001910A1 (en) | 2022-05-25 |
Similar Documents
| Publication | Publication Date | Title |
|---|---|---|
| JP7267865B2 (en) | Analysis device and analysis method | |
| JP5984584B2 (en) | Automatic analyzer | |
| US10352864B2 (en) | Automatic analyzer for identifying a cause of abnormalities of measurement results | |
| EP3971577A1 (en) | Automatic analysis apparatus and cleaning method for same | |
| AU2018216105B2 (en) | Quality control method, quality control system, management apparatus, analyzer, and quality control abnormality determination method | |
| EP2187219B1 (en) | Sample analysis system comprising regent preparation device and sample treating device | |
| US11782021B2 (en) | Electrolyte concentration measurement device | |
| JP7178208B2 (en) | Analysis system | |
| JP7330785B2 (en) | automatic analyzer | |
| JP2008076342A (en) | Automatic analyzer | |
| JP5492833B2 (en) | Automatic analyzer and control method thereof | |
| US11971427B2 (en) | Bubble detection in an automated analysis device | |
| WO2023218738A1 (en) | Analyzing device, and state detecting method | |
| WO2022185641A1 (en) | Electrolyte measurement device, and method for determining abnormality in electrolyte concentration measurement unit | |
| JP7299914B2 (en) | Abnormality determination method and automatic analyzer | |
| JP2012137436A (en) | Automatic analyzer | |
| WO2022270267A1 (en) | Diagnosis system, automated analysis device, and diagnostic method | |
| EP4283288A1 (en) | Electrolyte analysis device and method for identifying abnormality in same | |
| JP2016090526A (en) | Automatic analyzer | |
| JP2021067686A (en) | Techniques for checking state of analyzer |
Legal Events
| Date | Code | Title | Description |
|---|---|---|---|
| A521 | Request for written amendment filed |
Free format text: JAPANESE INTERMEDIATE CODE: A523 Effective date: 20211122 |
|
| A621 | Written request for application examination |
Free format text: JAPANESE INTERMEDIATE CODE: A621 Effective date: 20211122 |
|
| A131 | Notification of reasons for refusal |
Free format text: JAPANESE INTERMEDIATE CODE: A131 Effective date: 20230110 |
|
| A521 | Request for written amendment filed |
Free format text: JAPANESE INTERMEDIATE CODE: A523 Effective date: 20230310 |
|
| TRDD | Decision of grant or rejection written | ||
| A01 | Written decision to grant a patent or to grant a registration (utility model) |
Free format text: JAPANESE INTERMEDIATE CODE: A01 Effective date: 20230411 |
|
| A61 | First payment of annual fees (during grant procedure) |
Free format text: JAPANESE INTERMEDIATE CODE: A61 Effective date: 20230420 |
|
| R150 | Certificate of patent or registration of utility model |
Ref document number: 7267865 Country of ref document: JP Free format text: JAPANESE INTERMEDIATE CODE: R150 |