JP6987496B2 - Analyst - Google Patents
Analyst Download PDFInfo
- Publication number
- JP6987496B2 JP6987496B2 JP2016228341A JP2016228341A JP6987496B2 JP 6987496 B2 JP6987496 B2 JP 6987496B2 JP 2016228341 A JP2016228341 A JP 2016228341A JP 2016228341 A JP2016228341 A JP 2016228341A JP 6987496 B2 JP6987496 B2 JP 6987496B2
- Authority
- JP
- Japan
- Prior art keywords
- image
- calculated
- shear wave
- phase
- processing unit
- Prior art date
- Legal status (The legal status is an assumption and is not a legal conclusion. Google has not performed a legal analysis and makes no representation as to the accuracy of the status listed.)
- Active
Links
- 238000012545 processing Methods 0.000 claims description 302
- 238000006073 displacement reaction Methods 0.000 claims description 102
- 238000004458 analytical method Methods 0.000 claims description 28
- 230000001902 propagating effect Effects 0.000 claims description 17
- 230000008859 change Effects 0.000 claims description 16
- 230000033001 locomotion Effects 0.000 claims description 13
- 230000029058 respiratory gaseous exchange Effects 0.000 claims description 7
- 239000006185 dispersion Substances 0.000 claims description 4
- 230000005855 radiation Effects 0.000 claims description 4
- 230000001133 acceleration Effects 0.000 claims description 2
- 238000010009 beating Methods 0.000 claims 1
- 230000006870 function Effects 0.000 description 183
- 239000000523 sample Substances 0.000 description 128
- 230000005540 biological transmission Effects 0.000 description 52
- 238000009826 distribution Methods 0.000 description 51
- 238000010586 diagram Methods 0.000 description 38
- 238000000034 method Methods 0.000 description 25
- 238000005259 measurement Methods 0.000 description 14
- 230000008569 process Effects 0.000 description 13
- 238000006243 chemical reaction Methods 0.000 description 10
- 238000003384 imaging method Methods 0.000 description 8
- 238000001228 spectrum Methods 0.000 description 8
- 230000010349 pulsation Effects 0.000 description 6
- 238000002099 shear wave elastography Methods 0.000 description 6
- 238000001514 detection method Methods 0.000 description 4
- 238000002091 elastography Methods 0.000 description 3
- 238000003672 processing method Methods 0.000 description 3
- 230000017531 blood circulation Effects 0.000 description 2
- 230000007423 decrease Effects 0.000 description 2
- 230000000694 effects Effects 0.000 description 2
- 238000011156 evaluation Methods 0.000 description 2
- 230000010354 integration Effects 0.000 description 2
- 238000002595 magnetic resonance imaging Methods 0.000 description 2
- 230000003321 amplification Effects 0.000 description 1
- 238000013459 approach Methods 0.000 description 1
- 230000002238 attenuated effect Effects 0.000 description 1
- 230000015572 biosynthetic process Effects 0.000 description 1
- 239000003086 colorant Substances 0.000 description 1
- 239000002872 contrast media Substances 0.000 description 1
- 238000012937 correction Methods 0.000 description 1
- 238000013016 damping Methods 0.000 description 1
- 230000001419 dependent effect Effects 0.000 description 1
- 238000003745 diagnosis Methods 0.000 description 1
- 238000002059 diagnostic imaging Methods 0.000 description 1
- 238000009499 grossing Methods 0.000 description 1
- 239000000463 material Substances 0.000 description 1
- 230000007246 mechanism Effects 0.000 description 1
- 238000003199 nucleic acid amplification method Methods 0.000 description 1
- 230000001172 regenerating effect Effects 0.000 description 1
- 238000009877 rendering Methods 0.000 description 1
- 230000004044 response Effects 0.000 description 1
- 230000003595 spectral effect Effects 0.000 description 1
- 238000012546 transfer Methods 0.000 description 1
Images


Classifications
-
- A—HUMAN NECESSITIES
- A61—MEDICAL OR VETERINARY SCIENCE; HYGIENE
- A61B—DIAGNOSIS; SURGERY; IDENTIFICATION
- A61B8/00—Diagnosis using ultrasonic, sonic or infrasonic waves
- A61B8/48—Diagnostic techniques
- A61B8/485—Diagnostic techniques involving measuring strain or elastic properties
-
- A—HUMAN NECESSITIES
- A61—MEDICAL OR VETERINARY SCIENCE; HYGIENE
- A61B—DIAGNOSIS; SURGERY; IDENTIFICATION
- A61B8/00—Diagnosis using ultrasonic, sonic or infrasonic waves
- A61B8/08—Detecting organic movements or changes, e.g. tumours, cysts, swellings
-
- A—HUMAN NECESSITIES
- A61—MEDICAL OR VETERINARY SCIENCE; HYGIENE
- A61B—DIAGNOSIS; SURGERY; IDENTIFICATION
- A61B8/00—Diagnosis using ultrasonic, sonic or infrasonic waves
- A61B8/44—Constructional features of the ultrasonic, sonic or infrasonic diagnostic device
- A61B8/4411—Device being modular
-
- A—HUMAN NECESSITIES
- A61—MEDICAL OR VETERINARY SCIENCE; HYGIENE
- A61B—DIAGNOSIS; SURGERY; IDENTIFICATION
- A61B8/00—Diagnosis using ultrasonic, sonic or infrasonic waves
- A61B8/46—Ultrasonic, sonic or infrasonic diagnostic devices with special arrangements for interfacing with the operator or the patient
- A61B8/461—Displaying means of special interest
- A61B8/463—Displaying means of special interest characterised by displaying multiple images or images and diagnostic data on one display
-
- A—HUMAN NECESSITIES
- A61—MEDICAL OR VETERINARY SCIENCE; HYGIENE
- A61B—DIAGNOSIS; SURGERY; IDENTIFICATION
- A61B8/00—Diagnosis using ultrasonic, sonic or infrasonic waves
- A61B8/52—Devices using data or image processing specially adapted for diagnosis using ultrasonic, sonic or infrasonic waves
- A61B8/5207—Devices using data or image processing specially adapted for diagnosis using ultrasonic, sonic or infrasonic waves involving processing of raw data to produce diagnostic data, e.g. for generating an image
-
- A—HUMAN NECESSITIES
- A61—MEDICAL OR VETERINARY SCIENCE; HYGIENE
- A61B—DIAGNOSIS; SURGERY; IDENTIFICATION
- A61B8/00—Diagnosis using ultrasonic, sonic or infrasonic waves
- A61B8/52—Devices using data or image processing specially adapted for diagnosis using ultrasonic, sonic or infrasonic waves
- A61B8/5215—Devices using data or image processing specially adapted for diagnosis using ultrasonic, sonic or infrasonic waves involving processing of medical diagnostic data
- A61B8/5223—Devices using data or image processing specially adapted for diagnosis using ultrasonic, sonic or infrasonic waves involving processing of medical diagnostic data for extracting a diagnostic or physiological parameter from medical diagnostic data
-
- G—PHYSICS
- G01—MEASURING; TESTING
- G01S—RADIO DIRECTION-FINDING; RADIO NAVIGATION; DETERMINING DISTANCE OR VELOCITY BY USE OF RADIO WAVES; LOCATING OR PRESENCE-DETECTING BY USE OF THE REFLECTION OR RERADIATION OF RADIO WAVES; ANALOGOUS ARRANGEMENTS USING OTHER WAVES
- G01S7/00—Details of systems according to groups G01S13/00, G01S15/00, G01S17/00
- G01S7/52—Details of systems according to groups G01S13/00, G01S15/00, G01S17/00 of systems according to group G01S15/00
- G01S7/52017—Details of systems according to groups G01S13/00, G01S15/00, G01S17/00 of systems according to group G01S15/00 particularly adapted to short-range imaging
- G01S7/52023—Details of receivers
- G01S7/52036—Details of receivers using analysis of echo signal for target characterisation
- G01S7/52042—Details of receivers using analysis of echo signal for target characterisation determining elastic properties of the propagation medium or of the reflective target
-
- G—PHYSICS
- G01—MEASURING; TESTING
- G01S—RADIO DIRECTION-FINDING; RADIO NAVIGATION; DETERMINING DISTANCE OR VELOCITY BY USE OF RADIO WAVES; LOCATING OR PRESENCE-DETECTING BY USE OF THE REFLECTION OR RERADIATION OF RADIO WAVES; ANALOGOUS ARRANGEMENTS USING OTHER WAVES
- G01S7/00—Details of systems according to groups G01S13/00, G01S15/00, G01S17/00
- G01S7/52—Details of systems according to groups G01S13/00, G01S15/00, G01S17/00 of systems according to group G01S15/00
- G01S7/52017—Details of systems according to groups G01S13/00, G01S15/00, G01S17/00 of systems according to group G01S15/00 particularly adapted to short-range imaging
- G01S7/52053—Display arrangements
- G01S7/52057—Cathode ray tube displays
- G01S7/52074—Composite displays, e.g. split-screen displays; Combination of multiple images or of images and alphanumeric tabular information
-
- A—HUMAN NECESSITIES
- A61—MEDICAL OR VETERINARY SCIENCE; HYGIENE
- A61B—DIAGNOSIS; SURGERY; IDENTIFICATION
- A61B8/00—Diagnosis using ultrasonic, sonic or infrasonic waves
- A61B8/46—Ultrasonic, sonic or infrasonic diagnostic devices with special arrangements for interfacing with the operator or the patient
- A61B8/467—Ultrasonic, sonic or infrasonic diagnostic devices with special arrangements for interfacing with the operator or the patient characterised by special input means
- A61B8/469—Ultrasonic, sonic or infrasonic diagnostic devices with special arrangements for interfacing with the operator or the patient characterised by special input means for selection of a region of interest
Landscapes
- Health & Medical Sciences (AREA)
- Life Sciences & Earth Sciences (AREA)
- Engineering & Computer Science (AREA)
- Physics & Mathematics (AREA)
- Surgery (AREA)
- Animal Behavior & Ethology (AREA)
- Radiology & Medical Imaging (AREA)
- Nuclear Medicine, Radiotherapy & Molecular Imaging (AREA)
- Biomedical Technology (AREA)
- Heart & Thoracic Surgery (AREA)
- Medical Informatics (AREA)
- Molecular Biology (AREA)
- Biophysics (AREA)
- Pathology (AREA)
- General Health & Medical Sciences (AREA)
- Public Health (AREA)
- Veterinary Medicine (AREA)
- Computer Vision & Pattern Recognition (AREA)
- Computer Networks & Wireless Communication (AREA)
- General Physics & Mathematics (AREA)
- Radar, Positioning & Navigation (AREA)
- Remote Sensing (AREA)
- Physiology (AREA)
- Ultra Sonic Daignosis Equipment (AREA)
Description
本発明の実施形態は、解析装置に関する。 Embodiments of the present invention relate to an analyzer.
生体組織は粘性と弾性とを有する粘弾性体であると言われており、近年、この粘弾性を評価するために、種々の方法が提案されている。例えば、生体組織の硬さ(弾性)を測定し、測定した硬さの分布を映像化するエラストグラフィー(Elastography)が知られている。例えば、生体組織に対して音響放射力を与えてせん断波(Shear Wave)に基づく変位を発生させ、発生した変位を経時的に観測することでせん断波の伝播速度を算出し、算出した伝播速度から弾性率を求めるSWE(Shear Wave Elastography)がある。 Living tissue is said to be a viscoelastic body having viscosity and elasticity, and in recent years, various methods have been proposed for evaluating this viscoelasticity. For example, elastography is known in which the hardness (elasticity) of a living tissue is measured and the distribution of the measured hardness is visualized. For example, the propagation velocity of a shear wave is calculated by applying acoustic radiation force to a living tissue to generate a displacement based on the shear wave and observing the generated displacement over time, and the calculated propagation velocity. There is SWE (Shear Wave Elastography) that obtains the elastic modulus from.
また、例えば、粘弾性を評価するために、生体をモデルに近似することで粘性の指標となる値を算出することが行われている。ここで、モデルとは、例えば、粘性と弾性の現象を数式化した近似式であり、Maxwellモデル、Voigtモデル、三要素モデル、多次元Maxwellモデル等が知られている。しかしながら、評価に用いたモデルの違いによって、粘弾性を示す値が異なってしまうことが報告されている。 Further, for example, in order to evaluate viscoelasticity, a value that is an index of viscosity is calculated by approximating a living body to a model. Here, the model is, for example, an approximate expression in which the phenomena of viscosity and elasticity are mathematically expressed, and a Maxwell model, a Voice model, a three-element model, a multidimensional Maxwell model, and the like are known. However, it has been reported that the values indicating viscoelasticity differ depending on the model used for the evaluation.
本発明が解決しようとする課題は、生体組織の粘性を評価することができる解析装置を提供することである。 An object to be solved by the present invention is to provide an analysis device capable of evaluating the viscosity of a living tissue.
実施形態の解析装置は、処理部を備える。処理部は、物体内を伝播するせん断波を検出する。処理部は、検出した前記せん断波を解析することにより、粘弾性に関する物理モデルに依存せず、前記物体内の粘性を表す指標値を算出する。 The analysis device of the embodiment includes a processing unit . The processing unit detects shear waves propagating in the object. By analyzing the detected shear wave, the processing unit calculates an index value representing the viscosity in the object without depending on the physical model of viscoelasticity.
以下、図面を参照して、実施形態に係る解析装置を説明する。以下では、解析装置の一例として、超音波診断装置について説明する。 Hereinafter, the analysis apparatus according to the embodiment will be described with reference to the drawings. Hereinafter, the ultrasonic diagnostic apparatus will be described as an example of the analysis apparatus.
(第1の実施形態)
図1は、第1の実施形態に係る超音波診断装置の構成例を示すブロック図である。図1に示すように、第1の実施形態に係る超音波診断装置は、超音波プローブ101と、入力装置102と、ディスプレイ103と、装置本体100とを備える。超音波プローブ101、入力装置102、及びディスプレイ103は、装置本体100と通信可能に接続される。なお、被検体Pは、超音波診断装置の構成に含まれない。
(First Embodiment)
FIG. 1 is a block diagram showing a configuration example of the ultrasonic diagnostic apparatus according to the first embodiment. As shown in FIG. 1, the ultrasonic diagnostic apparatus according to the first embodiment includes an
超音波プローブ101は、複数の振動子(例えば、圧電振動子)を有し、これら複数の振動子は、後述する装置本体100が有する送信回路110から供給される駆動信号に基づき超音波を発生する。また、超音波プローブ101が有する複数の振動子は、被検体Pからの反射波を受信して電気信号に変換する。また、超音波プローブ101は、振動子に設けられる整合層と、振動子から後方への超音波の伝播を防止するバッキング材等を有する。なお、超音波プローブ101は、装置本体100と着脱自在に接続される。
The
超音波プローブ101から被検体Pに超音波が送信されると、送信された超音波は、被検体Pの体内組織における音響インピーダンスの不連続面で次々と反射され、反射波信号として超音波プローブ101が有する複数の振動子にて受信される。受信される反射波信号の振幅は、超音波が反射される不連続面における音響インピーダンスの差に依存する。なお、送信された超音波パルスが、移動している血流や心臓壁等の表面で反射された場合の反射波信号は、ドプラ効果により、移動体の超音波送信方向に対する速度成分に依存して、周波数偏移を受ける。
When ultrasonic waves are transmitted from the
なお、第1の実施形態は、図1に示す超音波プローブ101が、複数の圧電振動子が一列で配置された1次元超音波プローブである場合や、一列に配置された複数の圧電振動子が機械的に揺動される1次元超音波プローブである場合、複数の圧電振動子が格子状に2次元で配置された2次元超音波プローブである場合のいずれであっても適用可能である。
In the first embodiment, the
入力装置102は、マウス、キーボード、ボタン、パネルスイッチ、タッチコマンドスクリーン、フットスイッチ、トラックボール、ジョイスティック等を有し、超音波診断装置の操作者からの各種設定要求を受け付け、装置本体100に対して受け付けた各種設定要求を転送する。
The input device 102 has a mouse, keyboard, button, panel switch, touch command screen, foot switch, trackball, joystick, etc., and receives various setting requests from the operator of the ultrasonic diagnostic device, and receives various setting requests from the device
ディスプレイ103は、超音波診断装置の操作者が入力装置102を用いて各種設定要求を入力するためのGUI(Graphical User Interface)を表示したり、装置本体100において生成された超音波画像データ等を表示したりする。
The
装置本体100は、超音波プローブ101が受信した反射波信号に基づいて超音波画像データを生成する装置であり、図1に示すように、送信回路110と、受信回路120と、処理回路130と、画像メモリ140と、記憶回路150とを有する。送信回路110、受信回路120、処理回路130、画像メモリ140、及び記憶回路150は、互いに通信可能に接続される。
The device
送信回路110は、超音波送信における送信指向性を制御する。具体的には、送信回路110は、レートパルサ発生器、送信遅延部、送信パルサ等を有し、超音波プローブ101に駆動信号を供給する。レートパルサ発生器は、所定のレート周波数(PRF:Pulse Repetition Frequency)で、送信超音波を形成するためのレートパルスを繰り返し発生する。レートパルスは、送信遅延部を通ることで異なる送信遅延時間を有した状態で送信パルサへ電圧を印加する。すなわち、送信遅延部は、超音波プローブ101から発生される超音波をビーム状に集束して送信指向性を決定するために必要な振動子ごとの送信遅延時間を、レートパルサ発生器が発生する各レートパルスに対し与える。送信パルサは、かかるレートパルスに基づくタイミングで、超音波プローブ101に駆動信号(駆動パルス)を印加する。送信方向或いは送信遅延時間は、後述する記憶回路150に記憶されており、送信回路110は、記憶回路150を参照して、送信指向性を制御する。
The
駆動パルスは、送信パルサからケーブルを介して超音波プローブ101内の振動子まで伝達した後に、振動子において電気信号から機械的振動に変換される。この機械的振動は、生体内部で超音波として送信される。振動子ごとに異なる送信遅延時間を持った超音波は、収束されて、所定方向に伝播していく。送信遅延部は、各レートパルスに対し与える送信遅延時間を変化させることで、振動子面からの送信方向を任意に調整する。送信回路110は、超音波ビームの送信に用いる振動子の数及び位置(送信開口)と、送信開口を構成する各振動子の位置に応じた送信遅延間とを制御することで、送信指向性を与える。例えば、送信回路110の送信遅延回路は、送信遅延時間をパルサ回路が発生する各レートパルスに対し与えることで、超音波送信の深さ方向における集束点(送信フォーカス)の位置を制御する。
The drive pulse is transmitted from the transmission pulser to the vibrator in the
なお、送信回路110は、後述する処理回路130の指示に基づいて、所定のスキャンシーケンスを実行するために、送信周波数、送信駆動電圧等を瞬時に変更可能な機能を有している。特に、送信駆動電圧の変更は、瞬間にその値を切り替え可能なリニアアンプ型の発信回路、または、複数の電源ユニットを電気的に切り替える機構によって実現される。
The
超音波プローブ101が送信した超音波の反射波は、超音波プローブ101内部の振動子まで到達した後、振動子において、機械的振動から電気的信号(反射波信号)に変換され、受信回路120に入力される。
The reflected ultrasonic wave transmitted by the
受信回路120は、超音波受信における受信指向性を制御する。具体的には、受信回路120は、プリアンプ、A/D変換部、受信遅延部及び加算部等を有し、超音波プローブ101が受信した反射波信号に対して各種処理を行なって反射波データを生成する。プリアンプは、反射波信号をチャンネルごとに増幅してゲイン補正処理を行なう。A/D変換部は、ゲイン補正された反射波信号をA/D変換し、受信遅延部は、受信指向性を決定するのに必要な受信遅延時間をチャンネルごとに与える。加算部は、受信遅延時間が与えられた反射波信号(デジタル信号)を加算して、反射波データを生成する。加算器の加算処理により、反射波信号の受信指向性に応じた方向からの反射成分が強調される。受信方向或いは受信遅延時間は、後述する記憶回路150に記憶されており、受信回路120は、記憶回路150を参照して、受信指向性を制御する。なお、第1の実施形態に係る受信回路120は、並列同時受信を行なうことも可能である。
The reception circuit 120 controls the reception directivity in ultrasonic reception. Specifically, the reception circuit 120 has a preamplifier, an A / D conversion unit, a reception delay unit, an addition unit, and the like, and performs various processing on the reflected wave signal received by the
処理回路130は、超音波診断装置の処理全体を制御する。具体的には、処理回路130は、入力装置102を介して操作者から入力された各種設定要求や、記憶回路150から読込んだ各種制御プログラム及び各種データに基づき、送信回路110及び受信回路120の処理を制御する。なお、処理回路130は、処理部の一例である。
The
また、処理回路130は、信号処理機能131と、画像処理機能132と、出力制御機能133とを実行する。ここで、処理回路130の構成要素である信号処理機能131、画像処理機能132及び出力制御機能133が実行する各処理機能は、例えば、コンピュータによって実行可能なプログラムの形態で記憶回路150に記録されている。処理回路130は、各プログラムを記憶回路150から読み出し、実行することで各プログラムに対応する機能を実現するプロセッサである。すなわち、信号処理機能131は、処理回路130が信号処理機能131に対応するプログラムを記憶回路150から読み出し実行することで、実現される機能である。また、画像処理機能132は、処理回路130が画像処理機能132に対応するプログラムを記憶回路150から読み出し実行することで、実現される機能である。また、出力制御機能133は、処理回路130が出力制御機能133に対応するプログラムを記憶回路150から読み出し実行することで、実現される機能である。換言すると、各プログラムを読み出した状態の処理回路130は、図1の処理回路130内に示された各機能を有することとなる。
Further, the
信号処理機能131は、受信回路120が反射波信号から生成した反射波データに対して各種の信号処理を行う。信号処理機能131は、受信回路120から受信した反射波データに対して、対数増幅、包絡線検波処理等を行って、サンプル点ごとの信号強度が輝度の明るさで表現されるデータ(Bモードデータ)を生成する。 The signal processing function 131 performs various signal processing on the reflected wave data generated from the reflected wave signal by the receiving circuit 120. The signal processing function 131 performs logarithmic amplification, envelope detection processing, etc. on the reflected wave data received from the reception circuit 120, and the signal strength for each sample point is expressed by the brightness of the brightness (B mode). Data) is generated.
また、信号処理機能131は、受信回路120から受信した反射波データより、移動体のドプラ効果に基づく運動情報を、走査領域内の各サンプル点で抽出したデータ(ドプラデータ)を生成する。具体的には、信号処理機能131は、移動体の運動情報として、平均速度、分散値、パワー値等を各サンプル点で抽出したドプラデータを生成する。ここで、移動体とは、例えば、血流や、心壁等の組織、造影剤である。 Further, the signal processing function 131 generates data (Doppler data) obtained by extracting motion information based on the Doppler effect of the moving body at each sample point in the scanning region from the reflected wave data received from the receiving circuit 120. Specifically, the signal processing function 131 generates Doppler data obtained by extracting the average velocity, the dispersion value, the power value, and the like at each sample point as the motion information of the moving body. Here, the moving body is, for example, a blood flow, a tissue such as a heart wall, or a contrast medium.
画像処理機能132は、信号処理機能131が生成したデータから超音波画像データを生成する。画像処理機能132は、信号処理機能131が生成したBモードデータから反射波の強度を輝度で表したBモード画像データを生成する。また、画像処理機能132は、信号処理機能131が生成したドプラデータから移動体情報を表すドプラ画像データを生成する。ドプラ画像データは、速度画像データ、分散画像データ、パワー画像データ、又は、これらを組み合わせた画像データである。
The
ここで、画像処理機能132は、一般的には、超音波走査の走査線信号列を、テレビ等に代表されるビデオフォーマットの走査線信号列に変換(スキャンコンバート)し、表示用の超音波画像データを生成する。具体的には、画像処理機能132は、超音波プローブ101による超音波の走査形態に応じて座標変換を行うことで、表示用の超音波画像データを生成する。また、画像処理機能132は、スキャンコンバート以外に種々の画像処理として、例えば、スキャンコンバート後の複数の画像フレームを用いて、輝度の平均値画像を再生成する画像処理(平滑化処理)や、画像内で微分フィルタを用いる画像処理(エッジ強調処理)等を行う。また、画像処理機能132は、超音波画像データに、付帯情報(種々のパラメータの文字情報、目盛り、ボディーマーク等)を合成する。
Here, the
すなわち、Bモードデータ、ドプラデータ及び硬さ分布情報は、スキャンコンバート処理前の超音波画像データであり、画像処理機能132が生成するデータは、スキャンコンバート処理後の表示用の超音波画像データである。なお、画像処理機能132は、信号処理機能131が3次元のデータ(3次元Bモードデータ、3次元ドプラデータ及び3次元硬さ分布情報)を生成した場合、超音波プローブ101による超音波の走査形態に応じて座標変換を行うことで、ボリュームデータを生成する。そして、画像処理機能132は、ボリュームデータに対して、各種レンダリング処理を行なって、表示用の2次元画像データを生成する。
That is, the B mode data, Doppler data, and hardness distribution information are ultrasonic image data before scan conversion processing, and the data generated by the
出力制御機能133は、処理回路130により生成された情報の出力制御を行う。例えば、出力制御機能133は、画像メモリ140が記憶する表示用の超音波画像データをディスプレイ103にて表示するように制御する。また、例えば、出力制御機能133は、操作者からの指示に応じて、超音波画像データをワークステーション等の装置に送信する。
The
画像メモリ140は、画像処理機能132が生成した表示用の画像データを記憶するメモリである。また、画像メモリ140は、信号処理機能131が生成したデータを記憶することも可能である。画像メモリ140が記憶するBモードデータやドプラデータ、硬さ分布情報は、例えば、診断の後に操作者が呼び出すことが可能となっており、画像処理機能132を経由して表示用の超音波画像データとなる。
The
記憶回路150は、超音波送受信、画像処理及び表示処理を行うための制御プログラムや、診断情報(例えば、患者ID、医師の所見等)や、診断プロトコルや各種ボディーマーク等の各種データを記憶する。また、記憶回路150は、必要に応じて、画像メモリ140が記憶する画像データの保管等にも使用される。また、記憶回路150が記憶するデータは、図示しないインタフェース部を介して、外部装置へ転送することができる。
The
なお、本実施形態においては、単一の処理回路130にて、上述した各処理機能が実現されるものとして説明するが、複数の独立したプロセッサを組み合わせて処理回路を構成し、各プロセッサがプログラムを実行することにより機能を実現するものとしても構わない。例えば、装置本体100は、処理回路130とは別に、信号処理機能131を実行するプロセッサや画像処理機能132を実行するプロセッサを備えていてもよい。
In the present embodiment, it is assumed that each of the above-mentioned processing functions is realized by a
上記説明において用いた「プロセッサ」という文言は、例えば、CPU(Central Processing Unit)、GPU(Graphics Processing Unit)、或いは、特定用途向け集積回路(Application Specific Integrated Circuit:ASIC)、プログラマブル論理デバイス(例えば、単純プログラマブル論理デバイス(Simple Programmable Logic Device:SPLD)、複合プログラマブル論理デバイス(Complex Programmable Logic Device:CPLD)、及びフィールドプログラマブルゲートアレイ(Field Programmable Gate Array:FPGA))等の回路を意味する。プロセッサは記憶回路150に保存されたプログラムを読み出し実行することで機能を実現する。なお、記憶回路150にプログラムを保存する代わりに、プロセッサの回路内にプログラムを直接組み込むよう構成しても構わない。この場合、プロセッサは回路内に組み込まれたプログラムを読み出し実行することで機能を実現する。なお、本実施形態の各プロセッサは、プロセッサごとに単一の回路として構成される場合に限らず、複数の独立した回路を組み合わせて1つのプロセッサとして構成し、その機能を実現するようにしてもよい。更に、各図における複数の構成要素を1つのプロセッサへ統合してその機能を実現するようにしてもよい。
The word "processor" used in the above description is, for example, a CPU (Central Processing Unit), a GPU (Graphics Processing Unit), an integrated circuit for a specific application (ASIC), or a programmable logic device (for example, a programmable logic device). It means a circuit such as a simple programmable logic device (SPLD), a complex programmable logic device (CPLD), and a field programmable gate array (FPGA). The processor realizes the function by reading and executing the program stored in the
ところで、従来の超音波診断装置において、生体組織の粘弾性の評価方法の一つとして、生体組織の硬さ(弾性)の分布を映像化するエラストグラフィー(Elastography)が行われている。例えば、生体組織に対して音響放射力(プッシュパルス)を与えてせん断波(Shear Wave)に基づく変位を発生させ、発生した変位を経時的に観測することでせん断波の伝播速度を算出し、算出した伝播速度から弾性率を求めるSWE(Shear Wave Elastography)が知られている。SWEで測定された硬さの値は、弾性の定量的な指標として、例えば、医用画像診断において利用されている。 By the way, in the conventional ultrasonic diagnostic apparatus, as one of the methods for evaluating the viscoelasticity of a living tissue, elastography for visualizing the distribution of the hardness (elasticity) of the living tissue is performed. For example, an acoustic radiation force (push pulse) is applied to a living tissue to generate a displacement based on a shear wave, and the generated displacement is observed over time to calculate the propagation velocity of the shear wave. SWE (Shear Wave Elastography), in which the elastic coefficient is obtained from the calculated propagation velocity, is known. The hardness value measured by SWE is used as a quantitative index of elasticity, for example, in medical imaging.
ここで、生体組織は粘性と弾性とを有する粘弾性体であると言われている。このため、SWEによる弾性の評価のみならず、粘性も評価することで、生体組織の粘弾性特性を正確に捉えることができると考えられる。 Here, the living tissue is said to be a viscoelastic body having viscosity and elasticity. Therefore, it is considered that the viscoelastic property of the living tissue can be accurately grasped by evaluating not only the elasticity by SWE but also the viscosity.
しかしながら、従来の粘性評価では、生体をモデルに近似する手法が一般的である。モデルによって算出される粘性の指標値にはモデル依存性があり、例えば、ファントムでは上手く測定できたとしても、必ずしも生体で上手く測定できるとは限らない。逆に言えば、生体で上手く測定できるモデルが、必ずしもファントムで上手く測定できるとは限らない。 However, in the conventional viscosity evaluation, a method of approximating a living body to a model is common. The index value of viscosity calculated by the model is model-dependent, and even if it can be measured well with a phantom, for example, it cannot always be measured well with a living body. Conversely, a model that can be measured well with a living body is not always able to be measured well with a phantom.
そこで、第1の実施形態に係る超音波診断装置は、生体組織の粘性を評価するために、以下の機能を実行する。例えば、超音波診断装置は、粘性体を伝播するせん断波の速度の周波数依存性を用いて、粘弾性に関する物理モデルに依存しない指標値を算出する。 Therefore, the ultrasonic diagnostic apparatus according to the first embodiment performs the following functions in order to evaluate the viscosity of the living tissue. For example, an ultrasonic diagnostic apparatus uses the frequency dependence of the velocity of a shear wave propagating in a viscoelastic body to calculate an index value independent of a physical model for viscoelasticity.
例えば、第1の実施形態に係る超音波診断装置は、生体組織に対して超音波プローブ101からプッシュパルスを送信させ、プッシュパルスで生じるせん断波により変位を観測することで、生体組織の横波速度の周波数依存性に関する指標値を算出する。
For example, the ultrasonic diagnostic apparatus according to the first embodiment causes a living tissue to transmit a push pulse from the
例えば、第1の実施形態に係る送信回路110は、音響放射力で生じるせん断波により変位を発生させるプッシュパルス(変位発生用超音波)を超音波プローブ101から被検体Pに対して送信させる。そして、第1の実施形態に係る送信回路110は、プッシュパルスにより発生する変位を観測するトラッキングパルス(観測用超音波)を、走査領域内の複数の走査線それぞれで超音波プローブ101から複数回送信させる。トラッキングパルスは、プッシュパルスにより発生したせん断波を、走査領域内の各サンプル点で観測するために送信される。
For example, the
図2は、第1の実施形態に係る超音波診断装置におけるせん断波の観測について説明するための図である。図2には、超音波プローブ101から送信されるプッシュパルス10及びトラッキングパルス11を模式的に示す。なお、図2において、矢印tは、時間方向に対応する。
FIG. 2 is a diagram for explaining observation of shear waves in the ultrasonic diagnostic apparatus according to the first embodiment. FIG. 2 schematically shows a
図2に示すように、プッシュパルス10が送信されると、プッシュパルス10の送信位置から変位が発生する。ここで、発生した変位は、例えば、送信位置から図中の右方向へせん断波12(横波)として伝播し、走査線A,B,C,D,E,Fの順に伝わる。このせん断波12は、各走査線(ビーム)A〜Fに対してそれぞれ複数回送信されるトラッキングパルス11によって観測される。図2に示す例では、トラッキングパルス11は、各走査線A〜Fに対してそれぞれ4回ずつ送信される。なお、図2では、各走査線A〜Fに送信されるトラッキングパルス11を、線種の違いによって例示している。
As shown in FIG. 2, when the
信号処理機能131は、物体内を伝播するせん断波12を、せん断波12の伝播方向に沿った複数の位置それぞれについて検出する。例えば、信号処理機能131は、各走査線A〜Fで複数回送信されたトラッキングパルス11の反射波データに対して自己相関演算を施して、各サンプル点における変位を推定する。
The signal processing function 131 detects the
ここで、推定された変位は、せん断波12による変位のみならず、呼吸や拍動、体動等によって生じた変位を含む可能性がある。このため、信号処理機能131は、WF(Wall Filter)やDirection Filterによるフィルタ処理を行うことで、せん断波12の伝播方向に沿った各サンプル点における変位を推定する。これにより、信号処理機能131は、例えば、推定された変位から呼吸や拍動、体動等による変位の成分を除外して、せん断波による変位を推定する。なお、WFとは、呼吸や拍動、体動等の所定の周波数をカットするフィルタである。また、Direction Filterとは、せん断波12が水平方向に伝播すると仮定して変位を選択するフィルタである。
Here, the estimated displacement may include not only the displacement due to the
このように、信号処理機能131は、各サンプル点における変位の時間変化を、物体内を伝播するせん断波12として検出する。なお、WFやDirection Filterによるフィルタ処理は、フィルタ特性によりその後の処理で求められる位相特性に影響を与えてしまうため、必ずしも実行されなくてもよい。
As described above, the signal processing function 131 detects the time change of the displacement at each sample point as the
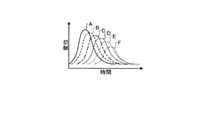
図3は、第1の実施形態に係る超音波診断装置におけるせん断波の検出について説明するための図である。図3には、トラッキングパルス11により各サンプル点で観測された変位の時間変化を表すグラフ(時間変位曲線)を例示する。なお、図3の線種の違いは、各走査線A〜F上の各サンプル点における時間変位曲線に対応する。
FIG. 3 is a diagram for explaining the detection of shear waves in the ultrasonic diagnostic apparatus according to the first embodiment. FIG. 3 illustrates a graph (time displacement curve) showing the time change of the displacement observed at each sample point by the tracking
図3に示すように、信号処理機能131は、各走査線A〜F上の各サンプル点について、それぞれの時間における変位を推定する。ここで、各サンプル点で検出される時間変位曲線は、プッシュパルス10の送信位置に最も近い走査線Aで最大変位となり、走査線B,C,D,E,F・・・と離れるほど小さな曲線となる。このように、信号処理機能131は、物体内を伝播するせん断波12を、各サンプル点における変位の時間変化として検出する。
As shown in FIG. 3, the signal processing function 131 estimates the displacement at each time for each sample point on each of the scan lines A to F. Here, the time displacement curve detected at each sample point becomes the maximum displacement at the scanning line A closest to the transmission position of the
信号処理機能131は、検出したせん断波12に含まれる複数の周波数成分それぞれの位相を算出する。例えば、信号処理機能131は、複数の位置それぞれについて検出したせん断波12に対する周波数解析により、位相を算出する。具体的には、信号処理機能131は、図3で得られた時間変位曲線に対してフーリエ変換を行うことで、各サンプル点について周波数ごとの位相を算出する。
The signal processing function 131 calculates the phase of each of the plurality of frequency components included in the detected
また、各サンプル点で得られる時間変位曲線は、せん断波12の伝播方向の順に検出される。例えば、各時間変位曲線のピーク位置は、伝播方向の順に異なる時間に検出される。このため、信号処理機能131は、せん断波12の伝播時間から各時間変位曲線の時間のずれ(違い)を算出する。この伝播時間は、例えば、各サンプル点の時間変位曲線の相互相関によって求めてもよいし、時間変位曲線のピーク検出によって求めてもよい。そして、信号処理機能131は、算出したずれに応じて解析範囲をずらした上で窓関数処理を行う。すなわち、信号処理機能131は、周波数解析の前に、複数の位置それぞれについて検出したせん断波に対して、それぞれの位置で検出されるせん断波の伝播時間の違いを補正した窓関数処理を行う。
Further, the time displacement curve obtained at each sample point is detected in the order of the propagation direction of the
そして、信号処理機能131は、窓関数処理後の各サンプル点の時間変位曲線に対してフーリエ変換を行って、位相を算出する。なお、上記の窓関数処理もWFやDirection Filter同様、窓関数によるフィルタ特性によって、その後の処理で求められる位相特性に影響を与えてしまうため、必ずしも実行されなくてもよい。 Then, the signal processing function 131 performs a Fourier transform on the time displacement curve of each sample point after the window function processing, and calculates the phase. As with the WF and Direction Filter, the above window function processing does not necessarily have to be executed because the filter characteristics of the window function affect the phase characteristics obtained in the subsequent processing.
また、上記の例では、変位を用いてフーリエ変換を行う場合を説明したが、実施形態はこれに限定されるものではない。例えば、信号処理機能131は、複数の位置における物体内の動きを算出することにより、せん断波を検出してもよい。例えば、信号処理機能131は、物体内の動きとして、複数の位置における変位、速度、又は加速度を算出してもよい。この場合、例えば、信号処理機能131は、反射波データに対して自己相関演算を施して、積分処理前の情報を瞬時速度として取得する。そして、信号処理機能131は、この瞬時速度に対してフーリエ変換を行って、この周波数依存性を評価してもよい。 Further, in the above example, the case where the Fourier transform is performed using the displacement has been described, but the embodiment is not limited to this. For example, the signal processing function 131 may detect a shear wave by calculating the movement in the object at a plurality of positions. For example, the signal processing function 131 may calculate displacement, velocity, or acceleration at a plurality of positions as movement in an object. In this case, for example, the signal processing function 131 performs an autocorrelation calculation on the reflected wave data and acquires the information before the integration processing as the instantaneous speed. Then, the signal processing function 131 may perform a Fourier transform on this instantaneous speed to evaluate this frequency dependence.
信号処理機能131は、各位置について算出した位相を用いて、周波数成分毎に、位相速度を算出する。例えば、信号処理機能131は、各サンプル点について算出した位相を用いて、位相差を算出する。そして、信号処理機能131は、下記の式(1)を用いて、位相速度Cphaseを算出する。なお、式(1)において、ΔΦは、位相差を示し、fは、周波数を示し、Lは、サンプル点の距離を示す。 The signal processing function 131 calculates the phase velocity for each frequency component using the phase calculated for each position. For example, the signal processing function 131 calculates the phase difference using the phase calculated for each sample point. Then, the signal processing function 131 calculates the phase velocity C phase using the following equation (1). In the equation (1), ΔΦ indicates a phase difference, f indicates a frequency, and L indicates a distance between sample points.

例えば、信号処理機能131は、3以上の位置それぞれについて算出した位相を用いて、位相速度を算出する。例えば、信号処理機能131は、3つの連続するサンプル点の位相を用いて、その中央に位置するサンプル点の位相速度を算出する。 For example, the signal processing function 131 calculates the phase velocity using the phase calculated for each of the three or more positions. For example, the signal processing function 131 uses the phases of three consecutive sample points to calculate the phase velocity of the sample points located at the center thereof.
図4は、第1の実施形態に係る超音波診断装置における位相速度の算出について説明するための図である。図4には、ある周波数で得られた位相を走査線A〜Fごとにプロットしたグラフを例示する。つまり、図4において、横軸は、走査線に対応し、縦軸は、位相に対応する。 FIG. 4 is a diagram for explaining the calculation of the phase velocity in the ultrasonic diagnostic apparatus according to the first embodiment. FIG. 4 illustrates a graph in which the phase obtained at a certain frequency is plotted for each of scanning lines A to F. That is, in FIG. 4, the horizontal axis corresponds to the scanning line and the vertical axis corresponds to the phase.
図4に示すように、例えば、信号処理機能131は、走査線A,B,Cのサンプル点の位相を用いて、走査線Bのサンプル点における位相速度を算出する。この場合、式(1)における位相差ΔΦは、走査線A,B,Cのうち隣り合うサンプル点間の位相の差の平均から求めてもよいし、走査線A,B,Cのサンプル点の位相の最小二乗法によって傾きから求めてもよい。また、距離Lは、走査線Aのサンプル点と走査線Cのサンプル点との間の距離から求める。また、周波数fは、任意の周波数が複数選択される。例えば、周波数fは、呼吸や拍動、体動等と比較してせん断波12の方が支配的な周波数が選択される。そして、信号処理機能131は、求めた位相差ΔΦ、距離L、周波数fを用いて、上記の式(1)から位相速度Cphaseを算出する。このように、信号処理機能131は、例えば、走査線A〜Cのサンプル点の位相を用いて、走査線Bのサンプル点の位相速度を算出する。同様に、例えば、信号処理機能131は、走査線B〜Dのサンプル点の位相を用いて、走査線Cのサンプル点の位相速度を算出する。また、例えば、信号処理機能131は、走査線C〜Eのサンプル点の位相を用いて、走査線Dのサンプル点の位相速度を算出する。
As shown in FIG. 4, for example, the signal processing function 131 calculates the phase velocity at the sample point of the scanning line B by using the phase of the sample points of the scanning lines A, B, and C. In this case, the phase difference ΔΦ in the equation (1) may be obtained from the average of the phase differences between the adjacent sample points of the scanning lines A, B, and C, or the sample points of the scanning lines A, B, and C. It may be obtained from the slope by the method of least squares of the phase of. Further, the distance L is obtained from the distance between the sample point of the scanning line A and the sample point of the scanning line C. Further, a plurality of arbitrary frequencies are selected as the frequency f. For example, as the frequency f, a frequency in which the
このように、信号処理機能131は、各サンプル点の位相速度を算出する。なお、図4は一例に過ぎず、例えば、算出に用いるサンプル点や、算出された位相速度が割り当てられる位置は、適宜変更可能である。例えば、信号処理機能131は、走査線A〜Dの4つのサンプル点の位相を用いて位相速度を算出し、算出した位相速度を走査線B,Cのサンプル点の中点に割り当ててもよい。また、例えば、信号処理機能131は、走査線A,Bの2つのサンプル点の位相を用いて位相速度を算出し、算出した位相速度を走査線A,Bのサンプル点の中点に割り当ててもよい。つまり、信号処理機能131によって算出された位相速度は、任意の位相速度の算出位置に割り当てられる。 In this way, the signal processing function 131 calculates the phase velocity of each sample point. Note that FIG. 4 is only an example, and for example, the sample points used for the calculation and the positions to which the calculated phase velocities are assigned can be appropriately changed. For example, the signal processing function 131 may calculate the phase velocity using the phases of the four sample points of the scanning lines A to D, and assign the calculated phase velocity to the midpoint of the sample points of the scanning lines B and C. .. Further, for example, the signal processing function 131 calculates the phase velocity using the phases of the two sample points of the scanning lines A and B, and assigns the calculated phase velocity to the midpoint of the sample points of the scanning lines A and B. May be good. That is, the phase velocity calculated by the signal processing function 131 is assigned to an arbitrary phase velocity calculation position.
信号処理機能131は、算出した位相速度の周波数方向への変化量(以下、位相速度のばらつき)を表し、粘弾性に関する物理モデルに依存しない指標値を算出する。すなわち、信号処理機能131は、位相速度のばらつきを表す指標値を、粘弾性に関する物理モデルを用いずに算出する。例えば、信号処理機能131は、位相速度のばらつきを表す指標値を、粘弾性に関する物理モデルへのフィッティングを行わずに算出する。一例としては、信号処理機能131は、位相速度のばらつきを表す指標値として、位相速度分布の傾きを算出する。言い換えると、信号処理機能131は、せん断波を解析することにより算出された周波数−位相速度分布を用いて、指標値を算出する。 The signal processing function 131 represents the amount of change in the calculated phase velocity in the frequency direction (hereinafter, variation in the phase velocity), and calculates an index value of viscoelasticity that does not depend on the physical model. That is, the signal processing function 131 calculates an index value representing a variation in phase velocity without using a physical model for viscoelasticity. For example, the signal processing function 131 calculates an index value representing a variation in phase velocity without fitting to a physical model regarding viscoelasticity. As an example, the signal processing function 131 calculates the slope of the phase velocity distribution as an index value representing the variation in the phase velocity. In other words, the signal processing function 131 calculates the index value using the frequency-phase velocity distribution calculated by analyzing the shear wave.
図5は、第1の実施形態に係る超音波診断装置における指標値の算出について説明するための図である。図5には、走査線Bのサンプル点の位相速度を周波数ごとにプロットしたグラフ(位相速度分布)を例示する。つまり、図5にプロットされる位相速度は、走査線A,B,Cのサンプル点の位相を用いて算出された値である。図5において、横軸は、周波数インデックスに対応し、縦軸は、位相速度に対応する。なお、周波数インデックスとは、位相速度の算出に用いた各周波数を示すインデックスを表し、周波数インデックスの値の大きさは周波数の大きさに対応する。 FIG. 5 is a diagram for explaining the calculation of the index value in the ultrasonic diagnostic apparatus according to the first embodiment. FIG. 5 illustrates a graph (phase velocity distribution) in which the phase velocities of the sample points of the scanning line B are plotted for each frequency. That is, the phase velocity plotted in FIG. 5 is a value calculated using the phase of the sample points of the scanning lines A, B, and C. In FIG. 5, the horizontal axis corresponds to the frequency index and the vertical axis corresponds to the phase velocity. The frequency index represents an index indicating each frequency used for calculating the phase velocity, and the magnitude of the value of the frequency index corresponds to the magnitude of the frequency.
図5に示すように、信号処理機能131は、式(1)により算出した走査線Bのサンプル点の位相速度Cphaseを周波数インデックスごとにプロットし、プロットした位相速度分布から傾きを算出する。例えば、信号処理機能131は、この位相速度分布における任意の周波数区間に対して多項式フィッティングを行って、走査線Bのサンプル点の位相速度分布の傾きを求める。なお、任意の周波数区間としては、呼吸や拍動、体動等と比較してせん断波12の方が支配的な周波数区間が選択されるのが好ましい。
5, the signal processing function 131 plots the phase velocity C phase of the sample point of the scanning line B, which is calculated by the equation (1) for each frequency index, calculates an inclination from the phase velocity distribution plotted. For example, the signal processing function 131 performs polynomial fitting on an arbitrary frequency interval in this phase velocity distribution to obtain the slope of the phase velocity distribution of the sample points of the scanning line B. As an arbitrary frequency section, it is preferable to select a frequency section in which the
このように、信号処理機能131は、走査線Bのサンプル点の位相速度分布の傾きを指標値として算出する。また、信号処理機能131は、他のサンプル点についても同様に、各サンプル点の位相速度分布の傾きを指標値として求める。言い換えると、信号処理機能131は、検出したせん断波を解析することにより、粘弾性に関する物理モデルに依存せず、物体内の粘性を表す指標値を算出する。なお、図5は一例に過ぎず、例えば、位相速度分布の傾きを算出する方法は、多項式フィッティングに限定されるものではない。位相速度分布の傾きを算出する他の方法としては、例えば、任意の周波数区間で1次近似を行い、その傾きを算出してもよい。また、例えば、任意の周波数区間の対数フィッティングを適用してもよい。この場合、フィッティング後に、ある周波数での微分係数を指標値として算出してもよい。この他にも、位相速度のばらつきを評価可能な値であれば、指標値として算出可能である。この他の例については、後述することとする。 As described above, the signal processing function 131 calculates the slope of the phase velocity distribution of the sample points of the scanning line B as an index value. Further, the signal processing function 131 similarly obtains the slope of the phase velocity distribution of each sample point as an index value for the other sample points. In other words, the signal processing function 131 analyzes the detected shear wave to calculate an index value representing the viscosity in the object without depending on the physical model of viscoelasticity. Note that FIG. 5 is only an example, and for example, the method of calculating the slope of the phase velocity distribution is not limited to polynomial fitting. As another method for calculating the slope of the phase velocity distribution, for example, a first-order approximation may be performed in an arbitrary frequency section and the slope may be calculated. Further, for example, logarithmic fitting of an arbitrary frequency section may be applied. In this case, after fitting, the differential coefficient at a certain frequency may be calculated as an index value. In addition to this, if the variation in the phase velocity can be evaluated, it can be calculated as an index value. Other examples will be described later.
また、例えば、図5の例では、9個の周波数成分(周波数インデックス)について算出した位相速度を用いて指標値を算出する場合を説明したが、実施形態はこれに限定されるものではない。例えば、信号処理機能131は、任意数の周波数成分について算出した位相速度を用いて指標値を算出してもよい。ただし、位相速度のばらつきを評価するため、信号処理機能131は、3以上の周波数成分それぞれについて算出した位相速度を用いて、指標値を算出するのが好ましい。 Further, for example, in the example of FIG. 5, the case where the index value is calculated using the phase velocity calculated for the nine frequency components (frequency indexes) has been described, but the embodiment is not limited to this. For example, the signal processing function 131 may calculate an index value using the phase velocity calculated for an arbitrary number of frequency components. However, in order to evaluate the variation in the phase velocity, it is preferable that the signal processing function 131 calculates the index value by using the phase velocity calculated for each of the three or more frequency components.
また、例えば、図5の例では、位相速度を周波数インデックスごとにプロットしたグラフを生成する場合を説明したが、実施形態はこれに限定されるものではなく、位相速度を周波数成分毎にプロットしたグラフを生成してもよい。 Further, for example, in the example of FIG. 5, a case where a graph in which the phase velocity is plotted for each frequency index has been described, but the embodiment is not limited to this, and the phase velocity is plotted for each frequency component. You may generate a graph.
画像処理機能132は、指標値に応じた属性を、位相速度の算出位置に対応する位置に割り当てることにより、指標画像を生成する。例えば、画像処理機能132は、信号処理機能131によって算出された各サンプル点の指標値を、各サンプル点に割り当てた指標情報を生成する。そして、画像処理機能132は、生成した指標情報をカラーコード化し、スキャンコンバートを行うことで、各サンプル点の指標値が各画素に割り当てられた指標画像を生成する。
The
例えば、画像処理機能132は、指標値に応じた色相が割り当てられた指標画像21を生成する。なお、指標画像21として割り当てられる属性は、色相に限定されるものではなく、例えば、明度や彩度であってもよい。
For example, the
出力制御機能133は、指標画像を表示する。例えば、出力制御機能133は、画像処理機能132によって生成された指標画像をディスプレイ103に表示させる。
The
図6は、第1の実施形態に係る指標画像の一例を示す図である。図6には、Bモード画像20上に表示された指標画像21を例示する。なお、指標画像21が生成される領域は、操作者によって任意に設定される。
FIG. 6 is a diagram showing an example of an index image according to the first embodiment. FIG. 6 illustrates the
図6に示すように、出力制御機能133は、各サンプル点の指標値が各画素に割り当てられた指標画像21をディスプレイ103に表示させる。ここで、出力制御機能133は、指標画像21を、Bモード画像20上の対応する位置に重畳表示させる。また、出力制御機能133は、指標画像21の各画素における指標値と、各画素に割り当てられた色相との対応を表すスケール22を、ディスプレイ103に表示させる。
As shown in FIG. 6, the
このように、出力制御機能133は、例えば、指標値に応じた色相が割り当てられた指標画像21を表示させる。なお、図6では、指標画像21がBモード画像20上に重畳表示される場合を例示したが、実施形態はこれに限定されるものではない。例えば、指標画像21は、Bモード画像20上に重畳表示されず、単独で表示されてもよいし、Bモード画像20等の他の画像と同時に表示されてもよい。同時表示については、後述することとする。
In this way, the
図7は、第1の実施形態に係る超音波診断装置の処理手順を示すフローチャートである。図7に示す処理手順は、例えば、指標画像の撮像を開始する旨の指示を操作者から受け付けた場合に開始される。 FIG. 7 is a flowchart showing a processing procedure of the ultrasonic diagnostic apparatus according to the first embodiment. The processing procedure shown in FIG. 7 is started, for example, when an instruction to start imaging of the index image is received from the operator.
ステップS101において、処理回路130は、指標画像の撮像を開始する旨の指示を受け付けたか否かを判定する。ここで、指標画像の撮像を開始する旨の指示を受け付けると、処理回路130は、ステップS102以降の処理を開始する。なお、ステップS101が否定される場合には、ステップS102以降の処理は開始されず、処理回路130の各処理機能は待機状態である。
In step S101, the
ステップS101が肯定されると、ステップS102において、処理回路130は、プッシュパルスによって発生したせん断波をトラッキングパルスにより観測する。例えば、処理回路130の制御により、送信回路110は、プッシュパルスにより発生する変位を観測するトラッキングパルスを、走査領域内の複数の走査線それぞれで超音波プローブ101から複数回送信させる。
When step S101 is affirmed, in step S102, the
ステップS103において、信号処理機能131は、自己相関により変位を推定する。例えば、信号処理機能131は、各走査線A〜Fで複数回送信されたトラッキングパルス11の反射波データに対して自己相関演算を施して、各サンプル点における変位を推定する。
In step S103, the signal processing function 131 estimates the displacement by autocorrelation. For example, the signal processing function 131 performs an autocorrelation calculation on the reflected wave data of the tracking
ステップS104において、信号処理機能131は、WFやDirection Filterによるフィルタ処理を行う。これにより、信号処理機能131は、例えば、推定された変位から呼吸や拍動、体動等による変位の成分を除外して、せん断波による変位を推定する。 In step S104, the signal processing function 131 performs filter processing by WF or Direction Filter. As a result, the signal processing function 131 estimates the displacement due to the shear wave by excluding the components of the displacement due to respiration, pulsation, body movement, etc. from the estimated displacement, for example.
ステップS105において、信号処理機能131は、時間変位曲線の時間のずれを算出する。例えば、信号処理機能131は、せん断波12の伝播時間から各時間変位曲線の時間のずれ(違い)を算出する。
In step S105, the signal processing function 131 calculates the time lag of the time displacement curve. For example, the signal processing function 131 calculates the time lag (difference) of each time displacement curve from the propagation time of the
ステップS106において、信号処理機能131は、フーリエ変換を行う。例えば、信号処理機能131は、ずれに応じて解析範囲をずらした上で、各時間変位曲線に対して窓関数処理を行い、その後、フーリエ変換を行う。 In step S106, the signal processing function 131 performs a Fourier transform. For example, the signal processing function 131 shifts the analysis range according to the deviation, performs window function processing on each time displacement curve, and then performs Fourier transform.
ステップS107において、信号処理機能131は、位相を算出する。例えば、信号処理機能131は、フーリエ変換により得られた各サンプル点について、周波数ごとの位相を算出する。 In step S107, the signal processing function 131 calculates the phase. For example, the signal processing function 131 calculates the phase for each frequency for each sample point obtained by the Fourier transform.
ステップS108において、信号処理機能131は、位相速度を算出する。例えば、信号処理機能131は、例えば、信号処理機能131は、各サンプル点について算出した位相を用いて、位相差を算出する。そして、信号処理機能131は、求めた位相差、距離L、周波数fを用いて、各サンプル点の位相速度を算出する。 In step S108, the signal processing function 131 calculates the phase velocity. For example, the signal processing function 131, for example, the signal processing function 131 calculates the phase difference using the phase calculated for each sample point. Then, the signal processing function 131 calculates the phase velocity of each sample point using the obtained phase difference, distance L, and frequency f.
ステップS109において、信号処理機能131は、位相速度のばらつきを表す指標値として、位相速度分布の傾きを算出する。例えば、信号処理機能131は、各サンプル点の位相速度分布における任意の周波数区間に対して多項式フィッティングを行って、各サンプル点の位相速度分布の傾きを求める。 In step S109, the signal processing function 131 calculates the slope of the phase velocity distribution as an index value representing the variation in the phase velocity. For example, the signal processing function 131 performs polynomial fitting for an arbitrary frequency interval in the phase velocity distribution of each sample point to obtain the slope of the phase velocity distribution of each sample point.
ステップS110において、画像処理機能132は、指標画像として、位相速度分布の傾きを画像化する。例えば、画像処理機能132は、信号処理機能131によって算出された各サンプル点の指標値を、各サンプル点に割り当てた指標情報を生成する。そして、画像処理機能132は、生成した指標情報をカラーコード化し、スキャンコンバートを行うことで、各サンプル点の指標値が各画素に割り当てられた指標画像を生成する。
In step S110, the
ステップS111において、出力制御機能133は、指標画像を表示する。例えば、出力制御機能133は、画像処理機能132によって生成された指標画像を、Bモード画像上の対応する位置に重畳表示させる。
In step S111, the
なお、図7の例は一例に過ぎない。例えば、ステップS104の処理であるフィルタ処理やステップS106の窓関数処理は、必ずしも実行されなくてもよい。 The example of FIG. 7 is only an example. For example, the filter process that is the process of step S104 and the window function process of step S106 do not necessarily have to be executed.
上述してきたように、第1の実施形態に係る超音波診断装置は、粘性体を伝播するせん断波の速度の周波数依存性を用いて、粘弾性に関する物理モデルに依存しない指標値を算出する。このため、第1の実施形態に係る超音波診断装置は、生体組織の粘性を評価することができる。ここで、図8を用いて、第1の実施形態に係る超音波診断装置による指標値と取得した変位の外形との関係について説明する。 As described above, the ultrasonic diagnostic apparatus according to the first embodiment uses the frequency dependence of the velocity of the shear wave propagating in the viscoelastic body to calculate an index value independent of the physical model of viscoelasticity. Therefore, the ultrasonic diagnostic apparatus according to the first embodiment can evaluate the viscosity of a living tissue. Here, with reference to FIG. 8, the relationship between the index value by the ultrasonic diagnostic apparatus according to the first embodiment and the outer shape of the acquired displacement will be described.
図8は、第1の実施形態に係る超音波診断装置による指標値と取得した変位の外形との関係について説明するための図である。図8の(a)には、粘性が小さい組織に生じた変位の時間変位曲線を例示し、図8の(b)には、粘性が大きい組織に生じた変位の時間変位曲線を例示する。例示した変位は、粘性の大小を示す特徴の一部であり、その限りではない。なお、図8の線種の違いは、各走査線A〜F上の各サンプル点における時間変位曲線に対応する。 FIG. 8 is a diagram for explaining the relationship between the index value by the ultrasonic diagnostic apparatus according to the first embodiment and the outer shape of the acquired displacement. FIG. 8A exemplifies a time-displacement curve of displacement occurring in a tissue having low viscosity, and FIG. 8B exemplifies a time-displacement curve of displacement occurring in a tissue having high viscosity. The illustrated displacements are, but are not limited to, some of the features that indicate the magnitude of the viscosity. The difference in the line type in FIG. 8 corresponds to the time displacement curve at each sample point on the scanning lines A to F.
図8の(a)に示すように、粘性が小さい組織における各時間変位曲線は、せん断波の伝播に伴って変位量が低減するものの、曲線形状は大きく変化することなく伝わる。図8の(a)では、例えば、各時間変位曲線の頂点付近の曲線形状はほぼ一定であり、平行移動しているように見える。時間変位曲線の曲線形状が一定である場合には、例えば、周波数が2倍になれば、位相差(図4の傾き)も2倍になる。ここで、上記の式(1)において、周波数が分子にあり位相差が分母にあるため、周波数と位相差の変化量が互いにキャンセルされる結果、位相速度は変化しない。すなわち、粘性が小さい場合には、位相速度は、周波数に寄らず一定に近づくことがわかる。 As shown in FIG. 8 (a), each time displacement curve in a tissue having a low viscosity is transmitted without a large change in the curve shape, although the displacement amount decreases with the propagation of the shear wave. In FIG. 8A, for example, the curve shape near the apex of each time displacement curve is almost constant, and it seems that they are moving in parallel. When the curve shape of the time displacement curve is constant, for example, if the frequency is doubled, the phase difference (slope in FIG. 4) is also doubled. Here, in the above equation (1), since the frequency is in the numerator and the phase difference is in the denominator, the change amounts of the frequency and the phase difference are canceled each other, and as a result, the phase velocity does not change. That is, it can be seen that when the viscosity is small, the phase velocity approaches constant regardless of the frequency.
一方、図8の(b)に示すように、粘性が大きい組織における各時間変位曲線は、せん断波の伝播に伴って変位量が低減するとともに、曲線形状が時間方向にブロードになる。図8の(b)では、例えば、せん断波の発生源から離れるほど、時間変位曲線の立ち上がり及び立ち下がりが緩やかになり、頂点付近の形状も頂点が潰れた形状となる。時間変位曲線の曲線形状が時間方向にブロードになる場合には、例えば、周波数が2倍になっても、位相差が2倍になるとは限らない。むしろ、位相差(位相回転量)が大きくなり、2倍以上となる。このため、位相速度は、周波数に依存して変化することとなる。 On the other hand, as shown in FIG. 8B, the displacement amount of each time displacement curve in a highly viscous structure decreases with the propagation of the shear wave, and the curve shape becomes broad in the time direction. In FIG. 8B, for example, the farther away from the source of the shear wave, the more gradual the rise and fall of the time displacement curve, and the shape near the apex also becomes a shape in which the apex is crushed. When the curve shape of the time displacement curve becomes broad in the time direction, for example, even if the frequency is doubled, the phase difference is not always doubled. Rather, the phase difference (phase rotation amount) becomes large and becomes more than double. Therefore, the phase velocity changes depending on the frequency.
そこで、第1の実施形態に係る超音波診断装置は、粘性に応じた時間変位曲線の曲線形状の変化を、各時間変位曲線の位相速度の違いで表すことにより、粘性の指標値を求めるものである。第1の実施形態に係る超音波診断装置は、例えば、複数の周波数成分それぞれについて位相速度を算出し、位相速度のばらつき(分散関係)を表す指標値として、位相速度分布の傾きを算出する。このため、第1の実施形態に係る超音波診断装置は、生体組織の粘性を正確に評価することができる。例えば、第1の実施形態に係る超音波診断装置により算出される指標値は、粘性が大きい場合には大きな値となり、粘性が小さければ小さな値となる。 Therefore, the ultrasonic diagnostic apparatus according to the first embodiment obtains an index value of viscosity by expressing the change in the curve shape of the time displacement curve according to the viscosity by the difference in the phase velocity of each time displacement curve. Is. The ultrasonic diagnostic apparatus according to the first embodiment calculates the phase velocity for each of a plurality of frequency components, and calculates the slope of the phase velocity distribution as an index value indicating the variation (dispersion relation) of the phase velocity. Therefore, the ultrasonic diagnostic apparatus according to the first embodiment can accurately evaluate the viscosity of a living tissue. For example, the index value calculated by the ultrasonic diagnostic apparatus according to the first embodiment is a large value when the viscosity is high, and a small value when the viscosity is low.
また、例えば、第1の実施形態に係る超音波診断装置は、粘弾性に関する物理モデルを用いることなく、被検体Pから収集された反射波データから指標値を測定する。このため、第1の実施形態に係る超音波診断装置により算出される指標値は、物理モデルに依存しない定性的な値と言える。また、この指標値は、物理モデルに依存しないため、粘性の大小が生体に及ぼす影響(傾向)を知る手段の一つとして有用である。 Further, for example, the ultrasonic diagnostic apparatus according to the first embodiment measures an index value from the reflected wave data collected from the subject P without using a physical model for viscoelasticity. Therefore, it can be said that the index value calculated by the ultrasonic diagnostic apparatus according to the first embodiment is a qualitative value that does not depend on the physical model. Moreover, since this index value does not depend on the physical model, it is useful as one of the means for knowing the influence (tendency) of the viscosity on the living body.
つまり、従来は、生体の性質(粘弾性)を等価回路に置き換えてモデル化したものである。それら等価回路は、必ずしも生体を現している訳ではない。これに対して、第1の実施形態に係る超音波診断装置は、生体の性質(粘性)を等価回路に置き換えることなく、観測された値に対して決まった処理を行うことで粘性の指標値を算出する。このため、第1の実施形態に係る超音波診断装置は、近似を行わずに粘性の指標値を算出することができる。 That is, conventionally, the property (viscoelasticity) of the living body is replaced with an equivalent circuit and modeled. These equivalent circuits do not necessarily represent living organisms. On the other hand, the ultrasonic diagnostic apparatus according to the first embodiment performs a predetermined process on the observed value without replacing the property (viscosity) of the living body with an equivalent circuit, thereby performing a predetermined process for the viscosity index value. Is calculated. Therefore, the ultrasonic diagnostic apparatus according to the first embodiment can calculate the index value of viscosity without performing approximation.
なお、上記の実施形態では、例えば、算出した変位、位相、位相速度等の各種のパラメータを適宜グラフ上にプロットしたものを例示して説明したが、必ずしもプロットしなくてもよい。例えば、上記の各種パラメータは、処理回路130の内部で計算可能であれば、必ずしもプロットしなくてもよい。ただし、グラフを表示する場合には、処理回路130は、各種のパラメータを適宜グラフ上にプロットし、グラフをディスプレイ103に表示させてもよい。
In the above embodiment, for example, various parameters such as calculated displacement, phase, and phase velocity are plotted on a graph as an example, but it is not always necessary to plot them. For example, the above parameters do not necessarily have to be plotted as long as they can be calculated inside the
(第2の実施形態)
第2の実施形態では、せん断波の減衰距離以上の範囲を画像化するための処理を説明する。ここで、図9を用いて、せん断波の減衰について説明する。
(Second embodiment)
In the second embodiment, a process for imaging a range equal to or larger than the damping distance of the shear wave will be described. Here, the attenuation of the shear wave will be described with reference to FIG.
図9は、せん断波の減衰について説明するための図である。図9には、超音波プローブ101から送信されるプッシュパルス10及びトラッキングパルス11を模式的に示す。なお、図2において、矢印tは、時間方向に対応する。
FIG. 9 is a diagram for explaining the attenuation of the shear wave. FIG. 9 schematically shows the
図9に示すように、プッシュパルス10によって発生したせん断波12は、伝播に伴って減弱してしまう。このため、せん断波12は、例えば、走査線A〜Fでは検出されても、更に離れた走査線G〜Iでは検出できない場合がある。この場合、仮に、別のプッシュパルスを用いて発生したせん断波を走査線G〜Iで検出したとしても、走査線Fと走査線Gとの間に抜けが生じてしまう。抜けが生じたまま画像化を行うと、画質が低下する恐れがある。
As shown in FIG. 9, the
そこで、第2の実施形態では、せん断波の減衰距離以上の範囲を画像化するための処理を説明する。 Therefore, in the second embodiment, a process for imaging a range equal to or longer than the attenuation distance of the shear wave will be described.
第2の実施形態に係る超音波診断装置は、図1に例示した超音波診断装置1と同様の構成を備え、処理内容の一部が相違する。そこで、第2の実施形態では、第1の実施形態と相違する点を中心に説明することとし、第1の実施形態において説明した構成と同様の機能を有する点については、説明を省略する。
The ultrasonic diagnostic apparatus according to the second embodiment has the same configuration as the ultrasonic
第2の実施形態に係る処理回路130は、異なる複数の走査範囲のそれぞれでせん断波を検出する場合に、隣り合う走査範囲同士のうち少なくとも1つの位置を重複して走査させる。
When the
図10は、第2の実施形態に係る処理回路130の処理を説明するための図である。図10には、超音波プローブ101から送信されるプッシュパルス10,30及びトラッキングパルス11,31を模式的に示す。なお、図10において、矢印tは、時間方向に対応する。
FIG. 10 is a diagram for explaining the processing of the
図10に示すように、処理回路130の制御により、送信回路110は、プッシュパルス10により発生する変位を観測するトラッキングパルス11を、走査線A〜Fのそれぞれで複数回送信させる。また、送信回路110は、プッシュパルス30により発生する変位を観測するトラッキングパルス31を、走査線D〜Iのそれぞれで複数回送信させる。このように、処理回路130は、2つの異なるせん断波12,32を用いて走査を行う場合に、せん断波12を観測する走査線A〜Fと、せん断波32を観測する走査線D〜Iとのうち、走査線D〜Fを重複させて走査させる。
As shown in FIG. 10, under the control of the
このように、処理回路130は、異なる複数の走査範囲のそれぞれでせん断波を検出する場合に、隣り合う走査範囲同士のうち少なくとも1つの走査線を重複して走査させる。
In this way, when the
処理回路130は、隣り合う走査範囲に含まれる各位置で算出された位相を、重複して走査された位置の位相を用いて連結する。
The
図11は、第2の実施形態に係る処理回路130の処理を説明するための図である。図11には、2つのせん断波12,32で算出された各サンプル点の位相を連結する場合を模式的に示す。なお、図11の左上のグラフは、図10のせん断波12により算出された各走査線A〜Fのサンプル点の位相を示す。また、図11の右上のグラフは、図10のせん断波32により算出された各走査線D〜Iのサンプル点の位相を示す。また、図11の下のグラフは、せん断波12,32で算出された各サンプル点の位相を連結した結果を示す。
FIG. 11 is a diagram for explaining the processing of the
図11の左上に示すように、処理回路130において、信号処理機能131は、せん断波12のフーリエ変換により、各走査線A〜Fのサンプル点の位相を算出する。そして、信号処理機能131は、走査線Aのサンプル点の位相を基準(ゼロ)として、各走査線A〜Fの位相差を求める。また、図11の右上に示すように、信号処理機能131は、せん断波32のフーリエ変換により、各走査線D〜Iのサンプル点の位相を算出する。そして、信号処理機能131は、走査線Dのサンプル点の位相を基準(ゼロ)として、各走査線D〜Iの位相差を求める。このように、両者のグラフは、基準が異なる。なお、位相を算出する処理は、第1の実施形態と同様であるので説明を省略する。
As shown in the upper left of FIG. 11, in the
ここで、両者のグラフのうち、走査線D,E,Fのサンプル点は一致する。このため、信号処理機能131は、図11の下のグラフに示すように、この走査線D,E,Fのサンプル点の位相を用いて、各走査線A〜Fのサンプル点の位相と、各走査線D〜Iのサンプル点の位相とを連結する。例えば、信号処理機能131は、両者のグラフにおける走査線Dのサンプル点の位相の差、走査線Eのサンプル点の位相の差、及び走査線Fのサンプル点の位相の差をそれぞれ求め、求めた差の平均値を算出する。そして、信号処理機能131は、算出した平均値を各走査線G〜Iのサンプル点の位相にそれぞれ加算することで、各走査線G〜Iのサンプル点の位相を左上のグラフに当てはめることで、連結する。 Here, in both graphs, the sample points of the scanning lines D, E, and F match. Therefore, as shown in the graph at the bottom of FIG. 11, the signal processing function 131 uses the phases of the sample points of the scanning lines D, E, and F to obtain the phases of the sample points of the scanning lines A to F. The phases of the sample points of the scanning lines D to I are connected. For example, the signal processing function 131 obtains and obtains the phase difference of the sample points of the scanning line D, the phase difference of the sample points of the scanning line E, and the phase difference of the sample points of the scanning line F in both graphs. Calculate the average value of the difference. Then, the signal processing function 131 adds the calculated average value to the phase of the sample points of each scan line G to I, and applies the phase of the sample points of each scan line G to I to the upper left graph. ,connect.
このように、処理回路130は、隣り合う走査範囲に含まれる各位置で算出された位相を、重複して走査された位置の位相を用いて連結する。これにより、信号処理機能131は、各走査線A〜Iの位相を、第1の実施形態で説明した処理により同様に扱うことができる。
In this way, the
上述してきたように、第2の実施形態に係る超音波診断装置は、異なる複数の走査範囲のそれぞれでせん断波を検出する場合に、隣り合う走査範囲同士のうち少なくとも1つの位置を重複して走査させる。そして、超音波診断装置は、隣り合う走査範囲に含まれる各位置で算出された位相を、重複して走査された位置の位相を用いて連結する。このため、超音波診断装置は、せん断波の減衰距離以上の範囲を高画質に画像化することができる。 As described above, when the ultrasonic diagnostic apparatus according to the second embodiment detects a shear wave in each of a plurality of different scanning ranges, at least one position of the adjacent scanning ranges overlaps with each other. Scan. Then, the ultrasonic diagnostic apparatus connects the phases calculated at each positions included in the adjacent scanning ranges by using the phases of the overlapping scanned positions. Therefore, the ultrasonic diagnostic apparatus can image a range equal to or longer than the attenuation distance of the shear wave with high image quality.
なお、上記の説明は一例に過ぎない。例えば、上記の例では、3つの走査線を重複して走査する場合を説明したが、実施形態はこれに限定されるものではなく、重複して走査される走査線数は任意に設定されてよい。ただし、少なくとも1つの走査線を重複して走査することが好ましい。 The above explanation is only an example. For example, in the above example, the case where three scanning lines are scanned in an overlapping manner has been described, but the embodiment is not limited to this, and the number of scanning lines to be scanned in an overlapping manner is arbitrarily set. good. However, it is preferable to scan at least one scanning line in an overlapping manner.
(その他の実施形態)
上述した実施形態以外にも、種々の異なる形態にて実施されてもよい。
(Other embodiments)
In addition to the above-described embodiments, various different embodiments may be performed.
(解析装置)
例えば、上記の実施形態では、解析装置の一例として、超音波診断装置を説明したが、実施形態はこれに限定されるものではない。例えば、物体内を伝播するせん断波が検出され、時間変位曲線を取得可能な程度の情報があれば、任意の装置で実行可能である。
(Analyzer)
For example, in the above embodiment, the ultrasonic diagnostic apparatus has been described as an example of the analysis apparatus, but the embodiment is not limited to this. For example, if a shear wave propagating in an object is detected and there is enough information to obtain a time displacement curve, it can be executed by any device.
この場合、例えば、その他の実施形態に係る解析装置は、処理回路130を備える。処理回路130は、物体内を伝播するせん断波を、せん断波の伝播方向に沿った複数の位置それぞれについて検出する。処理回路130は、検出したせん断波に含まれる複数の周波数成分それぞれの位相を算出する。処理回路130は、各位置について算出した位相を用いて、周波数成分毎に、位相速度を算出する。処理回路130は、算出した位相速度のばらつきを表し、粘弾性に関する物理モデルに依存しない指標値を算出する。このため、その他の実施形態に係る解析装置は、生体組織の粘性を正確に評価することができる。
In this case, for example, the analysis device according to another embodiment includes a
(位相差のばらつきを表す指標値)
また、例えば、上記の実施形態では、各サンプル点の位相速度を算出し、算出した位相速度のばらつきを表す指標値を算出するものと説明したが、実施形態はこれに限定されるものではない。例えば、信号処理機能131は、位相差のばらつきを表す指標値を算出してもよい。
(Index value indicating variation in phase difference)
Further, for example, in the above embodiment, it has been described that the phase velocity of each sample point is calculated and the index value indicating the variation of the calculated phase velocity is calculated, but the embodiment is not limited to this. .. For example, the signal processing function 131 may calculate an index value representing a variation in the phase difference.
この場合、その他の実施形態に係る超音波診断装置は、処理回路130を備える。処理回路130は、物体内を伝播するせん断波を、せん断波の伝播方向に沿った複数の位置それぞれについて検出する。処理回路130は、検出したせん断波に含まれる複数の周波数成分それぞれの位相を算出する。処理回路130は、各位置について算出した位相を用いて、周波数成分毎に、位相差を算出する。処理回路130は、算出した位相差のばらつきを表し、粘弾性に関する物理モデルに依存しない指標値を算出する。言い換えると、信号処理機能131は、せん断波を解析することにより算出された周波数−位相差分布を用いて、指標値を算出する。
In this case, the ultrasonic diagnostic apparatus according to the other embodiment includes a
ここで、処理回路130は、位相差のばらつきを表す指標値として、例えば、位相差の傾きを算出する。具体的には、処理回路130は、上述したように、図4の傾きを指標値として算出してもよい。このため、その他の実施形態に係る超音波診断装置は、位相差を指標として、生体組織の粘性を評価することができる。なお、この場合、処理回路130は、位相速度を算出しなくてもよい。すなわち、本実施形態に係る処理回路130は、位相差又は位相速度のばらつきを表す指標値を、粘弾性に関する物理モデルを用いずに算出する。例えば、処理回路130は、位相差又は位相速度のばらつきを表す指標値を、粘弾性に関する物理モデルへのフィッティングを行わずに算出する。
Here, the
(位相速度のイメージング)
また、例えば、その他の実施形態に係る超音波診断装置は、特定周波数の位相速度をイメージングしても良い。
(Phase velocity imaging)
Further, for example, the ultrasonic diagnostic apparatus according to another embodiment may image the phase velocity of a specific frequency.
この場合、その他の実施形態に係る超音波診断装置は、処理回路130を備える。処理回路130は、物体内を伝播するせん断波を、せん断波の伝播方向に沿った複数の位置それぞれについて検出する。処理回路130は、検出したせん断波に含まれる特定の周波数成分の位相を算出する。処理回路130は、各位置について算出した位相を用いて、位相速度を算出する。処理回路130は、算出した位相速度を指標値として、指標値に応じた属性を、位相速度の算出位置に対応する位置に割り当てることにより、指標画像を生成する。これにより、その他の実施形態に係る超音波診断装置は、特定周波数の位相速度をイメージングすることができる。
In this case, the ultrasonic diagnostic apparatus according to the other embodiment includes a
なお、この場合、上記の実施形態のように、複数の周波数成分について位相速度を算出しなくても良い。つまり、超音波診断装置は、特定の周波数についてのみ、位相速度を算出し、この位相速度に応じた画素値を割り当てた画像を生成してもよい。 In this case, it is not necessary to calculate the phase velocity for a plurality of frequency components as in the above embodiment. That is, the ultrasonic diagnostic apparatus may calculate the phase velocity only for a specific frequency and generate an image to which the pixel value corresponding to the phase velocity is assigned.
(位相差のイメージング)
また、例えば、その他の実施形態に係る超音波診断装置は、特定周波数の位相差をイメージングしても良い。
(Phase difference imaging)
Further, for example, the ultrasonic diagnostic apparatus according to another embodiment may image the phase difference of a specific frequency.
例えば、その他の実施形態に係る超音波診断装置は、処理回路130を備える。処理回路130は、物体内を伝播するせん断波を、せん断波の伝播方向に沿った複数の位置それぞれについて検出する。処理回路130は、検出したせん断波に含まれる特定の周波数成分の位相を算出する。処理回路130は、各位置について算出した位相を用いて、位相差を算出する。処理回路130は、算出した位相差を指標値として、指標値に応じた属性を、位相差の算出位置に対応する位置に割り当てることにより、指標画像を生成する。これにより、その他の実施形態に係る超音波診断装置は、特定周波数の位相差をイメージングすることができる。
For example, the ultrasonic diagnostic apparatus according to another embodiment includes a
なお、この場合、上記の実施形態のように、複数の周波数成分について位相差を算出しなくても良い。つまり、超音波診断装置は、特定の周波数についてのみ、位相差を算出し、この位相差に応じた画素値を割り当てた画像を生成してもよい。 In this case, it is not necessary to calculate the phase difference for a plurality of frequency components as in the above embodiment. That is, the ultrasonic diagnostic apparatus may calculate the phase difference only for a specific frequency and generate an image to which the pixel value corresponding to the phase difference is assigned.
(指標画像上での計測)
また、例えば、上記の実施形態で説明した超音波診断装置により生成される指標画像は、計測に用いられてもよい。
(Measurement on index image)
Further, for example, the index image generated by the ultrasonic diagnostic apparatus described in the above embodiment may be used for measurement.
図12は、その他の実施形態に係る超音波診断装置における計測について説明するための図である。図12には、Bモード画像20上に表示された指標画像21を例示する。なお、図12において、操作者の指示により指標画像21上に計測ROI40が設定される。
FIG. 12 is a diagram for explaining measurement in the ultrasonic diagnostic apparatus according to another embodiment. FIG. 12 illustrates the
図12に示すように、処理回路130は、操作者の指示により計測ROI40が設定されると、設定された計測ROI40に含まれる指標値の平均値を算出する。そして、処理回路130は、算出した平均値「XX.XX」を計測ROI40の値として領域41に表示する。
As shown in FIG. 12, when the
このように、処理回路130は、指標画像21上に設定された関心領域に含まれる指標値を用いた統計値を算出する。なお、処理回路130によって算出される統計値は、平均値に限らず、例えば、中央値、分散値、標準偏差等であってもよい。また、処理回路130は、統計値をレポート作成プログラムに出力してもよい。例えば、処理回路130は、計測した値と指標画像21とを、被検体Pのレポートに反映させるために、レポートを作成するレポート作成プログラムに出力しても良い。
In this way, the
(他の画像との同時表示)
また、例えば、上記の実施形態で説明した超音波診断装置により生成される指標画像21は、他の画像と同時にディスプレイ103に表示されてもよい。
(Simultaneous display with other images)
Further, for example, the
処理回路130は、物体内の組織性状を表す画像(Bモード画像)、及び、せん断波が複数の位置のそれぞれに伝播した伝播時間に基づく画像の少なくとも一方を生成し、生成した画像を指標画像と同時に表示する。例えば、処理回路130は、せん断波が複数の位置のそれぞれに伝播した伝播時間に基づく画像として、硬さ画像を生成し、表示する。
The
図13は、その他の実施形態に係る超音波診断装置における同時表示について説明するための図である。図13には、Bモード画像20上に表示された指標画像21と、Bモード画像20上に表示された硬さ画像50とを例示する。なお、図13において、指標画像21上に計測ROI40が設定され、硬さ画像50上に計測ROI52が設定される。なお、スケール51は、硬さ画像50の各画素における弾性率と、各画素に割り当てられた色相との対応を表すスケールである。
FIG. 13 is a diagram for explaining simultaneous display in the ultrasonic diagnostic apparatus according to another embodiment. FIG. 13 illustrates an
図13に示すように、処理回路130は、硬さ画像50を生成する。例えば、処理回路130は、図3で得られた各時間変位曲線の相互相関によってせん断波の伝播時間を算出し、算出した伝播時間と各サンプル点の距離とに基づいて、せん断波の伝播速度を求める。そして、処理回路130は、求めた伝播速度をヤング率に変換した弾性率を算出する。処理回路130は、算出した弾性率を硬さの指標として画素値を割り当てることで、硬さ画像50を生成する。
As shown in FIG. 13, the
そして、処理回路130は、生成した硬さ画像50をBモード画像20上の対応する位置に重畳表示させ、指標画像21と同時に表示する。また、処理回路130は、計測ROI52に含まれる弾性率の平均値を算出し、算出した平均値「XX.XX」を計測ROI52の弾性値として領域53に表示する。
Then, the
このように、処理回路130は、指標画像21とともに、硬さ画像50等の他の画像をディスプレイ103に同時表示してもよい。なお、指標画像21とともに同時表示される画像は、硬さ画像50以外の画像であってもよい。
As described above, the
例えば、処理回路130は、伝播時間に基づく画像として、伝播時間に応じた画素値を割り当てた画像、伝播時間から算出される硬さに応じた画素値を割り当てた画像(硬さ画像50)、伝播時間が略同一の位置を表す画像、及び、伝播時間の分散値に応じた画素値を割り当てた画像のうち少なくとも一つを生成し、生成した画像を指標画像と同時に表示する。
For example, as an image based on the propagation time, the
また、例えば、指標画像21及び硬さ画像50は、必ずしもBモード画像20上に重畳表示されなくてもよい。また、計測ROI52は、計測ROI40の設定に伴って自動設定されてもよい。つまり、処理回路130は、同時に表示される画像のうち一つの画像に第1の関心領域が設定された場合に、他の画像における第1の関心領域に対応する位置に第2の関心領域を設定し、設定された第1の関心領域及び第2の関心領域のそれぞれについて、各関心領域に含まれる値を用いた統計値を算出してもよい。
Further, for example, the
また、例えば、図13に例示した2画像の同時表示のみならず、例えば、4画像の同時表示であってもよい。例えば、処理回路130は、上述した実施形態において算出される任意のパラメータに応じた画素値を割り当てた画像を表示することができる。
Further, for example, not only the simultaneous display of the two images illustrated in FIG. 13 but also the simultaneous display of four images may be performed. For example, the
図14は、その他の実施形態に係る超音波診断装置における同時表示について説明するための図である。図14には、図13に示した指標画像21及び硬さ画像50に加えて、何も重畳させないBモード画像20と、Bモード画像20上に重畳させた伝播時間画像60とを例示する。
FIG. 14 is a diagram for explaining simultaneous display in the ultrasonic diagnostic apparatus according to another embodiment. In FIG. 14, in addition to the
図14に示すように、処理回路130は、例えば、伝播時間が略同一の位置を表す画像として、伝播時間画像60を生成し、表示する。この伝播時間画像60は、各サンプル点における伝播時間が略同一となる位置に対して同様の画素値を割り当てた画像であり、収集された変位の情報に関する信頼度の指標となる。これは、変位の伝播時間が画像内でおよそ均一であれば、画像内に変位が安定して伝わったと考えられるため、収集された変位の情報に関する信頼度が高い。これに対して、変位の伝播時間が画像内で不均一であれば、何らかの要因によって変位が伝わらなかったと考えられるため、信頼度が低い(アーチファクトの可能性が高い)。なお、伝播時間画像60は、必ずしも全画素に画素値を割り当てなくても良い。例えば、図14の線62に示すように、伝播時間が略同一となる位置を所定間隔で示す場合(等高線のような表示)であっても良い。また、処理回路130は、伝播時間画像60の各画素における指標値と、各画素に割り当てられた色相との対応を表すスケール61を、ディスプレイ103に表示させる。
As shown in FIG. 14, the
(2次元フーリエ変換を用いた指標値の算出)
上記の実施形態では、変位の時間変化(例えば、図3の時間変位曲線)に対して時間方向のフーリエ変換を行うことで、粘性を表す指標値を求める場合を説明した。しかしながら、実施形態はこれに限定されるものではない。例えば、時間−空間方向の変位分布に対して2次元フーリエ変換(2D−FFT)を行うことで、粘性を表す指標値を求めることも可能である。
(Calculation of index value using 2D Fourier transform)
In the above embodiment, the case where the index value representing the viscosity is obtained by performing the Fourier transform in the time direction with respect to the time change of the displacement (for example, the time displacement curve of FIG. 3) has been described. However, the embodiments are not limited to this. For example, it is also possible to obtain an index value representing viscosity by performing a two-dimensional Fourier transform (2D-FFT) on a displacement distribution in the time-spatial direction.
つまり、信号処理機能131は、時間−空間方向の変位分布に対して、時間方向及び空間方向の2次元フーリエ変換を行う。そして、信号処理機能131は、2次元フーリエ変換の結果に基づいて、周波数ごとの位相速度を算出する。そして、信号処理機能131は、周波数ごとの位相速度を用いて、粘性を表す指標値を算出する。 That is, the signal processing function 131 performs a two-dimensional Fourier transform in the time direction and the space direction with respect to the displacement distribution in the time-spatial direction. Then, the signal processing function 131 calculates the phase velocity for each frequency based on the result of the two-dimensional Fourier transform. Then, the signal processing function 131 calculates an index value representing the viscosity by using the phase velocity for each frequency.
図15A及び図15Bは、その他の実施形態に係る時間−空間方向の変位分布の一例を示す図である。図15Aにおいて、横方向は時間方向に対応し、縦方向は振幅(変位)の大きさに対応し、奥行き方向は方位方向に対応する。また、図15Bにおいて、横方向は時間方向に対応し、縦方向は方位方向に対応し、カラーの変化は振幅(変位)の大きさに対応する。なお、図15A及び図15Bは、2次元フーリエ変換の対象となる変位分布を異なる表示形態で例示したものであり、実質的には同一のものである。 15A and 15B are diagrams showing an example of displacement distribution in the time-spatial direction according to other embodiments. In FIG. 15A, the horizontal direction corresponds to the time direction, the vertical direction corresponds to the magnitude of the amplitude (displacement), and the depth direction corresponds to the directional direction. Further, in FIG. 15B, the horizontal direction corresponds to the time direction, the vertical direction corresponds to the directional direction, and the change in color corresponds to the magnitude of the amplitude (displacement). It should be noted that FIGS. 15A and 15B illustrate the displacement distributions that are the targets of the two-dimensional Fourier transform in different display forms, and are substantially the same.
図15A及び図15Bに示すように、信号処理機能131は、時間−空間方向の変位分布に対して2次元フーリエ変換を行う。ここで、2次元フーリエ変換の対象となる変位分布は、時間方向と、空間方向(方位方向)と、変位の大きさとの3軸で表される。具体的には、信号処理機能131は、図15A及び図15Bに例示する時間−空間方向の変位分布に対して、時間方向及び空間方向の2次元フーリエ変換を行う。この結果、信号処理機能131は、パワースペクトル分布を得る(図16参照)。 As shown in FIGS. 15A and 15B, the signal processing function 131 performs a two-dimensional Fourier transform on the displacement distribution in the time-spatial direction. Here, the displacement distribution that is the target of the two-dimensional Fourier transform is represented by three axes of the time direction, the spatial direction (direction direction), and the magnitude of the displacement. Specifically, the signal processing function 131 performs a two-dimensional Fourier transform in the time direction and the space direction with respect to the displacement distribution in the time-spatial direction exemplified in FIGS. 15A and 15B. As a result, the signal processing function 131 obtains a power spectral distribution (see FIG. 16).
図16は、その他の実施形態に係る2次元フーリエ変換によるパワースペクトル分布の一例を示す図である。図16において、横方向は周波数[Hz]に対応し、縦方向は波数[1/m]に対応し、カラーの変化はパワースペクトルに対応する。なお、図16において、横方向の周波数は、時間周波数に対応し、縦方向の波数は、空間周波数に対応する。 FIG. 16 is a diagram showing an example of a power spectrum distribution by a two-dimensional Fourier transform according to another embodiment. In FIG. 16, the horizontal direction corresponds to the frequency [Hz], the vertical direction corresponds to the wave number [1 / m], and the color change corresponds to the power spectrum. In FIG. 16, the frequency in the horizontal direction corresponds to the time frequency, and the wave number in the vertical direction corresponds to the spatial frequency.
図16に示すように、信号処理機能131は、各周波数(時間周波数)におけるパワースペクトルが極大となる波数k(f)を取得する。具体的には、信号処理機能131は、図16のパワースペクトル分布から、周波数fを固定させたときの波数方向へのパワースペクトル分布(図16の領域70に対応)の極大値を取得する。この結果、信号処理機能131は、周波数fごとのパワースペクトルの極大値(図16の丸印)を取得する。そして、信号処理機能131は、取得したそれぞれの極大値に対応する波数k(f)をパワースペクトル分布から取得する。
As shown in FIG. 16, the signal processing function 131 acquires the wave number k (f) at which the power spectrum at each frequency (time frequency) is maximized. Specifically, the signal processing function 131 acquires the maximum value of the power spectrum distribution (corresponding to the
そして、信号処理機能131は、下記の式(2)を用いて、位相速度C(f)を算出する。例えば、信号処理機能131は、式(2)を用いて、周波数fごとの位相速度C(f)を算出する。 Then, the signal processing function 131 calculates the phase velocity C (f) using the following equation (2). For example, the signal processing function 131 calculates the phase velocity C (f) for each frequency f using the equation (2).
そして、信号処理機能131は、周波数fごとの位相速度C(f)を用いて、粘性を表す指標値を算出する。例えば、信号処理機能131は、図5に示したように、周波数−位相速度分布の傾きを、粘性を表す指標値を算出する。この場合、算出された指標値は、2次元フーリエ変換の対象となる変位分布の空間方向の中心位置に割り当てられる(図17参照)。 Then, the signal processing function 131 calculates an index value representing the viscosity by using the phase velocity C (f) for each frequency f. For example, as shown in FIG. 5, the signal processing function 131 calculates an index value indicating the slope of the frequency-phase velocity distribution and the viscosity. In this case, the calculated index value is assigned to the center position in the spatial direction of the displacement distribution that is the target of the two-dimensional Fourier transform (see FIG. 17).
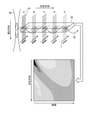
図17は、その他の実施形態に係る粘性の指標値とサンプル位置との関係を示す図である。図17には、超音波プローブ101から送信されるプッシュパルス80と、トラッキングパルス81と、せん断波82とを模式的に示す。なお、図17において、矢印tは、時間方向に対応する。
FIG. 17 is a diagram showing the relationship between the index value of viscosity and the sample position according to other embodiments. FIG. 17 schematically shows a
図17の上図に示すように、せん断波82により生じる変位は、各走査線A,B,C,D,Eの各サンプル点(図17の丸印)において時間方向に複数回観測される。これにより、図17に示すように、各走査線A,B,C,D,Eの各サンプル点における変位の時間変化を表すデータ群83が観測される。このデータ群83は、図17の下図に示すように、2次元フーリエ変換の対象となる時間−空間方向の変位分布に対応する。
As shown in the upper figure of FIG. 17, the displacement caused by the
図17に示す例では、信号処理機能131は、データ群83の変位分布に対する2次元フーリエ変換により算出された粘性の指標値を、走査線A〜Eの中心に位置する走査線Cのサンプル点に割り当てる。そして、信号処理機能131は、深さ方向及び方位方向の各サンプル点において粘性の指標値を算出することで、画像化を行う(図18参照)。
In the example shown in FIG. 17, the signal processing function 131 uses the index value of viscosity calculated by the two-dimensional Fourier transform on the displacement distribution of the
図18は、その他の実施形態に係る深さ方向及び方位方向における指標値の算出について説明するための図である。図18は、超音波プローブ101から送信されるプッシュパルス80,90と、トラッキングパルス81,91と、せん断波82,92とを模式的に示す。なお、図18において、矢印tは、時間方向に対応する。
FIG. 18 is a diagram for explaining the calculation of index values in the depth direction and the directional direction according to the other embodiments. FIG. 18 schematically shows push
図18の上図に示すように、信号処理機能131は、深さ方向が異なるデータ群84,85,86のそれぞれにおいて、粘性を表す指標値を算出する。具体的には、信号処理機能131は、データ群84の変位分布に対して2次元フーリエ変換を行うことで、データ群84に含まれる走査線Cのサンプル点の指標値を算出する。また、信号処理機能131は、データ群85の変位分布に対して2次元フーリエ変換を行うことで、データ群85に含まれる走査線Cのサンプル点の指標値を算出する。また、信号処理機能131は、データ群86の変位分布に対して2次元フーリエ変換を行うことで、データ群86に含まれる走査線Cのサンプル点の指標値を算出する。このように、信号処理機能131は、深さ方向における各サンプル点の指標値を算出する。
As shown in the upper figure of FIG. 18, the signal processing function 131 calculates an index value indicating viscosity in each of the
図18の下図に示すように、信号処理機能131は、方位方向が異なるサンプル点については、観測されるデータ群の位置を方位方向へ移動させることにより、方位方向が異なるサンプル点の指標値を算出する。具体的には、処理回路130の制御により、送信回路110は、データ群84の位置をデータ群93の位置へ移動させる。データ群93には、走査線B,C,D,E,Fのサンプル点が含まれる。そして、信号処理機能131は、データ群93の変位分布に対する2次元フーリエ変換により算出された粘性の指標値を、走査線B〜Fの中心に位置する走査線Dのサンプル点に割り当てる。また、送信回路110は、データ群85の位置をデータ群94の位置へ移動させる。ここで、そして、信号処理機能131は、データ群94の変位分布に対する2次元フーリエ変換により算出された粘性の指標値を、走査線B〜Fの中心に位置する走査線Dのサンプル点に割り当てる。また、送信回路110は、データ群86の位置をデータ群95の位置へ移動させる。ここで、そして、信号処理機能131は、データ群95の変位分布に対する2次元フーリエ変換により算出された粘性の指標値を、走査線B〜Fの中心に位置する走査線Dのサンプル点に割り当てる。このように、信号処理機能131は、方位方向における各サンプル点の指標値を算出する。
As shown in the lower figure of FIG. 18, the signal processing function 131 determines the index value of the sample points having different directional directions by moving the position of the observed data group in the directional direction for the sample points having different directional directions. calculate. Specifically, under the control of the
このように、信号処理機能131は、深さ方向及び方位方向の各サンプル点において、粘性の指標値を算出する。そして、例えば、画像処理機能132は、深さ方向及び方位方向の各サンプル点の粘性の指標値に応じたカラーを割り当てることで、図6に示した指標画像を生成する。
In this way, the signal processing function 131 calculates the index value of viscosity at each sample point in the depth direction and the azimuth direction. Then, for example, the
上述したように、その他の実施形態に係る超音波診断装置は、時間−空間方向の変位分布に対して2次元フーリエ変換を行うことで、粘性を表す指標値を求めることが可能である。すなわち、超音波診断装置において、処理回路は、物体内を伝播するせん断波を検出する。また、処理回路は、検出した前記せん断波を解析することにより、粘弾性に関する物理モデルに依存せず、前記物体内の粘性を表す指標値を算出する。 As described above, the ultrasonic diagnostic apparatus according to the other embodiment can obtain an index value indicating viscosity by performing a two-dimensional Fourier transform on the displacement distribution in the time-spatial direction. That is, in the ultrasonic diagnostic apparatus, the processing circuit detects the shear wave propagating in the object. Further, the processing circuit analyzes the detected shear wave to calculate an index value representing the viscosity in the object without depending on the physical model of viscoelasticity.
(他の指標値)
また、例えば、上記の実施形態では、位相速度のばらつきを表す指標値として位相速度分布の傾きを算出する場合を説明したが、実施形態はこれに限定されるものではない。例えば、信号処理機能131は、ある周波数区間の位相速度の平均からの差の二乗和(図19A参照)、ある周波数区間における位相速度の面積(図19B参照)等についても、位相速度のばらつきを表す指標値として算出しても良い。言い換えると、指標値は、せん断波を解析することにより算出された周波数−位相速度分布又は周波数−位相差分布を用いて算出される傾き、残差平方和、及び面積のうち少なくともいずれかを含む。なお、図19A,19Bは、その他の実施形態に係る他の指標値の一例を示す図である。
(Other index values)
Further, for example, in the above embodiment, the case where the slope of the phase velocity distribution is calculated as an index value representing the variation in the phase velocity has been described, but the embodiment is not limited to this. For example, the signal processing function 131 also causes variations in the phase velocity with respect to the sum of squares of the differences from the average of the phase velocities in a certain frequency section (see FIG. 19A), the area of the phase velocity in a certain frequency section (see FIG. 19B), and the like. It may be calculated as an index value to be represented. In other words, the index value includes at least one of the slope, residual sum of squares, and area calculated using the frequency-phase velocity distribution or frequency-phase difference distribution calculated by analyzing the shear wave. .. Note that FIGS. 19A and 19B are diagrams showing an example of other index values according to other embodiments.
また、例えば、上記の実施形態では、プッシュパルスにより生じたせん断波12を検出する場合を説明したが、実施形態はこれに限定されるものではない。例えば、処理回路130は、外部加振により生じたせん断波を検出してもよい。
Further, for example, in the above embodiment, the case of detecting the
また、例えば、上記の実施形態では、超音波の反射を利用して収集された信号を用いて、せん断波を検出する場合を説明したが、実施形態はこれに限定されるものではない。例えば、処理回路130は、磁気共鳴を利用して収集された信号を用いて、せん断波を検出してもよい。例えば、処理回路130は、MRI(Magnetic Resonance Imaging)により収集された信号を用いて生体の硬さを評価するMRエラストグラフィに対して適用することが可能である。
Further, for example, in the above embodiment, the case where the shear wave is detected by using the signal collected by utilizing the reflection of the ultrasonic wave has been described, but the embodiment is not limited to this. For example, the
また、図示した各装置の各構成要素は機能概念的なものであり、必ずしも物理的に図示の如く構成されていることを要しない。すなわち、各装置の分散・統合の具体的形態は図示のものに限られず、その全部又は一部を、各種の負荷や使用状況等に応じて、任意の単位で機能的又は物理的に分散・統合して構成することができる。更に、各装置にて行なわれる各処理機能は、その全部又は任意の一部が、CPU及び当該CPUにて解析実行されるプログラムにて実現され、或いは、ワイヤードロジックによるハードウェアとして実現され得る。 Further, each component of each of the illustrated devices is a functional concept, and does not necessarily have to be physically configured as shown in the figure. That is, the specific form of distribution / integration of each device is not limited to the one shown in the figure, and all or part of them may be functionally or physically distributed / physically in arbitrary units according to various loads and usage conditions. Can be integrated and configured. Further, each processing function performed by each device may be realized by a CPU and a program analyzed and executed by the CPU, or may be realized as hardware by wired logic.
また、上記の実施形態において説明した各処理のうち、自動的に行なわれるものとして説明した処理の全部又は一部を手動的に行なうこともでき、或いは、手動的に行なわれるものとして説明した処理の全部又は一部を公知の方法で自動的に行なうこともできる。この他、上記文書中や図面中で示した処理手順、制御手順、具体的名称、各種のデータやパラメータを含む情報については、特記する場合を除いて任意に変更することができる。 Further, among the processes described in the above-described embodiment, all or a part of the processes described as being automatically performed can be manually performed, or the processes described as being manually performed. It is also possible to automatically perform all or part of the above by a known method. In addition, the processing procedure, control procedure, specific name, and information including various data and parameters shown in the above document and drawings can be arbitrarily changed unless otherwise specified.
また、上記の実施形態で説明した画像処理方法は、予め用意された画像処理プログラムをパーソナルコンピュータやワークステーション等のコンピュータで実行することによって実現することができる。この画像処理方法は、インターネット等のネットワークを介して配布することができる。また、この画像処理方法は、ハードディスク、フレキシブルディスク(FD)、CD−ROM、MO、DVD等のコンピュータで読み取り可能な記録媒体に記録され、コンピュータによって記録媒体から読み出されることによって実行することもできる。 Further, the image processing method described in the above embodiment can be realized by executing an image processing program prepared in advance on a computer such as a personal computer or a workstation. This image processing method can be distributed via a network such as the Internet. Further, this image processing method can also be executed by recording on a computer-readable recording medium such as a hard disk, flexible disk (FD), CD-ROM, MO, or DVD, and reading from the recording medium by the computer. ..
以上説明した少なくともひとつの実施形態によれば、生体組織の粘性を正確に評価することができる。 According to at least one embodiment described above, the viscosity of a living tissue can be accurately evaluated.
本発明のいくつかの実施形態を説明したが、これらの実施形態は、例として提示したものであり、発明の範囲を限定することは意図していない。これら実施形態は、その他の様々な形態で実施されることが可能であり、発明の要旨を逸脱しない範囲で、種々の省略、置き換え、変更を行うことができる。これら実施形態やその変形は、発明の範囲や要旨に含まれると同様に、特許請求の範囲に記載された発明とその均等の範囲に含まれるものである。 Although some embodiments of the present invention have been described, these embodiments are presented as examples and are not intended to limit the scope of the invention. These embodiments can be implemented in various other embodiments, and various omissions, replacements, and changes can be made without departing from the gist of the invention. These embodiments and variations thereof are included in the scope of the invention described in the claims and the equivalent scope thereof, as are included in the scope and gist of the invention.
100 装置本体
130 処理回路
131 信号処理機能
132 画像処理機能
133 出力制御機能
100 Device
Claims (20)
検出した前記せん断波に含まれる複数の周波数成分の位相を算出し、
算出した前記位相を解析することにより算出される位相差又は位相速度の周波数に対する変化を表す指標値であって、前記物体内の粘性を表す指標値を、粘弾性に関する物理モデルに依存せずに算出する、処理部
を備えた解析装置。 Detects shear waves propagating in an object and detects them.
The phases of a plurality of frequency components contained in the detected shear wave are calculated, and the phases are calculated.
Calculated an index value representing a change against the frequency of the phase difference or phase velocity is calculated by analyzing the phase, the index value indicating the viscosity of said object, independent of the physical model of viscoelastic An analyzer equipped with a processing unit that calculates without the need for processing.
検出した前記せん断波に含まれる複数の周波数成分の位相を算出し、
算出した前記位相を解析することにより算出される位相差又は位相速度の周波数に対する変化を表す指標値であって、前記物体内の粘性を表す指標値を、粘弾性に関する物理モデルに依存せずに算出する、処理部
を備え、
前記変化は、傾き、残差平方和、及び面積のうち少なくともいずれかを含む、
解析装置。 Detects shear waves propagating in an object and detects them.
The phases of a plurality of frequency components contained in the detected shear wave are calculated, and the phases are calculated.
Calculated an index value representing a change against the frequency of the phase difference or phase velocity is calculated by analyzing the phase, the index value indicating the viscosity of said object, independent of the physical model of viscoelastic Equipped with a processing unit that calculates without
The changes include at least one of slope, residual sum of squares, and area.
Analytical device.
請求項1又は2に記載の解析装置。 The processing unit generates an index image by assigning an attribute corresponding to the index value to a position corresponding to a calculated position of a phase difference or a phase velocity calculated by analyzing the shear wave.
The analysis device according to claim 1 or 2.
検出した前記せん断波に含まれる複数の周波数成分の位相を算出し、
各位置について算出した前記位相を用いて、位相差又は位相速度を算出し、
算出した前記位相差又は前記位相速度の周波数に対する変化を表す値を前記物体内の粘性を表す指標値として、前記指標値に応じた属性を、前記位相差又は前記位相速度の算出位置に対応する位置に割り当てることにより、指標画像を生成する処理部
を備えた解析装置。 Shear waves propagating in the object are detected at each of a plurality of positions along the propagation direction of the shear waves.
The phases of a plurality of frequency components contained in the detected shear wave are calculated, and the phases are calculated.
Using the phase calculated for each position, the phase difference or phase velocity is calculated.
Calculated the phase difference or a value representing a change against the frequency of the phase velocity as an index value representing the viscosity of said object, the attributes corresponding to the index value, the calculation position of the phase difference or the phase velocity An analysis device equipped with a processing unit that generates an index image by assigning it to the corresponding position.
請求項1乃至4のうちいずれか一つに記載の解析装置。 The processing unit calculates a statistical value using the plurality of index values.
The analysis device according to any one of claims 1 to 4.
請求項1乃至5のうちいずれか一つに記載の解析装置。 When the processing unit detects the shear wave in each of a plurality of different scanning ranges, the processing unit scans at least one position of the adjacent scanning ranges in an overlapping manner, and each position included in the adjacent scanning ranges. Concatenate the phases calculated in (1) using the phases of the overlapping scanned positions.
The analysis device according to any one of claims 1 to 5.
請求項1乃至6のうちいずれか一つに記載の解析装置。 The processing unit is dominated by the shear wave as compared with the breathing, beating, and body movement of the subject by frequency analysis for the shear wave detected at each of a plurality of positions along the propagation direction of the shear wave. Calculate the phase of the frequency component corresponding to the frequency section,
The analysis device according to any one of claims 1 to 6.
請求項7に記載の解析装置。 Prior to the frequency analysis, the processing unit performs window function processing for correcting the difference in propagation time of the shear wave detected at each position with respect to the shear wave detected at each of the plurality of positions. ,
The analysis device according to claim 7.
請求項1乃至8のうちいずれか一つに記載の解析装置。 The processing unit detects the shear wave by calculating the movement in the object at a plurality of positions along the propagation direction of the shear wave.
The analysis device according to any one of claims 1 to 8.
請求項9に記載の解析装置。 The processing unit calculates displacement, velocity, or acceleration at a plurality of positions along the propagation direction of the shear wave as movement in the object.
The analysis device according to claim 9.
請求項1乃至10のうちいずれか一つに記載の解析装置。 The processing unit uses the phase difference or phase velocity calculated by analyzing the shear wave for each of the three or more frequency components in order to evaluate the phase difference or the variation in the phase velocity, and the index value. To calculate,
The analysis device according to any one of claims 1 to 10.
請求項1乃至11のうちいずれか一つに記載の解析装置。 The processing unit calculates the phase difference or the phase velocity using the phase calculated by analyzing the shear wave at each of the three or more positions.
The analysis device according to any one of claims 1 to 11.
請求項1乃至12のうちいずれか一つに記載の解析装置。 The processing unit detects the shear wave using a signal collected by utilizing the reflection of ultrasonic waves or magnetic resonance.
The analysis device according to any one of claims 1 to 12.
請求項1乃至13のうちいずれか一つに記載の解析装置。 The processing unit detects the shear wave generated by acoustic radiation force or external vibration.
The analysis device according to any one of claims 1 to 13.
請求項1乃至14のうちいずれか一つに記載の解析装置。 The processing unit generates a graph in which the phase difference or phase velocity calculated by analyzing the shear wave is plotted for each frequency component.
The analysis device according to any one of claims 1 to 14.
請求項3又は4に記載の解析装置。 The processing unit calculates a statistical value using the index value included in the region of interest set on the index image.
The analysis device according to claim 3 or 4.
請求項3又は4に記載の解析装置。 The processing unit generates at least one of an image showing the texture in the object and an image based on the propagation time of the shear wave, and displays the generated image at the same time as the index image.
The analysis device according to claim 3 or 4.
請求項17に記載の解析装置。 As an image based on the propagation time, the processing unit omits an image to which a pixel value corresponding to the propagation time is assigned, an image to which a pixel value corresponding to the hardness calculated from the propagation time is assigned, and an image having a propagation time. At least one of an image representing the same position and an image to which a pixel value corresponding to the dispersion value of the propagation time is assigned is generated, and the generated image is displayed at the same time as the index image.
The analysis device according to claim 17.
請求項18に記載の解析装置。 When the first area of interest is set for one of the images displayed at the same time, the processing unit sets the second area of interest at a position corresponding to the first area of interest in the other image. Then, for each of the set first and second regions of interest, statistical values using the values included in each region of interest are calculated.
The analyzer according to claim 18.
請求項16又は19に記載の解析装置。 The processing unit outputs the statistical value to the report creation program.
The analyzer according to claim 16 or 19.
Priority Applications (5)
| Application Number | Priority Date | Filing Date | Title |
|---|---|---|---|
| US15/367,712 US11071524B2 (en) | 2015-12-04 | 2016-12-02 | Analyzing apparatus |
| CN201611093028.XA CN106963419B (en) | 2015-12-04 | 2016-12-02 | Analysis device |
| CN202011336457.1A CN112450976A (en) | 2015-12-04 | 2016-12-02 | Analysis device |
| US17/354,601 US11826203B2 (en) | 2015-12-04 | 2021-06-22 | Analyzing apparatus |
| US18/382,219 US20240041434A1 (en) | 2015-12-04 | 2023-10-20 | Analyzing apparatus |
Applications Claiming Priority (2)
| Application Number | Priority Date | Filing Date | Title |
|---|---|---|---|
| JP2015237845 | 2015-12-04 | ||
| JP2015237845 | 2015-12-04 |
Publications (3)
| Publication Number | Publication Date |
|---|---|
| JP2017104526A JP2017104526A (en) | 2017-06-15 |
| JP2017104526A5 JP2017104526A5 (en) | 2019-12-12 |
| JP6987496B2 true JP6987496B2 (en) | 2022-01-05 |
Family
ID=59058237
Family Applications (1)
| Application Number | Title | Priority Date | Filing Date |
|---|---|---|---|
| JP2016228341A Active JP6987496B2 (en) | 2015-12-04 | 2016-11-24 | Analyst |
Country Status (3)
| Country | Link |
|---|---|
| US (1) | US20240041434A1 (en) |
| JP (1) | JP6987496B2 (en) |
| CN (2) | CN106963419B (en) |
Families Citing this family (9)
| Publication number | Priority date | Publication date | Assignee | Title |
|---|---|---|---|---|
| JP6850211B2 (en) * | 2017-06-29 | 2021-03-31 | ゼネラル・エレクトリック・カンパニイ | Ultrasonic device and its control program |
| US11154277B2 (en) | 2017-10-31 | 2021-10-26 | Siemens Medical Solutions Usa, Inc. | Tissue viscoelastic estimation from shear velocity in ultrasound medical imaging |
| CN112074237A (en) * | 2018-05-03 | 2020-12-11 | 皇家飞利浦有限公司 | Shear wave amplitude reconstruction for tissue elasticity monitoring and display |
| EP3813675B1 (en) * | 2018-06-27 | 2023-10-25 | Koninklijke Philips N.V. | Shear wave detection of anatomical viscosity and associated devices, systems, and methods |
| US11850099B2 (en) | 2019-02-26 | 2023-12-26 | Canon Medical Systems Corporation | Ultrasonic diagnostic apparatus |
| EP3769690B1 (en) * | 2019-07-25 | 2023-01-04 | Esaote S.p.A. | Method for tissue characterization by ultrasound wave attenuation measurements and ultrasound system for tissue characterization |
| CN114431893A (en) * | 2020-10-30 | 2022-05-06 | 浙江省人民医院 | Parameter measuring method of peristaltic wave and ultrasonic measuring system |
| WO2022141631A1 (en) * | 2021-01-04 | 2022-07-07 | 深圳迈瑞生物医疗电子股份有限公司 | Viscoelasticity measurement method and ultrasonic imaging system |
| CN116269480B (en) * | 2023-03-14 | 2024-04-12 | 逸超医疗科技(北京)有限公司 | Ultrasonic imaging method and system for detecting tissue viscosity |
Family Cites Families (12)
| Publication number | Priority date | Publication date | Assignee | Title |
|---|---|---|---|---|
| US4721874A (en) * | 1986-10-06 | 1988-01-26 | Emmert Sans W | Apparatus and method for determining the viscosity of a fluid sample |
| US7753847B2 (en) * | 2003-10-03 | 2010-07-13 | Mayo Foundation For Medical Education And Research | Ultrasound vibrometry |
| CN102481137B (en) * | 2009-06-30 | 2015-03-18 | 皇家飞利浦电子股份有限公司 | Supersonic device and method for shear wave dispersion vibrometry |
| CN101869485B (en) * | 2010-06-23 | 2012-07-04 | 深圳大学 | Ultrasonic imaging method and device |
| JP5615073B2 (en) * | 2010-07-20 | 2014-10-29 | オムロンヘルスケア株式会社 | measuring device |
| JPWO2012063928A1 (en) * | 2010-11-11 | 2014-05-12 | オリンパスメディカルシステムズ株式会社 | Ultrasonic observation apparatus, operation method of ultrasonic observation apparatus, and operation program of ultrasonic observation apparatus |
| CN103006274A (en) * | 2012-12-21 | 2013-04-03 | 深圳大学 | Method and system for ultrasonic detection of cornea viscoelasticity |
| EP2965694A4 (en) * | 2013-03-05 | 2016-11-16 | Hitachi Ltd | Ultrasonic diagnosis device and transmission/reception method |
| WO2014201020A1 (en) * | 2013-06-10 | 2014-12-18 | Mayo Foundation For Medical Education And Research | System and method for acoustic radiation force creep-recovery and shear wave propagation for elasticity imaging |
| CN104968278B (en) * | 2013-07-19 | 2017-12-08 | 梅约医学教育与研究基金会 | For the system and method from multi-directional wave field measurement shear wave velocity |
| JP5730978B2 (en) * | 2013-11-08 | 2015-06-10 | 日立アロカメディカル株式会社 | Ultrasonic diagnostic apparatus and method |
| JP6462340B2 (en) * | 2013-12-13 | 2019-01-30 | キヤノンメディカルシステムズ株式会社 | Ultrasonic diagnostic apparatus, image processing apparatus, and image processing method |
-
2016
- 2016-11-24 JP JP2016228341A patent/JP6987496B2/en active Active
- 2016-12-02 CN CN201611093028.XA patent/CN106963419B/en active Active
- 2016-12-02 CN CN202011336457.1A patent/CN112450976A/en active Pending
-
2023
- 2023-10-20 US US18/382,219 patent/US20240041434A1/en active Pending
Also Published As
| Publication number | Publication date |
|---|---|
| JP2017104526A (en) | 2017-06-15 |
| CN106963419B (en) | 2021-11-19 |
| CN106963419A (en) | 2017-07-21 |
| CN112450976A (en) | 2021-03-09 |
| US20240041434A1 (en) | 2024-02-08 |
Similar Documents
| Publication | Publication Date | Title |
|---|---|---|
| JP6987496B2 (en) | Analyst | |
| US11826203B2 (en) | Analyzing apparatus | |
| JP6462340B2 (en) | Ultrasonic diagnostic apparatus, image processing apparatus, and image processing method | |
| JP5925438B2 (en) | Ultrasonic diagnostic equipment | |
| JP6305699B2 (en) | Ultrasonic diagnostic apparatus and ultrasonic imaging program | |
| US9072493B1 (en) | Ultrasonic diagnostic apparatus and elastic evaluation method | |
| JP6608232B2 (en) | Medical image diagnostic apparatus, medical image processing apparatus, and medical information display control method | |
| EP2881041B1 (en) | Apparatus and method for ultrasonic diagnosis | |
| JP7230255B2 (en) | Analysis device and analysis program | |
| US10959704B2 (en) | Ultrasonic diagnostic apparatus, medical image processing apparatus, and medical image processing method | |
| WO2013183651A1 (en) | Ultrasound diagnostic device and image processing device | |
| JP6635766B2 (en) | Ultrasound diagnostic apparatus, signal processing apparatus, and analysis program | |
| JP6058295B2 (en) | Ultrasonic diagnostic apparatus, medical image processing apparatus, medical image processing method, and medical image processing program | |
| KR102011545B1 (en) | Ultrasonic diagnosis apparatus, image processing apparatus, and image processing method | |
| US11337674B2 (en) | Ultrasonography apparatus and control method | |
| JP7043193B2 (en) | Analytical device, ultrasonic diagnostic device, and analysis program | |
| JP2023126415A (en) | Ultrasound diagnosis apparatus | |
| WO2013002351A1 (en) | Ultrasound diagnostic device and medical image processing device | |
| JP7490839B2 (en) | Analysis device and analysis program | |
| JP7490840B2 (en) | Analysis device and analysis program | |
| JP6887767B2 (en) | Analytical equipment, ultrasonic diagnostic equipment and analysis program | |
| JP2021074535A (en) | Analyzer and ultrasound diagnostic device |
Legal Events
| Date | Code | Title | Description |
|---|---|---|---|
| A521 | Request for written amendment filed |
Free format text: JAPANESE INTERMEDIATE CODE: A523 Effective date: 20191028 |
|
| A621 | Written request for application examination |
Free format text: JAPANESE INTERMEDIATE CODE: A621 Effective date: 20191028 |
|
| A977 | Report on retrieval |
Free format text: JAPANESE INTERMEDIATE CODE: A971007 Effective date: 20200831 |
|
| A131 | Notification of reasons for refusal |
Free format text: JAPANESE INTERMEDIATE CODE: A131 Effective date: 20200908 |
|
| A521 | Request for written amendment filed |
Free format text: JAPANESE INTERMEDIATE CODE: A523 Effective date: 20201109 |
|
| A02 | Decision of refusal |
Free format text: JAPANESE INTERMEDIATE CODE: A02 Effective date: 20210224 |
|
| A521 | Request for written amendment filed |
Free format text: JAPANESE INTERMEDIATE CODE: A523 Effective date: 20210524 |
|
| C60 | Trial request (containing other claim documents, opposition documents) |
Free format text: JAPANESE INTERMEDIATE CODE: C60 Effective date: 20210524 |
|
| A911 | Transfer to examiner for re-examination before appeal (zenchi) |
Free format text: JAPANESE INTERMEDIATE CODE: A911 Effective date: 20210601 |
|
| C21 | Notice of transfer of a case for reconsideration by examiners before appeal proceedings |
Free format text: JAPANESE INTERMEDIATE CODE: C21 Effective date: 20210608 |
|
| A131 | Notification of reasons for refusal |
Free format text: JAPANESE INTERMEDIATE CODE: A131 Effective date: 20210817 |
|
| A521 | Request for written amendment filed |
Free format text: JAPANESE INTERMEDIATE CODE: A523 Effective date: 20211018 |
|
| TRDD | Decision of grant or rejection written | ||
| A01 | Written decision to grant a patent or to grant a registration (utility model) |
Free format text: JAPANESE INTERMEDIATE CODE: A01 Effective date: 20211102 |
|
| A61 | First payment of annual fees (during grant procedure) |
Free format text: JAPANESE INTERMEDIATE CODE: A61 Effective date: 20211201 |
|
| R150 | Certificate of patent or registration of utility model |
Ref document number: 6987496 Country of ref document: JP Free format text: JAPANESE INTERMEDIATE CODE: R150 |