JP6927770B2 - Plant operation support device and plant operation support method - Google Patents
Plant operation support device and plant operation support method Download PDFInfo
- Publication number
- JP6927770B2 JP6927770B2 JP2017133806A JP2017133806A JP6927770B2 JP 6927770 B2 JP6927770 B2 JP 6927770B2 JP 2017133806 A JP2017133806 A JP 2017133806A JP 2017133806 A JP2017133806 A JP 2017133806A JP 6927770 B2 JP6927770 B2 JP 6927770B2
- Authority
- JP
- Japan
- Prior art keywords
- data
- plant
- category
- operation data
- target
- Prior art date
- Legal status (The legal status is an assumption and is not a legal conclusion. Google has not performed a legal analysis and makes no representation as to the accuracy of the status listed.)
- Active
Links
Images


Classifications
-
- G—PHYSICS
- G05—CONTROLLING; REGULATING
- G05B—CONTROL OR REGULATING SYSTEMS IN GENERAL; FUNCTIONAL ELEMENTS OF SUCH SYSTEMS; MONITORING OR TESTING ARRANGEMENTS FOR SUCH SYSTEMS OR ELEMENTS
- G05B13/00—Adaptive control systems, i.e. systems automatically adjusting themselves to have a performance which is optimum according to some preassigned criterion
- G05B13/02—Adaptive control systems, i.e. systems automatically adjusting themselves to have a performance which is optimum according to some preassigned criterion electric
- G05B13/04—Adaptive control systems, i.e. systems automatically adjusting themselves to have a performance which is optimum according to some preassigned criterion electric involving the use of models or simulators
- G05B13/041—Adaptive control systems, i.e. systems automatically adjusting themselves to have a performance which is optimum according to some preassigned criterion electric involving the use of models or simulators in which a variable is automatically adjusted to optimise the performance
-
- G—PHYSICS
- G05—CONTROLLING; REGULATING
- G05B—CONTROL OR REGULATING SYSTEMS IN GENERAL; FUNCTIONAL ELEMENTS OF SUCH SYSTEMS; MONITORING OR TESTING ARRANGEMENTS FOR SUCH SYSTEMS OR ELEMENTS
- G05B13/00—Adaptive control systems, i.e. systems automatically adjusting themselves to have a performance which is optimum according to some preassigned criterion
- G05B13/02—Adaptive control systems, i.e. systems automatically adjusting themselves to have a performance which is optimum according to some preassigned criterion electric
- G05B13/0205—Adaptive control systems, i.e. systems automatically adjusting themselves to have a performance which is optimum according to some preassigned criterion electric not using a model or a simulator of the controlled system
- G05B13/021—Adaptive control systems, i.e. systems automatically adjusting themselves to have a performance which is optimum according to some preassigned criterion electric not using a model or a simulator of the controlled system in which a variable is automatically adjusted to optimise the performance
Landscapes
- Engineering & Computer Science (AREA)
- Health & Medical Sciences (AREA)
- Artificial Intelligence (AREA)
- Computer Vision & Pattern Recognition (AREA)
- Evolutionary Computation (AREA)
- Medical Informatics (AREA)
- Software Systems (AREA)
- Physics & Mathematics (AREA)
- General Physics & Mathematics (AREA)
- Automation & Control Theory (AREA)
- Testing And Monitoring For Control Systems (AREA)
Description
本発明は、プラント操作支援装置、および、プラント操作支援方法に関する。 The present invention relates to a plant operation support device and a plant operation support method.
発電プラントや化学プラント等のプラント制御装置には、目標となる製品を効率よく製造するための様々な機能が組み込まれている。最も一般的な制御機能は、プラントの状態量が目標値を満足するように制御するPID(Proportional-Integral-Differential)制御であり、様々なプラントの制御装置に実装されている。 Plant control devices such as power plants and chemical plants incorporate various functions for efficiently manufacturing target products. The most common control function is PID (Proportional-Integral-Differential) control that controls the state quantity of a plant so as to satisfy a target value, and is implemented in control devices of various plants.
また、近年では、プラントの運転状態や環境変化への対応のため、プラントの運転状態の将来値を予測し、現在から将来にわたる運転状態が制御目標値に対して最適となるように操作変数を決めるモデル予測制御が適用されている。ただし、操作変数が増加すると、操作変数間の相互作用の影響のため、所望の制御効果を得られない場合がある。そこで、特許文献1には、プラントのプロセスの時間因子に起因する操作変数間の相互作用を考慮したプラント制御装置が記載されている。
In recent years, in order to respond to changes in the operating state of the plant and the environment, the future value of the operating state of the plant is predicted, and the instrumental variables are set so that the operating state from the present to the future is optimal for the control target value. The model predictive control that determines is applied. However, when the manipulated variables increase, the desired control effect may not be obtained due to the influence of the interaction between the manipulated variables. Therefore,
しかしながら、経年変化したプラントや比較的新しいプロセスのプラントでは、なんらかの外乱により、プラントの状態が変化し、プラント効率や製品の収率が低下することがあるが、この場合、目標値までの制御特性の改善よりも、目標とするプラントの状態をいかに適切に設定するかが課題となる。
なお、特許文献1などの従来技術では、現在のプラントの運転状態を起点として、どのような運転状態を目標とすればよいかを決定する手段は、提供されていない。
However, in a plant that has changed over time or a plant with a relatively new process, the state of the plant may change due to some disturbance, and the plant efficiency and product yield may decrease. In this case, the control characteristics up to the target value. Rather than improving the above, the issue is how to properly set the target plant condition.
It should be noted that the prior art such as
そこで、本発明は、現在のプラントの運転状態を起点として、プラントを適切に運転させるための運転状態の目標を提示することを、主な課題とする。 Therefore, it is a main subject of the present invention to present a target of an operating state for properly operating the plant, starting from the operating state of the current plant.
前記課題を解決するために、本発明のプラント操作支援装置は、以下の特徴を有する。
本発明は、制御対象のプラントから計測されたデータ、および、前記プラントを制御するための入力データのうちの少なくとも1つのデータである運転データについて、その運転データの大小関係をもとにカテゴリに分類し、各カテゴリのプラント状態ごとに運転させることで得られるプラント性能を前記プラントの評価値として算出し、
n次元(n≧4)の各運転データのカテゴリをXY平面上にマッピングすることで、現在の運転データがマッピングされるXY平面上の第1位置から前記各運転データがマッピングされるXY平面上の第2位置までの距離を空間距離として算出し、
それぞれ算出した前記評価値および前記空間距離をもとに、目標とする運転データの候補を複数個抽出する目標抽出部と、
抽出された前記運転データの候補ごとに、前記現在の運転データから前記目標とする運転データへと至る操作内容を操作経路として、各候補の前記操作経路を通過する運転データから得られるプラント性能に応じて評価することで、採用する前記操作経路およびその操作経路の終点である前記目標とする運転データを決定する経路決定部と、
前記操作経路の始点となる前記運転データから前記目標とする運転データまでの前記操作経路を、マップデータとして表示する表示部とを有することを特徴とする。
その他の手段は、後記する。
In order to solve the above problems, the plant operation support device of the present invention has the following features.
The present invention classifies the data measured from the plant to be controlled and the operation data, which is at least one of the input data for controlling the plant, into categories based on the magnitude relationship of the operation data. classifying, plant performance obtained by causing the operation for each plant state of each category is calculated as the evaluation value of the plant,
By mapping each n-dimensional (n ≧ 4) operation data category on the XY plane, the operation data is mapped from the first position on the XY plane to which the current operation data is mapped on the XY plane . the distance to the second position is calculated as the spatial distance,
A target extraction unit that extracts a plurality of target driving data candidates based on the calculated evaluation value and the spatial distance, respectively.
For each of the extracted operation data candidates, the operation content from the current operation data to the target operation data is used as an operation path, and the plant performance obtained from the operation data passing through the operation path of each candidate is obtained. A route determination unit that determines the operation route to be adopted and the target operation data that is the end point of the operation route by evaluating according to the above.
It is characterized by having a display unit that displays the operation route from the operation data that is the start point of the operation path to the target operation data as map data.
Other means will be described later.
本発明によれば、現在のプラントの運転状態を起点として、プラントを適切に運転させるための運転状態の目標を提示することができる。 According to the present invention, it is possible to present a target of an operating state for properly operating a plant, starting from the operating state of the current plant.
以下、本発明の一実施形態を、図面を参照して詳細に説明する。 Hereinafter, an embodiment of the present invention will be described in detail with reference to the drawings.
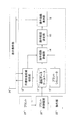
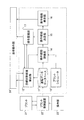
図1は、プラントシステムの構成図である。プラントシステムは、図2などのプラント21、プラント制御装置22、操作部23、プラント操作支援装置1、および表示操作部24からなる。
プラント21は、操作部23から入力される設定値データなどをもとに、プラント制御装置22により制御されている。プラント操作支援装置1は、操作部23を扱う運転員に対して、プラント21の操作内容の把握を支援させるための各種操作のガイダンスを表示操作部24に表示する。表示操作部24は、さらに、運転員からプラント操作支援装置1へのデータ入力を受け付ける。
FIG. 1 is a block diagram of a plant system. The plant system includes a plant 21 as shown in FIG. 2, a
The plant 21 is controlled by the
プラント操作支援装置1は、CPU(Central Processing Unit)と、メモリと、ハードディスクなどの記憶手段(記憶部)と、ネットワークインタフェースとを有するコンピュータとして構成される。
このコンピュータは、CPUが、メモリ上に読み込んだプログラム(アプリケーションや、その略のアプリとも呼ばれる)を実行することにより、各処理部により構成される制御部(制御手段)を動作させる。
プラント操作支援装置1は、運転データデータベース11、目標状態候補抽出部12、プラントシミュレータ13、操作経路評価部14、操作経路決定部15、操作経路表示部16からなる。これらのプラント操作支援装置1の各構成要素の詳細は、図3以降で明らかにする。
The plant
In this computer, the CPU operates a control unit (control means) composed of each processing unit by executing a program (also called an application or an abbreviation for application) read in the memory.
The plant
図2は、表示操作部24の画面に表示されるプラント21としての化学プラントの系統図の一例である。なお、以下では化学プラントを例示するが、発電プラントや医薬プラントなどでもよい。
系統図は、例えば系統図作成用CADソフトで作成された電子ファイルであり、系統図には、機器、接続配管、主要な計測機器が記載されている。系統図は、配管計装線図または、P&ID(Piping & Instrument Flow Diagram)とも呼ばれる。系統図には、機器としての反応器R1〜R4、機器間を接続する配管、計測器などの情報が記載されている。なお、図2で例示された28個の計測器にはF1,P1,T1などのタグがついており、Fが流量計、Pが圧力計、Tが温度計を示している。
FIG. 2 is an example of a system diagram of a chemical plant as a plant 21 displayed on the screen of the
The system diagram is, for example, an electronic file created by CAD software for creating a system diagram, and the system diagram describes equipment, connecting pipes, and major measuring instruments. The system diagram is also called a piping instrumentation diagram or a P & ID (Piping & Instrument Flow Diagram). In the system diagram, information on reactors R1 to R4 as equipment, piping connecting the equipment, measuring instruments, and the like is described. The 28 measuring instruments illustrated in FIG. 2 are tagged with F1, P1, T1, etc., where F is a flow meter, P is a pressure gauge, and T is a thermometer.
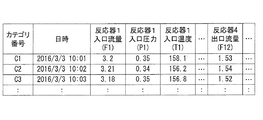
図3は、運転データデータベース11に格納されている運転データの例を示す。プラント制御装置22は、プラント21の運転データを収集し、運転データデータベース11に格納する。
「運転データ」は、プラント21に関する時系列データ(日時ごとのデータ)のパラメータ集合であり、例えば以下に例示するパラメータのうちの少なくとも1つのパラメータから構成される。
FIG. 3 shows an example of operation data stored in the
The "operation data" is a parameter set of time-series data (data for each date and time) relating to the plant 21, and is composed of at least one of the parameters illustrated below, for example.
運転データの一例として、プラント21のセンサなどの計測データは、例えば、プラントの構成機器の温度データ、圧力データ、流量データなどの状態データである。図3の例では、第1反応器入口流量、第1反応器入口圧力などのようにプラント21の各計測器で計測された計測データが、例えば1分間隔で保存されている。
なお、計測データは、プラント21の運転員が明示的に制御した場合だけでなく、なんらかの外乱により変化したプラント21の状態を示すデータとも言える。つまり、運転員が意図せずに、プラント性能が劣化した運転データに移行してしまうこともある。
As an example of the operation data, the measurement data of the sensor of the plant 21 is, for example, the state data such as the temperature data, the pressure data, and the flow rate data of the constituent equipment of the plant. In the example of FIG. 3, measurement data measured by each measuring instrument of the plant 21, such as the flow rate at the inlet of the first reactor and the pressure at the inlet of the first reactor, is stored, for example, at 1-minute intervals.
The measurement data can be said to be data indicating the state of the plant 21 changed due to some disturbance as well as the case where the operator of the plant 21 explicitly controls the data. That is, the operator may unintentionally shift to the operation data in which the plant performance has deteriorated.
運転データの別の一例として、プラント21の構成機器に対して入力されるデータは、例えば、バルブ開度などの操作量データ、制御信号の設定値データ、運転条件、操作条件、設定条件などの各種条件データである。これらの入力されるデータは、操作部23からプラント制御装置22を介してプラント21の構成機器に遠隔入力してもよいし、プラント21の運転員が現場で直接入力してもよい。
さらに、運転データデータベース11の各運転データは、個別のカテゴリ番号が与えられ、分類(カテゴライズ)されている。つまり、「カテゴリ」は、ある時点でのプラント21が取り得る運転データとも言える。
As another example of the operation data, the data input to the constituent equipment of the plant 21 includes, for example, operation amount data such as valve opening, setting value data of control signal, operation condition, operation condition, setting condition and the like. Various condition data. These input data may be remotely input from the
Further, each operation data of the
図4は、分類器により運転データをカテゴリ(カテゴリ番号、冒頭の「C」は図示省略)に分類する一例を示す説明図である。ここでは、分類器として、データクラスタリング技術の1つである適応共鳴理論(ART:Adaptive Resonance Theory)を用いた。分類器に入力する運転データは、通常4次元以上のデータであり、図3では28項目(次元)のデータを示した。一方、図4では説明用に単純化し、データ1,データ2という2次元の時系列データを分類する場合を例示する。
分類器は、データ1とデータ2とのデータ値の関係により、例えば以下のように運転データをカテゴリに分類する(カテゴライズする)。
カテゴリC1:データ1の値:大、データ2の値:小
カテゴリC2:データ1の値:中、データ2の値:小
カテゴリC3:データ1の値:中、データ2の値:大
カテゴリC4:データ1の値:小、データ2の値:大
FIG. 4 is an explanatory diagram showing an example of classifying operation data into categories (category numbers, “C” at the beginning is omitted) by a classifier. Here, as a classifier, Adaptive Resonance Theory (ART), which is one of the data clustering techniques, was used. The operation data to be input to the classifier is usually four-dimensional or more data, and in FIG. 3, 28 items (dimensions) of data are shown. On the other hand, FIG. 4 exemplifies a case where two-dimensional time series data of
The classifier classifies (categorizes) the operation data into categories as follows, for example, according to the relationship between the data values of the
Category C1:
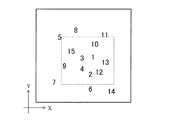
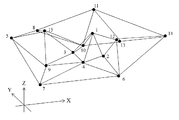
図5は、15個のカテゴリを2次元平面(XY平面)にマッピングした一例を示す。カテゴリ間の位置関係を把握しやすくする2次元平面へのマッピング結果を、以下では「カテゴリマップデータ(マップデータ)」と呼ぶ。カテゴリマップデータは、ナビゲーションシステムにおける地図のように用いられる。
ここでは、マッピングに多次元尺度法(MDS:Multi Dimensional Scaling)を利用した。MDSは、p次元の複数データについて、データ間の距離が与えられた場合に、その距離情報をq次元の空間上に再現するように座標を決定する方法である。p>qの場合、距離情報を必ずしも正確に再現できないが、およその位置関係を把握するには有効である。特に、q=2とすると、多次元空間上のデータの平面上にマッピングすることができるため、多次元データの可視化に利用できる。
FIG. 5 shows an example in which 15 categories are mapped to a two-dimensional plane (XY plane). The mapping result to the two-dimensional plane that makes it easy to grasp the positional relationship between categories is referred to as "category map data (map data)" below. Category map data is used like a map in a navigation system.
Here, Multi Dimensional Scaling (MDS) was used for mapping. MDS is a method of determining coordinates of a plurality of p-dimensional data so as to reproduce the distance information in a q-dimensional space when a distance between the data is given. When p> q, the distance information cannot always be reproduced accurately, but it is effective for grasping the approximate positional relationship. In particular, when q = 2, it can be used for visualization of multidimensional data because it can be mapped on a plane of data in multidimensional space.
図6は、カテゴリマップデータ上に設定される「操作経路」の説明図である。図5の破線四角部の拡大図に対して、カテゴリ4→3→1の順に通過する操作経路が矢印で示されている。操作経路は、ナビゲーションシステムにおける案内ルートに相当する。
以下、操作経路に着目したカテゴリの呼び方を定義する。
・「初期カテゴリ」は、操作経路を決定した時点の(出発地の)運転データの状態を示す。図6では初期カテゴリ=4である。
・「現在カテゴリ」は、初期カテゴリより後である現在地の運転データの状態を示す。図6では現在カテゴリ=3である。
・「目標カテゴリ」は、決定した操作経路における目標とする(目的地の)運転データの状態を示す。図6では目標カテゴリ=1である。
FIG. 6 is an explanatory diagram of an “operation route” set on the category map data. The operation path passing through the
In the following, we define how to call categories focusing on the operation path.
-The "initial category" indicates the state of the operation data (at the departure point) at the time when the operation route is determined. In FIG. 6, the initial category = 4.
-"Current category" indicates the state of the operation data of the current location after the initial category. In FIG. 6, the current category is 3.
-The "target category" indicates the state of the target (destination) driving data in the determined operation route. In FIG. 6, the target category = 1.
次に、現在カテゴリと操作経路との位置関係により、操作経路に対して現在カテゴリの移行度合いと、逸脱状態とを定義する。
現在カテゴリが操作経路に対して「逸脱状態」にあるとは、図6で現在カテゴリがカテゴリ=2に位置するなど、操作経路の矢印の線上から外れた状態を指す。一方、逸脱していない状態とは、操作経路の矢印の線上に現在カテゴリが位置する(カテゴリ=3など)状態である。
現在カテゴリの「移行度合い」は、例えば、操作経路の道のりに対する現在カテゴリの位置関係により定義される。例えば、現在カテゴリがカテゴリ3,4間の矢印上で、カテゴリ4から70%カテゴリ3に向かって進行中であるとき、カテゴリ4からカテゴリ3へ70%移行中である。このとき、初期カテゴリ(カテゴリ4)から現在カテゴリ(カテゴリ3へ70%移行中)までにかかった移行時間をもとに、今後現在カテゴリがカテゴリ3に100%移行完了する予定時刻を求めることができる。
Next, the degree of transition of the current category and the deviation state with respect to the operation path are defined by the positional relationship between the current category and the operation path.
The fact that the current category is in the "deviation state" with respect to the operation path means a state in which the current category is located at category = 2 in FIG. 6 and is out of the line of the arrow of the operation path. On the other hand, the state in which the deviation does not deviate is a state in which the category is currently located on the line of the arrow of the operation path (category = 3, etc.).
The "transition degree" of the current category is defined by, for example, the positional relationship of the current category with respect to the path of the operation route. For example, when the category is currently progressing from
また、「現在カテゴリを次のカテゴリに移行させる」とは、現在カテゴリが示す運転データの状態を、次のカテゴリが示す運転データの状態へと変化させるための、プラント21に対する各種操作である。
例えば、運転データがバルブ開度であるときは、現在カテゴリ(開度:40%)から次のカテゴリ(開度:60%)へと変化させるために、プラント21の運転員がバルブ開度を変更する。このバルブの開度変更作業が完了したとき、次のカテゴリへの移行が完了する。
一方、運転データが温度データであるときは、現在カテゴリ(温度120℃)から次のカテゴリ(温度150℃)へと変化させるために、操作部23から温度の設定値を150℃に変更し、制御信号がプラント21に送信される。その結果、加熱用蒸気量が増加し温度データが実際に150℃になったときに、次のカテゴリへの移行が完了する。
Further, "shifting the current category to the next category" is various operations on the plant 21 for changing the state of the operation data indicated by the current category to the state of the operation data indicated by the next category.
For example, when the operation data is the valve opening, the operator of the plant 21 changes the valve opening in order to change from the current category (opening: 40%) to the next category (opening: 60%). change. When the valve opening change work is completed, the transition to the next category is completed.
On the other hand, when the operation data is temperature data, the temperature setting value is changed from the
図1に戻り、目標状態候補抽出部12は、カテゴリごとのプラント性能値と、初期カテゴリを起点とした各カテゴリまでの距離とをもとに、目標カテゴリを抽出する。ここで、目標状態候補抽出部12は、抽出された目標カテゴリの候補が複数存在するときには、それらの候補から採用するものを1つ決定する。
Returning to FIG. 1, the target state
図7は、目標状態候補抽出部12の処理を示すフローチャートである。
S10(S11〜S14)は、目標状態候補抽出部12が図5のようなカテゴリマップデータを事前に用意する処理であり、運転データのカテゴリが更新される度に、実行される。
S11において、目標状態候補抽出部12は、図4で説明したように、図3の運転データを類似度に応じて、カテゴリに分類する。
S12において、目標状態候補抽出部12は、カテゴリごとの運転データの代表値を算出する。ここでは、各運転データの平均値を代表値とした。本実施例で用いた運転データは、図3に示す28項目である。例えば、カテゴリC1に含まれるデータが100点あったとすると、反応器1入口流量、反応器1入口圧力などの各項目毎に100点のデータの平均値を計算する。なお、本実施例では、代表値として平均値を採用したが、中央値など他の代表値を採用してもよい。
S13において、目標状態候補抽出部12は、図5で説明したように、S12の運転データの代表値を2次元平面(カテゴリマップデータ)にマッピングする。
FIG. 7 is a flowchart showing the processing of the target state
S10 (S11 to S14) is a process in which the target state
In S11, the target state
In S12, the target state
In S13, the target state
S14において、目標状態候補抽出部12は、各カテゴリに分類された運転データについて、プラント性能の平均値を算出する。本実施例では、プラント性能は、製品収率として、計算式「製品収率=K×F12/F1」で求めた。ここで、F12は、製品の流量である反応器4出口流量であり、F1は、反応器1入口流量である。また、Kは、理論式から求めた係数であり、理想的な運転データでは、製品収率が100%となる。
図8は、S14でのプラント性能の計算結果を示すテーブルである。15個のカテゴリC1〜C15に分類された各運転データについて、プラント性能である製品収率が各カテゴリの評価値として計算された。
そして、目標状態候補抽出部12は、カテゴリマップデータ内に点在する各カテゴリに対して、図8のような評価値を対応付ける。
In S14, the target state
FIG. 8 is a table showing the calculation result of the plant performance in S14. For each operation data classified into 15 categories C1 to C15, the product yield, which is the plant performance, was calculated as the evaluation value of each category.
Then, the target state
図7に戻り、S20(S21〜S23)は、目標状態候補抽出部12がS10で作成されたカテゴリマップデータ上に、新たに操作経路の目標カテゴリを設定する処理を示す。つまり、新たな操作経路の目標カテゴリは、現在の運転データの状態を基準(初期カテゴリ)として設定されるので、ユーザが目標カテゴリを設定したいときに、S20の処理が実行される。
S21において、目標状態候補抽出部12は、図4で説明した分類器を用いて、現在の運転データを分類する。その結果、初期カテゴリ(=カテゴリC4)が決定する。
S22において、目標状態候補抽出部12は、プラント性能が高いカテゴリをN個抽出する。
図9は、図8のプラント性能のテーブルから、プラント性能が高い順にN=5個のカテゴリを抽出した結果を示すテーブルである。
Returning to FIG. 7, S20 (S21 to S23) shows a process in which the target state
In S21, the target state
In S22, the target state
FIG. 9 is a table showing the results of extracting N = 5 categories in descending order of plant performance from the plant performance table of FIG.
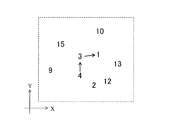
S23において、目標状態候補抽出部12は、S22で抽出した5個のカテゴリのうち、カテゴリマップデータ内の各カテゴリの配置を参照して、S21で設定した初期カテゴリとの間の距離(カテゴリの代表値間の距離)が近いM個のカテゴリを選択する。
ここでの「距離」とは、カテゴリAの運転データがマッピングされる多次元空間上の第1位置とカテゴリBの運転データがマッピングされる多次元空間上の第2位置との間の空間距離である。図5に示したカテゴリマップデータにおける各カテゴリ地点間の直線距離を、カテゴリ間の距離として用いると、多次元空間上の距離と若干の誤差が生じることもある。しかし、近似値でも大まかな傾向は一致するため、目標カテゴリの選択結果への影響は少ない(カテゴリの順位が入れ替わることは少ない)。
In S23, the target state
The "distance" here is the spatial distance between the first position on the multidimensional space to which the driving data of category A is mapped and the second position on the multidimensional space to which the driving data of category B is mapped. Is. When the linear distance between each category point in the category map data shown in FIG. 5 is used as the distance between categories, a slight error may occur with the distance in the multidimensional space. However, since the general tendency is the same even with the approximate value, the influence on the selection result of the target category is small (the order of the categories is rarely changed).
図10は、初期カテゴリ(=カテゴリC4)からの距離が近い順に、図9のテーブルのエントリをソートした結果である。M=3とすると、S23において、目標状態候補抽出部12は、カテゴリC14,C11,C15を目標カテゴリの候補として選択する。
以上説明したように、目標状態候補抽出部12は、S22でプラント性能が高いカテゴリを選択し、さらに、S23でカテゴリ間の距離が近いカテゴリを選択する。これにより、プラント21を高性能に運転させるとともに、運転状態変更に要する時間も短縮されるような、バランスのよい目標カテゴリを適切に選択することができる。
FIG. 10 shows the result of sorting the entries in the table of FIG. 9 in the order of the closest distance from the initial category (= category C4). Assuming that M = 3, in S23, the target state
As described above, the target state
図1に戻って、操作経路評価部14は、初期カテゴリを起点とし、目標状態候補抽出部12が抽出した目標カテゴリまでの操作経路について、予め定めた評価指標に基づき評価する。なお、評価指標は、運転コストや製品収率など計算可能なものであれば、任意に設定可能である。また、複数の評価指標を計算してもよい。操作経路の評価計算には、運転データデータベース11のデータを用いてもよいし、プラントシミュレータ13を用いてもよい。
Returning to FIG. 1, the operation
以下、S23で目標カテゴリの候補がカテゴリC1、C12、C15の3つに絞られている状態から、操作経路評価部14がプラントシミュレータ13を用いて各操作経路の製品収率を評価することで、操作経路決定部15が図6の操作経路(C4→C3→C1)を決定する一例を説明する。
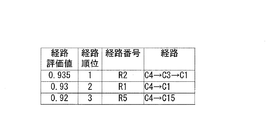
図11は、初期カテゴリ(=カテゴリC4)を出発地として、目標カテゴリの各候補(C1、C12、C15)に向かうまでの操作経路の組み合わせを示すテーブルである。例えば、カテゴリC4からカテゴリC1への経路は、直接カテゴリC1に行くケース(R1)と、カテゴリC3を経由してカテゴリC2に行くケース(R2)の2通りがある。同様にカテゴリC12に行くケースも2通りあり(R3,R4)、組み合わせの合計は、6通りとなる。
Hereinafter, from the state in which the target category candidates are narrowed down to three categories C1, C12, and C15 in S23, the operation
FIG. 11 is a table showing a combination of operation routes from the initial category (= category C4) to each candidate (C1, C12, C15) of the target category. For example, there are two routes from category C4 to category C1: a case of directly going to category C1 (R1) and a case of going to category C2 via category C3 (R2). Similarly, there are two cases of going to category C12 (R3, R4), and the total number of combinations is six.
プラントシミュレータ13は、プラント21の運転データをもとに、各操作経路の製品収率などのプラント性能値をプラント21の特性として模擬する動特性シミュレータである。プラントシミュレータ13では、まず、初期カテゴリであるカテゴリC4の状態で運転データを安定化させる。次に各操作経路のカテゴリC4から、矢印で接続される次のカテゴリまで、運転データを移行させる。プラントシミュレータ13は、現在カテゴリの運転データが各操作経路の終点である目標カテゴリで安定したところでシミュレーションを終了する。
The
なお、プラントシミュレータ13には、実プラントの制御ロジックが実装されているため、カテゴリ間の過渡状態も実プラントの挙動を模擬することができる。
例えば、操作経路R1では、初期カテゴリであるカテゴリC4から、次のカテゴリであるカテゴリC1への運転データの移行が安定すれば、模擬終了となる。一方、操作経路R2では、初期カテゴリであるカテゴリC4から、カテゴリC3の状態で安定化させ、次にカテゴリC1の状態に変更するというように2段階で運転データを変更する。
Since the control logic of the actual plant is implemented in the
For example, in the operation path R1, if the transfer of the operation data from the initial category C4 to the next category C1 is stable, the simulation ends. On the other hand, in the operation path R2, the operation data is changed in two steps, such as stabilizing the category C4, which is the initial category, in the state of the category C3, and then changing to the state of the category C1.
図12は、プラントシミュレータ13の模擬結果において2つのカテゴリ間の過渡状態を示すグラフである。運転データを変化させた場合、変更前のカテゴリから変更後のカテゴリまで、必ずしも線形に製品収率が変化するわけではない。一時的に製品の収率が低下するケース(実線グラフ)や、逆に比較的早い段階から製品の収率が上昇するケース(破線グラフ)がある。
プラントシミュレータ13では、このように各経路の製品収率を計算することができる。なお、評価指標として製品収率を計算したが、運転コストを計算してもよい。また、製品収率と運転コストという2つの評価指標を別々に計算し、それらの評価指標の重み付け平均などの複合的に考慮した複合指標を評価指標としてもよい。
FIG. 12 is a graph showing a transient state between two categories in the simulated result of the
In the
操作経路評価部14は、プラントシミュレータ13を用いる代わりに、運転データデータベース11に格納された過去の運転データを利用して、操作経路を評価してもよい。例えば、操作経路R1(C4→C1)を評価する場合、次のように計算する。
(手順1)運転データデータベース11の運転データのうちの所定期間内(例えば過去6ヶ月間)の運転データの中から、カテゴリC4→C1に遷移したデータを全て抽出する。運転データデータベース11は図3に示したように予めカテゴリ分けされているため、カテゴリC4→C1に遷移した4件の事例を高速に抽出できた。
(手順2)抽出した4件のデータに対し、評価指標を計算し、その平均値を求める。本実施例では、実際の運転データから製品収率を計算し、平均値を求めた。
このように過去の実際の運転データを利用して評価値を計算することで、プラントシミュレータ13よりも高い精度で評価値を求めることができる。ただし、操作経路の候補が常に過去の実績データに含まれるとは限らない。その場合は、プラントシミュレータ13を併用してもよい。
Instead of using the
(Procedure 1) From the operation data of the
(Procedure 2) For the four extracted data, calculate the evaluation index and calculate the average value. In this example, the product yield was calculated from the actual operation data, and the average value was obtained.
By calculating the evaluation value using the actual operation data in the past in this way, the evaluation value can be obtained with higher accuracy than that of the
図13は、操作経路決定部15が、操作経路評価部14で計算した評価指標(図11)に基づき操作経路を決定した結果を示すテーブルである。操作経路決定部15が決定する経路は最適な経路1つに限らず、評価値が高い順に複数の操作経路を決定してもよい。さらに、評価値が高い順に複数の操作経路の候補を表示し、運転員が1つの操作経路を選択してもよい。
ここでは、評価指標が製品収率のみであり、操作経路決定部15は、基本的には最も製品収率が高い候補を選べばよい。一方で、製品収率に大きな違いがなかった場合、例えば、最近の運転履歴や部品のメンテナンス情報を考慮して、操作経路決定部15は、経路を探索してもよい。また、評価指標が製品収率と運転コストのように複数ある場合、それらの複合指標のみで判断するのではなく、例えば運転コストを重視するなどの判断で、操作経路決定部15は、操作経路を選択してもよい。
FIG. 13 is a table showing the results of the operation
Here, the evaluation index is only the product yield, and the operation
操作経路表示部16は、操作経路決定部15で決定された操作経路を、表示操作部24にガイダンスとして表示する。操作経路の表示画面は、例えば、図6に示したように、カテゴリマップデータの一部に、選択した経路を矢印などで表示する画面である。そして、プラント21の運転員は、操作経路の表示画面に従い、現在カテゴリから目標カテゴリへと向かう操作経路に沿った運転データを操作部23に入力する。
これにより、プラント制御装置22がプラント21を最適に制御し、プラント性能を高く引き出すような運転データでプラント21を運用することができる。
The operation
As a result, the
図14は、図1のプラントシステムに操作監視部17を追加した場合の構成図である。
操作監視部17は、操作経路決定部15で決定した操作経路に沿って現在カテゴリから目標カテゴリに移行しているか否かを監視する。操作監視部17は、現在カテゴリに対するガイダンス情報として、現在カテゴリが操作経路から逸脱せずに順調に移行しているときには、その移行度合いを表示操作部24に表示させる。または、操作監視部17は、現在カテゴリが目標カテゴリに向かう操作経路から逸脱してしまったときには、その旨を表示操作部24に表示させる。
FIG. 14 is a configuration diagram when the
The
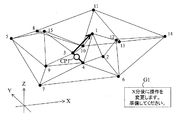
図15は、カテゴリマップデータの空間座標(XYZ軸)への拡張例を示す。目標状態候補抽出部12は、カテゴリマップデータのXY平面に対して、S14で計算した評価値をZ軸(高さ方向)に対応付ける。具体的には、カテゴリjに関し、XY平面上にマッピングされた平均値の座標が(Xj,Yj)、プラント性能の平均値をKjとすると、カテゴリとKPIの関係を、座標(Xj,Yj,Kj)で表す。
このように可視化することで、カテゴリ間の位置関係だけでなく、各カテゴリのプラント性能を直観的に把握することができる。
FIG. 15 shows an example of extension of the category map data to the spatial coordinates (XYZ axes). The target state
By visualizing in this way, it is possible to intuitively grasp not only the positional relationship between categories but also the plant performance of each category.
図16は、図15のカテゴリマップデータに対して、図6と同様に操作経路R2(カテゴリC4→C3→C1)を矢印で追加した場合の表示画面図である。図16のカテゴリマップデータではZ軸の位置が高くなるほどプラント性能値が向上するため、現在カテゴリに移行中でもどの程度プラント性能値が向上しつつあるのかを、直観的に把握することができる。 FIG. 16 is a display screen view when an operation path R2 (category C4 → C3 → C1) is added to the category map data of FIG. 15 with an arrow in the same manner as in FIG. In the category map data of FIG. 16, the higher the position of the Z axis, the higher the plant performance value. Therefore, it is possible to intuitively grasp how much the plant performance value is improving even during the transition to the category.
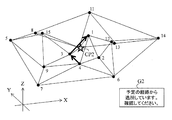
図17は、図16のカテゴリマップデータに対して、操作経路から逸脱していない現在カテゴリの位置情報CP1と、今後の操作に関するガイダンスG1とを追加した場合の表示画面図である。
本例は、一旦カテゴリC3になるように操作してから、さらに操作をしてカテゴリC1に変更する場合である。そのため、現在カテゴリがカテゴリC3に近づいた段階で、次にカテゴリC1に操作することを運転員にガイダンスG1で知らせる。前記したように、操作経路上の現在カテゴリの移行度合いから、現在カテゴリが次カテゴリC3に到着するまでの予想時間(X分)がわかる。よって、操作監視部17は、カテゴリC3→C1に移行させるように、X分後に操作を変更する旨を、ガイダンスG1として表示操作部24に表示させる。
このようにガイダンスを表示することで、運転員の操作ミスを防ぐことができる。なお、位置情報CP1を示すアイコンは、目立つように、各カテゴリのノードや、ノード間の線とは異なる表示形態にて(色を変えるなど強調して)、表示することが望ましい。
FIG. 17 is a display screen view when the position information CP1 of the current category that does not deviate from the operation path and the guidance G1 regarding future operations are added to the category map data of FIG.
This example is a case where the operation is once performed so as to be in the category C3, and then the operation is further performed to change to the category C1. Therefore, when the category is approaching the category C3 at present, the operator is notified by the guidance G1 that the category C1 will be operated next. As described above, the estimated time (X minutes) until the current category arrives at the next category C3 can be known from the degree of transition of the current category on the operation route. Therefore, the
By displaying the guidance in this way, it is possible to prevent an operator's operation error. It is desirable that the icon indicating the position information CP1 is displayed in a display form different from the nodes of each category and the lines between the nodes (emphasized by changing the color) so as to be conspicuous.
図18は、図16のカテゴリマップデータに対して、操作経路から逸脱してしまった現在カテゴリの位置情報CP2と、今後の操作に関するガイダンスG2とを追加した場合の表示画面図である。まず、操作監視部17は、逸脱していない位置情報CP1のアイコンを緑色の円マークで表示し、逸脱してしまった位置情報CP2のアイコンを赤色の星マークで表示するなど、逸脱の有無で表示形態を変えることで、運転員に逸脱した旨を知らせる。
さらに、操作監視部17は、「予定の経路から逸脱しています。確認してください」という警報のガイダンスG2を表示操作部24に表示させる。なお、図17、図18では、表示画面上にガイダンスを表示したが、音声ガイダンスまたは、音声と画面の両方のガイダンスを利用してもよい。
FIG. 18 is a display screen view when the position information CP2 of the current category deviating from the operation path and the guidance G2 regarding future operations are added to the category map data of FIG. First, the
Further, the
ここで、操作監視部17は、逸脱してしまった現在カテゴリについて、現在カテゴリを操作経路に復帰させるように運転員に指示してもよいし、現在カテゴリを起点(初期カテゴリ)として、新たな目標カテゴリと操作経路とを目標状態候補抽出部12に再計算(ナビゲーションシステムにおけるリルート)させてもよい(S20からの再計算)。これにより、逸脱してしまった古い操作経路にこだわらず、現時点を基準に、より適したプラント21の運用が可能となる。
Here, the
以上説明した本実施形態では、プラントの性能が低下した場合などで、目的となる運転データを目標カテゴリとして設定し、そこに至る最適な操作経路を決定することができるため、プラントを高効率に運用することができる。また、図17などのカテゴリマップデータの表示画面では、目標カテゴリに至る操作経路のうち、現在カテゴリがどの位置まで移行中なのかが可視化されている。これにより、運転員が現在の運転データをどのように更新すればよいかを把握することができる。 In the present embodiment described above, when the performance of the plant deteriorates, the target operation data can be set as the target category and the optimum operation route to reach the target category can be determined, so that the plant can be made highly efficient. It can be operated. Further, on the category map data display screen as shown in FIG. 17, it is visualized to what position the category is currently shifting among the operation paths leading to the target category. This makes it possible for the operator to understand how to update the current operation data.
なお、本発明は前記した実施例に限定されるものではなく、様々な変形例が含まれる。例えば、前記した実施例は本発明を分かりやすく説明するために詳細に説明したものであり、必ずしも説明した全ての構成を備えるものに限定されるものではない。
また、ある実施例の構成の一部を他の実施例の構成に置き換えることが可能であり、また、ある実施例の構成に他の実施例の構成を加えることも可能である。
また、各実施例の構成の一部について、他の構成の追加・削除・置換をすることが可能である。また、上記の各構成、機能、処理部、処理手段などは、それらの一部または全部を、例えば集積回路で設計するなどによりハードウェアで実現してもよい。
また、前記の各構成、機能などは、プロセッサがそれぞれの機能を実現するプログラムを解釈し、実行することによりソフトウェアで実現してもよい。
The present invention is not limited to the above-described embodiment, and includes various modifications. For example, the above-described embodiment has been described in detail in order to explain the present invention in an easy-to-understand manner, and is not necessarily limited to those having all the described configurations.
Further, it is possible to replace a part of the configuration of one embodiment with the configuration of another embodiment, and it is also possible to add the configuration of another embodiment to the configuration of one embodiment.
Further, it is possible to add / delete / replace a part of the configuration of each embodiment with another configuration. Further, each of the above configurations, functions, processing units, processing means and the like may be realized by hardware by designing a part or all of them by, for example, an integrated circuit.
Further, each of the above configurations, functions, and the like may be realized by software by the processor interpreting and executing a program that realizes each function.
各機能を実現するプログラム、テーブル、ファイルなどの情報は、メモリや、ハードディスク、SSD(Solid State Drive)などの記録装置、または、IC(Integrated Circuit)カード、SDカード、DVD(Digital Versatile Disc)などの記録媒体に置くことができる。
また、制御線や情報線は説明上必要と考えられるものを示しており、製品上必ずしも全ての制御線や情報線を示しているとは限らない。実際にはほとんど全ての構成が相互に接続されていると考えてもよい。
さらに、各装置を繋ぐ通信手段は、無線LANに限定せず、有線LANやその他の通信手段に変更してもよい。
Information such as programs, tables, and files that realize each function can be stored in memory, hard disks, recording devices such as SSDs (Solid State Drives), IC (Integrated Circuit) cards, SD cards, DVDs (Digital Versatile Discs), etc. Can be placed on the recording medium of.
In addition, control lines and information lines are shown as necessary for explanation, and not all control lines and information lines are necessarily shown in the product. In practice, it can be considered that almost all configurations are interconnected.
Further, the communication means for connecting each device is not limited to the wireless LAN, and may be changed to a wired LAN or other communication means.
1 プラント操作支援装置
11 運転データデータベース
12 目標状態候補抽出部(目標抽出部)
13 プラントシミュレータ
14 操作経路評価部(経路決定部)
15 操作経路決定部(経路決定部)
16 操作経路表示部
17 操作監視部
21 プラント
22 プラント制御装置
23 操作部
24 表示操作部(表示部)
1 Plant
13
15 Operation route determination unit (route determination unit)
16 Operation
Claims (7)
n次元(n≧4)の各運転データのカテゴリをXY平面上にマッピングすることで、現在の運転データがマッピングされるXY平面上の第1位置から前記各運転データがマッピングされるXY平面上の第2位置までの距離を空間距離として算出し、
それぞれ算出した前記評価値および前記空間距離をもとに、目標とする運転データの候補を複数個抽出する目標抽出部と、
抽出された前記運転データの候補ごとに、前記現在の運転データから前記目標とする運転データへと至る操作内容を操作経路として、各候補の前記操作経路を通過する運転データから得られるプラント性能に応じて評価することで、採用する前記操作経路およびその操作経路の終点である前記目標とする運転データを決定する経路決定部と、
前記操作経路の始点となる前記運転データから前記目標とする運転データまでの前記操作経路を、マップデータとして表示する表示部とを有することを特徴とする
プラント操作支援装置。 The data measured from the plant to be controlled and the operation data, which is at least one of the input data for controlling the plant, are classified into categories based on the magnitude relationship of the operation data, and each of them is classified into categories. plant performance obtained by causing the operation for each plant state category is calculated as the evaluation value of the plant,
By mapping each n-dimensional (n ≧ 4) operation data category on the XY plane, the operation data is mapped from the first position on the XY plane to which the current operation data is mapped on the XY plane . the distance to the second position is calculated as the spatial distance,
A target extraction unit that extracts a plurality of target driving data candidates based on the calculated evaluation value and the spatial distance, respectively.
For each of the extracted operation data candidates, the operation content from the current operation data to the target operation data is used as an operation path, and the plant performance obtained from the operation data passing through the operation path of each candidate is obtained. A route determination unit that determines the operation route to be adopted and the target operation data that is the end point of the operation route by evaluating according to the above.
A plant operation support device including a display unit that displays the operation route from the operation data that is the starting point of the operation path to the target operation data as map data.
請求項1に記載のプラント操作支援装置。 When the target extraction unit extracts a plurality of candidates for the target operation data based on the calculated evaluation value and the space distance, the target extraction unit extracts a predetermined number of the operation data in descending order of the calculated evaluation value. Is extracted as the first candidate set, a predetermined number of the operation data is extracted as the second candidate set in ascending order of the spatial distance from the first candidate set, and the second candidate set is used as the extraction result to determine the route. The plant operation support device according to claim 1, wherein the plant operation support device is characterized in that.
前記操作監視部は、前記表示部に表示させる前記マップデータ上に、前記現在の運転データを示す情報を追加で表示させることを特徴とする
請求項1または請求項2に記載のプラント操作支援装置。 The plant operation support device further has an operation monitoring unit, and has an operation monitoring unit.
The plant operation support device according to claim 1 or 2, wherein the operation monitoring unit additionally displays information indicating the current operation data on the map data to be displayed on the display unit. ..
請求項3に記載のプラント操作支援装置。 The operation monitoring unit displays the information indicating the current operation data on the display unit by changing the display form of the information indicating the current operation data depending on whether the current operation data deviates from the operation path or not. The plant operation support device according to claim 3, wherein the plant operation support device is provided.
請求項4に記載のプラント操作支援装置。 When the current operation data deviates from the operation path, the operation monitoring unit sets a new target operation data different from the deviating operation path to the target extraction unit. The plant operation support device according to claim 4, wherein the candidate is recalculated to update to a new operation path starting from the current operation data.
請求項1ないし請求項5のいずれか1項に記載のプラント操作支援装置。 The display unit, the projecting the representative value of each operation data to the XY plane, said as a three-dimensional graph of the evaluation value is a Z-axis of the plant to be operated for each operation data, display the said map data The plant operation support device according to any one of claims 1 to 5, characterized in that.
前記目標抽出部は、制御対象のプラントから計測されたデータ、および、前記プラントを制御するための入力データのうちの少なくとも1つのデータである運転データについて、その運転データの大小関係をもとにカテゴリに分類し、各カテゴリのプラント状態ごとに運転させることで得られるプラント性能を前記プラントの評価値として算出し、
n次元(n≧4)の各運転データのカテゴリをXY平面上にマッピングすることで、現在の運転データがマッピングされるXY平面上の第1位置から前記各運転データがマッピングされるXY平面上の第2位置までの距離を空間距離として算出し、
それぞれ算出した前記評価値および前記空間距離をもとに、目標とする運転データの候補を複数個抽出し、
前記経路決定部は、抽出された前記運転データの候補ごとに、前記現在の運転データから前記目標とする運転データへと至る操作内容を操作経路として、各候補の前記操作経路を通過する運転データから得られるプラント性能に応じて評価することで、採用する前記操作経路およびその操作経路の終点である前記目標とする運転データを決定し、
前記表示部は、前記操作経路の始点となる前記運転データから前記目標とする運転データまでの前記操作経路を、マップデータとして表示することを特徴とする
プラント操作支援方法。 The plant operation support device has a target extraction unit, a route determination unit, and a display unit.
The target extraction unit is based on the magnitude relationship of the operation data with respect to the data measured from the plant to be controlled and the operation data which is at least one of the input data for controlling the plant. categorize, plant performance obtained by causing operation calculated by the evaluation value of the plant for each plant state for each category,
By mapping each n-dimensional (n ≧ 4) operation data category on the XY plane, the operation data is mapped from the first position on the XY plane to which the current operation data is mapped on the XY plane . the distance to the second position is calculated as the spatial distance,
Based on the evaluated value and the spatial distance calculated respectively, a plurality of target driving data candidates are extracted.
For each of the extracted candidates for the operation data, the route determination unit uses the operation content from the current operation data to the target operation data as an operation path, and the operation data passing through the operation path of each candidate. By evaluating according to the plant performance obtained from, the operation path to be adopted and the target operation data which is the end point of the operation path are determined.
The display unit is a plant operation support method, characterized in that the operation route from the operation data which is the start point of the operation route to the target operation data is displayed as map data.
Priority Applications (3)
| Application Number | Priority Date | Filing Date | Title |
|---|---|---|---|
| JP2017133806A JP6927770B2 (en) | 2017-07-07 | 2017-07-07 | Plant operation support device and plant operation support method |
| MYPI2018001170A MY193844A (en) | 2017-07-07 | 2018-06-28 | Plant operation support system and plant operation support method |
| EP18180703.3A EP3441828A3 (en) | 2017-07-07 | 2018-06-29 | Plant operation support system and plant operation support method |
Applications Claiming Priority (1)
| Application Number | Priority Date | Filing Date | Title |
|---|---|---|---|
| JP2017133806A JP6927770B2 (en) | 2017-07-07 | 2017-07-07 | Plant operation support device and plant operation support method |
Publications (2)
| Publication Number | Publication Date |
|---|---|
| JP2019016214A JP2019016214A (en) | 2019-01-31 |
| JP6927770B2 true JP6927770B2 (en) | 2021-09-01 |
Family
ID=62837687
Family Applications (1)
| Application Number | Title | Priority Date | Filing Date |
|---|---|---|---|
| JP2017133806A Active JP6927770B2 (en) | 2017-07-07 | 2017-07-07 | Plant operation support device and plant operation support method |
Country Status (3)
| Country | Link |
|---|---|
| EP (1) | EP3441828A3 (en) |
| JP (1) | JP6927770B2 (en) |
| MY (1) | MY193844A (en) |
Families Citing this family (3)
| Publication number | Priority date | Publication date | Assignee | Title |
|---|---|---|---|---|
| US11327121B2 (en) * | 2019-04-03 | 2022-05-10 | Transportation Ip Holdings, Llc | Deviation detection system for energy storage system |
| JP7183131B2 (en) * | 2019-09-11 | 2022-12-05 | 日立造船株式会社 | Information processing device, driving support system, information processing method, and information processing program |
| US20230341827A1 (en) * | 2022-04-26 | 2023-10-26 | Transportation Ip Holdings, Llc | Shift detection system and method for a power supply system |
Family Cites Families (8)
| Publication number | Priority date | Publication date | Assignee | Title |
|---|---|---|---|---|
| JPS59127105A (en) * | 1983-01-10 | 1984-07-21 | Hitachi Ltd | Display device for operation guide of plant |
| US5155677A (en) * | 1989-11-21 | 1992-10-13 | International Business Machines Corporation | Manufacturing process optimizations |
| JP4043879B2 (en) * | 2002-07-24 | 2008-02-06 | 三菱電機株式会社 | Plant optimum operation control system |
| JP4600081B2 (en) * | 2005-02-24 | 2010-12-15 | 横河電機株式会社 | Operation support system and operation support method |
| JP5410480B2 (en) * | 2011-08-04 | 2014-02-05 | 株式会社日立製作所 | Plant control equipment |
| US20150356413A1 (en) * | 2013-01-17 | 2015-12-10 | Toyota Jidosha Kabushiki Kaisha | Plant control device |
| US20160231716A1 (en) * | 2015-02-10 | 2016-08-11 | General Electric Company | System of systems optimizing control for achieving performance and risk outcomes in physical and business operations of connected and interrelated industrial systems |
| EP3104240A1 (en) * | 2015-06-11 | 2016-12-14 | Siemens Aktiengesellschaft | Device and method for optimizing a working point for the operation of an installation |
-
2017
- 2017-07-07 JP JP2017133806A patent/JP6927770B2/en active Active
-
2018
- 2018-06-28 MY MYPI2018001170A patent/MY193844A/en unknown
- 2018-06-29 EP EP18180703.3A patent/EP3441828A3/en not_active Withdrawn
Also Published As
| Publication number | Publication date |
|---|---|
| EP3441828A2 (en) | 2019-02-13 |
| JP2019016214A (en) | 2019-01-31 |
| EP3441828A3 (en) | 2019-03-06 |
| MY193844A (en) | 2022-10-28 |
Similar Documents
| Publication | Publication Date | Title |
|---|---|---|
| US10534329B2 (en) | System and method for improving performance of a plant with a furnace | |
| EP3482261B1 (en) | Computer system and method for the dynamic construction and online deployment of an operation-centric first-principles process model for predictive analytics | |
| US10360217B2 (en) | Event based data collection, integration, and presentation | |
| JP5133681B2 (en) | Integrated configuration system for use in process plants | |
| JP5684941B1 (en) | Abnormal sign diagnostic apparatus and abnormal sign diagnostic method | |
| JP6682411B2 (en) | Plant status display device, plant status display system, and plant status display method | |
| JP6927770B2 (en) | Plant operation support device and plant operation support method | |
| JP6654119B2 (en) | Plant data display processing device and plant control system | |
| CN106164795B (en) | Optimization method for classified alarm | |
| CN111527459A (en) | Apparatus, method and program for identifying changes in plant models | |
| EP2827203B1 (en) | Method for generating plant topology model data | |
| CN110162743A (en) | A kind of data administering method based on k neighborhood nonlinear state Eq algorithm | |
| JP2016133879A (en) | Engineering support device, method and program | |
| JP6458157B2 (en) | Data analysis apparatus and analysis method | |
| JP7151312B2 (en) | control system | |
| EP3521960A1 (en) | Tag identification device, tag identification method, and non-transitory computer readable storage medium | |
| CN115081175A (en) | Analysis device, analysis method, and computer-readable medium having program recorded thereon | |
| JP6604455B1 (en) | Display control method, display control apparatus, and program | |
| JP2005070161A (en) | Simulation system for training | |
| JP2007057065A (en) | Apparatus and method for analyzing piping network | |
| JP7000266B2 (en) | Analysis flow creation system and analysis flow creation method | |
| WO2020075436A1 (en) | Predictive situation visualization device, predictive situation visualization method and predictive situation visualization program | |
| JP6586355B2 (en) | I / O list creation method, I / O list creation device | |
| JP6453073B2 (en) | Data input support device and data input support method | |
| JP2021192137A (en) | Quality influencing factor identification support device and method |
Legal Events
| Date | Code | Title | Description |
|---|---|---|---|
| A621 | Written request for application examination |
Free format text: JAPANESE INTERMEDIATE CODE: A621 Effective date: 20200226 |
|
| A977 | Report on retrieval |
Free format text: JAPANESE INTERMEDIATE CODE: A971007 Effective date: 20210203 |
|
| A131 | Notification of reasons for refusal |
Free format text: JAPANESE INTERMEDIATE CODE: A131 Effective date: 20210302 |
|
| A521 | Request for written amendment filed |
Free format text: JAPANESE INTERMEDIATE CODE: A523 Effective date: 20210423 |
|
| TRDD | Decision of grant or rejection written | ||
| A01 | Written decision to grant a patent or to grant a registration (utility model) |
Free format text: JAPANESE INTERMEDIATE CODE: A01 Effective date: 20210720 |
|
| A61 | First payment of annual fees (during grant procedure) |
Free format text: JAPANESE INTERMEDIATE CODE: A61 Effective date: 20210805 |
|
| R150 | Certificate of patent or registration of utility model |
Ref document number: 6927770 Country of ref document: JP Free format text: JAPANESE INTERMEDIATE CODE: R150 |