JP6810786B2 - Demand forecaster - Google Patents
Demand forecaster Download PDFInfo
- Publication number
- JP6810786B2 JP6810786B2 JP2019501089A JP2019501089A JP6810786B2 JP 6810786 B2 JP6810786 B2 JP 6810786B2 JP 2019501089 A JP2019501089 A JP 2019501089A JP 2019501089 A JP2019501089 A JP 2019501089A JP 6810786 B2 JP6810786 B2 JP 6810786B2
- Authority
- JP
- Japan
- Prior art keywords
- information
- demand
- people
- event
- prediction model
- Prior art date
- Legal status (The legal status is an assumption and is not a legal conclusion. Google has not performed a legal analysis and makes no representation as to the accuracy of the status listed.)
- Active
Links
- 238000000034 method Methods 0.000 description 28
- 238000004891 communication Methods 0.000 description 9
- 230000029305 taxis Effects 0.000 description 6
- 230000006870 function Effects 0.000 description 5
- 238000010295 mobile communication Methods 0.000 description 5
- 230000011664 signaling Effects 0.000 description 5
- 238000004364 calculation method Methods 0.000 description 4
- 238000001556 precipitation Methods 0.000 description 4
- 230000005540 biological transmission Effects 0.000 description 3
- 238000005516 engineering process Methods 0.000 description 3
- 230000005484 gravity Effects 0.000 description 3
- 230000014759 maintenance of location Effects 0.000 description 3
- 238000007796 conventional method Methods 0.000 description 2
- 238000010586 diagram Methods 0.000 description 2
- 239000000284 extract Substances 0.000 description 2
- 239000000523 sample Substances 0.000 description 2
- 238000007476 Maximum Likelihood Methods 0.000 description 1
- 230000033228 biological regulation Effects 0.000 description 1
- 239000003795 chemical substances by application Substances 0.000 description 1
- 238000009795 derivation Methods 0.000 description 1
- 239000000835 fiber Substances 0.000 description 1
- 230000033001 locomotion Effects 0.000 description 1
- 238000010801 machine learning Methods 0.000 description 1
- 239000006249 magnetic particle Substances 0.000 description 1
- 230000003287 optical effect Effects 0.000 description 1
- 230000000737 periodic effect Effects 0.000 description 1
- 230000002093 peripheral effect Effects 0.000 description 1
- 230000000717 retained effect Effects 0.000 description 1
- 230000036962 time dependent Effects 0.000 description 1
Images


Classifications
-
- G—PHYSICS
- G06—COMPUTING; CALCULATING OR COUNTING
- G06Q—INFORMATION AND COMMUNICATION TECHNOLOGY [ICT] SPECIALLY ADAPTED FOR ADMINISTRATIVE, COMMERCIAL, FINANCIAL, MANAGERIAL OR SUPERVISORY PURPOSES; SYSTEMS OR METHODS SPECIALLY ADAPTED FOR ADMINISTRATIVE, COMMERCIAL, FINANCIAL, MANAGERIAL OR SUPERVISORY PURPOSES, NOT OTHERWISE PROVIDED FOR
- G06Q30/00—Commerce
- G06Q30/02—Marketing; Price estimation or determination; Fundraising
- G06Q30/0201—Market modelling; Market analysis; Collecting market data
- G06Q30/0204—Market segmentation
- G06Q30/0205—Location or geographical consideration
-
- G—PHYSICS
- G06—COMPUTING; CALCULATING OR COUNTING
- G06Q—INFORMATION AND COMMUNICATION TECHNOLOGY [ICT] SPECIALLY ADAPTED FOR ADMINISTRATIVE, COMMERCIAL, FINANCIAL, MANAGERIAL OR SUPERVISORY PURPOSES; SYSTEMS OR METHODS SPECIALLY ADAPTED FOR ADMINISTRATIVE, COMMERCIAL, FINANCIAL, MANAGERIAL OR SUPERVISORY PURPOSES, NOT OTHERWISE PROVIDED FOR
- G06Q10/00—Administration; Management
- G06Q10/04—Forecasting or optimisation specially adapted for administrative or management purposes, e.g. linear programming or "cutting stock problem"
-
- G—PHYSICS
- G06—COMPUTING; CALCULATING OR COUNTING
- G06N—COMPUTING ARRANGEMENTS BASED ON SPECIFIC COMPUTATIONAL MODELS
- G06N20/00—Machine learning
-
- G—PHYSICS
- G06—COMPUTING; CALCULATING OR COUNTING
- G06N—COMPUTING ARRANGEMENTS BASED ON SPECIFIC COMPUTATIONAL MODELS
- G06N5/00—Computing arrangements using knowledge-based models
- G06N5/04—Inference or reasoning models
-
- G—PHYSICS
- G06—COMPUTING; CALCULATING OR COUNTING
- G06Q—INFORMATION AND COMMUNICATION TECHNOLOGY [ICT] SPECIALLY ADAPTED FOR ADMINISTRATIVE, COMMERCIAL, FINANCIAL, MANAGERIAL OR SUPERVISORY PURPOSES; SYSTEMS OR METHODS SPECIALLY ADAPTED FOR ADMINISTRATIVE, COMMERCIAL, FINANCIAL, MANAGERIAL OR SUPERVISORY PURPOSES, NOT OTHERWISE PROVIDED FOR
- G06Q10/00—Administration; Management
- G06Q10/06—Resources, workflows, human or project management; Enterprise or organisation planning; Enterprise or organisation modelling
- G06Q10/063—Operations research, analysis or management
- G06Q10/0631—Resource planning, allocation, distributing or scheduling for enterprises or organisations
-
- G—PHYSICS
- G06—COMPUTING; CALCULATING OR COUNTING
- G06Q—INFORMATION AND COMMUNICATION TECHNOLOGY [ICT] SPECIALLY ADAPTED FOR ADMINISTRATIVE, COMMERCIAL, FINANCIAL, MANAGERIAL OR SUPERVISORY PURPOSES; SYSTEMS OR METHODS SPECIALLY ADAPTED FOR ADMINISTRATIVE, COMMERCIAL, FINANCIAL, MANAGERIAL OR SUPERVISORY PURPOSES, NOT OTHERWISE PROVIDED FOR
- G06Q50/00—Information and communication technology [ICT] specially adapted for implementation of business processes of specific business sectors, e.g. utilities or tourism
- G06Q50/40—Business processes related to the transportation industry
-
- G—PHYSICS
- G08—SIGNALLING
- G08G—TRAFFIC CONTROL SYSTEMS
- G08G1/00—Traffic control systems for road vehicles
- G08G1/123—Traffic control systems for road vehicles indicating the position of vehicles, e.g. scheduled vehicles; Managing passenger vehicles circulating according to a fixed timetable, e.g. buses, trains, trams
Landscapes
- Engineering & Computer Science (AREA)
- Business, Economics & Management (AREA)
- Theoretical Computer Science (AREA)
- Strategic Management (AREA)
- Physics & Mathematics (AREA)
- General Physics & Mathematics (AREA)
- Human Resources & Organizations (AREA)
- Entrepreneurship & Innovation (AREA)
- Economics (AREA)
- Development Economics (AREA)
- General Business, Economics & Management (AREA)
- Marketing (AREA)
- Accounting & Taxation (AREA)
- Finance (AREA)
- Data Mining & Analysis (AREA)
- Software Systems (AREA)
- Game Theory and Decision Science (AREA)
- Tourism & Hospitality (AREA)
- Evolutionary Computation (AREA)
- Artificial Intelligence (AREA)
- Computing Systems (AREA)
- General Engineering & Computer Science (AREA)
- Mathematical Physics (AREA)
- Quality & Reliability (AREA)
- Operations Research (AREA)
- Medical Informatics (AREA)
- Computational Linguistics (AREA)
- Computer Vision & Pattern Recognition (AREA)
- Remote Sensing (AREA)
- Educational Administration (AREA)
- Radar, Positioning & Navigation (AREA)
- Health & Medical Sciences (AREA)
- General Health & Medical Sciences (AREA)
- Primary Health Care (AREA)
- Management, Administration, Business Operations System, And Electronic Commerce (AREA)
- Traffic Control Systems (AREA)
Description
本発明は、タクシー等の乗り物の位置に応じた需要予測を行う需要予測装置に関する。 The present invention relates to a demand forecasting device that forecasts demand according to the position of a vehicle such as a taxi.
従来から、位置に応じたタクシーの需要予測を行うことが提案されている。例えば、特許文献1には、イベント発生時の予測を行うため、場所、終了時刻、集客数、交通規制情報等のイベントに関する情報に基づいて、タクシーの配車需要の予測を行うことが示されている。
Conventionally, it has been proposed to forecast the demand for taxis according to the position. For example,
しかしながら、イベント発生時には、対象となる位置にいる人の数とタクシーの利用率とがイベント非発生時である定常(通常、日常)時とは異なることが考えられる。従って、特許文献1に示されているように単にイベントに関する情報を用いるだけでは、精度の高い需要予測ができないおそれがあった。
However, when an event occurs, it is possible that the number of people in the target position and the taxi utilization rate are different from those in the steady state (usually daily) when the event does not occur. Therefore, as shown in
本発明は、上記に鑑みてなされたものであり、イベント発生時等の、タクシー等の乗り物の利用のされ方が定常時と異なる非日常の場合であっても、精度の高い乗り物の需要予測を行うことができる需要予測装置を提供することを目的とする。 The present invention has been made in view of the above, and even in an extraordinary case where a vehicle such as a taxi is used differently from the normal state, such as when an event occurs, the demand forecast of the vehicle is highly accurate. It is an object of the present invention to provide a demand forecasting device capable of performing the above.
上記目的を達成するために、本発明の一実施形態に係る需要予測装置は、位置に応じた乗り物の需要予測を行う需要予測装置であって、複数の時刻における位置毎の人の数に係る情報を含む人数情報を取得する取得部と、取得部によって取得された人数情報に基づいて、需要予測に用いる予測モデルを決定する予測モデル決定部と、予測モデル決定部によって決定された予測モデルを用いて、取得部によって取得された人数情報から乗り物の需要予測を行う予測部と、予測部による需要予測の結果に応じた情報を出力する出力部と、を備え、複数の時刻における位置毎の人の数に係る情報を含む複数のモデル生成用人数情報、及び当該複数の時刻に対応する時刻における位置毎の乗り物の需要量を示す需要情報を取得し、取得したモデル生成用人数情報をクラスタリングして、クラスタリングによって得られたクラスタ毎にモデル生成用人数情報及び需要情報から予測モデルを生成する予測モデル生成部を更に備え、予測モデル決定部は、取得部によって取得された人数情報に基づいて、予測モデル生成部によって生成された複数の予測モデルから、需要予測に用いる予測モデルを決定する。 In order to achieve the above object, the demand forecasting device according to the embodiment of the present invention is a demand forecasting device that predicts the demand of a vehicle according to a position, and relates to the number of people at each position at a plurality of times. The acquisition unit that acquires the number of people information including information, the forecast model determination unit that determines the forecast model to be used for demand forecast based on the number of people information acquired by the acquisition unit, and the forecast model determined by the forecast model determination unit. It is equipped with a forecasting unit that predicts the demand for vehicles from the number of people information acquired by the acquisition unit and an output unit that outputs information according to the result of the demand forecast by the forecasting unit, and is provided for each position at a plurality of times. Acquires a plurality of model generation number information including information related to the number of people and demand information indicating the demand amount of the vehicle for each position at the time corresponding to the plurality of times, and clusters the acquired model generation number information. Then, each cluster obtained by clustering is further provided with a forecast model generation unit that generates a forecast model from model generation number information and demand information, and the forecast model determination unit is based on the number information acquired by the acquisition unit. , The forecast model used for demand forecast is determined from a plurality of forecast models generated by the forecast model generator .
本発明の一実施形態に係る需要予測装置では、時系列の人数情報に基づいて、需要予測に用いる予測モデルが決定されて、需要予測が行われる。従って、本発明の一実施形態に係る需要予測装置によれば、人数情報に応じたタクシー等の乗り物の利用のされ方が考慮された需要予測を行うことができる。即ち、本発明の一実施形態に係る需要予測装置によれば、非日常の場合であっても、単なるイベントの開催の考慮ではなく、実際の人数の変動に応じた精度の高い乗り物の需要予測を行うことができる。 In the demand forecasting device according to the embodiment of the present invention, a forecasting model used for demand forecasting is determined based on time-series number of people information, and demand forecasting is performed. Therefore, according to the demand forecasting device according to the embodiment of the present invention, it is possible to perform demand forecasting in consideration of how to use a vehicle such as a taxi according to the number of people information. That is, according to the demand forecasting device according to the embodiment of the present invention, even in an extraordinary case, the demand forecasting of vehicles with high accuracy according to the fluctuation of the actual number of people is not merely considered for holding an event. It can be performed.
本発明の一実施形態によれば、人数情報に応じたタクシー等の乗り物の利用のされ方が考慮された需要予測を行うことができる。即ち、本発明の一実施形態によれば、非日常の場合であっても、単なるイベントの開催の考慮ではなく、実際の人数の変動に応じた精度の高い乗り物の需要予測を行うことができる。 According to one embodiment of the present invention, it is possible to make a demand forecast in consideration of how a vehicle such as a taxi is used according to the number of people information. That is, according to one embodiment of the present invention, even in an extraordinary case, it is possible to predict the demand for a vehicle with high accuracy according to the fluctuation of the actual number of people, instead of simply considering the holding of the event. ..
以下、図面と共に本発明に係る需要予測装置の実施形態について詳細に説明する。なお、図面の説明においては同一要素には同一符号を付し、重複する説明を省略する。 Hereinafter, embodiments of the demand forecasting apparatus according to the present invention will be described in detail together with the drawings. In the description of the drawings, the same elements are designated by the same reference numerals, and duplicate description will be omitted.
図1に本実施形態に係る需要予測装置10を示す。需要予測装置10は、乗り物の位置に応じた需要予測を行う装置(システム)である。本実施形態では、乗り物は、タクシーであるものとする。タクシーの位置に応じた需要予測とは、どの位置でどの程度、タクシーの利用(乗車)が行われるかを予測するものである。本実施形態では、需要予測の対象となる領域を正方形のメッシュに区切り、メッシュ及び時刻毎にタクシーの利用がどの程度行われるかを予測する。メッシュは、例えば、一辺が500mとされる。時刻は、例えば、10分単位とされる。本実施形態における需要予測は、例えば、メッシュ毎に現時点から10分後にタクシーの利用がどの程度行われるかを予測する。但し、需要予測の単位は、必ずしも上記のものに限られない。需要予測装置10による需要予測の結果は、例えば、タクシーの営業者に提供され、いわゆる流し営業の場所の決定等に利用される。
FIG. 1 shows the
本実施形態では、需要予測装置10は、メッシュ及び時刻毎にイベントが発生しているか否かを検知して、イベントの発生を検知した場合のタクシーの需要予測を行う。即ち、需要予測装置10は、(日常需要予測では予測が困難な)イベント発生時という定常時と異なる非日常の場合のタクシーの需要予測を行う。本実施形態におけるイベントとは、人が多く集まるイベントであり、例えば、コンサート、展示会又はスポーツの試合等である。なお、本実施形態では、非日常の場合の例としてイベントの発生時を対象とするが、メッシュにおける人の状況が定常時と異なると考えられる状況であれば、イベントの発生時以外の突発的な事象の発生時を対象としてもよい。また、需要予測装置10は、非日常時のタクシーの需要予測に加えて、定常時のタクシーの需要予測を行うこととしてもよい。
In the present embodiment, the
需要予測装置10は、例えば、サーバ装置等のコンピュータを含んで構成される。需要予測装置10は、複数のコンピュータを含んで構成されていてもよい。需要予測装置10は、ネットワーク等を通じて、他の装置との間で情報の送受信を行えるようになっている。他の装置との間では、需要予測に用いられる情報、及び需要予測の結果を示す情報等の送受信が行われる。
The
引き続いて、本実施形態に係る需要予測装置10の機能を説明する。図1に示すように需要予測装置10は、予測モデル生成部11と、取得部12と、予測モデル決定部13と、予測部14と、出力部15とを備えて構成される。
Subsequently, the function of the
予測モデル生成部11は、需要予測に用いる複数の予測モデルを生成する機能部である。予測モデル生成部11は、複数の時刻におけるメッシュ毎の人の数に係る情報を含む複数のモデル生成用人数情報、及び当該複数の時刻に対応する時刻におけるメッシュ毎のタクシーの需要量を示す需要情報を取得する。予測モデル生成部11は、取得したモデル生成用人数情報をクラスタリングして、クラスタリングによって得られたクラスタ毎にモデル生成用人数情報及び需要情報から予測モデルを生成する。予測モデル生成部11は、モデル生成用人数情報から、複数の時刻毎のメッシュにおける人の流入を示す流入状態を特定し、特定した流入状態から予測モデルを生成に用いるモデル生成用人数情報の範囲を特定する。具体的には、予測モデル生成部11は、以下のように複数の予測モデルを生成する。
The forecast
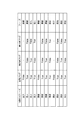
予測モデル生成部11は、時系列の情報であるメッシュ毎のモデル生成用人数情報、及び需要情報を取得する。予測モデル生成部11によって取得される情報の例を図2のテーブルに示す。図2のテーブルに示すように、予測モデル生成部11によって取得される情報は、メッシュコード、時間、各種の人口、気候及び乗車数が対応付けられた情報である。メッシュコードは、メッシュを特定する情報であり、例えば、9桁の文字列である。メッシュコードは、メッシュ毎に予め設定されている。時間は、時刻を示す情報であり、年月日時分によって表される。本実施形態では、メッシュと時刻との組み合わせをキューブと呼ぶ。図2の1つの行のデータが、1つのキューブのデータに相当する。
The prediction
各種の人口は、当該メッシュに位置している人の数である。各種の人口には、モデル人口、イベント人口、及びデモグラ(デモグラフィック、属性)が対応付いたイベント人口が含まれる。モデル人口は、当該メッシュに位置している人口である。イベント人口は、定常時(普段)との人口の差分の情報であり、例えば、当該メッシュのモデル人口から、前の週の同曜日の同時刻のモデル人口を引いた値である。デモグラは、例えば、性別、年代、居住地である。デモグラが対応付いたイベント人口は、性別であれば、当該メッシュの男性及び女性毎のイベント人口である。年代であれば、当該メッシュの若年(19歳以下)、壮年(20歳〜49歳)及び中高年(50歳以上)毎のイベント人口である。居住地であれば、当該メッシュを含む市区町村内(に居住地がある人)、特定の地域(例えば、東京23区)内(に居住地がある人)、及び特定の地域外(に居住地がある人)毎のイベント人口である。 The various populations are the number of people located in the mesh. Various populations include model populations, event populations, and event populations with demographics (demographics, attributes). The model population is the population located on the mesh. The event population is information on the difference in population from the normal time (normal), and is, for example, a value obtained by subtracting the model population of the same day of the previous week from the model population of the mesh. Demogras are, for example, gender, age, and place of residence. The event population to which Demogra corresponds is, in the case of gender, the event population for each male and female of the mesh. In terms of age, it is the event population for each young (19 years old or younger), middle-aged (20-49 years old) and middle-aged (50 years old or older) of the mesh. If it is a place of residence, it is within the municipality (people who have a place of residence) including the mesh, within a specific area (for example, the 23 wards of Tokyo) (people who have a place of residence), and outside a specific area (for people). It is the event population for each person who has a place of residence.
キューブの各種の人口の情報は、例えば、携帯電話機等の移動通信端末の位置を示す情報、及び当該移動通信端末のユーザの属性の情報に基づいて得ることができる。予測モデル生成部11は、例えば、移動体通信の通信事業者のサーバからキューブの各種の人口の情報を取得する。なお、キューブのモデル人口の情報を取得することができれば、イベント人口を算出することができるので、予測モデル生成部11は、移動体通信の通信事業者のサーバからキューブの各種のモデル人口の情報を取得して、各種のイベント人口を算出して取得することとしてもよい。本実施形態では、イベント人口に基づいた需要予測を行う。即ち、上記のモデル生成用人数情報は、メッシュ毎の人の数を示す値であるモデル人口と、所定の基準値である前の週の同曜日の同時刻のイベント人口との差分を示すイベント人口の情報である。
Information on various populations of the cube can be obtained, for example, based on information indicating the position of a mobile communication terminal such as a mobile phone and information on the attributes of the user of the mobile communication terminal. For example, the prediction
このように人口の差分を取っているのは、イベント時の情報として適切に扱うためである。対象となるメッシュ、あるいは近傍のメッシュにおいて、イベントが発生している場合には、定常時と比べてメッシュの人口が増加していると考えられる。差分を取ることで、定常時の人口の変化の影響を排除して、イベントの影響を反映させることができる。この趣旨から、差分は、前の週の同曜日の同時刻のモデル人口との差分ではなく、当該キューブのモデル人口の平均値との差分としてもよい。他にも、時系列の人口データを逐次的に学習、フィルタリングし、短期変動成分等をイベント人口としてもよい。 The reason for taking the difference in population in this way is to handle it appropriately as information at the time of the event. If an event occurs in the target mesh or a nearby mesh, it is considered that the population of the mesh has increased compared to the normal state. By taking the difference, it is possible to eliminate the influence of changes in the population during normal times and reflect the influence of the event. For this purpose, the difference may not be the difference from the model population at the same time on the same day of the previous week, but may be the difference from the average value of the model population of the cube. In addition, time-series population data may be sequentially learned and filtered, and short-term fluctuation components and the like may be used as the event population.
気候は、当該キューブにおける気候を示す情報であり、例えば、当該メッシュにおける時間降水量(mm/h)である。予測モデル生成部11は、例えば、気候の情報を提供しているサーバから時間降水量の情報を取得する。取得される時間降水量の情報は、上記のメッシュと異なる地域範囲の情報であってもよい。例えば、1km四方のメッシュの情報であってもよい。その場合、予測モデル生成部11は、当該情報から500m四方のメッシュの時間降水量を算出する。
The climate is information indicating the climate in the cube, for example, the hourly precipitation (mm / h) in the mesh. For example, the prediction
乗車数は、当該キューブにおけるタクシーの乗車数の実績値である。即ち、乗車数は、当該メッシュにおけるタクシーの需要量を示す需要情報である。予測モデル生成部11は、例えば、タクシーの営業者のサーバから乗車数の情報(タクシープローブ)を取得する。取得される乗車数の情報は、上記のメッシュと異なる地域範囲の情報であってもよい。例えば、100m四方のメッシュの情報であってもよい。その場合、予測モデル生成部11は、当該情報から500m四方のメッシュの乗車数を算出する。
The number of boarding is the actual value of the number of taxi boarding in the cube. That is, the number of passengers is demand information indicating the demand amount of taxis in the mesh. For example, the prediction
予測モデル生成部11は、一定時間間隔、例えば、10分毎の上記の情報を一定期間分、例えば、数カ月分取得する。
The prediction
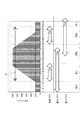
予測モデル生成部11は、取得した情報から、予測モデルの生成に用いる情報を抽出する。具体的には、予測モデル生成部11は、取得した情報のうち、イベントに係ると考えられる情報を、予測モデルの生成に用いる情報として抽出する。図3に、イベント発生時のイベント人口の例を示す。図3のグラフにおいて、横軸は時刻、縦軸はイベント人口をそれぞれ示している。当該メッシュ、あるいは近傍のメッシュにおいて、イベントが発生した場合、当該イベントに起因してメッシュの人口が増加する。イベントが発生した場合、イベントの経過に応じて、当該メッシュにおける人口が変動する。図3に示すように、当該変動は、流入(上昇、come)、滞留(平衡、stay)、流出(減少、go)のフェーズ(過程)を含む。本実施形態では、当該変動の一連のフェーズを1つのイベントセッションとして扱う。
The prediction
予測モデル生成部11は、取得した各キューブの情報が、イベントセッションを構成する情報であるか否かを判断する。まず、予測モデル生成部11は、各キューブの情報について、以下の2つの条件を満たすか否かを判断する。1つ目の条件は、イベント人口>イベント判定閾値(イベント人口)である。イベント判定閾値(イベント人口)は、予め設定されて予測モデル生成部11に記憶されており、例えば、1000である。2つ目の条件は、イベント人口/モデル人口=イベント人口比率>イベント判定閾値(人口比率)である。イベント判定閾値(人口比率)は、予め設定されて予測モデル生成部11に記憶されており、例えば、30%である。予測モデル生成部11は、上記の2つの条件を満たすキューブを、イベントセッションを構成する候補とする。また、予測モデル生成部11は、上記の2つの条件を満たすキューブ以降の一定期間、例えば12期分(2時間分)の同一のメッシュのキューブについても、イベントセッションを構成する候補とする。
The prediction
予測モデル生成部11は、イベントセッションを構成する候補としたキューブのうち、同一のメッシュの時刻が連続するキューブを一連のキューブとして扱う。予測モデル生成部11は、一連のキューブに対して、イベントを特定する情報であるイベントIDを付与する。イベントIDは、例えば、メッシュコード+一連のキューブの最も早い時刻(YYYY−MM−DD HH:MM)により設定される。予測モデル生成部11は、一連のキューブのうち、期間長が一定期間、例えば、12時間(72期)以上の一連のキューブを、ノイズデータとして排除する。
The prediction
予測モデル生成部11は、一連のキューブに含まれる各キューブについて、イベントセッションを構成するものであるか、及びイベントセッションのどのフェーズに該当するものであるかを判断する。予測モデル生成部11は、一連のキューブの先頭の(時刻が最も早い)キューブを、イベントセッションを構成するものとし、また、流入のフェーズに該当するものとする。予測モデル生成部11は、それ以降のキューブについて、以下のように、変動フラグ、最大値フラグ及び最小値フラグを算出する。
The prediction
予測モデル生成部11は、それ以降のキューブ毎に、当該キューブのイベント人口、及び同一のメッシュの当該キューブから12期遡ったキューブである過去12期のキューブのイベント人口から変動係数を算出する。変動係数は、(当該キューブ及び過去12期のキューブのイベント人口の標準偏差)/(当該キューブ及び過去12期のキューブのイベント人口の平均値)により算出される。予測モデル生成部11は、変動係数>変動閾値を満たすか否かを判断する。変動閾値は、予め設定されて予測モデル生成部11に記憶されており、例えば、0.09である。予測モデル生成部11は、上記の条件を満たすと判断した場合、当該キューブについて変動フラグをTrue(変動あり)に設定する。予測モデル生成部11は、上記の条件を満たさないと判断した場合、当該キューブについて変動フラグをFalseに設定する。
The prediction
予測モデル生成部11は、当該キューブのイベント人口≧過去12期のキューブのイベント人口の最大値を満たすか否かを判断する。予測モデル生成部11は、上記の条件を満たすと判断した場合、当該キューブについて最大値フラグをTrueに設定する。予測モデル生成部11は、上記の条件を満たさないと判断した場合、当該キューブについて最大値フラグをFalseに設定する。
The prediction
予測モデル生成部11は、当該キューブのイベント人口≦過去12期のキューブのイベント人口の最小値を満たすか否かを判断する。予測モデル生成部11は、上記の条件を満たすと判断した場合、当該キューブについて最小値フラグをTrueに設定する。予測モデル生成部11は、上記の条件を満たさないと判断した場合、当該キューブについて最小値フラグをFalseに設定する。
The prediction
予測モデル生成部11は、同一のメッシュにおける1つ前の時刻の(1期前)キューブのフェーズと、上記のように算出した変動フラグ、最大値フラグ及び最小値フラグとから、当該キューブのフェーズを特定する。当該フェーズの特定は、予め設定されて予測モデル生成部11に記憶されている図4に示すフェーズ推定ロジック表に基づいて行われる。図4に示すフェーズ推定ロジック表において、1列目は、1期前のキューブのフェーズを示している。2〜4列目は、特定対象となるキューブの変動フラグ、最大値フラグ及び最小値フラグを示している。5列目は、特定対象のキューブのフェーズを示している。
The prediction
予測モデル生成部11は、フェーズ推定ロジック表において、同一のメッシュにおける1つ前の時刻の(1期前)キューブのフェーズと、上記のように算出した変動フラグ、最大値フラグ及び最小値フラグとに相当するレコード(フェーズ推定ロジック表の行のデータ)の5列目のフェーズを、特定対象のキューブのフェーズと特定する。例えば、1期前のフェーズが流入であり、変動フラグがTrueであり、最大値フラグがFalseであり、最小値フラグがFalseであれば(フェーズ推定ロジック表の2行目のレコードに対応)、特定対象のキューブのフェーズは滞留と特定される。
In the phase estimation logic table, the prediction
予測モデル生成部11は、一連のキューブに含まれる各キューブについて、2番目のキューブから、順次、フェーズを特定する。予測モデル生成部11は、フェーズが終了と判断されたキューブの1つ前の時刻のキューブ(フェーズが流出であるキューブ)までをイベントセッションを構成するものとする。予測モデル生成部11は、一連のキューブ全てについて、上記のようにイベントセッションを構成するキューブを特定する。イベントセッションを構成するキューブの情報をイベントデータと呼ぶ。図3のイベント人口のグラフに、各時刻におけるフェーズ及びイベントセッションを構成するキューブの時刻の範囲(イベントデータの範囲)Rを示す。
The prediction
予測モデル生成部11は、イベントデータに含まれるキューブに対して、セッション時刻ラベルを付与する。予測モデル生成部11は、セッション時刻ラベルとして、イベントデータに含まれるキューブのうち最も時刻が早いものから順番に1からの整数を付与する。セッション時刻ラベルが付与されたイベントデータの例を、図5に示す。
The prediction
予測モデル生成部11は、イベントデータのクラスタリングを行う。クラスタリングでは、1つのイベントセッションを構成するとされたイベントデータをひとまとまりのデータとして扱い、それらをクラスタリングする。クラスタリングは、段階的に行われる。図6に、このクラスタリングを概念的に示す。予測モデル生成部11は、イベントデータをイベントセッションの期間長(イベントデータに含まれるキューブ(時刻)の数)毎に分ける。図6におけるts,length=2は、イベントセッションの期間長が2のイベントデータの集合を示し、ts,length=Nは、イベントセッションの期間長がNのイベントデータの集合を示している。The prediction
予測モデル生成部11は、各イベントデータについて、クラスタリングを行うためのデモグラ比率データを算出する。デモグラ比率データは、例えば、男性人口比率、若年人口比率、壮年人口比率及び市区町村内人口比率である。予測モデル生成部11は、上記の各人口比率を、イベントデータに含まれる各キューブのデモグラに対応付けられたイベント人口の総和を、各キューブのイベント人口の総和で割ることで算出する。
The prediction
予測モデル生成部11は、イベントデータの時系列のイベント人口であるイベント人口波形に基づいて、イベントセッションの期間長毎にイベントデータをクラスタリングする(図6の(a)イベント人口波形によるクラスタリングに相当)。予測モデル生成部11は、例えば、階層的手法であるウォード法を用いてクラスタリングする。具体的には、2つのクラスタを併合したとき、群内平方和の増加量が最小となるデータを集合する。
The prediction
予測モデル生成部11は、デモグラ比率データに基づいて、上記のクラスタリングによって得られたクラスタに含まれるイベントデータを更にクラスタリングする(図6の(b)デモグラ比率によるクラスタリングに相当)。予測モデル生成部11は、例えば、上記のクラスタリングと同様に階層的手法であるウォード法を用いてクラスタリングする。なお、上記のそれぞれのクラスタリングは、必ずしもウォード法で行われる必要はなく、任意のクラスタリング手法を用いることができる。
The prediction
予測モデル生成部11は、上記のクラスタリングによって得られたクラスタ毎にイベントデータから予測モデルを生成する。予測モデルは、例えば、イベントセッションの途中の時刻までのイベントデータ(説明変数)から、当該時刻のうちの最新の時刻の次の時刻の乗車数(目的変数)を予測するものである。即ち、予測モデルは、イベントセッションのn期(nは、イベントセッションの時刻の数)までのデータ(説明変数)から、n+1期の乗車数(目的変数)を予測する予測モデルである。予測モデル生成部11は、1つのクラスタについて、どの時刻までのデータが得られているかに応じた複数の予測モデルを生成する。即ち、予測モデル生成部11は、イベントセッションの各時刻について、予測モデルを生成する。なお、予測モデル作成の際の時刻としては、セッション時刻ラベルの値が用いられる。予測モデル生成部11は、例えば、機械学習によって予測モデルを生成する。
The prediction
予測モデルは、具体的には例えば、以下を説明変数として、対象メッシュにおける対象時刻の乗車数を予測するモデルである。説明変数としては、イベント人口データ、人口差分データ、前期乗車数データ、気候データ、及びデモグラパターンデータである。イベント人口データは、対象メッシュにおける対象時刻1期前でのイベント人口である。人口差分データは、対象メッシュにおける対象時刻1期前でのイベント人口−対象メッシュにおける対象時刻2期前でのイベント人口により得られる値である。前期乗車数データは、対象メッシュにおける対象時刻1期前での乗車数である。気候データは、対象メッシュにおける対象時刻1期前での気候の値である。デモグラパターンデータは、対象メッシュにおける対象時刻1期前でのデモグラ毎のイベント人口の比率である。例えば、男性比率であれば、対象メッシュにおけるイベントセッション開始から対象時刻1期前までの男性イベント人口数の総和/対象メッシュにおけるイベントセッション開始から対象時刻1期前までの総イベント人口の総和である。このデモグラパターンデータは、全てのデモグラについての値が用いられてもよい。また、男性×若年といった異なる2つの種別のデモグラの組み合わせ毎のイベント人口の比率、及び男性×若年×市区町村内といった異なる3つの種別のデモグラの組み合わせ毎のイベント人口の比率が用いられてもよい。 Specifically, for example, the prediction model is a model that predicts the number of passengers at the target time in the target mesh using the following as explanatory variables. The explanatory variables are event population data, population difference data, previous term passenger number data, climate data, and demogra pattern data. The event population data is the event population one period before the target time in the target mesh. The population difference data is a value obtained by the event population in the target mesh one period before the target time-the event population in the target mesh two periods before the target time. The number of passengers in the previous period is the number of passengers in the target mesh one period before the target time. The climate data is the value of the climate in the target mesh one period before the target time. The demogra pattern data is the ratio of the event population for each demogra in the target mesh one period before the target time. For example, in the case of the male ratio, it is the total number of male event populations from the start of the event session in the target mesh to one period before the target time / the total number of total event populations from the start of the event session in the target mesh to one period before the target time. .. For this demogra pattern data, values for all demogras may be used. Also, even if the ratio of the event population for each combination of two different types of demogras such as male x youth and the ratio of the event population for each combination of three different types of demogras such as male x youth x municipality are used. Good.
予測モデル生成部11は、例えば、一般線形モデル(General Linear Model)を用いて、クラスタ毎に説明変数となるイベントデータに基づく値から最尤推定で各説明変数の係数であるモデル係数を算出して、予測モデルを生成する。
For example, the prediction
また、予測モデル生成部11は、ステップワイズ手法を用いた説明変数の選択を行ってもよい。即ち、予測モデル生成部11は、イベント人口データ、人口差分データ、前期乗車数データ及び気候データを必須の説明変数とした予測モデルに、デモグラパターンデータを1つずつ説明変数として加えた予測モデルを用いて、AIC(赤池情報量規準)で最も適切なデモグラパターンデータを説明変数として採用してもよい。
Further, the prediction
なお、上記の予測モデルは、イベントセッションの途中の時刻までのイベントデータ(説明変数)から、1期後の時刻の乗車数(目的変数)を予測するものであったが、それ以降、即ち2期後以降の時刻の乗車数(目的変数)を予測するものであってもよい。また、デモグラパターンデータ以外の説明変数に相当するデータについて、上記の例のように、イベントデータに基づく値のうち、対象時刻1期前及び対象時刻2期前のデータだけではなく、イベントセッションの途中の時刻までのイベントデータ全てが用いられてもよい。また、上記の例以外のデータが、説明変数として用いられてもよい。また、予測モデルは、クラスタ毎のイベントデータが用いられて作成されるものであれば、上記の方法以外の方法によって生成される上記以外の予測モデルであってもよい。 In addition, the above prediction model predicts the number of passengers (objective variable) at the time one period later from the event data (explanatory variable) up to the time in the middle of the event session, but after that, that is, 2 It may predict the number of passengers (objective variable) at the time after the period. Further, regarding the data corresponding to the explanatory variables other than the demogra pattern data, as in the above example, among the values based on the event data, not only the data one period before the target time and the data two periods before the target time, but also the event session. All event data up to the time in the middle of is may be used. In addition, data other than the above example may be used as an explanatory variable. Further, the prediction model may be a prediction model other than the above, which is generated by a method other than the above method, as long as it is created by using the event data for each cluster.
予測モデル生成部11は、クラスタ毎に代表データ及び閾値データを生成する。代表データは、各クラスタの重心データである。閾値データは、各クラスタの重心(代表データ)と離れる最大距離を算出するために用意するデータである。代表データ及び閾値データは、需要予測を行う予測モデル(クラスタ)の決定の際に用いられる。
The prediction
予測モデル生成部11は、イベントデータのクラスタリングに用いたデータ、即ち、時系列のイベント人口(イベント人口波形)及びデモグラ比率データの項目毎の値の平均(重心)を算出して代表データとする。即ち、同クラスタに所属するイベントデータのクラスタリングに用いたデータの項目毎の合計値/クラスタに含まれるイベントデータ数(イベントセッション数)の値を代表データとする。なお、イベント人口の平均は、時刻(セッション時刻ラベル)毎に算出される。クラスタに含まれるイベントデータが1つ(サンプル数1)であったら、当該1つのイベントデータに係るデータが代表データとなる。クラスタに含まれるイベントデータが2つ以上(サンプル数2以上)であったら、当該2つ以上のイベントデータに係るデータの平均が代表データとなる。予測モデル生成部11は、各項目の代表データの値+項目毎の標準偏差×2の値を算出して閾値データとする。
The prediction
予測モデル生成部11は、生成した情報を需要予測装置10に記憶させ、予測の際に予測モデル決定部13及び予測部14によって利用可能にする。なお、生成した情報について、何れのクラスタに係るものであるか識別子を設定する等して識別できるようにしておく。
The prediction
予測モデル生成部11によって生成されたクラスタ毎の予測モデルについて、予測モデルの生成に用いた情報等から予測精度の検証を行って、十分な精度で予測できたもののみを需要予測に用いる予測モデルとして採用することとしてもよい。
For each cluster of forecast models generated by the forecast
取得部12は、需要予測装置10においてタクシーの需要予測が行われる際に、複数の時刻におけるメッシュ毎の人の数に係る情報を含む人数情報を取得する機能部である。取得部12は、メッシュ毎の人の属性を示す情報を含む人数情報を取得する。取得部12は、複数の時刻におけるメッシュ毎の人の数を示す値と所定の基準値との差分を示す情報を人の数に係る情報として含む人数情報を取得する。具体的には、取得部12は、以下のように人数情報を取得する。
The
取得部12は、時系列の情報であるメッシュ毎の人数情報を取得する。取得部12によって取得される人数情報は、モデル生成用人数情報と同様の形式の情報である。取得部12は、予測モデル生成部11によるモデル生成用人数情報の取得と同様の方法で、人数情報を取得する。但し、人数情報は、上記の通り、タクシーの需要予測に用いられる情報であるため、リアルタイムの、あるいはリアルタイムに近い人数情報が取得される。また、人数情報には、未来の時刻等におけるメッシュ毎の予測された人口に係る情報が含まれていてもよい。当該予測は、例えば、予測対象となる時刻以前の人口の履歴等に基づいて、従来の方法によって行われる。当該予測は、需要予測装置10において行われてもよいし、その他の装置において行われてもよい。また、予測された人数情報を用いる場合には、需要予測に用いられる以下のその他の情報についても、従来の方法あるいは本実施形態に係る方法によって予測された情報が用いられてもよい。また、取得部12は、人数情報以外にも需要予測に用いられる情報を取得する。例えば、取得部12は、当該情報として、時刻毎のメッシュにおける気候を示す情報、及びタクシーの乗車数の実績値を取得する。即ち、取得部12は、図2に示す形式と同様の情報を取得する。取得部12は、取得した情報を予測モデル決定部13に出力する。
The
予測モデル決定部13は、取得部12によって取得された人数情報に基づいて、予測モデル生成部11によって生成された複数の予測モデルから、需要予測に用いる予測モデルを決定する機能部である。予測モデル決定部13は、人数情報から、複数の時刻毎のメッシュにおける人の流入を示す流入状態を特定し、特定した流入状態から予測モデルの決定及び需要予測に用いる人数情報の範囲を特定する。具体的には、予測モデル決定部13は、以下のように需要予測に用いる予測モデルを決定する。
The forecast
予測モデル決定部13は、取得部12から情報を入力する。予測モデル決定部13は、取得部12から入力した取得した各キューブの情報が、イベントセッションを構成するものであるか否かを判断する。当該判断は、予測モデル生成部11の判断と同様に行われる。
The prediction
予測モデル決定部13によって、最新の時刻に係るキューブのフェーズが滞留と判断されたら、それ以降、需要予測装置10において、イベントセッションを構成するそこまでのイベントデータが用いられて次の時刻(例えば、10分後の時刻)の当該メッシュにおけるタクシーの需要予測が行われる。このタイミングでタクシーの需要予測が行われるのは、メッシュの人口のフェーズが滞留から流出である期間が、タクシーの需要が多くなると考えられるからである。
When the prediction
予測モデル決定部13は、最新の時刻に係るキューブのフェーズが滞留と判断されたら、イベントセッションを構成するそこまでのイベントデータから、上記のクラスタリングに用いたデータと同様の形式のデータ、即ち、時系列のイベント人口(イベント人口波形)及びデモグラ比率データを生成(用意)する。
When the prediction
予測モデル決定部13は、生成したデータを用いて、当該イベントデータがどのクラスタに所属するものであるか判断する。即ち、予測モデル決定部13は、どのクラスタの予測モデルを需要予測に用いるか決定する。具体的には、予測モデル決定部13は、生成したデータと、各クラスタの代表データとの距離を算出する。例えば、当該距離は、ウォード法の計算式を用いて算出される。即ち、距離=(クラスタサンプル数/(1+クラスタサンプル数))×(生成したデータとクラスタの代表データとのユークリッド距離)を算出する。なお、距離の算出の際に用いるクラスタの代表データのうち、イベント人口は、セッション時刻ラベルの先頭から、生成したデータのイベントセッションの期間長分のみのデータが用いられる。生成したデータと各クラスタの代表データとのデータ数が同じ、即ち、同数の要素数のベクトルとなる。以下の距離の算出についても、同様である。
The prediction
予測モデル決定部13は、算出した距離が最も短いクラスタを、当該イベントデータが所属する候補となるクラスタとする。続いて、予測モデル決定部13は、生成したデータと、当該候補としたクラスタの閾値データとの距離を算出する。例えば、当該距離は、生成したデータとクラスタの閾値データとのユークリッド距離とする。予測モデル決定部13は、算出した距離を閾値として、生成したデータと候補としたクラスタの代表データとの距離である最短距離と比較する。比較の結果、最短距離≦閾値であった場合には、予測モデル決定部13は、当該イベントデータが当該クラスタに所属するものであると判断する。この場合、当該クラスタの予測モデルが用いられて、需要予測が行われる。即ち、所属するクラスタを判断することが、需要予測に用いる予測モデルを決定することに相当する。予測モデル決定部13は、イベントデータを予測部14に出力すると共に当該クラスタを通知する。
The prediction
比較の結果、最短距離>閾値であった場合には、予測モデル決定部13は、当該イベントデータが所属するクラスタはないと判断する。この場合、クラスタの予測モデルが用いられた需要予測は行われない。上記の閾値を用いた判断は、イベントデータが、クラスタの予測モデルを用いて需要予測を行ってよいほど、クラスタに近いかを判断するためのものである。
As a result of the comparison, if the shortest distance> the threshold value, the prediction
予測部14は、予測モデル決定部13によって決定された予測モデルを用いて、取得部12によって取得された人数情報からタクシーの需要予測を行う機能部である。予測部14は、予測モデル決定部13からイベントデータを入力すると共にクラスタの通知を受ける。予測部14は、通知されたクラスタの予測モデルを読み出す。読み出される予測モデルは、イベントデータの最新時刻に相当するセッション時刻ラベルの次の時刻(セッション時刻ラベル)の乗車数を予測するためのものである。
The
予測部14は、予測モデル決定部13から入力したイベントデータから、予測モデルに入力する説明変数となる値を生成(用意)する。これらの値は、イベントデータの最新時刻の次の時刻の乗車数を予測するためのものである。具体的には、これらの値は、イベント人口データ、人口差分データ、前期乗車数データ、気候データ、及びデモグラパターンデータである。イベント人口データは、対象メッシュにおける最新の時刻でのイベント人口である。人口差分データは、対象メッシュにおける最新時刻でのイベント人口−対象メッシュにおける最新時刻1期前でのイベント人口により得られる値である。未来の時刻における人口を予測できる場合には、当該未来の時刻を最新時刻としてもよい。前期乗車数データは、対象メッシュにおける最新時刻での乗車数である。気候データは、対象メッシュにおける最新時刻での気候の値である。デモグラパターンデータは、対象メッシュにおける最新時刻でのデモグラ毎のイベント人口の比率である。デモグラパターンデータは、予測モデルにおいて説明変数として採用されているもののみが生成されればよい。
The
予測部14は、これらの値を読み出した予測モデルに入力して、乗車数を算出する。予測部14は、算出した乗車数、並びに予測対象となったメッシュ及び時刻を示す情報を需要予測の結果として、出力部15に出力する。この際、あわせて、イベントID、イベントデータの最新時刻におけるフェーズ、セッション時刻ラベル及びイベントデータが所属するクラスタ(人口波形クラスタ、デモグラ比率クラスタ)を示す情報を出力してもよい。
The
出力部15は、予測部14による需要予測の結果に応じた情報を出力する機能部である。出力部15は、予測部14から予測結果に係る情報を入力する。例えば、出力部15は、例えば、予測部14から入力した情報をタクシーの営業者の端末に送信して出力する。あるいは、出力部15は、予測された乗車数が一定以上のメッシュの情報をタクシーの営業者の端末に送信する等してもよい。なお、出力部15による出力は上記に限られず、任意の出力を行うことができる。以上が、需要予測装置10の機能である。
The
引き続いて、図7及び図8のフローチャートを用いて、本実施形態に係る需要予測装置10で実行される処理(需要予測装置10が行う動作方法)を説明する。まず、図7のフローチャートを用いて、予測モデルが生成される際の処理を説明する。
Subsequently, the processing executed by the
本処理では、まず、予測モデル生成部11によって、予測モデルの生成に用いられる情報が取得される(S01)。当該情報は、図2に示すように、メッシュコード、時間、各種の人口、気候及び乗車数が対応付けられた情報である。続いて、予測モデル生成部11によって、取得された各キューブの情報が、イベントセッションを構成するものであるか否かが判断される(S02)。イベントセッションを構成する情報と判断された情報が、予測モデルの生成に用いるイベントデータとして抽出される。
In this process, first, the prediction
続いて、予測モデル生成部11によって、イベントデータのクラスタリングが行われる(S03)。上述したように、イベントセッションの期間長毎に分けられたイベントデータに対して、イベント人口波形によるクラスタリング及びデモグラ比率によるクラスタリングが行われる。続いて、予測モデル生成部11によって、クラスタリングによって得られたクラスタ毎にイベントデータから予測モデルが生成される(S04)。また、クラスタ毎に代表データ及び閾値データが生成される。生成された予測モデル等の情報を需要予測装置10に記憶される。以上が、予測モデルが生成される際の処理である。
Subsequently, the prediction
続いて、図8のフローチャートを用いて、需要予測が行われる際の処理を説明する。まず、取得部12によって、需要予測に用いられる情報が取得される(S11)。当該情報は、図2に示す形式と同様の情報である。続いて、予測モデル決定部13によって、取得された各キューブの情報が、イベントセッションを構成するものであるか否かが判断される(S12)。イベントセッションを構成する情報と判断された情報が、需要予測に用いられるイベントデータとして抽出される。
Subsequently, the process when the demand forecast is performed will be described with reference to the flowchart of FIG. First, the
続いて、予測モデル決定部13によって、イベントデータから、当該イベントデータが所属するクラスタが判断される。当該判断は、上述したようにイベントデータに基づくデータとクラスタの代表データとの距離に基づいて行われる。
Subsequently, the prediction
続いて、予測部14によって判断されたクラスタの予測モデルが用いられて、イベントデータからタクシーの需要予測が行われる(S14)。続いて、出力部15によって、予測部14による需要予測の結果に応じた情報が出力される(S15)。以上が、需要予測が行われる際の処理である。
Subsequently, the cluster prediction model determined by the
上述したように本実施形態では、時系列の人数情報に基づいて、需要予測に用いる予測モデルが決定されて、需要予測が行われる。従って、本実施形態によれば、人数情報に応じたタクシーの利用のされ方が考慮された需要予測を行うことができる。即ち、本実施形態によれば、非日常の場合であっても、単なるイベントの開催の考慮ではなく、実際の人数の変動に応じた精度の高いタクシーの需要予測を行うことができる。 As described above, in the present embodiment, the forecast model used for the demand forecast is determined based on the time-series number of people information, and the demand forecast is performed. Therefore, according to the present embodiment, it is possible to make a demand forecast in consideration of how a taxi is used according to the number of people information. That is, according to the present embodiment, even in an extraordinary case, it is possible to forecast the demand for a taxi with high accuracy according to the fluctuation of the actual number of people, instead of simply considering the holding of the event.
このように本実施形態では、実際の人数の変動に応じて需要予測を行うため、過去の周期的な動きから乖離しているタクシー需要(非日常需要)を予測することができる。特に、本実施形態によれば、プロ野球及び大型展示会といったメジャーなイベントだけでなく、これまでタクシーの利用実績が顕在化していないマイナーなイベントを考慮して需要予測を行うことができる。即ち、需要予測装置10による予測により、普段気づかないタクシー需要を検知することができる。
As described above, in the present embodiment, since the demand is predicted according to the fluctuation of the actual number of people, it is possible to predict the taxi demand (unusual demand) that deviates from the past periodic movement. In particular, according to the present embodiment, it is possible to forecast demand in consideration of not only major events such as professional baseball and large-scale exhibitions, but also minor events for which taxi usage records have not been realized so far. That is, it is possible to detect taxi demand that is not normally noticed by the forecast by the
また、本実施形態のように人数情報から、人の流入を示す流入状態であるフェーズを特定して、予測モデルの生成及び需要予測に用いるイベントデータを特定することとしてもよい。この構成によれば、適切にイベントデータを特定することができ、その結果、適切な需要予測を行うことができる。 Further, as in the present embodiment, the phase of the inflow state indicating the inflow of people may be specified from the number of people information, and the event data used for generating the prediction model and forecasting the demand may be specified. According to this configuration, event data can be appropriately specified, and as a result, appropriate demand forecast can be performed.
また、本実施形態のようにデモグラデータを用いて、需要予測を行うこととしてもよい。この構成によれば、人のデモグラも考慮した、より適切な需要予測を行うことができる。また、デモグラデータを用いることが可能であれば、予測に用いるデータに係る時刻が少ない場合、即ち、サンプル数が少ない場合であっても、適切な需要予測を行うことができる。但し、デモグラデータを用いないで需要予測を行うこととしてもよい。 Further, the demand forecast may be performed by using the demogra data as in the present embodiment. According to this configuration, it is possible to make a more appropriate demand forecast in consideration of human demograss. Further, if the demogra data can be used, an appropriate demand forecast can be performed even when the time related to the data used for the forecast is small, that is, even when the number of samples is small. However, the demand forecast may be performed without using the demogra data.
また、本実施形態のように、例えば、モデル人口から所定の基準値を引いたイベント人口を用いて需要予測を行うこととしてもよい。この構成によれば、例えば、定常時の人口を考慮したより適切な需要予測を行うことができる。但し、イベント人口を用いずに、モデル人口から需要予測を行うこととしてもよい。 Further, as in the present embodiment, for example, the demand forecast may be performed using the event population obtained by subtracting a predetermined reference value from the model population. According to this configuration, for example, a more appropriate demand forecast can be made in consideration of the normal population. However, the demand forecast may be made from the model population without using the event population.
また、本実施形態のように、需要予測装置10が、予測モデルを生成する機能を有していてもよい。これにより、より適切かつ確実に本発明の一実施形態を実施することができる。但し、予測モデルの生成は、必ずしも需要予測装置10で行われる必要はなく、需要予測装置10は予め用意された予測モデルを用いて需要予測を行うこととしてもよい。
Further, as in the present embodiment, the
なお、本実施形態では、需要予測の対象となる乗り物はタクシーであるものとしたが、必ずしもタクシーである必要はなく、任意の位置に応じて需要が生じる乗り物であれば、任意の乗り物を需要予測の対象としてもよい。 In the present embodiment, the vehicle to be the target of the demand forecast is a taxi, but it does not necessarily have to be a taxi, and if the vehicle is in demand according to an arbitrary position, any vehicle is demanded. It may be the target of prediction.
なお、上記実施の形態の説明に用いたブロック図は、機能単位のブロックを示している。これらの機能ブロック(構成部)は、ハードウェア及び/又はソフトウェアの任意の組み合わせによって実現される。また、各機能ブロックの実現手段は特に限定されない。すなわち、各機能ブロックは、物理的及び/又は論理的に結合した1つの装置により実現されてもよいし、物理的及び/又は論理的に分離した2つ以上の装置を直接的及び/又は間接的に(例えば、有線及び/又は無線)で接続し、これら複数の装置により実現されてもよい。 The block diagram used in the description of the above embodiment shows a block of functional units. These functional blocks (components) are realized by any combination of hardware and / or software. Further, the means for realizing each functional block is not particularly limited. That is, each functional block may be realized by one physically and / or logically coupled device, or directly and / or indirectly by two or more physically and / or logically separated devices. (For example, wired and / or wireless) may be connected and realized by these plurality of devices.
例えば、本発明の一実施の形態における需要予測装置10は、本実施形態の需要予測装置10の処理を行うコンピュータとして機能してもよい。図9は、本実施形態に係る需要予測装置10のハードウェア構成の一例を示す図である。上述の需要予測装置10は、物理的には、プロセッサ1001、メモリ1002、ストレージ1003、通信装置1004、入力装置1005、出力装置1006、バス1007などを含むコンピュータ装置として構成されてもよい。
For example, the
なお、以下の説明では、「装置」という文言は、回路、デバイス、ユニットなどに読み替えることができる。需要予測装置10のハードウェア構成は、図に示した各装置を1つ又は複数含むように構成されてもよいし、一部の装置を含まずに構成されてもよい。
In the following description, the word "device" can be read as a circuit, device, unit, or the like. The hardware configuration of the
需要予測装置10における各機能は、プロセッサ1001、メモリ1002などのハードウェア上に所定のソフトウェア(プログラム)を読み込ませることで、プロセッサ1001が演算を行い、通信装置1004による通信、並びにメモリ1002及びストレージ1003におけるデータの読み出し及び/又は書き込みを制御することで実現される。
Each function of the
プロセッサ1001は、例えば、オペレーティングシステムを動作させてコンピュータ全体を制御する。プロセッサ1001は、周辺装置とのインターフェース、制御装置、演算装置、レジスタなどを含む中央処理装置(CPU:Central Processing Unit)で構成されてもよい。例えば、需要予測装置10の各機能部11〜15は、プロセッサ1001を含んで実現されてもよい。
また、プロセッサ1001は、プログラム(プログラムコード)、ソフトウェアモジュール及びデータを、ストレージ1003及び/又は通信装置1004からメモリ1002に読み出し、これらに従って各種の処理を実行する。プログラムとしては、上述の実施の形態で説明した動作の少なくとも一部をコンピュータに実行させるプログラムが用いられる。例えば、需要予測装置10の各機能部11〜15は、メモリ1002に格納され、プロセッサ1001で動作する制御プログラムによって実現されてもよい。上述の各種処理は、1つのプロセッサ1001で実行される旨を説明してきたが、2以上のプロセッサ1001により同時又は逐次に実行されてもよい。プロセッサ1001は、1以上のチップで実装されてもよい。なお、プログラムは、電気通信回線を介してネットワークから送信されても良い。
Further, the
メモリ1002は、コンピュータ読み取り可能な記録媒体であり、例えば、ROM(Read Only Memory)、EPROM(Erasable Programmable ROM)、EEPROM(Electrically Erasable Programmable ROM)、RAM(Random Access Memory)などの少なくとも1つで構成されてもよい。メモリ1002は、レジスタ、キャッシュ、メインメモリ(主記憶装置)などと呼ばれてもよい。メモリ1002は、本発明の一実施の形態に係る方法を実施するために実行可能なプログラム(プログラムコード)、ソフトウェアモジュールなどを保存することができる。
The
ストレージ1003は、コンピュータ読み取り可能な記録媒体であり、例えば、CD−ROM(Compact Disc ROM)などの光ディスク、ハードディスクドライブ、フレキシブルディスク、光磁気ディスク(例えば、コンパクトディスク、デジタル多用途ディスク、Blu−ray(登録商標)ディスク)、スマートカード、フラッシュメモリ(例えば、カード、スティック、キードライブ)、フロッピー(登録商標)ディスク、磁気ストリップなどの少なくとも1つで構成されてもよい。ストレージ1003は、補助記憶装置と呼ばれてもよい。上述の記憶媒体は、例えば、メモリ1002及び/又はストレージ1003を含むデータベース、サーバその他の適切な媒体であってもよい。
The
通信装置1004は、有線及び/又は無線ネットワークを介してコンピュータ間の通信を行うためのハードウェア(送受信デバイス)であり、例えばネットワークデバイス、ネットワークコントローラ、ネットワークカード、通信モジュールなどともいう。例えば、上述の需要予測装置10の各機能部11〜15は、通信装置1004を含んで実現されてもよい。
The
入力装置1005は、外部からの入力を受け付ける入力デバイス(例えば、キーボード、マウス、マイクロフォン、スイッチ、ボタン、センサなど)である。出力装置1006は、外部への出力を実施する出力デバイス(例えば、ディスプレイ、スピーカー、LEDランプなど)である。なお、入力装置1005及び出力装置1006は、一体となった構成(例えば、タッチパネル)であってもよい。
The
また、プロセッサ1001及びメモリ1002などの各装置は、情報を通信するためのバス1007で接続される。バス1007は、単一のバスで構成されてもよいし、装置間で異なるバスで構成されてもよい。
Further, each device such as the
また、需要予測装置10は、マイクロプロセッサ、デジタル信号プロセッサ(DSP:Digital Signal Processor)、ASIC(Application Specific Integrated Circuit)、PLD(Programmable Logic Device)、FPGA(Field Programmable Gate Array)などのハードウェアを含んで構成されてもよく、当該ハードウェアにより、各機能ブロックの一部又は全てが実現されてもよい。例えば、プロセッサ1001は、これらのハードウェアの少なくとも1つで実装されてもよい。
Further, the
以上、本実施形態について詳細に説明したが、当業者にとっては、本実施形態が本明細書中に説明した実施形態に限定されるものではないということは明らかである。本実施形態は、特許請求の範囲の記載により定まる本発明の趣旨及び範囲を逸脱することなく修正及び変更態様として実施することができる。したがって、本明細書の記載は、例示説明を目的とするものであり、本実施形態に対して何ら制限的な意味を有するものではない。 Although the present embodiment has been described in detail above, it is clear to those skilled in the art that the present embodiment is not limited to the embodiment described in the present specification. This embodiment can be implemented as a modified or modified mode without departing from the spirit and scope of the present invention determined by the description of the claims. Therefore, the description of the present specification is for the purpose of exemplification and does not have any limiting meaning to the present embodiment.
情報の通知は、本明細書で説明した態様/実施形態に限られず、他の方法で行われてもよい。例えば、情報の通知は、物理レイヤシグナリング(例えば、DCI(Downlink Control Information)、UCI(Uplink Control Information))、上位レイヤシグナリング(例えば、RRC(Radio Resource Control)シグナリング、MAC(Medium Access Control)シグナリング、報知情報(MIB(Master Information Block)、SIB(System Information Block)))、その他の信号又はこれらの組み合わせによって実施されてもよい。また、RRCシグナリングは、RRCメッセージと呼ばれてもよく、例えば、RRC接続セットアップ(RRC Connection Setup)メッセージ、RRC接続再構成(RRC Connection Reconfiguration)メッセージなどであってもよい。 The notification of information is not limited to the embodiments / embodiments described herein, and may be made by other methods. For example, information notification includes physical layer signaling (for example, DCI (Downlink Control Information), UCI (Uplink Control Information)), upper layer signaling (for example, RRC (Radio Resource Control) signaling, MAC (Medium Access Control) signaling, etc. It may be carried out by notification information (MIB (Master Information Block), SIB (System Information Block)), other signals, or a combination thereof. Further, the RRC signaling may be referred to as an RRC message, and may be, for example, an RRC Connection Setup message, an RRC Connection Reconfiguration message, or the like.
本明細書で説明した各態様/実施形態の処理手順、シーケンス、フローチャートなどは、矛盾の無い限り、順序を入れ替えてもよい。例えば、本明細書で説明した方法については、例示的な順序で様々なステップの要素を提示しており、提示した特定の順序に限定されない。 The order of the processing procedures, sequences, flowcharts, etc. of each aspect / embodiment described in the present specification may be changed as long as there is no contradiction. For example, the methods described herein present elements of various steps in an exemplary order, and are not limited to the particular order presented.
入出力された情報等は特定の場所(例えば、メモリ)に保存されてもよいし、管理テーブルで管理してもよい。入出力される情報等は、上書き、更新、または追記され得る。出力された情報等は削除されてもよい。入力された情報等は他の装置へ送信されてもよい。 The input / output information and the like may be stored in a specific location (for example, a memory), or may be managed by a management table. Input / output information and the like can be overwritten, updated, or added. The output information and the like may be deleted. The input information or the like may be transmitted to another device.
判定は、1ビットで表される値(0か1か)によって行われてもよいし、真偽値(Boolean:trueまたはfalse)によって行われてもよいし、数値の比較(例えば、所定の値との比較)によって行われてもよい。 The determination may be made by a value represented by 1 bit (0 or 1), by a boolean value (Boolean: true or false), or by comparing numerical values (for example, a predetermined value). It may be done by comparison with the value).
本明細書で説明した各態様/実施形態は単独で用いてもよいし、組み合わせて用いてもよいし、実行に伴って切り替えて用いてもよい。また、所定の情報の通知(例えば、「Xであること」の通知)は、明示的に行うものに限られず、暗黙的(例えば、当該所定の情報の通知を行わない)ことによって行われてもよい。 Each aspect / embodiment described in the present specification may be used alone, in combination, or may be switched and used according to the execution. Further, the notification of predetermined information (for example, the notification of "being X") is not limited to the explicit notification, but is performed implicitly (for example, the notification of the predetermined information is not performed). May be good.
ソフトウェアは、ソフトウェア、ファームウェア、ミドルウェア、マイクロコード、ハードウェア記述言語と呼ばれるか、他の名称で呼ばれるかを問わず、命令、命令セット、コード、コードセグメント、プログラムコード、プログラム、サブプログラム、ソフトウェアモジュール、アプリケーション、ソフトウェアアプリケーション、ソフトウェアパッケージ、ルーチン、サブルーチン、オブジェクト、実行可能ファイル、実行スレッド、手順、機能などを意味するよう広く解釈されるべきである。 Software is an instruction, instruction set, code, code segment, program code, program, subprogram, software module, whether called software, firmware, middleware, microcode, hardware description language, or another name. , Applications, software applications, software packages, routines, subroutines, objects, executable files, execution threads, procedures, features, etc. should be broadly interpreted to mean.
また、ソフトウェア、命令などは、伝送媒体を介して送受信されてもよい。例えば、ソフトウェアが、同軸ケーブル、光ファイバケーブル、ツイストペア及びデジタル加入者回線(DSL)などの有線技術及び/又は赤外線、無線及びマイクロ波などの無線技術を使用してウェブサイト、サーバ、又は他のリモートソースから送信される場合、これらの有線技術及び/又は無線技術は、伝送媒体の定義内に含まれる。 Further, software, instructions, and the like may be transmitted and received via a transmission medium. For example, the software uses wired technology such as coaxial cable, fiber optic cable, twist pair and digital subscriber line (DSL) and / or wireless technology such as infrared, wireless and microwave to websites, servers, or other When transmitted from a remote source, these wired and / or wireless technologies are included within the definition of transmission medium.
本明細書で説明した情報、信号などは、様々な異なる技術のいずれかを使用して表されてもよい。例えば、上記の説明全体に渡って言及され得るデータ、命令、コマンド、情報、信号、ビット、シンボル、チップなどは、電圧、電流、電磁波、磁界若しくは磁性粒子、光場若しくは光子、又はこれらの任意の組み合わせによって表されてもよい。 The information, signals, etc. described herein may be represented using any of a variety of different techniques. For example, data, instructions, commands, information, signals, bits, symbols, chips, etc. that may be referred to throughout the above description are voltages, currents, electromagnetic waves, magnetic fields or magnetic particles, light fields or photons, or any of these. It may be represented by a combination of.
なお、本明細書で説明した用語及び/又は本明細書の理解に必要な用語については、同一の又は類似する意味を有する用語と置き換えてもよい。例えば、チャネル及び/又はシンボルは信号(シグナル)であってもよい。また、信号はメッセージであってもよい。また、コンポーネントキャリア(CC)は、キャリア周波数、セルなどと呼ばれてもよい。 In addition, the terms described in the present specification and / or the terms necessary for understanding the present specification may be replaced with terms having the same or similar meanings. For example, the channel and / or symbol may be a signal. Also, the signal may be a message. Further, the component carrier (CC) may be referred to as a carrier frequency, a cell, or the like.
本明細書で使用する「システム」および「ネットワーク」という用語は、互換的に使用される。 The terms "system" and "network" as used herein are used interchangeably.
また、本明細書で説明した情報、パラメータなどは、絶対値で表されてもよいし、所定の値からの相対値で表されてもよいし、対応する別の情報で表されてもよい。例えば、無線リソースはインデックスで指示されるものであってもよい。 Further, the information, parameters, etc. described in the present specification may be represented by an absolute value, a relative value from a predetermined value, or another corresponding information. .. For example, the radio resource may be indexed.
上述したパラメータに使用する名称はいかなる点においても限定的なものではない。さらに、これらのパラメータを使用する数式等は、本明細書で明示的に開示したものと異なる場合もある。様々なチャネル(例えば、PUCCH、PDCCHなど)及び情報要素(例えば、TPCなど)は、あらゆる好適な名称によって識別できるので、これらの様々なチャネル及び情報要素に割り当てている様々な名称は、いかなる点においても限定的なものではない。 The names used for the above parameters are not limited in any way. Further, mathematical formulas and the like using these parameters may differ from those expressly disclosed herein. Since the various channels (eg, PUCCH, PDCCH, etc.) and information elements (eg, TPC, etc.) can be identified by any suitable name, the various names assigned to these various channels and information elements are in any respect. However, it is not limited.
移動通信端末は、当業者によって、加入者局、モバイルユニット、加入者ユニット、ワイヤレスユニット、リモートユニット、モバイルデバイス、ワイヤレスデバイス、ワイヤレス通信デバイス、リモートデバイス、モバイル加入者局、アクセス端末、モバイル端末、ワイヤレス端末、リモート端末、ハンドセット、ユーザエージェント、モバイルクライアント、クライアント、またはいくつかの他の適切な用語で呼ばれる場合もある。 Mobile communication terminals may be subscriber stations, mobile units, subscriber units, wireless units, remote units, mobile devices, wireless devices, wireless communication devices, remote devices, mobile subscriber stations, access terminals, mobile terminals, etc. It may also be referred to as a wireless terminal, remote terminal, handset, user agent, mobile client, client, or some other suitable term.
本明細書で使用する「判断(determining)」、「決定(determining)」という用語は、多種多様な動作を包含する場合がある。「判断」、「決定」は、例えば、判定(judging)、計算(calculating)、算出(computing)、処理(processing)、導出(deriving)、調査(investigating)、探索(looking up)(例えば、テーブル、データベースまたは別のデータ構造での探索)、確認(ascertaining)した事を「判断」「決定」したとみなす事などを含み得る。また、「判断」、「決定」は、受信(receiving)(例えば、情報を受信すること)、送信(transmitting)(例えば、情報を送信すること)、入力(input)、出力(output)、アクセス(accessing)(例えば、メモリ中のデータにアクセスすること)した事を「判断」「決定」したとみなす事などを含み得る。また、「判断」、「決定」は、解決(resolving)、選択(selecting)、選定(choosing)、確立(establishing)、比較(comparing)などした事を「判断」「決定」したとみなす事を含み得る。つまり、「判断」「決定」は、何らかの動作を「判断」「決定」したとみなす事を含み得る。 As used herein, the terms "determining" and "determining" may include a wide variety of actions. “Judgment” and “decision” are, for example, judgment (judging), calculation (calculating), calculation (computing), processing (processing), derivation (deriving), investigating (investigating), searching (looking up) (for example, table). , Searching in a database or another data structure), ascertaining can be considered as a "judgment" or "decision". Also, "judgment" and "decision" are receiving (for example, receiving information), transmitting (for example, transmitting information), input (input), output (output), and access. (Accessing) (for example, accessing data in memory) may be regarded as "judgment" or "decision". In addition, "judgment" and "decision" mean that "resolving", "selecting", "choosing", "establishing", "comparing", etc. are regarded as "judgment" and "decision". Can include. That is, "judgment" and "decision" may include that some action is regarded as "judgment" and "decision".
「接続された(connected)」、「結合された(coupled)」という用語、又はこれらのあらゆる変形は、2又はそれ以上の要素間の直接的又は間接的なあらゆる接続又は結合を意味し、互いに「接続」又は「結合」された2つの要素間に1又はそれ以上の中間要素が存在することを含むことができる。要素間の結合又は接続は、物理的なものであっても、論理的なものであっても、或いはこれらの組み合わせであってもよい。本明細書で使用する場合、2つの要素は、1又はそれ以上の電線、ケーブル及び/又はプリント電気接続を使用することにより、並びにいくつかの非限定的かつ非包括的な例として、無線周波数領域、マイクロ波領域及び光(可視及び不可視の両方)領域の波長を有する電磁エネルギーなどの電磁エネルギーを使用することにより、互いに「接続」又は「結合」されると考えることができる。 The terms "connected", "coupled", or any variation thereof, mean any direct or indirect connection or connection between two or more elements, and each other. It can include the presence of one or more intermediate elements between two "connected" or "combined" elements. The connection or connection between the elements may be physical, logical, or a combination thereof. As used herein, the two elements are by using one or more wires, cables and / or printed electrical connections, and, as some non-limiting and non-comprehensive examples, radio frequencies. By using electromagnetic energies such as electromagnetic energies with wavelengths in the region, microwave region and light (both visible and invisible) regions, they can be considered to be "connected" or "coupled" to each other.
本明細書で使用する「に基づいて」という記載は、別段に明記されていない限り、「のみに基づいて」を意味しない。言い換えれば、「に基づいて」という記載は、「のみに基づいて」と「に少なくとも基づいて」の両方を意味する。 As used herein, the phrase "based on" does not mean "based on" unless otherwise stated. In other words, the statement "based on" means both "based only" and "at least based on".
本明細書で「第1の」、「第2の」などの呼称を使用した場合においては、その要素へのいかなる参照も、それらの要素の量または順序を全般的に限定するものではない。これらの呼称は、2つ以上の要素間を区別する便利な方法として本明細書で使用され得る。したがって、第1および第2の要素への参照は、2つの要素のみがそこで採用され得ること、または何らかの形で第1の要素が第2の要素に先行しなければならないことを意味しない。 When the terms "first", "second", etc. are used herein, any reference to the elements does not generally limit the quantity or order of those elements. These designations can be used herein as a convenient way to distinguish between two or more elements. Thus, references to the first and second elements do not mean that only two elements can be adopted there, or that the first element must somehow precede the second element.
「含む(include)」、「含んでいる(including)」、およびそれらの変形が、本明細書あるいは特許請求の範囲で使用されている限り、これら用語は、用語「備える(comprising)」と同様に、包括的であることが意図される。さらに、本明細書あるいは特許請求の範囲において使用されている用語「または(or)」は、排他的論理和ではないことが意図される。 As long as "include", "including", and variations thereof are used within the scope of the present specification or claims, these terms are similar to the term "comprising". Is intended to be inclusive. Furthermore, the term "or" as used herein or in the claims is intended not to be an exclusive OR.
本明細書において、文脈または技術的に明らかに1つのみしか存在しない装置である場合以外は、複数の装置をも含むものとする。本開示の全体において、文脈から明らかに単数を示したものではなければ、複数のものを含むものとする。 In the present specification, a plurality of devices shall be included unless the device has only one device apparently in the context or technically. In the whole of the present disclosure, if the context clearly does not indicate the singular, it shall include more than one.
10…需要予測装置、11…予測モデル生成部、12…取得部、13…予測モデル決定部、14…予測部、15…出力部、1001…プロセッサ、1002…メモリ、1003…ストレージ、1004…通信装置、1005…入力装置、1006…出力装置、1007…バス。 10 ... Demand forecasting device, 11 ... Prediction model generation unit, 12 ... Acquisition unit, 13 ... Prediction model determination unit, 14 ... Prediction unit, 15 ... Output unit, 1001 ... Processor, 1002 ... Memory, 1003 ... Storage, 1004 ... Communication Device, 1005 ... Input device, 1006 ... Output device, 1007 ... Bus.
Claims (5)
複数の時刻における位置毎の人の数に係る情報を含む人数情報を取得する取得部と、
前記取得部によって取得された人数情報に基づいて、需要予測に用いる予測モデルを決定する予測モデル決定部と、
前記予測モデル決定部によって決定された予測モデルを用いて、前記取得部によって取得された人数情報から乗り物の需要予測を行う予測部と、
前記予測部による需要予測の結果に応じた情報を出力する出力部と、
を備え、
複数の時刻における位置毎の人の数に係る情報を含む複数のモデル生成用人数情報、及び当該複数の時刻に対応する時刻における位置毎の乗り物の需要量を示す需要情報を取得し、取得したモデル生成用人数情報をクラスタリングして、クラスタリングによって得られたクラスタ毎にモデル生成用人数情報及び需要情報から予測モデルを生成する予測モデル生成部を更に備え、
前記予測モデル決定部は、前記取得部によって取得された人数情報に基づいて、前記予測モデル生成部によって生成された複数の予測モデルから、需要予測に用いる予測モデルを決定する、需要予測装置。 It is a demand forecasting device that forecasts the demand for vehicles according to the position.
An acquisition unit that acquires information on the number of people, including information on the number of people at each position at multiple times.
A forecast model determination unit that determines a forecast model to be used for demand forecast based on the number of people information acquired by the acquisition unit.
Using the forecast model determined by the forecast model determination unit, the forecast unit that predicts the demand for vehicles from the number of people information acquired by the acquisition unit, and
An output unit that outputs information according to the result of demand forecasting by the forecasting unit,
Equipped with a,
Acquired and acquired information on the number of people for model generation including information on the number of people per position at a plurality of times, and demand information indicating the amount of vehicle demand for each position at the times corresponding to the plurality of times. It is further equipped with a prediction model generation unit that clusters model generation number information and generates a prediction model from model generation number information and demand information for each cluster obtained by clustering.
The forecast model determination unit is a demand forecast device that determines a forecast model to be used for demand forecast from a plurality of forecast models generated by the forecast model generation unit based on the number of people information acquired by the acquisition unit.
Applications Claiming Priority (3)
| Application Number | Priority Date | Filing Date | Title |
|---|---|---|---|
| JP2017034693 | 2017-02-27 | ||
| JP2017034693 | 2017-02-27 | ||
| PCT/JP2017/046405 WO2018154958A1 (en) | 2017-02-27 | 2017-12-25 | Demand prediction device |
Publications (2)
| Publication Number | Publication Date |
|---|---|
| JPWO2018154958A1 JPWO2018154958A1 (en) | 2019-11-21 |
| JP6810786B2 true JP6810786B2 (en) | 2021-01-06 |
Family
ID=63252642
Family Applications (1)
| Application Number | Title | Priority Date | Filing Date |
|---|---|---|---|
| JP2019501089A Active JP6810786B2 (en) | 2017-02-27 | 2017-12-25 | Demand forecaster |
Country Status (5)
| Country | Link |
|---|---|
| US (1) | US20200111111A1 (en) |
| EP (1) | EP3564897A4 (en) |
| JP (1) | JP6810786B2 (en) |
| CN (1) | CN110326020A (en) |
| WO (1) | WO2018154958A1 (en) |
Families Citing this family (10)
| Publication number | Priority date | Publication date | Assignee | Title |
|---|---|---|---|---|
| US11119472B2 (en) * | 2018-09-28 | 2021-09-14 | Uptake Technologies, Inc. | Computer system and method for evaluating an event prediction model |
| US11537953B2 (en) * | 2018-11-29 | 2022-12-27 | Here Global B.V. | Method and apparatus for proactive booking of a shared vehicle |
| JP2020160960A (en) * | 2019-03-27 | 2020-10-01 | 株式会社日立製作所 | Movement support system and method |
| WO2020213612A1 (en) * | 2019-04-16 | 2020-10-22 | 株式会社Nttドコモ | Demand forecasting device |
| JP7294421B2 (en) * | 2019-06-26 | 2023-06-20 | 日本電信電話株式会社 | Learning device, prediction device, learning method, prediction method, learning program, and prediction program |
| US11568342B1 (en) * | 2019-08-16 | 2023-01-31 | Lyft, Inc. | Generating and communicating device balance graphical representations for a dynamic transportation system |
| US20210295224A1 (en) * | 2020-03-23 | 2021-09-23 | Lyft, Inc. | Utilizing a requestor device forecasting model with forward and backward looking queue filters to pre-dispatch provider devices |
| US20230169414A1 (en) * | 2020-04-23 | 2023-06-01 | Ntt Docomo, Inc. | Population extraction device |
| CN114530039A (en) * | 2022-01-27 | 2022-05-24 | 浙江梧斯源通信科技股份有限公司 | Real-time detection device and method for pedestrian flow and vehicle flow at intersection |
| US20230342874A1 (en) * | 2022-04-25 | 2023-10-26 | Toyota Motor North America, Inc. | Prioritizing access to shared vehicles based on need |
Family Cites Families (9)
| Publication number | Priority date | Publication date | Assignee | Title |
|---|---|---|---|---|
| JP2007072784A (en) | 2005-09-07 | 2007-03-22 | Hitachi Kokusai Electric Inc | Vehicle dispatch system |
| JP2008052455A (en) * | 2006-08-23 | 2008-03-06 | Fujitsu Ten Ltd | Demand prediction device and program |
| JP5118684B2 (en) * | 2009-11-20 | 2013-01-16 | 株式会社エヌ・ティ・ティ・ドコモ | Demand forecasting apparatus and demand forecasting method |
| JP5129799B2 (en) * | 2009-11-24 | 2013-01-30 | 株式会社エヌ・ティ・ティ・ドコモ | Demand forecasting apparatus and demand forecasting method |
| US9424515B2 (en) * | 2011-12-05 | 2016-08-23 | FasterFare, LLC | Predicting taxi utilization information |
| US10373089B2 (en) * | 2014-04-24 | 2019-08-06 | Beijing Didi Infinity Technology And Development Co., Ltd. | System and method for managing supply of service |
| CN104021668B (en) * | 2014-06-26 | 2016-03-09 | 中国科学院自动化研究所 | A kind of public transport supply and demand state-detection and prognoses system and method |
| JP2016075972A (en) * | 2014-10-02 | 2016-05-12 | シャープ株式会社 | Terminal device and program |
| JP6454222B2 (en) * | 2015-05-29 | 2019-01-16 | 株式会社日立製作所 | Data processing system and data processing method |
-
2017
- 2017-12-25 WO PCT/JP2017/046405 patent/WO2018154958A1/en unknown
- 2017-12-25 US US16/488,772 patent/US20200111111A1/en not_active Abandoned
- 2017-12-25 EP EP17897243.6A patent/EP3564897A4/en not_active Withdrawn
- 2017-12-25 CN CN201780086875.XA patent/CN110326020A/en active Pending
- 2017-12-25 JP JP2019501089A patent/JP6810786B2/en active Active
Also Published As
| Publication number | Publication date |
|---|---|
| WO2018154958A1 (en) | 2018-08-30 |
| EP3564897A4 (en) | 2019-11-13 |
| EP3564897A1 (en) | 2019-11-06 |
| US20200111111A1 (en) | 2020-04-09 |
| CN110326020A (en) | 2019-10-11 |
| JPWO2018154958A1 (en) | 2019-11-21 |
Similar Documents
| Publication | Publication Date | Title |
|---|---|---|
| JP6810786B2 (en) | Demand forecaster | |
| WO2018207878A1 (en) | Demand forecast device | |
| US11593817B2 (en) | Demand prediction method, demand prediction apparatus, and non-transitory computer-readable recording medium | |
| US10379717B2 (en) | Device based visualization and analysis of multivariate data | |
| US11176812B2 (en) | Real-time service level monitor | |
| CN108108743B (en) | Abnormal user identification method and device for identifying abnormal user | |
| Chen et al. | Constructing and comparing user mobility profiles | |
| US20210174270A1 (en) | Rideshare vehicle demand forecasting device, method for forecasting rideshare vehicle demand, and storage medium | |
| US20150269195A1 (en) | Model updating apparatus and method | |
| CN108280685A (en) | Information acquisition method and device | |
| CN110225366A (en) | Video data processing and advertisement position determine method, apparatus, medium and electronic equipment | |
| US20230144809A1 (en) | Model operation support system and method | |
| CN111400126A (en) | Network service abnormal data detection method, device, equipment and medium | |
| WO2021039797A1 (en) | Click rate prediction model construction device | |
| CN111123778B (en) | Method and device for monitoring vehicle use condition and electronic equipment | |
| JP2019082895A (en) | Device to determine time to visit | |
| CN112262582A (en) | Method, system, and medium for identifying videos containing objectionable content | |
| JPWO2019167685A1 (en) | Visit time determination device | |
| JPWO2019159585A1 (en) | Learning system, estimation system and trained model | |
| JP7478140B2 (en) | Demand forecasting device | |
| US11847592B2 (en) | Required time prediction apparatus, control method, and non-transitory storage medium | |
| WO2020230524A1 (en) | Traffic amount estimation system | |
| JP7449192B2 (en) | Timetable information management system, timetable information management method, and operation guidance system | |
| WO2018216413A1 (en) | Aloneness estimation device | |
| US20220398358A1 (en) | Information processing device, information processing method, and computer program product |
Legal Events
| Date | Code | Title | Description |
|---|---|---|---|
| A621 | Written request for application examination |
Free format text: JAPANESE INTERMEDIATE CODE: A621 Effective date: 20190729 |
|
| A131 | Notification of reasons for refusal |
Free format text: JAPANESE INTERMEDIATE CODE: A131 Effective date: 20200519 |
|
| A521 | Request for written amendment filed |
Free format text: JAPANESE INTERMEDIATE CODE: A523 Effective date: 20200714 |
|
| TRDD | Decision of grant or rejection written | ||
| A01 | Written decision to grant a patent or to grant a registration (utility model) |
Free format text: JAPANESE INTERMEDIATE CODE: A01 Effective date: 20201208 |
|
| A61 | First payment of annual fees (during grant procedure) |
Free format text: JAPANESE INTERMEDIATE CODE: A61 Effective date: 20201211 |
|
| R150 | Certificate of patent or registration of utility model |
Ref document number: 6810786 Country of ref document: JP Free format text: JAPANESE INTERMEDIATE CODE: R150 |
|
| R250 | Receipt of annual fees |
Free format text: JAPANESE INTERMEDIATE CODE: R250 |