JP6692809B2 - Percutaneous Coronary Intervention Planning Interface and Related Devices, Systems, and Methods - Google Patents
Percutaneous Coronary Intervention Planning Interface and Related Devices, Systems, and Methods Download PDFInfo
- Publication number
- JP6692809B2 JP6692809B2 JP2017525405A JP2017525405A JP6692809B2 JP 6692809 B2 JP6692809 B2 JP 6692809B2 JP 2017525405 A JP2017525405 A JP 2017525405A JP 2017525405 A JP2017525405 A JP 2017525405A JP 6692809 B2 JP6692809 B2 JP 6692809B2
- Authority
- JP
- Japan
- Prior art keywords
- stent
- vessel
- representation
- pressure
- user input
- Prior art date
- Legal status (The legal status is an assumption and is not a legal conclusion. Google has not performed a legal analysis and makes no representation as to the accuracy of the status listed.)
- Active
Links
- 238000000034 method Methods 0.000 title claims description 126
- 238000013146 percutaneous coronary intervention Methods 0.000 title claims description 65
- 230000000007 visual effect Effects 0.000 claims description 117
- 238000009530 blood pressure measurement Methods 0.000 claims description 87
- 238000012800 visualization Methods 0.000 claims description 66
- 238000012545 processing Methods 0.000 claims description 51
- 230000004044 response Effects 0.000 claims description 24
- 238000003384 imaging method Methods 0.000 claims description 16
- 239000003550 marker Substances 0.000 claims description 16
- 238000004904 shortening Methods 0.000 claims description 13
- 238000002560 therapeutic procedure Methods 0.000 claims description 12
- 230000001225 therapeutic effect Effects 0.000 claims description 5
- 208000031481 Pathologic Constriction Diseases 0.000 description 48
- 230000036262 stenosis Effects 0.000 description 48
- 208000037804 stenosis Diseases 0.000 description 48
- 230000008859 change Effects 0.000 description 26
- 230000000875 corresponding effect Effects 0.000 description 26
- 238000012544 monitoring process Methods 0.000 description 20
- 230000036961 partial effect Effects 0.000 description 20
- 238000004891 communication Methods 0.000 description 19
- 244000208734 Pisonia aculeata Species 0.000 description 17
- 239000000463 material Substances 0.000 description 16
- 230000002792 vascular Effects 0.000 description 14
- 238000005259 measurement Methods 0.000 description 13
- 210000004204 blood vessel Anatomy 0.000 description 12
- 239000012530 fluid Substances 0.000 description 11
- 238000003780 insertion Methods 0.000 description 11
- 230000037431 insertion Effects 0.000 description 11
- 230000002596 correlated effect Effects 0.000 description 10
- 230000003902 lesion Effects 0.000 description 10
- 230000004048 modification Effects 0.000 description 10
- 238000012986 modification Methods 0.000 description 10
- 230000000704 physical effect Effects 0.000 description 9
- 239000007788 liquid Substances 0.000 description 8
- 210000005166 vasculature Anatomy 0.000 description 8
- 238000002608 intravascular ultrasound Methods 0.000 description 7
- 238000012014 optical coherence tomography Methods 0.000 description 6
- 230000002829 reductive effect Effects 0.000 description 6
- 230000000747 cardiac effect Effects 0.000 description 5
- 210000004351 coronary vessel Anatomy 0.000 description 5
- 230000003287 optical effect Effects 0.000 description 5
- CCEKAJIANROZEO-UHFFFAOYSA-N sulfluramid Chemical group CCNS(=O)(=O)C(F)(F)C(F)(F)C(F)(F)C(F)(F)C(F)(F)C(F)(F)C(F)(F)C(F)(F)F CCEKAJIANROZEO-UHFFFAOYSA-N 0.000 description 5
- 206010020565 Hyperaemia Diseases 0.000 description 4
- 238000002583 angiography Methods 0.000 description 4
- 238000004364 calculation method Methods 0.000 description 4
- 230000006870 function Effects 0.000 description 4
- 229940124549 vasodilator Drugs 0.000 description 4
- 239000003071 vasodilator agent Substances 0.000 description 4
- 230000008901 benefit Effects 0.000 description 3
- 230000017531 blood circulation Effects 0.000 description 3
- 238000002586 coronary angiography Methods 0.000 description 3
- 230000003247 decreasing effect Effects 0.000 description 3
- 230000008569 process Effects 0.000 description 3
- 238000004458 analytical method Methods 0.000 description 2
- 210000000709 aorta Anatomy 0.000 description 2
- 230000009286 beneficial effect Effects 0.000 description 2
- 239000003086 colorant Substances 0.000 description 2
- 238000004040 coloring Methods 0.000 description 2
- 208000037265 diseases, disorders, signs and symptoms Diseases 0.000 description 2
- 230000023597 hemostasis Effects 0.000 description 2
- 230000006872 improvement Effects 0.000 description 2
- 230000000670 limiting effect Effects 0.000 description 2
- 238000002595 magnetic resonance imaging Methods 0.000 description 2
- 238000004519 manufacturing process Methods 0.000 description 2
- 239000000203 mixture Substances 0.000 description 2
- 230000002093 peripheral effect Effects 0.000 description 2
- 230000002441 reversible effect Effects 0.000 description 2
- 239000004065 semiconductor Substances 0.000 description 2
- 239000007787 solid Substances 0.000 description 2
- 230000002966 stenotic effect Effects 0.000 description 2
- 238000001356 surgical procedure Methods 0.000 description 2
- 238000002604 ultrasonography Methods 0.000 description 2
- 208000004434 Calcinosis Diseases 0.000 description 1
- OYPRJOBELJOOCE-UHFFFAOYSA-N Calcium Chemical compound [Ca] OYPRJOBELJOOCE-UHFFFAOYSA-N 0.000 description 1
- 206010057469 Vascular stenosis Diseases 0.000 description 1
- 238000009825 accumulation Methods 0.000 description 1
- 230000004075 alteration Effects 0.000 description 1
- 210000003484 anatomy Anatomy 0.000 description 1
- 238000002399 angioplasty Methods 0.000 description 1
- 230000003466 anti-cipated effect Effects 0.000 description 1
- 210000001367 artery Anatomy 0.000 description 1
- 239000008280 blood Substances 0.000 description 1
- 210000004369 blood Anatomy 0.000 description 1
- 230000002308 calcification Effects 0.000 description 1
- 229910052791 calcium Inorganic materials 0.000 description 1
- 239000011575 calcium Substances 0.000 description 1
- 210000001715 carotid artery Anatomy 0.000 description 1
- 210000001627 cerebral artery Anatomy 0.000 description 1
- 239000002131 composite material Substances 0.000 description 1
- 238000002591 computed tomography Methods 0.000 description 1
- 230000001276 controlling effect Effects 0.000 description 1
- 238000012937 correction Methods 0.000 description 1
- 238000013480 data collection Methods 0.000 description 1
- 238000003745 diagnosis Methods 0.000 description 1
- 238000002405 diagnostic procedure Methods 0.000 description 1
- 238000010586 diagram Methods 0.000 description 1
- 201000010099 disease Diseases 0.000 description 1
- 208000035475 disorder Diseases 0.000 description 1
- 230000000694 effects Effects 0.000 description 1
- 239000003925 fat Substances 0.000 description 1
- 239000000835 fiber Substances 0.000 description 1
- 238000002594 fluoroscopy Methods 0.000 description 1
- 238000009499 grossing Methods 0.000 description 1
- 230000036541 health Effects 0.000 description 1
- 230000000004 hemodynamic effect Effects 0.000 description 1
- 208000028867 ischemia Diseases 0.000 description 1
- 210000003734 kidney Anatomy 0.000 description 1
- 150000002632 lipids Chemical class 0.000 description 1
- 230000007774 longterm Effects 0.000 description 1
- 210000003141 lower extremity Anatomy 0.000 description 1
- 230000005012 migration Effects 0.000 description 1
- 238000013508 migration Methods 0.000 description 1
- 230000001338 necrotic effect Effects 0.000 description 1
- 210000000056 organ Anatomy 0.000 description 1
- 238000009877 rendering Methods 0.000 description 1
- 230000000284 resting effect Effects 0.000 description 1
- 239000000523 sample Substances 0.000 description 1
- 238000002603 single-photon emission computed tomography Methods 0.000 description 1
- 238000004513 sizing Methods 0.000 description 1
- 238000003860 storage Methods 0.000 description 1
- 238000006467 substitution reaction Methods 0.000 description 1
- 238000013175 transesophageal echocardiography Methods 0.000 description 1
- 230000007704 transition Effects 0.000 description 1
- 238000010200 validation analysis Methods 0.000 description 1
- 210000003462 vein Anatomy 0.000 description 1
Images


Classifications
-
- G—PHYSICS
- G16—INFORMATION AND COMMUNICATION TECHNOLOGY [ICT] SPECIALLY ADAPTED FOR SPECIFIC APPLICATION FIELDS
- G16H—HEALTHCARE INFORMATICS, i.e. INFORMATION AND COMMUNICATION TECHNOLOGY [ICT] SPECIALLY ADAPTED FOR THE HANDLING OR PROCESSING OF MEDICAL OR HEALTHCARE DATA
- G16H20/00—ICT specially adapted for therapies or health-improving plans, e.g. for handling prescriptions, for steering therapy or for monitoring patient compliance
- G16H20/40—ICT specially adapted for therapies or health-improving plans, e.g. for handling prescriptions, for steering therapy or for monitoring patient compliance relating to mechanical, radiation or invasive therapies, e.g. surgery, laser therapy, dialysis or acupuncture
-
- A—HUMAN NECESSITIES
- A61—MEDICAL OR VETERINARY SCIENCE; HYGIENE
- A61B—DIAGNOSIS; SURGERY; IDENTIFICATION
- A61B8/00—Diagnosis using ultrasonic, sonic or infrasonic waves
- A61B8/12—Diagnosis using ultrasonic, sonic or infrasonic waves in body cavities or body tracts, e.g. by using catheters
-
- A—HUMAN NECESSITIES
- A61—MEDICAL OR VETERINARY SCIENCE; HYGIENE
- A61B—DIAGNOSIS; SURGERY; IDENTIFICATION
- A61B5/00—Measuring for diagnostic purposes; Identification of persons
- A61B5/02—Detecting, measuring or recording pulse, heart rate, blood pressure or blood flow; Combined pulse/heart-rate/blood pressure determination; Evaluating a cardiovascular condition not otherwise provided for, e.g. using combinations of techniques provided for in this group with electrocardiography or electroauscultation; Heart catheters for measuring blood pressure
- A61B5/02007—Evaluating blood vessel condition, e.g. elasticity, compliance
-
- A—HUMAN NECESSITIES
- A61—MEDICAL OR VETERINARY SCIENCE; HYGIENE
- A61B—DIAGNOSIS; SURGERY; IDENTIFICATION
- A61B5/00—Measuring for diagnostic purposes; Identification of persons
- A61B5/02—Detecting, measuring or recording pulse, heart rate, blood pressure or blood flow; Combined pulse/heart-rate/blood pressure determination; Evaluating a cardiovascular condition not otherwise provided for, e.g. using combinations of techniques provided for in this group with electrocardiography or electroauscultation; Heart catheters for measuring blood pressure
- A61B5/021—Measuring pressure in heart or blood vessels
- A61B5/0215—Measuring pressure in heart or blood vessels by means inserted into the body
- A61B5/02158—Measuring pressure in heart or blood vessels by means inserted into the body provided with two or more sensor elements
-
- A—HUMAN NECESSITIES
- A61—MEDICAL OR VETERINARY SCIENCE; HYGIENE
- A61B—DIAGNOSIS; SURGERY; IDENTIFICATION
- A61B5/00—Measuring for diagnostic purposes; Identification of persons
- A61B5/74—Details of notification to user or communication with user or patient ; user input means
- A61B5/742—Details of notification to user or communication with user or patient ; user input means using visual displays
- A61B5/743—Displaying an image simultaneously with additional graphical information, e.g. symbols, charts, function plots
-
- A—HUMAN NECESSITIES
- A61—MEDICAL OR VETERINARY SCIENCE; HYGIENE
- A61B—DIAGNOSIS; SURGERY; IDENTIFICATION
- A61B5/00—Measuring for diagnostic purposes; Identification of persons
- A61B5/74—Details of notification to user or communication with user or patient ; user input means
- A61B5/742—Details of notification to user or communication with user or patient ; user input means using visual displays
- A61B5/7435—Displaying user selection data, e.g. icons in a graphical user interface
-
- A—HUMAN NECESSITIES
- A61—MEDICAL OR VETERINARY SCIENCE; HYGIENE
- A61B—DIAGNOSIS; SURGERY; IDENTIFICATION
- A61B5/00—Measuring for diagnostic purposes; Identification of persons
- A61B5/74—Details of notification to user or communication with user or patient ; user input means
- A61B5/7475—User input or interface means, e.g. keyboard, pointing device, joystick
-
- A—HUMAN NECESSITIES
- A61—MEDICAL OR VETERINARY SCIENCE; HYGIENE
- A61B—DIAGNOSIS; SURGERY; IDENTIFICATION
- A61B6/00—Apparatus for radiation diagnosis, e.g. combined with radiation therapy equipment
- A61B6/50—Clinical applications
- A61B6/504—Clinical applications involving diagnosis of blood vessels, e.g. by angiography
-
- A—HUMAN NECESSITIES
- A61—MEDICAL OR VETERINARY SCIENCE; HYGIENE
- A61B—DIAGNOSIS; SURGERY; IDENTIFICATION
- A61B8/00—Diagnosis using ultrasonic, sonic or infrasonic waves
- A61B8/46—Ultrasonic, sonic or infrasonic diagnostic devices with special arrangements for interfacing with the operator or the patient
- A61B8/461—Displaying means of special interest
- A61B8/463—Displaying means of special interest characterised by displaying multiple images or images and diagnostic data on one display
-
- A—HUMAN NECESSITIES
- A61—MEDICAL OR VETERINARY SCIENCE; HYGIENE
- A61B—DIAGNOSIS; SURGERY; IDENTIFICATION
- A61B8/00—Diagnosis using ultrasonic, sonic or infrasonic waves
- A61B8/46—Ultrasonic, sonic or infrasonic diagnostic devices with special arrangements for interfacing with the operator or the patient
- A61B8/467—Ultrasonic, sonic or infrasonic diagnostic devices with special arrangements for interfacing with the operator or the patient characterised by special input means
- A61B8/468—Ultrasonic, sonic or infrasonic diagnostic devices with special arrangements for interfacing with the operator or the patient characterised by special input means allowing annotation or message recording
-
- G—PHYSICS
- G16—INFORMATION AND COMMUNICATION TECHNOLOGY [ICT] SPECIALLY ADAPTED FOR SPECIFIC APPLICATION FIELDS
- G16H—HEALTHCARE INFORMATICS, i.e. INFORMATION AND COMMUNICATION TECHNOLOGY [ICT] SPECIALLY ADAPTED FOR THE HANDLING OR PROCESSING OF MEDICAL OR HEALTHCARE DATA
- G16H30/00—ICT specially adapted for the handling or processing of medical images
- G16H30/40—ICT specially adapted for the handling or processing of medical images for processing medical images, e.g. editing
-
- G—PHYSICS
- G16—INFORMATION AND COMMUNICATION TECHNOLOGY [ICT] SPECIALLY ADAPTED FOR SPECIFIC APPLICATION FIELDS
- G16H—HEALTHCARE INFORMATICS, i.e. INFORMATION AND COMMUNICATION TECHNOLOGY [ICT] SPECIALLY ADAPTED FOR THE HANDLING OR PROCESSING OF MEDICAL OR HEALTHCARE DATA
- G16H50/00—ICT specially adapted for medical diagnosis, medical simulation or medical data mining; ICT specially adapted for detecting, monitoring or modelling epidemics or pandemics
- G16H50/50—ICT specially adapted for medical diagnosis, medical simulation or medical data mining; ICT specially adapted for detecting, monitoring or modelling epidemics or pandemics for simulation or modelling of medical disorders
-
- G—PHYSICS
- G16—INFORMATION AND COMMUNICATION TECHNOLOGY [ICT] SPECIALLY ADAPTED FOR SPECIFIC APPLICATION FIELDS
- G16H—HEALTHCARE INFORMATICS, i.e. INFORMATION AND COMMUNICATION TECHNOLOGY [ICT] SPECIALLY ADAPTED FOR THE HANDLING OR PROCESSING OF MEDICAL OR HEALTHCARE DATA
- G16H50/00—ICT specially adapted for medical diagnosis, medical simulation or medical data mining; ICT specially adapted for detecting, monitoring or modelling epidemics or pandemics
- G16H50/70—ICT specially adapted for medical diagnosis, medical simulation or medical data mining; ICT specially adapted for detecting, monitoring or modelling epidemics or pandemics for mining of medical data, e.g. analysing previous cases of other patients
-
- A—HUMAN NECESSITIES
- A61—MEDICAL OR VETERINARY SCIENCE; HYGIENE
- A61B—DIAGNOSIS; SURGERY; IDENTIFICATION
- A61B34/00—Computer-aided surgery; Manipulators or robots specially adapted for use in surgery
- A61B34/10—Computer-aided planning, simulation or modelling of surgical operations
- A61B2034/101—Computer-aided simulation of surgical operations
- A61B2034/102—Modelling of surgical devices, implants or prosthesis
- A61B2034/104—Modelling the effect of the tool, e.g. the effect of an implanted prosthesis or for predicting the effect of ablation or burring
-
- A—HUMAN NECESSITIES
- A61—MEDICAL OR VETERINARY SCIENCE; HYGIENE
- A61B—DIAGNOSIS; SURGERY; IDENTIFICATION
- A61B5/00—Measuring for diagnostic purposes; Identification of persons
- A61B5/48—Other medical applications
- A61B5/4848—Monitoring or testing the effects of treatment, e.g. of medication
Description
本開示は、概して、経皮的冠動脈インターベンション(PCI:percutaneous coronary intervention)計画のための脈管の評価に関する。例えば、本開示の幾つかの実施形態は、グラフィカルユーザインタフェースを使用して、脈管内に位置決めされるステントのグラフィック表現の特性を視覚化及び変化させることにより、ステントの位置、ステントの長さ、及びステントの直径等、PCIに関する生理学的パラメータを決定するのに適している。 The present disclosure relates generally to vascular assessment for percutaneous coronary intervention (PCI) planning. For example, some embodiments of the present disclosure use a graphical user interface to visualize and change the characteristics of a graphical representation of a stent positioned within a vessel, such as stent location, stent length, And suitable for determining physiological parameters for PCI, such as stent diameter.
疾患の治療の成功レベルを診断して検証するための技術革新は、単なる外部撮像プロセスから、内部診断プロセスを含むものへと進展している。X線、MRI、CTスキャン、蛍光透視法、血管造影法等の従来の外部画像技法に加えて、現在、小型のセンサが体内に直接配置され得る。例えば、カテーテル又はカテーテル法のために使用されるガイドワイヤ等、可撓性の細長い部材の遠位端に配置された超小型センサによって脈管構造の閉塞及び他の脈管構造の疾患を診断するための診断機器及びプロセスが開発されている。例えば、既知の医療的検知技法は、血管内超音波(IVUS:intravascular ultrasound)、前方視IVUS(FL−IVUS:forward looking IVUS)、冠血流予備量比(FFR:fractional flow reserve)測定、冠血流予備能(CFR:coronary flow reserve)測定、光干渉断層画像診断法(OCT:optical coherence tomography)、経食道心エコー検査、及び画像誘導療法を含む。 Innovations for diagnosing and validating successful levels of treatment of diseases are evolving from mere external imaging processes to those involving internal diagnostic processes. In addition to conventional external imaging techniques such as X-ray, MRI, CT scan, fluoroscopy, angiography, small sensors can now be placed directly inside the body. Diagnosis of vasculature obstruction and other vasculature disorders with microsensors placed at the distal end of flexible elongate members, such as catheters or guidewires used for catheterization. Diagnostic equipment and processes have been developed. For example, known medical sensing techniques include intravascular ultrasound (IVUS), forward looking IVUS (FL-IVUS), fractional flow reserve (FFR) measurement, and coronary flow. Includes coronary flow reserve (CFR) measurement, optical coherence tomography (OCT), transesophageal echocardiography, and image-guided therapy.
1つの例示的な処置タイプは、血管内の圧力測定を含む。虚血を引き起こす病変を含む血管内の狭窄部の重症度を評価するための現在受け入れられている技法は、冠血流予備量比(FFR)である。FFRは、(狭窄部の近位側で取られた)近位圧力測定量に対する(狭窄部の遠位側で取られた)遠位圧力測定量の比の計算である。FFRは、狭窄部の重症度の指標を提供し、これは、治療が必要とされる程度まで閉塞が脈管内の血流を制限しているかどうかの判断を可能にする。健康な脈管におけるFFRの正常値は1.00であり、約0.80未満の値が一般に有意と考えられ、治療を必要とする。血管を評価するための別の技法は、Instant Wave-Free Ratio(商標)機能(iFR(登録商標)機能)(両方ともVolcano Corp.の商標)を利用し、これは、心臓周期において自然状態で抵抗が一定であり最小になる時相(wave-free period)中の、狭窄部の前後での圧力比の決定を含む。iFRモダリティは、血管拡張剤の投与を必要としない。健康な脈管におけるiFRの正常値は1.00であり、約0.89未満の値が一般に有意と考えられ、治療を必要とする。 One exemplary treatment type involves intravascular pressure measurement. The currently accepted technique for assessing the severity of stenosis in blood vessels, including lesions that cause ischemia, is coronary flow reserve (FFR). FFR is a calculation of the ratio of the distal pressure measurement (taken distal to the stenosis) to the proximal pressure measurement (taken proximal to the stenosis). FFR provides an indication of the severity of the stenosis, which allows a determination of whether the occlusion limits intravascular blood flow to the extent that treatment is required. The normal value of FFR in healthy vessels is 1.00, values below about 0.80 are generally considered significant and require treatment. Another technique for assessing blood vessels utilizes the Instant Wave-Free Ratio (TM) function (iFR (R) function), both trademarks of Volcano Corp., which are naturally present in the cardiac cycle. This includes determining the pressure ratio before and after the constriction during the wave-free period when the resistance is constant and minimizes. The iFR modality does not require administration of vasodilators. The normal value of iFR in healthy vessels is 1.00, values less than about 0.89 are generally considered significant and require treatment.
治療を必要とする閉塞された血管が識別されたとき、経皮的冠動脈インターベンション(PCI)は、脈管を治療するために利用され得る療法処置である。PCIは血管形成術を含み、脈管を開くために狭窄部にわたってステントを位置決めすることを含む。従来、臨床医は、療法インターベンションを計画するために、圧力及び/又は流れの血管造影と生理学的測定とに依拠しているが、これらは有意に連携されていない。療法インターベンションの計画は、位置決め、長さ、及び直径等、ステントに関係する様々なパラメータを選択することを含むことができる。様々なデータ源を統合することが困難であるため、療法計画を開発するのは難しい。更に、入手可能なデータに基づいた療法インターベンションの有効性の予測はほぼ不可能である。例えば、従来、臨床医は、ステントの位置決め及び/又は長さの変更が及ぼすステント配置の有効性に対する効果を、収集されたデータによって裏付けられる臨床的な確信をもって判断することはできない。 When an occluded vessel in need of treatment has been identified, percutaneous coronary intervention (PCI) is a therapeutic treatment that can be utilized to treat the vessel. PCI involves angioplasty and involves positioning a stent over a stenosis to open a vessel. Traditionally, clinicians rely on angiography and physiological measurements of pressure and / or flow to plan therapy interventions, but these are not significantly coordinated. Planning a therapy intervention can include selecting various parameters related to the stent, such as positioning, length, and diameter. It is difficult to develop a therapeutic plan because it is difficult to integrate various data sources. Moreover, predicting the effectiveness of therapy interventions based on available data is nearly impossible. For example, conventionally, clinicians cannot determine the effect of stent positioning and / or length change on the effectiveness of stent placement with clinical confidence supported by the data collected.
従って、脈管内の閉塞の重症度、特に血管内の狭窄部を評価するための改良されたデバイス、システム、及び方法が依然として必要である。また、提案される療法を臨床医が効率的に計画して評価することを可能にするように、血管造影データと生理学的データとを連携させることによってPCIを計画するための改良されたデバイス、システム、及び方法も依然として必要である。更に、収集された生理学的データによる裏付けのもとで、臨床医が提案された療法を計画、評価、及び変更することを可能にする、脈管の視覚的描画、及び脈管内のステント等の提案された療法インターベンションを提供することが依然として必要である。 Accordingly, there remains a need for improved devices, systems, and methods for assessing the severity of intravascular occlusions, particularly intravascular stenosis. Also, an improved device for planning PCI by coordinating angiographic and physiological data to allow clinicians to efficiently plan and evaluate the proposed therapy, Systems and methods are still needed. Further, such as visual delineation of vessels and stents within vessels that allow clinicians to plan, evaluate, and modify the proposed therapy, supported by collected physiological data. It is still necessary to provide the proposed therapy intervention.
本開示の実施形態は、経皮的冠動脈インターベンション(PCI)として知られている手術処置を医師が効果的に計画することを可能にするために、血管内に位置決めされたステントを示すグラフィカルユーザインタフェースを提供するように構成される。血管内のステントの位置及び長さは、ユーザ入力に基づいて変更され得る。血管の画像は、脈管の長さに沿って計算された圧力比、圧力比に関連する脈管に沿った位置、及び脈管の名称を含め、医師を支援する様々な注釈を含むことができる。幾つかの実施形態では、ステントのメニューが医師に提供され、それにより、医師は、手術処置の計画中、在庫があり、且つ病院での使用のために入手可能なステントを選択することができる。 Embodiments of the disclosure disclose a graphical user showing a stent positioned within a blood vessel to enable a physician to effectively plan a surgical procedure known as percutaneous coronary intervention (PCI). It is configured to provide the interface. The position and length of the stent within the vessel can be changed based on user input. The image of the blood vessel may include various annotations to assist the physician, including the calculated pressure ratio along the length of the vessel, the location along the vessel associated with the pressure ratio, and the vessel name. it can. In some embodiments, a menu of stents is provided to the physician, which allows the physician to select stents that are in stock during surgery planning and are available for use in the hospital. .
例示的実施形態では、患者の脈管を評価する方法が提供される。この方法は、ディスプレイデバイスに画面表示を出力するステップであって、画面表示は、患者の脈管内に位置決めされた第1の器具及び第2の器具から、第2の器具が脈管を通して長手方向に移動され、且つ第1の器具が脈管内で静止したままである間に取得された圧力測定量に基づく視覚化表現と、脈管の視覚的表現とを含む、ステップと、療法処置をシミュレートするために視覚化表現を修正するためのユーザ入力を受信するステップと、ユーザ入力に基づいて視覚化表現を修正することを含め、ユーザ入力に応答して画面表示を更新するステップとを含む。 In an exemplary embodiment, a method of assessing a patient's vasculature is provided. The method comprises outputting a screen display to a display device, the screen display comprising a first device and a second device positioned within a vessel of a patient, the second apparatus longitudinally through the vessel. Simulating the therapeutic treatment, including a visualization representation based on the pressure measurements obtained while the first instrument was moved to the first position and remained stationary within the vessel, and a visual representation of the vessel. Receiving user input for modifying the visualization to modify the visualization, and updating the screen display in response to the user input, including modifying the visualization based on the user input. ..
幾つかの実施形態では、方法は、圧力測定量を取得するのと同時に血管造影データを取得するステップを更に含み、脈管の視覚的表現は、脈管の血管造影画像を含み、視覚化表現は、血管造影画像上のグラフィックオーバーレイを含む。幾つかの実施形態では、圧力測定量を取得するステップは、第2の器具を、一定の速度又は一定でない速度で脈管を通して移動させるステップを含む。幾つかの実施形態では、視覚化表現は、脈管の視覚的表現内に位置決めされたステントのグラフィック表現を含み、療法処置は、経皮的冠動脈インターベンションである。幾つかの実施形態では、方法は、ステントのグラフィック表現の特性に基づいて、脈管内で展開されるべきステントに関する生理学的パラメータを決定するステップを更に含む。幾つかの実施形態では、生理学的パラメータは、ステントの位置、ステントの長さ、及びステントの直径の少なくとも1つを含み、且つステントのグラフィック表現の特性は、位置、長さ、及び直径の少なくとも1つを含む。 In some embodiments, the method further comprises obtaining angiographic data at the same time as obtaining the pressure metric, and the visual representation of the vessel comprises an angiographic image of the vessel and a visualization representation. Includes a graphic overlay on the angiographic image. In some embodiments, obtaining the pressure measurement comprises moving the second instrument through the vessel at a constant velocity or a non-constant velocity. In some embodiments, the visualization representation comprises a graphic representation of the stent positioned within the visual representation of the vessel and the therapeutic procedure is a percutaneous coronary intervention. In some embodiments, the method further comprises determining a physiological parameter for the stent to be deployed intravascularly based on the characteristics of the graphical representation of the stent. In some embodiments, the physiological parameter comprises at least one of a location of the stent, a length of the stent, and a diameter of the stent, and a characteristic of the graphical representation of the stent is at least the location, the length, and the diameter. Including one.
幾つかの実施形態では、方法は、血管造影データと、取得された圧力測定量と、取得された圧力測定量に基づいて計算された圧力比との少なくとも1つに基づいて、ステントの長さと、ステントのグラフィック表現の長さとの少なくとも一方を自動で計算するステップを更に含み、視覚化表現は、計算された長さを有するステントのグラフィック表現を含む。幾つかの実施形態では、方法は、ユーザ入力に基づいて、ステントの長さとステントのグラフィック表現の長さとの少なくとも一方を決定するステップを更に含み、視覚化表現は、決定された長さを有するステントのグラフィック表現を含む。幾つかの実施形態では、方法は、血管造影データと脈管内で取得された血管内撮像データとの少なくとも一方に基づいて、ステントの直径とステントのグラフィック表現の直径との少なくとも一方を決定するステップを更に含む。幾つかの実施形態では、ユーザ入力を受信するステップは、脈管の視覚的表現内でステントのグラフィック表現を移動させるためのユーザ入力を受信するステップを含み、視覚化表現を修正するステップは、ユーザ入力に基づく位置にステントのグラフィック表現を出力するステップを含む。幾つかの実施形態では、ユーザ入力を受信するステップは、脈管の視覚的表現内のステントのグラフィック表現の長さを変えるためのユーザ入力を受信するステップを含み、視覚化表現を修正するステップは、受信されたユーザ入力に基づく長さでステントのグラフィック表現を出力するステップを含む。 In some embodiments, the method determines a stent length based on at least one of angiographic data, an acquired pressure measurement, and a pressure ratio calculated based on the acquired pressure measurement. , Further comprising automatically calculating at least one of a length of the graphic representation of the stent and the visualization representation includes a graphic representation of the stent having the calculated length. In some embodiments, the method further comprises determining at least one of a length of the stent and a length of the graphical representation of the stent based on user input, the visualization representation having the determined length. Contains a graphical representation of the stent. In some embodiments, the method determines at least one of a diameter of the stent and a diameter of a graphical representation of the stent based on at least one of angiographic data and intravascular acquired intravascular imaging data. Is further included. In some embodiments, receiving user input comprises receiving user input to move a graphical representation of the stent within the visual representation of the vessel, and modifying the visualization representation comprises: Outputting a graphical representation of the stent at a location based on user input. In some embodiments, receiving user input comprises receiving user input for varying the length of the graphic representation of the stent within the visual representation of the vessel, modifying the visualization representation. Includes outputting a graphical representation of the stent at a length based on the received user input.
幾つかの実施形態では、方法は、ステントの複数のグラフィック表現を出力するステップを更に含む。幾つかの実施形態では、方法は、臨床環境に関連するステントの在庫データベースに基づいて、ステントの複数のグラフィック表現を編纂するステップを更に含む。幾つかの実施形態では、方法は、ステントの複数のグラフィック表現のうちの1つを選択するためのユーザ入力を受信するステップであって、視覚化表現は、脈管の視覚的表現内に位置決めされたステントの選択されたグラフィック表現を含む、ステップと、血管造影データと、取得された圧力測定量と、取得された圧力測定量に基づいて計算された圧力比との少なくとも1つに基づいて、ステントの複数のグラフィック表現のうちからステントのグラフィック表現を自動で選択するステップであって、視覚化表現は、ステントの複数のグラフィック表現のうちから自動で選択されたステントのグラフィック表現を含む、ステップとの少なくとも一方を更に含む。 In some embodiments, the method further comprises outputting multiple graphical representations of the stent. In some embodiments, the method further comprises compiling a plurality of graphical representations of the stent based on the inventory database of stents associated with the clinical environment. In some embodiments, the method comprises receiving user input for selecting one of a plurality of graphical representations of the stent, the visualization representation positioned within the visual representation of the vessel. Based on at least one of: a selected graphical representation of the stent, angiographic data, an acquired pressure measurement, and a pressure ratio calculated based on the acquired pressure measurement. A step of automatically selecting a graphical representation of the stent from the plurality of graphical representations of the stent, the visualization representation including a graphical representation of the stent automatically selected from the plurality of graphical representations of the stent, And / or at least one of the steps.
幾つかの実施形態では、方法は、取得された圧力測定量に基づいて脈管内の圧力比を計算するステップを更に含み、視覚化表現は、計算された圧力比を更に含む。幾つかの実施形態では、視覚化表現は、取得された圧力測定量に関連する脈管内の位置を示すマーカと、脈管内の位置を示すマーカに隣接して位置決めされた計算された圧力比との少なくとも一方を更に含む。幾つかの実施形態では、方法は、脈管を自動で識別することを更に含み、視覚化表現は、決定された脈管の識別を示すラベルを更に含む。 In some embodiments, the method further comprises calculating an intravascular pressure ratio based on the obtained pressure measurement, and the visualization representation further comprises the calculated pressure ratio. In some embodiments, the visualization is a marker indicating a position within the vessel associated with the acquired pressure measurement and a calculated pressure ratio positioned adjacent the marker indicating the position within the vessel. And at least one of the above. In some embodiments, the method further comprises automatically identifying the vessel, and the visualization representation further comprises a label indicating the identified vessel.
別の例示的実施形態では、患者の脈管を評価するためのシステムが提供される。システムは、患者の脈管に導入するためにサイズ及び形状を定められた第1の器具と、患者の脈管に導入するためにサイズ及び形状を定められた第2の器具と、第1及び第2の器具並びにディスプレイデバイスに通信可能に接続された処理システムとを備え、処理システムは、患者の脈管内に位置決めされた第1の器具及び第2の器具から、第2の器具が脈管を通して長手方向に移動され、且つ第1の器具が脈管内で静止したままである間に圧力測定量を受信し、ディスプレイデバイスに、第1の器具及び第2の器具から受信された圧力測定量に基づく視覚化表現と、脈管の視覚的表現とを含む画面表示を出力し、療法処置をシミュレートするために視覚化表現を修正するためのユーザ入力を受信し、及びユーザ入力に基づいて視覚化表現を修正することを含め、ユーザ入力に応答して画面表示を更新するように構成される。 In another exemplary embodiment, a system for assessing a patient's vasculature is provided. The system comprises a first instrument sized and shaped for introduction into a patient's vessel, a second instrument sized and shaped for introduction into a patient's vessel, first and A second instrument and a processing system communicatively coupled to the display device, the processing system comprising a first instrument and a second instrument positioned within the vessel of the patient, the second instrument being the vessel. A pressure measurement received from the first device and the second device on the display device, the pressure measurement being received longitudinally through the first device and receiving the pressure measurement while the first device remains stationary in the vessel. Output a screen display including the visual representation of the vascular and a visual representation of the vessel, receiving user input to modify the visual representation to simulate a therapeutic procedure, and based on the user input Visualization Including the positive to be configured to update the screen display in response to user input.
幾つかの実施形態では、脈管の視覚的表現は、脈管の血管造影画像を含み、視覚化表現は、血管造影画像上のグラフィックオーバーレイを含む。幾つかの実施形態では、視覚化表現は、脈管の視覚的表現内に位置決めされたステントのグラフィック表現を含み、療法処置は、経皮的冠動脈インターベンションである。幾つかの実施形態では、処理システムは、ステントのグラフィック表現の特性に基づいて、脈管内で展開されるべきステントに関する生理学的パラメータを決定するように更に構成される。幾つかの実施形態では、生理学的パラメータは、ステントの位置、ステントの長さ、及びステントの直径の少なくとも1つを含み、且つステントのグラフィック表現の特性は、位置、長さ、及び直径の少なくとも1つを含む。 In some embodiments, the visual representation of the vessel comprises an angiographic image of the vessel and the visualization representation comprises a graphic overlay on the angiographic image. In some embodiments, the visualization representation comprises a graphic representation of the stent positioned within the visual representation of the vessel and the therapeutic procedure is a percutaneous coronary intervention. In some embodiments, the processing system is further configured to determine a physiological parameter for the stent to be deployed within the vessel based on the characteristics of the graphical representation of the stent. In some embodiments, the physiological parameter comprises at least one of a location of the stent, a length of the stent, and a diameter of the stent, and a characteristic of the graphical representation of the stent is at least the location, the length, and the diameter. Including one.
幾つかの実施形態では、処理システムは、血管造影データと、受信された圧力測定量と、受信された圧力測定量に基づいて計算された圧力比との少なくとも1つに基づいて、ステントの長さとステントのグラフィック表現の長さとの少なくとも一方を自動で計算するように更に構成され、視覚化表現は、計算された長さを有するステントのグラフィック表現を含む。幾つかの実施形態では、処理システムは、ユーザ入力に基づいて、ステントの長さとステントのグラフィック表現の長さとの少なくとも一方を決定するように更に構成され、視覚化表現は、決定された長さを有するステントのグラフィック表現を含む。 In some embodiments, the processing system determines the length of the stent based on at least one of angiographic data, a received pressure measurement, and a pressure ratio calculated based on the received pressure measurement. And a length of the graphic representation of the stent are further configured to be automatically calculated, and the visualization representation comprises a graphic representation of the stent having the calculated length. In some embodiments, the processing system is further configured to determine the length of the stent and / or the length of the graphical representation of the stent based on user input, the visualization representation being the determined length. Including a graphical representation of a stent having a.
幾つかの実施形態では、処理システムは、血管造影データ及び血管内超音波(IVUS)データの少なくとも一方に基づいて、ステントの直径とステントのグラフィック表現の直径との少なくとも一方を自動で計算するように更に構成される。幾つかの実施形態では、処理システムは、脈管の視覚的表現内でステントのグラフィック表現を移動させるためのユーザ入力を受信することにより、ユーザ入力を受信するように構成され、処理システムは、ユーザ入力に基づく位置にステントのグラフィック表現を出力することにより、視覚化表現を修正するように構成される。幾つかの実施形態では、処理システムは、脈管内でステントのグラフィック表現の長さを変えるためのユーザ入力を受信することにより、ユーザ入力を受信するように構成され、処理システムは、受信されたユーザ入力に基づく長さを有するステントのグラフィック表現を出力することにより、視覚化表現を修正するように構成される。 In some embodiments, the processing system automatically calculates the diameter of the stent and / or the diameter of the graphical representation of the stent based on the angiographic data and / or the intravascular ultrasound (IVUS) data. Is further configured. In some embodiments, the processing system is configured to receive the user input by receiving the user input to move the graphical representation of the stent within the visual representation of the vessel, the processing system comprising: It is configured to modify the visualization representation by outputting a graphical representation of the stent at a location based on user input. In some embodiments, the processing system is configured to receive the user input by receiving the user input to alter the length of the graphical representation of the stent within the vessel, and the processing system receives the user input. It is configured to modify the visualization representation by outputting a graphical representation of the stent having a length based on user input.
幾つかの実施形態では、処理システムは、ステントの複数のグラフィック表現を出力するように更に構成される。幾つかの実施形態では、処理システムは、臨床環境に関連するステントの在庫データベースに基づいて、ステントの複数のグラフィック表現を編纂するように更に構成される。幾つかの実施形態では、処理システムは、ステントの複数のグラフィック表現のうちの1つを選択するためのユーザ入力を受信することであって、視覚化表現は、ステントの複数のグラフィック表現のうちから選択されたステントのグラフィック表現を含む、受信することと、血管造影データと、受信された圧力測定量と、受信された圧力測定量に基づいて計算された圧力比との少なくとも1つに基づいて、ステントの複数のグラフィック表現のうちからステントのグラフィック表現を自動で選択することであって、視覚化表現は、ステントの複数のグラフィック表現のうちから自動で選択されたステントのグラフィック表現を含む、選択することとの少なくとも一方を行うように更に構成される。 In some embodiments, the processing system is further configured to output multiple graphical representations of the stent. In some embodiments, the processing system is further configured to compile a plurality of graphical representations of the stent based on the inventory database of stents associated with the clinical environment. In some embodiments, the processing system is receiving user input for selecting one of the plurality of graphical representations of the stent, the visualization representation being the one of the plurality of graphical representations of the stent. Based on at least one of receiving, angiographic data, a received pressure measurement, and a pressure ratio calculated based on the received pressure measurement, including a graphical representation of a stent selected from And automatically selecting a graphical representation of the stent from the plurality of graphical representations of the stent, wherein the visualization representation includes the graphical representation of the stent automatically selected from the plurality of graphical representations of the stent. , And / or selecting.
幾つかの実施形態では、処理システムは、受信された圧力測定量に基づいて脈管内の圧力比を計算するように更に構成され、視覚化表現は、計算された圧力比を更に含む。幾つかの実施形態では、視覚化表現は、取得された圧力測定量に関連する脈管内の位置を示すマーカと、脈管内の位置を示すマーカに隣接して位置決めされた計算された圧力比との少なくとも一方を更に含む。幾つかの実施形態では、連続するマーカは、脈管の視覚的表現に沿って不均等間隔で位置決めされる。幾つかの実施形態では、処理システムは、脈管を自動で識別するように更に構成され、視覚化表現は、決定された脈管の識別を示すラベルを更に含む。 In some embodiments, the processing system is further configured to calculate an intravascular pressure ratio based on the received pressure measurement, and the visualization representation further comprises the calculated pressure ratio. In some embodiments, the visualization is a marker indicating a position within the vessel associated with the acquired pressure measurement and a calculated pressure ratio positioned adjacent the marker indicating the position within the vessel. And at least one of the above. In some embodiments, consecutive markers are non-uniformly positioned along the visual representation of the vessel. In some embodiments, the processing system is further configured to automatically identify the vessel and the visualization representation further includes a label indicating the determined vessel identification.
本開示の更なる態様、特徴、及び利点は、以下の詳細な説明から明らかになるであろう。 Further aspects, features and advantages of this disclosure will be apparent from the detailed description below.
添付図面を参照して、本開示の例示的実施形態を述べる。 Exemplary embodiments of the present disclosure will be described with reference to the accompanying drawings.
本開示の原理の理解を助長することを目的として、以下、図示された実施形態が参照され、また、その説明のために具体的な表現が使用される。しかしながら、本開示の範囲を限定する意図はないことを理解されたい。本開示が関連する分野の当業者が通常考えつくであろう開示される装置、システム、及び方法への任意の変更及びさらなる改変、並びに本開示の原理の任意のさらなる用途が完全に考慮され、本開示の範囲に含まれる。特に、一実施形態に関連して説明された特徴、部品、及び/又はステップが、本開示の他の実施形態に関連して説明された特徴、部品、及び/又はステップと組み合わせられ得ることが完全に考慮される。しかしながら、簡潔さのため、これらの組み合わせは個別に何度も繰り返し説明されない。 To facilitate an understanding of the principles of the disclosure, reference will now be made to the illustrated embodiments and specific language will be used for the description thereof. However, it should be understood that there is no intent to limit the scope of the present disclosure. Any alterations and further modifications to the disclosed devices, systems, and methods that would normally occur to one of ordinary skill in the art to which this disclosure pertains, as well as any further uses of the principles of this disclosure, are fully considered. Included within the scope of disclosure. In particular, features, components, and / or steps described in connection with one embodiment may be combined with features, components, and / or steps described in connection with other embodiments of the present disclosure. Fully considered. However, for the sake of brevity, these combinations will not be individually and repeatedly described.
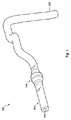
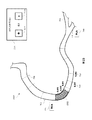
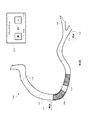
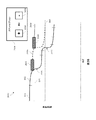
図1及び図2を参照して、本開示の一実施形態に係る狭窄を有する導管100が示されている。図1は導管100の図式的な斜視図であり、図2は図1の切断線2−2に沿って取られた導管100の部分の部分的断面斜視図である。図1をより詳細に参照すると、導管100は、近位部分102及び遠位部分104を含む。導管100の長さに沿って、近位部分102と遠位部分104との間に管腔106が延在する。この点において、管腔106は導管内を流体が流れることを可能にするよう構成されている。一部の実施形態では、導管100は血管である。一部の具体的実施形態では、導管100は冠動脈である。このような場合、管腔106は、導管100内の血流を促進するよう構成される。
Referring to FIGS. 1 and 2, a
図示されるように、導管100は、近位部分102と遠位部分104との間に狭窄108を含む。狭窄108は、導管100の管腔106中の流体の流れを制限する任意の障害物又は他の構造的配置を一般的に表す。本開示の実施形態は、限定はされないが、冠状、末梢(限定はされないが、下肢、頸動脈、神経血管を含む)、腎臓、及び/又は静脈を含む多様な血管への適用に適する。導管100が血管の場合、狭窄108は、限定はされないが、線維、線維脂質(線維脂肪)、壊死性コア、石灰化(濃縮カルシウム)、血液、新鮮な血栓、及び成熟した血栓等のプラーク成分を含むプラークの蓄積の結果であり得る。一般的に、狭窄の組成は評価される導管の種類に依存する。これに関して、本開示の概念は、実質的にあらゆる種類の障害物又は流量の減少をもたらす他の導管狭窄に適用可能である。
As shown, the
図2についてより詳細に参照すると、導管100の管腔106は、狭窄108の近位直径110及び狭窄の遠位直径112を有する。一部の実施形態では、直径110及び112は、実質的に等しい。この点において、直径110及び112は管腔106の健康な部分、又は少なくとも狭窄108と比較してより健康な部分を表すことを意図する。したがって、管腔106のこれらのより健康な部分は、実質的に一定の円筒状プロフィールを有するよう描かれており、よって、管腔の高さ又は幅を直径として述べた。しかしながら、多くの場合、管腔106のこれらの部分も、狭窄108ほどではないがプラーク堆積物、非対称プロフィール、及び/又は他の不規則性を有し、よって円筒状プロフィールを有さないことを理解されたい。このような場合、直径110及び112は、管腔の相対的サイズ又は断面積を表すものであり、円形の断面プロフィールを示唆しないことを理解されたい。
Referring more particularly to FIG. 2, the
図2に示されるように、狭窄108は、導管100の管腔106を狭めるプラーク堆積物114を含む。場合によっては、プラーク堆積物114は均等な又は対称なプロフィールを有さず、かかる狭窄の血管造影評価を信頼できないものにする。図示の実施形態では、プラーク堆積物114は上部116及び対向する下部118を含む。この点について、下部118は上部116よりも厚く、これは、狭窄108から近位及び遠位の管腔部分と比較して、非対称かつ不均等なプロフィールをもたらす。図示されるように、プラーク堆積物114は、流体が管腔106中を流れるために利用可能な空間を減少させる。特に、管腔106の断面積がプラーク堆積物114によって減少される。上部116と下部118との間の最も狭い地点において、管腔106は、狭窄108の近位及び遠位の直径110及び112に対して減少されたサイズ又は断面積を表す高さ120を有する。プラーク堆積物114を含む狭窄108は本質的に例示的であることに留意されたい。この点について、他の場合では、狭窄108は、管腔106内の流体の流れを制限する他の形状及び/又は組成を有することを理解されたい。図1及び図2では、単一の狭窄108を有する導管100が示され、後述される実施形態の記載は主に単一の狭窄を前提としているが、本明細書に記載される装置、システム、及び方法は、複数の狭窄領域を有する導管についても同様な用途を有することを理解されたい。
As shown in FIG. 2, the stenosis 108 includes a plaque deposit 114 that narrows the
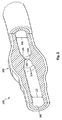
次に図3を参照して、本開示の一実施形態に係る器具130及び132が挿入された導管100が示されている。一般的に、器具130及び132は、導管内に配置されるよう寸法設定及び成形された装置、器具、又はプローブの任意の形態を取り得る。図示の実施形態では、器具130は一般的にガイドワイヤーを表し、器具132は一般的にカテーテルを表す。これに関して、器具130は器具132の中央管腔を通る。しかし、他の実施形態では、器具130及び132は他の形態を取る。これに関して、器具130及び132は一部の実施形態では同様な形態からなる。例えば、一部の実施形態では、器具130及び132はともにガイドワイヤーである。他の実施形態では、器具130及び132はともにカテーテルである。また、一方の器具がカテーテルで他方の器具がガイドワイヤーである図示の実施形態のように、一部の実施形態では器具130及び132は異なる形態からなる。また、一部の実施形態では、図3に示される実施形態のように、器具130及び132は同軸配置される。他の実施形態では、一方の器具が他方の器具のオフセンター管腔を通る。他の実施形態では、器具130及び132は並列して延在する。特定の実施形態では、少なくとも1つの器具がラピッドエクスチェンジデバイス、例えばラピッドエクスチェンジカテーテル等である。かかる実施形態では、他方の器具はバディーワイヤー、又はラピッドエクスチェンジデバイスの導入及び除去を容易化するよう構成された他のデバイスである。さらに、他の実施形態では、2つの別々の器具130及び132の代わりに単一の器具が使用される。これに関して、単一の器具は、一部の実施形態では器具130及び132の両方の機能(例えば、データ取得)の側面を備える。
Referring now to FIG. 3, a
器具130は、導管100に関する診断情報を取得するよう構成される。これに関して、器具130は、1つ又は複数のセンサ、トランスデューサ、及び/又は導管に関する診断情報を取得するよう構成された他のモニタリング要素を含む。診断情報は、圧力、フロー(速度及び/又はボリューム)、画像(超音波(例えば、IVUS)、OCT、熱、及び/又は他のイメージング技術を使用して取得された画像を含む)、温度、及び/又はこれらの組み合わせのうちの1つ又は複数を含む。一部の実施形態では、1つ又は複数のセンサ、トランスデューサ、及び/又は他のモニタリング要素は、器具130の遠位部分に隣接するよう配置される。これに関して、1つ又は複数のセンサ、トランスデューサ、及び/又は他のモニタリング要素は、一部の実施形態では、器具130の遠位端134から30cm未満、10cm未満、5cm未満、3cm未満、2cm未満、及び/又は1cm未満に配置される。一部の実施形態では、1つ又は複数のセンサ、トランスデューサ、及び/又は他のモニタリング要素のうちの少なくとも1つが器具130の遠位端に配置される。
The
器具130は、導管100内の圧力をモニタリングするよう構成された少なくとも1つの要素を含む。圧力モニタリング要素は、ピエゾ抵抗式圧力センサ、ピエゾ電気式圧力センサ、静電容量式圧力センサ、電磁式圧力センサ、液柱(液柱は、器具とは別個の及び/又は液柱から近位の器具の部分に配置された液柱センサと連絡する)、光学圧力センサ、及び/又はこれらの組み合わせの形態を取り得る。一部の実施形態では、圧力モニタリング要素の1つ又は複数の機能は、半導体及び/又は他の適切な製造技術を使用して製造された固体要素として実現される。適切な圧力モニタリング要素を含む市販されているガイドワイヤー製品の例は、限定はされないが、それぞれがVolcano Corporation から入手可能なVerrara圧力ガイドワイヤー、PrimeWirePrestige(登録商標)PLUS圧力ガイドワイヤー、ComboWire(登録商標)XT圧力及びフローガイドワイヤー、並びにそれぞれがSt. Jude Medical, Inc.から入手可能なPressureWire(登録商標) Certusガイドワイヤー及びPressureWire(登録商標) Aerisガイドワイヤーを含む。一般的に、器具130は、遠位圧力読み取り値に影響を及ぼす、狭窄前後の流体の流れに顕著な影響を及ぼすことなく狭窄108を通過して配置され得るよう寸法設定される。したがって、一部の実施形態では、器具130は0.018”以下の外径を有する。一部の実施形態では、器具130は0.014”以下の外径を有する。一部の実施形態では、器具130は0.035”以下の外径を有する。
器具132も導管100に関する診断情報を取得するよう構成される。一部の実施形態では、器具132は、器具130と同じ診断情報を取得するよう構成される。他の実施形態では、器具132は、器具130とは異なる診断情報を含むよう構成され、これは、追加診断情報、より少ない診断情報、及び/又は代替的な診断情報を含み得る。器具132によって取得される診断情報は、圧力、フロー(速度及び/又はボリューム)、画像(超音波(例えばIVUS)、OCT、熱、及び/又は他のイメージング技術を使用して取得された画像を含む)、温度、及び/又はこれらの組み合わせのうちの1つ又は複数を含む。器具132は、1つ又は複数のセンサ、トランスデューサ、及び/又は診断情報を取得するよう構成された他のモニタリング要素を含む。これに関して、1つ又は複数のセンサ、トランスデューサ、及び/又は他のモニタリング要素は、一部の実施形態では、器具132の遠位部分に隣接して配置される。これに関して、一部の実施形態では、1つ又は複数のセンサ、トランスデューサ、及び/又は他のモニタリング要素は、器具132の遠位端136から30cm未満、10cm未満、5cm未満、3cm未満、2cm未満、及び/又は1cm未満に配置される。一部の実施形態では、1つ又は複数のセンサ、トランスデューサ、及び/又はモニタリング要素のうちの少なくとも1つは、器具132の遠位端に配置される。
Instrument 132 is also configured to obtain diagnostic
器具130と同様に、器具132も、導管100内の圧力をモニタリングするよう構成された少なくとも1つの要素を含む。圧力モニタリング要素は、ピエゾ抵抗式圧力センサ、ピエゾ電気式圧力センサ、静電容量式圧力センサ、電磁式圧力センサ、液柱(液柱は、器具とは別個の及び/又は液柱から近位の器具の部分に配置された液柱センサと連絡する)、光学圧力センサ、及び/又はこれらの組み合わせの形態を取り得る。一部の実施形態では、圧力モニタリング要素の1つ又は複数の機能は、半導体及び/又は他の適切な製造技術を使用して製造された固体要素として実現される。SiemensのAXIOM Sensis、MennenのHorizon Xvu、及びPhilipsのXper IM Physiomonitoring 5のうちの1つ又は複数との使用に適し、圧力モニタリング要素を含む現在市販されているカテーテル製品が器具132として使用され得る。
Like the
本開示の側面によれば、器具130及び132のうちの少なくとも1つは、狭窄108の遠位の導管100内の圧力をモニタリングするよう構成され、器具130及び132のうちの少なくとも1つは、狭窄の近位の導管内圧力をモニタリングするよう構成される。これに関して、器具130、132は、導管100内の圧力をモニタリングするよう構成された少なくとも1つの要素が、デバイスの構成に基づき適宜に狭窄108の近位に及び/又は遠位に配置され得るよう寸法設定及び成形される。これに関して、図3は、狭窄108の遠位の圧力を測定するのに適した位置138を示す。これに関して、一部の実施形態では、位置138は(図2に示されるように)狭窄108の遠位端から5cm未満、3cm未満、2cm未満、1cm未満、5mm未満、及び/又は2.5mm未満である。また、図3は、狭窄108の近位の圧力を測定するのに適した複数の位置を示す。これに関して、位置140、142、144、146、及び148は、一部の実施形態において狭窄の近位の圧力をモニタリングするのに適した位置をそれぞれ表す。これに関して、位置140、142、144、146、及び148は、20cm以上から約5mm以下の範囲にわたり、狭窄108の近位端から異なる距離に配置されている。一般的に、近位圧力測定は、狭窄の近位端から離隔される。したがって、一部の実施形態では、近位圧力測定は、狭窄の近位端から導管の管腔の内径以上の距離において行われる。冠動脈圧測定の場合、近位圧力測定は、通常、血管の近位部分において、狭窄の近位かつ大動脈の遠位の位置で行われる。しかし、冠動脈圧測定の特定の実施形態では、近位圧力測定は大動脈内の位置で行われる。他の実施形態では、近位圧力測定は、冠動脈の起始部又は入口において行われる。
According to aspects of the present disclosure, at least one of the
一部の実施形態では、器具130及び132のうちの少なくとも1つは、管腔106内を移動されている間に導管100内の圧力をモニタリングするよう構成される。一部の実施形態では、器具130は、管腔106内を移動し狭窄108を通過するよう構成される。これに関して、一部の実施形態では、器具130は狭窄108の遠位に配置され、狭窄を通過して狭窄の近位の位置に至るまで近位に移動される(すなわち、引き戻される)。他の実施形態では、器具130は狭窄108の近位に配置され、狭窄を通過して狭窄の遠位の位置に至るまで遠位に動かされる。一部の実施形態では、器具130の近位又は遠位への移動は、医療従事者によって手動で制御される(例えば、外科医の手によって)。他の実施形態では、器具130の近位又は遠位への移動は、移動制御デバイス(例えば、Volcano Corporationから入手可能なTrak Back II Device等のプルバックデバイス)によって自動的に制御される。これに関して、一部の実施形態では、移動制御デバイスは、器具130の移動を選択可能な既知の速度(例えば、2.0mm/s、1.0mm/s、0.5mm/s、0.2mm/s等)で制御する。一部の実施形態では、導管中の器具130の移動は、プルバック又はプッシュスルー毎に連続的である。他の実施形態では、器具130は導管内を段階的に動かされる(すなわち、繰り返し所定距離及び/又は所定時間動かされる)。後述される視覚的描写のいくつかの側面は、器具130及び132のうちの少なくとも1つが管腔106内を移動される実施形態に特に適する。さらに、一部の特定の実施形態では、以下で論じられる視覚的描写の側面は、第2の器具が存在し又は存在せずに、単一の器具が管腔106内を移動される実施形態に特に適する。
In some embodiments, at least one of
器具130及び/又は132は、Instant Wave-Free Ratio(商標)Functionality(iFR(登録商標)Functionality)(両方ともボルケーノ社の商標)及び「DEVICES, SYSTEMS, AND METHODS FOR ASSESSING A VESSEL」との名称の米国特許出願13/460296に開示された内容と関連する医療検知処置を実施するように使用でき、米国特許出願13/460296は、充血剤の付与なしに利用可能な圧力比の利用を開示し、本明細書に参照により完全に組み込まれるものとする。更に、(iFR(登録商標)、FFRを見積もるために適切な補償されたPd/Pa比、及び/又は全体を参照により本明細書に援用する「DEVICES, SYSTEMS, AND METHODS FOR TREATMENT OF VESSELS」との名称の2014年7月14日出願の米国仮特許出願第62/024,005号に記載されているような他の受け入れられる診断圧力比と関連する医療検知処置は、器具130及び/又は132を使用して実施できる。
The
次に、図4を参照して、本開示の一実施形態に係るシステム150が示されている。これに関して、図4は、システム150の図式的な概略図である。図示されるように、システム150は器具152を含む。これに関して、一部の実施形態では、器具152は、上記器具130及び132のうちの少なくとも1つとしての使用に適する。したがって、一部の実施形態では、器具152は、いくつかの実施形態において器具130及び132に関連して上記した特徴と同様な特徴を含む。当該図示の実施形態では、器具152は、遠位部分154と、遠位部分154に隣接する筐体156とを有するガイドワイヤーである。これに関して、筐体156は、器具152の遠位端から約3cm離れている。筐体156は、1つ又は複数のセンサ、トランスデューサ、及び/又は導管に関する診断情報を取得するよう構成された他のモニタリング要素を収容するよう構成される。図示の実施形態では、筐体156は、器具152が挿入された管腔内の圧力をモニタリングするよう構成された圧力センサを少なくとも収容する。筐体156から近位にシャフト158が伸びる。シャフト158の近位部分にかけてトルクデバイス160が配置され、結合される。器具152の近位端部162は、コネクタ164に結合される。コネクタ164からコネクタ168にケーブルが伸びる。一部の実施形態では、コネクタ168はインターフェイス170にプラグインされるよう構成される。これに関して、一部の実施形態では、インターフェイス170は患者インターフェイスモジュール(patient interface module;PIM)である。一部の実施形態では、ケーブル166は、無線接続によって置き換えられる。これに関して、物理的接続(電気的、光学的、及び/又は流体接続を含む)、無線接続、及び/又はこれらの組み合わせを含む様々な通信経路が器具152とインターフェイス170との間で使用可能なことを理解されたい。
4, a
インターフェイス170は、接続174を介してコンピュータデバイス172に通信結合される。コンピュータデバイス172は、本開示に記載される処理及び解析技術を実行するのに適した任意のデバイスを一般的に表す。一部の実施形態では、コンピュータデバイス172はプロセッサ、RAM、及び記憶媒体を含む。これに関して、一部の特定の実施形態では、コンピュータデバイス172は、本明細書に記載されるデータ取得及び解析に関連するステップを実行するようプログラミングされる。したがって、データ取得、データ処理、機器制御、及び/又は本開示の他の処理又は制御側面に関連する任意のステップが、コンピュータデバイスにより、コンピュータデバイスがアクセス可能な非一時的コンピュータ可読媒体に保存された対応する命令を使用して実行され得ることを理解されたい。一部の実施形態では、コンピュータデバイス172はコンソールデバイスである。一部の特定の実施形態では、コンピュータデバイス172は、それぞれVolcano Corporationから入手可能なs5TMImaging System又はs5iTM Imaging Systemと同様である。一部の実施形態では、コンピュータデバイス172はポータブルである(例えば、ハンドヘルド、台車上にある等)。一部の実施形態では、コンピュータデバイス172の一部又は全ては、ここで説明された1つ以上の処理ステップがベッドサイドコントローラの処理部品により実施できるように、ベッドサイドコントローラとして実装できる。例示的なベッドコントローラは、全体を参照により本明細書に援用する「Bedside Controller for Assessment of Vessels and Associated Devices, Systems, and Methods」という名称の2014年9月11日出願の米国仮特許出願第62/049,265号に説明されている。また、一部の実施形態では、コンピュータデバイスは複数のコンピュータデバイスを含むことを理解されたい。これに関して、本開示の異なる処理及び/又は制御側面は、複数のコンピュータデバイスを使用して別々に又は所定のグループで実行され得ることを特に理解されたい。複数のコンピュータデバイス間の後述される処理及び/又は制御側面の任意の分割及び/又は組み合わせが本開示の範囲に含まれる。
Interface 170 is communicatively coupled to computing device 172 via
コネクタ164、ケーブル166、コネクタ168、インターフェイス170、及び接続174は合わせて、1つ又は複数のセンサ、トランスデューサ、及び/又は器具152の他のモニタリング要素と、コンピュータデバイス172との間の通信を助長する。しかし、この接続経路は本質的に例示的であり、如何なる意味でも限定的であると考えられるべきではない。これに関して、物理的接続(電気的、光学的、及び/又は流体接続を含む)、無線接続、及び/又はこれらの組み合わせを含む任意の接続経路が器具152とコンピュータデバイス172との間で使用され得る。これに関して、一部の実施形態では、接続174は無線であることが理解される。一部の実施形態では、接続174はネットワーク(例えば、イントラネット、インターネット、テレコミュニケーションネットワーク、及び/又は他のネットワーク)を介する通信リンクを含む。これに関して、一部の実施形態では、コンピュータデバイス172は、器具152が使用されているオペレーションエリアから遠方に配置されることが理解される。接続174がネットワーク接続を含むことは、コンピュータデバイスが近隣の部屋、近隣の建物、又は異なる国にあるかに関わらず、器具152と遠隔コンピュータデバイス172との間の通信を助長し得る。また、一部の実施形態では、器具152とコンピュータデバイス172との間の通信経路はセキュア通信であることを理解されたい。さらに、一部の実施形態では、器具152とコンピュータデバイス172との間の通信経路の1つ又は複数の部分を介して通信されるデータは暗号化されることを理解されたい。
The connector 164, cable 166, connector 168, interface 170, and
また、システム150は器具175を含む。これに関して、一部の実施形態では、器具175は、上記器具130及び132のうちの少なくとも1つとしての使用に適する。したがって、一部の実施形態では、器具175は、いくつかの場合において器具130及び132に関連して上記した特徴と同様な特徴を含む。図示の実施形態では、器具175はカテーテル型デバイスである。これに関して、器具175は、1つ又は複数のセンサ、トランスデューサ、及び/又は導管に関する診断情報を取得するよう構成された器具の遠位部分に隣接する他のモニタリング要素を含む。図示の実施形態では、器具175は、器具175が挿入された管腔内の圧力をモニタリングするよう構成された圧力センサを含む。器具175は、接続177を介してインターフェイス176と通信する。一部の実施形態では、インターフェイス176は、Siemens AXIOM Sensis、Mennen Horizon XVu、及びPhilips Xper IM Physiomonitoring 5等の血行動態モニタリングシステム又は他の制御デバイスである。ある特定の実施形態では、器具175は、その長さにわたり延在する液柱を含む圧力感知カテーテルである。かかる実施形態では、インターフェイス176は、カテーテルの液柱に流体結合された止血弁、止血弁に流体結合されたマニホールド、及び構成要素を流体結合するよう構成要素間に適宜延在するチューブを含む。これに関して、カテーテルの液柱は、弁、マニホールド、及びチューブを介して圧力センサと流体連絡する。一部の実施形態では、圧力センサはインターフェイス176の一部である。他の実施形態では、圧力センサは、器具175とインターフェイス176との間に配置された別個の部品である。インターフェイス176は、接続178を介してコンピュータデバイス172に通信結合される。
The
コンピュータデバイス172は、接続182を介して表示装置180に通信的に結合される。幾つかの実施形態では、表示装置180はコンピュータデバイス172の一部である一方、他の実施形態では、表示装置180はコンピュータデバイス172とは別個である。幾つかの実施形態では、表示装置180は、例えば、全体を参照により本明細書に援用する「Bedside Controller for Assessment of Vessels and Associated Devices, Systems, and Methods」という名称の2014年9月11日出願の米国仮特許出願第62/049,265号に記載されているタッチスクリーンディスプレイを持つベッドサイドコントローラとして実施される。コンピュータデバイス172は、器具152、157及び他の器具により集められたデータ、集められたデータに基づいて計算された量、データが集められた血管の視覚化表現、並びに、集められたデータ及び計算された量に基づいた視覚化表現を含む画面表示を生成できる。例示的画面表示が図7−図28に示されている。コンピュータデバイス172は、画面表示に関連する表示データを表示装置180に供給できる。コンピュータデバイス172は、追加的に、ユーザインタフェースデバイスと通信的に結合できる。ユーザインタフェースデバイスは、ユーザが表示装置180上で画面表示との対話を可能にする。例えば、ユーザは、ユーザインタフェースデバイスを用いて画面表示の一部又は全てを修正するためにユーザ入力を提供できる。例示的ユーザ入力及び画面表示への対応する修正が、図7−図28に示されている。幾つかの実施形態では、ユーザインタフェースデバイスは、表示装置180とは別個の部品である。他の実施形態では、ユーザインタフェースデバイスは、表示装置180の一部である。例えば、ユーザインタフェースデバイスは、例えば、全体を参照により本明細書に援用する「Bedside Controller for Assessment of Vessels and Associated Devices, Systems, and Methods」という名称の2014年9月11日出願の米国仮特許出願第62/049,265号に記載されているタッチスクリーンディスプレイを持つベッドサイドコントローラとして実施される。斯様な実施形態では、ユーザ入力は、ベッドサイドコントローラのタッチ感応ディスプレイ上で受信されるタッチ入力であり得る。
Computing device 172 is communicatively coupled to
器具152とコンピュータデバイス172との間の接続と同様に、インターフェイス176並びに接続177及び178は、1つ又は複数のセンサ、トランスデューサ、及び/又は器具175の他のモニタリング要素と、コンピュータデバイス172との間の接続を助長する。しかし、この通信経路は本質的に例示的であり、如何なる意味でも限定的であると考えられるべきではない。これに関して、物理的接続(電気的、光学的、及び/又は流体接続を含む)、無線接続、及び/又はこれらの組み合わせを含む任意の接続経路が器具175とコンピュータデバイス172との間で使用され得る。これに関して、一部の実施形態では、接続178は無線であることが理解される。一部の実施形態では、接続178はネットワーク(例えば、イントラネット、インターネット、テレコミュニケーションネットワーク、及び/又は他のネットワーク)を介する通信リンクを含む。これに関して、一部の実施形態では、コンピュータデバイス172は、器具175が使用されているオペレーションエリアから遠方に配置されることが理解される。接続178がネットワーク接続を含むことは、コンピュータデバイスが近隣の部屋、近隣の建物、又は異なる国にあるかに関わらず、器具175と遠隔コンピュータデバイス172との間の通信を助長し得る。また、一部の実施形態では、器具175とコンピュータデバイス172との間の通信経路はセキュア通信であることを理解されたい。さらに、一部の実施形態では、器具175とコンピュータデバイス172との間の通信経路の1つ又は複数の部分を介して通信されるデータは暗号化されることを理解されたい。
Similar to the connection between the instrument 152 and the computing device 172, the
本開示の他の実施形態では、システム150の1つ又は複数の構成要素が含まれず、異なる配置/順番で実装され、及び/又は代替的なデバイス/機構によって置き換えられることを理解されたい。例えば、一部の実施形態では、システム150はインターフェイス170及び/又はインターフェイス176を含まない。かかる実施形態では、コネクタ168(又は器具152若しくは器具175と通信する他の同様なコネクタ)はコンピュータデバイス172に関連付けられたポートにプラグインし得る。あるいは、器具152、175はコンピュータデバイス172と無線通信し得る。一般的に、器具152、175とコンピュータデバイス172との間の通信経路の一方又は両方は、中間ノードを有さず(すなわち、直接接続)、器具とコンピュータデバイスとの間に1つの中間ノードを有し、又は器具とコンピュータデバイスとの間に複数の中間ノードを有し得る。
It should be appreciated that in other embodiments of the present disclosure, one or more components of
幾つかの実施形態では、システム150は、全体を参照により本明細書に援用する「Bedside Controller for Assessment of Vessels and Associated Devices, Systems, and Methods」という名称の2014年9月11日出願の米国仮特許出願第62/049,265号に記載されているベッドサイドコントローラ等、ベッドサイドコントローラを更に含むことができる。ベッドサイドコントローラは臨床医によって利用され得、それにより臨床医は器具152及び175を制御して、処置中に圧力データを取得し、リアルタイム医療的圧力測定量(例えば圧力波形や数値等、圧力データの視覚的表現)を監視し、収集された圧力データに基づいて圧力比を計算し、取得された医療的検知データ、取得された医療的検知データ及び/又は計算された圧力比の視覚的表現、取得された医療的検知データ及び/又は計算された圧力比に基づく視覚化表現、及び/又は脈管100の視覚的表現を用いて対話する。それに関して、ベッドサイドコントローラは、コンピューティングデバイス172、インタフェース170及び176、及び/又は器具152及び175に通信可能に結合され得る。
In some embodiments,
幾つかの実施形態では、システム150は、患者にPCIが行われる病院又は他の医療施設等の臨床環境に関連する在庫データベース190を含むことができる。在庫データベースは、臨床医が使用のために入手可能なステントに関する様々なデータを記憶することができる。データは、製造業者名、長さ、直径、材料、病院で入手可能な量、即時使用のために入手可能な量、補充頻度、次の発送日、及び他の適切な情報を含むことができる。図27及び図28に関して述べるように、コンピューティングデバイス172は、在庫データベース190に基づいて複数のステントオプションを編纂し、選択メニューを臨床医に提供することができる。コンピューティングデバイス172は、グラフィカルユーザインタフェースを使用して行われたPCI計画に基づいて、特定のステント(例えば、特定の製造業者からの、特定の長さ、直径、及び/又は材料のステント)を自動で推奨することができる。また、コンピューティングデバイス172は、特定のステントを選択するユーザ入力を受信して、それをグラフィカルユーザインタフェースに提供することもでき、それにより、臨床医は、選択したステントを使用した治療の有効性を評価することができる。コンピューティングデバイス172は、接続ライン192を介して在庫データベース190に通信可能に結合される。接続ライン192は、コンピューティングデバイス172を医療施設のコンピューティングシステムと通信可能に結合する1つ又は複数のネットワーク接続を表すことができる。
In some embodiments, the
対象の脈管構造内の診断情報は、器具130、132、152、及び175の1つ又は複数を使用して取得され得る。例えば、1つ又は複数の冠状動脈、末梢動脈、及び脳脈管等に関して診断情報が取得される。診断情報は、圧力関連値及び流量関連値等を含むことができる。圧力関連値は、FFR(例えば、脈管の少なくとも1つの狭窄部を越えることを含め、第1の器具が第2の器具に対して脈管を通して移動されたときに計算される圧力比値)、Pd/Pa(例えば、病変に対して遠位の圧力と病変に対して近位の圧力との比)、iFR(例えば、脈管の少なくとも1つの狭窄部を越えることを含め、第1の器具が第2の器具に対して脈管を通して移動されるときに、距離に関する診断窓を使用して計算される圧力比値)等を含むことができる。流量関連値は、冠血流予備能又はCFR(例えば、正常な安静時体積を超える冠動脈を通る血流の最大増加)及びベース狭窄抵抗指数(BSR:basal stenosis resistance index)等を含むことがある。
Diagnostic information within the vasculature of the subject may be obtained using one or more of
器具130、132、152、及び/又は175によって取得された診断情報及び/又はデータは、外部撮像システムによって取得された患者の脈管構造の血管造影画像及び/又は他の2次元若しくは3次元描画に相関又はコレジストレーションされる。様々な実施形態において、外部撮像システムによって取得される診断情報は、外部から取得される患者の脈管構造の血管造影画像、X線画像、CT画像、PET画像、MRI画像、SPECT画像、及び/又は他の2次元若しくは3次元管腔外描画を含むことがある。全体を参照により本明細書に援用する「VASCULAR IMAGE CO-REGISTRATION」という名称の米国特許第7,930,014号に開示されている技法を使用して、既知の引戻し速度/距離に基づいて、既知の始点に基づいて、既知の終点に基づいて、及び/又はそれらの組合せに基づいて、空間的なコレジストレーションが完了され得る。例えば、機械的な引戻しデバイスが圧力検知処置を行うために使用され得る。機械的な引戻しデバイスは、既知の一定速度で脈管を通して圧力検知デバイスを移動させることができる。圧力測定の位置及び/又は圧力比は、引戻しの速度と、圧力検知デバイスの既知の位置(例えば、血管造影データから入手可能な開始位置、中間位置、終了位置)とに基づいて決定され得る。幾つかの実施形態では、全体を参照により本明細書に援用する「SPATIAL CORRELATION OF INTRAVASCULAR IMAGES AND PHYSIOLOGICAL FEATURES」という名称の2012年12月31日出願の米国仮特許出願第61/747,480号で述べられている技法と同様の技法を使用して、診断情報及び/又はデータが脈管画像に相関される。幾つかの実施形態では、全体を参照により本明細書に援用する「DEVICES, SYSTEMS, AND METHODS FOR ASSESSMENT OF VESSELS」という名称の2013年7月19日出願の米国仮特許出願第61/856,509号に記載されているように、コレジストレーション及び/又は相関が完了され得る。
Diagnostic information and / or data acquired by the
幾つかの実施形態では、全体を参照により本明細書に援用する「DEVICES, SYSTEMS, AND METHODS FOR ASSESSMENT OF VESSELS」という名称の2012年12月31日出願の米国特許出願第14/144,280号に記載された技法と同様の技法を使用して、診断情報及び/又はデータが脈管画像に相関される。幾つかの実施形態では、全体を参照により本明細書に援用する「DEVICES, SYSTEMS, AND METHODS FOR ASSESSMENT OF VESSELS」という名称の2013年7月19日出願の米国仮特許出願第61/856,509号に記載されているように、コレジストレーション及び/又は相関が完了され得る。他の実施形態では、全体を参照により本明細書に援用する「CO-USE OF ENDOLUMINAL DATA AND EXTRALUMINAL IMAGING」という名称の2011年7月28日出願の国際出願PCT/イスラエル特許出願公開第2011/000612号に記載されているように、コレジストレーション及び/又は相関が完了され得る。更に、幾つかの実施形態では、全体を参照により本明細書に援用する「IMAGE PROCESSING AND TOOL ACTUATION FOR MEDICAL PROCEDURES」という名称の2009年11月18日出願の国際出願PCT/イスラエル特許出願公開第2009/001089号に記載されているように、コレジストレーション及び/又は相関が完了され得る。更に、他の実施形態では、全体を参照により本明細書に援用する「IMAGING FOR USE WITH MOVING ORGANS」という名称の2008年3月10日出願の米国特許出願第12/075,244号に記載されているように、コレジストレーション及び/又は相関が完了され得る。 In some embodiments, U.S. Patent Application No. 14 / 144,280, filed December 31, 2012, entitled "DEVICES, SYSTEMS, AND METHODS FOR ASSESSMENT OF VESSELS," which is incorporated herein by reference in its entirety. Diagnostic information and / or data is correlated to the vascular image using techniques similar to those described in. In some embodiments, U.S. Provisional Patent Application No. 61 / 856,509 filed July 19, 2013, entitled "DEVICES, SYSTEMS, AND METHODS FOR ASSESSMENT OF VESSELS," which is incorporated herein by reference in its entirety. The co-registration and / or correlation can be completed as described in No. In another embodiment, International Application PCT / Israel Patent Application Publication No. 2011/000612 filed July 28, 2011, entitled "CO-USE OF ENDOLUMINAL DATA AND EXTRALUMINAL IMAGING", which is incorporated herein by reference in its entirety. The co-registration and / or correlation can be completed as described in No. Further, in some embodiments, International Application PCT / Israel Patent Application Publication No. 2009/18 filed November 18, 2009, entitled “IMAGE PROCESSING AND TOOL ACTUATION FOR MEDICAL PROCEDURES”, which is incorporated herein by reference in its entirety. Co-registration and / or correlation may be completed as described in US Pat. Yet another embodiment is described in US patent application Ser. No. 12 / 075,244, filed Mar. 10, 2008, entitled “IMAGING FOR USE WITH MOVING ORGANS”, which is incorporated herein by reference in its entirety. As described above, co-registration and / or correlation may be completed.
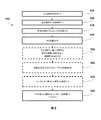
図5は、患者の脈管を評価する方法500を示す流れ図である。方法500は、iFR、Pd/Pa、又はFFR処置等の圧力検知処置に関連して述べる。方法500は、CFR処置等の流量検知処置に関連しても行われ得ることを理解されたい。方法500は、図7、図9、図11、図13、図15、図17、図19、図21、図23、図25、及び図27を参照してより良く理解し得る。ブロック510で、方法500は、圧力測定量を取得することを含む。ブロック520で、方法500は、血管造影データを取得することを含む。幾つかの実施形態では、圧力測定量は、血管造影データが取得されるのと同時に取得される。上述したように、圧力測定量と血管造影データとを同時に収集することは、コレジストレーションを容易にすることができる。例えば、収集された圧力データは、脈管内の血管内デバイスの圧力検知構成要素の位置が既知になるようにコレジストレーションされ得る。処理システムは、位置を、その位置での圧力測定量及び/又は圧力比と関連付けることができる。また、処理システムは、ブロック530に関して述べたように、圧力測定量及び/又は圧力比をそれらの関連の位置に含む画面表示を生成することもできる。
FIG. 5 is a flow chart illustrating a
臨床医は、カテーテル又はガイドワイヤ等の圧力検知型の血管内デバイスを患者に挿入することができる。幾つかの実施形態では、臨床医は、血管造影データを使用して、患者内の血管内デバイスを所望の位置にガイドし得る。圧力検知型の血管内デバイスが患者内に適切に位置決めされた後、臨床医は、圧力測定量の収集を開始することができる。圧力測定量は、以下の処置のうちの1つ又は複数の処置中に収集され得る:充血が誘発されている間に圧力センサが1箇所に留まるFFR「スポット」測定;長い期間の充血が誘発され、センサが小孔に引き戻されるFFR引戻し;FFRスポット測定と同様であるが、充血を伴わないiFR「スポット」測定;及びFFR引戻しと同様であるが、充血を伴わないiFR引戻し。様々な実施形態において、生理学的測定量の収集は、上述した処置の1つ又は複数の組合せによって行われ得る。生理学的測定は、例えば引戻し処置中に連続的であり得る。生理学的測定は、血管内デバイスが一方向に移動される間に行うことができる。測定量の収集は、血管内デバイスが脈管を通して選択的に移動されるとき(例えば、血管内デバイスの移動が開始及び停止されるとき、血管内デバイスが他の脈管よりも長い脈管に沿って様々な点に保持されるとき等)等、不連続の処置であり得る。生理学的測定は、血管内デバイスが両方向に(例えば血管内で近位及び遠位に)移動される間に行うこともできる。コレジストレーションは、生理学的測定量がどのように収集されたかに関わらず、測定の位置が脈管の血管造影画像上で識別され得ることを保証するために使用され得る。例えば、収集された生理学的測定量の合成が、コレジストレーションされたデータに基づいて生成され得る。 The clinician can insert a pressure-sensitive intravascular device, such as a catheter or guide wire, into the patient. In some embodiments, a clinician may use angiographic data to guide an intravascular device within a patient to a desired location. After the pressure sensitive endovascular device is properly positioned in the patient, the clinician can begin collecting pressure measurements. Pressure measurements may be collected during one or more of the following procedures: FFR "spot" measurement in which the pressure sensor stays in place while hyperemia is induced; long term hyperemia induced. And the sensor is pulled back into the stoma; iFR "spot" measurement similar to FFR spot measurement but without hyperemia; and iFR pullback similar to FFR pullback but without hyperemia. In various embodiments, the collection of physiological measures can be done by a combination of one or more of the procedures described above. Physiological measurements can be continuous, for example during a pullback procedure. Physiological measurements can be made while the intravascular device is moved in one direction. The collection of measurands is done when the intravascular device is selectively moved through the vessel (e.g., when the movement of the intravascular device is started and stopped, the intravascular device may be longer than other vessels). Discontinuous treatment, such as when held at various points along the line). Physiological measurements can also be made while the intravascular device is moved in both directions (eg, proximally and distally within the blood vessel). Coregistration can be used to ensure that the location of the measurement can be identified on the angiographic image of the vessel, regardless of how the physiological measure was collected. For example, a composite of collected physiological measures can be generated based on the co-registered data.
それに関して、幾つかの場合、圧力測定量は、器具が脈管を通して移動されるときの、脈管内の固定位置と器具の移動位置との圧力比を表す。例えば、幾つかの場合、近位圧力測定量が脈管内の固定位置で取得され、器具は、近位圧力測定量が取得された位置の遠位の第1の位置から、第1の位置よりも近位の(即ち近位圧力測定の固定位置により近い)第2の位置へ脈管を通して引き戻される。本開示の概念を理解しやすくするために、本開示の実施形態の多くを述べるためにこの構成を利用する。しかし、それらの概念が他の構成にも同様に適用可能であることが理解されよう。例えば、幾つかの場合、器具は、近位圧力測定位置の遠位の第1の位置から、更に遠位の(即ち近位圧力測定の固定位置から離れた)第2の位置へ脈管を通して押し込まれる。他の場合、遠位圧力測定量が脈管内の固定位置で取得され、器具は、遠位圧力測定の固定位置の近位の第1の位置から、第1の位置よりも近位の(即ち遠位圧力測定の固定位置からより遠い)第2の位置へ脈管を通して引き戻される。更に他の場合、遠位圧力測定量が脈管内の固定位置で取得され、器具は、遠位圧力測定の固定位置の近位の第1の位置から、第1の位置よりも近位でない(即ち遠位圧力測定の固定位置により近い)第2の位置へ脈管を通して押される。 In that regard, in some cases, the pressure metric represents the pressure ratio between a fixed position within the vessel and a moving position of the device as the device is moved through the vessel. For example, in some cases, the proximal pressure measurement is taken at a fixed location within the vessel and the device is from a first position distal to the location where the proximal pressure measurement was acquired to Is also pulled back through the vessel to a second position that is proximal (ie, closer to the fixed position of the proximal pressure measurement). This configuration is used to describe many of the embodiments of the present disclosure to facilitate understanding of the concepts of the present disclosure. However, it will be appreciated that the concepts are applicable to other configurations as well. For example, in some cases, the instrument is vascularized from a first position distal of the proximal pressure measurement position to a second position further distal (ie, away from the fixed position of the proximal pressure measurement). Pushed in. In other cases, the distal pressure measurement is taken at a fixed position within the vessel and the instrument is from a first position proximal to the fixed position of the distal pressure measurement and closer to the first position (ie, It is withdrawn through the vessel to a second position (further from the fixed position of the distal pressure measurement). In still other cases, the distal pressure measurement is taken at a fixed position within the vessel and the instrument is from a first position proximal to the fixed position of the distal pressure measurement and less proximal than the first position ( That is, it is pushed through the vessel to a second position (closer to the fixed position of the distal pressure measurement).
典型的な実施形態では、処理システムは、血管内デバイスから生の圧力データを収集し、データを処理して圧力差又は比を計算することができる。幾つかの場合、脈管内の2つの圧力測定量(例えば、固定位置圧力測定量及び移動圧力測定量)の圧力差は、2つの圧力測定量の比(例えば、移動圧力測定量を固定位置圧力測定量で割った値)として計算される。幾つかの場合、圧力差は、患者の心拍周期毎に計算される。それに関して、幾つかの実施形態では、計算される圧力差は、心拍周期にわたる平均圧力差である。例えば、血管拡張剤が患者に適用される幾つかの場合、圧力差を計算するために、心拍周期にわたる平均圧力差が利用される。他の実施形態では、圧力差を計算するために、心拍周期の一部のみが利用される。幾つかの場合、圧力差は、心拍周期の一部又は診断窓にわたる平均である。 In an exemplary embodiment, the processing system can collect raw pressure data from the intravascular device and process the data to calculate a pressure difference or ratio. In some cases, the pressure difference between two pressure measurements in the vessel (eg, fixed position pressure measurement and moving pressure measurement) is the ratio of the two pressure measurements (eg, moving pressure measurement to fixed position pressure measurement). Divided by the measured amount). In some cases, the pressure differential is calculated every patient's heart cycle. In that regard, in some embodiments, the calculated pressure difference is an average pressure difference over a cardiac cycle. For example, in some cases where a vasodilator is applied to a patient, the average pressure difference over the cardiac cycle is utilized to calculate the pressure difference. In other embodiments, only a portion of the cardiac cycle is utilized to calculate the pressure differential. In some cases, the pressure difference is an average over a portion of the heart cycle or diagnostic window.
幾つかの実施形態では、診断窓は、全体を参照により本明細書に援用する2012年4月30日に出願された「DEVICES, SYSTEMS, AND METHODS FOR ASSESSING A VESSEL」という名称の米国特許出願第13/460,296号に記載された技法の1つ又は複数を使用して選択される。そこで論じられているように、診断窓及び関連の技術は、患者への血管拡張剤の投与なしでの使用に特に適している。一般に、血管拡張剤を使用せずに狭窄部の前後での差圧を評価するための診断窓は、近位圧力測定量、遠位圧力測定量、近位速度測定量、遠位速度測定量、ECG波形、並びに/又は脈管性能の他の識別可能及び/若しくは測定可能な側面のうちの1つ又は複数の特性及び/又は成分に基づいて識別される。それに関して、近位圧力測定量、遠位圧力測定量、近位速度測定量、遠位速度測定量、ECG波形、並びに/又は脈管性能の他の識別可能及び/若しくは測定可能な側面のうちの1つ又は複数の特性及び/又は成分に様々な信号処理及び/又は計算技法が適用され得、適切な診断窓を識別する。 In some embodiments, the diagnostic window includes a U.S. Patent Application No. Selected using one or more of the techniques described in 13 / 460,296. As discussed therein, the diagnostic window and related techniques are particularly suitable for use without administration of a vasodilator to a patient. In general, the diagnostic window for assessing the differential pressure across a stenosis without the use of vasodilators is proximal pressure measurement, distal pressure measurement, proximal velocity measurement, distal velocity measurement. , ECG waveforms, and / or one or more properties and / or components of other identifiable and / or measurable aspects of vascular performance. In that regard, of the proximal pressure metric, the distal pressure metric, the proximal velocity metric, the distal velocity metric, the ECG waveform, and / or other distinguishable and / or measurable aspects of vascular performance. Various signal processing and / or computational techniques may be applied to one or more properties and / or components of the to identify an appropriate diagnostic window.
再び図5を参照すると、ブロック530で、方法500は、PCIが脈管に適した治療であると決定することを含む。脈管狭窄部が存在し、脈管を治療する必要があると決定するために、血管造影データ、圧力測定量、及び/又は他のデータが使用され得る。脈管を治療することを決定する例示的実施形態は、全体を参照により本明細書に援用する米国仮特許出願第62/089039号に記載されている。
Referring again to FIG. 5, at
方法500は、ステップ540で、PCIを計画することを含む。PCIの計画は、本明細書で述べるグラフィカルユーザインタフェースと対話して、ステントの位置、ステントの長さ、及びステントの直径等のPCIに関する生理学的パラメータを決定することを含むことができる。本明細書で述べる画面表示を使用して、脈管内に位置決めされたステントのグラフィック表現が視覚化され得る。画面表示は、圧力比等、様々なコレジストレーションされた生理学的データを含むことができ、これらのデータは、それらが関連付けられる位置で脈管にオーバーレイされている。ステントのグラフィック表現は、脈管の視覚的表現に適切に収まるように、位置、長さ、及び直径等の様々なシミュレートされた又は仮想の特性を有することができる。例えば、ステントのグラフィック表現の特性は、例えばユーザ入力に基づいて、臨床医によって手動で選択され得、及び/又はコンピューティングデバイスによって自動で決定され得る。ステントのグラフィック表現の特性は、ユーザ入力に応答して変更され得る。ブロック580に関して述べるように、ステントの位置、ステントの長さ、及びステントの直径等のPCIに関する実際の生理学的パラメータは、ステントのグラフィック表現のシミュレートされた又は仮想の特性に基づいて決定され得る。このようにして、PCIの結果を計画及び評価するために、血管造影データと生理学的測定量とが有意義に組み合わされ得る。療法計画、及びステントパラメータに対する任意の修正、並びに治療の予測/予期される結果は、収集されたデータによって裏付けられ得る。
PCIの計画(ブロック540)は、ブロック550、560、及び/又は570の1つ又は複数を含むことができる。ブロック550で、方法500は、画面表示を出力することを含む。画面表示は、圧力測定量に基づく視覚化表現と、脈管の視覚的表現とを含む。幾つかの実施形態では、脈管の視覚的表現は、ブロック520で収集された血管造影データに基づいて生成された血管造影画像等、脈管の2次元又は3次元血管造影画像である。幾つかの実施形態では、脈管の視覚的表現は、脈管の定型的な画像又は再構成等、脈管の2次元又は3次元グラフィック表現である。圧力測定量に基づく視覚化表現は、数値、グラフィック、テキスト、及び/又は他の適切な視覚化表現を含むことができる。例えば、視覚化表現は、とりわけ、脈管の視覚的表現内に位置決めされたステント、計算された圧力比、取得された圧力測定量又は計算された圧力比の脈管内の位置を示すマーカ、及び脈管を識別するラベルのうちの1つ又は複数を含むことができる。脈管の視覚的表現及び圧力測定量に基づく視覚化表現を図7〜図28に関連して述べる。幾つかの実施形態では、圧力測定量に基づく視覚化表現はヒートマップを含むことができ、ヒートマップでは、脈管の視覚的表現が色付けされて又は他の態様でグラデーションを付けられて、取得された圧力測定量又は計算された圧力比の変化を示す。ヒートマップ、計算された圧力比、取得された圧力測定量又は計算された圧力比に関連する位置を示すマーカ、及び他の視覚化表現を含む画面表示の例は、全体を参照により本明細書に援用する「Devices, Systems, and Methods for Vessel Assessment」という名称の2013年10月25日出願の米国仮特許出願第61/895,909号に記載されている。様々な実施形態において、全体を参照により本明細書に援用する「Bedside Controller for Assessment of Vessels and Associated Devices, Systems, and Methods」という名称の2014年9月11日出願の米国仮特許出願第62/049,265号に記載されているように、他の収集されたデータ及び計算された量等(例えばECG波形や数値)が、画面表示上に提供され得る。他の例示的な画面表示は、方法600(図6)の論述で述べる。
The PCI plan (block 540) may include one or more of
ブロック560で、方法500は、視覚化表現を修正するためのユーザ入力を受信することを含む。ユーザ入力は、脈管の視覚的表現にステントを挿入すること、及び/又は脈管内でステントを移動させることであり得る。ユーザ入力は、長さ、直径、及び材料等のステントの1つ又は複数の特性を変更することであり得る。例えば、ユーザ入力は、脈管内でステントの長さを増加又は減少することでもあり得る。ユーザ入力は、ユーザインタフェースデバイスで受信され得る。幾つかの実施形態では、ユーザ入力は、ベッドサイドコントローラのタッチディスプレイで受信されるタッチ入力である。ブロック570で、方法500は、ユーザ入力に基づいて視覚化表現を修正することを含む。例えば、ユーザ入力に応答して、ステントが脈管の視覚的表現に挿入され得、脈管内のステントの位置が変更され得、ステントの1つ又は複数の特性(例えば、長さ、直径、及び材料等)が変更され得る。
At
ブロック580で、方法500は、PCI計画中に識別された生理学的パラメータを使用してPCIを行うことを含む。実際の生理学的パラメータ(例えば、ステントの位置、ステントの長さ、及びステントの長さ等)は、脈管の視覚的表現内でのステントのグラフィック表現の位置、長さ、及び直径等に基づいて決定され得る。例えば、コンピューティングデバイス172は、ステントの実際の生理学的パラメータを決定するために、ステントのグラフィック表現の仮想の/シミュレートされた特性を、コレジストレーションされた血管造影データと相関させることができる。例えば、血管造影画像を使用して、ステントのグラフィック表現の長さは、ステントがまたぐ脈管内の実際の長さに相関され得る。同様に、血管造影画像を使用して、ステントのグラフィック表現の位置、直径、及び他の仮想の/シミュレートされた特性は、脈管内の対応する実際の生理学的パラメータと相関され得る。幾つかの実施形態では、コレジストレーションされた血管造影データでの脈管の寸法は、定量的冠動脈造影(QCA:quantitative coronary angiography)及び既知の引戻し速度等を使用して決定され得る。決定された実際の生理学的パラメータを用いて、ステントを使用して、閉塞された脈管を治療するために患者にPCIが行われ得る。
At
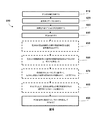
図6は、患者の脈管を評価する方法600を示す流れ図である。方法600は方法500と同様であり、同様に、iFR、Pd/Pa、又はFFR処置等の圧力検知処置に関連して述べる。方法600は、CFR処置等の流量検知処置に関連しても行われ得ることを理解されたい。方法600は、図7〜図28を参照してより良く理解され得る。ブロック610、620、及び630は、上述した方法500のブロック510、520、及び530と同様である。
FIG. 6 is a flow chart illustrating a
方法600は、ステップ640で、PCIを計画することを含む。PCIの計画は、本明細書で述べるグラフィカルユーザインタフェースと対話して、ステントの位置、ステントの長さ、及びステントの直径等のPCIに関する生理学的パラメータを決定することを含むことができる。本明細書で述べる画面表示を使用して、脈管内に又は圧力曲線に沿って位置決めされたステントのグラフィック表現が視覚化され得る。画面表示は、圧力比等、様々なコレジストレーションされた生理学的データを含むことができ、これらのデータは、それらが関連付けられる位置で脈管にオーバーレイされている。ステントのグラフィック表現は、脈管の視覚的表現に適切に収まるように、位置、長さ、及び直径等の様々なシミュレートされた又は仮想の特性を有することができる。例えば、ステントのグラフィック表現の特性は、例えばユーザ入力に基づいて、臨床医によって手動で選択され得、及び/又はコンピューティングデバイスによって自動で決定され得る。ステントのグラフィック表現の特性は、ユーザ入力に応答して変更され得る。ブロック690に関して述べるように、ステントの位置、ステントの長さ、及びステントの直径等のPCIに関する実際の生理学的パラメータは、ステントのグラフィック表現のシミュレートされた又は仮想の特性に基づいて決定され得る。このようにして、PCIの結果を計画及び評価するために、血管造影データと生理学的測定量が有意義に組み合わされ得る。療法計画、及びステントパラメータに対する任意の修正、並びに治療の予期される結果は、収集された血管造影及び/又は圧力データによって裏付けられ得る。
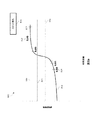
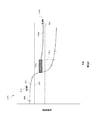
PCIの計画(ブロック640)は、ブロック650、660、670、及び/又は680の1つ又は複数を含むことができる。ブロック650で、方法600は、画面表示を出力することを含む。画面表示は、圧力比の視覚的表現と脈管の視覚的表現とを含む。幾つかの実施形態では、画面表示は、圧力比の視覚的表現と脈管の視覚的表現との両方を例えば並置して含むことができる。様々な実施形態において、全体を参照により本明細書に援用する「Bedside Controller for Assessment of Vessels and Associated Devices, Systems, and Methods」という名称の2014年9月11日出願の米国仮特許出願第62/049,265号に記載されているように、他の収集されたデータ及び計算された量等(例えばECG波形や数値)が、画面表示に提供され得る。他の例示的な画面表示は、方法500(図5)の論述で述べた。ブロック550に関して同様に述べたように、脈管の視覚的表現は、脈管の2次元又は3次元血管造影画像又はグラフィック表現を含むことができる。
The PCI plan (block 640) may include one or more of
圧力比の視覚的表現は、時間にわたる又は血管等の解剖学的構造での場所/位置に対する、計算された圧力比のグラフを含むことができる。圧力比の視覚的表現の例示的実施形態が図8a、図8b、図10、図12、図14、図16、図18、図20、図22、図24、図26、及び図28に示されている。グラフは、例えば引戻し中に、圧力測定量を取得する時間にわたる、又は血管での場所/位置に対する、計算された圧力比を示すことができる。例えば、グラフは、iFR又はFFR圧力比値を示すことができる。それに関して、2012年1月6日出願の「APPARATUS AND METHODS OF CHARACTERISING A NARROWING IN A FLUID FILLED TUBE」という名称のPCT特許出願公開国際公開第2012/093260号、2012年1月6日出願の「APPARATUS AND METHODS OF ASSESSING A NARROWING IN A FLUID FILLED TUBE」という名称のPCT特許出願公開国際公開第2012/093266号、2012年4月30日出願の「DEVICES, SYSTEMS, AND METHODS FOR ASSESSING A VESSEL」という名称の米国特許出願第13/460,296号、2012年8月20日出願の「DEVICES, SYSTEMS, AND METHODS FOR VISUALLY DEPICTING A VESSEL AND EVALUATING TREATMENT OPTIONS」という名称のPCT特許出願公開国際公開第2013/028612号、2013年7月19日出願の「DEVICES, SYSTEMS, AND METHODS FOR ASSESSMENT OF VESSELS」という名称の米国仮特許出願第61/856,509号、及び2013年7月19日出願の「DEVICES, SYSTEMS, AND METHODS FOR ASSESSING A VESSEL WITH AUTOMATED DRIFT CORRECTION」という名称の米国仮特許出願第61/856,518号の1つ又は複数に述べられているように、iFR圧力比が計算され得る。上記特許文献のそれぞれの全体を参照により本明細書に援用する。 The visual representation of the pressure ratio can include a graph of the calculated pressure ratio over time or location / location in an anatomical structure such as a blood vessel. Exemplary embodiments of visual representations of pressure ratios are shown in Figures 8a, 8b, 10, 12, 12, 14, 16, 18, 20, 22, 24, 26, and 28. Has been done. The graph can show the calculated pressure ratio over time to obtain a pressure measurement, or against location / location at a blood vessel, eg, during pullback. For example, the graph can show iFR or FFR pressure ratio values. In this regard, PCT patent application publication WO 2012/093260 entitled “APPARATUS AND METHODS OF CHARACTERISING A NARROWING IN A FLUID FILLED TUBE” filed on January 6, 2012, “APPARATUS” filed on January 6, 2012 AND METHODS OF ASSESSING A NARROWING IN A FLUID FILLED TUBE "PCT patent application publication WO 2012/093266, filed April 30, 2012, entitled" DEVICES, SYSTEMS, AND METHODS FOR ASSESSING A VESSEL " U.S. Patent Application No. 13 / 460,296, PCT Patent Application Publication No. WO 2013/028612, entitled "DEVICES, SYSTEMS, AND METHODS FOR VISUALLY DEPICTING A VESSEL AND EVALUATING TREATMENT OPTIONS" filed on August 20, 2012. , US Provisional Patent Application No. "DEVICES, SYSTEMS, AND METHODS FOR ASSESSMENT OF VESSELS" filed on July 19, 2013 1 / 856,509 and one of U.S. Provisional Patent Application No. 61 / 856,518 entitled "DEVICES, SYSTEMS, AND METHODS FOR ASSESSING A VESSEL WITH AUTOMATED DRIFT CORRECTION" filed on July 19, 2013 or The iFR pressure ratio can be calculated as described in several. The entirety of each of the above patents is incorporated herein by reference.
圧力比の視覚的表現は、複数の検知構成要素によって取得された圧力比及び/又は元となる圧力測定量を任意の適切な態様で示し得ることを理解されたい。一般に、圧力比の視覚的表現でのデータの表現は、圧力比及び/又は元となる圧力測定量の勾配/変化を識別するために利用され得、この勾配/変化は、脈管内の重大な病変を示し得る。それに関して、データの視覚的表現は、圧力測定量;圧力測定量の比;圧力測定量の差;圧力測定量の勾配、圧力測定量の比、及び/又は圧力測定量の差;圧力測定量、圧力測定量の比、及び/又は圧力測定量の差の1次又は2次導関数;及び/又はそれらの組合せを含むことができる。 It is to be appreciated that the visual representation of the pressure ratio may indicate the pressure ratio and / or the underlying pressure measurement obtained by the multiple sensing components in any suitable manner. In general, a representation of the data in a visual representation of the pressure ratio can be utilized to identify a slope / change in the pressure ratio and / or the underlying pressure measurement, which slope / change is significant in the vessel. It may show a lesion. In that regard, the visual representation of the data is: pressure metric; pressure metric ratio; pressure metric difference; pressure metric slope, pressure metric ratio, and / or pressure metric difference; pressure metric. , And / or a first or second derivative of the difference between the pressure measurements, and / or a combination thereof.
ブロック660で、方法600は、圧力比の視覚的表現又は脈管の視覚的表現を修正するためのユーザ入力を受信することを含む。ユーザ入力は、脈管の視覚的表現又は圧力比の視覚的表現にステントを挿入することであり得る。ユーザ入力は、脈管内で又は圧力比の視覚的表現に沿ってステントを移動させることでもあり得る。ユーザ入力は、長さ、直径、及び材料等、ステントの1つ又は複数の特性を変更することでもあり得る。例えば、ユーザ入力は、脈管内で又は圧力比の視覚的表現に沿ってステントの長さを増加又は減少することでもあり得る。ユーザ入力は、ユーザインタフェースデバイスから受信され得る。幾つかの実施形態では、ユーザ入力は、ベッドサイドコントローラのタッチディスプレイで受信されるタッチ入力である。例えば、圧力比の視覚的表現を修正するためのユーザ入力は、時間にわたる圧力比のグラフ上で直接受信され得る。例えば、脈管の視覚的表現を修正するためのユーザ入力は、脈管の血管造影画像上で直接受信され得る。
At
ブロック670で、方法600は、圧力比の視覚的表現と脈管の視覚的表現とのうちの選択された一方を修正することを含む。ブロック680で、方法600は、それに対応して、圧力比の視覚的表現と脈管の視覚的表現とのうちの選択されていない一方を修正することを含む。例えば、脈管の視覚的表現を修正するためのユーザ入力に応答して、脈管の視覚的表現にステントが挿入され得る。例えば、ステントは、脈管の血管造影画像に重ねて位置決めされたグラフィックオーバーレイであり得る。また、対応するステントが圧力比の視覚的表現に挿入され得る。同様に、圧力比の視覚的表現を修正するためのユーザ入力に応答して、時間にわたる圧力比のグラフに沿ってステントが挿入され得る。また、対応するステントが脈管の視覚的表現に挿入され得る。ステントの様々な特性又は他の視覚化表現を用いて、ユーザが指示した修正及び自動対応の修正を行い得る。例えば、圧力比の視覚的表現に沿ってステントの位置を変更するように画面表示が修正され得、それに対応して脈管内のステントの位置が変更され得る。その逆も可能である。圧力比の視覚的表現でステントの1つ又は複数の特性(例えば、長さ、直径、及び材料等)が変更され得、それに対応して脈管の視覚的表現で特性が変更され得る。その逆も可能である。
At
幾つかの場合、圧力比の視覚的表現と脈管の視覚的表現との一方が、PCI計画により良く適合し得る。本明細書で述べる1つ又は複数の方法は、状況に最も適した視覚的表現を臨床医が使用することを可能にする。例えば、血管造影画像の使用は、特定の長さのステントが脈管内の病変による圧力変化を改善するのに十分であることを示し得る。しかし、圧力検知デバイスは、脈管を通る比較的直接的な経路を取るため、血管造影画像は、必要とされるステントの実際の長さを小さく評価し得る。対照的に、圧力比の視覚的表現は、圧力降下に対処するのに必要とされるステントの長さをより正確に示唆し得る。従って、圧力比の視覚的表現の画面表示は、より長い長さを有するステントを含むように修正され得る。それに対応して、脈管の視覚的表現もより長いステントを含むように修正され得る。他の実施形態では、脈管の視覚的表現は、PCI計画に関するより正確な情報を提供することができ、圧力比の視覚的表現に対して対応する変更がなされ得る。 In some cases, one of the pressure ratio visual representation and the vascular visual representation may be better suited to PCI planning. One or more of the methods described herein allow the clinician to use the visual representation that best suits the situation. For example, the use of angiographic images may indicate that a particular length of stent is sufficient to ameliorate pressure changes due to intravascular lesions. However, because the pressure sensing device takes a relatively direct path through the vessel, angiographic images may underestimate the actual length of the stent required. In contrast, a visual representation of the pressure ratio may more accurately indicate the length of stent needed to address the pressure drop. Accordingly, the screen display of the visual representation of the pressure ratio can be modified to include stents with longer lengths. Correspondingly, the visual representation of the vessel can also be modified to include a longer stent. In other embodiments, the visual representation of the vessel can provide more accurate information about the PCI plan and corresponding changes can be made to the visual representation of pressure ratio.
ブロック690で、方法600は、PCI計画中に識別された生理学的パラメータを使用してPCIを行うことを含む。実際の生理学的パラメータ(例えば、ステントの位置、ステントの長さ、及びステントの長さ等)は、脈管の視覚的表現内のステントのグラフィック表現の位置、長さ、及び直径等に基づいて、及び/又は圧力曲線に沿って決定され得る。例えば、コンピューティングデバイス172は、ステントの実際の生理学的パラメータを決定するために、ステントのグラフィック表現の特性を、コレジストレーションされた血管造影データと相関させることができる。例えば、ステントのグラフィック表現の長さは、血管造影画像又は圧力曲線上のデータ点(例えば圧力比)間の脈管内の既知の距離を使用して、ステントがまたぐ脈管内の実際の長さと相関され得る。同様に、ステントのグラフィック表現の位置、直径、及び他の仮想の/シミュレートされた特性は、血管造影画像又は圧力曲線上のデータ点(例えば圧力比)間の脈管内の既知の寸法を使用して、脈管内の対応する実際の生理学的パラメータと相関され得る。幾つかの実施形態では、コレジストレーションされた血管造影データでの脈管の寸法は、定量的冠動脈造影(QCA)及び既知の引戻し速度等を使用して決定され得る。決定された実際の生理学的パラメータを用いて、ステントを使用して、閉塞された脈管を治療するために患者に対してPCIが行われ得る。
At
以下の論述は、図7〜図28を全体的に参照する。図7〜図28は、本開示の実施形態による例示的な画面表示(又は部分画面表示)である。図7、図9、図11、図13、図15、図17、図19、図21、図23、図25、及び図27は、脈管の視覚的表現を含む画面表示を示す。図8a、図8b、図10、図12、図14、図16、図18、図20、図22、図24、図26、及び図28は、圧力比の視覚的表現を含む画面表示を示す。図7〜図28は、コンピューティングデバイス172に関連するディスプレイデバイス180(図4)等、患者の脈管構造を評価するシステムのディスプレイデバイスに表示され得る。即ち、システム(例えばコンピューティングデバイス172)の1つ又は複数の構成要素(例えばプロセッサ及び/又は処理回路)が表示データを提供することができ、図7〜図28の画像がディスプレイデバイス(例えばディスプレイデバイス180)に示されるようにする。図7〜図28に示される圧力比値は、例示的なものである。 The following discussion generally refers to FIGS. 7-28. 7 to 28 are exemplary screen displays (or partial screen displays) according to embodiments of the present disclosure. 7, 9, 11, 13, 13, 15, 17, 19, 21, 23, 25, and 27 show screen displays that include a visual representation of the vessel. 8a, 8b, 10, 12, 12, 14, 16, 18, 20, 20, 22, 24, 26, and 28 show screen displays that include a visual representation of the pressure ratio. . 7-28 may be displayed on a display device of a system for assessing a patient's vasculature, such as display device 180 (FIG. 4) associated with computing device 172. That is, one or more components (eg, processor and / or processing circuitry) of the system (eg, computing device 172) can provide display data and the images of FIGS. 7-28 can be displayed on a display device (eg, display). Device 180). The pressure ratio values shown in FIGS. 7-28 are exemplary.
図7は、脈管の視覚的表現を含む画面表示700(又は部分画面表示)を示す。画面表示700(図7)に示されるデータは、画面表示800及び850(図8a及び図8b)に示されるデータに対応する。画面表示は、圧力検知構成要素を有する血管内デバイスがその中に案内される脈管702の視覚的表現を含む。血管造影データ及び圧力データは、脈管702内の血管内デバイスによって収集され得る。例えば、圧力データは、図7の実施形態では脈管702の右から左へのものである引戻し処置中に収集され得る。収集された血管造影データは、脈管702及び他の分枝脈管704を含む血管造影画像を生成するために使用され得る。本明細書で述べる1つ又は複数の視覚化表現は、血管造影画像上のグラフィックオーバーレイであり得る。画面表示700は、特定の脈管を識別するラベルフィールド706を含む。幾つかの実施形態では、コンピューティングデバイス(例えば図4のコンピューティングデバイス172)は、脈管の輪郭、位置、分枝、及び他の特徴等の血管造影データを使用して、脈管を自動で識別する。外部撮像システム(例えば血管造影又はX線システム)の位置及び/又は視野角も脈管を識別するために使用され得る。コンピューティングデバイスは、アルファベット、数字、英数字、及び/又は記号文字を含む、ラベル706に関連する表示データを生成することができる。図7の実施形態では、ラベル706は、右冠状動脈の「RCA」及び後側部動脈の「PLA」等、識別される脈管の略語を含む。図7では略語及び特定の脈管が使用されているが、任意の適切なラベルが使用され得ることを理解されたい。幾つかの実施形態では、ユーザは、ラベル706の1つ又は複数を選択的にアクティブ又は非アクティブにすることができ、それにより、ラベル706の一部若しくは全部が画面表示700に含まれるか、又は何れのラベル706も画面表示700に含まれない。
FIG. 7 shows a screen display 700 (or partial screen display) that includes a visual representation of a vessel. The data shown in screen display 700 (FIG. 7) corresponds to the data shown in screen displays 800 and 850 (FIGS. 8a and 8b). The screen display includes a visual representation of
また、画面表示700は、収集された圧力測定量又は計算された圧力比に関連する脈管700内の位置を示すマーカ708を含む。例えば、マーカ708は、圧力測定量が収集されるときの圧力センサの位置であり得る。図7の実施形態では、マーカ708は、脈管702を横断する線分である。位置を示すマーカの他の例は、全体を参照により本明細書に援用する「Devices, Systems, and Methods for Vessel Assessment」という名称の2013年10月25日出願の米国仮特許出願第61/895,909号に記載されている。一実施形態では、例えばiFR処置中、心拍周期毎に1つの圧力比が計算される。従って、各マーカ708は、収集されたデータ、及び/又は心拍周期中の計算された圧力比を示す。幾つかの実施形態では、ユーザは、マーカ708の1つ又は複数を選択的にアクティブ又は非アクティブにすることができ、それにより、マーカ708の一部若しくは全部が画面表示700に含まれるか、又はマーカ708が何れも画面表示700に含まれない。マーカ708は、距離710及び712によって示されるような脈管702内の様々な距離によって分離され得る。ここで、距離710及び712は、圧力検知デバイスが脈管702を通して案内される速度に対応し得る。圧力検知デバイスが一定の速度で脈管702を通して案内される実施形態では、マーカ708間の距離は等しく又はほぼ等しく、従って、連続するマーカ702が等間隔又はほぼ等間隔に位置決めされる。圧力検知デバイスが一定でない速度で脈管702を通して案内される実施形態では、マーカ708間の距離はより大きく変動し、従って、連続するマーカ708が不均等間隔で位置決めされる。例えば、圧力検知デバイスが障害物の近くで減速され得、それにより、比較的多数の心拍周期からのデータが収集される。図7に示されるように、脈管702内の障害物に起因する圧力変化の周りでは、連続するマーカ708間の距離はより小さい。各心拍周期中に脈管702内の圧力検知型の血管内デバイスの位置が既知になるように、コレジストレーションが行われ得る。従って、圧力検知型の血管内デバイスは、(例えば引戻し処置中に)一定でない速度で脈管702を通して案内され得、それにより、脈管702内でのデータ収集のペースが臨床医によって制御され得る。例えば、臨床医は、病変等、脈管702の臨床的に重要な部分の近くで、より多くの情報を得られるように減速することができる。例えば、臨床医は、脈管702の臨床的に重要でない部分を通るときに速度を上げることができる。
The
脈管702内での圧力変化は、圧力比フィールド714によって示される。圧力比フィールドは、マーカ708に隣接して提供される。図7の実施形態では、圧力比フィールド714の一部のみが示されている。様々な実施形態において、圧力比フィールド714の一部若しくは全部が、所与の位置に関連する計算された圧力比を提供し得、又は何れの圧力比フィールド714も圧力比を提供しないことができる。例えば、ユーザは、圧力比フィールド714の1つ又は複数を選択的にアクティブ又は非アクティブにすることができる。様々な実施形態において、圧力比フィールド714は、アルファベット、数字、英数字、及び/又は記号文字を含む。図7で、フィールド714は、iFR計算に関連する数値を含む。他の実施形態では、フィールド714は、表示されている量のタイプを識別するために、「FFR」、「iFR」、「Pd/Pa」、又は他のラベルを含むことができる。そのような実施形態は、例えば、全体を参照により本明細書に援用する「Devices, Systems, and Methods for Vessel Assessment」という名称の2013年10月25日出願の米国仮特許出願第61/895,909号に記載されている。圧力変化は、フィールド714の値によって示される。例えば、図7で、脈管702内の障害物は、値0.93〜0.81に存在する可能性が高い。
The pressure change within
画面表示700は、ステント挿入フィールド716を更に含む。ステント挿入フィールド716の選択は、脈管の視覚的表現及び/又は圧力測定量に基づく視覚化表現を修正するためのユーザ入力であり得る。幾つかの実施形態では、ステント挿入フィールド716の選択により、コンピューティングデバイス(例えばコンピューティングデバイス172)が、位置、直径、長さ、及び材料等を含めた、脈管702内に展開されるべきステントの1つ又は複数の推奨される特性を決定することができる。1つ又は複数の特性の決定は、収集された圧力データ、計算された圧力比、血管造影データ、閾値圧力比、目標圧力比、及び理想圧力比等に基づくことができる。それに関して、ステントは、圧力測定量に基づく視覚化表現として表され得る。例えば、ステントの位置及び長さ等の特性は、障害物の前後での圧力比の低下を改善するように選択され得る。コンピューティングデバイスは、ステントの特性を決定し、表示データを生成して、(図9に示されるように)ステントが脈管702内に表示されるようにすることができる。以下に述べるように、臨床医は、ステントの推奨される特性を修正することができる。幾つかの実施形態では、ステント挿入フィールド716の選択は、収集された圧力データ、計算された圧力比、及び/又は血管造影データに基づいてステントの特性を決定することなく、ステントを提供する。このようにすると、臨床医は、ステントの特性をカスタマイズすることができる。例えば、臨床医は、脈管702に沿ってユーザ入力(クリック及びドラッグ又は他の適切な入力等)を提供することができ、コンピューティングデバイスは、脈管702に沿ってユーザ入力が進む距離に対応する長さを有するステントのグラフィック表現を提供することができる。幾つかの実施形態では、図25に関してより詳細に述べるように、ステント挿入フィールド716が選択されたときに、複数のステントオプションが提供され得る。
The
図8a及び図8bは、圧力比の視覚的表現を含む画面表示800及び850(又は部分画面表示)を示す。画面表示800及び850(図8a及び図8b)に示されるデータは、画面表示700(図7)に示されるデータに対応する。画面表示800及び850は、それぞれ脈管702内の圧力比の曲線802、852を含む。曲線802、852は、x軸が異なることを除いて同じデータを表す。画面表示800(図8a)は、x軸に時間又は距離を取り、y軸に圧力比量(iFR、FFR、Pd/Pa等)を取る。例えば、図7に示される実施形態では、可動圧力検知デバイスは、引戻し処置中に脈管702内を右から左へと案内され得、固定圧力検知デバイスは、脈管702の左側に静止したままである。画面表示800のx軸に沿った値は、引戻し処置の期間、及び/又は引戻し処置中に可動圧力検知デバイスが移動した距離に対応し得る。画面表示850は、x軸に沿って、脈管702の物理的向きに対応する位置を取り、y軸に圧力比量(iFR、FFR、Pd/Pa等)を取る。即ち、画面表示850は、曲線852の左側に、脈管702の左側に関連する圧力比を示し、曲線852の右側に、脈管702の右側に関連する圧力比を示す。幾つかの場合、脈管に沿った物理的位置に対応する圧力比プロットの提供は、より簡単なPCI計画を促進し得る。以下の論述は、一般に画面表示850に言及するが、画面表示800が同様に利用され得ることを理解されたい。
8a and 8b show screen displays 800 and 850 (or partial screen displays) that include a visual representation of the pressure ratio. The data shown in screen displays 800 and 850 (FIGS. 8a and 8b) correspond to the data shown in screen display 700 (FIG. 7). Screen displays 800 and 850 include pressure ratio curves 802 and 852, respectively, within
画面表示800及び850は、理想圧力比ライン806を含む。理想ライン806は、1に等しい圧力比を表し、障害物のない脈管を示す。生理学的には、1に等しい圧力比が最大圧力比であり、近位圧力測定量と遠位圧力測定量とが等しいときに生じる。PCI計画中、臨床医は、患者の圧力比が理想ライン806の可能な限り近くに戻るようにするステントパラメータを決定することを試みる。
Screen displays 800 and 850 include ideal
画面表示800及び850は、閾値圧力比804を含む。閾値804は、健康な脈管を表す圧力比と障害物を有する脈管を表す圧力比との間の遷移を示す値に設定され得る。閾値804を超える圧力比は、治療が推奨されない脈管を表すことができ、閾値804を下回る圧力比は、治療が推奨される脈管を表すことができる。閾値804は、画面表示800及び850で使用される圧力比スケール(例えば、iFR、FFR、又はPd/Pa等)に依存して異なることがある。例えば、FFRに関する閾値804は0.80であり、iFRに関する閾値804は0.89であり得る。例えば、脈管が0.80を超えるFFR値を有する場合、臨床医は脈管を治療しないと決定することができる。脈管が0.80未満のFFR値を有する場合、臨床医は、PCIで脈管を治療すると決定することができる。
The screen displays 800 and 850 include a
画面表示800及び850は、目標ライン820を含む。目標ライン820は、患者に関する臨床的に有益な結果に関連する圧力比値に対応し得る。目標ライン820は、幾つかの実施形態では、閾値804よりも高い圧力比値に対応し得る。即ち、閾値804は、健康とみなすことができる最小圧力比値を表すことができ、目標ライン820は、有効な治療に関連するより高い圧力比値を表すことができる。目標ライン820は、画面表示800及び850で使用される圧力比スケール(例えば、iFR、FFR、又はPd/Pa等)に依存して異なることがある。例えば、FFRに関する目標ライン820は0.93であり得る。PCI計画に関するグラフィカルユーザインタフェースは、臨床医が閾値804及び/又は目標ライン820に関する圧力比値を設定することを可能にすることができる。例えば、臨床医は、閾値804及び/又は目標ライン820の修正を可能にする設定オプションにアクセスすることができる。PCI中のステントの挿入中の目標の1つは、曲線802及び852の実際の圧力比値を、理想ライン806によって示される値の可能な限り近くに戻すことである。しかし、狭窄脈管内で完全な流れを再生成することは、医療的に可能でないことがある。そのような状況では、目標ライン820は、有効な治療を示す医療的に許容できる圧力比値を表す。従って、PCI計画中、臨床医は、患者の圧力比値を理想ライン806の可能な限り近くに、少なくとも目標ライン820よりも上に戻すようにステントパラメータを決定する。視覚化表現を表示/非表示するためのユーザ入力に応答して、閾値804、目標ライン820、及び/又は理想ライン806が画面表示800及び850に選択的に提供され得る。図10、図12、図14、図16、図18、図20、図22、図24、図26、及び図28には閾値804及び目標ライン820が示されているが、閾値804、目標ライン820、及び/又は理想ライン806の任意の1つ若しくは複数が画像表示に提供され得、又は何れも提供されないことができることを理解されたい。
Screen displays 800 and 850 include
幾つかの実施形態では、閾値804と実際の圧力比との差を示すために、様々な色及び/又は他の視覚的インジケータが画面表示800及び850に提供される。例えば、閾値を十分に超える値(例えば、0.00〜1.00のスケールで、閾値が0.80であり、値が0.90を超える場合)を表すために第1の色(例えば、緑色、白色、又は他の色)が利用され得、閾値に近いが上回っている値(例えば、0.00〜1.00のスケールで、閾値が0.80であり、値が0.81〜0.90である場合)を表すために第2の色(例えば、黄色、灰色、又は他の色)が利用され得、閾値以下の値(例えば、0.00〜1.00のスケールで、閾値が0.80であり、値が0.80以下の場合)を表すために第3の色(例えば、赤色、黒色、又は他の色)が利用され得る。閾値に対する圧力の差の相対値を視覚的に表すために、任意の数の色の組合せ、スケーリング、カテゴリ、及び/又は他の特性が利用され得ることを理解されたい。しかし、簡潔にするために、本出願人らは、本明細書では多数の変形形態を明示的には記載しない。
In some embodiments, various colors and / or other visual indicators are provided on the screen displays 800 and 850 to indicate the difference between the
画面表示800及び850は、マーカ808及び圧力比フィールド814を更に含む。マーカ808及び圧力比フィールド814は、図7に関連して述べたものと同様である。図8a及び図8bには曲線802及び852が連続的に示されているが、マーカ808は、曲線802及び852上の実際のデータ点を表すことができる。マーカ808間の曲線802及び852の値は、マーカ808に関連する圧力比に基づいて補間され得る。コンピューティングデバイス(例えば図4のコンピューティングデバイス172)は、データ処理、データ補間、及び平滑化を提供し、他の計算を行って圧力比曲線802及び852を生成することができる。理想圧力比ライン806、閾値804、マーカ808、及び圧力比フィールド814は、選択的にアクティブ又は非アクティブにすることができ、それにより、一部若しくは全部が画面表示800及び850に現れるか、又は何れも画面表示800及び850に現れない。
Screen displays 800 and 850 further include
画面表示800及び850は、ステント挿入フィールド816を更に含む。ステント挿入フィールド816の選択は、圧力比の視覚的表現を修正するためのユーザ入力であり得る。図7に関して同様に述べたように、幾つかの実施形態では、ステント挿入フィールド816の選択により、コンピューティングデバイス(例えば、図4のコンピューティングデバイス172)は、ステントの位置、直径、長さ、及び材料等を含めた、曲線802又は852に沿って展開されるべきステントの1つ又は複数の推奨される特性を決定することができる。1つ又は複数の特性の決定は、収集された圧力データ、計算された圧力比、血管造影データ、閾値圧力比、目標圧力比、及び理想圧力比等に基づくことができる。それに関して、ステントは、圧力測定量に基づく視覚化表現として表され得る。例えば、ステントの位置及び長さ等の特性は、圧力比曲線の降下部分をまたぐように選択され得る。コンピューティングデバイスは、ステントの特性を決定し、表示データを生成して、(例えば図10に示されるように)ステントが曲線802及び852に沿って表示されるようにすることができる。以下に述べるように、臨床医は、ステントの推奨される特性を修正することができる。幾つかの実施形態では、ステント挿入フィールド816の選択は、収集された圧力データ、計算された圧力比、及び/又は血管造影データに基づいてステントの特性を決定することなく、ステントを提供する。このようにすると、臨床医は、ステントの特性をカスタマイズすることができる。例えば、臨床医は、曲線802及び/又は852に沿ってユーザ入力(クリック及びドラッグ又は他の適切な入力等)を提供することができ、コンピューティングデバイスは、曲線802及び/又は852に沿ってユーザ入力が進む距離に対応する長さを有するステントのグラフィック表現を提供することができる。幾つかの実施形態では、図26に関してより詳細に述べるように、ステント挿入フィールド816が選択されたときに複数のステントオプションが提供され得る。
The screen displays 800 and 850 further include a
図9は、脈管の視覚的表現を含む画面表示900(又は部分画面表示)を示す。画面表示900(図9)に示されるデータは、画面表示1000(図10)に示されるデータに対応する。ステント902のグラフィック表現が、脈管702の視覚的表現内に位置決めされる。ステント902は、脈管の視覚的表現を修正するため及び/又は圧力測定量に基づく視覚化表現を修正するためのユーザ入力に応答して、脈管に挿入され得る。上述したように、コンピューティングデバイスにより、位置、長さ、直径、材料、及び/又は他の特性が自動で生成され得、対応する表示データがディスプレイデバイスに提供され得る。例えば、ステントの直径は、血管造影画像における脈管の直径と一致するように自動でサイズ調整され得る。ステント902が画面表示900にどのように現れるかを決定するステント902の画像特性は、ステント902が脈管702内で視覚的に識別可能であるように選択され得る。画像特性は、色、陰影、パターン、透明度、境界線、及び他の関連の特性を含むことができる。幾つかの実施形態では、ステント902の画像特性は、実際のステントの物理的外観と一致するように選択される。幾つかの実施形態では、ステント902の画像特性は、ステントが挿入される脈管702内の領域を強調表示するように選択される。ステント902のグラフィック表現の位置、長さ、直径、材料、及び/又は他の仮想の/シミュレートされた特性に基づいて、ヒト患者の閉塞脈管内に位置決めされるべきステントに関する実際の生理学的値が決定され得る。
FIG. 9 shows a screen display 900 (or partial screen display) that includes a visual representation of a vessel. The data shown in screen display 900 (FIG. 9) corresponds to the data shown in screen display 1000 (FIG. 10). A graphical representation of
図10は、圧力比の視覚的表現を含む画面表示1000(又は部分画面表示)を示す。画面表示1000(図10)に示されるデータは、画面表示900(図9)に示されるデータに対応する。ステント1002のグラフィック表現は、圧力比曲線852の視覚的表現に沿って位置決めされている。とりわけ位置及び長さ等のステント1002のグラフィック表現の特性は、脈管702(図9)内に位置決めされたステント902のグラフィック表現の特性に対応する。圧力比の視覚的表現を修正するため及び/又は圧力測定量に基づく視覚化表現を修正するためのユーザ入力に応答して、圧力比曲線852に沿ってステント1002が挿入され得る。上述したように、コンピューティングデバイスにより、位置、長さ、直径、材料、及び/又は他の物理的特性が自動で生成され得、対応する表示データがディスプレイデバイスに提供され得る。ステント1002が画面表示1000にどのように現れるかを決定するステント1002の画像特性は、ステント1002が曲線852に沿って視覚的に識別可能であるように選択され得る。画像特性は、色、陰影、パターン、透明度、境界線、及び他の関連の特性を含むことができる。幾つかの実施形態では、ステント1002の画像特性は、実際のステントの物理的外観と一致するように選択される。幾つかの実施形態では、ステント1002の画像特性は、ステントが挿入される曲線852に沿った領域を強調表示するように選択される。ステント1002のグラフィック表現の位置、長さ、直径、材料、及び/又は他の仮想の/シミュレートされた特性に基づいて、ヒト患者の閉塞脈管内に位置決めされるべきステントに関する実際の生理学的値が決定され得る。
FIG. 10 shows a screen display 1000 (or partial screen display) that includes a visual representation of the pressure ratio. The data shown in screen display 1000 (FIG. 10) corresponds to the data shown in screen display 900 (FIG. 9). The graphical representation of
画面表示1000は、補正圧力曲線1004を含む。補正圧力曲線1004は、現在の位置での、及び長さ等の現在の特性でのステント1002の展開による圧力曲線852の予想される変化を表す。補正圧力曲線1004で示されるように、ステント1002の長さにわたって圧力の変化は予想されない。即ち、ステント1002の配置は、脈管702のその部分にわたる完全な又はほぼ完全な流れを理想的に生成している。ステント1002の端部は、ステント端部表記1006によって示され得る。様々な実施形態において、ステントの端部の様々な他のグラフィック表現が利用され得る。ステント端部表記1006は、例えば視覚化表現を表示/非表示するためのユーザ入力に基づいて、画面表示1000に選択的に提供され得る。ステント端部表記1006は、そこを超えると補正圧力曲線1004が圧力曲線852と同様に挙動すると予想される点を表す。図示されるように、補正圧力曲線1004は、ステント端部表記1006を過ぎると、圧力曲線852と同様の形状になる。しかし、脈管内の病変の前後での圧力降下の少なくとも一部をステント1002が補正することにより、補正圧力曲線1004によって示される圧力値はより高い。
The
画面表示1000は、補正圧力比値1010を更に含む。補正圧力比値1010は、補正圧力比曲線1004の数値に対応し得る。補正圧力比値1010と補正圧力比曲線1004の一方又は両方は、選択された治療が脈管内の圧力損失を減少させるという臨床的目標を実現するという検証を臨床医に提供することができる。例えば、閾値804は、0.89のiFR値に対応することがあり得、その値よりも上では脈管は健康とみなされ得る。補正圧力比値1010が、(図10の実施形態におけるように)0.89よりも大きいiFR値を提供する場合、臨床医は、所与のパラメータ(例えば、長さ、直径、及び位置等)によるステントの配置が脈管の治療において幾らかの利益をもたらすことを理解することができる。また、臨床医は、提案されたステントパラメータにより、補正圧力比曲線1004又は補正圧力比値1004が、療法インターベンションにより臨床的利益が得られる可能性が高い目標ライン820以上にならないことを理解することもできる。従って、臨床医は、本明細書で述べるようにステントパラメータを変えて、例えば、ステントを移動させたり、ステントの長さを修正したりして、目標ライン820を超える補正圧力比を生じるPCIを計画することができる。幾つかの実施形態では、臨床医は、補正圧力比曲線1004が目標ライン820を実現することが不可能である、及び補正圧力比曲線1004を閾値804よりも上に上昇させる治療で十分であるという医療的決定を下すことができる。補正圧力比値1010は、補正圧力比曲線1004の遠位部分(例えば、補正圧力比曲線の最も遠位の値、又は値の平均値等)に関連付けられ得る。補正圧力比値1010は、補正圧力比曲線1004に隣接して提供され得る。補正圧力比値1010は、視覚化表現を表示/非表示するためのユーザ入力に応答して選択的に提供され得る。
The
コンピューティングデバイス(例えばコンピューティングデバイス172)は、取得された圧力測定量、計算された圧力比、目標圧力比、及び理想圧力比等に基づいて、補正圧力曲線1004の値を計算することができる。補正圧力曲線1004は、リアルタイムで計算されて提供され得、従って、臨床医によってなされた(物理的特性のうちでもとりわけ)ステント1002の位置及び長さの修正に基づいて、曲線1004が調節される。臨床医は、補正圧力曲線の値が理想圧力比(図8bの理想圧力比ライン806等)に等しくなり、及び/又は少なくとも目標圧力比(図8bの目標ライン820等)よりも大きくなるようにステントの物理的特性を修正することができる。
A computing device (eg, computing device 172) can calculate a value for the corrected
幾つかの実施形態では、画面表示900(図9)の脈管702にステントのグラフィック表現を挿入することにより、それに対応して、画面表示1000(図10)の圧力比曲線852に沿ってステントのグラフィック表現が挿入され得る。同様に、画面表示1000(図10)の圧力比曲線852に沿ってステントを挿入することにより、それに対応して、画面表示900の脈管702にステントが挿入され得る。このようにして、臨床医は、画面表示900及び1000のうちの選択された一方と直接対話しながらPCI計画を行うと共に、画面表示900及び1000のうちの選択されていない一方の対応する変化を自動で閲覧することができる。
In some embodiments, inserting a graphical representation of a stent into
図11〜図14は、脈管内及び圧力比曲線に沿ったステントの移動を述べる。図11は、脈管の視覚的表現を含む画面表示1100(又は部分画面表示)を示す。画面表示1100(図11)に示されるデータは、画面表示1200(図12)に示されるデータに対応する。ステント902のグラフィック表現は、脈管702内で移動され得る。即ち、ステント902を移動させるためのユーザ入力に応答して、脈管702内のステント902の位置が変更され得る。ステント902を移動させるためのユーザ入力は、圧力比に基づく視覚化表現又は脈管の視覚的表現を修正するためのユーザ入力として表され得る。幾つかの実施形態では、ステントオプションメニュー1104が、脈管702内でステント902を左右に移動させるためのオプション1106及び1108を提供することができる。幾つかの実施形態では、例えば画面表示1100がタッチディスプレイに提供されるとき、ユーザは、ステント902自体にある1つ又は複数のタッチ入力を使用して、脈管702内でステントを移動させることができる。例えば、ユーザは、ステント902にタッチして異なる位置にドラッグすることができる。図11の実施形態では、画面表示1100は、対応するユーザ入力に応答して、ステント902が新たな位置1102へと左に移動されている中間段階にあるものとして示されている。図13の画面表示1300は、脈管702内の新たな位置にあるステント1302を示す。画面表示1300(図13)に示されるデータは、画面表示1400(図14)に示されるデータに対応する。
11-14 describe the migration of the stent intravascularly and along the pressure ratio curve. FIG. 11 shows a screen display 1100 (or partial screen display) that includes a visual representation of a vessel. The data shown in screen display 1100 (FIG. 11) corresponds to the data shown in screen display 1200 (FIG. 12). A graphical representation of
図12は、圧力比の視覚的表現を含む画面表示1200(又は部分画面表示)を示す。画面表示1200(図12)に示されるデータは、画面表示1100(図11)に示されるデータに対応する。ステント1002のグラフィック表現は、圧力比曲線852に沿って移動され得る。即ち、ステント1002を移動させるためのユーザ入力に応答して、曲線852に沿ったステント1002の位置が変更され得る。ステント1002を移動させるためのユーザ入力は、圧力比に基づく視覚化表現又は圧力比の視覚的表現を修正するためのユーザ入力として表され得る。幾つかの実施形態では、ステントオプションメニュー1204は、ステント1002を曲線852に沿って左右に移動させるためのオプション1206及び1208を提供することができる。幾つかの実施形態では、例えば画面表示1200がタッチディスプレイに提供されるとき、ユーザは、ステント1002自体にある1つ又は複数のタッチ入力を使用して、曲線852に沿ってステントを移動させることができる。例えば、ユーザは、ステント1002にタッチして異なる位置にドラッグすることができる。図12の実施形態では、画面表示1200は、対応するユーザ入力に応答して、ステント1002が新たな位置1202へと左に移動されている中間段階にあるものとして示されている。幾つかの実施形態では、補正圧力比曲線1004はリアルタイムで更新され得、それにより、ステント1002が移動されているときに、曲線1004は、ステント1002が現時点での位置にある状態での予測される圧力比を反映するように調節される。図14の画面表示1400は、曲線852に沿った新たな位置にあるステント1402を示す。画面表示1400(図14)に示されるデータは、画面表示1300(図13)に示されるデータに対応する。また、画面表示1400は、ステント1402の新たな位置に基づいて更新された補正圧力比曲線1004を提供する。例えば、図14の曲線1004は目標ライン820よりも上であり、これは、ステント1402が(図12のステント1002の元の位置と比較して)脈管702内の障害物に対してより良く位置決めされており、障害物によって引き起こされる圧力の変化を改善することを示す。少なくとも目標ライン820よりも上の補正圧力比曲線1004は、PCI計画中の臨床医の目標であり得る。ステント1402の選択された仮想の/シミュレートされた特性に応答して、コンピューティングデバイスは、収集された圧力データに基づいて目標が達成されると予測する。ステント1402の仮想の/シミュレートされた特性は、PCI計画に基づいて患者を治療するためにヒト脈管内に位置決めされるべきステントの実際の生理学的パラメータと相関され得る。従って、ステントのグラフィック表現を移動させることで、臨床医は、PCI計画中の臨床効果を最大にするようにステントを展開するのに適した生理学的位置を選択することが可能になる。
FIG. 12 shows a screen display 1200 (or partial screen display) that includes a visual representation of the pressure ratio. The data shown in screen display 1200 (FIG. 12) corresponds to the data shown in screen display 1100 (FIG. 11). A graphical representation of the
幾つかの実施形態では、画面表示1100(図11)の脈管702内でステントを移動させることにより、それに対応して、画面表示1200(図12)の圧力比曲線852に沿ってステントが移動され得る。同様に、画面表示1200(図12)の圧力比曲線852に沿ってステントを移動させることにより、それに対応して、画面表示1100(図11)の脈管702内でステントが移動され得る。このようにして、臨床医は、画面表示1100及び1200のうちの選択された一方と直接対話しながらPCI計画を行うと共に、画面表示1100及び1200のうちの選択されていない一方の対応する変化を自動で閲覧することができる。例えば、臨床医は、圧力比曲線852と、圧力比曲線に対するステントの位置決めとを示す画面表示1200上で直接操作することができる。圧力比曲線852に沿ってステントが移動され得、それにより、補正圧力比曲線1004は、目標ライン820により良く合致する又は目標ライン820を超える。脈管の画面表示1100(図11)上で、ステントの位置の対応する変更が行われ得、それにより、臨床医は、補正圧力比曲線を実現するためにステントが脈管内のどこで展開されるべきかを理解できるようになる。
In some embodiments, moving the stent within
図15〜図24は、脈管内及び圧力比曲線に沿ったステントの長さの変更を表す。特に、図17〜図20はステントの短縮を表し、図21〜図24はステントの延長を表す。図15は、脈管の視覚的表現を含む画面表示1500(又は部分画面表示)を示す。画面表示1500(図15)に示されるデータは、画面表示1600(図16)に示されるデータに対応する。ステント1502のグラフィック表現の長さは、脈管702内で減少又は増加され得る。即ち、それぞれステント1502を短縮又は延長するためのユーザ入力に応答して、脈管702内のステント1502が短縮又は延長され得る。ステント1502を短縮又は延長するためのユーザ入力は、圧力比に基づく視覚化表現又は脈管の視覚的表現を修正するためのユーザ入力として表され得る。幾つかの実施形態では、ステントオプションメニュー1504が、それぞれステント1502の長さを増加又は減少させるためのオプション1506及び1508を提供することができる。幾つかの実施形態では、例えば画面表示1500がタッチディスプレイに提供されるとき、ユーザは、ステント1502自体にある1つ又は複数のタッチ入力を使用して、脈管702内でステントの長さを変えることができる。例えば、ユーザは、(図17及び図21に関してより詳細に述べるように)ステント1502の端部の一方、他方、又は両方にタッチしてドラッグすることができる。図15は、ステントの長さを変えるためのユーザ入力が受信される前のステント1502を示す。
FIGS. 15-24 represent changes in stent length along the intravascular and pressure ratio curves. In particular, FIGS. 17-20 represent the shortening of the stent and FIGS. 21-24 represent the extension of the stent. FIG. 15 shows a screen display 1500 (or partial screen display) that includes a visual representation of a vessel. The data shown in screen display 1500 (FIG. 15) corresponds to the data shown in screen display 1600 (FIG. 16). The length of the graphical representation of
図16は、圧力比の視覚的表現を含む画面表示1600(又は部分画面表示)を示す。画面表示1600(図16)に示されるデータは、画面表示1500(図15)に示されるデータに対応する。ステント1602の長さは、圧力比曲線852に沿って増減され得る。即ち、曲線852に沿ったステント1602は、それぞれステント1602を短縮又は延長するためのユーザ入力に応答して短縮又は延長され得る。ステント1602を短縮又は延長するためのユーザ入力は、圧力比に基づく視覚化表現又は圧力比の視覚的表現を修正するためのユーザ入力として表され得る。幾つかの実施形態では、ステントオプションメニュー1604が、それぞれステント1602の長さを増加又は減少させるためのオプション1606及び1608を提供し得る。幾つかの実施形態では、例えば画面表示1600がタッチディスプレイに提供されるとき、ユーザは、ステント1602自体にある1つ又は複数のタッチ入力を使用して、曲線852に沿ってステントの長さを変えることができる。例えば、ユーザは、(図18及び図22に関してより詳細に述べるように)ステント1602の端部の一方、他方、又は両方にタッチしてドラッグすることができる。図16は、ステントの長さを変えるためのユーザ入力が受信される前のステント1602を示す。
FIG. 16 shows a screen display 1600 (or partial screen display) that includes a visual representation of the pressure ratio. The data shown in screen display 1600 (FIG. 16) corresponds to the data shown in screen display 1500 (FIG. 15). The length of the
図17は、脈管の視覚的表現を含む画面表示1700(又は部分画面表示)を示す。画面表示1700(図17)に示されるデータは、画面表示1800(図18)に示されるデータに対応する。図17の実施形態では、画面表示1700は、対応するユーザ入力に応答してステント1702の長さが減少されている中間段階にあるものとして示されている。幾つかの実施形態では、ユーザ入力は、短縮オプション1508の選択である。短縮オプション1508の選択により、ステント1702の長さが、端部1706の一方、他方、又は両方で固定量又は可変量だけ減少され得る。幾つかの実施形態では、例えばユーザ入力がタッチディスプレイで受信されるとき、ユーザ入力は、端部1706の一方、他方、又は両方にタッチして、ステント1702の中央に向けてドラッグすることを含むことができる。図17の実施形態では、ステント1702は、ユーザ入力により、ステントの両端で長さ1704だけ短縮され得る。図17では、ステント1702の両端1706での長さ1704がほぼ等しいが、ステントは、端部1706で異なる長さだけ短縮され得ることを理解されたい。ステント1702が一端1706でのみ短縮され得ることも理解されたい。図19の画面表示1900は、脈管702内の修正されたより短い長さを有するステント1902を示す。画面表示1900(図19)に示されるデータは、画面表示2000(図20)に示されるデータに対応する。
FIG. 17 shows a screen display 1700 (or partial screen display) that includes a visual representation of a vessel. The data shown in screen display 1700 (FIG. 17) corresponds to the data shown in screen display 1800 (FIG. 18). In the embodiment of FIG. 17,
図18は、圧力比の視覚的表現を含む画面表示1800(又は部分画面表示)を示す。画面表示1800(図18)に示されるデータは、画面表示1700(図17)に示されるデータに対応する。図18の実施形態では、画面表示1800は、対応するユーザ入力に応答してステント1802の長さが短縮されている中間段階にあるものとして示されている。幾つかの実施形態では、ユーザ入力は、短縮オプション1608の選択である。短縮オプション1608の選択により、ステント1802の長さが、端部1806の一方、他方、又は両方で固定量だけ短縮され得る。幾つかの実施形態では、例えばユーザ入力がタッチディスプレイで受信されるとき、ユーザ入力は、端部1806の一方、他方、又は両方にタッチして、ステント1802の中央に向けてドラッグすることを含むことができる。図18の実施形態では、ユーザ入力により、ステント1802は、ステントの両端で長さ1804だけ短縮され得る。幾つかの実施形態では、圧力曲線852に隣接する側でのステント1802の長さの短縮が、ステント1602の元の位置からステント1802を移動させることができる。即ち、(図18の実施形態で)ステント1602の左側での長さの短縮により、ステントの長さが変化し、且つステントの位置が右に移動する。幾つかの実施形態では、圧力曲線852の反対側のステント1802の長さの短縮が、ステントの位置を変えることなくステントの長さを変えることができる。幾つかの実施形態では、補正圧力比曲線1004はリアルタイムで更新され得、それにより、ステント1802が短縮されているときに、曲線1004は、ステント1802が現時点での長さを有する状態での予測される圧力比を反映するように調節される。図20の画面表示2000は、圧力比曲線852に沿って、修正されたより短い長さと、修正された位置とを有するステント2002を示す。画面表示2000(図20)に示されるデータは、画面表示1900(図19)に示されるデータに対応する。
FIG. 18 shows a screen display 1800 (or partial screen display) that includes a visual representation of the pressure ratio. The data shown in screen display 1800 (FIG. 18) corresponds to the data shown in screen display 1700 (FIG. 17). In the embodiment of FIG. 18, the
また、画面表示2000は、ステント2002の減少された長さに基づいて更新された補正圧力比曲線1004も提供する。図20の実施形態では、ステント2002の短縮された長さは、脈管702内の障害物によって引き起こされる圧力低下に対する改善を提供しない。実際、図20の曲線1004は、ステント1602がその元の長さを有していたときの図16の曲線1004よりも目標ライン820から離れている。目標ライン820から離れている図20の曲線1004は、ステント2002が脈管702内の障害物をあまり良好にまたがず、障害物によって引き起こされる圧力の変化を改善するには不十分であることを示している。PCI計画中の脈管702内の予測圧力比を改良するために、臨床医は、以下に述べるように、ステントの長さを増加させることができる。
The screen display 2000 also provides an updated corrected
図21は、脈管の視覚的表現を含む画面表示2100(又は部分画面表示)を示す。画面表示2100(図21)に示されるデータは、画面表示2200(図22)に示されるデータに対応する。図21の実施形態では、画面表示2100は、対応するユーザ入力に応答してステント2102の長さが増加されている中間段階にあるものとして示されている。幾つかの実施形態では、ユーザ入力は、延長オプション1508の選択である。短縮オプション1508の選択により、ステント1702の長さが、端部2106の一方、他方、又は両方で固定量又は可変量だけ増加され得る。幾つかの実施形態では、例えばユーザ入力がタッチディスプレイで受信されるとき、ユーザ入力は、端部2106の一方、他方、又は両方にタッチして、ステント2102の中央に向けてドラッグすることを含むことができる。ユーザ入力により、ステント2102は、ステントの両端2106で長さ2104だけ延長され得る。図21に示されるように、(例えば0.93から0.81への)圧力比の変化箇所により近いステントの端部は、圧力変化を引き起こす障害物を有する可能性が高い脈管702の領域をステントが覆うように延長される。図21では両端2106での長さ2104が異なるが、他の実施形態では、長さ2104が同じであり得ることを理解されたい。また、ステント2102が一端2106のみで延長され得ることも理解されたい。図23の画面表示2300は、脈管702内の修正されたより長い長さを有するステント2302を示す。画面表示2300(図23)に示されるデータは、画面表示2400(図24)に示されるデータに対応する。
FIG. 21 shows a screen display 2100 (or partial screen display) that includes a visual representation of a vessel. The data shown in screen display 2100 (FIG. 21) corresponds to the data shown in screen display 2200 (FIG. 22). In the embodiment of FIG. 21,
図22は、圧力比の視覚的表現を含む画面表示2200(又は部分画面表示)を示す。画面表示2200(図22)に示されるデータは、画面表示2100(図21)に示されるデータに対応する。図22の実施形態では、画面表示2200は、対応するユーザ入力に応答してステント2202の長さが増加されている中間段階にあるものとして示されている。幾つかの実施形態では、ユーザ入力は、延長オプション1608の選択である。延長オプション1608の選択により、ステント2202の長さが、端部2206の一方、他方、又は両方で固定量又は可変量だけ増加され得る。幾つかの実施形態では、例えばユーザ入力がタッチディスプレイで受信されるとき、ユーザ入力は、端部2206の一方、他方、又は両方にタッチして、ステント2202の中央から離れるようにドラッグすることを含むことができる。ユーザ入力により、ステント2202は、ステントの両端2206で長さ2204だけ延長され得る。幾つかの実施形態では、圧力曲線852に隣接するステント2202の延長が、ステント1602の元の位置からステント2202を移動させることができる。即ち、(図22の実施形態で)ステント1602の左側での長さの増加により、ステントの長さが変化し、且つステントの位置が左に移動する。幾つかの実施形態では、圧力曲線852の反対側のステント2202の長さの短縮が、ステントの位置を変えることなくステントの長さを変えることができる。図22に示されるように、ステント2202は、脈管内の障害物によって引き起こされる圧力変化を示す曲線852の領域をステントが覆うように、延長されて移動される。図22では両端2206での長さ2204が異なるが、他の実施形態では、長さ2204が同じであり得ることを理解されたい。また、ステント2202が一端2206のみで延長され得ることも理解されたい。幾つかの実施形態では、補正圧力比曲線1004はリアルタイムで更新され得、それにより、ステント2202が延長されているときに、曲線1004は、ステント2202が現時点での長さを有する状態での予測される圧力比を反映するように調節される。図24の画面表示2400は、圧力比曲線852に沿って、修正されたより長い長さと、修正された位置とを有するステント2402を示す。画面表示2400(図24)に示されるデータは、画面表示2300(図23)に示されるデータに対応する。
FIG. 22 shows a screen display 2200 (or partial screen display) that includes a visual representation of the pressure ratio. The data shown in screen display 2200 (FIG. 22) corresponds to the data shown in screen display 2100 (FIG. 21). In the embodiment of FIG. 22, the
また、画面表示2400は、ステント2402の増加された長さに基づいて更新された補正圧力比曲線1004も提供する。例えば、図24の曲線1004は、ステント1602がその元の長さを有していたときの図16の曲線1004よりも目標ライン820に近い。図24の曲線1004が目標ライン820により近いことは、ステント2402が脈管702内の障害物に対してより良い長さであり、障害物によって引き起こされる圧力の変化を改善することを示す。曲線1004が目標ライン820を超えない間、臨床医は、PCI計画中、予測される結果が最良の臨床結果であるという医療的決定を下し得る。ステント2402の仮想の/シミュレートされた特性は、PCI計画に基づいて患者を治療するためにヒト脈管内に位置決めされるべきステントの実際の生理学的パラメータと相関され得る。従って、ステントのグラフィック表現を伸縮させることで、臨床医は、PCI計画中の臨床効果を最大にするようにステントが展開されるのに適した生理学的長さを選択することが可能になる。
The
幾つかの実施形態では、画面表示1700(図17)及び2100(図21)の脈管702内のステントの長さを変えることにより、それに対応して、画面表示1800(図12)及び2200(図22)の圧力比曲線852に沿ってステントをそれぞれ短縮又は延長させることができる。同様に、画面表示1800(図12)及び2200(図22)の圧力比曲線852に沿ったステントの長さを変えることにより、それに対応して、画面表示1700(図17)及び2100(図21)の脈管702内でステントをそれぞれ短縮又は延長させることができる。このようにして、臨床医は、画面表示1700及び1800のうちの選択された一方と直接対話しながらPCI計画を行うと共に、画面表示1700及び1800のうちの選択されていない一方の対応する変化を自動で閲覧することができる。同様に、臨床医は、画面表示2100と2200のうちの選択された一方と直接対話しながらPCI計画を行うと共に、画面表示2100と2200のうちの選択されていない一方の対応する変化を自動で閲覧することができる。例えば、臨床医は、圧力比曲線852と、計算された圧力比曲線に対するステントの長さとを示す画面表示2200上で直接操作することができる。補正圧力比曲線1004が理想圧力比ライン806及び/又は目標ライン820により良く合致するように、ステントが圧力比曲線852に沿って延長され得る。脈管の画面表示2100上で、ステントの長さの対応する変更が行われ得、それにより、臨床医は、補正圧力比曲線852(図24)を実現するために脈管内で展開されるべきステントの長さを理解できるようになる。
In some embodiments, by varying the length of the stent within
図7〜図24の説明は、1つの修正(例えばステントの移動又はステントの長さの変更)を述べているが、ステントに対して複数の操作が行われ得る(例えば、ステントを移動させる1つ又は複数のインスタンス、及びステントの長さを変える1つ又は複数のインスタンス)ことを理解されたい。 Although the description of FIGS. 7-24 describes one modification (eg, moving the stent or changing the length of the stent), multiple operations may be performed on the stent (eg, moving the stent 1 One or more instances, and one or more instances that change the length of the stent).
更に、図7〜図24に関連して、ステントの長さ及び位置が述べるが、本開示が、直径及び材料等、ステントの他の特性にも同様に適用されることを理解されたい。例えば、生理学的ステントのサイズ設定は、病変の長さと脈管の直径との両方に基づくことができる。例えば、16mmのステントは、2.5mm〜5.0mmにおいて4分の1ミリメートルの増分での直径を有することができる。様々な実施形態において、ステントのグラフィック表現の直径は、脈管の視覚的表現内に又は圧力曲線に沿って適切に収まるように選択され得る。コンピューティングデバイスは、ステントのグラフィック表現の直径を、ヒト脈管に挿入されるべきステントの実際の生理学的直径に相関させることができる。幾つかの実施形態では、臨床医は、生理学的ステント直径を手入力することができる。 Further, while the length and location of the stent is described with reference to FIGS. 7-24, it should be understood that the present disclosure applies to other properties of the stent as well, such as diameter and material. For example, sizing of a physiological stent can be based on both lesion length and vessel diameter. For example, a 16 mm stent can have a diameter in quarter millimeter increments from 2.5 mm to 5.0 mm. In various embodiments, the diameter of the graphic representation of the stent can be selected to fit properly within the visual representation of the vessel or along the pressure curve. The computing device can correlate the diameter of the graphic representation of the stent with the actual physiological diameter of the stent to be inserted into the human vessel. In some embodiments, the clinician can manually enter the physiological stent diameter.
幾つかの実施形態では、コンピューティングデバイスは、例えば血管造影画像で脈管の直径を決定するためにQCA(定量的冠動脈造影)を行うことができる。例えば、PCI計画中、臨床医は、脈管の血管造影画像又は圧力曲線にオーバーレイされたステントのグラフィック表現に関する位置及び/又は長さを選択することができる。コンピューティングデバイスは、QCAを使用して、提案されたステントの両端での実際の生理学的脈管直径を決定し、ヒト脈管内での使用に推奨される生理学的ステント直径を決定することができる。例えば、コンピューティングデバイスは、提案されたステントの両端に関連する2つの直径の大きい方を選択することができる。臨床医が、生理学的ステント直径の決定を指示することができ、又はコンピューティングデバイスが、生理学的ステント直径を自動で決定して提供することができる。 In some embodiments, the computing device can perform QCA (quantitative coronary angiography) to determine vessel diameter, eg, in angiographic images. For example, during PCI planning, the clinician may select a position and / or length for a graphical representation of a stent overlaid on a vessel angiographic image or pressure curve. The computing device can use the QCA to determine the actual physiologic vessel diameter at both ends of the proposed stent and to determine the recommended physiologic stent diameter for use in human vessels. . For example, the computing device may choose the larger of the two diameters associated with the ends of the proposed stent. The clinician can direct the determination of the physiological stent diameter, or the computing device can automatically determine and provide the physiological stent diameter.
幾つかの実施形態では、生理学的ステント直径を決定するために血管内撮像が使用され得る。例えば、血管内超音波(IVUS)、前方視IVUS(FL−IVUS)、光干渉断層画像診断法(OCT)、及び/又は他の撮像モダリティを使用して脈管が撮像され得る。それに関して、方法500及び600は、幾つかの実施形態では、血管内撮像データを取得することを含むことができる。例えば、全体を参照により本明細書に援用する「VISCULAR IMAGE CO-REGISTRATION」という名称の米国特許第7,930,014号に記載されているように、血管内画像は、血管造影データ及び/又は生理学的データ(例えば圧力測定量及び流量測定値等)とコレジストレーションされ得る。例えば、PCI計画中、臨床医は、脈管の血管造影画像又は圧力曲線にオーバーレイされたステントのグラフィック表現に関する位置及び/又は長さを選択することができる。臨床医は、提案されるステントの両端での血管内画像を閲覧し、血管内画像に基づいて生理学的脈管直径を決定することができる。幾つかの実施形態では、例えば、全体を参照により本明細書に援用する「DEVICES, SYSTEMS, AND METHODS FOR IMPROVED ACCURACY MODEL OF VESSEL ANATOMY」という名称の2014年7月14日出願の米国仮特許出願第62/024,339号に記載されているように、コンピューティングデバイスは、血管内画像を使用して脈管境界及び生理学的脈管直径を自動で決定することができる。決定された生理学的脈管直径に基づいて、臨床医が生理学的ステント直径を決定することができ、又はコンピューティングデバイスが生理学的ステント直径を自動で決定して提供することができる。例えば、臨床医又はコンピューティングデバイスは、提案されたステントの両端に関連する2つの直径の大きい方を選択することができる。
In some embodiments, intravascular imaging can be used to determine the physiological stent diameter. For example, intravascular ultrasound (IVUS), anterior-view IVUS (FL-IVUS), optical coherence tomography (OCT), and / or other imaging modalities may be used to image a vessel. In that regard, the
更に、PCI計画が、脈管内に複数のステントを位置決めして個別に調節することを含み得ることを理解されたい。それに関して、図25及び図26は、ステントの複数のグラフィック表現を有する画面表示を示す。図25は、ステント2502及び2504の2つのグラフィック表現を有する脈管の視覚的表現を含む画面表示2500(又は部分画面表示)を示す。図26は、ステント2602及び2604の2つのグラフィック表現を有する圧力比の視覚的表現の画面表示2600(又は部分画面表示)を示す。画面表示2500(図25)に示されるデータは、画面表示2600(図26)に示されるデータに対応し、その逆も同様である。PCI計画は、血管造影データ及び/又は生理学的データが複数の閉塞を示すとき、ステントの複数のグラフィック表現を含むことができる。例えば、図26の圧力曲線852は、異なる病変に起因し得る2つの圧力低下2610、2612を含む。PCI計画は、病変の一方又は両方を治療することを決定することを含むことができる。図25及び図26の論述では2つのステントが特に言及されているが、PCI計画が、1、2、3、4、5、6、又は7つ以上を含む任意の適切な数のステントを含み得ることを理解されたい。
Further, it should be appreciated that PCI planning may include positioning and individually adjusting multiple stents within a vessel. In that regard, FIGS. 25 and 26 show screen displays having multiple graphical representations of a stent. FIG. 25 shows a screen display 2500 (or partial screen display) that includes a visual representation of a vessel with two graphical representations of
図25に示されるように、ステント2502及び2504のグラフィック表現がそれぞれ、脈管702の視覚的表現内に挿入され得る。PCI計画は、本明細書で述べたように、例えば、ステント2502及び2504のグラフィック表現を移動させたり、長さ/直径を変えたりすることによって実施され得る。幾つかの実施形態では、例えば、まず特定のステントを選択するためのユーザ入力を受信し、次いで、選択されたステントの特性を修正するためのユーザ入力を受信することにより、ステント2502及び2504のグラフィック表現の特性が個別に修正され得る。幾つかの実施形態では、例えば、まず両方のステントを選択するためのユーザ入力を受信し、両方のステントの特性を修正するためのユーザ入力を受信することにより、ステント2502及び2504の特性が一緒に挿入及び/又は修正され得る。
As shown in FIG. 25, graphical representations of
図26に示されるように、ステント2602及び2604のグラフィック表現はそれぞれ、圧力比の視覚的表現に沿って挿入され得る。PCI計画は、本明細書で述べたように、例えば、ステント2602及び2604のグラフィック表現を移動させたり、長さ/直径を変えたりすることによって実施され得る。様々な実施形態において、ステント2602及び2604のグラフィック表現の特性は、個別に又は一緒に修正され得る。補正圧力比曲線は、ステントの各グラフィック表現に関連付けられ得る。例えば、補正圧力比曲線2606は、ステント2602に関連付けられ、補正圧力比曲線2608は、ステント2604に関連付けられる。臨床医は、圧力曲線852に沿ってステント2602のグラフィック表現を挿入することができる。ステント2602のグラフィック表現の特性は、本明細書で述べたように修正され得る。補正圧力比曲線2606の遠位値が閾値804よりも上であることによって示されるように、ステント2602は、幾らかの臨床的改善をもたらす。臨床医は、補正圧力比曲線2606に沿ってステント2604のグラフィック表現を挿入することができる。ステント2604のグラフィック表現の特性は、本明細書で述べたように修正され得る。補正圧力比曲線2608の遠位値が目標ライン820よりも上であることによって示されるように、ステント2604は、ステント2602と共に、有益な臨床的結果をもたらすことができる。ステント2602及び2606の仮想の/シミュレートされた特性は、PCI計画に基づいて患者を治療するためにヒト脈管内に位置決めされるべきステントの実際の生理学的パラメータに相関され得る。
As shown in FIG. 26, the graphical representations of
本明細書で述べるように、画面表示2500(図25)の脈管702内のステントのグラフィック表現の一方又は両方の特性を修正することにより、それに対応して、画面表示2600(図26)の圧力曲線に沿ったステントのグラフィック表現が同様に修正され得る。
By modifying one or both properties of the graphical representation of the stent within
図27は、脈管の視覚的表現を含む画面表示2700(又は部分画面表示)を示す。画面表示2700(図27)に示されるデータは、画面表示2800(図28)に示されるデータに対応する。画面表示2700は、複数のステントを含むステントオプションメニュー2704を含む。図27には3つのステントが示されているが、異なる実施形態では、より多い又はより少ないステントが提供され得ることを理解されたい。複数のステントはそれぞれ、長さ、直径、及び材料等を含む同様の又は異なる物理的特性を有することができる。幾つかの実施形態では、メニュー2704に提供されるステントは、処置室で臨床医が利用できるものに対応する。例えば、コンピューティングデバイス(例えば図4のコンピューティングデバイス172)は、病院又は他の処置場所の在庫データベースにアクセスして、在庫があり、且つ臨床医が使用のために入手可能なステントのタイプを決定することができる。幾つかの実施形態では、メニュー2704に提供されるステントは、1つ又は複数の製造業者から購入して使用することが可能なものに対応する。例えば、コンピューティングデバイスは、1つ又は複数の製造業者の在庫データベースにアクセスして、購入して使用するために臨床医又は病院が入手可能なステントのタイプを決定することができる。メニュー2704は、様々なステントの視覚的表現2706を含むことができる。異なる材料及び他の特性のステントは、異なる色付け、陰影、又はパターン等によって示され得る。説明2708もメニュー2704の各ステントに付随し得る。例えば、説明2708は、ステントの長さを含むことができる。
FIG. 27 shows a screen display 2700 (or partial screen display) that includes a visual representation of a vessel. The data shown in screen display 2700 (FIG. 27) corresponds to the data shown in screen display 2800 (FIG. 28).
上述したように、脈管702にステントを挿入するためのユーザ入力は、コンピューティングデバイスに、ステントの推奨される物理的特性を自動で決定させることができる。幾つかの場合、推奨される物理的特性は、在庫があり、且つ臨床医が使用のために入手可能なステントに対応しないことがある。例えば、コンピューティングデバイスによって決定される推奨される生理学的長さは15.5mmであり得、実際のステントは1mmの増分でのみ利用可能である。更に、ステントは、生理学的長さと生理学的直径との両方によって識別され得る。そのような実施形態では、コンピューティングデバイスは、入手可能なステントのうちの何れのステントが推奨される物理的特性に最も良く合致するかを自動で決定し、最も良く合致するステントを脈管702内に提供することができる。例えば、コンピューティングデバイスは、15.5mmが推奨ステント長さであるとき、在庫があり、且つ臨床医が入手可能な長さ16mm及び直径3.0mmのステントを脈管702内に提供し得る。生理学的ステント直径は、本明細書で述べるように決定され得る。幾つかの実施形態では、臨床医は、ステントに関する長さ及び/又は直径を決定して、コンピューティングデバイスに提供することができる。コンピューティングデバイスは、在庫データベースにアクセスし、入力された長さ及び/又は直径に基づいて適切なステントを推奨することができる。ユーザは、メニュー2704から別のオプションを選択することにより、推奨されるステントを変更することができる。また、ユーザは、上述したように、位置、直径、及び長さ等のステントの特性を修正することもできる。幾つかの実施形態では、メニュー2704は、在庫があり且つ入手可能なステントのみを提供し、他の実施形態では、メニュー2704は、在庫がある又は入手可能であるかどうかに関係なく、病院での全てのステントを提供する。記号又は色付け等のインジケータが、入手可能なステント又は入手可能でないステントに隣接して設けられ得、それらを他のものから視覚的に区別する。他の実施形態では、コンピューティングデバイスは、複数のステントのうちから自動で選択しない。そうではなく、臨床医が、メニュー2704から個々に選択して、何れのステントが最も適切であるかを決定することができる。脈管702に挿入された、自動で推奨された又は臨床医によって選択されたステント2702の視覚的表現は、メニュー2704での強調表示2710によって示され得る。ステント2702は、図7〜図24に関連して述べたように修正され得る。
As described above, user input for inserting a stent into
図28は、圧力比の視覚的表現を含む画面表示2800(又は部分画面表示)を示す。画面表示2800(図28)に示されるデータは、画面表示2700(図27)に示されるデータに対応する。画面表示2800は、複数のステントを含むステントオプションメニュー2804を含む。図28には3つのステントが示されているが、異なる実施形態では、より多い又はより少ないステントが提供され得ることを理解されたい。幾つかの実施形態では、メニュー2804に提供されるステントは、処置室で臨床医が利用できるものに対応する。例えば、コンピューティングデバイス(例えば図4のコンピューティングデバイス172)は、病院又は他の処置場所の在庫データベースにアクセスして、在庫があり、且つ臨床医が使用のために入手可能なステントのタイプを決定することができる。幾つかの実施形態では、メニュー2804に提供されるステントは、1つ又は複数の製造業者から購入して使用することが可能なものに対応する。例えば、コンピューティングデバイスは、1つ又は複数の製造業者の在庫データベースにアクセスして、購入及び使用のために臨床医又は病院が入手可能なステントのタイプを決定することができる。メニュー2804は、様々なステントの視覚的表現2806を含むことができる。異なる材料及び他の特性のステントは、異なる色付け、陰影、又はパターン等によって示され得る。説明2808もメニュー2804の各ステントに付随し得る。例えば、説明2808は、ステントの長さを含むことができる。
FIG. 28 shows a screen display 2800 (or partial screen display) that includes a visual representation of the pressure ratio. The data shown in screen display 2800 (FIG. 28) corresponds to the data shown in screen display 2700 (FIG. 27).
上述したように、圧力比曲線852に沿ってステントを挿入するためのユーザ入力は、コンピューティングデバイスに、ステントの推奨される物理的特性を自動で決定させることができる。幾つかの場合、推奨される物理的特性は、在庫があり、且つ臨床医が使用のために入手可能なステントに対応しないことがある。例えば、コンピューティングデバイスによって決定される推奨される物理的長さは15.5mmであり得、ステントは1mmの増分でのみ利用可能である。更に、ステントは、生理学的長さと生理学的直径との両方によって識別され得る。幾つかの実施形態では、臨床医は、ステントに関する長さ及び/又は直径を決定して、コンピューティングデバイスに提供することができる。コンピューティングデバイスは、在庫データベースにアクセスし、入力された長さ及び/又は直径に基づいて適切なステントを推奨することができる。そのような実施形態では、コンピューティングデバイスは、入手可能なステントのうちの何れのステントが推奨される物理的特性に最も良く合致するかを自動で決定し、最も良く合致するステントを曲線852に沿って提供することができる。例えば、コンピューティングデバイスは、15.5mmが推奨ステント長さであるとき、在庫があり、且つ臨床医が入手可能な長さ16mm及び直径3.0mmのステントを曲線852に沿って提供し得る。生理学的ステント直径は、本明細書で述べるように決定され得る。ユーザは、メニュー2804から別のオプションを選択することにより、推奨されるステントを変更することができる。また、ユーザは、上述したように、位置、直径、及び長さ等のステントの特性を修正することもできる。幾つかの実施形態では、メニュー2804は、在庫があり且つ入手可能なステントのみを提供し、他の実施形態では、メニュー2804は、在庫がある又は入手可能であるかどうかに関係なく、病院での全てのステントを提供する。記号又は色付け等のインジケータが、入手可能なステント又は入手可能でないステントに隣接して設けられ得、それらを他のものから視覚的に区別する。他の実施形態では、コンピューティングデバイスは、複数のステントのうちから自動で選択しない。そうではなく、臨床医が、メニュー2804から個々に選択して、何れのステントが最も適切であるかを決定することができる。曲線852に沿って挿入された、自動で推奨された又は臨床医によって選択されたステントのグラフィック表現は、メニュー2804での強調表示2510によって示され得る。ステント2802は、図7〜図24に関連して述べたように修正され得る。
As described above, user input to insert the stent along the
幾つかの実施形態では、画面表示2700(図27)の脈管702にメニュー2704からのステントを挿入することにより、それに対応して、画面表示2800(図28)の圧力比曲線852に沿ってステントが挿入され得る。同様に、画面表示2800(図28)の圧力比曲線852に沿ってメニュー2804からのステントを挿入することにより、それに対応して、画面表示2700(図27)の脈管702にステントが挿入され得る。このようにして、臨床医は、画面表示2700及び2800のうちの選択された一方と直接対話しながらPCI計画を行うと共に、画面表示2700と2800のうちの選択されていない一方の対応する変化を自動で閲覧することができる。例えば、臨床医は、圧力比曲線852と、計算された圧力比曲線に対するステントの位置/長さとを示す画面表示2800上で直接操作することができる。補正圧力比曲線1004が理想圧力比ライン806及び/又は目標ライン820により良く合致するように、複数の入手可能なステントのうちからステントが選択されて、圧力比曲線852に沿って挿入され得る。対応するステントは、脈管の画面表示2700の脈管702に挿入され得、それにより、臨床医は、補正圧力比曲線1004を実現するために、入手可能なステントの何れが脈管内に展開されるべきかを理解できるようになる。図28の実施形態では、補正圧力比曲線1004を閾値804に近付けるために、より長いステントが必要である。
In some embodiments, inserting a stent from
上述した装置、システム、及び方法が様々な態様で修正され得ることも当業者は理解されよう。従って、本開示によって包含される実施形態は、上述した特定の例示的実施形態に限定されないことを当業者は理解されよう。それに関して、例示的実施形態を図示して述べてきたが、上記の開示において広範な修正形態、変更形態、及び置換形態が企図される。本開示の範囲から逸脱することなく、上記に対するそのような変更形態がなされ得ることを理解されたい。従って、添付の特許請求の範囲が、広範に且つ本開示と一致するように解釈されることが適切である。 Those skilled in the art will also appreciate that the above-described devices, systems, and methods may be modified in various ways. Accordingly, those of ordinary skill in the art will appreciate that the embodiments encompassed by the present disclosure are not limited to the particular exemplary embodiments described above. In that regard, although exemplary embodiments have been shown and described, a wide variety of modifications, changes, and substitutions are contemplated in the above disclosure. It is to be understood that such modifications to the above can be made without departing from the scope of this disclosure. Therefore, it is appropriate that the appended claims be construed broadly and consistent with the present disclosure.
Claims (19)
患者の脈管に導入するためにサイズ及び形状を定められた第1の器具と、
患者の脈管に導入するためにサイズ及び形状を定められた第2の器具と、
前記第1及び第2の器具並びにディスプレイデバイスに通信可能に接続された処理システムとを備え、
前記方法は、
前記処理システムが、ディスプレイデバイスに画面表示を出力するステップであって、当該画面表示は、
第1の器具が脈管内で静止したままであり、且つ第2の器具が脈管を通して長手方向に移動されている間に、患者の脈管内に位置決めされた前記第1の器具及び前記第2の器具から取得された圧力測定量に基づく視覚化表現と、
脈管の視覚的表現と
を含む、ステップと、
前記処理システムが、療法処置をシミュレートするために前記視覚化表現を修正するためステントを短縮又は延長又は移動するためのユーザ入力を受信するステップと、
前記処理システムが、前記ユーザ入力に応答して、前記ユーザ入力に基づいて前記視覚化表現を修正することを含む、前記画面表示を更新するステップと
を含み、
前記視覚化表現は、脈管の前記視覚的表現内に位置決めされた前記ステントのグラフィック表現を含み、前記処理システムが、前記ステントの前記グラフィック表現の特性に基づいて、脈管内で展開されるべきステントに関する生理学的パラメータを決定するステップを更に含む、
方法。 A method of operating a system for assessing a patient's vessel, the system comprising:
A first device sized and shaped for introduction into a vessel of a patient;
A second device sized and shaped for introduction into a patient's vessel;
A processing system communicatively connected to the first and second instruments and a display device,
The method is
The processing system is a step of outputting a screen display to a display device, the screen display comprising:
The first device and the second device positioned within a vessel of a patient while the first device remains stationary within the vessel and the second device is longitudinally moved through the vessel. Visualization representation based on pressure measurements obtained from
And a visual representation of the vessels,
Said processing system receiving user input for shortening or extending or moving a stent to modify said visualization to simulate a therapeutic procedure;
Updating the screen display in response to the user input, the processing system comprising modifying the visualization representation based on the user input;
The visualization representation should include a graphical representation of the stent positioned within the visual representation of a vessel, the processing system being deployed within the vessel based on characteristics of the graphical representation of the stent. Further comprising determining a physiological parameter for the stent,
Method.
前記ステントの前記グラフィック表現の前記特性は、位置、長さ、及び直径の少なくとも1つを含む、
請求項1に記載の方法。 The physiological parameter includes at least one of a position of the stent, a length of the stent, and a diameter of the stent, and the characteristic of the graphical representation of the stent is at least the position, the length, and the diameter. Including one,
The method of claim 1.
を更に含む、請求項11に記載の方法。 12. The method of claim 11, wherein the processing system further comprises compiling the plurality of graphical representations of stents based on an inventory database of stents associated with a clinical environment.
前記処理システムが、前記血管造影データと、前記取得された圧力測定量と、前記取得された圧力測定量に基づいて計算された圧力比との少なくとも1つに基づいて、ステントの複数のグラフィック表現のうちからステントのグラフィック表現を自動で選択するステップであって、前記視覚化表現は、ステントの前記複数のグラフィック表現のうちから前記自動で選択されたステントのグラフィック表現を含む、ステップと
の少なくとも一方を更に含む、請求項11に記載の方法。 The processing system receiving user input for selecting one of the plurality of graphical representations of a stent, the visualization representation being positioned within the visual representation of the vessel. Including the selected graphic representation of a stent,
The processing system includes a plurality of graphical representations of a stent based on at least one of the angiographic data, the acquired pressure measurement, and a pressure ratio calculated based on the acquired pressure measurement. At least automatically selecting a graphical representation of the stent from among the plurality of graphical representations of the stent, the visualizing representation including a graphical representation of the automatically selected stent of the plurality of graphical representations of the stent. The method of claim 11, further comprising one.
前記取得された圧力測定量に関連する脈管内の位置を示すマーカと、
脈管内の前記位置を示す前記マーカに隣接して位置決めされた前記計算された圧力比と
の少なくとも一方を更に含む、請求項14に記載の方法。 The visualization is
A marker indicating the position within the vessel associated with the acquired pressure measurement,
15. The method of claim 14, further comprising: at least one of the calculated pressure ratio positioned adjacent to the marker indicative of the position within a vessel.
患者の脈管に導入するためにサイズ及び形状を定められた第1の器具と、
患者の脈管に導入するためにサイズ及び形状を定められた第2の器具と、
前記第1及び第2の器具並びにディスプレイデバイスに通信可能に接続された処理システムとを備え、当該処理システムは、
前記第2の器具が前記脈管を通して長手方向に移動され、且つ前記第1の器具が前記脈管内で静止したままである間に、患者の脈管内に位置決めされた前記第1の器具及び前記第2の器具から圧力測定量を受信し、
前記ディスプレイデバイスに、
前記第1の器具及び前記第2の器具から受信された圧力測定量に基づく視覚化表現と、
脈管の視覚的表現と
を含む画面表示を出力し、
療法処置をシミュレートするために前記視覚化表現を修正するためステントを短縮又は延長又は移動するためのユーザ入力を受信し、
前記ユーザ入力に応答して、前記ユーザ入力に基づいて前記視覚化表現を修正することを含む、前記画面表示を更新し、
前記視覚化表現は、脈管の前記視覚的表現内に位置決めされた前記ステントのグラフィック表現を含み、前記処理システムが、前記ステントの前記グラフィック表現の特性に基づいて、脈管内で展開されるべきステントに関する生理学的パラメータを決定する、
システム。 A system for assessing a patient's vessels, comprising:
A first device sized and shaped for introduction into a vessel of a patient;
A second device sized and shaped for introduction into a patient's vessel;
A processing system communicatively connected to the first and second instruments and a display device, the processing system comprising:
The first device positioned within a vessel of a patient while the second device is longitudinally moved through the vessel and the first device remains stationary within the vessel; and Receiving a pressure measurement from the second instrument,
In the display device,
A visualization representation based on pressure measurements received from the first instrument and the second instrument;
Output a screen display that includes a visual representation of the vessel,
Receiving user input to shorten or extend or move the stent to modify the visualization to simulate a therapeutic procedure;
Updating the screen display in response to the user input, including modifying the visualization representation based on the user input;
The visualization representation should include a graphical representation of the stent positioned within the visual representation of a vessel, and the processing system should be deployed within the vessel based on characteristics of the graphical representation of the stent. Determine physiological parameters for the stent,
system.
Applications Claiming Priority (3)
| Application Number | Priority Date | Filing Date | Title |
|---|---|---|---|
| US201462080023P | 2014-11-14 | 2014-11-14 | |
| US62/080,023 | 2014-11-14 | ||
| PCT/IB2015/058480 WO2016075590A1 (en) | 2014-11-14 | 2015-11-03 | Percutaneous coronary intervention (pci) planning interface and associated devices, systems, and methods |
Publications (3)
| Publication Number | Publication Date |
|---|---|
| JP2017534394A JP2017534394A (en) | 2017-11-24 |
| JP2017534394A5 JP2017534394A5 (en) | 2018-12-13 |
| JP6692809B2 true JP6692809B2 (en) | 2020-05-13 |
Family
ID=54601854
Family Applications (1)
| Application Number | Title | Priority Date | Filing Date |
|---|---|---|---|
| JP2017525405A Active JP6692809B2 (en) | 2014-11-14 | 2015-11-03 | Percutaneous Coronary Intervention Planning Interface and Related Devices, Systems, and Methods |
Country Status (5)
| Country | Link |
|---|---|
| US (5) | US10667775B2 (en) |
| EP (1) | EP3218829B1 (en) |
| JP (1) | JP6692809B2 (en) |
| CN (2) | CN107106130A (en) |
| WO (1) | WO2016075590A1 (en) |
Families Citing this family (32)
| Publication number | Priority date | Publication date | Assignee | Title |
|---|---|---|---|---|
| WO2016038493A1 (en) * | 2014-09-11 | 2016-03-17 | Koninklijke Philips N.V. | Bedside controller for assessment of vessels and associated devices, systems, and methods |
| EP3725225A1 (en) | 2015-02-12 | 2020-10-21 | Foundry Innovation & Research 1, Ltd. | Implantable devices for heart failure monitoring |
| WO2016207762A1 (en) | 2015-06-25 | 2016-12-29 | Koninklijke Philips N.V. | Interactive intravascular procedure training and associated devices, systems, and methods |
| WO2017024051A1 (en) | 2015-08-03 | 2017-02-09 | Foundry Innovation & Research 1, Ltd. | Devices and methods for measurement of vena cava dimensions, pressure, and oxygen saturation |
| US20170308997A1 (en) * | 2016-04-20 | 2017-10-26 | Abbott Laboratories Services Corp., Taiwan Branch | Method and system for processing an image frame showing a biodegradable medical device in a part of a human body |
| EP4241694A3 (en) | 2016-05-16 | 2023-12-20 | Cathworks Ltd. | Selection of vascular paths from images |
| US11206992B2 (en) | 2016-08-11 | 2021-12-28 | Foundry Innovation & Research 1, Ltd. | Wireless resonant circuit and variable inductance vascular monitoring implants and anchoring structures therefore |
| EP3496606A1 (en) | 2016-08-11 | 2019-06-19 | Foundry Innovation & Research 1, Ltd. | Systems and methods for patient fluid management |
| US11701018B2 (en) | 2016-08-11 | 2023-07-18 | Foundry Innovation & Research 1, Ltd. | Wireless resonant circuit and variable inductance vascular monitoring implants and anchoring structures therefore |
| DE202017106017U1 (en) * | 2016-10-04 | 2018-02-05 | Toshiba Medical Systems Corporation | Medical information processing device |
| CA3043228A1 (en) | 2016-11-29 | 2018-06-07 | Foundry Innovation & Research 1, Ltd. | Wireless resonant circuit and variable inductance vascular implants for monitoring patient vasculature and fluid status and systems and methods employing same |
| WO2018220146A1 (en) | 2017-05-31 | 2018-12-06 | Foundry Innovation & Research 1, Ltd. | Implantable sensors for vascular monitoring |
| WO2018220143A1 (en) | 2017-05-31 | 2018-12-06 | Foundry Innovation And Research 1, Ltd | Implantable ultrasonic vascular sensor |
| EP3453326A1 (en) * | 2017-09-08 | 2019-03-13 | Koninklijke Philips N.V. | Registration and comparison of measured and simulated intracoronary pullback curves |
| EP3461416A1 (en) * | 2017-09-28 | 2019-04-03 | Koninklijke Philips N.V. | Guiding an intravascular us catheter |
| JP7160659B2 (en) | 2018-01-11 | 2022-10-25 | キヤノンメディカルシステムズ株式会社 | Medical information processing apparatus, medical information processing system, and medical information processing method |
| US11523788B2 (en) * | 2018-01-11 | 2022-12-13 | Canon Medical Systems Corporation | Medical information processing apparatus, medical information processing system, and medical information processing method |
| US11150776B2 (en) * | 2018-02-02 | 2021-10-19 | Centerline Biomedical, Inc. | Graphical user interface for marking anatomic structures |
| JP7024103B2 (en) * | 2018-02-23 | 2022-02-22 | ボストン サイエンティフィック サイムド,インコーポレイテッド | Evaluation method of blood vessels by sequential physiological measurement |
| EP3768156B1 (en) | 2018-03-23 | 2023-09-20 | Boston Scientific Scimed, Inc. | Medical device with pressure sensor |
| EP3773182B1 (en) | 2018-04-06 | 2023-08-09 | Boston Scientific Scimed, Inc. | Medical device with pressure sensor |
| WO2019204219A1 (en) | 2018-04-18 | 2019-10-24 | Boston Scientific Scimed, Inc. | System for assessing a vessel with sequential physiological measurements |
| CN112912011A (en) * | 2018-10-26 | 2021-06-04 | 皇家飞利浦有限公司 | Intraluminal ultrasound navigation guidance and associated devices, systems, and methods |
| CN111227822B (en) * | 2018-11-28 | 2022-02-11 | 苏州润迈德医疗科技有限公司 | Coronary artery blood flow reserve fraction calculation method based on myocardial blood flow volume and CT image |
| WO2020113083A1 (en) | 2018-11-28 | 2020-06-04 | Histosonics, Inc. | Histotripsy systems and methods |
| DE102018220758B4 (en) * | 2018-11-30 | 2023-02-16 | Siemens Healthcare Gmbh | Device and method for controlling an X-ray machine |
| USD926199S1 (en) | 2019-05-17 | 2021-07-27 | Opsens, Inc. | Display screen or portion thereof with graphical user interface |
| CA3169465A1 (en) | 2020-01-28 | 2021-08-05 | The Regents Of The University Of Michigan | Systems and methods for histotripsy immunosensitization |
| WO2022202303A1 (en) * | 2021-03-25 | 2022-09-29 | テルモ株式会社 | Computer program, information processing method, and information processing device |
| WO2023104599A1 (en) * | 2021-12-11 | 2023-06-15 | Koninklijke Philips N.V. | Automatic segmentation and treatment planning for a vessel with coregistration of physiology data and extraluminal data |
| US20230270407A1 (en) * | 2022-02-26 | 2023-08-31 | Xenter, Inc. | Medical devices, systems, and methods incorporating the same |
| WO2024071251A1 (en) * | 2022-09-29 | 2024-04-04 | テルモ株式会社 | Computer program, information processing method, information processing device, and learning model |
Family Cites Families (22)
| Publication number | Priority date | Publication date | Assignee | Title |
|---|---|---|---|---|
| WO2004005587A2 (en) | 2002-07-08 | 2004-01-15 | The Regents Of The University Of California | Surface nanopatterning |
| US20050010138A1 (en) | 2003-07-11 | 2005-01-13 | Mangiardi Eric K. | Lumen-measuring devices and method |
| DE102005045071A1 (en) * | 2005-09-21 | 2007-04-12 | Siemens Ag | Catheter device with a position sensor system for the treatment of a partial and / or complete vascular occlusion under image monitoring |
| WO2006076409A2 (en) | 2005-01-11 | 2006-07-20 | Volcano Corporation | Vascular image co-registration |
| US7892177B2 (en) * | 2005-02-28 | 2011-02-22 | Scimed Life Systems, Inc. | Systems and methods for estimating the length and position of a stent to be applied within a patient |
| JP4473800B2 (en) * | 2005-09-09 | 2010-06-02 | 株式会社東芝 | Therapeutic device selection support system and therapeutic device selection method |
| US8781193B2 (en) | 2007-03-08 | 2014-07-15 | Sync-Rx, Ltd. | Automatic quantitative vessel analysis |
| JP5639764B2 (en) | 2007-03-08 | 2014-12-10 | シンク−アールエックス,リミティド | Imaging and tools for use with moving organs |
| EP2170162B1 (en) * | 2007-06-26 | 2017-08-23 | Vasonova, Inc. | Apparatus for endovascular device guiding and positioning using physiological parameters |
| JP5523791B2 (en) * | 2008-10-27 | 2014-06-18 | 株式会社東芝 | X-ray diagnostic apparatus and image processing apparatus |
| EP3876148A1 (en) | 2010-07-29 | 2021-09-08 | Sync-RX, Ltd. | Co-use of endoluminal data and extraluminal imaging |
| GB201100136D0 (en) | 2011-01-06 | 2011-02-23 | Davies Helen C S | Apparatus and method of characterising a narrowing in a filled tube |
| GB201100137D0 (en) | 2011-01-06 | 2011-02-23 | Davies Helen C S | Apparatus and method of assessing a narrowing in a fluid tube |
| GB2487079A (en) | 2011-01-07 | 2012-07-11 | Oclaro Technology Ltd | Tunable pumping light source for optical amplifiers |
| US20140094697A1 (en) * | 2011-05-27 | 2014-04-03 | Lightlab Imaging, Inc. | Optical coherence tomography and pressure based systems and methods |
| US9339348B2 (en) | 2011-08-20 | 2016-05-17 | Imperial Colege of Science, Technology and Medicine | Devices, systems, and methods for assessing a vessel |
| WO2013028612A2 (en) * | 2011-08-20 | 2013-02-28 | Volcano Corporation | Devices, systems, and methods for visually depicting a vessel and evaluating treatment options |
| US8548778B1 (en) | 2012-05-14 | 2013-10-01 | Heartflow, Inc. | Method and system for providing information from a patient-specific model of blood flow |
| CA2896589A1 (en) * | 2012-12-31 | 2014-07-03 | Volcano Corporation | Devices, systems, and methods for assessment of vessels |
| CN105392429B (en) * | 2013-07-19 | 2020-11-24 | 火山公司 | Device, system and method for evaluating a vessel |
| CN105636509B (en) * | 2013-10-18 | 2019-07-02 | 火山公司 | Assess the equipment, system and method for vascular |
| US20150141853A1 (en) * | 2013-11-15 | 2015-05-21 | Acist Medical Systems, Inc. | Multi-sensor lesion assessment device and method |
-
2015
- 2015-11-03 WO PCT/IB2015/058480 patent/WO2016075590A1/en active Application Filing
- 2015-11-03 CN CN201580061751.7A patent/CN107106130A/en active Pending
- 2015-11-03 EP EP15797445.2A patent/EP3218829B1/en active Active
- 2015-11-03 CN CN202211610173.6A patent/CN115813438A/en active Pending
- 2015-11-03 JP JP2017525405A patent/JP6692809B2/en active Active
- 2015-11-12 US US14/939,172 patent/US10667775B2/en active Active
-
2020
- 2020-06-01 US US16/888,896 patent/US11205507B2/en active Active
-
2021
- 2021-12-21 US US17/557,214 patent/US11688502B2/en active Active
-
2023
- 2023-06-26 US US18/214,451 patent/US20230352145A1/en active Pending
- 2023-10-17 US US18/380,913 patent/US20240047038A1/en active Pending
Also Published As
| Publication number | Publication date |
|---|---|
| US11688502B2 (en) | 2023-06-27 |
| WO2016075590A1 (en) | 2016-05-19 |
| EP3218829A1 (en) | 2017-09-20 |
| US10667775B2 (en) | 2020-06-02 |
| CN115813438A (en) | 2023-03-21 |
| US20160135787A1 (en) | 2016-05-19 |
| US11205507B2 (en) | 2021-12-21 |
| CN107106130A (en) | 2017-08-29 |
| EP3218829B1 (en) | 2020-10-28 |
| US20240047038A1 (en) | 2024-02-08 |
| US20200289076A1 (en) | 2020-09-17 |
| JP2017534394A (en) | 2017-11-24 |
| US20220115112A1 (en) | 2022-04-14 |
| US20230352145A1 (en) | 2023-11-02 |
Similar Documents
| Publication | Publication Date | Title |
|---|---|---|
| JP6692809B2 (en) | Percutaneous Coronary Intervention Planning Interface and Related Devices, Systems, and Methods | |
| US11779286B2 (en) | Percutaneous coronary intervention (PCI) planning interface with pressure data and vessel data and associated devices, systems, and methods | |
| US20220000427A1 (en) | Automated identification and classification of intravascular lesions | |
| JP7391133B2 (en) | Devices, systems and methods for evaluating, planning and treating coronary interventions based on desired outcomes | |
| JP6925268B2 (en) | Devices and methods for recommending diagnostic procedures based on co-registration angiographic images and physiological information measured by intravascular devices | |
| JP6789944B2 (en) | Interactive cardiac test data and related devices, systems, and methods | |
| CN106535746A (en) | Devices, systems, and methods for treatment of vessels | |
| WO2016008809A1 (en) | Devices, systems, and methods and associated display screens for assessment of vessels with multiple sensing components |
Legal Events
| Date | Code | Title | Description |
|---|---|---|---|
| A521 | Request for written amendment filed |
Free format text: JAPANESE INTERMEDIATE CODE: A523 Effective date: 20181101 |
|
| A621 | Written request for application examination |
Free format text: JAPANESE INTERMEDIATE CODE: A621 Effective date: 20181101 |
|
| A131 | Notification of reasons for refusal |
Free format text: JAPANESE INTERMEDIATE CODE: A131 Effective date: 20190830 |
|
| A977 | Report on retrieval |
Free format text: JAPANESE INTERMEDIATE CODE: A971007 Effective date: 20190828 |
|
| A521 | Request for written amendment filed |
Free format text: JAPANESE INTERMEDIATE CODE: A523 Effective date: 20191126 |
|
| A131 | Notification of reasons for refusal |
Free format text: JAPANESE INTERMEDIATE CODE: A131 Effective date: 20191210 |
|
| A521 | Request for written amendment filed |
Free format text: JAPANESE INTERMEDIATE CODE: A523 Effective date: 20200226 |
|
| TRDD | Decision of grant or rejection written | ||
| A01 | Written decision to grant a patent or to grant a registration (utility model) |
Free format text: JAPANESE INTERMEDIATE CODE: A01 Effective date: 20200317 |
|
| A61 | First payment of annual fees (during grant procedure) |
Free format text: JAPANESE INTERMEDIATE CODE: A61 Effective date: 20200415 |
|
| R150 | Certificate of patent or registration of utility model |
Ref document number: 6692809 Country of ref document: JP Free format text: JAPANESE INTERMEDIATE CODE: R150 |
|
| S531 | Written request for registration of change of domicile |
Free format text: JAPANESE INTERMEDIATE CODE: R313531 |
|
| S533 | Written request for registration of change of name |
Free format text: JAPANESE INTERMEDIATE CODE: R313533 |
|
| R350 | Written notification of registration of transfer |
Free format text: JAPANESE INTERMEDIATE CODE: R350 |
|
| R250 | Receipt of annual fees |
Free format text: JAPANESE INTERMEDIATE CODE: R250 |
|
| R250 | Receipt of annual fees |
Free format text: JAPANESE INTERMEDIATE CODE: R250 |