JP6175637B2 - Power estimation support program, power estimation support device, and power estimation support method - Google Patents
Power estimation support program, power estimation support device, and power estimation support method Download PDFInfo
- Publication number
- JP6175637B2 JP6175637B2 JP2012211579A JP2012211579A JP6175637B2 JP 6175637 B2 JP6175637 B2 JP 6175637B2 JP 2012211579 A JP2012211579 A JP 2012211579A JP 2012211579 A JP2012211579 A JP 2012211579A JP 6175637 B2 JP6175637 B2 JP 6175637B2
- Authority
- JP
- Japan
- Prior art keywords
- power
- partial circuit
- circuit
- power estimation
- flow rate
- Prior art date
- Legal status (The legal status is an assumption and is not a legal conclusion. Google has not performed a legal analysis and makes no representation as to the accuracy of the status listed.)
- Expired - Fee Related
Links
Images


Description
本発明は、電力見積支援プログラム、電力見積支援装置および電力見積支援方法に関する。 The present invention relates to a power estimation support program, a power estimation support apparatus, and a power estimation support method.
従来、ESL(Electronic System Level)で回路の電力を見積もりたいという要望がある。ESLは、RTL(Register Transfer Level)よりも抽象度が高い上位の概念である。ESLでは、例えば、機能ブロックとメモリとバスとが定義され、機能ブロック間や機能ブロック/メモリ間のデータの流れなどが記述される。 Conventionally, there is a demand for estimating the power of a circuit by ESL (Electronic System Level). ESL is a high-level concept having a higher level of abstraction than RTL (Register Transfer Level). In the ESL, for example, a functional block, a memory, and a bus are defined, and a data flow between functional blocks or between functional blocks / memory is described.
関連する先行技術としては、例えば、大規模な回路に対して電力の消費傾向を解析するものがある。具体的には、例えば、電力見積装置は、各回路範囲における単位時間当たりの信号の変化回数の平均値を取得して、回路範囲ごとの電力係数を算出し、または、単位時間当たりの信号の変化回数の平均値が1の場合の回路範囲ごとの電力係数を算出する。つぎに、電力見積装置は、回路範囲において指定された観測ポイントの信号の単位時間当たりの変化回数の平均値に対する、回路範囲に含まれる各信号線の信号の単位時間当たりの変化回数の平均値の比を補正係数として算出する。そして、電力見積装置は、回路範囲ごとの補正係数と電力係数をもとに、回路範囲ごとの電力値を算出する。 As a related prior art, for example, there is one that analyzes a power consumption tendency for a large-scale circuit. Specifically, for example, the power estimation device obtains an average value of the number of signal changes per unit time in each circuit range, calculates a power coefficient for each circuit range, or calculates the signal per unit time. The power coefficient for each circuit range when the average value of the number of changes is 1 is calculated. Next, the power estimation device calculates the average value of the number of changes per unit time of the signal of each signal line included in the circuit range with respect to the average value of the number of changes per unit time of the signal at the observation point specified in the circuit range. The ratio is calculated as a correction coefficient. The power estimation apparatus calculates a power value for each circuit range based on the correction coefficient and the power coefficient for each circuit range.
また、半導体集積回路の消費電力解析の時間を短縮するための技術がある。具体的には、例えば、消費電力解析装置は、設計回路情報を解析し、動作モードが共通の回路ブロックにおいて動作モードを規定する測定対象回路と、その特徴情報とを抽出する。つぎに、消費電力解析装置は、グループ分けポリシーに基づいて、抽出された測定対象回路をグループ分けする。そして、消費電力解析装置は、グループ分けされた測定グループごとに動作回数を測定し、測定結果に基づいて各測定対象回路の動作率を算出する。 There is also a technique for shortening the time required for power consumption analysis of a semiconductor integrated circuit. Specifically, for example, the power consumption analysis apparatus analyzes design circuit information and extracts a measurement target circuit that defines an operation mode in a circuit block having a common operation mode, and characteristic information thereof. Next, the power consumption analysis apparatus groups the extracted measurement target circuits based on the grouping policy. The power consumption analyzer measures the number of operations for each grouped measurement group, and calculates the operation rate of each measurement target circuit based on the measurement result.
しかしながら、従来技術では、ESLで回路の電力を見積もることが難しいという問題がある。例えば、回路の電力を見積もる際のプリミティブな電力モデルとなるのは、ゲートレベルのセルをモデル化したものとなる。ESLでは、例えば、機能ブロック間や機能ブロック/メモリ間のデータの流れなどが記述される程度であり、ゲートとのリレーションをとることが難しい。 However, the conventional technique has a problem that it is difficult to estimate the power of the circuit by ESL. For example, a primitive power model for estimating the power of a circuit is a model of a gate level cell. In ESL, for example, the flow of data between functional blocks or between functional blocks / memory is described, and it is difficult to establish a relationship with a gate.
一つの側面では、本発明は、回路の電力見積を支援することができる電力見積支援プログラム、電力見積支援装置および電力見積支援方法を提供することを目的とする。 In one aspect, an object of the present invention is to provide a power estimation support program, a power estimation support apparatus, and a power estimation support method that can support circuit power estimation.
本発明の一側面によれば、回路の消費電力を見積もるシミュレーションにより所定の期間単位に計測された前記回路内のバスを介して部分回路に入出力されるデータ量と前記部分回路における単位時間当たりの信号の変化回数とを対応付けて表す計測結果を記憶部から読み出し、前記計測結果に基づいて、前記データ量を独立変数とし、前記変化回数を従属変数として回帰分析を行うことにより、前記データ量から前記変化回数を求めるトグルレート推定関数を作成する電力見積支援プログラム、電力見積支援装置および電力見積支援方法が提案される。 According to one aspect of the present invention, the amount of data input to and output from a partial circuit via a bus in the circuit measured by a simulation for estimating the power consumption of the circuit and a unit time in the partial circuit. A measurement result representing the number of signal changes in association with each other is read from the storage unit, and based on the measurement result, the data amount is set as an independent variable, and regression analysis is performed using the change number as a dependent variable. A power estimation support program, a power estimation support apparatus, and a power estimation support method for creating a toggle rate estimation function for obtaining the number of changes from a quantity are proposed.
本発明の一態様によれば、回路の電力見積を支援することができる。 According to one embodiment of the present invention, circuit power estimation can be supported.
以下に添付図面を参照して、本発明にかかる電力見積支援プログラム、電力見積支援装置および電力見積支援方法の実施の形態を詳細に説明する。 Exemplary embodiments of a power estimation support program, a power estimation support apparatus, and a power estimation support method according to the present invention will be described below in detail with reference to the accompanying drawings.
(電力見積支援方法の一実施例)
図1は、実施の形態にかかる電力見積支援方法の一実施例を示す説明図である。図1において、電力見積支援装置101は、回路の消費電力の見積もりを支援するコンピュータである。消費電力の見積対象となる回路は、例えば、LSI(Large Scale Integrated circuit)などの半導体集積回路である。
(One example of power estimation support method)
FIG. 1 is an explanatory diagram of an example of a power estimation support method according to the embodiment. In FIG. 1, a power
ここで、回路の消費電力を見積もる際のプリミティブな電力モデルとなるのは、例えば、ゲートレベルのセルをモデル化したものとなる。RTLの設計データは論理合成することによりゲートレベルの設計データに落とし込むことができる。このため、RTLの設計データから回路の消費電力を見積もることは比較的容易に行うことができる。 Here, the primitive power model for estimating the power consumption of the circuit is, for example, a model of a gate level cell. RTL design data can be dropped into gate level design data by logical synthesis. Therefore, it is relatively easy to estimate the power consumption of the circuit from the RTL design data.
これに対して、RTLよりも抽象度が高いESLの設計データでは、例えば、機能ブロック間や機能ブロック/メモリ間のデータの流れなどが記述されている程度であり、ゲートとのリレーションをとることが難しい。また、ESLの設計データからRTLの設計データに落とし込むことが難しい場合がある。 On the other hand, ESL design data with a higher abstraction level than RTL, for example, describes the flow of data between functional blocks or between functional blocks / memory, and has relations with gates. Is difficult. Also, it may be difficult to drop ESL design data into RTL design data.
そこで、本実施の形態では、電力見積支援装置101は、回路内のバスを介して部分回路に入出力されるデータ量(バス流量)と部分回路のトグルレートに相関があると仮定し、部分回路へのバス流量からトグルレートを推定するモデル式を作成する。これにより、部分回路へのバス流量程度の情報しか得られないESLでの電力見積を可能にする。以下、電力見積支援装置101の電力見積支援処理の一実施例について説明する。
Therefore, in this embodiment, the power
(1)電力見積支援装置101は、ある回路の消費電力を見積もる電力見積シミュレーションの計測結果を取得する。ここで、計測結果は、例えば、回路内の部分回路について、シミュレーション中に所定の期間単位で計測されたバス流量とトグルレートとを対応付けて表す情報である。
(1) The power
また、部分回路は、例えば、複数のセルと信号線を含む回路ブロックである。セルは、例えば、NOTゲート、ANDゲート、バッファ、INV(インバータ)、FF(フリップフロップ)などの回路素子である。具体的には、例えば、部分回路は、LSIなどの半導体集積回路を形成するための部分的な回路情報として利用されるIP(Intellectual Property)であり、機能ブロック単位で再利用可能な形でまとめた設計資産である。 The partial circuit is a circuit block including a plurality of cells and signal lines, for example. The cell is a circuit element such as a NOT gate, an AND gate, a buffer, INV (inverter), and FF (flip-flop). Specifically, for example, the partial circuit is an IP (Intellectual Property) used as partial circuit information for forming a semiconductor integrated circuit such as an LSI, and is summarized in a form that can be reused in units of functional blocks. Design assets.
また、バス流量は、単位時間当たりの回路内のバスを介して部分回路に入出力されるデータ量である。バス流量の単位は、例えば、[byte/sec]であってもよく、[bit/sec]であってもよい。また、回路内のバス幅が固定の場合は、サイクル数/secをバス流量の単位として用いることにしてもよい。また、シミュレーション中のある期間のデータ量を取得する場合で期間が固定であれば、この期間を単位時間とみなして単にデータ量を流量と同一視する場合もある。この場合、バス流量の単位は、[byte]であっても[bit]であってもサイクル数であってもよい。なお、以下の説明では、バス流量を単に「流量」と表記する場合がある。 The bus flow rate is the amount of data input / output to / from the partial circuit via the bus in the circuit per unit time. The unit of the bus flow rate may be, for example, [byte / sec] or [bit / sec]. When the bus width in the circuit is fixed, the number of cycles / sec may be used as a unit of bus flow rate. Further, when the data amount of a certain period during simulation is acquired and the period is fixed, the period may be regarded as a unit time and the data amount may be simply identified with the flow rate. In this case, the unit of the bus flow rate may be [byte], [bit], or the number of cycles. In the following description, the bus flow rate may be simply expressed as “flow rate”.
また、トグルレートは、部分回路における単位時間当たりの信号の変化回数を表すものである。具体的には、例えば、トグルレートは、部分回路内の各セルのトグルレートの平均値(平均トグルレート)、すなわち、各セルにおける単位時間当たりの信号の変化回数の平均値を表すものであってもよい。 The toggle rate represents the number of signal changes per unit time in the partial circuit. Specifically, for example, the toggle rate represents the average value of the toggle rate of each cell in the partial circuit (average toggle rate), that is, the average value of the number of signal changes per unit time in each cell. May be.
図1の例では、回路内の部分回路Xについて、シミュレーション中の期間(例えば、期間T1)ごとに計測された、バス流量(例えば、バス流量x1)とトグルレート(例えば、トグルレートy1)とを対応付けて表す計測結果110が取得されている。
In the example of FIG. 1, for the partial circuit X in the circuit, the bus flow rate (for example, bus flow rate x1) and the toggle rate (for example, toggle rate y1) measured for each period (for example, the period T1) during simulation. The
(2)電力見積支援装置101は、取得した計測結果に基づいて、部分回路のバス流量から部分回路のトグルレートを求めるトグルレート推定関数を作成する。具体的には、例えば、電力見積支援装置101は、計測結果110に基づいて、バス流量を独立変数とし、トグルレートを従属変数として回帰分析を行うことにより、バス流量からトグルレートを求めるトグルレート推定関数を作成する。
(2) The power
ここで、セルの電力係数PCは、下記式(1)を用いて表現することができる。電力係数PCは、例えば、信号の1変化当たりに消費されるセルの電力を表すものである。ただし、Cは、セルの静電容量[pF]である。Vは、セルの電圧[V]である。 Here, the power coefficient PC of the cell can be expressed using the following equation (1). The power coefficient PC represents, for example, the power of a cell consumed per signal change. Where C is the capacitance [pF] of the cell. V is the cell voltage [V].
PC=(1/2)*C*V2 ・・・(1) PC = (1/2) * C * V 2 (1)
また、n個のセルを含む回路の電力は、例えば、下記式(2)を用いて表現することができる。ただし、PCmは、n個のセルのm番目のセルの電力係数PCである。TRmは、n個のセルのm番目のセルのトグルレートTR[toggle/ns]である。 In addition, the power of a circuit including n cells can be expressed using, for example, the following formula (2). Here, PC m is the power coefficient PC of the m-th cell of n cells. TR m is the toggle rate TR [toggle / ns] of the m-th cell of n cells.

また、セルの電力係数PCのばらつきが小さいと仮定すると、n個のセルを含む回路の電力は、例えば、下記式(3)を用いて表現することができる。 Further, assuming that the variation of the cell power coefficient PC is small, the power of a circuit including n cells can be expressed using, for example, the following equation (3).
また、バス流量と平均トグルレートとの間に強い相関があると仮定すると、部分回路(IP)の平均トグルレートは、例えば、下記式(4)を用いて表現することができる。 Further, assuming that there is a strong correlation between the bus flow rate and the average toggle rate, the average toggle rate of the partial circuit (IP) can be expressed using, for example, the following equation (4).
すなわち、電力見積支援装置101は、計測結果110から特定される期間ごとのバス流量とトグルレート(平均トグルレート)とを上記式(4)に代入して回帰分析を行うことにより、部分回路Xのトグルレート推定関数を作成することができる。より具体的には、例えば、電力見積支援装置101は、最小二乗法により、上記式(4)の係数CoeffX,CoffCを求めることにより、部分回路Xのトグルレート推定関数を作成する。
In other words, the power
(3)電力見積支援装置101は、作成したトグルレート推定関数を部分回路と関連付けて出力する。具体的には、例えば、電力見積支援装置101は、作成した部分回路Xのトグルレート推定関数を、部分回路Xの識別情報(例えば、部分回路XのIP名)と関連付けてライブラリ120に登録することにしてもよい。
(3) The power
このように、電力見積支援装置101によれば、部分回路へのバス流量とトグルレートに相関があると仮定して、バス流量から部分回路のトグルレートを推定するトグルレート推定関数(モデル式)を作成することができる。これにより、消費電力の見積対象となる回路内部の詳細は決まっていなくとも、既存IPと同一品種の部分回路(例えば、既存IPと同一の機能を実現する部分回路)のトグルレートをバス流量から推定することができる。
As described above, according to the power
また、電力見積支援装置101によれば、例えば、部分回路へのバス流量から推定されるトグルレートを上記式(3)に代入することにより、部分回路の電力を求めることができ、ESLでの電力見積を行うことができるようになる。なお、部分回路の電力係数(セルの電力係数の平均値にセル数nを掛けた値、すなわち、セルの電力係数の合計値)としては、例えば、既存技術により得られる部分回路と同一品種の既存IPの電力係数を用いることができる。
Further, according to the power
また、電力見積支援装置101によれば、部分回路の識別情報(例えば、IP名)と関連付けてトグルレート推定関数をライブラリ120に登録することができる。これにより、バス流量から部分回路のトグルレートを推定するモデル式を電力ライブラリとして提供することができる。
Further, according to the power
(電力見積支援装置101のハードウェア構成例)
図2は、電力見積支援装置101のハードウェア構成例を示すブロック図である。図2において、電力見積支援装置101は、CPU(Central Processing Unit)201と、ROM(Read‐Only Memory)202と、RAM(Random Access Memory)203と、磁気ディスクドライブ204と、磁気ディスク205と、光ディスクドライブ206と、光ディスク207と、I/F(Interface)208と、ディスプレイ209と、キーボード210と、マウス211とを有している。また、各構成部はバス200によってそれぞれ接続されている。
(Example of hardware configuration of power estimation support apparatus 101)
FIG. 2 is a block diagram illustrating a hardware configuration example of the power
ここで、CPU201は、電力見積支援装置101の全体の制御を司る。ROM202は、ブートプログラムなどのプログラムを記憶している。RAM203は、CPU201のワークエリアとして使用される。磁気ディスクドライブ204は、CPU201の制御にしたがって磁気ディスク205に対するデータのリード/ライトを制御する。磁気ディスク205は、磁気ディスクドライブ204の制御で書き込まれたデータを記憶する。
Here, the
光ディスクドライブ206は、CPU201の制御にしたがって光ディスク207に対するデータのリード/ライトを制御する。光ディスク207は、光ディスクドライブ206の制御で書き込まれたデータを記憶したり、光ディスク207に記憶されたデータをコンピュータに読み取らせたりする。
The
I/F208は、通信回線を通じてLAN(Local Area Network)、WAN(Wide Area Network)、インターネットなどのネットワーク212に接続され、ネットワーク212を介して他の装置に接続される。そして、I/F208は、ネットワーク212と内部のインターフェースを司り、外部装置からのデータの入出力を制御する。I/F208には、例えば、モデムやLANアダプタなどを採用することができる。
The I /
ディスプレイ209は、カーソル、アイコンあるいはツールボックスをはじめ、文書、画像、機能情報などのデータを表示する。このディスプレイ209は、例えば、CRT、TFT液晶ディスプレイ、プラズマディスプレイなどを採用することができる。
A
キーボード210は、文字、数字、各種指示などの入力のためのキーを備え、データの入力を行う。また、タッチパネル式の入力パッドやテンキーなどであってもよい。マウス211は、カーソルの移動や範囲選択、あるいはウィンドウの移動やサイズの変更などを行う。なお、電力見積支援装置101は、上述した構成部のうち、例えば、光ディスクドライブ206、光ディスク207、ディスプレイ209、キーボード210およびマウス211を有さないことにしてもよい。
The
(計測結果データの具体例)
つぎに、ある部分回路IPを含む回路の消費電力を見積もる電力見積シミュレーションの計測結果データの具体例について説明する。
(Specific example of measurement result data)
Next, a specific example of measurement result data of a power estimation simulation for estimating the power consumption of a circuit including a certain partial circuit IP will be described.
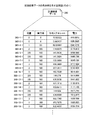
図3Aおよび図3Bは、計測結果データの具体例を示す説明図である。図3Aおよび図3Bにおいて、計測結果データ300は、回路内の部分回路IPについて、シミュレーション中に所定の期間(Interval)単位で計測された、流量と実行率と平均トグルレートと電力とを対応付けて表す計測結果300−1〜300−38を含む情報である。
3A and 3B are explanatory diagrams showing specific examples of measurement result data. In FIG. 3A and FIG. 3B, the
ここで、流量は、シミュレーション中の所定の期間単位(例えば、1サイクル)に計測された回路内のバスを介して部分回路IPに入出力されたデータ量である。実行率は、所定の期間において部分回路IPが、例えば、回路内のプロセッサから要求された処理を実行可能となってから処理の実行が完了するまでの状態である期間の割合である。平均トグルレートは、部分回路IP内の各セルにおける単位時間当たりの信号の変化回数の平均値である。電力は、所定の期間に部分回路IPで消費される電力の見積結果である。 Here, the flow rate is the amount of data input / output to / from the partial circuit IP via the bus in the circuit measured in a predetermined period unit (for example, one cycle) during the simulation. The execution rate is a ratio of a period in which the partial circuit IP is in a state from when the partial circuit IP can execute the process requested by the processor in the circuit until the execution of the process is completed. The average toggle rate is an average value of the number of signal changes per unit time in each cell in the partial circuit IP. The power is an estimation result of power consumed by the partial circuit IP in a predetermined period.
なお、計測結果データ300は、例えば、図1に示した計測結果110に対応する。具体的には、計測結果データ300の流量は、計測結果110のバス流量に対応し、計測結果データ300の平均トグルレートは、計測結果110のトグルレートに対応している。
The
(電力見積支援装置101の機能的構成例)
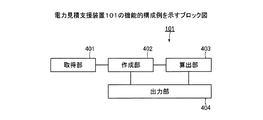
図4は、電力見積支援装置101の機能的構成例を示すブロック図である。図4において、電力見積支援装置101は、取得部401と、作成部402と、算出部403と、出力部404と、を含む。取得部401〜出力部404は制御部となる機能であり、具体的には、例えば、図2に示したROM202、RAM203、磁気ディスク205、光ディスク207などの記憶装置に記憶されたプログラムをCPU201に実行させることにより、または、I/F208により、その機能を実現する。各機能部の処理結果は、例えば、RAM203、磁気ディスク205、光ディスク207などの記憶装置に記憶される。
(Functional configuration example of power estimation support apparatus 101)
FIG. 4 is a block diagram illustrating a functional configuration example of the power
取得部401は、部分回路IPを含む回路の消費電力を見積もるシミュレーションの計測結果データを取得する機能を有する。具体的には、例えば、取得部401は、図2に示したキーボード210やマウス211を用いたユーザの操作入力により、入力された計測結果データ300(図3参照)をRAM203等の記憶装置から読み出すことにしてもよい。
The
また、取得部401は、例えば、回路の消費電力を見積もる電力見積シミュレーションを行うことにより、計測結果データ300を取得することにしてもよい。なお、電力見積支援装置101は、例えば、部分回路IPを含む回路のゲートレベルの設計データ(例えば、ネットリスト)に基づいて、電力見積シミュレーションを実行することができる。
In addition, the
作成部402は、取得された計測結果データに基づいて、部分回路IPの流量を独立変数とし、部分回路IPの平均トグルレートを従属変数として回帰分析を行うことにより、流量から平均トグルレートを求めるトグルレート推定関数を作成する機能を有する。
The
具体的には、例えば、まず、作成部402は、上記式(4)を回帰式に設定する。つぎに、作成部402は、例えば、計測結果データ300に基づいて、最小二乗法により、独立変数の測定値と、従属変数の測定値および回帰式を用いて求めた独立変数の推定値との差の2乗平均が最小になるように、係数CoeffX,CoffCを求める。これにより、流量から平均トグルレートを求めるトグルレート推定関数を作成することができる。
Specifically, for example, first, the
また、作成部402は、計測結果データに基づいて、部分回路IPの流量と実行率とを独立変数とし、部分回路IPの平均トグルレートを従属変数として重回帰分析を行うことにより、流量から平均トグルレートを求めるトグルレート推定関数を作成してもよい。実行率は、シミュレーション中の所定の期間において部分回路IPが、プロセッサから要求された処理を実行可能となってから処理の実行が完了するまでの状態(実行状態)である期間の割合である。
Further, the
具体的には、例えば、まず、作成部402は、下記式(5)を回帰式に設定する。ただし、RunRaticは、部分回路IPの実行率である。また、CoeffYは、係数である。
Specifically, for example, first, the
つぎに、作成部402は、例えば、計測結果データ300に基づいて、最小二乗法により、独立変数の測定値と、従属変数の測定値および回帰式を用いて求めた独立変数の推定値との差の2乗平均が最小になるように、係数CoeffX,CoeffY,CoffCを求める。これにより、流量と実行率から平均トグルレートを求めるトグルレート推定関数を作成することができる。
Next, the
より具体的には、例えば、作成部402は、計測結果データ300に基づいて、部分回路IPの流量と実行率を独立変数とし、部分回路IPの平均トグルレートを従属変数として重回帰分析を行うことにより、下記式(6)のトグルレート推定関数を作成することができる。
More specifically, for example, based on the
また、作成部402は、作成した部分回路IPのトグルレート推定関数と、信号の1変化当たりに消費される部分回路IPの電力値とを用いて、部分回路IPの電力(消費電力)を求める電力推定関数を作成する機能を有する。
Further, the
例えば、トグルレート推定関数が、部分回路IPの流量のみをパラメータとする関数の場合は、作成部402は、流量から部分回路IPの電力を求める電力推定関数を作成する。また、トグルレート推定関数が、部分回路IPの流量と実行率とをパラメータとする関数の場合は、作成部402は、流量と実行率とから部分回路IPの電力を求める電力推定関数を作成する。
For example, when the toggle rate estimation function is a function using only the flow rate of the partial circuit IP as a parameter, the
ここで、信号の1変化当たりに消費される部分回路IPの電力値は、部分回路IP内のセル数nとセルの電力係数PCの平均値とを掛け合わせた値、すなわち、部分回路IP内の全セルの電力係数の合計値である(ただし、セルの電力係数PCのばらつきが小さいと仮定する。)。以下説明のため、信号の1変化当たりに消費される部分回路IPの電力値を「電力値(n*PC)」と表記する場合がある。 Here, the power value of the partial circuit IP consumed per change of the signal is a value obtained by multiplying the number n of cells in the partial circuit IP and the average value of the power coefficient PC of the cell, that is, in the partial circuit IP. (It is assumed that the variation of the power coefficient PC of the cell is small). For the sake of explanation, the power value of the partial circuit IP consumed per signal change may be expressed as “power value (n * PC)”.
なお、電力見積支援装置101は、例えば、既存の電力見積ツールを用いて、1トグルレート時の部分回路IPの電力を見積もることにより、部分回路IPの電力値(n*PC)を得ることができる。また、電力見積支援装置101は、例えば、計測結果データ300に基づいて、部分回路IPの電力の平均値を平均トグルレートの平均値で除算することにより、部分回路IPの電力値(n*PC)を求めることにしてもよい。
The power
具体的には、例えば、作成部402は、作成した部分回路IPのトグルレート推定関数と部分回路IPの電力値(n*PC)とを上記式(3)に代入することにより、流量から部分回路IPの電力を求める電力推定関数を作成する。これにより、部分回路IPの流量から部分回路IPの電力を求める電力推定関数を作成することができる。
Specifically, for example, the
より具体的には、例えば、作成部402は、上記式(6)のトグルレート推定関数と部分回路IPの電力値(n*PC)とを上記式(3)に代入することにより、下記式(7)の電力推定関数を作成することができる。ただし、部分回路IPの電力値(n*PC)を「10.4」とする。
More specifically, for example, the
算出部403は、作成された部分回路IPの電力推定関数を用いて、電力見積対象となる回路内の部分回路IPの見積消費電力を算出する機能を有する。例えば、電力推定関数が、部分回路IPの流量のみをパラメータとする関数の場合を想定する。この場合、算出部403は、回路内のバスを介して部分回路IPに入出力されるデータ量(流量)を電力推定関数に代入することにより、部分回路IPの見積消費電力を算出する。
The
また、電力推定関数が、部分回路IPの流量と実行率とをパラメータとする関数の場合を想定する。この場合、算出部403は、所定期間における回路内のバスを介して部分回路IPに入出力されるデータ量と部分回路IPの実行率とを電力推定関数に代入することにより、所定期間における部分回路IPの見積消費電力を算出する。
Further, it is assumed that the power estimation function is a function using the flow rate and execution rate of the partial circuit IP as parameters. In this case, the
なお、電力推定関数に代入される回路内のバスを介して部分回路IPに入出力されるデータ量や部分回路IPの実行率は、例えば、ユーザの操作入力により、電力見積支援装置101に直接入力されることにしてもよい。また、電力見積支援装置101は、電力見積対象となるアーキテクチャシミュレーションモデルのシミュレーションを行うことにより、部分回路IPにバスを介して入出力されるデータ量や部分回路IPの実行率を取得することにしてもよい。
Note that the amount of data input to and output from the partial circuit IP via the bus in the circuit substituted for the power estimation function and the execution rate of the partial circuit IP are directly input to the power
出力部404は、作成されたトグルレート推定関数を部分回路IPと関連付けて出力する機能を有する。具体的には、例えば、出力部404は、部分回路IPのトグルレート推定関数を、部分回路IPのIP名と関連付けてライブラリ120(図1参照)に登録することにしてもよい。なお、ライブラリ120は、例えば、RAM203、磁気ディスク205、光ディスク207などの記憶装置により実現される。
The
これにより、バス流量や実行率から部分回路IPのトグルレートを推定するモデル式(トグルレート推定関数)を電力ライブラリとして提供することができる。 Thereby, a model formula (toggle rate estimation function) for estimating the toggle rate of the partial circuit IP from the bus flow rate and the execution rate can be provided as a power library.
また、出力部404は、作成された電力推定関数を部分回路IPと関連付けて出力することにしてもよい。具体的には、例えば、出力部404は、部分回路IPの電力推定関数を、部分回路IPのIP名と関連付けてライブラリ120に登録することにしてもよい。
The
これにより、バス流量や実行率から部分回路IPの電力を推定するモデル式(電力推定関数)を電力ライブラリとして提供することができる。 Thereby, a model formula (power estimation function) for estimating the power of the partial circuit IP from the bus flow rate and the execution rate can be provided as a power library.
また、出力部404は、算出された部分回路IPの見積消費電力を出力することにしてもよい。出力部404の出力形式としては、例えば、RAM203、磁気ディスク205、光ディスク207などの記憶領域への記憶、ディスプレイ209への表示、不図示のプリンタへの印刷出力、I/F208による外部装置への送信などがある。
The
また、算出部403は、例えば、電力見積対象となる回路内の部分回路IPごとの見積消費電力を累積することにより、電力見積対象となる回路の見積消費電力を算出することにしてもよい。この場合、出力部404は、算出された電力見積対象となる回路の見積消費電力を出力することにしてもよい。
Further, the
(平均トグルレートの推定例)
つぎに、作成部402によって作成されたトグルレート推定関数を用いて推定される部分回路IPの平均トグルレートの推定例について説明する。
(Example of average toggle rate estimation)
Next, an example of estimating the average toggle rate of the partial circuit IP estimated using the toggle rate estimation function created by the
図5は、平均トグルレートの計測結果と推定結果とを表す説明図である。図5において、グラフ501は、計測結果データ300の流量と実行率とを上記式(6)に代入することにより推定された部分回路IPの平均トグルレートの時系列変化を表している。また、グラフ502は、計測結果データ300の平均トグルレートの時系列変化を表している。
FIG. 5 is an explanatory diagram showing a measurement result and an estimation result of the average toggle rate. In FIG. 5, a
グラフ501,502によれば、部分回路IPの平均トグルレートの計測結果と推定結果とが同じような時系列変化をしていることが分かる。
According to the
(電力の推定例)
つぎに、作成部402によって作成された電力推定関数を用いて推定される部分回路IPの電力の推定例について説明する。
(Example of power estimation)
Next, an example of estimating the power of the partial circuit IP estimated using the power estimation function created by the
図6は、電力の計測結果と推定結果とを表す説明図である。図6において、グラフ601は、計測結果データ300の流量と実行率とを上記式(7)に代入することにより推定された部分回路IPの電力の時系列変化を表している。また、グラフ602は、計測結果データ300の電力の時系列変化を表している。
FIG. 6 is an explanatory diagram showing the power measurement result and the estimation result. In FIG. 6, a
グラフ601,602によれば、部分回路IPの電力(消費電力)の計測結果と推定結果とが同じような時系列変化をしていることが分かる。
According to the
(電力見積支援装置101の電力見積支援処理手順)
つぎに、電力見積支援装置101の電力見積支援処理手順について説明する。
(Power estimation support processing procedure of power estimation support apparatus 101)
Next, the power estimation support processing procedure of the power
図7は、電力見積支援装置101の電力見積支援処理手順の一例を示すフローチャートである。図7のフローチャートにおいて、まず、電力見積支援装置101は、部分回路IPを含む回路の消費電力を見積もるシミュレーションの計測結果データを取得したか否かを判断する(ステップS701)。計測結果データは、例えば、図3に示した計測結果データ300である。
FIG. 7 is a flowchart illustrating an example of the power estimation support processing procedure of the power
ここで、電力見積支援装置101は、計測結果データを取得するのを待つ(ステップS701:No)。そして、電力見積支援装置101は、計測結果データを取得した場合(ステップS701:Yes)、部分回路IPの平均トグルレートを表す従属変数を独立変数で計算する回帰式を設定する(ステップS702)。
Here, the power
回帰式は、例えば、上記式(4)や上記式(5)などである。回帰式は、例えば、ROM202等の記憶装置に記憶されている。また、設定される回帰式は予め決められていてもよく、ステップS702において、電力見積支援装置101が、ユーザの操作入力により、設定される回帰式の選択を受け付けることにしてもよい。
The regression equation is, for example, the above equation (4) or the above equation (5). The regression equation is stored in a storage device such as the
つぎに、電力見積支援装置101は、取得した計測結果データに基づいて、最小二乗法により、設定した回帰式に含まれる係数の値を算出する(ステップS703)。そして、電力見積支援装置101は、算出した係数の値を回帰式に代入することにより、部分回路IPのトグルレート推定関数を作成する(ステップS704)。
Next, the power
つぎに、電力見積支援装置101は、取得した計測結果データに基づいて、1トグルレート時の部分回路IPの電力値を算出する(ステップS705)。そして、電力見積支援装置101は、作成した部分回路IPのトグルレート推定関数と1トグルレート時の部分回路IPの電力値とを上記式(3)に代入することにより、部分回路IPの電力推定関数を作成する(ステップS706)。
Next, the power
つぎに、電力見積支援装置101は、作成した部分回路IPのトグルレート推定関数と電力推定関数とを、部分回路IPのIP名と関連付けてライブラリ120に登録して(ステップS707)、本フローチャートによる一連の処理を終了する。
Next, the power
以上説明したように、実施の形態にかかる電力見積支援装置101によれば、部分回路IPへのバス流量とトグルレートに相関があると仮定して、バス流量から部分回路IPのトグルレートを推定するトグルレート推定関数を作成することができる。具体的には、例えば、電力見積支援装置101によれば、部分回路IPを含む回路の電力見積シミュレーションの計測結果データに基づいて、上記式(4)を用いた回帰分析を行うことにより、トグルレート推定関数を作成することができる。
As described above, according to the power
また、電力見積支援装置101によれば、部分回路IPへのバス流量および実行率とトグルレートとに相関があると仮定して、バス流量および実行率から部分回路IPのトグルレートを推定するトグルレート推定関数を作成することができる。具体的には、例えば、電力見積支援装置101によれば、部分回路IPを含む回路の電力見積シミュレーションの計測結果データに基づいて、上記式(5)を用いた回帰分析を行うことにより、トグルレート推定関数を作成することができる。
Further, according to the power
これにより、消費電力の見積対象となる回路内部の詳細は決まっていなくとも、既存IPと同一品種の部分回路IPのトグルレートを、バス流量や実行率から推定することができる。 As a result, the toggle rate of the partial circuit IP of the same type as the existing IP can be estimated from the bus flow rate and the execution rate, even if the details of the circuit to be estimated for power consumption are not determined.
また、電力見積支援装置101によれば、部分回路IPのトグルレート推定関数と、1平均トグルレート当たりの部分回路IPの電力値とを用いて、部分回路IPの電力を推定する電力推定関数を作成することができる。これにより、消費電力の見積対象となる回路内部の詳細は決まっていなくとも、既存IPと同一品種の部分回路IPの電力を、バス流量や実行率から推定することができる。
Further, according to the power
また、電力見積支援装置101によれば、部分回路IPの識別情報(例えば、IP名)と関連付けてトグルレート推定関数をライブラリ120に登録することができる。これにより、バス流量や実行率から部分回路IPのトグルレートを推定するモデル式を電力ライブラリとして提供することができる。また、ステップ707を利用時に行うとし、ステップ707の計算に必要なデータをライブラリに記載するとしてもよい。このようにすると1トグル当たりの電力値を利用時に補正をかけたのち、ステップ707を実行して電力推定関数を利用することが可能になる。このようにすることで電力ライブラリ作成時のテクノロジーライブラリと電力見積時のテクノロジーライブラリの相違を考慮した電力見積が可能となる。
Further, according to the power
また、電力見積支援装置101によれば、部分回路IPの識別情報(例えば、IP名)と関連付けて電力推定関数をライブラリ120に登録することができる。これにより、バス流量や実行率から部分回路IPの電力を推定するモデル式を電力ライブラリとして提供することができる。
Further, according to the power
なお、上述した説明では、部分回路IPの実行状態が一つの場合について説明したが、これに限らない。例えば、部分回路IPの実行状態が複数存在する場合、電力見積支援装置101は、各々の実行状態について所定の期間単位の実行率を取得し、各々の実行率を独立変数とする回帰分析を行うことにより、トグルレート推定関数を作成することにしてもよい。また、実行状態ごとのバス流量を独立変数にするとしてもよい。
In the above description, the case where the execution state of the partial circuit IP is one has been described. However, the present invention is not limited to this. For example, when there are a plurality of execution states of the partial circuit IP, the power
(実施例)
以下、実施例について説明する。まず、電力要素の分類について説明する。本実施例では、FFクロック部、クロックツリー部、非クロックツリー部およびRAM/ROM部の4つの属性(電力要素)で回路を分割して電力見積を行う場合を想定する。
(Example)
Examples will be described below. First, classification of power elements will be described. In the present embodiment, it is assumed that power estimation is performed by dividing a circuit by four attributes (power elements) of an FF clock unit, a clock tree unit, a non-clock tree unit, and a RAM / ROM unit.
FFクロック部は、クロックツリーに含まれるFF(FFのクロック端子)の集合である。クロックツリー部は、クロックソースから辿ることができる出力端子を有する非FFのセルの集合である。なお、非FFとは、FFではないセルである。非クロックツリー部は、クロックツリーに含まれないセルの集合である。RAM/ROM部は、クロックツリーに接続されたRAMまたはROMである。 The FF clock unit is a set of FFs (FF clock terminals) included in the clock tree. The clock tree portion is a set of non-FF cells having output terminals that can be traced from a clock source. Note that a non-FF is a cell that is not an FF. The non-clock tree part is a set of cells not included in the clock tree. The RAM / ROM unit is a RAM or a ROM connected to a clock tree.
FFクロック部とクロックツリー部は、ユニットセルを対象としたクロックツリー関連の電力消費傾向に関係する電力要素である。FFは、クロックツリーの葉部分にクロックツリーの非FF要素の15倍程度の個数があり、CGIC(クロックゲーティングインテグレイティッドセル)によりよく止まるものもあれば、CGICがなくよく動くものもあり、設計によっても変化する可能性がある。 The FF clock part and the clock tree part are power elements related to the power consumption tendency related to the clock tree for the unit cell. FF has about 15 times the number of non-FF elements in the clock tree in the leaf part of the clock tree. May also change.
一方、クロックツリーは、ツリー構造になっており、葉の近くにCGICがあることが多い。また、幹の部分は、FF数よりもレイアウトマターで複雑さが決まる。これらのことから、FFクロック部とクロックツリー部は電力消費傾向が違う可能性がある。そこで、本実施例では、FFクロック部とクロックツリー部とを分けて扱う。 On the other hand, the clock tree has a tree structure, and there are many CGICs near the leaves. Further, the complexity of the trunk portion is determined by the layout matter rather than the FF number. For these reasons, there is a possibility that the power consumption tendency is different between the FF clock unit and the clock tree unit. Therefore, in this embodiment, the FF clock part and the clock tree part are handled separately.
非クロックツリー部は、第1の非クロックツリーと、第2の非クロックツリーと、第3の非クロックツリーとに分けられる。第1の非クロックツリーは、クロックツリーに接続されたFFの集合である。第2の非クロックツリーは、クロックツリーに非接続のFFの集合である。第3の非クロックツリーは、クロックツリーに非接続の非FFの集合である。本実施例では、これら第1、第2および第3の非クロックツリーを一つのグループ(非クロックツリー部)として扱う。 The non-clock tree part is divided into a first non-clock tree, a second non-clock tree, and a third non-clock tree. The first non-clock tree is a set of FFs connected to the clock tree. The second non-clock tree is a set of FFs not connected to the clock tree. The third non-clock tree is a set of non-FFs that are not connected to the clock tree. In the present embodiment, these first, second and third non-clock trees are handled as one group (non-clock tree portion).
RAM/ROM部については、まず、ユニットセル1セルとRAM/ROM1マクロとを比較すると1個当たりの消費電力の差が大きい。また、RAMの内外でクロックを止めることにより節電を行う場合が多く、RAMの制御に失敗すると節電効果のロスが大きくなる。また、回路内のRAM/ROMの個数は1000個程度と推測でき、ユニットセル(例えば、260万個)と比較すると少数である。これらのことから、本実施例では、RAM/ROMを1つのグループ(RAM/ROM部)として扱う。
Regarding the RAM / ROM portion, first, when the
(電力係数の抽象化)
つぎに、FFクロック部、クロックツリー部、非クロックツリー部およびRAM/ROM部の4つの属性(電力要素)で回路を分割した場合の電力係数の抽象化について説明する。なお、以下の説明では、「部分回路IP」を単に「IP」と表記する場合がある。また、プロセッサから要求された処理を実行可能となってから処理の実行が完了するまでのIPの状態を「Run状態」と表記し、Run状態以外のIPの状態を「Idle状態」と表記する場合がある。
(Power factor abstraction)
Next, abstraction of power coefficients when a circuit is divided by four attributes (power elements) of an FF clock unit, a clock tree unit, a non-clock tree unit, and a RAM / ROM unit will be described. In the following description, “partial circuit IP” may be simply expressed as “IP”. Further, the IP state from when the processing requested by the processor can be executed until the execution of the processing is completed is expressed as “Run state”, and the IP state other than the Run state is expressed as “Idle state”. There is a case.
図8は、クロックツリー部の一例を示す説明図である。図8において、ブロック800内部のクロックツリーの一例が示されている。図8の例では、部分クロックツリーA、部分クロックツリーB、部分クロックツリーでグルーピングされたグルーピング部の3個の部分回路がある。なお、部分クロックツリーは、クロックツリーのうちトグルレートが同じであることが保証されているセル群を含む部分である。
FIG. 8 is an explanatory diagram illustrating an example of the clock tree unit. In FIG. 8, an example of a clock tree inside the
グルーピングして見積もった結果はクロックツリーについては3個に分けたことに等しい。さらに、部分クロックツリーAは、常時ONのため、固定消費分(グラフ化すれば切片に含まれる要因)である。部分クロックツリーBは、手置きCGICで制御されているものの、手置きCGICがブロック全体の制御をしていると考えると、IPがRun/Idleのどちらの状態かで制御する程度で、大きな粒度での制御であると考えられる。 The result of grouping and estimation is equivalent to dividing the clock tree into three. Further, since the partial clock tree A is always ON, it is a fixed consumption (a factor included in the intercept if graphed). Although the partial clock tree B is controlled by the hand-held CGIC, when considering that the hand-held CGIC controls the entire block, the IP is controlled in either Run / Idle state, with a large granularity. It is thought that it is the control in.
したがって、Run状態のみをみた時には、部分クロックツリーBは、固定消費分になる。グルーピング部は、自動挿入CGICによる制御で、この部分は回路の動作に依存する部分である。しかし、グルーピングしても電力見積上、問題があまりない。したがって、Idle状態は別途見積って、Run状態の電力モデルを作るとすると、部分クロックツリーA、部分クロックツリーB、グルーピング部を分ける必要はないという考え方もできる。 Therefore, when only the Run state is viewed, the partial clock tree B has a fixed consumption. The grouping unit is controlled by automatic insertion CGIC, and this part depends on the operation of the circuit. However, there is not much problem in power estimation even when grouping. Therefore, if the Idle state is estimated separately and a Run state power model is created, it is possible to think that there is no need to separate the partial clock tree A, the partial clock tree B, and the grouping unit.
同様に、FFについては、まず、部分クロックツリーAにつながるFFは、クロックツリーAのトグルレートと同じである。また、部分クロックツリーBにつながるFFは、クロックツリーBのトグルレートと同じである。また、自動置きCGICにより制御されるFFは、グルーピング部の平均トグルレートを用いればよいといえる。 Similarly, for the FF, first, the FF connected to the partial clock tree A is the same as the toggle rate of the clock tree A. The FF connected to the partial clock tree B is the same as the toggle rate of the clock tree B. Moreover, it can be said that the FF controlled by the automatic placement CGIC may use the average toggle rate of the grouping unit.
したがって、クロックツリー部分と同様のことがいえて、部分クロックツリーAにつながるFFのクロック成分は固定消費的であり、部分クロックツリーBにつながるクロック部分はRun状態において固定消費的であると考えられる。また、グルーピングされた部分は、回路の動作に依存する部分であると考えられる。このため、グルーピングによってある程度の精度が出ていれば、クロックツリー、FFクロックに対して、ブロックに対して一つの電力係数にしてもよいと考えられる。 Therefore, it can be said that the clock tree portion is the same as the clock tree portion, the clock component of the FF connected to the partial clock tree A is fixed consumption, and the clock portion connected to the partial clock tree B is fixed consumption in the Run state. . Further, the grouped part is considered to be a part depending on the operation of the circuit. For this reason, if a certain degree of accuracy is obtained by the grouping, it is considered that one power coefficient may be used for the block with respect to the clock tree and the FF clock.
すなわち、自動置きCGICがドライブする部分は、バス流量と相関がある可能性がある部分であり、手置きCGIC部分は通例CPU(プロセッサ)からの設定値によりON/OFFが決まる部分であり、IPの状態値に依存すると考えられる部分である。CGICがない部分は固定的に電力を消費する固定値部分(切片部分)に相当する。つぎに、非クロックツリー部について説明する。 That is, the portion where the automatic placement CGIC is driven is a portion which may have a correlation with the bus flow rate, and the manual placement CGIC portion is usually a portion where ON / OFF is determined by a set value from the CPU (processor). This is the part that is considered to depend on the state value of. The portion without CGIC corresponds to a fixed value portion (intercept portion) that consumes power in a fixed manner. Next, the non-clock tree part will be described.
図9は、非クロックツリー部の一例を示す説明図である。図9において、非クロックツリー部900は、入力データの有無によって回路が動けるかどうかが決まる。非クロックツリー部900では、ループ回数などによりデータ取得間隔が伸び縮みするが、電力または性能が最も厳しくなる条件での測定を行うことが多い。
FIG. 9 is an explanatory diagram illustrating an example of a non-clock tree unit. In FIG. 9, the
このような厳しい条件下ではスループット、レイテンシともに一定値に近づくと仮定すると、バス流量と計算量は比例関係にあり、計算量とトグルレートは比例関係にあることから、バス流量とトグルレートは比例関係になると推測できる。 Assuming that throughput and latency are close to a constant value under such severe conditions, the bus flow rate and the calculation amount are proportional, and the calculation amount and the toggle rate are proportional. Therefore, the bus flow rate and the toggle rate are proportional. I can guess it will be a relationship.
なお、IPの電力値は、ループ回数などにより変化することがある。このため、例えば、動画処理のIPであれば、IPの電力値に対して「N番目の標準画像の実測値をベースにした電力値である」といった記述が付記されることにしてもよい。 Note that the IP power value may change depending on the number of loops. For this reason, for example, in the case of an IP for moving image processing, a description such as “the power value is based on the measured value of the Nth standard image” may be appended to the power value of the IP.
また、RAM/ROMは、1個のインスタンスに含まれる個数が少なく、アクセス回数が回路部分の動作に依存する回路である。このため、回路に記述されたようにアクセスすることが期待できることを考慮すると、RAM/ROM成分として一まとめにしてもある程度の見積精度がでると期待できる。 The RAM / ROM is a circuit in which the number contained in one instance is small and the number of accesses depends on the operation of the circuit portion. For this reason, in consideration of the fact that access can be expected as described in the circuit, it can be expected that a certain degree of estimation accuracy can be obtained as a RAM / ROM component.
(IPの状態を考慮した電力モデリング)
ここで、IPの状態(Run状態、Idle状態)を考慮した電力モデリングについて説明する。以下、1つのブロックを題材に説明する。このブロックを「ブロックA」と仮称する。なお、ここでは、エミュレーション電力見積のシミュレーション期間中のIPへのstart assert〜IPからのdone assertまでの期間をRun状態とし、それ以外の期間をIdle状態とする。
(Power modeling considering IP status)
Here, power modeling considering the IP state (Run state, Idle state) will be described. Hereinafter, one block will be described as a theme. This block is temporarily referred to as “block A”. Here, the period from the start assert to the IP to the done assert during the simulation period of the emulation power estimation is set to the Run state, and the other periods are set to the Idle state.
図10は、ブロックAの動作状況を示すガントチャートである。図10において、ガントチャート1000は、シミュレーション時刻の経過とともに変化するブロックAの動作状況(Run状態、Idle状態)を示している。なお、横軸は、シミュレーション時刻である。
FIG. 10 is a Gantt chart showing the operation status of the block A. In FIG. 10, a
図11は、ブロックAの状態データを示す説明図である。図11において、状態データ1100は、図10に示したガントチャート1000に対応するブロックAの詳細な動作状況を示している。状態データ1100によれば、ブロックAの動作状況は、ほぼ281[ms]以降はずっとRun状態であるといえる。
FIG. 11 is an explanatory diagram showing state data of the block A. In FIG. 11, the
図12および図13は、エミュレーション電力見積のシミュレーション結果を示す説明図である。図12において、グラフ1200は、シミュレーション時刻の経過とともに変化するクロックツリー部、FFクロック部およびRAM/ROM部の電力を示している。また、図13において、グラフ1300は、シミュレーション時刻の経過とともに変化する非クロックツリー部のFF入力端子のトグル回数を示している。
12 and 13 are explanatory diagrams showing simulation results of emulation power estimation. In FIG. 12, a
例えば、ガントチャート1000によれば、281[ms]〜2.5[s]までは、ほぼ100[%]Run状態となっている。これに対して、グラフ1200によれば、クロックツリー部、FFクロック部およびRAM/ROM部の電力の著しい増減が、無視できないほど長い時間で起きている。また、グラフ1300によれば、非クロックツリー部のトグル回数の著しい増減が、無視できないほど長い時間で起きている。すなわち、Run/Idle状態のみを考慮した電力モデリングでは、高精度な電力見積は難しい。
For example, according to the
(流量を考慮した電力モデリング)
つぎに、流量(バス流量)を考慮した電力モデリングについて説明する。IPの流量とIPの計算量との間は比例関係にあり、IPの計算量とIPの電力との間は比例関係にあると仮定すると、IPの流量とトグルレートとの間は比例関係にあると推測できる。以下、図14〜図21を用いて、流量を考慮した電力モデリングの実験結果について説明する。
(Power modeling considering flow rate)
Next, power modeling considering the flow rate (bus flow rate) will be described. Assuming that there is a proportional relationship between the IP flow rate and the IP calculation amount, and that there is a proportional relationship between the IP calculation amount and the IP power, there is a proportional relationship between the IP flow rate and the toggle rate. I can guess. Hereinafter, the experimental results of power modeling considering the flow rate will be described with reference to FIGS.
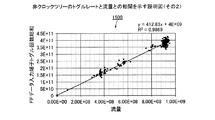
図14は、非クロックツリーのトグルレートと流量との相関を示す説明図(その1)である。図14において、グラフ1400は、FF入力データ端子のトグル回数と流量との時系列変化を表している。
FIG. 14 is an explanatory diagram (part 1) illustrating the correlation between the toggle rate of the non-clock tree and the flow rate. In FIG. 14, a
図15は、非クロックツリーのトグルレートと流量との相関を示す説明図(その2)である。図15において、図14に示したグラフ1400の各サンプルのFF入力データ端子のトグル回数と流量の散布図1500が示されている。散布図1500の決定係数は「0.98」であり、十分な相関が観測されているといえる。
FIG. 15 is an explanatory diagram (part 2) illustrating the correlation between the toggle rate of the non-clock tree and the flow rate. 15, a scatter diagram 1500 of the number of toggles of the FF input data terminal and the flow rate of each sample of the
なお、決定係数とは、独立変数(説明変数)が従属変数(被説明変数)のどれくらいを説明できるかを表す指標である。決定係数は、例えば、標本値から求めた回帰方程式のあてはまりのよさの尺度として利用される。決定係数は、例えば、xの変数の変化とyの変数の変化とがどれくらい似通っているかを表す(x、yは、例えば、流量)。 The determination coefficient is an index indicating how much an independent variable (explanatory variable) can explain a dependent variable (explained variable). The coefficient of determination is used as a measure of the goodness of fit of a regression equation obtained from a sample value, for example. The determination coefficient represents, for example, how similar the change of the variable of x and the change of the variable of y are (x and y are, for example, flow rate).
図16は、RAM/ROMの電力と流量との相関を示す説明図(その1)である。図16において、グラフ1600は、RAM/ROMの電力と流量との時系列変化を表している。
FIG. 16 is an explanatory diagram (part 1) showing the correlation between the power of the RAM / ROM and the flow rate. In FIG. 16, a
図17は、RAM/ROMの電力と流量との相関を示す説明図(その2)である。図17において、図16に示したグラフ1600の各サンプルの電力と流量の散布図1700が示されている。散布図1700の決定係数は「0.91」であり、十分な相関が観測されているといえる。
FIG. 17 is an explanatory diagram (part 2) illustrating the correlation between the power of the RAM / ROM and the flow rate. 17, a scatter diagram 1700 of the power and flow rate of each sample of the
図18は、FFクロックの電力と流量との相関を示す説明図(その1)である。図18において、グラフ1800は、FFのクロック端子成分の電力と流量との時系列変化を表している。
FIG. 18 is an explanatory diagram (part 1) showing the correlation between the power of the FF clock and the flow rate. In FIG. 18, a
図19は、FFクロックの電力と流量との相関を示す説明図(その2)である。図19において、図18に示したグラフ1800の各サンプルのFFクロック端子成分の電力と流量の散布図1900が示されている。散布図1900の決定係数は「0.18」であり、相関が観測されていないといえる。
FIG. 19 is an explanatory diagram (part 2) illustrating the correlation between the power of the FF clock and the flow rate. 19, a scatter diagram 1900 of the power and flow rate of the FF clock terminal component of each sample of the
図20は、クロックツリーの電力と流量との相関を示す説明図(その1)である。図20において、グラフ2000は、クロックツリーの電力と流量との時系列変化を表している。
FIG. 20 is an explanatory diagram (part 1) illustrating the correlation between the power of the clock tree and the flow rate. In FIG. 20, a
図21は、クロックツリーの電力と流量との相関を示す説明図(その2)である。図21において、図20に示したグラフ2000の各サンプルのクロックツリーの電力と流量の散布図2100が示されている。散布図2100の決定係数は「0.51」であり、十分な相関は観測されていないといえる。
FIG. 21 is an explanatory diagram (part 2) illustrating the correlation between the power of the clock tree and the flow rate. In FIG. 21, a scatter diagram 2100 of the power and flow rate of the clock tree of each sample of the
このように、非クロックツリー部とRAM/ROM部については流量と相関があるといえるが、クロックツリー部とFFクロック部については何らかの改善策が必要であるといえる。すなわち、流量のみを考慮した電力モデリングでは、高精度な電力見積は難しい。 Thus, although it can be said that there is a correlation with the flow rate for the non-clock tree portion and the RAM / ROM portion, it can be said that some improvement measures are necessary for the clock tree portion and the FF clock portion. That is, it is difficult to estimate power with high accuracy by power modeling considering only the flow rate.
(流量およびIPの状態を考慮した電力モデリング)
つぎに、流量およびIPの状態を考慮した電力モデリングについて説明する。流量を考慮した電力モデリングによれば、クロック系と非クロック系とRAMとで傾向が分かれている。RAMはクロック系であるが、チップイネーブル信号により、RAMのクロックゲーティングが大きな粒度で行えるため、相関が強い可能性がある。
(Power modeling considering flow rate and IP status)
Next, power modeling considering the flow rate and the IP state will be described. According to the power modeling considering the flow rate, the tendency is divided between the clock system, the non-clock system, and the RAM. Although the RAM is a clock system, there is a possibility that the correlation is strong because the clock gating of the RAM can be performed with a large granularity by the chip enable signal.
クロック系も自動挿入CGICの部分は相関があると想定することができる。RAM/ROMと非クロックツリーは、計算量と電力量の相関が強く、Idle状態もRun状態で計算量が極めて小さい時も同じような傾向を示すが、クロックツリー、FFクロックはIdle状態とRun状態で計算量が極めて小さい時であっても異なる傾向を示すことがある。 It can be assumed that the clock system also has a correlation in the part of the automatic insertion CGIC. The RAM / ROM and the non-clock tree have a strong correlation between the calculation amount and the power amount, and the Idle state and the Run state show the same tendency when the calculation amount is very small. Even when the amount of calculation in the state is extremely small, a different tendency may be shown.
すなわち、クロックツリー、FFクロックにはIPの制御要因による電力消費分があり、この電力消費分は、流量からは測れないために電力があっていないと想定することができる。そこで、以下の説明では、図22〜図27を用いて、「Idle状態とRun状態をもち、Run状態には流量と相関がある」というモデル化を行った場合の実験結果について説明する。 That is, the clock tree and the FF clock have power consumption due to IP control factors, and since this power consumption cannot be measured from the flow rate, it can be assumed that there is no power. Therefore, in the following description, an experimental result in the case of performing modeling that has “Idle state and Run state, and the Run state has a correlation with the flow rate” will be described with reference to FIGS.
図22は、FFクロックの電力と流量との相関を示す説明図(その3)である。図22において、グラフ2200は、RUN状態のみのFFクロック端子成分の電力値と流量の時系列変化を表している。なお、0[ms]〜300[ms]付近は、Idle状態のため対象外となっている。
FIG. 22 is an explanatory diagram (part 3) illustrating the correlation between the power of the FF clock and the flow rate. In FIG. 22, a
図23は、FFクロックの電力と流量との相関を示す説明図(その4)である。図23において、図22に示したグラフ2200の各サンプルのFFクロック端子成分の電力値と流量の散布図2300が示されている。散布図2300の決定係数は「0.75」であり、図19に示した実験結果と比べて大幅な改善がみられる。
FIG. 23 is an explanatory diagram (part 4) illustrating the correlation between the power of the FF clock and the flow rate. FIG. 23 shows a scatter diagram 2300 of the power value and flow rate of the FF clock terminal component of each sample of the
図24は、FFクロックの電力と流量との相関を示す説明図(その5)である。図24において、グラフ2400は、図23に示した例で回帰分析により得られた式を用いて、流量から推定した電力の予測値と実際の電力値(図24中、FFCLK)の時系列変化を表している。グラフ2400によれば、電力の予測値と実際の電力値とが合っていることがわかる。
FIG. 24 is an explanatory diagram (part 5) illustrating the correlation between the power of the FF clock and the flow rate. 24, a
図25は、クロックツリーの電力と流量との相関を示す説明図(その3)である。図25において、グラフ2500は、RUN状態のみのクロックツリーの電力値と流量の時系列変化を表している。なお、0[ms]〜300[ms]付近は、Idle状態のため対象外となっている。
FIG. 25 is an explanatory diagram (part 3) illustrating the correlation between the power of the clock tree and the flow rate. In FIG. 25, a
図26は、クロックツリーの電力と流量との相関を示す説明図(その4)である。図26において、図25に示したグラフ2500の各サンプルのクロックツリーの電力値と流量の散布図2600が示されている。散布図2600の決定係数は「0.74」であり、図21に示した実験結果と比べて大幅な改善がみられる。
FIG. 26 is an explanatory diagram (part 4) illustrating the correlation between the power of the clock tree and the flow rate. In FIG. 26, a scatter diagram 2600 of the power value and flow rate of the clock tree of each sample of the
図27は、クロックツリーの電力と流量との相関を示す説明図(その5)である。図27において、グラフ2700は、図26に示した例で回帰分析により得られた式を用いて、流量から推定した電力の予測値と実際の電力値(図27中、クロックツリー)の時系列変化を表している。グラフ2700によれば、電力の予測値と実際の電力値とが合っていることがわかる。
FIG. 27 is an explanatory diagram (part 5) illustrating the correlation between the power of the clock tree and the flow rate. In FIG. 27, a
このように、FFクロックとクロックツリーに関しては、Run状態を考慮することにより、決定係数が大幅に上がっており、電力見積の精度を改善することができることがわかる。 As described above, regarding the FF clock and the clock tree, it is understood that the determination coefficient is greatly increased by considering the Run state, and the accuracy of the power estimation can be improved.
また、図24や図27に示すように、波形の形もよく似ている。これは回路構造に依存していると考えられる。例えば、図8に示した回路があったとすると、Idle状態では、手置きCGICが止まり、部分クロックツリーBが完全に止まっているものと考えられる。 Moreover, as shown in FIG. 24 and FIG. 27, the shape of the waveform is very similar. This is considered to depend on the circuit structure. For example, if there is the circuit shown in FIG. 8, in the idle state, it is considered that the manual placement CGIC is stopped and the partial clock tree B is completely stopped.
Run状態では、手置きCGICがONになっていて、部分クロックツリーBの部分が常時動作しているようにみえるため、固定消費分が増大する。一方、自動置きCGICは、計算に必要な時にしかONにならない。したがって、計算量と何らかの依存関係があると考えられる。すなわち、IPの計算量とトグルレートとの間に比例関係が成り立つといえる。 In the Run state, the manual placement CGIC is ON, and the portion of the partial clock tree B seems to be operating at all times, so the fixed consumption increases. On the other hand, the automatic placement CGIC is turned on only when necessary for calculation. Therefore, it is considered that there is some dependency on the calculation amount. That is, it can be said that a proportional relationship is established between the amount of calculation of IP and the toggle rate.
なお、IPの状態をRun/Idleで分類して決定係数が上がった理由は、Run/Idleと強い相関性をもつ手挿入CGICがあったためだと推測できる。したがって、広範囲のクロックツリーを止めうるCGICと相関性が出るIPの状態を洗い出して定義し、その状態ごとに回帰分析を行うことが望ましい。また、図28に示すように、複数のメジャーなコンポーネントが存在する場合が考えられる。 It can be presumed that the reason why the determination coefficient is increased by classifying the IP state by Run / Idle is that there is a manual insertion CGIC having a strong correlation with Run / Idle. Therefore, it is desirable to identify and define IP states that correlate with CGIC that can stop a wide range of clock trees, and to perform regression analysis for each state. In addition, as shown in FIG. 28, there may be a case where a plurality of major components exist.
図28は、マルチファンクションの一例を示す説明図である。図28において、例えば、サブブロックAとサブブロックBとの電力差が大きく、共通サブブロック部分の電力が小さければ、信号がサブブロックAを通るか、サブブロックBを通るかが重要になってくる。 FIG. 28 is an explanatory diagram showing an example of a multifunction. In FIG. 28, for example, if the power difference between sub-block A and sub-block B is large and the power of the common sub-block portion is small, it becomes important whether the signal passes through sub-block A or sub-block B. come.
この場合には、例えば、設定レジスタの値も状態としてもっておくことが望ましい。バスアクセス部分は共通のため、流量と非クロックツリー部分の電力も大きく異なることになる。FFクロック、クロック部分についても影響は出る。一方、サブブロックAとサブブロックBとの電力差が小さく、共通サブブロック部分の電力が大きく、マルチパス部分が小さければ対応する必要はない。 In this case, for example, it is desirable to set the value of the setting register as the state. Since the bus access portion is common, the flow rate and the power of the non-clock tree portion are greatly different. The FF clock and clock part are also affected. On the other hand, if the power difference between sub-block A and sub-block B is small, the power of the common sub-block portion is large, and the multipath portion is small, there is no need to deal with it.
すなわち、電力モデリングにおいては、広範囲に影響を及ぼす手挿入CGIC(ただし、PowerProなどを使って同等の効果が得られることを期待する設計も含む)と相関があるパラメータは考慮することが望ましい。そして、手挿入CGICと相関があるパラメータを考慮することにより、回帰分析による電力モデル作成の安全度が高まると言える。 That is, in power modeling, it is desirable to take into account parameters correlated with manual insertion CGIC that affects a wide range (including designs that are expected to obtain the same effect using PowerPro or the like). And it can be said that the safety degree of power model creation by regression analysis is increased by considering a parameter correlated with manual insertion CGIC.
(流量と待ち時間を考慮した電力モデリング)
つぎに、流量と待ち時間を考慮した電力モデリングについて説明する。上述した流量を考慮した電力モデリングで説明した例題のクロックツリーの電力とFFクロックの電力をみると、計算量が減るはずのところで増えており、切片として表されるような固定量と流量と負の相関を持っているような変化をしている。
(Power modeling considering flow rate and waiting time)
Next, power modeling considering flow rate and waiting time will be described. Looking at the power of the clock tree and the FF clock in the example described in the power modeling considering the flow rate described above, the calculation amount is increased where it should be reduced. There is a change that has a correlation.
これは、何らかの無駄に電力を消費するような事象が起きていると考えられる。また、流量を考慮した電力モデリングの決定係数がある程度よい値であることを考えると、バスに起因した事象が起きていると推測できる。そこで、バスの利用権を欲しているのに待たされた時間はマイナス的な要因であると仮定して、バスの流量に加えて待ち時間を電力モデリングの要素に加えた場合について説明する。 This is considered to be an event in which power is wasted somehow. Also, considering that the power modeling decision coefficient considering the flow rate is a good value to some extent, it can be estimated that an event caused by the bus is occurring. Therefore, assuming that the time spent waiting for the right to use the bus is a negative factor, the case where the waiting time is added to the power modeling element in addition to the bus flow rate will be described.
待ち時間とは、バスの利用権を欲しているのに待たされた時間、すなわち、アービターにリクエストを投げてから、バスの利用が許可されるまでの累積時間である。実験では、待ち時間データがあるサンプルと電力があるサンプルとでは、データ取得条件が、前者は1[ms]程度でサンプリングしており、後者は6[ms]程度でサンプリングしており、開始時間にもずれがあることが分かった。 The waiting time is the time spent waiting for the right to use the bus, that is, the accumulated time from when a request is sent to the arbiter until the bus is allowed to be used. In the experiment, for the sample with waiting time data and the sample with power, the data acquisition condition is about 1 [ms] for the former, and about 6 [ms] for the latter, and the start time It was found that there was a gap.
そこで、本実験では、待ち時間データのほうに合わせて、サンプリングポイントの時刻が含まれる電力値を後者のデータから取って1つのデータにまとめたものを実験用のデータ(以下、「サンプルデータ2」という)とする。また、待ち時間は、ポートごとに発生する。
Therefore, in this experiment, in accordance with the waiting time data, the power value including the time of the sampling point is taken from the latter data and collected into one data (hereinafter referred to as “
以下、図29〜図32を用いて、サンプルデータ2で流量のみで重回帰分析した例について説明する。なお、サンプルデータ2では、リードポート2個、ライトポート1個のトランザクションの履歴がある。
Hereinafter, an example in which multiple regression analysis is performed using only the flow rate in the
図29は、サンプルデータ2でのクロックツリーの相関を示す説明図(その1)である。図29において、グラフ2900は、クロックツリーの電力に関する、本データセットにおける流量からの予測値と観測値との時系列変化を表している。
FIG. 29 is an explanatory diagram (part 1) illustrating the correlation of the clock tree with the
図30は、サンプルデータ2でのクロックツリーの相関を示す説明図(その2)である。図30において、クロックツリーの電力に関する、本データセットにおける流量からの予測値と観測値の散布図3000が示されている。散布図3000の決定係数は「0.47」であり、図21の決定係数「0.51」と同等であることがわかる。
FIG. 30 is an explanatory diagram (part 2) of the correlation of the clock tree with the
図31は、サンプルデータ2でのクロックツリーの相関を示す説明図(その3)である。図31において、グラフ3100は、FFクロック端子成分の電力に関する、本データセットにおける流量からの予測値と観測値との時系列変化を表している。
FIG. 31 is an explanatory diagram (part 3) illustrating the correlation of the clock tree with the
図32は、サンプルデータ2でのクロックツリーの相関を示す説明図(その4)である。図32において、FFクロック端子成分の電力に関する、本データセットにおける流量からの予測値と観測値の散布図3200が示されている。散布図3200の決定係数は「0.15」であり、図19の決定係数「0.18」と同等であることがわかる。
FIG. 32 is an explanatory diagram (part 4) illustrating the correlation of the clock tree with the
これらのことから、時間粒度が違うデータセットにおいても同等の精度が得られており、ポート数が多くなった要因は考慮しなくてもよいことが分かる。したがって、サンプルデータ2は(流量およびIPの状態を考慮した電力モデリング)までで用いたデータと同程度の品質があるといえる。そこで、待ち時間を用いた回帰分析実験においてはサンプルデータ2を使うことにする。
From these facts, it can be seen that the same accuracy is obtained even in the data sets having different time granularities, and it is not necessary to consider the factor that the number of ports is increased. Therefore, it can be said that the
(流量と待ち時間とを用いた回帰分析結果)
つぎに、図33〜図36を用いて、流量と待ち時間とを用いた回帰分析結果について説明する。
(Regression analysis result using flow rate and waiting time)
Next, the regression analysis results using the flow rate and the waiting time will be described with reference to FIGS.
図33は、流量と待ち時間によるクロックツリー電力見積の相関を示す説明図(その1)である。図33において、グラフ3300は、流量と待ち時間によるクロックツリーの電力の予測値と観測値との時系列変化を表している。
FIG. 33 is an explanatory diagram (part 1) illustrating the correlation between the clock tree power estimation based on the flow rate and the waiting time. In FIG. 33, a
図34は、流量と待ち時間によるクロックツリー電力見積の相関を示す説明図(その2)である。図34において、図33に示したグラフ3300の予測値と観測値の散布図3400が示されている。散布図3400の決定係数は「0.97」であり、十分な相関が観測されているといえる。
FIG. 34 is an explanatory diagram (part 2) showing the correlation between the clock tree power estimation based on the flow rate and the waiting time. 34 shows a scatter diagram 3400 of predicted values and observed values of the
図35は、流量と待ち時間によるFFクロック電力見積の相関を示す説明図(その1)である。図35において、グラフ3500は、流量と待ち時間によるFFクロック端子成分の電力の予測値と観測値との時系列変化を表している。
FIG. 35 is an explanatory diagram (part 1) illustrating the correlation between the FF clock power estimation based on the flow rate and the waiting time. In FIG. 35, a
図36は、流量と待ち時間によるFFクロック電力見積の相関を示す説明図(その2)である。図36において、図35に示したグラフ3500の予測値と観測値の散布図3600が示されている。散布図3600の決定係数は「0.89」であり、十分な相関が観測されているといえる。
FIG. 36 is an explanatory diagram (part 2) illustrating the correlation of the FF clock power estimation based on the flow rate and the waiting time. 36 shows a scatter diagram 3600 of predicted values and observed values of the
このように、流量と待ち時間とを考慮することにより、状態を考慮しなくても決定係数的には十分な相関が見受けられる。しかし、図33に示したグラフ3300や図35に示したグラフ3500から分かるように振幅が大きく、誤差がみられる。
Thus, by considering the flow rate and the waiting time, a sufficient correlation can be seen in terms of the determination coefficient without considering the state. However, as can be seen from the
(流量と待ち時間と状態とを用いた回帰分析結果)
つぎに、図37〜図40を用いて、流量と待ち時間と状態とを用いた回帰分析結果について説明する。
(Regression analysis result using flow rate, waiting time and status)
Next, regression analysis results using the flow rate, the waiting time, and the state will be described with reference to FIGS.
図37は、Run状態における流量と待ち時間によるクロックツリー電力見積の相関を示す説明図(その1)である。図37において、グラフ3700は、Run状態のみに着目した流量と待ち時間によるクロックツリーの電力の予測値と観測値との時系列変化を表している。
FIG. 37 is an explanatory diagram (part 1) illustrating a correlation between the clock tree power estimation based on the flow rate and the waiting time in the Run state. In FIG. 37, a
図38は、Run状態における流量と待ち時間によるクロックツリー電力見積の相関を示す説明図(その2)である。図38において、図37に示したグラフ3700の予測値と観測値の散布図3800が示されている。散布図3800の決定係数は「0.76」であり、相関が観測されているといえる。また、図34に比べて決定係数が小さくなっているが、図33のグラフ3300と図37のグラフ3700によれば、振幅が小さく誤差が小さくなっていることがわかる。
FIG. 38 is an explanatory diagram (part 2) of the correlation between the clock tree power estimation based on the flow rate and the waiting time in the Run state. FIG. 38 shows a scatter diagram 3800 of predicted values and observed values of the
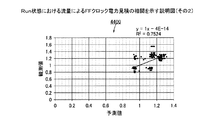
図39は、Run状態における流量と待ち時間によるFFクロック電力見積の相関を示す説明図(その1)である。図39において、グラフ3900は、Run状態のみに着目した流量と待ち時間によるFFクロック端子成分の電力の予測値と観測値との時系列変化を表している。
FIG. 39 is an explanatory diagram (part 1) illustrating the correlation between the flow rate in the Run state and the FF clock power estimation based on the waiting time. In FIG. 39, a
図40は、Run状態における流量と待ち時間によるFFクロック電力見積の相関を示す説明図(その2)である。図40において、図39に示したグラフ3900の予測値と観測値の散布図4000が示されている。散布図4000の決定係数は「0.77」であり、相関が観測されているといえる。また、図36に比べて決定係数が小さくなっているが、図35のグラフ3500と図39のグラフ3900によれば、振幅が小さく誤差が小さいことがわかる。
FIG. 40 is an explanatory diagram (part 2) of the correlation between the FF clock power estimation based on the flow rate and the waiting time in the Run state. In FIG. 40, a scatter diagram 4000 of predicted values and observed values of the
このように、流量と待ち時間に合わせて状態を考慮することにより、見積誤差を抑えることができる。 Thus, estimation errors can be suppressed by considering the state according to the flow rate and the waiting time.
(流量と状態とを用いた回帰分析結果)
つぎに、図41〜図44を用いて、Run状態における流量を用いた回帰分析結果についても、流量およびIPの状態を考慮した電力モデリングまでで用いたデータの代わりに使った分析結果を説明する。
(Regression analysis result using flow rate and condition)
Next, with reference to FIGS. 41 to 44, the regression analysis results using the flow rate in the Run state will be described using the analysis results used instead of the data used until the power modeling considering the flow rate and the IP state. .
図41は、Run状態における流量によるクロックツリー電力見積の相関を示す説明図(その1)である。図41において、グラフ4100は、Run状態のみに着目した流量によるクロックツリーの電力の予測値と観測値との時系列変化を表している。
FIG. 41 is an explanatory diagram (part 1) illustrating the correlation of the clock tree power estimation based on the flow rate in the Run state. In FIG. 41, a
図42は、Run状態における流量によるクロックツリー電力見積の相関を示す説明図(その2)である。図42において、図41に示したグラフ4100の予測値と観測値の散布図4200が示されている。散布図4200の決定係数は「0.74」であり、図38に示した例と同等に、相関が観測されているといえる。
FIG. 42 is an explanatory diagram (part 2) illustrating the correlation of the clock tree power estimation based on the flow rate in the Run state. In FIG. 42, a scatter diagram 4200 of predicted values and observed values of the
図43は、Run状態における流量によるFFクロック電力見積の相関を示す説明図(その1)である。図43において、グラフ4300は、Run状態のみに着目した流量によるFFクロック端子成分の電力の予測値と観測値との時系列変化を表している。
FIG. 43 is an explanatory diagram (part 1) illustrating the correlation of the FF clock power estimation based on the flow rate in the Run state. In FIG. 43, a
図44は、Run状態における流量によるFFクロック電力見積の相関を示す説明図(その2)である。図44において、図43に示したグラフ4300の予測値と観測値の散布図4400が示されている。散布図4400の決定係数は「0.75」であり、図40に示した例と同等に、相関が観測されているといえる。
FIG. 44 is an explanatory diagram (part 2) illustrating the correlation of the FF clock power estimation based on the flow rate in the Run state. 44, a scatter diagram 4400 of the predicted values and observed values of the
(電力見積支援装置101の記述例)
図45A、図45Bおよび図45Cは、電力見積支援装置101の記述例を示す説明図である。図45A、図45Bおよび図45Cに示す記述例4500によれば、電力見積に用いたトグルレート値とバス情報、IP状態履歴を使って、電力を見積もった区間の中に含まれる各状態の占有率を求めることができる。
(Description example of the power estimation support apparatus 101)
45A, 45B, and 45C are explanatory diagrams illustrating a description example of the power
また、記述例4500によれば、各状態の算出式*占有率の和で回帰分析を行って推定式を出力することができる。なお、カウンタは、IP状態数*パラメータ数個用意して、状態Aパラメータaのカウンタ値を出力する。更に、状態の期間/単位時間も合わせて出力する。 Further, according to the description example 4500, it is possible to perform a regression analysis with the calculation formula of each state * the sum of the occupation ratios and output an estimation formula. Note that the counter prepares the number of IP states * the number of parameters, and outputs the counter value of the state A parameter a. Further, the period / unit time of the state is also output.
(見積対象ブロックNの一例)
つぎに、見積対象ブロックNの一例について説明する。ここでは、クロックツリー部と非クロックツリー部とRAM/ROM部との回路範囲に分類した見積対象ブロックN(部分回路IP)について説明する。
(Example of block N for estimation)
Next, an example of the estimation target block N will be described. Here, the estimation target block N (partial circuit IP) classified into the circuit ranges of the clock tree portion, the non-clock tree portion, and the RAM / ROM portion will be described.
図46は、見積対象ブロックNの一例を示す説明図である。図46において、見積対象ブロックNが、クロックツリー部と非クロックツリー部とRAM/ROM部との回路範囲に分類されている。この場合、流量(Trans)と状態(State)が回帰分析で使用されるパラメータ(独立変数)とすると、見積対象ブロックNの電力を見積もるために観測すべき値は、見積対象ブロックNに対する流量(Trans)と状態(State)となる。 FIG. 46 is an explanatory diagram of an example of the estimation target block N. In FIG. 46, the estimation target block N is classified into circuit ranges of a clock tree portion, a non-clock tree portion, and a RAM / ROM portion. In this case, if the flow rate (Trans) and the state (State) are parameters (independent variables) used in the regression analysis, the value to be observed in order to estimate the power of the estimation target block N is the flow rate for the estimation target block N ( (Trans) and state (State).
流量(Trans)と状態(State)のパラメータをそれぞれXNTrans,XNStateとすると、見積対象ブロックNの電力推定関数は、例えば、下記式(8)となる。なお、XNTrans,XNStateの単位は、回帰分析を行ったときと同じ単位である。 Flow rate (Trans) and state parameters (State) respectively X ntrans, When X NState, power estimation function estimates the target block N is, for example, the following equation (8). Incidentally, X ntrans, units of X NState are the same units as when performing a regression analysis.
以上説明したように、電力見積支援装置101によれば、例えば、クロックツリー部、FFクロック部、非クロックツリー部、RAM/ROM部ごとの電力ライブラリを提供することができる。例えば、部分回路IPをクロックツリー部と非クロックツリー部とRAM/ROM部との回路範囲に分類した場合、電力見積支援装置101は、各々の回路範囲の計測結果データを取得して、各々の回路範囲のトグルレート推定関数を作成することができる。
As described above, according to the power
また、電力見積支援装置101は、各々の回路範囲のトグルレート推定関数と各々の回路範囲の電力値(n*PC)を用いて、各々の回路範囲の電力推定関数を作成することができる。これにより、クロックツリー部、非クロックツリー部およびRAM/ROM部といったカテゴリー別の消費電力を見積もることができる。
The power
なお、本実施の形態で説明した電力見積支援方法は、予め用意されたプログラムをパーソナル・コンピュータやワークステーション等のコンピュータで実行することにより実現することができる。本電力見積支援プログラムは、ハードディスク、フレキシブルディスク、CD−ROM、MO、DVD等のコンピュータで読み取り可能な記録媒体に記録され、コンピュータによって記録媒体から読み出されることによって実行される。また、本電力見積支援プログラムは、インターネット等のネットワークを介して配布してもよい。 The power estimation support method described in this embodiment can be realized by executing a program prepared in advance on a computer such as a personal computer or a workstation. The power estimation support program is recorded on a computer-readable recording medium such as a hard disk, a flexible disk, a CD-ROM, an MO, and a DVD, and is executed by being read from the recording medium by the computer. The power estimation support program may be distributed via a network such as the Internet.
また、本実施の形態で説明した電力見積支援装置101は、スタンダードセルやストラクチャードASIC(Application Specific Integrated Circuit)などの特定用途向けIC(以下、単に「ASIC」と称す。)やFPGAなどのPLD(Programmable Logic Device)によっても実現することができる。具体的には、例えば、上述した電力見積支援装置101の機能(取得部401〜出力部404)をHDL記述によって機能定義し、そのHDL記述を論理合成してASICやPLDに与えることにより、電力見積支援装置101を製造することができる。
In addition, the power
上述した実施の形態に関し、さらに以下の付記を開示する。 The following additional notes are disclosed with respect to the embodiment described above.
(付記1)コンピュータに、
回路の消費電力を見積もるシミュレーションにより所定の期間単位に計測された前記回路内のバスを介して部分回路に入出力されるデータ量と前記部分回路における単位時間当たりの信号の変化回数とを対応付けて表す計測結果を記憶部から読み出し、
前記計測結果に基づいて、前記データ量を独立変数とし、前記変化回数を従属変数として回帰分析を行うことにより、前記データ量から前記変化回数を求めるトグルレート推定関数を作成する、
処理を実行させることを特徴とする電力見積支援プログラム。
(Supplementary note 1)
Associating the amount of data input / output to / from a partial circuit via a bus in the circuit measured in a predetermined unit of time by simulation for estimating the power consumption of the circuit and the number of signal changes per unit time in the partial circuit Reading out the measurement results expressed as
Based on the measurement result, the data amount is an independent variable, and a regression analysis is performed using the number of changes as a dependent variable, thereby creating a toggle rate estimation function for obtaining the number of changes from the data amount.
A power estimation support program characterized by causing processing to be executed.
(付記2)前記コンピュータに、
作成した前記トグルレート推定関数と、前記信号の1変化当たりに消費される前記部分回路の電力値とを用いて、前記データ量から前記部分回路の電力を求める電力推定関数を作成する処理を実行させることを特徴とする付記1に記載の電力見積支援プログラム。
(Supplementary note 2)
Using the generated toggle rate estimation function and the power value of the partial circuit consumed per change of the signal, a process for generating a power estimation function for determining the power of the partial circuit from the data amount is executed. The power estimation support program according to
(付記3)前記計測結果は、前記データ量と前記変化回数と対応付けて、前記所定の期間において前記部分回路が要求された処理を実行可能となってから前記処理の実行が完了するまでの状態である期間の割合を表し、
前記トグルレート推定関数を作成する処理は、
前記計測結果に基づいて、前記データ量と前記割合とを独立変数とし、前記変化回数を従属変数として重回帰分析を行うことにより、前記データ量と前記割合とから前記変化回数を求めるトグルレート推定関数を作成することを特徴とする付記2に記載の電力見積支援プログラム。
(Supplementary Note 3) The measurement result is associated with the data amount and the number of changes, and the execution of the process is completed after the partial circuit can execute the requested process in the predetermined period. Represents the percentage of the period that is in state,
The process of creating the toggle rate estimation function is as follows:
Based on the measurement result, toggle rate estimation for obtaining the number of changes from the data amount and the ratio by performing multiple regression analysis with the data amount and the ratio as independent variables and the number of changes as a dependent variable. The power estimation support program according to
(付記4)前記電力推定関数を作成する処理は、
作成した前記トグルレート推定関数と、前記信号の1変化当たりに消費される前記部分回路の電力値とを用いて、前記データ量と前記割合とから前記部分回路の電力を求める電力推定関数を作成することを特徴とする付記2または3に記載の電力見積支援プログラム。
(Supplementary Note 4) The process of creating the power estimation function is as follows:
Using the generated toggle rate estimation function and the power value of the partial circuit consumed per change of the signal, a power estimation function for determining the power of the partial circuit from the data amount and the ratio is generated The power estimation support program according to
(付記5)前記コンピュータに、
作成した前記トグルレート推定関数を前記部分回路と関連付けて出力する処理を実行させることを特徴とする付記2〜4のいずれか一つに記載の電力見積支援プログラム。
(Supplementary note 5)
The power estimation support program according to any one of
(付記6)前記コンピュータに、
作成した前記電力推定関数を前記部分回路と関連付けて出力する処理を実行させることを特徴とする付記2〜5のいずれか一つに記載の電力見積支援プログラム。
(Appendix 6)
The power estimation support program according to any one of
(付記7)コンピュータに、
回路の消費電力を見積もるシミュレーションにより所定の期間単位に計測された前記回路内のバスを介して部分回路に入出力されるデータ量と前記部分回路における単位時間当たりの信号の変化回数とを対応付けて表す計測結果を記憶部から読み出し、
前記計測結果に基づいて、前記データ量を独立変数とし、前記変化回数を従属変数として回帰分析を行うことにより、前記データ量から前記変化回数を求めるトグルレート推定関数を作成する、
処理を実行させる電力見積支援プログラムを記録したことを特徴とする前記コンピュータに読取可能な記録媒体。
(Appendix 7)
Associating the amount of data input / output to / from a partial circuit via a bus in the circuit measured in a predetermined unit of time by simulation for estimating the power consumption of the circuit and the number of signal changes per unit time in the partial circuit Reading out the measurement results expressed as
Based on the measurement result, the data amount is an independent variable, and a regression analysis is performed using the number of changes as a dependent variable, thereby creating a toggle rate estimation function for obtaining the number of changes from the data amount.
A computer-readable recording medium in which a power estimation support program for executing processing is recorded.
(付記8)回路の消費電力を見積もるシミュレーションにより所定の期間単位に計測された前記回路内のバスを介して部分回路に入出力されるデータ量と前記部分回路における単位時間当たりの信号の変化回数とを対応付けて表す計測結果を取得する取得部と、
前記取得部によって取得された前記計測結果に基づいて、前記データ量を独立変数とし、前記変化回数を従属変数として回帰分析を行うことにより、前記データ量から前記変化回数を求めるトグルレート推定関数を作成する作成部と、
を有することを特徴とする電力見積支援装置。
(Supplementary note 8) The amount of data input to and output from the partial circuit via the bus in the circuit measured by a simulation for estimating the power consumption of the circuit and the number of signal changes per unit time in the partial circuit An acquisition unit for acquiring a measurement result in association with
Based on the measurement result acquired by the acquisition unit, a toggle rate estimation function for obtaining the number of changes from the data amount by performing regression analysis with the data amount as an independent variable and the number of changes as a dependent variable. A creation section to create,
A power estimation support apparatus comprising:
(付記9)回路の消費電力を見積もるシミュレーションにより所定の期間単位に計測された前記回路内のバスを介して部分回路に入出力されるデータ量と前記部分回路における単位時間当たりの信号の変化回数とを対応付けて表す計測結果を取得する取得部と、
前記取得部によって取得された前記計測結果に基づいて、前記データ量を独立変数とし、前記変化回数を従属変数として回帰分析を行うことにより、前記データ量から前記変化回数を求めるトグルレート推定関数を作成する作成部と、
を有するコンピュータを含むことを特徴とする電力見積支援装置。
(Supplementary note 9) Amount of data input / output to / from a partial circuit via a bus in the circuit measured by a simulation for estimating power consumption of the circuit and a number of signal changes per unit time in the partial circuit An acquisition unit for acquiring a measurement result in association with
Based on the measurement result acquired by the acquisition unit, a toggle rate estimation function for obtaining the number of changes from the data amount by performing regression analysis with the data amount as an independent variable and the number of changes as a dependent variable. A creation section to create,
A power estimation support apparatus comprising: a computer having:
(付記10)コンピュータが、
回路の消費電力を見積もるシミュレーションにより所定の期間単位に計測された前記回路内のバスを介して部分回路に入出力されるデータ量と前記部分回路における単位時間当たりの信号の変化回数とを対応付けて表す計測結果を記憶部から読み出し、
前記計測結果に基づいて、前記データ量を独立変数とし、前記変化回数を従属変数として回帰分析を行うことにより、前記データ量から前記変化回数を求めるトグルレート推定関数を作成する、
処理を実行することを特徴とする電力見積支援方法。
(Supplementary note 10)
Associating the amount of data input / output to / from a partial circuit via a bus in the circuit measured in a predetermined unit of time by simulation for estimating the power consumption of the circuit and the number of signal changes per unit time in the partial circuit Reading out the measurement results expressed as
Based on the measurement result, the data amount is an independent variable, and a regression analysis is performed using the number of changes as a dependent variable, thereby creating a toggle rate estimation function for obtaining the number of changes from the data amount.
A power estimation support method characterized by executing processing.
101 電力見積支援装置
401 取得部
402 作成部
403 算出部
404 出力部
101 Power
Claims (9)
回路の消費電力を見積もるシミュレーションにより所定の期間単位に計測された前記回路内のバスを介して部分回路に入出力されるデータ量と前記部分回路における単位時間当たりの信号の変化回数と対応付けて、前記所定の期間において前記部分回路が要求された処理を実行可能となってから前記処理の実行が完了するまでの状態である期間の割合を表す計測結果を記憶部から読み出し、
前記計測結果に基づいて、前記データ量と前記割合とを独立変数とし、前記変化回数を従属変数として重回帰分析を行うことにより、前記データ量と前記割合とから前記変化回数を求めるトグルレート推定関数を作成する、
処理を実行させることを特徴とする電力見積支援プログラム。 On the computer,
In association with the number of changes in the circuit data amount signal per unit time in the partial circuit is input to the partial circuit via the bus in the circuit that is measured in a predetermined period unit by simulation to estimate the power consumption of , Reading a measurement result representing a ratio of a period in which the partial circuit can execute the requested process in the predetermined period until the execution of the process is completed from the storage unit,
Based on the measurement result, toggle rate estimation for obtaining the number of changes from the data amount and the ratio by performing multiple regression analysis with the data amount and the ratio as independent variables and the number of changes as a dependent variable. Create a function,
A power estimation support program characterized by causing processing to be executed.
作成した前記トグルレート推定関数と、前記信号の1変化当たりに消費される前記部分回路の電力値とを用いて、前記データ量と前記割合とから前記部分回路の電力を求める電力推定関数を作成する処理を実行させることを特徴とする請求項1に記載の電力見積支援プログラム。 In the computer,
Using the generated toggle rate estimation function and the power value of the partial circuit consumed per change of the signal, a power estimation function for determining the power of the partial circuit from the data amount and the ratio is generated The power estimation support program according to claim 1, wherein the power estimation support program is executed.
作成した前記トグルレート推定関数を前記部分回路と関連付けて出力する処理を実行させることを特徴とする請求項1に記載の電力見積支援プログラム。 The power estimation support program according to claim 1, wherein a process for outputting the generated toggle rate estimation function in association with the partial circuit is executed.
作成した前記電力推定関数を前記部分回路と関連付けて出力する処理を実行させることを特徴とする請求項2に記載の電力見積支援プログラム。 The power estimation support program according to claim 2, wherein a process of outputting the generated power estimation function in association with the partial circuit is executed.
前記取得部によって取得された前記計測結果に基づいて、前記データ量と前記割合とを独立変数とし、前記変化回数を従属変数として重回帰分析を行うことにより、前記データ量と前記割合とから前記変化回数を求めるトグルレート推定関数を作成する作成部と、 Based on the measurement result acquired by the acquisition unit, the data amount and the ratio are set as independent variables, and multiple regression analysis is performed using the number of changes as a dependent variable. A creation unit for creating a toggle rate estimation function for obtaining the number of changes;
を有することを特徴とする電力見積支援装置。 A power estimation support apparatus comprising:
回路の消費電力を見積もるシミュレーションにより所定の期間単位に計測された前記回路内のバスを介して部分回路に入出力されるデータ量と前記部分回路における単位時間当たりの信号の変化回数と対応付けて、前記所定の期間において前記部分回路が要求された処理を実行可能となってから前記処理の実行が完了するまでの状態である期間の割合を表す計測結果を記憶部から読み出し、 Corresponding to the amount of data input / output to / from the partial circuit via the bus in the circuit measured by a simulation for estimating the power consumption of the circuit and the number of signal changes per unit time in the partial circuit , Reading a measurement result representing a ratio of a period in which the partial circuit can execute the requested process in the predetermined period until the execution of the process is completed from the storage unit,
前記計測結果に基づいて、前記データ量と前記割合とを独立変数とし、前記変化回数を従属変数として重回帰分析を行うことにより、前記データ量と前記割合とから前記変化回数を求めるトグルレート推定関数を作成する、 Based on the measurement result, toggle rate estimation for obtaining the number of changes from the data amount and the ratio by performing multiple regression analysis with the data amount and the ratio as independent variables and the number of changes as a dependent variable. Create a function,
処理を実行することを特徴とする電力見積支援方法。 A power estimation support method characterized by executing processing.
回路の消費電力を見積もるシミュレーションにより所定の期間単位に計測された前記回路内のバスを介して部分回路に入出力されるデータ量と前記部分回路における単位時間当たりの信号の変化回数と対応付けて、前記所定の期間において前記部分回路が要求された処理を実行可能となってから前記処理の実行が完了するまでの状態である期間の割合を表す計測結果を記憶部から読み出し、 Corresponding to the amount of data input / output to / from the partial circuit via the bus in the circuit measured by a simulation for estimating the power consumption of the circuit and the number of signal changes per unit time in the partial circuit , Reading a measurement result representing a ratio of a period in which the partial circuit can execute the requested process in the predetermined period until the execution of the process is completed from the storage unit,
前記計測結果に基づいて、前記データ量と前記割合とを独立変数とし、前記変化回数を従属変数として重回帰分析を行うことにより、前記データ量と前記割合とから前記変化回数を求めるトグルレート推定関数を作成し、 Based on the measurement result, toggle rate estimation for obtaining the number of changes from the data amount and the ratio by performing multiple regression analysis with the data amount and the ratio as independent variables and the number of changes as a dependent variable. Create a function
作成した前記トグルレート推定関数と、前記信号の1変化当たりに消費される前記部分回路の電力値とを用いて、前記データ量から前記部分回路の電力を求める電力推定関数を作成する、 Using the created toggle rate estimation function and the power value of the partial circuit consumed per change of the signal, a power estimation function for determining the power of the partial circuit from the data amount is created.
処理を実行させることを特徴とする電力見積支援プログラム。 A power estimation support program characterized by causing processing to be executed.
作成した前記トグルレート推定関数と、前記信号の1変化当たりに消費される前記部分回路の電力値とを用いて、前記データ量と前記割合とから前記部分回路の電力を求める電力推定関数を作成することを特徴とする請求項7に記載の電力見積支援プログラム。 The process of creating the power estimation function includes:
Using the generated toggle rate estimation function and the power value of the partial circuit consumed per change of the signal, a power estimation function for determining the power of the partial circuit from the data amount and the ratio is generated The power estimation support program according to claim 7 , wherein:
回路の消費電力を見積もるシミュレーションにより所定の期間単位に計測された前記回路内のバスを介して部分回路に入出力されるデータ量と前記部分回路における単位時間当たりの信号の変化回数と対応付けて、前記所定の期間において前記部分回路が要求された処理を実行可能となってから前記処理の実行が完了するまでの状態である期間の割合を表す計測結果を記憶部から読み出し、 Corresponding to the amount of data input / output to / from the partial circuit via the bus in the circuit measured by a simulation for estimating the power consumption of the circuit and the number of signal changes per unit time in the partial circuit , Reading a measurement result representing a ratio of a period in which the partial circuit can execute the requested process in the predetermined period until the execution of the process is completed from the storage unit,
前記計測結果に基づいて、前記データ量と前記割合とを独立変数とし、前記変化回数を従属変数として重回帰分析を行うことにより、前記データ量と前記割合とから前記変化回数を求めるトグルレート推定関数を作成し、 Based on the measurement result, toggle rate estimation for obtaining the number of changes from the data amount and the ratio by performing multiple regression analysis with the data amount and the ratio as independent variables and the number of changes as a dependent variable. Create a function
作成した前記トグルレート推定関数と、前記信号の1変化当たりに消費される前記部分回路の電力値とを用いて、前記データ量から前記部分回路の電力を求める電力推定関数を作成する、 Using the created toggle rate estimation function and the power value of the partial circuit consumed per change of the signal, a power estimation function for determining the power of the partial circuit from the data amount is created.
処理を実行することを特徴とする電力見積支援方法。 A power estimation support method characterized by executing processing.
Priority Applications (1)
| Application Number | Priority Date | Filing Date | Title |
|---|---|---|---|
| JP2012211579A JP6175637B2 (en) | 2012-09-25 | 2012-09-25 | Power estimation support program, power estimation support device, and power estimation support method |
Applications Claiming Priority (1)
| Application Number | Priority Date | Filing Date | Title |
|---|---|---|---|
| JP2012211579A JP6175637B2 (en) | 2012-09-25 | 2012-09-25 | Power estimation support program, power estimation support device, and power estimation support method |
Publications (2)
| Publication Number | Publication Date |
|---|---|
| JP2014067196A JP2014067196A (en) | 2014-04-17 |
| JP6175637B2 true JP6175637B2 (en) | 2017-08-09 |
Family
ID=50743541
Family Applications (1)
| Application Number | Title | Priority Date | Filing Date |
|---|---|---|---|
| JP2012211579A Expired - Fee Related JP6175637B2 (en) | 2012-09-25 | 2012-09-25 | Power estimation support program, power estimation support device, and power estimation support method |
Country Status (1)
| Country | Link |
|---|---|
| JP (1) | JP6175637B2 (en) |
Family Cites Families (8)
| Publication number | Priority date | Publication date | Assignee | Title |
|---|---|---|---|---|
| JP2001056827A (en) * | 1999-08-18 | 2001-02-27 | Matsushita Electric Ind Co Ltd | Method for designing integrated circuit device |
| JP2001338010A (en) * | 2000-05-25 | 2001-12-07 | Matsushita Electric Ind Co Ltd | Method for designing integrated circuit |
| JP2003186930A (en) * | 2001-12-14 | 2003-07-04 | Sharp Corp | Logic circuit designing method |
| JP2007293542A (en) * | 2006-04-24 | 2007-11-08 | Fujitsu Ltd | Fpga current consumption relational expression deriving method and program, fpga current consumption relational expression deriving system, and accuracy evaluation program for fpga estimation tool |
| WO2008041280A1 (en) * | 2006-09-29 | 2008-04-10 | Fujitsu Limited | Method for calculating power consumption of semiconductor integrated circuit and apparatus for designing semiconductor integrated circuit |
| JP4728203B2 (en) * | 2006-11-06 | 2011-07-20 | 富士通セミコンダクター株式会社 | Semiconductor circuit layout method, program, and design support system |
| JP5374937B2 (en) * | 2007-12-03 | 2013-12-25 | 富士通株式会社 | Power index calculation program, power index calculation device, and power index calculation method |
| JP5510274B2 (en) * | 2010-11-02 | 2014-06-04 | 富士通株式会社 | Integrated circuit power consumption analysis apparatus and method |
-
2012
- 2012-09-25 JP JP2012211579A patent/JP6175637B2/en not_active Expired - Fee Related
Also Published As
| Publication number | Publication date |
|---|---|
| JP2014067196A (en) | 2014-04-17 |
Similar Documents
| Publication | Publication Date | Title |
|---|---|---|
| JP3925471B2 (en) | Method and system for efficiently performing RTL power estimation | |
| US8095354B2 (en) | Power consumption peak estimation program for LSI and device therefor | |
| US20070276645A1 (en) | Power modelling in circuit designs | |
| JP4667466B2 (en) | Power consumption analysis method and power consumption analysis apparatus | |
| US8572527B1 (en) | Generating properties for circuit designs | |
| JP2009266237A (en) | Peak power detection in digital designs using emulation systems | |
| JP2005092885A (en) | System and method for statistical timing analysis of digital circuits | |
| US5787008A (en) | Simulation corrected sensitivity | |
| US8468479B2 (en) | Consistent hierarchical timing model with crosstalk consideration | |
| US7926019B1 (en) | Common clock path pessimism analysis for circuit designs using clock tree networks | |
| JP2010160787A (en) | System for creating parameter information, system for estimating yields, program and recording medium | |
| US8713506B2 (en) | System and method for employing signoff-quality timing analysis information concurrently in multiple scenarios to reduce dynamic power in an electronic circuit and an apparatus incorporating the same | |
| US11636246B2 (en) | Systems and methods for predicting and managing power and energy use of semiconductor devices | |
| US7260809B2 (en) | Power estimation employing cycle-accurate functional descriptions | |
| US7475367B2 (en) | Memory power models related to access information and methods thereof | |
| JP2005352787A (en) | Method and apparatus for timing analysis | |
| US10430535B2 (en) | Verification support program medium, verification support method, and information processing device for verification of a circuit | |
| JP5018781B2 (en) | Signal selection device, circuit correction device, circuit simulator, circuit emulator, signal selection method and program | |
| JP6175637B2 (en) | Power estimation support program, power estimation support device, and power estimation support method | |
| US8959467B2 (en) | Structural rule analysis with TCL scripts in synthesis or STA tools and integrated circuit design tools | |
| CN112149370B (en) | Chip aging static time sequence analysis method and device and electronic equipment | |
| JP6089627B2 (en) | Power consumption estimation apparatus and power consumption estimation method | |
| US20140298049A1 (en) | Digital signal transition counters for digital integrated circuits | |
| JP2008234187A (en) | Power consumption analysis support program, recording medium recording this program, and power consumption analysis support device | |
| JP7091726B2 (en) | Information processing equipment, programs and information processing methods |
Legal Events
| Date | Code | Title | Description |
|---|---|---|---|
| A621 | Written request for application examination |
Free format text: JAPANESE INTERMEDIATE CODE: A621 Effective date: 20150526 |
|
| A711 | Notification of change in applicant |
Free format text: JAPANESE INTERMEDIATE CODE: A712 Effective date: 20150611 |
|
| A977 | Report on retrieval |
Free format text: JAPANESE INTERMEDIATE CODE: A971007 Effective date: 20160421 |
|
| A131 | Notification of reasons for refusal |
Free format text: JAPANESE INTERMEDIATE CODE: A131 Effective date: 20160426 |
|
| A521 | Request for written amendment filed |
Free format text: JAPANESE INTERMEDIATE CODE: A523 Effective date: 20160624 |
|
| A131 | Notification of reasons for refusal |
Free format text: JAPANESE INTERMEDIATE CODE: A131 Effective date: 20161025 |
|
| A521 | Request for written amendment filed |
Free format text: JAPANESE INTERMEDIATE CODE: A523 Effective date: 20161226 |
|
| TRDD | Decision of grant or rejection written | ||
| A01 | Written decision to grant a patent or to grant a registration (utility model) |
Free format text: JAPANESE INTERMEDIATE CODE: A01 Effective date: 20170509 |
|
| A711 | Notification of change in applicant |
Free format text: JAPANESE INTERMEDIATE CODE: A711 Effective date: 20170608 |
|
| A61 | First payment of annual fees (during grant procedure) |
Free format text: JAPANESE INTERMEDIATE CODE: A61 Effective date: 20170608 |
|
| A521 | Request for written amendment filed |
Free format text: JAPANESE INTERMEDIATE CODE: A821 Effective date: 20170630 |
|
| R150 | Certificate of patent or registration of utility model |
Ref document number: 6175637 Country of ref document: JP Free format text: JAPANESE INTERMEDIATE CODE: R150 |
|
| LAPS | Cancellation because of no payment of annual fees |