JP6141235B2 - How to detect anomalies in time series data - Google Patents
How to detect anomalies in time series data Download PDFInfo
- Publication number
- JP6141235B2 JP6141235B2 JP2014124072A JP2014124072A JP6141235B2 JP 6141235 B2 JP6141235 B2 JP 6141235B2 JP 2014124072 A JP2014124072 A JP 2014124072A JP 2014124072 A JP2014124072 A JP 2014124072A JP 6141235 B2 JP6141235 B2 JP 6141235B2
- Authority
- JP
- Japan
- Prior art keywords
- series data
- time series
- time
- component
- universal
- Prior art date
- Legal status (The legal status is an assumption and is not a legal conclusion. Google has not performed a legal analysis and makes no representation as to the accuracy of the status listed.)
- Active
Links
- 238000000034 method Methods 0.000 claims description 36
- 238000012549 training Methods 0.000 claims description 18
- 238000012360 testing method Methods 0.000 claims description 13
- 230000001788 irregular Effects 0.000 claims description 6
- 230000005856 abnormality Effects 0.000 claims description 4
- 239000013598 vector Substances 0.000 description 9
- 230000002159 abnormal effect Effects 0.000 description 3
- 238000001514 detection method Methods 0.000 description 2
- 238000012545 processing Methods 0.000 description 2
- 230000008439 repair process Effects 0.000 description 2
- 206010000117 Abnormal behaviour Diseases 0.000 description 1
- 230000002547 anomalous effect Effects 0.000 description 1
- 238000001914 filtration Methods 0.000 description 1
- 230000007774 longterm Effects 0.000 description 1
- 238000012423 maintenance Methods 0.000 description 1
- 238000012544 monitoring process Methods 0.000 description 1
- 238000003909 pattern recognition Methods 0.000 description 1
- 230000000737 periodic effect Effects 0.000 description 1
- 238000005070 sampling Methods 0.000 description 1
- 230000001052 transient effect Effects 0.000 description 1
Images


Classifications
-
- G—PHYSICS
- G06—COMPUTING; CALCULATING OR COUNTING
- G06F—ELECTRIC DIGITAL DATA PROCESSING
- G06F11/00—Error detection; Error correction; Monitoring
- G06F11/07—Responding to the occurrence of a fault, e.g. fault tolerance
- G06F11/0703—Error or fault processing not based on redundancy, i.e. by taking additional measures to deal with the error or fault not making use of redundancy in operation, in hardware, or in data representation
- G06F11/0751—Error or fault detection not based on redundancy
- G06F11/0754—Error or fault detection not based on redundancy by exceeding limits
- G06F11/076—Error or fault detection not based on redundancy by exceeding limits by exceeding a count or rate limit, e.g. word- or bit count limit
-
- G—PHYSICS
- G06—COMPUTING; CALCULATING OR COUNTING
- G06F—ELECTRIC DIGITAL DATA PROCESSING
- G06F11/00—Error detection; Error correction; Monitoring
- G06F11/07—Responding to the occurrence of a fault, e.g. fault tolerance
- G06F11/0703—Error or fault processing not based on redundancy, i.e. by taking additional measures to deal with the error or fault not making use of redundancy in operation, in hardware, or in data representation
- G06F11/0706—Error or fault processing not based on redundancy, i.e. by taking additional measures to deal with the error or fault not making use of redundancy in operation, in hardware, or in data representation the processing taking place on a specific hardware platform or in a specific software environment
- G06F11/0736—Error or fault processing not based on redundancy, i.e. by taking additional measures to deal with the error or fault not making use of redundancy in operation, in hardware, or in data representation the processing taking place on a specific hardware platform or in a specific software environment in functional embedded systems, i.e. in a data processing system designed as a combination of hardware and software dedicated to performing a certain function
Landscapes
- Engineering & Computer Science (AREA)
- Theoretical Computer Science (AREA)
- Quality & Reliability (AREA)
- Physics & Mathematics (AREA)
- General Engineering & Computer Science (AREA)
- General Physics & Mathematics (AREA)
- Complex Calculations (AREA)
- Testing Of Devices, Machine Parts, Or Other Structures Thereof (AREA)
Description
本発明は、包括的には、時系列データを処理することに関し、より詳細には、機器の動作中に時系列データから異常を判断することに関する。 The present invention relates generally to processing time series data, and more particularly to determining anomalies from time series data during device operation.
複数の用途で、時系列データを生成し、解析することができる。例えば、自動機器監視は、コストの高い修理を回避することができる。これは、機器上または機器の近くのセンサーによって取得される時系列データを解析して、機器のメンテナンスまたは修理が必要であることを示す場合がある異常を検出することによって行うことができる。 Time series data can be generated and analyzed in multiple applications. For example, automated equipment monitoring can avoid costly repairs. This can be done by analyzing time-series data acquired by sensors on or near the device to detect anomalies that may indicate that the device needs maintenance or repair.
通常の確率論的かつ多変量の時系列データについて、図1Aおよび図1Bに示すように、異常を検出する従来技術による方法のほとんどは、正常動作範囲101外の値を単に求める。
For normal stochastic and multivariate time series data, as shown in FIGS. 1A and 1B, most of the prior art methods for detecting anomalies simply determine values outside the
例えば、1つの方法は、多変量時系列をベクトル自己回帰(AR)モデルとして局所的にモデル化することができることを仮定する。非特許文献1を参照されたい。その方法は、まず、トレーニングデータの時間ウィンドウごとに、ARモデルパラメーターの分布を学習する。試験中、時間ウィンドウごとに、ARモデルパラメーターが推定され、これらのパラメーターの確率が、以前に学習された確率分布から求められる。その方法によって学習される分布は、制限的自己回帰推定を用いる。その方法は、不規則確率変動成分を有する時系列データに対し、良好に機能する。
For example, one method assumes that a multivariate time series can be locally modeled as a vector autoregressive (AR) model. See Non-Patent
ほとんどの方法は、特定の用途の単一のタイプの時系列データに焦点をあてる。時系列データにおける異常検出の問題に対する、より一般的な解決を試みる方法は、ほとんどない。 Most methods focus on a single type of time series data for a specific application. There are few ways to try a more general solution to the problem of anomaly detection in time series data.
特許文献1「Strategies for identifying anomalies in time-series data」は、時系列データにスプラインセグメントを当てはめるモデルベースの手法である。図1Cを参照されたい。その方法は、スプラインパラメーターにおける変化を計算し、スプライン間のL1距離を用いて異常を検出し、L2距離を用いて正常動作を測定する。この方法は、平滑な軌道を有する時系列に対し、良好に機能する。
本発明の実施の形態によれば、時系列を、平滑な曲線と、その平滑な曲線のまわりの不規則変動とに分解することができる。平滑な曲線は、時系列の軌道成分と呼ばれ、不規則変動は、時系列の確率変動成分と呼ばれる。従来技術による方法は、通常、これらの成分のうちの1つのみを含む時系列を扱う。 According to the embodiment of the present invention, a time series can be decomposed into a smooth curve and irregular fluctuations around the smooth curve. A smooth curve is called a time-series orbital component, and irregular fluctuations are called time-series probability fluctuation components. Prior art methods typically deal with time series containing only one of these components.
実施の形態は、時系列データにおける異常を検出する方法を提供する。時系列データは、例えば、機器からセンサーによって取得することができる。本方法は、時系列データにおける異常パターンを検出する。例えば、機械からのセンサーデータは、正常時には、周期的なパターン、例えば、正弦波を生成することができる。センサーが一定の信号、すなわち、平坦なラインを生成する場合、これは、正常動作範囲から外れる値が存在しない場合であっても異常である。本発明は、時系列の確率論的成分および軌道成分の双方をモデル化する。本発明は、異常発見問題を解決し、これは、任意の時系列データとともに、良好に機能する。 Embodiments provide a method for detecting anomalies in time-series data. The time series data can be acquired from a device by a sensor, for example. The method detects an abnormal pattern in time series data. For example, sensor data from a machine can generate a periodic pattern, such as a sine wave, when normal. If the sensor produces a constant signal, i.e. a flat line, this is abnormal even if there are no values outside the normal operating range. The present invention models both time-series stochastic and orbital components. The present invention solves the anomaly discovery problem, which works well with arbitrary time series data.
本方法は、トレーニングに用いられる時系列データを要約する1組の普遍的特徴を用いる。普遍的特徴は、本発明の顕著な要素である。これらの特徴は、様々なタイプの時系列データを扱うように設計されるので、普遍的であるといわれる。このため、本方法は、特徴に基づく手法である。 The method uses a set of universal features that summarize the time series data used for training. Universal features are a prominent element of the present invention. These features are said to be universal because they are designed to handle various types of time series data. For this reason, this method is a technique based on features.
本発明の実施の形態によれば、時系列データ源、例えば、機械からのセンサー出力は、確率変動成分と軌道成分との組み合わせとして特徴付けることができる。確率変動成分は、移動平均(moving mean or average)のまわりの不規則変動を有するデータを生成する一方、軌道成分は、軌道のような平滑な曲線を生成する。 In accordance with an embodiment of the present invention, the sensor output from a time series data source, eg, a machine, can be characterized as a combination of a probability variation component and a trajectory component. The probability variation component generates data with irregular variation around the moving mean or average, while the trajectory component generates a smooth curve like a trajectory.
自己回帰モデルを用いて時系列をモデル化する等の従来技術の方法は、確率論的時系列に対してのみ良好に機能する。実施の形態によって用いられる普遍的特徴は、これらの特徴が、時系列の軌道のような挙動および確率論的タイプの挙動の双方を特徴付けるという点で優れている。 Prior art methods, such as modeling a time series using an autoregressive model, work well only for stochastic time series. The universal features used by the embodiments are excellent in that these features characterize both time-series orbit-like behavior and stochastic type behavior.
方法の概観
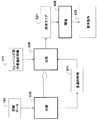
図2Aに示すように、本発明の実施の形態は、時系列データにおける異常を検出する方法を提供する。例えば、データは、機器または機械からセンサーによって取得される。本方法は、いくつか例を挙げると、一般統計学、信号処理、パターン認識、計量経済学、金融サービス、天気予報、気候変動、海洋学、制御工学、通信工学、医療診断、疫学および市場分析等の他の用途において用いることができることを理解すべきである。
Overview of Method As shown in FIG. 2A, embodiments of the present invention provide a method for detecting anomalies in time series data. For example, data is obtained by sensors from a device or machine. The method can be general statistics, signal processing, pattern recognition, econometrics, financial services, weather forecasting, climate change, oceanography, control engineering, communications engineering, medical diagnostics, epidemiology and market analysis, to name a few. It should be understood that it can be used in other applications.
時系列データは、トレーニングデータ101と試験データとを含むことができる。いずれの場合においても、時系列データは、長さwの重なり合ってスライドする時間ウィンドウに分割される。サンプリングレート、ウィンドウサイズ、および重ね合わせの量は、用途に特有とすることができ、例えば、短期現象の場合、ウィンドウは、ほんの数分の一秒にすることができる。長期の挙動の場合のウィンドウは、数年または数世紀とすることができる。以下のように、ウィンドウから特徴が抽出される。これらの特徴は、様々なタイプの時系列データ、例えば、確率論的タイプ、軌道タイプ、並びに単一の特徴において軌道タイプおよび確率論的タイプの時系列データの特性を組み合わせた混成タイプを表すことができるので、普遍的である。
The time series data can include
トレーニング中、トレーニング用の普遍的特徴111が、トレーニングデータ、例えば、異常を一切含まないデータから抽出される(110)。
During training,
試験中、同様にして、特徴が抽出され、特徴付けされる。次に、学習された特徴と比較することによって、試験データ102内の異常103が検出される(120)。検出は、トレーニング中に学習された特徴と、試験データからの特徴との間の距離を用いることができる。
During the test, features are extracted and characterized in the same way. Next,
この方法のステップおよび本明細書において説明される他の手順は、当該技術分野において既知のメモリおよび入/出力インターフェースに接続されたプロセッサ100において実行することができる。
The method steps and other procedures described herein may be performed on a
軌道および確率論的特徴
普遍的特徴は、2つの主要成分、すなわち、軌道成分および確率変動成分を含む。
Orbital and probabilistic features Universal features include two main components: an orbital component and a stochastic variation component.
軌道成分
軌道成分は、時系列がウィンドウ内でたどる平滑な軌道を示す。軌道成分は、ウィンドウ移動平均を用い、これは、時系列の低域通過フィルタリングに等しい。軌道成分は、各時間ステップにおけるウィンドウの平均に対する制限も含み、トレーニングデータにおける全ての類似した軌道の中で、軌道の変動が通常どの程度見られるかが規定される。これは、軌道に沿って信頼区間を配置することに等しい。
Orbital component The orbital component represents a smooth trajectory that the time series follows in the window. The orbital component uses a window moving average, which is equivalent to time series low pass filtering. The trajectory component also includes a limit on the average of the window at each time step, and defines how much trajectory variation is usually seen among all similar trajectories in the training data. This is equivalent to placing confidence intervals along the trajectory.
普遍的特徴の軌道成分の例が、図2Bに示されている。軌道成分は、長さ2wのベクトルとして表され、移動平均200と、平均に対する制限201とを含む。軌道成分は、各時間ステップにおける軌道の変動を示す区間とともに、平均軌道とみなすことができる。軌道成分は、時系列データの低周波数成分を特徴付ける。
An example of a trajectory component of a universal feature is shown in FIG. 2B. The trajectory component is represented as a vector of length 2w and includes a moving
ほとんどの従来技術による方法が、起動後にある定常状態202に達したシステムの確率論的挙動にしか関心を有しないことに留意すべきである。対照的に、本発明者らは、過渡的状態203にも関心を有する。
It should be noted that most prior art methods are only interested in the stochastic behavior of the system that has reached
確率変動成分
時系列の確率変動成分は、不規則過程に起因する可能性が最も高い、時系列データにおける変動を示す。普遍的特徴の確率変動成分は、時系列データの時間ウィンドウにわたって、各統計の標準偏差とともに求められた様々な統計を含む。統計は、N要素ベクトルとして記憶される。ここで、Nは、計算される統計の数である。各統計の標準偏差が、別のN要素ベクトルとして記憶され、合計2N個の要素となる。好ましい実施の形態では、確率変動成分の統計は、
i.平均、
ii.標準偏差、
iii.第1の差分、例えば
![]()
iv.平均値交差数、
v.第1の差分における正の値のパーセンテージ、
vi.第1の差分におけるゼロ値のパーセンテージ、および
vii.正の差分の平均ラン長、
を含む。
Probability variation component The time-series probability variation component indicates the variation in the time-series data that is most likely due to an irregular process. The probability variation component of the universal feature includes various statistics determined along with the standard deviation of each statistic over the time window of the time series data. Statistics are stored as N element vectors. Where N is the number of statistics calculated. The standard deviation of each statistic is stored as a separate N element vector, for a total of 2N elements. In a preferred embodiment, the statistics of the probability variation component are
i. average,
ii. standard deviation,
iii. The first difference, eg
![]()
iv. Average number of intersections,
v. A percentage of the positive value in the first difference,
vi. The percentage of zero values in the first difference, and vii. Average run length of positive differences,
including.
図3は、対応する普遍的特徴の軌道成分が重ねられた混成型時系列データを示している。 FIG. 3 shows mixed time series data in which the trajectory components of the corresponding universal features are superimposed.
トレーニング
図4に示すようなトレーニング中、時系列のトレーニングデータ101から普遍的特徴411が抽出される(410)。トレーニングデータは、正常な時系列データのみを含むべきである。これは、時系列を長さwの重なり合う時間ウィンドウに分割することによって行われる。関連付けられた標準偏差を有しない普遍的特徴が、時間ウィンドウごとに求められる。
Training During training as shown in FIG. 4,
次に、類似した普遍的特徴のクラスター421が求められる(420)。クラスターごとに、上記で説明したように、軌道の時間ステップごとの標準偏差および各統計の標準偏差431が求められ、クラスターごとの普遍的特徴が形成される(430)。次に、クラスターの普遍的特徴が収集され、時系列データを特徴付ける単一組の普遍的特徴111にされる(440)。
Next, a
試験
図5に示すような試験中、試験時系列データ102において、異常130が以下のように検出される。試験時系列はトレーニング中、長さwの重なり合う時間ウィンドウに分割される(510)。関連付けられた標準偏差を有しない普遍的特徴511が、時間ウィンドウごとに求められる。次に、普遍的特徴は、トレーニング用の普遍的特徴と比較され、最も類似した特徴が求められる(520)。この比較は、以下に説明される距離メトリックを用いる。
Test During the test as shown in FIG. 5, the abnormality 130 is detected in the test
距離メトリック
標準偏差を含む、クラスターのトレーニング用の普遍的特徴fv1と、標準偏差を含まない、試験データ内の単一の時間ウィンドウの普遍的特徴fv2との間の距離が、以下の式に従って求められる。
Distance metric The distance between the universal feature fv1 for training the cluster, including the standard deviation, and the universal feature fv2 of the single time window in the test data, not including the standard deviation, is determined according to the following equation: It is done.

ここで、Iμ1は、fv1の軌道成分であり、Iσ1は、fv1の軌道成分の標準偏差のベクトルであり、m1は、fv1の統計のベクトルであり、s1は、fv1の統計の標準偏差のベクトルである。同様に、μ2は、単一の時間ウィンドウfv2の普遍的特徴の軌道成分であり、m2は、fv2の統計のベクトルである。 Where Iμ 1 is the orbital component of fv1, Iσ 1 is the vector of the standard deviation of the orbital component of fv1, m 1 is the statistical vector of fv1, and s 1 is the statistical vector of fv1 Standard deviation vector. Similarly, μ 2 is a trajectory component of a universal feature of a single time window fv2, and m 2 is a statistical vector of fv2.
この定式は、fv1の平均軌道の3標準偏差(3シグマ)外側からのfv2の距離と、fv1の各特徴統計の3標準偏差(3シグマ)外側からの距離とを加えたものを測定する。 This formula measures the distance of fv2 from the outside of 3 standard deviations (3 sigma) of the average trajectory of fv1 and the distance from the outside of 3 standard deviations (3 sigma) of each feature statistic of fv1.
試験用の普遍的特徴とトレーニング用の普遍的特徴との間のそのような距離の最小距離は、その時間ウィンドウの異常スコア521である。異常スコアが、ある閾値430よりも高い場合、試験時間ウィンドウは、異常動作と関連付けられる。
The minimum such distance between the test universal feature and the training universal feature is the
Claims (6)
前記時系列データを分割するステップであって、重なり合ってスライドする時間ウィンドウにするステップと、
前記時間ウィンドウごとの特徴を求めるステップと、
類似したウィンドウの特徴をクラスター化するステップであって、普遍的特徴を得るステップと
を含み、
前記普遍的特徴は、確率変動成分を含み、前記確率変動成分の統計は、平均、標準偏差、第1の差分の絶対値の平均、平均値交差数、前記第1の差分における正の値のパーセンテージ、前記第1の差分におけるゼロ値のパーセンテージ、および前記時間ウィンドウ内の前記時系列データの正の差分の平均ラン長、並びに前記統計の標準偏差を含み、
試験時系列データから抽出された前記普遍的特徴をトレーニング時系列データから取得された前記普遍的特徴と比較するステップであって、スコアを求め、前記普遍的特徴は、前記時系列データの軌道成分と、前記時系列データの確率変動成分とを特徴付ける、ステップと、
スコアが閾値よりも高い場合、異常を検出するステップと
を含み、前記ステップは、プロセッサにおいて実行される、時系列データにおいて異常を検出する方法。 A method for detecting anomalies in time series data,
Dividing the time series data into a time window that slides overlapping;
Determining a feature for each time window;
Clustering similar window features, obtaining universal features;
Including
The universal feature includes a probability variation component, and the statistics of the probability variation component include an average, a standard deviation, an average of the absolute value of the first difference, an average number of intersections, and a positive value in the first difference. A percentage, a percentage of zero values in the first difference, and an average run length of positive differences in the time series data within the time window, and a standard deviation of the statistics,
The obtained the universal features extracted from the test time series data from the training time series data comprising the steps of: comparing a universal characteristic, it obtains a score, the universal characteristic, orbital component of the time-series data And characterizing the probability variation component of the time series data; and
A method of detecting an abnormality in time-series data, wherein the step is executed in a processor.
Applications Claiming Priority (2)
| Application Number | Priority Date | Filing Date | Title |
|---|---|---|---|
| US13/932,238 | 2013-07-01 | ||
| US13/932,238 US9146800B2 (en) | 2013-07-01 | 2013-07-01 | Method for detecting anomalies in a time series data with trajectory and stochastic components |
Publications (3)
| Publication Number | Publication Date |
|---|---|
| JP2015011027A JP2015011027A (en) | 2015-01-19 |
| JP2015011027A5 JP2015011027A5 (en) | 2017-04-13 |
| JP6141235B2 true JP6141235B2 (en) | 2017-06-07 |
Family
ID=52116917
Family Applications (1)
| Application Number | Title | Priority Date | Filing Date |
|---|---|---|---|
| JP2014124072A Active JP6141235B2 (en) | 2013-07-01 | 2014-06-17 | How to detect anomalies in time series data |
Country Status (2)
| Country | Link |
|---|---|
| US (1) | US9146800B2 (en) |
| JP (1) | JP6141235B2 (en) |
Families Citing this family (13)
| Publication number | Priority date | Publication date | Assignee | Title |
|---|---|---|---|---|
| US9779361B2 (en) * | 2014-06-05 | 2017-10-03 | Mitsubishi Electric Research Laboratories, Inc. | Method for learning exemplars for anomaly detection |
| JP6313730B2 (en) * | 2015-04-10 | 2018-04-18 | タタ コンサルタンシー サービシズ リミテッドTATA Consultancy Services Limited | Anomaly detection system and method |
| SG11201710646TA (en) * | 2015-08-06 | 2018-01-30 | Ns Solutions Corp | Information processing apparatus, information processing system, information processing method and program |
| US9892012B2 (en) * | 2015-12-30 | 2018-02-13 | International Business Machines Corporation | Detecting anomalous sensors |
| EP3407198A1 (en) | 2017-05-22 | 2018-11-28 | Siemens Aktiengesellschaft | System, device and method for frozen period detection in sensor datasets |
| US10699040B2 (en) * | 2017-08-07 | 2020-06-30 | The Boeing Company | System and method for remaining useful life determination |
| KR102017561B1 (en) * | 2017-08-10 | 2019-09-05 | 울랄라랩 주식회사 | Algorithm and method for detecting error data of machine based on machine-learning technique |
| US10713270B2 (en) * | 2017-12-20 | 2020-07-14 | Sap Se | Emerging issue detection and analysis |
| CN108460118A (en) * | 2018-02-13 | 2018-08-28 | 清华大学 | Time series data restorative procedure based on neighbour and device |
| CN113574358B (en) | 2019-03-18 | 2022-09-20 | 三菱电机株式会社 | Abnormality detection device and abnormality detection method |
| US11392469B2 (en) * | 2019-06-20 | 2022-07-19 | Microsoft Technology Licensing, Llc | Framework for testing machine learning workflows |
| US11748632B2 (en) | 2019-10-30 | 2023-09-05 | Sensai Networks Ltd | Analysis of anomalies in a facility |
| KR102325629B1 (en) * | 2020-09-18 | 2021-11-11 | 국민대학교산학협력단 | Anomaly detecting method and anomaly detecting apparatus |
Family Cites Families (16)
| Publication number | Priority date | Publication date | Assignee | Title |
|---|---|---|---|---|
| JPH06129955A (en) * | 1992-10-14 | 1994-05-13 | Hitachi Ltd | System for diagnosing soundness of rotary equipment |
| JP3179969B2 (en) * | 1994-07-28 | 2001-06-25 | 松下電器産業株式会社 | Vibration analysis method |
| KR0145146B1 (en) * | 1994-12-01 | 1998-08-17 | 장문현 | Diagnosis of rotating machines by utilizing a back propagation neural network |
| JP2002181038A (en) * | 2000-12-18 | 2002-06-26 | Mitsubishi Heavy Ind Ltd | Abnormality diagnosis device |
| US7539597B2 (en) | 2001-04-10 | 2009-05-26 | Smartsignal Corporation | Diagnostic systems and methods for predictive condition monitoring |
| EP1818746A1 (en) | 2006-02-10 | 2007-08-15 | ALSTOM Technology Ltd | Method of condition monitoring |
| WO2007100916A2 (en) * | 2006-02-28 | 2007-09-07 | The Trustees Of Columbia University In The City Of New York | Systems, methods, and media for outputting a dataset based upon anomaly detection |
| US7716011B2 (en) | 2007-02-28 | 2010-05-11 | Microsoft Corporation | Strategies for identifying anomalies in time-series data |
| US7774655B2 (en) * | 2007-03-16 | 2010-08-10 | Xerox Corporation | Method and system for retrieving time series data |
| US8090592B1 (en) * | 2007-10-31 | 2012-01-03 | At&T Intellectual Property I, L.P. | Method and apparatus for multi-domain anomaly pattern definition and detection |
| JP2011145846A (en) | 2010-01-14 | 2011-07-28 | Hitachi Ltd | Anomaly detection method, anomaly detection system and anomaly detection program |
| US8800036B2 (en) * | 2010-01-22 | 2014-08-05 | The School Of Electrical Engineering And Computer Science (Seecs), National University Of Sciences And Technology (Nust) | Method and system for adaptive anomaly-based intrusion detection |
| EP2469496A1 (en) * | 2010-12-23 | 2012-06-27 | Fraunhofer-Gesellschaft zur Förderung der angewandten Forschung e.V. | Concept for encoding data defining coded positions representing a trajectory of an object |
| US9218232B2 (en) * | 2011-04-13 | 2015-12-22 | Bar-Ilan University | Anomaly detection methods, devices and systems |
| US8825567B2 (en) * | 2012-02-08 | 2014-09-02 | General Electric Company | Fault prediction of monitored assets |
| US9075713B2 (en) * | 2012-05-24 | 2015-07-07 | Mitsubishi Electric Research Laboratories, Inc. | Method for detecting anomalies in multivariate time series data |
-
2013
- 2013-07-01 US US13/932,238 patent/US9146800B2/en active Active
-
2014
- 2014-06-17 JP JP2014124072A patent/JP6141235B2/en active Active
Also Published As
| Publication number | Publication date |
|---|---|
| US9146800B2 (en) | 2015-09-29 |
| JP2015011027A (en) | 2015-01-19 |
| US20150006972A1 (en) | 2015-01-01 |
Similar Documents
| Publication | Publication Date | Title |
|---|---|---|
| JP6141235B2 (en) | How to detect anomalies in time series data | |
| Wang et al. | A two-stage data-driven-based prognostic approach for bearing degradation problem | |
| US10914608B2 (en) | Data analytic engine towards the self-management of complex physical systems | |
| CN106104496B (en) | The abnormality detection not being subjected to supervision for arbitrary sequence | |
| AU2018201487B2 (en) | Method and system for health monitoring and fault signature identification | |
| WO2017154844A1 (en) | Analysis device, analysis method, and analysis program | |
| Jablonski et al. | Modeling of probability distribution functions for automatic threshold calculation in condition monitoring systems | |
| US20130060524A1 (en) | Machine Anomaly Detection and Diagnosis Incorporating Operational Data | |
| US9208209B1 (en) | Techniques for monitoring transformation techniques using control charts | |
| US20120310597A1 (en) | Failure cause diagnosis system and method | |
| US10565080B2 (en) | Discriminative hidden kalman filters for classification of streaming sensor data in condition monitoring | |
| Frank et al. | A performance evaluation framework for building fault detection and diagnosis algorithms | |
| WO2016093960A1 (en) | Method for creating an intelligent energy kpi system | |
| US20200143292A1 (en) | Signature enhancement for deviation measurement-based classification of a detected anomaly in an industrial asset | |
| US8560279B2 (en) | Method of determining the influence of a variable in a phenomenon | |
| JPWO2013105164A1 (en) | Abnormal signal determination device, abnormal signal determination method, and abnormal signal determination program | |
| US20140188777A1 (en) | Methods and systems for identifying a precursor to a failure of a component in a physical system | |
| Xu et al. | A lof-based method for abnormal segment detection in machinery condition monitoring | |
| Sharafi et al. | Identifying the time of step change in binary profiles | |
| JP5771317B1 (en) | Abnormality diagnosis apparatus and abnormality diagnosis method | |
| US10360249B2 (en) | System and method for creation and detection of process fingerprints for monitoring in a process plant | |
| US20220147034A1 (en) | Automated refinement of a labeled window of time series data | |
| Salvador et al. | Online detection of shutdown periods in chemical plants: A case study | |
| Chang et al. | Real-time detection of wave profile changes | |
| US20230297095A1 (en) | Monitoring device and method for detecting anomalies |
Legal Events
| Date | Code | Title | Description |
|---|---|---|---|
| A521 | Request for written amendment filed |
Free format text: JAPANESE INTERMEDIATE CODE: A523 Effective date: 20170308 |
|
| A621 | Written request for application examination |
Free format text: JAPANESE INTERMEDIATE CODE: A621 Effective date: 20170308 |
|
| A871 | Explanation of circumstances concerning accelerated examination |
Free format text: JAPANESE INTERMEDIATE CODE: A871 Effective date: 20170308 |
|
| TRDD | Decision of grant or rejection written | ||
| A975 | Report on accelerated examination |
Free format text: JAPANESE INTERMEDIATE CODE: A971005 Effective date: 20170330 |
|
| A01 | Written decision to grant a patent or to grant a registration (utility model) |
Free format text: JAPANESE INTERMEDIATE CODE: A01 Effective date: 20170404 |
|
| A61 | First payment of annual fees (during grant procedure) |
Free format text: JAPANESE INTERMEDIATE CODE: A61 Effective date: 20170502 |
|
| R150 | Certificate of patent or registration of utility model |
Ref document number: 6141235 Country of ref document: JP Free format text: JAPANESE INTERMEDIATE CODE: R150 |
|
| R250 | Receipt of annual fees |
Free format text: JAPANESE INTERMEDIATE CODE: R250 |
|
| R250 | Receipt of annual fees |
Free format text: JAPANESE INTERMEDIATE CODE: R250 |
|
| R250 | Receipt of annual fees |
Free format text: JAPANESE INTERMEDIATE CODE: R250 |
|
| R250 | Receipt of annual fees |
Free format text: JAPANESE INTERMEDIATE CODE: R250 |
|
| R250 | Receipt of annual fees |
Free format text: JAPANESE INTERMEDIATE CODE: R250 |