JP6022456B2 - Method and system for determining the decay constant of a time domain signal - Google Patents
Method and system for determining the decay constant of a time domain signal Download PDFInfo
- Publication number
- JP6022456B2 JP6022456B2 JP2013524308A JP2013524308A JP6022456B2 JP 6022456 B2 JP6022456 B2 JP 6022456B2 JP 2013524308 A JP2013524308 A JP 2013524308A JP 2013524308 A JP2013524308 A JP 2013524308A JP 6022456 B2 JP6022456 B2 JP 6022456B2
- Authority
- JP
- Japan
- Prior art keywords
- signal
- time domain
- fourier transform
- local oscillator
- frequency
- Prior art date
- Legal status (The legal status is an assumption and is not a legal conclusion. Google has not performed a legal analysis and makes no representation as to the accuracy of the status listed.)
- Active
Links
- 238000000034 method Methods 0.000 title claims description 99
- 238000002835 absorbance Methods 0.000 claims description 59
- 230000003287 optical effect Effects 0.000 claims description 28
- 238000002156 mixing Methods 0.000 claims description 8
- 230000005284 excitation Effects 0.000 claims description 4
- 230000003796 beauty Effects 0.000 claims 1
- 238000001514 detection method Methods 0.000 description 35
- 241000894007 species Species 0.000 description 34
- 238000001228 spectrum Methods 0.000 description 34
- 238000000862 absorption spectrum Methods 0.000 description 32
- 238000004458 analytical method Methods 0.000 description 32
- 230000002238 attenuated effect Effects 0.000 description 32
- 238000006243 chemical reaction Methods 0.000 description 28
- 238000000180 cavity ring-down spectroscopy Methods 0.000 description 24
- 238000005033 Fourier transform infrared spectroscopy Methods 0.000 description 22
- 238000005259 measurement Methods 0.000 description 21
- 238000010521 absorption reaction Methods 0.000 description 14
- 238000004891 communication Methods 0.000 description 10
- 238000004364 calculation method Methods 0.000 description 9
- 238000011088 calibration curve Methods 0.000 description 9
- 230000001419 dependent effect Effects 0.000 description 9
- 230000008901 benefit Effects 0.000 description 8
- 238000007796 conventional method Methods 0.000 description 8
- 239000007789 gas Substances 0.000 description 7
- 230000003595 spectral effect Effects 0.000 description 7
- WPYMKLBDIGXBTP-UHFFFAOYSA-N benzoic acid Chemical compound OC(=O)C1=CC=CC=C1 WPYMKLBDIGXBTP-UHFFFAOYSA-N 0.000 description 6
- 239000002131 composite material Substances 0.000 description 6
- 238000006073 displacement reaction Methods 0.000 description 6
- 238000012544 monitoring process Methods 0.000 description 6
- 238000012545 processing Methods 0.000 description 6
- 230000008569 process Effects 0.000 description 5
- 230000036962 time dependent Effects 0.000 description 5
- 238000013459 approach Methods 0.000 description 4
- 230000008859 change Effects 0.000 description 4
- 238000001914 filtration Methods 0.000 description 4
- 238000005070 sampling Methods 0.000 description 4
- 238000004611 spectroscopical analysis Methods 0.000 description 4
- 239000005711 Benzoic acid Substances 0.000 description 3
- 235000010233 benzoic acid Nutrition 0.000 description 3
- 230000008878 coupling Effects 0.000 description 3
- 238000010168 coupling process Methods 0.000 description 3
- 238000005859 coupling reaction Methods 0.000 description 3
- 239000000284 extract Substances 0.000 description 3
- 238000004949 mass spectrometry Methods 0.000 description 3
- 239000011159 matrix material Substances 0.000 description 3
- 239000000203 mixture Substances 0.000 description 3
- 239000013307 optical fiber Substances 0.000 description 3
- 230000000737 periodic effect Effects 0.000 description 3
- 230000002829 reductive effect Effects 0.000 description 3
- 230000002123 temporal effect Effects 0.000 description 3
- QGZKDVFQNNGYKY-UHFFFAOYSA-N Ammonia Chemical compound N QGZKDVFQNNGYKY-UHFFFAOYSA-N 0.000 description 2
- LFQSCWFLJHTTHZ-UHFFFAOYSA-N Ethanol Chemical compound CCO LFQSCWFLJHTTHZ-UHFFFAOYSA-N 0.000 description 2
- 238000001157 Fourier transform infrared spectrum Methods 0.000 description 2
- 239000006096 absorbing agent Substances 0.000 description 2
- 238000004847 absorption spectroscopy Methods 0.000 description 2
- 238000009825 accumulation Methods 0.000 description 2
- 238000005314 correlation function Methods 0.000 description 2
- 238000007405 data analysis Methods 0.000 description 2
- 230000007423 decrease Effects 0.000 description 2
- 238000010586 diagram Methods 0.000 description 2
- 239000012535 impurity Substances 0.000 description 2
- 239000000463 material Substances 0.000 description 2
- 230000002085 persistent effect Effects 0.000 description 2
- 238000000513 principal component analysis Methods 0.000 description 2
- 238000002310 reflectometry Methods 0.000 description 2
- 239000000126 substance Substances 0.000 description 2
- 238000006467 substitution reaction Methods 0.000 description 2
- 238000012360 testing method Methods 0.000 description 2
- 238000012935 Averaging Methods 0.000 description 1
- 241000894006 Bacteria Species 0.000 description 1
- OKTJSMMVPCPJKN-UHFFFAOYSA-N Carbon Chemical compound [C] OKTJSMMVPCPJKN-UHFFFAOYSA-N 0.000 description 1
- OKTJSMMVPCPJKN-IGMARMGPSA-N Carbon-12 Chemical compound [12C] OKTJSMMVPCPJKN-IGMARMGPSA-N 0.000 description 1
- 206010028980 Neoplasm Diseases 0.000 description 1
- 238000011481 absorbance measurement Methods 0.000 description 1
- 230000002745 absorbent Effects 0.000 description 1
- 239000002250 absorbent Substances 0.000 description 1
- 239000011358 absorbing material Substances 0.000 description 1
- 229910021529 ammonia Inorganic materials 0.000 description 1
- 239000012491 analyte Substances 0.000 description 1
- QVGXLLKOCUKJST-UHFFFAOYSA-N atomic oxygen Chemical compound [O] QVGXLLKOCUKJST-UHFFFAOYSA-N 0.000 description 1
- 230000005540 biological transmission Effects 0.000 description 1
- 230000015572 biosynthetic process Effects 0.000 description 1
- 238000004422 calculation algorithm Methods 0.000 description 1
- 150000001722 carbon compounds Chemical class 0.000 description 1
- 230000015556 catabolic process Effects 0.000 description 1
- 239000013626 chemical specie Substances 0.000 description 1
- 238000002485 combustion reaction Methods 0.000 description 1
- 150000001875 compounds Chemical class 0.000 description 1
- 239000000470 constituent Substances 0.000 description 1
- 238000013016 damping Methods 0.000 description 1
- 230000007850 degeneration Effects 0.000 description 1
- 238000006731 degradation reaction Methods 0.000 description 1
- 230000037213 diet Effects 0.000 description 1
- 235000005911 diet Nutrition 0.000 description 1
- 238000010252 digital analysis Methods 0.000 description 1
- 239000003814 drug Substances 0.000 description 1
- 230000000694 effects Effects 0.000 description 1
- 238000000295 emission spectrum Methods 0.000 description 1
- 230000007613 environmental effect Effects 0.000 description 1
- 229910002804 graphite Inorganic materials 0.000 description 1
- 239000010439 graphite Substances 0.000 description 1
- 230000006872 improvement Effects 0.000 description 1
- 230000002452 interceptive effect Effects 0.000 description 1
- 230000000155 isotopic effect Effects 0.000 description 1
- 230000000670 limiting effect Effects 0.000 description 1
- 238000012886 linear function Methods 0.000 description 1
- 238000010295 mobile communication Methods 0.000 description 1
- 229910052760 oxygen Inorganic materials 0.000 description 1
- 239000001301 oxygen Substances 0.000 description 1
- 238000003909 pattern recognition Methods 0.000 description 1
- 239000008188 pellet Substances 0.000 description 1
- 239000003348 petrochemical agent Substances 0.000 description 1
- 230000005855 radiation Effects 0.000 description 1
- 238000010223 real-time analysis Methods 0.000 description 1
- 230000009467 reduction Effects 0.000 description 1
- 230000004044 response Effects 0.000 description 1
- 230000002441 reversible effect Effects 0.000 description 1
- 230000035945 sensitivity Effects 0.000 description 1
- 238000000926 separation method Methods 0.000 description 1
- 238000010183 spectrum analysis Methods 0.000 description 1
- 238000012549 training Methods 0.000 description 1
- 230000009466 transformation Effects 0.000 description 1
- 230000001131 transforming effect Effects 0.000 description 1
- 230000000007 visual effect Effects 0.000 description 1
Images


Classifications
-
- G—PHYSICS
- G01—MEASURING; TESTING
- G01N—INVESTIGATING OR ANALYSING MATERIALS BY DETERMINING THEIR CHEMICAL OR PHYSICAL PROPERTIES
- G01N21/00—Investigating or analysing materials by the use of optical means, i.e. using sub-millimetre waves, infrared, visible or ultraviolet light
- G01N21/17—Systems in which incident light is modified in accordance with the properties of the material investigated
- G01N21/59—Transmissivity
-
- G—PHYSICS
- G01—MEASURING; TESTING
- G01J—MEASUREMENT OF INTENSITY, VELOCITY, SPECTRAL CONTENT, POLARISATION, PHASE OR PULSE CHARACTERISTICS OF INFRARED, VISIBLE OR ULTRAVIOLET LIGHT; COLORIMETRY; RADIATION PYROMETRY
- G01J3/00—Spectrometry; Spectrophotometry; Monochromators; Measuring colours
- G01J3/28—Investigating the spectrum
- G01J3/42—Absorption spectrometry; Double beam spectrometry; Flicker spectrometry; Reflection spectrometry
- G01J3/433—Modulation spectrometry; Derivative spectrometry
- G01J3/4338—Frequency modulated spectrometry
-
- G—PHYSICS
- G01—MEASURING; TESTING
- G01J—MEASUREMENT OF INTENSITY, VELOCITY, SPECTRAL CONTENT, POLARISATION, PHASE OR PULSE CHARACTERISTICS OF INFRARED, VISIBLE OR ULTRAVIOLET LIGHT; COLORIMETRY; RADIATION PYROMETRY
- G01J3/00—Spectrometry; Spectrophotometry; Monochromators; Measuring colours
- G01J3/28—Investigating the spectrum
- G01J3/45—Interferometric spectrometry
-
- G—PHYSICS
- G01—MEASURING; TESTING
- G01N—INVESTIGATING OR ANALYSING MATERIALS BY DETERMINING THEIR CHEMICAL OR PHYSICAL PROPERTIES
- G01N21/00—Investigating or analysing materials by the use of optical means, i.e. using sub-millimetre waves, infrared, visible or ultraviolet light
- G01N21/17—Systems in which incident light is modified in accordance with the properties of the material investigated
- G01N21/25—Colour; Spectral properties, i.e. comparison of effect of material on the light at two or more different wavelengths or wavelength bands
- G01N21/31—Investigating relative effect of material at wavelengths characteristic of specific elements or molecules, e.g. atomic absorption spectrometry
-
- G—PHYSICS
- G01—MEASURING; TESTING
- G01N—INVESTIGATING OR ANALYSING MATERIALS BY DETERMINING THEIR CHEMICAL OR PHYSICAL PROPERTIES
- G01N21/00—Investigating or analysing materials by the use of optical means, i.e. using sub-millimetre waves, infrared, visible or ultraviolet light
- G01N21/17—Systems in which incident light is modified in accordance with the properties of the material investigated
- G01N21/59—Transmissivity
- G01N21/61—Non-dispersive gas analysers
-
- G—PHYSICS
- G06—COMPUTING; CALCULATING OR COUNTING
- G06F—ELECTRIC DIGITAL DATA PROCESSING
- G06F17/00—Digital computing or data processing equipment or methods, specially adapted for specific functions
-
- G—PHYSICS
- G01—MEASURING; TESTING
- G01N—INVESTIGATING OR ANALYSING MATERIALS BY DETERMINING THEIR CHEMICAL OR PHYSICAL PROPERTIES
- G01N21/00—Investigating or analysing materials by the use of optical means, i.e. using sub-millimetre waves, infrared, visible or ultraviolet light
- G01N21/17—Systems in which incident light is modified in accordance with the properties of the material investigated
- G01N21/25—Colour; Spectral properties, i.e. comparison of effect of material on the light at two or more different wavelengths or wavelength bands
- G01N21/31—Investigating relative effect of material at wavelengths characteristic of specific elements or molecules, e.g. atomic absorption spectrometry
- G01N21/35—Investigating relative effect of material at wavelengths characteristic of specific elements or molecules, e.g. atomic absorption spectrometry using infrared light
- G01N2021/3595—Investigating relative effect of material at wavelengths characteristic of specific elements or molecules, e.g. atomic absorption spectrometry using infrared light using FTIR
-
- G—PHYSICS
- G01—MEASURING; TESTING
- G01N—INVESTIGATING OR ANALYSING MATERIALS BY DETERMINING THEIR CHEMICAL OR PHYSICAL PROPERTIES
- G01N21/00—Investigating or analysing materials by the use of optical means, i.e. using sub-millimetre waves, infrared, visible or ultraviolet light
- G01N21/17—Systems in which incident light is modified in accordance with the properties of the material investigated
- G01N21/25—Colour; Spectral properties, i.e. comparison of effect of material on the light at two or more different wavelengths or wavelength bands
- G01N21/31—Investigating relative effect of material at wavelengths characteristic of specific elements or molecules, e.g. atomic absorption spectrometry
- G01N21/39—Investigating relative effect of material at wavelengths characteristic of specific elements or molecules, e.g. atomic absorption spectrometry using tunable lasers
Landscapes
- Physics & Mathematics (AREA)
- Spectroscopy & Molecular Physics (AREA)
- General Physics & Mathematics (AREA)
- Pathology (AREA)
- Chemical & Material Sciences (AREA)
- Analytical Chemistry (AREA)
- Biochemistry (AREA)
- General Health & Medical Sciences (AREA)
- Immunology (AREA)
- Health & Medical Sciences (AREA)
- Life Sciences & Earth Sciences (AREA)
- Engineering & Computer Science (AREA)
- Theoretical Computer Science (AREA)
- Data Mining & Analysis (AREA)
- Mathematical Physics (AREA)
- Software Systems (AREA)
- General Engineering & Computer Science (AREA)
- Databases & Information Systems (AREA)
- Investigating Or Analysing Materials By Optical Means (AREA)
- Spectrometry And Color Measurement (AREA)
Description
本発明は、信号を分析する検出スキームに関し、詳しくは、光吸収度信号を分析するデジタル検出スキームに関する。 The present invention relates to detection schemes for analyzing signals, and in particular to digital detection schemes for analyzing light absorbance signals.
本発明は、主に、リアルタイムで光吸収度信号を分析するデジタル検出スキームとして使用するべく開発され、本願を参照して以下に記載される。しかしながら、本発明はこの特定分野での使用に限定されるわけではない。 The present invention was developed primarily for use as a digital detection scheme for analyzing light absorbance signals in real time and is described below with reference to this application. However, the present invention is not limited to use in this particular field.
本明細書全体にわたる背景技術の議論は、かかる背景技術が従来技術であることを認めるもの、又はかかる背景技術が周知であること若しくは当該分野における共有の一般的知識の一部であることを認めるものとみなしてはならない。 Background discussion throughout this specification acknowledges that such background art is prior art, or acknowledges that such background art is well known or part of the common general knowledge in the field. Do not consider it as a thing.
吸収分光法が、化学種を定性的及び定量的に特定するべく広く使用されている。興味種が固有の吸収フィーチャを有する場合、吸収体をリアルタイムでモニタリングすることは、単数の周波数における又は単数の吸収帯域にわたる吸収度を測定するだけで達成することができる。しかしながら、同じ周波数の光を吸収する不純物が存在することが多い。その結果、不純物サンプルのリアルタイム分光分析は、所定範囲の波長にわたって吸収度データを蓄積することを必要とする。 Absorption spectroscopy is widely used to identify chemical species qualitatively and quantitatively. If the species of interest has unique absorption features, real-time monitoring of the absorber can be accomplished by simply measuring the absorbance at a single frequency or over a single absorption band. However, there are often impurities that absorb light of the same frequency. As a result, real-time spectroscopic analysis of impurity samples requires the accumulation of absorbance data over a predetermined range of wavelengths.
残念ながら、このアプローチは、複合的な吸収度データから迅速に情報を抽出する能力によって邪魔されるのが一般的である。 Unfortunately, this approach is generally hampered by the ability to quickly extract information from complex absorbance data.
したがって、リアルタイムで又は現行の分光分析システムよりも少なくとも有意に速く、時間変動吸収度信号から吸収度情報を抽出する復調法が求められている。 Accordingly, there is a need for a demodulation method that extracts absorbance information from a time-varying absorbance signal in real time or at least significantly faster than current spectroscopic analysis systems.
以下の定義は一般的定義として与えられ、本発明の範囲を当該用語のみに限定するべきものではないが、以下の記載の良好な理解のために列挙する。 The following definitions are given as general definitions, and the scope of the present invention should not be limited only to the terms, but is listed for a better understanding of the following description.
そうでないことが定義されない限り、ここで使用される技術的及び化学的用語はすべて、本発明の属する分野における当業者が共通して理解するものと同じ意味を有する。本発明の目的のため、次の用語を以下に定義する。 Unless defined otherwise, all technical and chemical terms used herein have the same meaning as commonly understood by one of ordinary skill in the art to which this invention belongs. For purposes of the present invention, the following terms are defined below.
冠詞「一つの」及び「一の」は、ここでは、冠詞の文法的目的の一つ又は一つを超えるもの(すなわち少なくとも一つ)を言及するべく使用される。例えば「一つの要素」は、一つの要素又は一つを超える要素を言及する。 The articles “one” and “one” are used herein to refer to one or more (ie, at least one) of the grammatical purposes of the article. For example, “an element” refers to one element or more than one element.
用語「約」は、ここでは、参照量の30%程度、好ましくは20%程度、及びより好ましくは10%程度だけ変動する量を言及するべく使用される。 The term “about” is used herein to refer to an amount that varies by as much as 30%, preferably by as much as 20%, and more preferably by as much as 10% of the reference amount.
本明細書全体を通じ、文脈がそうでない旨を必要としない限り、用語「含む」は、記載の一のステップ若しくは要素又は複数のステップ若しくは要素のグループを含むが他のいずれのステップ若しくは要素又は複数のステップ若しくは要素のグループを除外するわけではないことを意味するものと理解される。 Throughout this specification, unless the context requires otherwise, the term “comprising” includes the stated step or element or steps or groups of elements, but any other step or element or elements. Is not meant to exclude a step or group of elements.
用語「リアルタイム」、例えば「リアルタイムでデータを表示する」とは、当該システムの処理制限及び当該データを正確に測定するのに必要な時間を仮定した上での、意図的な遅延なしの当該データの表示を言及する。同様に、「信号をリアルタイムで分析する」というフレーズは、当該システムの処理制限及び当該信号を正確に分析して当該分析の出力を提示するのに必要な時間を仮定した上での、意図的な遅延なしの信号の分析及び当該信号を代表するデータの提示又は出力を言及する。 The term “real time”, eg “display data in real time” means that the data without intentional delay, assuming the processing limitations of the system and the time required to accurately measure the data. Refers to the display. Similarly, the phrase “analyze the signal in real time” is the intentional assumption of the processing limitations of the system and the time required to accurately analyze the signal and present the output of the analysis. Refers to the analysis of a signal without any delay and the presentation or output of data representative of the signal.
第1側面によれば、一の時間減衰信号を分析する方法が与えられる。本方法は、一の混合器において、当該時間減衰信号を、一の局所振動子発生器(又は変調器)からの一の局所振動子信号(又は変調信号)出力と混合することを含む。当該時間減衰信号を当該局所振動子信号と混合することにより、一のフーリエ変換時間減衰信号を生成する混合信号が得られる。当該フーリエ変換時間減衰信号は、当該局所振動子信号の基本周波数における一の基本変換時間減衰信号を含む。当該フーリエ変換時間減衰信号はまた、複数の周波数成分を有する複数の変換時間減衰信号も含む。当該周波数成分の少なくともいくつかは、当該局所振動子信号及び当該興味時間減衰信号双方に共通である。他の構成においては、当該混合信号の周波数成分すべてが当該局所振動子及び当該時間減衰信号双方に共通である。本方法はさらに、当該基本周波数における、及び当該基本周波数以外の一の周波数における各変換時間減衰信号の大きさを決定することを含む。 According to a first aspect, a method for analyzing a time decay signal is provided. The method includes, in one mixer, mixing the time decay signal with one local oscillator signal (or modulation signal) output from one local oscillator generator (or modulator). By mixing the time decay signal with the local oscillator signal, a mixed signal that generates one Fourier transform time decay signal is obtained. The Fourier transform time decay signal includes one fundamental transform time decay signal at the fundamental frequency of the local transducer signal. The Fourier transform time decay signal also includes a plurality of transform time decay signals having a plurality of frequency components. At least some of the frequency components are common to both the local oscillator signal and the time-of-interest decay signal. In other configurations, all the frequency components of the mixed signal are common to both the local oscillator and the time decay signal. The method further includes determining the magnitude of each conversion time attenuated signal at the fundamental frequency and at one frequency other than the fundamental frequency.
第1側面の一構成において、一の時間減衰信号を分析する方法が与えられる。本方法は、一の混合器において、当該時間減衰信号を、一の局所振動子発生器が生成する一の局所振動子信号と混合し、一のフーリエ変換時間減衰信号を生成する混合信号であって、当該局所振動子信号の基本周波数における一の基本変換時間減衰信号、及び複数の周波数における複数の変換時間減衰信号を含む混合信号を得ることと、
当該基本周波数における、及び当該基本周波数以外の一の周波数における当該変換時間減衰信号それぞれの大きさを決定することとを含む。
In one configuration of the first aspect, a method for analyzing a time decay signal is provided. This method is a mixed signal that, in one mixer, mixes the time attenuated signal with one local oscillator signal generated by one local oscillator generator to generate one Fourier transform time attenuated signal. Obtaining a mixed signal including one basic conversion time attenuation signal at the basic frequency of the local oscillator signal and a plurality of conversion time attenuation signals at a plurality of frequencies;
Determining the magnitude of each of the conversion time attenuated signals at the fundamental frequency and at one frequency other than the fundamental frequency.
当該変換時間減衰信号の少なくとも一つの大きさを、少なくとも一つの他の変換時間減衰信号とともに含む一以上の比が決定される。当該一以上の比は、当該時間減衰信号のスペクトル内容を表す。当該時間減衰信号のスペクトル内容は、一の較正曲線から決定することができる。当該変換時間減衰信号の当該少なくとも一つの、他の少なくとも一つの変換時間減衰信号との少なくとも一以上の比を、当該時間減衰信号のスペクトル内容に関する情報を含むパラメータに関連づける本方法はさらに、当該パラメータから当該時間減衰信号のスペクトル内容を抽出することを含む。当該パラメータは、当該時間減衰信号の減衰時定数であり得る。 One or more ratios are determined that include at least one magnitude of the conversion time decay signal along with at least one other conversion time decay signal. The one or more ratios represent the spectral content of the time decay signal. The spectral content of the time decay signal can be determined from a calibration curve. The method further relates to associating at least one ratio of the at least one conversion time attenuation signal with at least one other conversion time attenuation signal to a parameter that includes information regarding the spectral content of the time attenuation signal. Extracting the spectral content of the time decay signal from. The parameter can be the decay time constant of the time decay signal.
本方法は、異なる時間減衰信号に対し、当該異なる時間減衰信号のそれぞれのスペクトル内容を得て一のサンプルの一のスペクトルを決定するべく複数回繰り返してよい。本方法はさらに、当該スペクトルから当該サンプルの一以上の特徴又はパラメータを決定することを含む。本方法はさらに又は代替的に、当該スペクトルから当該サンプルの一以上の成分を特定することを含む。 The method may be repeated multiple times for different time-attenuated signals to obtain the spectral content of each of the different time-attenuated signals and determine one spectrum for a sample. The method further includes determining one or more features or parameters of the sample from the spectrum. The method additionally or alternatively includes identifying one or more components of the sample from the spectrum.
複数の変換時間減衰信号の周波数は、当該基本周波数の一以上の高調波周波数であり得る。本方法はさらに、一の周波数における当該変換時間減衰信号の少なくとも一つの大きさと、当該残りの変換時間減衰信号又は当該基本変換時間減衰信号のいずれか一以上の大きさとの比を決定することを含み得る。 The frequency of the plurality of conversion time attenuation signals may be one or more harmonic frequencies of the fundamental frequency. The method further comprises determining a ratio between at least one magnitude of the conversion time decay signal at one frequency and one or more magnitudes of the remaining conversion time decay signal or the basic conversion time decay signal. May be included.
当該時間減衰信号は、一の吸収度信号であり得る。当該時間減衰信号は、一のキャビティリングダウン信号であり得る。本システムは、時間減衰信号(すなわち吸収度信号又はキャビティリングダウン信号)をリアルタイムで分析するべく適合することができる。当該局所振動子は一の信号発生器振動子であり、当該局所振動子信号は一の方形波であり得る。当該局所振動子信号は、一の所望周波数を有する一の正弦波であり得る。当該局所振動子信号は、複数の周波数成分を含む一の複合的な信号波形であり得る。さらなる構成において、当該時間減衰信号は、任意形態の時間領域信号であり得る。当該時間領域信号は一のインターフェログラムであり得る。当該インターフェログラムは、一の干渉計から導出することができる。 The time decay signal may be a single absorbance signal. The time decay signal may be a single cavity ring down signal. The system can be adapted to analyze time decay signals (ie, absorbance signals or cavity ring down signals) in real time. The local oscillator may be a signal generator oscillator, and the local oscillator signal may be a square wave. The local oscillator signal may be a sine wave having a desired frequency. The local oscillator signal may be a complex signal waveform including a plurality of frequency components. In a further configuration, the time decay signal may be any form of time domain signal. The time domain signal may be an interferogram. The interferogram can be derived from one interferometer.
第2側面によれば、一の時間減衰信号を分析するシステムが与えられる。本システムは、当該時間減衰信号を一の局所振動子信号と混合する一の混合器を含み得る。当該時間減衰信号及び当該局所振動子信号の混合により、一のフーリエ変換時間減衰信号を生成する混合信号を形成することができる。当該フーリエ変換時間遅延信号は、当該局所振動子信号の当該基本周波数における一の基本変換時間減衰信号を含み得る。当該フーリエ変換時間遅延信号はまた、当該基本周波数に係る複数の周波数における複数の変換時間減衰信号を含み得る。本システムはさらに、当該基本周波数における、及び当該複数の周波数における各変換時間減衰信号の大きさを決定する決定器を含み得る。当該決定器は、決定に又は計算目的に適合された一のコンピュータ、一の計算機、又は他の適切なハードウェア若しくはソフトウェアコンポーネントを含み得る。当該フーリエ変換時間遅延信号は、当該決定器によって生成され得る。 According to a second aspect, a system for analyzing a time decay signal is provided. The system may include a mixer that mixes the time decay signal with a local oscillator signal. By mixing the time decay signal and the local oscillator signal, a mixed signal that generates one Fourier transform time decay signal can be formed. The Fourier transform time delay signal may include one fundamental transform time decay signal at the fundamental frequency of the local transducer signal. The Fourier transform time delay signal may also include a plurality of transform time attenuated signals at a plurality of frequencies related to the fundamental frequency. The system may further include a determiner that determines the magnitude of each conversion time attenuated signal at the fundamental frequency and at the plurality of frequencies. The determiner may include a computer, a calculator, or other suitable hardware or software component adapted for the determination or for calculation purposes. The Fourier transform time delay signal can be generated by the determiner.
第2側面の一構成において、一の時間減衰信号を分析するシステムであって、当該時間減衰信号を一の局所振動子信号と混合し、当該局所振動子信号の当該基本周波数における一の基本変換時間減衰信号、及び当該基本周波数の複数の高調波周波数における複数の高調波変換時間減衰信号を含む一のフーリエ変換時間減衰信号を生成する混合信号を形成する一の混合器と、
当該基本周波数における、及び当該複数の高調波周波数それぞれの周波数における当該変換時間減衰信号それぞれの大きさを決定する一の決定器とを含む。
In one configuration of the second aspect, there is provided a system for analyzing one time attenuated signal, wherein the time attenuated signal is mixed with one local oscillator signal, and one basic transformation of the local oscillator signal at the basic frequency is performed. A mixer forming a mixed signal that generates a Fourier transform time attenuated signal including a time attenuated signal and a plurality of harmonic transformed time attenuated signals at a plurality of harmonic frequencies of the fundamental frequency;
A determiner that determines the magnitude of each of the conversion time attenuated signals at the fundamental frequency and at each of the plurality of harmonic frequencies.
当該時間減衰信号は一の吸収度信号を含み得る。当該時間減衰信号は一のキャビティリングダウン信号であり得る。本システムは、当該時間減衰信号(すなわち吸収度信号又はキャビティリングダウン信号)をリアルタイムで分析するべく適合することができる。 The time decay signal may include an absorbance signal. The time decay signal may be a single cavity ring down signal. The system can be adapted to analyze the time decay signal (ie, the absorbance signal or the cavity ring down signal) in real time.
第3側面によれば、一の光検出システムにおいて一の吸収種からの一の時間減衰信号を分析するシステムが与えられる。本システムは、当該時間減衰信号を、一の局所振動子が生成する一の局所振動子信号と混合し、一のフーリエ変換時間減衰信号が生成され得る混合信号を得る一の混合器を含み得る。当該フーリエ変換時間減衰信号は、当該局所振動子信号の当該基本周波数における一の基本変換時間減衰信号を含み得る。当該フーリエ変換時間減衰信号はさらに、当該基本周波数の複数の周波数における少なくとも一つ又は複数の変換時間減衰信号を含み得る。本システムはさらに、当該基本周波数における、及び当該複数の周波数のそれぞれの周波数における当該変換時間減衰信号のそれぞれの大きさを決定する決定器を含む。当該決定器は、決定に及び/又は計算目的に適合された一のコンピュータ、一の計算機、又は他の適切なハードウェア若しくはソフトウェアコンポーネントを含み得る。 According to a third aspect, a system is provided for analyzing one time decay signal from one absorbing species in one light detection system. The system may include a mixer that mixes the time attenuated signal with a local oscillator signal generated by a local oscillator to obtain a mixed signal from which a Fourier transform time attenuated signal may be generated. . The Fourier transform time decay signal may include one fundamental transform time decay signal at the fundamental frequency of the local transducer signal. The Fourier transform time decay signal may further include at least one or more transform time decay signals at a plurality of frequencies of the fundamental frequency. The system further includes a determiner that determines a magnitude of each of the conversion time attenuated signals at the fundamental frequency and at each of the plurality of frequencies. The determiner may include a computer, a calculator, or other suitable hardware or software component that is adapted to the decision and / or calculation purpose.
第3側面の一構成において、一の光検出システムにおいて一の吸収種からの一の時間領域信号を分析するシステムが与えられる。本システムは、当該時間領域信号を、一の局所振動子が生成する一の局所振動子信号と混合し、当該局所振動子信号の当該基本周波数における一の基本変換時間領域信号、及び当該基本周波数の複数の高調波周波数における複数の高調波変換時間減衰信号を含む一のフーリエ変換時間減衰信号を生成する一の混合信号を得る一の混合器と、
当該基本周波数における、及び当該複数の高調波周波数のそれぞれの周波数における当該変換時間領域信号のそれぞれの大きさを決定する一の決定器とを含む。
In one configuration of the third aspect, a system for analyzing one time domain signal from one absorbing species in one light detection system is provided. The system mixes the time domain signal with one local oscillator signal generated by one local oscillator, and one basic conversion time domain signal at the fundamental frequency of the local oscillator signal, and the basic frequency. A mixer for obtaining a mixed signal for generating a Fourier transform time attenuated signal including a plurality of harmonic transform time attenuated signals at a plurality of harmonic frequencies of
And a determinator for determining the magnitude of each of the conversion time domain signals at the fundamental frequency and at each of the plurality of harmonic frequencies.
当該時間領域信号は一の吸収度信号であり得る。当該光検出システムは一のキャビティリングダウン光検出システムであり、当該時間領域信号は、当該キャビティリングダウンシステムからの一の時間減衰信号であり得る。さらなる構成において、当該時間減衰信号は、任意形態の時間領域信号であってよい。当該時間領域信号は一のインターフェログラムであり得る。当該インターフェログラムは、一の干渉計から導出することができる。本システムは、当該時間領域信号(すなわち吸収度若しくは信号又は時間減衰信号)をリアルタイムで分析するべく適合することができる。 The time domain signal may be a single absorbance signal. The light detection system may be a cavity ring down light detection system, and the time domain signal may be a time decay signal from the cavity ring down system. In a further configuration, the time decay signal may be any form of time domain signal. The time domain signal may be an interferogram. The interferogram can be derived from one interferometer. The system can be adapted to analyze the time domain signal (ie, absorbance or signal or time decay signal) in real time.
当該光キャビティ−リングダウン検出システムの励起源は、一の連続波源、一の準連続波源、又は一のパルス源の一以上から選択することができる。当該励起源は、一の連続波レーザ源、一の準連続波レーザ源、一のパルスレーザ源、又は一の変調レーザ源であり得る。例えば、当該光源は一の量子カスケードレーザであり得る。当該変調レーザ源は、100%又は100%未満の変調深さを有し得る。すなわち、当該変調深さは、0.01から100%、1%から100%、5%から100%、10%から100%、20%から100%、30%から100%、40%から100%、又は50%から100%であり、約0.01%、0.05%、0.1%、0.5%、1,5%、10%、15%、20%、25%、30%、35%、40%、45%、50%、55%、60%、65%、70%、75%、80%、85%、90%、95%、97%、98%、99%、99.5%、又は約100%であり得る。当該光検出システムは一の干渉計検出システムであり、時間領域信号は一の時間的なインターフェログラムであり得る。当該時間的なインターフェログラムは、一の所望時間フレーム全体の一空間(例えば距離)領域にわたる一のパラメータの変化から導出することができる。当該局所振動子は一の信号発生器振動子であり、当該局所振動子信号は一の方形波であり得る。当該局所振動子信号は、所望の周波数を有する一の正弦波であり得る。当該局所振動子信号は、複数の周波数成分を含む一の複合的な信号波形であり得る。 The excitation source of the optical cavity-ring-down detection system can be selected from one or more of a continuous wave source, a quasi-continuous wave source, or a pulse source. The excitation source can be one continuous wave laser source, one quasi-continuous wave laser source, one pulsed laser source, or one modulated laser source. For example, the light source can be a quantum cascade laser. The modulated laser source may have a modulation depth of 100% or less than 100%. That is, the modulation depth is 0.01 to 100%, 1% to 100%, 5% to 100%, 10% to 100%, 20% to 100%, 30% to 100%, 40% to 100%. Or about 50% to 100%, about 0.01%, 0.05%, 0.1%, 0.5%, 1,5%, 10%, 15%, 20%, 25%, 30% 35%, 40%, 45%, 50%, 55%, 60%, 65%, 70%, 75%, 80%, 85%, 90%, 95%, 97%, 98%, 99%, 99 .5%, or about 100%. The light detection system may be an interferometer detection system and the time domain signal may be a temporal interferogram. The temporal interferogram can be derived from a parameter change over a space (eg distance) region over a desired time frame. The local oscillator may be a signal generator oscillator, and the local oscillator signal may be a square wave. The local oscillator signal may be a single sine wave having a desired frequency. The local oscillator signal may be a complex signal waveform including a plurality of frequency components.
ここに開示される方法の側面のいずれにおいても、本方法は、一の吸収度信号を分析する方法を含み得る。本方法の側面は、一の変調器において一の変調信号を生成することを含み得る。本方法の側面はさらに、一の光源を当該変調信号によって変調することを含み得る。本方法の側面はさらに、当該光信号を、当該光信号の少なくとも一部分を吸収して一の吸収度信号を生成する一のサンプルに向けることを含み得る。当該吸収度信号は一の時間減衰部分を含み得る。本方法の側面はさらに、一の検出器により当該吸収度信号を検出して一の時間依存検出信号を生成することを含み得る。本方法の側面はさらに、当該検出信号を当該変調信号と混合して一の混合信号を生成することを含み得る。本方法の側面はさらに、当該混合信号を変換して一のフーリエ変換時間減衰信号を生成することを含み得る。当該混合信号の変換は、当該混合信号の低域通過フィルタリング、積分、又は加算して一のフーリエ変換時間減衰信号を生成することを含み得る。当該フーリエ変換時間減衰信号は、当該局所振動子信号の当該基本周波数における一の基本変換時間減衰信号を含み得る。当該フーリエ変換時間減衰信号は、複数の周波数成分を有する少なくとも一つ又は複数の変換時間減衰信号を含み得る。本方法の側面はさらに、当該基本周波数における、及び当該基本周波数以外の少なくとも一つの周波数における当該変換時間減衰信号それぞれの大きさを決定し、複数の周波数依存大きさの信号を生成することを含み得る。本方法の側面はさらに、当該周波数依存大きさの信号を分析し、当該吸収度信号を表すデータを決定して当該サンプルの吸収度を決定することを含み得る。 In any of the method aspects disclosed herein, the method may include a method of analyzing an absorbance signal. An aspect of the method may include generating a modulated signal at a modulator. Aspects of the method may further include modulating one light source with the modulated signal. Aspects of the method may further include directing the optical signal to a sample that absorbs at least a portion of the optical signal to produce an absorbance signal. The absorbance signal may include a time decay portion. An aspect of the method may further include detecting the absorbance signal with a detector to generate a time-dependent detection signal. Aspects of the method may further include mixing the detection signal with the modulation signal to generate a mixed signal. An aspect of the method may further include transforming the mixed signal to generate a Fourier transform time decay signal. The transform of the mixed signal may include low pass filtering, integrating, or adding the mixed signal to produce a Fourier transform time attenuated signal. The Fourier transform time decay signal may include one fundamental transform time decay signal at the fundamental frequency of the local transducer signal. The Fourier transform time decay signal may include at least one or more transform time decay signals having a plurality of frequency components. Aspects of the method further include determining a magnitude of each of the conversion time attenuated signals at the fundamental frequency and at least one frequency other than the fundamental frequency, and generating a plurality of frequency dependent magnitude signals. obtain. Aspects of the method may further include analyzing the frequency dependent magnitude signal and determining data representing the absorbance signal to determine the absorbance of the sample.
特定の構成において、ここに開示される方法は、一の吸収度信号を分析するべく適合され得る。本方法は、一の変調器において一の変調信号を生成することと、当該変調信号によって一の光源を変調することと、当該光信号を、当該光信号の少なくとも一部分を吸収するサンプルに向けて、一の時間減衰部分を含む一の吸収度信号を生成することと、一の検出器によって当該吸収度信号を検出し、一の時間依存検出信号を生成することと、当該検出信号を当該変調と混合して一の混合信号を生成することと、当該混合信号を変換し、当該局所振動子信号の基本周波数における一の基本変換時間減衰信号、及び複数の周波数成分を有する複数の変換時間減衰信号を含む一のフーリエ変換時間減衰信号を生成することと、当該基本周波数における、及び当該基本周波数以外の少なくとも一つの周波数における当該変換時間減衰信号のそれぞれの大きさを決定し、複数の周波数依存大きさの信号を生成することと、当該周波数依存大きさの信号を分析し、当該吸収度信号を表すデータを決定して当該サンプルの吸収度を決定することとを含む。 In certain configurations, the methods disclosed herein can be adapted to analyze a single absorbance signal. The method includes generating a modulated signal in a modulator, modulating a light source with the modulated signal, and directing the optical signal to a sample that absorbs at least a portion of the optical signal. Generating one absorbance signal including one time decay portion, detecting the absorbance signal by one detector, generating one time-dependent detection signal, and modulating the detection signal To generate one mixed signal, transform the mixed signal, one basic conversion time attenuation signal at the fundamental frequency of the local oscillator signal, and a plurality of conversion time attenuations having a plurality of frequency components Generating one Fourier transform time attenuated signal including the signal, and each of the transform time attenuated signals at the fundamental frequency and at least one frequency other than the fundamental frequency Determine the magnitude, generate a plurality of frequency dependent magnitude signals, analyze the frequency dependent magnitude signal, determine the data representing the absorbance signal, and determine the absorbance of the sample Including.
当該周波数依存大きさの信号の分析は、一の周波数における当該変換時間減衰信号の少なくとも一つの大きさの、当該残りの変換時間減衰信号の一以上又は当該基本変換時間減衰信号のいずれかの大きさとの比を決定することを含み得る。当該一又は複数の大きさの比は、当該時間減衰信号の時間減衰定数τを表し得る。これはさらに、当該サンプルの一の吸収度及び/又は吸収スペクトルを表し得る。 The analysis of the signal having the frequency-dependent magnitude is performed by measuring at least one magnitude of the conversion time attenuation signal at one frequency, one or more of the remaining conversion time attenuation signals, or any magnitude of the basic conversion time attenuation signal. Determining the ratio to The ratio of the one or more magnitudes may represent a time decay constant τ of the time decay signal. This may further represent an absorbance and / or absorption spectrum of the sample.
ここに開示されるシステムの側面のいずれにおいても、本システムは、一の吸収度信号を分析するべく適合され得る。本システムは、一の変調信号を生成する一の変調器を含み得る。本システムはさらに、当該変調信号によって変調されるべく適合される一の光源を含み得る。本システムはさらに、光キャビティを含み得る。当該光キャビティは、当該光源からの変調光を共振させ及び当該吸収度を出力するべく適合される。当該キャビティは、これの中にある一の吸収サンプルを、使用において当該サンプルが当該共振光信号の少なくとも一部を吸収するように受け入れるべく適合される。当該吸収度信号は一の時間減衰部分を含み得る。本システムはさらに、当該吸収度信号を検出して一の時間依存検出信号を生成する一の検出器を含み得る。本システムはさらに、当該検出信号を当該変調信号と混合して混合信号を生成する一の混合器を含み得る。本システムはさらに、当該混合信号を変換して一のフーリエ変換時間減衰信号を生成する信号変換器を含み得る。当該信号変換器は、一の低域通過フィルタ、一の積分器、又は一の加算演算器を含み得る。当該フーリエ変換時間減衰信号は、当該変調信号の当該基本周波数における一の基本変換時間減衰信号を含み得る。フーリエ変換時間減衰信号は、複数の周波数成分を有する少なくとも一つ又は複数の変換時間減衰信号を含み得る。本システムはさらに、当該変調器の基本周波数における、及び当該基本周波数以外の少なくとも一つの周波数における当該変換時間減衰信号それぞれの大きさを決定し、複数の周波数依存大きさの信号を生成する一の決定器を含み得る。本システムはさらに、当該周波数依存大きさの信号を分析し、当該吸収度信号を表すデータを決定して当該サンプルの吸収度を決定する一の分析器を含み得る。 In any of the system aspects disclosed herein, the system can be adapted to analyze a single absorbance signal. The system may include a modulator that generates a modulated signal. The system may further include a light source adapted to be modulated by the modulated signal. The system can further include an optical cavity. The optical cavity is adapted to resonate modulated light from the light source and output the absorbance. The cavity is adapted to receive one absorbing sample therein in such a manner that the sample absorbs at least a portion of the resonant optical signal in use. The absorbance signal may include a time decay portion. The system may further include a detector that detects the absorbance signal and generates a time-dependent detection signal. The system may further include a mixer that mixes the detected signal with the modulated signal to generate a mixed signal. The system may further include a signal converter that converts the mixed signal to generate a Fourier transform time attenuated signal. The signal converter may include one low pass filter, one integrator, or one adder. The Fourier transform time decay signal may include one fundamental transform time decay signal at the fundamental frequency of the modulation signal. The Fourier transform time decay signal may include at least one or more transform time decay signals having a plurality of frequency components. The system further determines a magnitude of each of the conversion time attenuated signals at the fundamental frequency of the modulator and at least one frequency other than the fundamental frequency, and generates a plurality of frequency dependent magnitude signals. A determiner may be included. The system may further include an analyzer that analyzes the frequency dependent magnitude signal and determines data representing the absorbance signal to determine the absorbance of the sample.
本システムは、一の第2(異なる)変調周波数の第2変調器(局所振動子)を含み得る。本システムは、当該検出時間依存検出信号を当該第2変調周波数と混合して一の第2混合信号を生成する一の第2混合器を含み得る。当該信号変換器は、当該第2混合信号を変換し、当該第2変調周波数における一の第2フーリエ変換時間減衰信号を生成することができる。当該決定器は、当該第2変調周波数における当該第2フーリエ変換時間減衰信号の大きさを決定し得る。当該分析器は、当該第2フーリエ変換時間減衰信号の大きさと当該第1フーリエ変換時間減衰信号の大きさとの比を決定し得る。 The system may include a second modulator (local oscillator) with one second (different) modulation frequency. The system may include a second mixer that mixes the detection time dependent detection signal with the second modulation frequency to generate a second mixed signal. The signal converter can convert the second mixed signal to generate one second Fourier transform time attenuated signal at the second modulation frequency. The determiner may determine the magnitude of the second Fourier transform time decay signal at the second modulation frequency. The analyzer may determine a ratio between the magnitude of the second Fourier transform time decay signal and the magnitude of the first Fourier transform time decay signal.
特定の構成において、ここに開示されるシステムは、一の吸収度信号を分析するシステムであり得る。本システムは、一の変調信号を生成する一の変調器と、当該変調信号によって変調されるべく適合される一の光源と、当該光源からの変調光を共振させて当該吸収度信号を出力するべく適合される一の光キャビティであって、当該光キャビティは、これの中にある一の吸収サンプルを、使用において当該サンプルが当該共振光信号の少なくとも一部を吸収するように受け入れるべく適合され、当該吸収信号は一の時間減衰部分を含む光キャビティと、当該吸収度信号を検出して時間依存検出信号を生成する一の検出器と、当該検出信号を当該変調信号と混合して一の混合信号を生成する一の混合器と、当該混合信号を変換して一のフーリエ変換時間減衰信号を生成する一の信号変換器であって、当該フーリエ変換時間減衰信号は、当該局所振動子信号の基本周波数における一の基本変換時間減衰信号、及び複数の周波数成分を有する複数の変換時間減衰信号を含む少なくとも一つ又は複数の変換時間減衰信号を含む信号変換器と、当該基本周波数における、及び当該基本周波数以外の少なくとも一つの周波数における当該変換時間減衰信号のそれぞれの大きさを決定し、複数の周波数依存大きさの信号を生成する一の決定器と、当該周波数依存大きさの信号を分析し、当該吸収度信号を表すデータを決定して当該サンプルの吸収度を決定する一の分析器とを含み得る。 In certain configurations, the system disclosed herein can be a system that analyzes a single absorbance signal. The system resonates the modulated light from the light source, the light source adapted to be modulated by the modulated signal, the modulated light from the light source, and outputs the absorbance signal. An optical cavity adapted to receive an absorbent sample contained therein so that, in use, the sample absorbs at least a portion of the resonant optical signal. The absorption signal includes an optical cavity including a time decay portion, a detector that detects the absorbance signal and generates a time-dependent detection signal, and mixes the detection signal with the modulation signal One mixer for generating a mixed signal and one signal converter for converting the mixed signal to generate one Fourier transform time attenuated signal, the Fourier transform time attenuated signal being the local oscillator A signal converter including at least one conversion time attenuation signal including one basic conversion time attenuation signal at the fundamental frequency of the child signal and a plurality of conversion time attenuation signals having a plurality of frequency components; , And a determiner for determining a magnitude of each of the conversion time attenuation signals at at least one frequency other than the fundamental frequency, and generating a plurality of frequency dependent magnitude signals, and a signal of the frequency dependent magnitude And an analyzer for determining data representing the absorbance signal to determine the absorbance of the sample.
ここに開示されるシステムは、吸収度信号のリアルタイム分析に適合され得る。 The system disclosed herein can be adapted for real-time analysis of absorbance signals.
ここに記載されるものと同様又は同等のいずれの方法及び材料も本発明の実施又は試験に使用することができるが、好ましい方法及び材料が記載される。ここに記載される方法、装置、及びシステムは、様々な方法で及び様々な目的のために実装することができる。ここでの記載は例示に過ぎない。 Although any methods and materials similar or equivalent to those described herein can be used in the practice or testing of the present invention, the preferred methods and materials are described. The methods, apparatus, and systems described herein can be implemented in a variety of ways and for a variety of purposes. The description here is merely an example.
例示のみを目的として、ここに記載される検出スキームの構成を、添付図面を参照して以下に記載する。
図面を参照してここに開示されるのは、時間減衰信号の分析を目的とするデジタル検出のシステム及び方法である。ここでは、光吸収度信号の検出及び分析に対して例示される。 Disclosed herein with reference to the drawings are systems and methods for digital detection intended for the analysis of time decay signals. Here, it is illustrated for detection and analysis of a light absorbance signal.
わかることだが、どのような波形も、正弦と余弦の重み付きの和によって表すことができる。電子的システムにおいて、所定周波数の正弦波が任意波形に寄与する程度は、アナログ又はデジタルいずれかの混合器を使用することによって決定することができる。混合器は、信号波形及び局所振動子が生成する信号を入力として受け入れる。当該信号は、一般には既知周波数の正弦関数又は方形波信号のいずれかである。混合器出力のDC成分は、周波数fの正弦波が当該信号波形に寄与する程度に比例する信号である。局所振動子周波数をスキャンすることにより、時間的に複合的な信号を、フーリエ変換適用により得られるものと類似する周波数領域スペクトルに分解することができる。 As you can see, any waveform can be represented by a weighted sum of sine and cosine. In electronic systems, the degree to which a sine wave of a given frequency contributes to an arbitrary waveform can be determined by using either analog or digital mixers. The mixer accepts the signal waveform and the signal generated by the local oscillator as inputs. The signal is generally either a sine function of known frequency or a square wave signal. The DC component of the mixer output is a signal proportional to the degree to which the sine wave of frequency f contributes to the signal waveform. By scanning the local oscillator frequency, a temporally complex signal can be decomposed into a frequency domain spectrum similar to that obtained by applying Fourier transform.
正弦波を混合器の局所振動子として使用することにより、一の信号波形に対する単数の周波数成分のみの寄与が測定される。いくつかの周波数に興味がある場合、異なる周波数を有する一セットの正弦波の寄与を同時に測定するべく、代替的な局所振動子を使用することができる。例えば、周波数fの方形波は、周波数がf、3f、5f、7f、9f、…である一セットの正弦波に分解される。したがって、局所振動子信号としての方形波を使用すると、混合器の出力から得られる混合信号は、当該信号波形への、f、3f、5f、7f、9f、又はこれより高い高調波における正弦波の組み合わされた寄与の尺度となる。このように、混合器は、一の信号波形への一セットの正弦関数の同時寄与を決定するべく使用することができる。したがって、適切な局所振動子信号波形を使用することにより、一セットの正弦波の、複合的な波形への寄与を迅速に決定することができる。なお、この検出スキームは、f、3f、5f、7f、9f、及びこれより高い高調波において偶然発生するものを除いたすべてのノイズ源をフィルタ除去するという利点を有する。 By using a sine wave as the local oscillator of the mixer, the contribution of only a single frequency component to one signal waveform is measured. If you are interested in several frequencies, an alternative local oscillator can be used to simultaneously measure the contribution of a set of sinusoids with different frequencies. For example, a square wave having a frequency f is decomposed into a set of sine waves having frequencies f, 3f, 5f, 7f, 9f,. Therefore, when using a square wave as the local oscillator signal, the mixed signal obtained from the output of the mixer is a sine wave at f, 3f, 5f, 7f, 9f or higher harmonics to the signal waveform. Is a measure of the combined contribution of. In this way, the mixer can be used to determine the simultaneous contribution of a set of sine functions to a signal waveform. Thus, by using an appropriate local oscillator signal waveform, the contribution of a set of sine waves to the composite waveform can be quickly determined. Note that this detection scheme has the advantage of filtering out all noise sources except those that occur by chance at f, 3f, 5f, 7f, 9f and higher harmonics.
ロック型キャビティリングダウン分光システム(例えば、図1のプロット10と同等のもの)から典型的に得られる信号の分析に限られることなく、ここに記載の信号分析法は、時間領域信号に関して記載することも容易である。例えば、インターフェログラム(すなわち干渉計からのもの)の分析を目的とし、又は代替的に、光通信システム(例えば、自由空間又は光ファイバのような通信リンクにわたる光変調信号の送信を目的とするもの)における信号ディジェネレーションの分析を目的とする。 Without being limited to analyzing signals typically obtained from a locked cavity ring-down spectroscopy system (eg, equivalent to plot 10 of FIG. 1), the signal analysis methods described herein are described with respect to time domain signals. It is also easy. For example, for analysis of interferograms (ie, from an interferometer), or alternatively, for transmission of optically modulated signals over optical communication systems (eg, free space or communication links such as optical fibers) The purpose is to analyze signal degeneration.
CRDS(キャビティリングダウン)システムにおいて、サンプル(吸収材料)が、入力結合ミラー及び出力結合ミラーを有する高フィネスの安定した光共振器又はリングダウンキャビティに配置される。入力結合器を介してリングダウンキャビティ内に入った光は、前後に複数回循環し、周期的空間変動を有する定在波をセットアップする。出力結合器を介して出てくる光は、キャビティ内光強度に比例する。入力光源が解除された後、リングダウンキャビティに蓄積された放射エネルギーが経時的に減少する(リングダウン)。空のキャビティに対し、蓄積されたエネルギーは、リングダウン速度を特徴とする指数関数的減衰に従う。リングダウン速度は、当該ミラーの反射性、当該ミラー間の分離、及び当該キャビティ内の光速度にのみ依存する。サンプルが共振器内に配置されると、リングダウンが加速され、適切な条件のもと、キャビティ内エネルギーはほぼ完璧に指数関数的に減衰する。 In a CRDS (cavity ring down) system, a sample (absorbing material) is placed in a high finesse stable optical resonator or ring down cavity with an input coupling mirror and an output coupling mirror. Light entering the ring-down cavity via the input coupler circulates back and forth multiple times, setting up a standing wave with periodic spatial variation. Light exiting through the output coupler is proportional to the light intensity in the cavity. After the input light source is released, the radiant energy stored in the ring-down cavity decreases with time (ring-down). For an empty cavity, the stored energy follows an exponential decay characterized by a ring-down velocity. The ring-down speed depends only on the reflectivity of the mirrors, the separation between the mirrors, and the speed of light in the cavity. When the sample is placed in the resonator, the ring-down is accelerated and, under appropriate conditions, the energy in the cavity decays almost perfectly exponentially.
キャビティリングダウン分光法(CRDS)において、高フィネス光キャビティにトラップされた光の減衰は、当該キャビティ内の気相分子による吸収度(光密度としても知られる)の直接的尺度となる。吸収度は、時間tにおいて指数関数的に減衰する信号Iの減衰定数τをモニタすることによって測定される。これは、
![]()
![]()
残念ながら、このプロセスは、2、3を超える波長に対してリアルタイムスペクトルを与えようと試みるいずれの機器の速度をも大きく低減する。2つの初期グループ(例えば非特許文献1及び3を参照)は、アナログシステムを使用することによってリングダウン信号をフィッティングすることを回避していた。Andersonら(非特許文献1)は、τを決定するべくクロック回路を使用したのに対し、Romaniniら(非特許文献3)はボックスカー積分器を利用した。双方の方法ともデータを迅速に抽出するのは得意だが、欠点として、リングダウン信号の小部分のみサンプリングするに過ぎないという事実があった。これにより、信号対ノイズ比が必然的に妥協を受けることになる。アナログCRDS検出システムのさらなる議論は、米国特許第6,233,052号及び第6,532,071号に与えられている。
Unfortunately, this process greatly reduces the speed of any instrument that attempts to provide a real-time spectrum for more than a few wavelengths. Two initial groups (see, for example,
リングダウンキャビティに周波数ロックされた連続波(CW)レーザを用いる機器は、5kHzを超える速度で波形を生成することができる(例えば非特許文献4及び5を参照)。これらのシステムでは、レーザ及び光キャビティが共振状態にロックされ、リングダウン波形の取得における時間限定因子はτそのものとなる。すなわち、図1のプロット10のような波形が、当該キャビティが「リングアップ」及び「リングダウン」できるのと同じ速さで生成され得る。唯一の機器(例えば、非特許文献4の機器を参照)が、リアルタイム吸収度データ(すなわち、吸収度及び/又は吸収スペクトル)を、当該速度でリングダウン波形から抽出できる能力を実証している。このシステムは、対数増幅器、アナログフィルタ、及びロックイン増幅器からなるアナログ検出システムを用いていたが、当該システムは専用コンポーネントの当該アレイを必要とするので、必然的に複雑となる。このため、意味のある結果を得るべく使用するには困難となり得る。
Devices that use a continuous wave (CW) laser frequency locked to the ring-down cavity can generate waveforms at speeds in excess of 5 kHz (see, eg,
検出スキームを単純化するべく、基本周波数においてオン及びオフに切り替えられる場合の時間減衰信号(すなわち、図1のプロット20に示されるレーザチョッピング信号)に対する2つの限定的ケースが存在する。
To simplify the detection scheme, there are two limited cases for the time decay signal (ie, the laser chopping signal shown in
図2Aは、レーザ/キャビティロック型システムが生成するリングダウン波形の当該限定的ケースにおける信号を示す概略図である。図2Aのプロット30に見ることができるように、光チョッピング周波数fと比べて非常に短い減衰時間τ(すなわち、小さなτ、又は大きなサンプル吸収度)の制限において、周波数がロックされたリングダウンシステムのリングダウン波形は方形波に近づく(この波形を、準方形波と称する)。長い減衰時間、すなわち図2Aのプロット40(大きなτ、小さなサンプル吸収度)、においては、当該リングダウン波形は三角波に近づく(すなわち準三角波)。
FIG. 2A is a schematic diagram showing signals in this limited case of a ring-down waveform generated by a laser / cavity lock type system. As can be seen in
これらの各限定的波形(すなわち準方形波及び準三角波)のフーリエ変換、及び純粋な方形波のフーリエ変換をそれぞれ、図2Bのプロット35、45、及び25に示す。これらの限定的ケースの周波数成分に関してはいくつかの注目すべき点が存在する。第1に、時間減衰波形のフーリエスペクトルをなす正弦波成分の周波数fが、双方の波形に対して同じである。第2に、短い減衰時間を有する当該波形に対するすべての周波数成分の振幅が、長いτの波形に対するものよりも一般に小さい。すなわち、準三角波時間減衰波形40に対するフーリエ変換信号における高調波成分の大きさの包絡線47は、準方形時間減衰波形30に対するフーリエ変換信号における高調波成分の大きさの包絡線37よりも小さな大きさとなっている。各高調波成分の大きさにおけるこの低下は、キャビティの完全なリングアップ又はリングダウンいずれも許容しない結果である短いτの波形40の、小さな振幅に部分的に起因する。
The Fourier transforms of each of these limited waveforms (ie, quasi-square and quasi-triangular waves) and the pure square wave are shown in
さらに、長いτの波形40の高周波数成分の振幅が、短いτのケースよりも大きい。これは、図2Bにおける包絡線37と47との対比から明確に証明される。これは、波形自体の形状に起因する。方形波が、一セットの等しく重み付けされた正弦波(純粋な方形波のフーリエ変換信号25における高調波成分の等しい大きさを参照)である一方、三角波は、高周波数において強度が低下する一セットの正弦波からなる。
Furthermore, the amplitude of the high frequency component of the
したがって、時間減衰信号の減衰時間τの変化は、リングダウン波形の様々な周波数成分、例えばCRDSシステムの基本変調周波数fの一以上の高調波成分、の一以上の大きさをモニタすることによって決定することができる。これは、現実には、適切な局所振動子局所振動子に対して、混合器を使用して又はデジタル的にリングダウン信号及び局所振動子信号を乗算して所定時間にわたって加算することによって行われる。CRDSシステムにおけるレーザ出力強度が、当該レーザがスキャンされる際に不変であるか又はゆっくりとのみ変化する場合、当該波形のすべての周波数成分(例えば基本変調周波数の高調波周波数)の振幅全体が、減衰時間τの尺度となる。すべての周波数成分を同時測定するべく、リングダウン波形は、CRDSシステムにおけるレーザ強度を変調するべく使用される方形波信号と同じものとして取得されるのが有利である適切な局所振動子信号と混合される。 Accordingly, the change in the decay time τ of the time decay signal is determined by monitoring one or more magnitudes of various frequency components of the ring-down waveform, for example, one or more harmonic components of the fundamental modulation frequency f of the CRDS system. can do. In practice, this is done for a suitable local oscillator local oscillator by using a mixer or digitally multiplying the ring-down signal and the local oscillator signal and adding them over time. . If the laser output intensity in a CRDS system is unchanged or changes only slowly when the laser is scanned, the overall amplitude of all frequency components of the waveform (eg, harmonic frequencies of the fundamental modulation frequency) It is a measure of the decay time τ. In order to measure all frequency components simultaneously, the ring-down waveform is mixed with a suitable local oscillator signal that is advantageously acquired as the same square wave signal used to modulate the laser intensity in the CRDS system. Is done.
図2Bに示されるように、方形波レーザ変調信号の周波数成分(すなわちレーザのチョッピング周波数)は、リングダウン波形の当該成分と同じ周波数において生じる。したがって、混合器における局所振動子信号としてレーザ変調信号を使用することによって、興味高調波周波数すべての大きさが同時に測定される。実際のところ、時間減衰信号のフーリエ成分に対する減衰定数τの正確な決定を得るには、基本変調周波数の約7次又は9次高調波までの高調波周波数成分で十分である。代替的に、高調波成分の一以上の大きさを単に取得してこれら一以上の成分のそれぞれの、基本フーリエ成分の大きさに対する比を取るのではなく、1次、2次、3次、4次、5次、6次、7次、8次、9次、10次、又はこれ以上の高次高調波成分を取得して、当該高調波の大きさの和を基本フーリエ成分の大きさに対して取ることもできる。 As shown in FIG. 2B, the frequency component of the square wave laser modulation signal (ie, the chopping frequency of the laser) occurs at the same frequency as that component of the ring-down waveform. Therefore, by using the laser modulation signal as the local oscillator signal in the mixer, the magnitudes of all the harmonic frequencies of interest are measured simultaneously. In fact, harmonic frequency components up to about the seventh or ninth harmonic of the fundamental modulation frequency are sufficient to obtain an accurate determination of the attenuation constant τ for the Fourier component of the time decay signal. Alternatively, rather than simply taking one or more magnitudes of the harmonic components and taking a ratio of each of the one or more components to the magnitude of the fundamental Fourier component, first, second, third, Acquire fourth-order, fifth-order, sixth-order, seventh-order, eighth-order, ninth-order, tenth-order or higher harmonic components, and the sum of the magnitudes of the harmonics is the magnitude of the basic Fourier component. Can also be taken against.
図3は、CRDSアプリケーションにおいて描かれる時間減衰信号分析用システム100の例示的構成の概略図を示す。周波数可変レーザ源であり得る光源110(例えば適切なレーザ源)が、通信ライン121を介する変調器(局所振動子)120からの方形波信号122によって、準連続波光ビーム111を生成するべく変調される。例えば、光源110は、量子カスケードレーザであってよい。他のタイプの光源特にレーザは、この後に記載される。ビーム111が、反射器131及び132により画定される高フィネス光キャビティ130に入る。各反射器は、CRDSシステムに対して典型的であるが、変調光ビーム111の波長において典型的には99.9%を超える反射性を有する。光ビーム111aがキャビティ130内で共振する。被分析吸収サンプル135(例えば気相種)が、光キャビティ130内の反射器131及び132の直近に置かれる。光ビーム111は、キャビティ130においてサンプル135によって少なくとも部分的に吸収される。キャビティ130を往復するたび、光ビーム111aの小部分が、時間減衰信号115(図1のプロット10のものと類似の波形を有する)として当該キャビティを出て光検出器140により検出される。検出器140は例えば、時間減衰信号を検出するのに十分速い応答時間を有する光電子増倍管、光ダイオード、又は他の適切な光検出器であり得る。検出信号141が検出器140から出力され、通信ライン142を介して混合器モジュール150に入力される。ここで、検出信号141が、リングダウン波形115と同じ周波数を有する方形波とデジタル的に混合される。リングダウン波形115は、ここに描かれるように、通信ライン123を介して変調器120から出力される方形波変調信号122から直接取得できる。混合器150は、変換(復調)出力信号151を生成することができる。変換(復調)出力信号151は、通信ライン152を介して、変換出力信号151を分析するべく適合される決定器160(例えば、コンピュータ、又は計算機若しくは同等のデバイスのような代替的な決定デバイス)に入力される。現在記載のシステム100は、光キャビティ130に配置されたサンプル135のキャビティリングダウン時間減衰(吸収度)信号115を分析するデジタル復調システムの一例である。
FIG. 3 shows a schematic diagram of an exemplary configuration of a
実際のところ、光源110は典型的に、興味周波数範囲にわたってスキャンされる周波数可変レーザ源である。スキャン周波数範囲内の周波数に対して吸収度が決定される。スキャン周波数範囲にわたって吸収種(サンプル135)の吸収スペクトルが生成される。代替的に、光源は、所定範囲の周波数にある光を出力する広帯域光源であってよい。本システムはさらに、当該出力周波数範囲にわたるスキャンを行うスキャンデバイス(図示せず)を含む。これにより、当該スキャン周波数にわたって時間減衰信号が検出され、当該スキャン周波数範囲にわたって吸収種(サンプル135)の吸収スペクトルが生成される。
In practice,
図4は、デジタル混合器150(これの信号入力は様々なτを有するリングダウン波形115である)の出力151の、減衰定数τに対するプロットである。ここでは、キャビティがリングダウンを許容される時間長さ(チョッピング窓)に対するτの比として与えられる。これは、混合された信号における周波数成分の大きさ間の比とキャビティにおける吸収度とを定量的に結びつける較正曲線として使用される。明らかなことだが、混合器の出力は、直線的関係ではないが、(キャビティ130内にある気相種の光吸収度の量によって決定される)キャビティの減衰時間τの変化に伴い変化する。したがって、混合器150からの出力151を、キャビティ130内における当該種の吸収度を決定するべく使用することができる。これは、ルックアップテーブル又は図4におけるもののような較正曲線(例えば、図10における実験的に決定された類似の較正曲線を参照)を使用して行われる可能性が最も高く、デジタル混合器からの出力(又は、図3に示されるチョッピング窓に正規化された出力)が減衰定数τと同一視される。減衰定数τは、指数関数的関係に従うと予想され及びこのように見えて、そのパラメータは、サンプリング周波数及びサンプル長さの単純な関数である可能性が高い。当該較正曲線はその後、高フィネスキャビティ内における気体種の吸収度を決定するべく、当業者がわかるキャビティリングダウン分光計システムとして通常の態様で使用される。
FIG. 4 is a plot of the
上述のシステムの一つの欠点は、デジタル混合器150からの出力が、レーザ強度の変動に対して敏感なことである。その結果、レーザの変動が、減衰定数τの決定においてノイズ源として作用する。これに対抗して混合器150からの出力をレーザ強度の変動に対して鈍感にするべく、高い周波数成分の一つの強度(大きさ)の、低い周波数成分の強度(大きさ)に対する比、すなわち、図2Aに示されるリングダウン波形のフーリエ変換における第1ピークに対する第2ピークの比が決定される。代替的に、フーリエ変換出力における高次の高調波成分(例えば3f、5f、7f、9f、…)の一以上の大きさの、基本周波数fにおける当該成分の大きさに対する比が決定される。
One drawback of the above system is that the output from the
高調波成分の大きさは代替的に、図5の代替的概略構成200に描かれる一セットのデジタル混合器を使用して得ることができる。ここで、CRDSシステムの同じコンポーネントを示すべく同じ参照番号が使用される。本システムは、一以上の興味周波数において局所振動子信号を生成する局所振動子221及び223を含む。局所振動子221及び223が生成する局所振動子信号における興味周波数は、基本周波数の高調波周波数であり得るが、必須というわけではない。一以上の周波数成分を有する信号を生成する任意の所望局所振動子を、各局所振動子に対して選択することができる。例えば、方形波局所振動子信号、又は異なる周波数の一以上の正弦波の重畳を含む信号も使用することができる。局所振動子が生成する信号の周波数は、興味波形の周波数成分でなければならない。当該周波数は高調波である傾向があるが、局所振動子信号の周波数は当該高調波に限られない。局所振動子221及び223がそれぞれ、別個のデジタル混合器150a及び150bそれぞれに結合され、各周波数の高調波成分の大きさを示す出力信号261及び263が得られる。当該出力信号は、通信ライン262及び264それぞれを介して決定器160に入力される。混合され及び統合された出力(すなわちフーリエ変換信号)におけるピーク比を取得することにより、光源110の強度変動によりもたらされる減衰時定数τの変動が排除される。
The magnitude of the harmonic components can alternatively be obtained using a set of digital mixers depicted in the alternative
図6は、フーリエ変換スペクトルにおける様々な高次高調波ピークnfの大きさの、基本周波数fの大きさに対する比が、上述のチョッピング窓に対する減衰定数τの相関関数としてどのように変化するかを示すプロットである。 FIG. 6 shows how the ratio of the magnitude of the various high-order harmonic peaks nf to the magnitude of the fundamental frequency f in the Fourier transform spectrum changes as a correlation function of the attenuation constant τ with respect to the chopping window described above. It is a plot to show.
上述の説明がCWレーザ出力波形に焦点を当てていたが、デジタル信号復調法はパルスレーザシステムに適用することもできる。高速デジタイザによる取得に引き続き、図1におけるプロット10のような波形を、パルスシステムリングダウン波形を使用して同様に構築及び分析することができる。この分析では、リングダウン事象間のデータの大半が排除され、一つおきに波形が修正されて周期的波形が生成される。当該周期的波形は、適切な局所振動子信号によって分析される結果的なシステムは、高速パルスシステムであっても、これにより生成される波形の100%を取得及び分析することができる。
Although the above description has focused on the CW laser output waveform, the digital signal demodulation method can also be applied to pulsed laser systems. Following acquisition by the high-speed digitizer, a waveform such as
このタイプのデジタル分析は、前述のシステムと比べて著しい利点をいくつか与える。第1に、局所振動子が生成する局所振動子信号における周波数セットに一致しないすべてのノイズ源が、完全にフィルタ除去されることである。実際のところ、減衰定数τは、時間減衰波形自体における著しい確率論的ノイズの存在があっても、極めて正確に決定することができる。第2に、信号オフセットが、測定されるτに影響を与えない。上述のアナログシステムとは異なり、局所振動子(デジタル的に生成された信号)がAC結合である限り、リングダウン波形のDCオフセットの変化によっては、デジタル混合法を使用して観測される減衰定数は影響を受けない。第3は速度である。フィールドプログラマブルゲートアレイのようなデジタルハードウェアを用いることにより、上述の強度比を得るべく必要とされる並列プロセスであっても、当該信号取得に使用されるデジタイザと同じ速度で発生させ得るので、光源自体の変調速度で行うことができる。これにより、多くの場合、一の測定を10サイクル以下(すなわち、CRDSシステムからの1から10の、又は1のみ、2、3、4、5、6、7、8、9、若しくは10の信号波形を使用して)で得ることができる。各測定を10ミリ秒以下で得ることができるので、せいぜい毎秒一回の測定を得るだけの前述のアナログタイプシステムと比べ、1秒に数千の個々の測定を得ることができると考えられる(当該サイクルが特にノイズを含む場合、例えば50又は100サイクルのような、追加のサイクルが必要となる)。したがって、興味周波数範囲にわたってスキャンされる周波数可変レーザ源に対し、吸収種のスペクトル全体を1秒未満で取得することができるので、検出プロセスが著しくスピードアップされ、既存システムよりも著しく速い完全な分光分析が可能となる。第4は、このデジタル復調法が、前述のアナログ検出システムと比べ、ノイズ上の利点をもたらすことである。アナログ検出システムにおいては、毎回の分析ステップが、当該波形に電子的ノイズを加える。ここでは、当該信号は即座にデジタル化され、すべての分析は、当該信号に追加ノイズが加えられない完全デジタル態様で行われる。さらに、本システムは、局所振動子が生成する局所振動子信号の周波数以外の周波数において生じるすべてのノイズ源に対して鈍感である。
This type of digital analysis offers several significant advantages over the aforementioned systems. First, all noise sources that do not match the frequency set in the local oscillator signal generated by the local oscillator are completely filtered out. In fact, the decay constant τ can be determined very accurately even in the presence of significant stochastic noise in the time decay waveform itself. Second, the signal offset does not affect the measured τ. Unlike the above-described analog system, the attenuation constant local oscillator (digitally generated signal) as long as the AC coupled, by a change in the DC offset of the ring-down waveform, observed using a digital mixing method Is not affected. The third is speed. By using digital hardware such as a field programmable gate array, even a parallel process required to obtain the intensity ratio described above can be generated at the same rate as the digitizer used for signal acquisition, This can be done at the modulation rate of the light source itself. This often results in one measurement taking 10 cycles or less (i.e. 1 to 10, or only 1, 2, 3, 4, 5, 6, 7, 8, 9, or 10 signals from a CRDS system). Using the waveform). Since each measurement can be obtained in 10 milliseconds or less, it is believed that at most thousands of individual measurements can be obtained per second compared to the analog type system described above, which at best obtains one measurement per second ( If the cycle is particularly noisy, additional cycles are required, eg 50 or 100 cycles). Thus, for a tunable laser source that is scanned over a range of frequencies of interest, the entire spectrum of absorbing species can be acquired in less than a second, thereby greatly speeding up the detection process and providing a complete spectrum that is significantly faster than existing systems. Analysis becomes possible. Fourth, this digital demodulation method provides a noise advantage compared to the analog detection system described above. In an analog detection system, each analysis step adds electronic noise to the waveform. Here, the signal is immediately digitized and all analysis is performed in a fully digital manner in which no additional noise is added to the signal. Furthermore, the system is insensitive to all noise sources that occur at frequencies other than the frequency of the local oscillator signal generated by the local oscillator.
図5に描かれる構成200の拡張として考えられる、図7に概略的に描かれるさらなる構成300において、局所振動子321は、任意の複合的な局所振動子信号波形323(これは、例えば、様々な周波数及び大きさの正弦波を重畳することにより形成することができる)を生成するべく適合することができる。これはその後、キャビティ130からの、検出器140によって検出される時間減衰信号出力115と混合される。この場合におけるデジタル混合器150からの出力363は、キャビティ130からの時間減衰信号115に存在する任意波形の周波数成分の結合の大きさを示す。この構成では、局所振動子信号は特定周波数の時間減衰信号への寄与を測定するべく使用されるだけでなく、波形323のような複合的な局所振動子信号波形を有する局所振動子信号が、当該複合的な局所振動子信号波形の周波数成分すべての測定を同時に与え、及び、当該周波数セットの時間減衰信号への寄与、又は代替的に、局所振動子の複合的な信号波形の時間減衰信号への未知の寄与を有するスペクトルを決定することを可能とする。この単純な例は、特定種の既知の吸収度の逆フーリエ変換を生成し、この逆フーリエ変換信号を局所振動子として使用することにより、本システムは、当該種からの時間減衰信号への寄与を決定し、ひいては、本測定システムに存在する当該特定種の濃度を決定する。
In a
なおもさらなる構成では、方形波変調信号を局所振動子として使用する上述の方法によって吸収種のスペクトルを得ることができる。当該方形波変調信号は、有利には、レーザ源を変調するべく使用されるものと同じ変調信号である。その結果、当該レーザにおけるノイズ源が、結果的なフーリエ変換信号(混合器モジュールからの出力)から除去される。スペクトルを得るべく、周波数可変レーザ源が用いられ、少なくとも一つのリングダウン信号が、興味領域の各波長において検出器により測定される。実際には、一以上のリングダウン信号が得られ、その結果が平均化される。一波長当たり1から10、1から20、1から50のリングダウン波形信号により正確な測定ができると考えられるが、必要とされる波形の実際の数は、当然のことながら当該信号のノイズレベルに依存する。 In a still further configuration, the spectrum of absorbing species can be obtained by the method described above using a square wave modulated signal as a local oscillator. The square wave modulation signal is advantageously the same modulation signal used to modulate the laser source. As a result, noise sources in the laser are removed from the resulting Fourier transform signal (output from the mixer module). To obtain the spectrum, a tunable laser source is used and at least one ring-down signal is measured by a detector at each wavelength of the region of interest. In practice, one or more ring-down signals are obtained and the results are averaged. While it is believed that accurate measurements can be made with 1 to 10, 1 to 20, 1 to 50 ringdown waveform signals per wavelength, the actual number of waveforms required is of course the noise level of the signal. Depends on.
ひとたび興味波長領域において吸収スペクトルが得られると(以下の実施例参照)、(潜在的に)未知の気相種の未知の寄与を包含する当該スペクトルを、同じ方法を繰り返してさらに使用することにより分析することができる。すなわち、測定吸収スペクトルが、局所振動子信号と混合される。当該局所振動子信号は、当該測定スペクトルに存在すると疑われる種の既知の吸収スペクトルを示す複合的な信号波形を含む。これは、デジタル復調法における当業者であればわかる、一般化されたフーリエ変換法の適用である。当該一般化されたフーリエ変換法の結果は、測定吸収スペクトルと、当該疑われる種の既知の吸収スペクトルとの直交性の尺度となる。これは、当該疑われる種が当該測定スペクトルに存在するパーセンテージ確率の関数である。本発明のシステムが測定する気相物質の構成種が未知であれば、適切なデータベース(例えばHITRAN(非特許文献12))から複数の既知の吸収スペクトルが得られるが、当該データベースから得られる吸収スペクトルをシミュレーションして当該分光計における測定条件(例えば温度)と整合させるべく注意が必要である。 Once an absorption spectrum is obtained in the wavelength region of interest (see examples below), the spectrum, which includes (potentially) unknown contributions of unknown gas phase species, is further used by repeating the same method. Can be analyzed. That is, the measured absorption spectrum is mixed with the local oscillator signal. The local oscillator signal includes a composite signal waveform that represents a known absorption spectrum of a species suspected of being present in the measurement spectrum. This is an application of a generalized Fourier transform method, as will be appreciated by those skilled in the art of digital demodulation. The result of the generalized Fourier transform method is a measure of the orthogonality between the measured absorption spectrum and the known absorption spectrum of the suspected species. This is a function of the percentage probability that the suspected species is present in the measured spectrum. If the constituent species of the gas phase substance to be measured by the system of the present invention is unknown, a plurality of known absorption spectra can be obtained from an appropriate database (for example, HITRAN (Non-Patent Document 12)). Care must be taken to match the measurement conditions (eg temperature) of the spectrometer by simulating the spectrum.
有利には、既知の吸収スペクトルを得る好ましい方法は、当該分光計自体から取得されるデータを使用する。これは、HITRANデータベースのような現行データベースシステムが予測できる分子よりも大きく及び複合的な分子の検出にとって特に適切である。すなわち、未知のものの分析を試みる前に同じ機器を使用してスペクトルライブラリを構築することである。既知の吸収スペクトルはその後それぞれ、ここに記載の態様によって測定スペクトルと別個に混合される。各既知スペクトルと各測定スペクトルとの直交性に応じて、測定種の組成が決定される。すなわち、この方法は、一層速い処理速度によるフィンガープリント分析において特に有利である。したがって、上述のデジタル信号復調法は、吸収度測定値をリアルタイムで抽出するデジタル復調法を使用して、高速リングダウンキャビティ波形を尋問する簡単なデジタル方法を与える。
Advantageously, the preferred method of obtaining a known absorption spectrum uses data obtained from the spectrometer itself. This is particularly appropriate for the detection of molecules that are larger and more complex than current database systems such as the HITRAN database can predict. That is, building a spectral library using the same instrument before attempting to analyze unknowns. Each known absorption spectrum is then separately mixed with the measured spectrum according to the embodiments described herein. The composition of the measurement species is determined according to the orthogonality between each known spectrum and each measured spectrum. That is, this method is particularly advantageous in fingerprint analysis with faster processing speed. Thus, the digital signal demodulation method described above provides a simple digital method for interrogating high-speed ring-down cavity waveforms using a digital demodulation method that extracts absorbance measurements in real time.
この方法は、CRDSを介する気相種の吸収度決定のみに限られないのは当然であるが、一以上の周波数における強度変化が、時間領域信号が生成されるシステム全体のパラメータを示す信号である場合の、任意の時間領域信号に適用することができる。例えば、上述の方法はまた、分子フィンガープリンティングのアプリケーションに適用することもできる。当該アプリケーションは、フーリエ変換赤外(FTIR)干渉計に関連して以下に記載される。ここでは、当該測定が、もはや時間的な減衰の測定ではなく、局所振動子信号が単数の正弦波である必要がないことが強調される。非常に複合的な局所振動子信号を、多くの周波数成分によって構成し、任意の時間変動信号において多数の興味周波数の振幅を同時かつ非常に迅速に測定することができる。 Naturally, this method is not limited only to determining the absorbance of gas phase species via CRDS, but the intensity change at one or more frequencies is a signal indicating the parameters of the entire system from which the time domain signal is generated. It can be applied to any time domain signal in some cases. For example, the methods described above can also be applied to molecular fingerprinting applications. The application is described below in connection with a Fourier transform infrared (FTIR) interferometer. It is emphasized here that the measurement is no longer a measurement of temporal decay and the local oscillator signal need not be a single sine wave. A very complex local oscillator signal can be composed of many frequency components and the amplitude of a number of frequencies of interest can be measured simultaneously and very quickly in any time-varying signal.
特定の実施例において、上記デジタル復調法が、以下に記載されるようにフーリエ変換赤外(FTIR)分光のアプリケーションに適用される。 In a specific embodiment, the digital demodulation method is applied to Fourier transform infrared (FTIR) spectroscopy applications as described below.
FTIR分光において、インコヒーレント光源からの光がマイケルソン干渉計及びサンプルを通過した後に検出器に落ちる。検出器における信号は、干渉計内におけるミラー位置の関数としてモニタされ、得られる干渉パターン(インターフェログラム)にフーリエ変換が適用される。その結果が、周波数空間における光源強度スペクトルである。吸収サンプルを当該光ビーム内に置くことにより光源が減衰し、得られるスペクトルはこの減衰を示す。当該ビーム内にサンプルがあり及びなしで得られたスペクトルから、サンプルの吸収スペクトルが得られる。単数気相種のFTIRスペクトルは一般に、吸収スペクトルにおけるピークの数百ではなくとも数十を示すのが一般的である。それぞれのピークは、吸収種の濃度に関する情報を包含する。ここに記載される復調法を使用して、すべての興味周波数における光源の減衰が迅速に決定される。 In FTIR spectroscopy, light from an incoherent light source falls on the detector after passing through the Michelson interferometer and sample. The signal at the detector is monitored as a function of the mirror position in the interferometer and a Fourier transform is applied to the resulting interference pattern (interferogram). The result is a light source intensity spectrum in frequency space. Placing the absorbing sample in the light beam attenuates the light source and the resulting spectrum shows this attenuation. From the spectrum obtained with and without the sample in the beam, the absorption spectrum of the sample is obtained. The FTIR spectrum of a singular gas phase species generally exhibits tens, if not hundreds of peaks in the absorption spectrum. Each peak contains information about the concentration of the absorbing species. Using the demodulation method described herein, the attenuation of the light source at all frequencies of interest is quickly determined.
理想的には、FTIRスペクトルから定量的情報を抽出するべく、当該サンプルによる吸収が観測される当該スペクトルのすべての点が使用される。一セットの吸収ピークが興味吸収種に起因し得るとされる単純な場合において、当該ピーク下の統合面積全体が使用されるのが一般的である。混合物における種の濃度を定量的に決定するための、いくつかの多変量法が開発されている(非特許文献6から8参照)。これらの方法は、古典的最小二乗回帰(CLS)、逆最小二乗回帰(ILS)、及び主成分分析(PCA)を含む。これらの方法はすべて、既知濃度の興味種の一セットの吸収スペクトルを使用する。これらのスペクトルは、未知のものを分析するべく使用されるのと同じ機器によって取得されるのがほぼ一般的であるが、計算されたスペクトルも使用することができる。このセットのスペクトルはその後、マトリックスを「トレーニング」するべく使用される。当該マトリックスはさらに、未知混合物のスペクトルから濃度情報を抽出するべく使用される。これらの方法はすべて、感度が当該吸収測定すべてに限定されるという同じ大きな制限を受ける。すなわち、低濃度においては、吸収分光法は、光源の観測強度の非常に小さな変化を測定するまでに低減される。加えて、有限データセットのフーリエ変換、すなわちフーリエ変換信号に望ましくないアーチファクトを付加するフーリエ変換用窓選択、によってもたらされるサテライトピークの形成を含むピーク形状の変形がある(別個のデータセットのフーリエ変換によって導入され得る望ましくないアーチファクトのさらなる説明に対して非特許文献13を参照)。実際のところ、これらの問題に対抗する試みとしてサテライトピーク及びピーク変形を最小限にするべく多岐にわたるアポダイゼーション法が開発されている。
Ideally, all points of the spectrum where absorption by the sample is observed are used to extract quantitative information from the FTIR spectrum. In the simple case where a set of absorption peaks can be attributed to the absorbing species of interest, it is common to use the entire integrated area under the peak. Several multivariate methods have been developed to quantitatively determine the concentration of species in a mixture (see
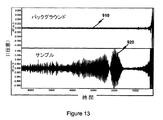
原理上は、FTIR機器が生成するインターフェログラムの分析により、サンプルの存在あり及びなしでの放射強度の差異を測定することにより課される制限を克服する方法が得られる。サンプルが不在であれば、FTIRにおける光源の放射スペクトルは一般に広く滑らかな曲線となり、得られるインターフェログラムは、小さなミラー変位において著しい強度を示すのみである。ビームの中に吸収体が置かれると、高周波数波形による時間領域インターフェログラムに特徴的な鋭い吸収フィーチャが吸収スペクトルに現れる。これは、一層大きなミラー変位に対しても持続性がある。その結果、鋭い吸収フィーチャにより生成される周波数固有の信号検出が、大きなミラー変位における近ゼロバックグラウンド測定となる。 In principle, analysis of the interferogram generated by the FTIR instrument provides a way to overcome the limitations imposed by measuring the difference in radiation intensity with and without the presence of a sample. In the absence of the sample, the emission spectrum of the light source in FTIR is generally a broad and smooth curve, and the resulting interferogram only shows significant intensity at small mirror displacements. When an absorber is placed in the beam, sharp absorption features characteristic of time domain interferograms with high frequency waveforms appear in the absorption spectrum. This is persistent even for larger mirror displacements. As a result, the frequency specific signal detection produced by the sharp absorbing features is a near zero background measurement at large mirror displacements.
様々なグループが従前より、FTIR分光法において生成されるインターフェログラムを分析する方法を使用しており(非特許文献9、10、及び11を参照)、典型的なソリューションは、帯域通過フィルタリングと、多くの場合上述のような多変量法を用いて吸収スペクトルではなくインターフェログラムを分析することとにより時間・空間フーリエ変換分析を行うことである。例えば、Brown及びその同僚(非特許文献10)は、興味吸収種の吸収スペクトルのトレーニングセットに基づいたマトリックスを使用して濃度データを得るべくカルマンフィルタを用いた。Smallら(非特許文献9)は、受動型FTIR分光法を使用しての、加熱されたプルームの環境モニタリングに適用されるインターフェログラムの直接分析のための2ステップ法を開発した。まず、デジタル帯域通過フィルタがインターフェログラムに適用され、興味周波数範囲外の信号が有効に除去される。次に、得られるフィルタリング済み波形の複数部分が、アンモニア及びエタノールのような種の存在を検出するべく数値パターン認識アルゴリズムを受ける。また、Stallardら(非特許文献11)は、バックグラウンドスペクトルが容易に得られないアプリケーションでの使用を目的として合成バックグラウンドを生成するべく、FTIRからのフィルタリング済みインターフェログラムを使用した。彼らは、センターバーストに中心があるガウス分布により当該波形を乗算することによってインターフェログラムをフィルタリングし、大きなミラー変位において生じる吸収種からの狭いピーク信号を有効に排除した。これら初期の方法はそれぞれ、データ分析に問題があった。最も顕著には、これらの結果を得るのに必要な時間において、帯域通過、低域通過、又は他のフィルタリング法からのデータにおけるアーチファクト及びシステムの複雑性に関する問題があった。すなわち、現在使用されている本発明の分析方法を代表する、上述の従来方法での計算を行うには熟練した操作者が必要となる。代替的に、本システムの必須計算が自動化されるとすれば、今度は、大量の計算パワー要件を有する値段が高いシステムが必要となる。本発明の方法は、本質的に乗算のみを行うので、計算による値段がかなり安くなり、操作者が、例えば、多くの波長/周波数における吸収度信号に係るリアルタイム分光分析のようなリアルタイム操作を行う上での必要な時間及び使用容易性の点で著しい利点が得られる。
Various groups have traditionally used methods of analyzing interferograms generated in FTIR spectroscopy (see
実施例1
約10Hzで発射する、ライン幅0.04nmを有するパルスN2レーザ励起色素レーザが、CRDS測定システム用レーザ源として使用された。真空状態キャビティ(圧力P<13Pa(0.1Torr))及び当該キャビティ内にNO2(最初は現行未知濃度)を有するもの双方に対する、各被尋問波長における100シングルショットのリングダウン波形である。例えば、図8A及び8Bそれぞれのプロット810及び820におけるシングルショットのリングダウン波形(実際にはこの場合、逆リングアップ波形)を参照のこと。使用された特定のセットアップにおいて、レーザ源は、出力パワー又は波長いずれにおいても安定しなかった。レーザ源の当該キャビティに対するモードマッチングは、まったく最適とはいえないものであった。それゆえ、リングダウン波形には著しいノイズが予想され、これはプロット810及び820において明確に観測される。
Example 1
A pulsed N 2 laser-excited dye laser emitting at about 10 Hz and having a line width of 0.04 nm was used as the laser source for the CRDS measurement system. 100 single shot ringdown waveforms at each interrogated wavelength for both a vacuum cavity (pressure P <13 Pa (0.1 Torr)) and one with NO 2 (initially unknown concentration initially) in the cavity. See, for example, the single shot ringdown waveform (actually the reverse ringup waveform in this case) in
リングダウン波形から分光データ点を決定する従来法において、各個別のリングダウン波形がフィッティングされて、時定数τに対する値が得られた。これは、最小二乗フィッティング法を使用するのが典型的である。平均からの2標準偏差を超える減衰定数の約10%のフィッター(fitter)が破棄された。ノイズがあるレーザ源に起因して、時定数τのショット対ショットフィッティング測定に対して著しい変動が観測された。データフィッティングのための総分析時間は約2時間であった。いくつかのリングダウン波形の平均が、フィッティング手順前に平均化されていれば、短い時間の利点が明らかにわかるのだが、この利点は最小となるだろう。 In the conventional method of determining spectroscopic data points from a ring-down waveform, each individual ring-down waveform was fitted to obtain a value for the time constant τ. This is typically using a least square fitting method. Approximately 10% of the fitter with an attenuation constant exceeding 2 standard deviations from the mean was discarded. Significant variation was observed for shot-to-shot fitting measurements of time constant τ due to noisy laser sources. Total analysis time for data fitting was about 2 hours. If the average of several ring-down waveforms is averaged before the fitting procedure, the advantage of short time is clearly seen, but this advantage will be minimal.
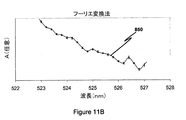
データもまた、上述の方法に従って分析された。当該データをフーリエに基づく分析に対して正しい形態とするべく、真空状態キャビティ及びNO2の未知圧力キャビティ双方に対して20の波形がデジタル的に収集された。ここで、波形が1つおきに時間上、反転されている(図9のプロット815及び825それぞれを参照)。フーリエ変換データのピークすべてが正であることを保証するべく、波形815及び825のフーリエパワースペクトル、及びフーリエ変換スペクトルにおける第2ピークと第1ピークの振幅(大きさ)比(0HzでのDCピークは無視)のみが計算された。フーリエ変換を生成し及び各波長において5波形を分析するのに十分なリングダウンデータが得られた(本実施例においては第1フーリエ変換を使用)。このステップに対する分析時間は5秒未満であった。したがって、この方法が、少なくとも分析フェーズを行う時間の関数として、従来型分析測定よりも非常に優れていることは明らかである。
The data was also analyzed according to the method described above. Twenty waveforms were collected digitally for both the vacuum cavity and the NO 2 unknown pressure cavity to ensure that the data was in the correct form for Fourier-based analysis. Here, every other waveform is inverted over time (see
図10は、観測時定数と、(図9の)波形825のフーリエ変換信号における第1及び第2ピークの観測ピーク比との関係をプロットしたものである。この較正曲線830は、実験的に得られた図4の較正曲線と類似する。リングダウン減衰定数τは、リングダウン波形分析を目的とする従来型最小二乗フィッティング法を使用して、個々のリングダウン信号出力トレース(例えば図8Bの820)を指数関数的減衰にフィッティングし、及び一波長当たり200ショットを平均することにより決定された。これはその後、較正曲線830を生成するべく、本発明の方法を使用して得られた周波数成分の比と対比された。図10のy軸上の比は単に、図9の波形825のフーリエ変換信号における基本ピークと第1次高調波ピークとの比である(本実施例においては高速フーリエ変換を使用)。従来法を最初に行い、これが本発明の方法を使用して得られた周波数成分の比と対比された。実際には、この較正曲線は、各特定分光計に対し、様々なサンプリングパラメータ(例えば、サンプリング時間及びサンプリング長)の関数として決定される。この較正データは当該分光計とともに蓄積され、当該特定分光計によって引き続き取得されたデータの分析に適用される。予想どおり、この関係は極めて非直線的であるが、当該非直線性を修正するべくこのデータのフィッティングが行われる。
FIG. 10 is a plot of the relationship between the observation time constant and the observed peak ratio of the first and second peaks in the Fourier transform signal of the waveform 825 (of FIG. 9). This calibration curve 830 is similar to the calibration curve of FIG. 4 obtained experimentally. The ring-down attenuation constant τ fits individual ring-down signal output traces (eg, 820 in FIG. 8B) to exponential attenuation using a conventional least square fitting method for ring-down waveform analysis, and Determined by averaging 200 shots per wavelength. This was then contrasted with the ratio of frequency components obtained using the method of the present invention to generate a calibration curve 830. The ratio on the y-axis in FIG. 10 is simply the ratio between the basic peak and the first harmonic peak in the Fourier transform signal of the
図11A及び11Bはそれぞれ、τ0が真空状態キャビティの時定数である場合の従来法によって得られた吸収スペクトル[(1/τ−1/τ0)対波長]840、及び未修正吸収スペクトル[(比(NO2)−比(ベースライン))対波長]を示す。ここに記載されるフーリエ変換法を使用して未修正吸収スペクトル850を決定するべく使用された比は、真空状態キャビティ[すなわち比(ベースライン)]及び未知濃度NO2[すなわち(比(NO2)]双方に対して、双方ともレーザ源の波長の関数として、フーリエ変換データにおける第1及び第2ピークのパワースペクトルの振幅比を取ることによって得られる。双方の場合において、エラーバーは1標準偏差を表す。データ点を接続するラインは、各図において単なる視覚上の補助である。フーリエ変換信号における第1及び第2の2ピーク間の比を使用するだけで、各データのエラーは、従来法における同様のデータ点よりも既に小さい。データが従来法においては計算から破棄されたが、ここに記載のフーリエ変換法を使用する吸収スペクトルの計算に対してはデータの破棄がされていない、すなわちすべての収集データが計算に使用される、ことも注目される。従来法における各点の平均標準偏差は約2%であるが、本発明のフーリエ変換法は1.2%にすぎない。各測定に対する時定数の計算において決定され及び使用される、フーリエ変換信号における高次成分の比と対比すれば、著しい改善がなおも見られることが予想される。
11A and 11B show the absorption spectrum [(1 / τ−1 / τ 0 ) vs. wavelength] 840 obtained by the conventional method when τ 0 is the time constant of the vacuum state cavity, and the uncorrected absorption spectrum [ (Ratio (NO 2 ) −ratio (baseline)) vs. wavelength]. The ratio used to determine the
図11A及び11Bからわかるように、本発明の方法は、従来法の信号分析よりも優れた誤差処理及び著しく低減された時間要求を分析法に与える。本発明のフーリエ変換混合法のデータ処理をハードウェアに実装することによって付加的な利得が予想される。例えば、当該ハードウェアは、並列デジタルハードウェアに基づく処理をするべく設計されるフィールドプログラマブルゲートアレイ(FPGA)である。当該処理は、コンピュータ上で計算を行うよりも本質的に速く、少なくとも2又は3桁の大きさの速度利得が予想される。FPGAを使用するハードウェア実装はまた、本システム全体のサイズにおいて著しい利点を与える。当該ハードウェアは、例えば、レーザ源の制御、当該レーザ源を変調して及び/又は当該検出時間減衰信号出力を変調して比分析のためのいくつかの周波数成分にする方形波変調源の生成のような、本システムの複数の機能を行うべく設計することができるからである。また、CRDSキャビティの当該源へのロックを制御するべく、検出信号に対してすべてのデータ処理を行うべく、及び本システムに対するすべての入力及び出力を制御するべく構成することができるからである。 As can be seen from FIGS. 11A and 11B, the method of the present invention provides the analysis method with better error handling and significantly reduced time requirements than conventional signal analysis. Additional gains are expected by implementing the Fourier transform mixing method data processing of the present invention in hardware. For example, the hardware is a field programmable gate array (FPGA) designed for processing based on parallel digital hardware. The process is inherently faster than doing calculations on a computer, and a speed gain of at least 2 or 3 orders of magnitude is expected. Hardware implementations using FPGAs also offer significant advantages in the overall system size. The hardware may, for example, control the laser source, modulate the laser source and / or modulate the detection time decay signal output to generate a square wave modulation source into several frequency components for ratio analysis. This is because it can be designed to perform a plurality of functions of the present system. It can also be configured to control the locking of the CRDS cavity to that source, to perform all data processing on the detection signal, and to control all inputs and outputs to the system.
実施例2
ここに記載されるデジタル復調法は、鋭いオーバラップ吸収フィーチャを有する干渉種が不在の場合に、FTIRインターフェログラムを分析する代替的方法として用いることができる。その結果は、バックグラウンドスペクトルを有する比の取得必要性及びこれが導入するノイズを排除する近ゼロバックグラウンド測定である。
Example 2
The digital demodulation method described herein can be used as an alternative method for analyzing FTIR interferograms in the absence of interfering species with sharp overlapping absorption features. The result is a near-zero background measurement that eliminates the need to obtain a ratio with a background spectrum and the noise it introduces.
例えば、ここに開示されるフーリエ変換法は、炭素12C及び13Cにおける同位体比(天然の存在量ではそれぞれ98.1%及び1.9%)を測定するべく使用された。当該比は13C/12Cとして定義される。この比はシグネチャとして作用し得るので、異なる元素の同位体比の組み合わせによって、例えば石油化学製品、グラファイトのような炭素化合物の起源、又は代替的に、合成物質の起源を決定するべく使用することができる。この比はまた、とりわけ、生物学(例えば、生体の食餌又は植物の起源若しくは生長条件の決定)において、又は医学(例えば典型的に腫瘍に存在する所定バクテリアの存在検出)においても使用することができる。 For example, the Fourier transform method disclosed herein was used to measure isotope ratios at carbon 12 C and 13 C (98.1% and 1.9% in natural abundance, respectively). The ratio is defined as 13 C / 12 C. Since this ratio can act as a signature, it can be used to determine the origin of synthetic compounds, for example, the origin of carbon compounds such as petrochemicals, graphite, or alternatively, by a combination of isotopic ratios of different elements Can do. This ratio may also be used, inter alia, in biology (eg, determining the origin or growth conditions of a living diet or plant) or in medicine (eg, detecting the presence of certain bacteria typically present in a tumor). it can.
安息香酸のサンプルが、当該サンプル中の13Cの結合を制御するべく、13C標識された安息香酸と定量的に混合された。安息香酸の0.20から0.40グラムのペレットが過剰酸素において燃焼され、CO2が形成された。燃焼生成物CO2が、マイケルソン干渉計構成を有するFTIR分光計内に置かれ、13C/12C比が決定された。図12は、FTIR分光計から得られたサンプルのインターフェログラム900を示す。当該インターフェログラムは、y軸に関して対称であって、複数の周波数波の合成である。当該インターフェログラムの中心部分(「センターバースト」)が、マイケルソン干渉計内の2つのミラーからの距離が等しいところに存在する。
A sample of benzoic acid was quantitatively mixed with 13 C-labeled benzoic acid to control 13 C binding in the sample. 0.20 0.40 grams of pellets of benzoic acid is burned in excess oxygen, CO 2 is formed. The combustion product CO 2 was placed in an FTIR spectrometer with a Michelson interferometer configuration and the 13 C / 12 C ratio was determined. FIG. 12 shows a
図13は、分光計にサンプルがない場合のバックグラウンド信号910の、FTIRからのインターフェログラム信号を示し、CO2サンプルのインターフェログラム920も示す。サンプル(I)を介しての伝播が、センターバーストを排除し、後の時刻(すなわち図13における10,000を超える時刻)におけるデータを変換することによってバックグラウンド信号(I0)から分離される。図14は、FTIR信号出力930、すなわちインターフェログラム920(センターバーストを含む)のフーリエ変換、を示す。これは、CO2吸収スペクトル(図15の932)並びに当該源のスペクトル内容及び強度(図15の934)を含む。
FIG. 13 shows the interferogram signal from the FTIR of the
図16は、ここに開示される方法及びシステムを使用して得られた12C16O2及び13C16O2のFTIR吸収スペクトルである。これは、2300cm−1付近にある13C16O2の強い基本吸収帯域、及び3700cm−1付近にある12C16O2の弱い結合帯域を示す。基本吸収ピークを結合帯域のそれと対比することにより、匹敵する強度の対比が可能となるので、本システムにおける制限されたダイナミックレンジの影響を低減することができる。 FIG. 16 is an FTIR absorption spectrum of 12 C 16 O 2 and 13 C 16 O 2 obtained using the methods and systems disclosed herein. This indicates a strong basic absorption bands of 13 C 16 O 2 in the vicinity 2300 cm -1, and 12 weak binding band of C 16 O 2 in the vicinity 3700 cm -1. By comparing the fundamental absorption peak with that of the coupling band, comparable intensity comparisons are possible, thus reducing the effects of limited dynamic range in the system.
図7の構成に関連して上述したように、適切な局所振動子信号があれば、一セットの正弦波の複合的な波形への寄与を、混合器を使用して決定することができる。混合器を使用してインターフェログラムから直接濃度情報を抽出する上で、当該適切な局所振動子信号は、吸収が生じるすべての周波数における一セットの正弦波を包含する波形である。この局所振動子信号を生成する一つの方法は、逆フーリエ変換を興味種の吸収スペクトル(すなわち図16の吸収スペクトル)に適用することである。得られる干渉パターンはその後、局所振動子として使用され、混合器においてFTIRインターフェログラムと混合かつ結合(混合)される。これにより、混合器出力のDC成分が興味種による伝播の一次関数となる混合信号が生成される。これは、多くの異なる周波数における吸収(吸収度)の同時モニタリングを可能とする。 As described above in connection with the configuration of FIG. 7, given a suitable local oscillator signal, the contribution of a set of sinusoids to the composite waveform can be determined using a mixer. In extracting concentration information directly from the interferogram using a mixer, the appropriate local oscillator signal is a waveform that includes a set of sine waves at all frequencies where absorption occurs. One way to generate this local oscillator signal is to apply an inverse Fourier transform to the absorption spectrum of the species of interest (ie, the absorption spectrum of FIG. 16). The resulting interference pattern is then used as a local oscillator and mixed and combined (mixed) with the FTIR interferogram in a mixer. As a result, a mixed signal is generated in which the DC component of the mixer output is a linear function of propagation by the species of interest. This allows simultaneous monitoring of absorption (absorbance) at many different frequencies.
ここに開示されるFTIR信号及びフーリエ変換混合法によって、様々な13C濃度を有するサンプルを使用して得られた13C/12C比測定の結果を、質量分析法によって決定された当該サンプルの13C/12C比と対比した。これを図17に示す。本実施例の絶対精度は、吸収フィーチャの周波数ドリフトゆえに約0.01%に限られていた。これは、適切なピーク追跡システムを使用することで著しく改善されると予想される。わかるように、ピーク周波数シフトを考慮しても、本発明の方法の質量分析法測定との一致は、R2=0.9988という優れたものである。 With the FTIR signal and Fourier transform mixing methods disclosed herein, the results of 13 C / 12 C ratio measurements obtained using samples with various 13 C concentrations were determined for the samples determined by mass spectrometry. Contrast with 13 C / 12 C ratio. This is shown in FIG. The absolute accuracy of this example was limited to about 0.01% due to the frequency drift of the absorbing features. This is expected to be significantly improved by using an appropriate peak tracking system. As can be seen, even when the peak frequency shift is taken into account, the agreement of the method of the present invention with the mass spectrometry measurement is excellent, R 2 = 0.9988.
この方法はいくつかの利点を有する。第1に、短いミラー変位でのデータが無視される場合、この方法が近ゼロバックグラウンド測定となることである。長いミラー変位に対して持続性がある信号のみが、鋭い吸収フィーチャに帰することができる信号だからである。第2に、データ分析が速いことである。適切な局所振動子信号によって、デジタル混合器を、信号取得プロセスと同じ速さ又はこれをも超える速さでインターフェログラムに適用することができる。最後に、上述のCRDSシステムのように、このアプローチが、局所振動子が生成する局所振動子信号における周波数以外の周波数において生じるノイズ源すべてに対し鈍感となることである。 This method has several advantages. First, if the data at short mirror displacements is ignored, this method becomes a near zero background measurement. Only signals that are persistent for long mirror displacements are signals that can be attributed to sharp absorbing features. Second, data analysis is fast. With the appropriate local oscillator signal, the digital mixer can be applied to the interferogram as fast as or even faster than the signal acquisition process. Finally, like the CRDS system described above, this approach is insensitive to all noise sources that occur at frequencies other than those in the local oscillator signal generated by the local oscillator.
上に述べた/例示した方法及びシステムが、吸収度信号のリアルタイム分光モニタリングにとって特に有用であるがこの分野に限られない、吸収度データの迅速なデジタル光スペクトル分析のための改善されたシステム及び方法を少なくとも実質的に与えることが理解される。例えば、本方法は、変調信号が、最初は方形波又は準方形波信号に類似した信号から、経時的にさらに分散しかつ準三角波信号に極めて類似する信号まで劣化する、自由空間又は光ファイバのような通信リンクを介して送信される変調光信号を定量化するべく有用となり得る。本方法において、光信号の劣化の分析は、例えば、通信リンクを介しての伝播品質及び/又は当該通信リンクにおける任意の光ファイバリンクの品質を決定する上で有用となり得る。したがって、ここに与えられる方法及びシステムは、広域にわたるアプリケーションを有し、光領域のみにリンクするわけではなく、他の電子システムにおける信号、例えば電子信号又はとりわけマイクロ波/短波/長波/モバイル通信、にもリンクする。本発明の方法を当該いずれのアプリケーションに使用することも、本発明の要旨内での使用である。 The above described / exemplified method and system is particularly useful for real-time spectroscopic monitoring of absorbance signals, but is not limited to this field, and an improved system for rapid digital optical spectrum analysis of absorbance data and It is understood that the method is provided at least substantially. For example, the method can be used in free-space or optical fiber where the modulation signal degrades from a signal that is initially similar to a square or quasi-square wave signal to a signal that is more dispersed over time and very similar to a quasi-triangular signal It can be useful to quantify modulated optical signals transmitted over such communication links. In this method, analysis of optical signal degradation can be useful, for example, in determining the quality of propagation over a communication link and / or the quality of any optical fiber link in the communication link. Thus, the methods and systems provided herein have a wide range of applications and do not link only to the optical domain, but signals in other electronic systems such as electronic signals or especially microwave / shortwave / longwave / mobile communications, Also link to The use of the method of the present invention for any such application is also within the scope of the present invention.
したがって、ここに記載される及び/又は図面に示されるシステム及び方法は、例示のみによって提示され、本発明の範囲を限定しない。特に記載のない限り、信号分析方法及び装置の個々の側面及びコンポーネントを修正してもよく、又は、周知の均等物、若しくは将来開発される置換物のような又は将来許容可能とわかる置換物のような依然未知の置換物に置換されていてもよい。本信号分析方法及び装置はまた、請求される発明の範囲及び要旨内に留まる間、様々なアプリケーションに対して修正することができる。潜在的なアプリケーションの範囲が大きいからであり、並びに、本信号分析方法及び装置は当該バリエーションの多くに適合可能であることが意図されるからである。 Accordingly, the systems and methods described herein and / or shown in the drawings are presented by way of example only and do not limit the scope of the invention. Unless otherwise stated, individual aspects and components of signal analysis methods and apparatus may be modified, or known equivalents, or substitutions that are known to be acceptable in the future, such as substitutions developed in the future. It may be substituted with such an unknown substitute. The signal analysis method and apparatus can also be modified for various applications while remaining within the scope and spirit of the claimed invention. This is because the range of potential applications is large, and the signal analysis method and apparatus are intended to be compatible with many of the variations.
Claims (17)
混合器において、前記時間領域信号を、局所振動子が生成する局所振動子信号と混合し、前記局所振動子信号の基本周波数及び前記基本周波数以外の他の周波数における少なくとも2つのフーリエ変換時間領域信号を含むフーリエ変換時間領域信号を生成することと、
前記基本周波数及び前記他の周波数における前記少なくとも2つのフーリエ変換時間領域信号のそれぞれの大きさを決定することと、
前記基本周波数及び前記他の周波数における前記少なくとも2つのフーリエ変換時間領域信号の大きさとの比を決定すること
を含む方法。 A method for determining an attenuation constant of a time domain signal, comprising:
In the mixer, the time domain signal is mixed with a local oscillator signal generated by a local oscillator, and at least two Fourier transform time domain signals at a fundamental frequency of the local oscillator signal and a frequency other than the fundamental frequency Generating a Fourier transform time domain signal comprising :
Determining the magnitude of each of the at least two Fourier transform time domain signals at the fundamental frequency and the other frequencies ;
Determining a ratio of the magnitude of the at least two Fourier transform time domain signals at the fundamental frequency and the other frequencies .
前記時間領域信号を局所振動子信号と混合し、前記局所振動子信号の基本周波数及び前記基本周波数以外の他の周波数における少なくとも2つのフーリエ変換時間領域信号を含むフーリエ変換時間領域信号を生成する混合信号を得る混合器と、
前記基本周波数及び前記他の周波数における前記少なくとも2つのフーリエ変換時間領域信号のそれぞれの大きさを決定する決定器と
を含み、
前記決定器はさらに、前記基本周波数及び前記他の周波数における前記少なくとも2つのフーリエ変換時間領域信号の大きさの比を決定するシステム。 A system for determining the decay constant of the time domain signal,
Mixing the time domain signal with a local oscillator signal to generate a Fourier transform time domain signal including at least two Fourier transform time domain signals at a fundamental frequency of the local oscillator signal and a frequency other than the fundamental frequency A mixer for obtaining a signal;
Look including a determiner for determining a magnitude of each of said at least two Fourier transform the time domain signal in the fundamental frequency及 beauty the other frequencies,
The determiner further determines a ratio of magnitudes of the at least two Fourier transform time domain signals at the fundamental frequency and the other frequencies .
前記変調信号を使用して変調されるべく適合される光源と、
前記光源からの変調光と共振して吸収度信号を出力するべく適合される光キャビティと、
前記吸収度信号を検出して時間領域信号を生成する検出器と
をさらに含み、
前記決定器は、前記少なくとも2つのフーリエ変換時間領域信号の大きさの比を分析してサンプルの吸収度を決定する、請求項6に記載のシステム。 A modulator for generating a modulated signal and the local oscillator signal,
A light source adapted to be modulated using the modulated signal;
An optical cavity which is adapted to output an intake Osamudo signal resonates the modulated light from said light source,
A detector that detects the absorbance signal and generates a time domain signal;
Further including
The system of claim 6, wherein the determiner analyzes a ratio of magnitudes of the at least two Fourier transform time domain signals to determine a sample absorbance.
Applications Claiming Priority (3)
| Application Number | Priority Date | Filing Date | Title |
|---|---|---|---|
| AU2010903745A AU2010903745A0 (en) | 2010-08-20 | Optical signal processing method and apparatus | |
| AU2010903745 | 2010-08-20 | ||
| PCT/AU2011/001071 WO2012021943A1 (en) | 2010-08-20 | 2011-08-19 | Optical signal processing method and apparatus for analysing time-decay signals |
Publications (2)
| Publication Number | Publication Date |
|---|---|
| JP2013534317A JP2013534317A (en) | 2013-09-02 |
| JP6022456B2 true JP6022456B2 (en) | 2016-11-09 |
Family
ID=45604624
Family Applications (1)
| Application Number | Title | Priority Date | Filing Date |
|---|---|---|---|
| JP2013524308A Active JP6022456B2 (en) | 2010-08-20 | 2011-08-19 | Method and system for determining the decay constant of a time domain signal |
Country Status (7)
| Country | Link |
|---|---|
| US (1) | US10345235B2 (en) |
| EP (1) | EP2606324B1 (en) |
| JP (1) | JP6022456B2 (en) |
| KR (1) | KR101706640B1 (en) |
| CN (1) | CN103154684B (en) |
| AU (1) | AU2011291414B2 (en) |
| WO (1) | WO2012021943A1 (en) |
Families Citing this family (21)
| Publication number | Priority date | Publication date | Assignee | Title |
|---|---|---|---|---|
| US8787767B2 (en) * | 2012-02-03 | 2014-07-22 | Raytheon Company | High-speed low-jitter communication system |
| AU2013308373B2 (en) * | 2012-08-30 | 2016-11-10 | Newsouth Innovations Pty Limited | Multiplexed spectroscopic absorbance from CRDS wave forms |
| US9449128B2 (en) * | 2012-11-29 | 2016-09-20 | The Mathworks, Inc. | Automatic computation of fundamental frequencies and maximum harmonic orders for radio frequency systems |
| JP6184141B2 (en) * | 2013-03-21 | 2017-08-23 | 日本分光株式会社 | Modulation signal detector for photoelastic modulator |
| JP6281973B2 (en) * | 2013-12-10 | 2018-02-21 | 国立大学法人京都大学 | Method for expressing properties of a mixture sample, method for evaluating properties of a mixture sample, method for identifying attributes of a mixture sample, and method for processing an electromagnetic wave signal derived from a mixture sample |
| US10925515B2 (en) | 2014-05-22 | 2021-02-23 | Picomole Inc. | Alveolar breath collection apparatus |
| AU2015327741B2 (en) | 2014-10-03 | 2021-03-11 | Newsouth Innovations Pty Limited | Cavity enhanced spectroscopy using off-axis paths |
| EP3153846A1 (en) * | 2015-10-08 | 2017-04-12 | Nederlandse Organisatie voor toegepast- natuurwetenschappelijk onderzoek TNO | Method and system for measuring a sensor |
| CN105608434A (en) * | 2015-12-23 | 2016-05-25 | 苏州汇莱斯信息科技有限公司 | Feature recognition technology-based fingerprint recognition algorithm |
| WO2017214155A1 (en) * | 2016-06-06 | 2017-12-14 | The Trustees Of Princeton University | Chirped laser dispersion spectroscopy sensitivity booster |
| US10666012B2 (en) | 2017-03-13 | 2020-05-26 | Picomole Inc. | Apparatus and method of optimizing laser system |
| CN106950194B (en) * | 2017-03-17 | 2018-06-12 | 哈尔滨翰奥科技有限公司 | Gas sensor and the method for detecting concentration of SO 2 gas variation |
| CN107607519B (en) * | 2017-08-27 | 2020-10-02 | 南京理工大学 | Multi-pulse free attenuation method for signal acquisition of microwave spectrometer |
| JP7035736B2 (en) * | 2018-04-03 | 2022-03-15 | 株式会社豊田中央研究所 | Concentration measuring device and concentration measuring method |
| JP7006800B2 (en) * | 2018-09-20 | 2022-01-24 | 株式会社島津製作所 | Gas measuring device and gas measuring method |
| US11035789B2 (en) | 2019-04-03 | 2021-06-15 | Picomole Inc. | Cavity ring-down spectroscopy system and method of modulating a light beam therein |
| CN111141707A (en) * | 2019-12-25 | 2020-05-12 | 电子科技大学 | High-resolution imaging measurement method for reflectivity distribution of high-reflection optical element |
| US11957450B2 (en) | 2020-02-28 | 2024-04-16 | Picomole Inc. | Apparatus and method for collecting a breath sample using an air circulation system |
| US11782049B2 (en) | 2020-02-28 | 2023-10-10 | Picomole Inc. | Apparatus and method for collecting a breath sample using a container with controllable volume |
| AU2020456218A1 (en) * | 2020-07-01 | 2023-02-23 | Chevron U.S.A. Inc. | Stratigraphic methods |
| WO2023279330A1 (en) * | 2021-07-08 | 2023-01-12 | Huawei Technologies Co., Ltd. | Coherent optical spectrum analysis |
Family Cites Families (16)
| Publication number | Priority date | Publication date | Assignee | Title |
|---|---|---|---|---|
| GB975600A (en) * | 1961-09-07 | 1964-11-18 | Standard Telephones Cables Ltd | Apparatus for the determination of attenuation in waveguides |
| JPH0843204A (en) * | 1994-06-23 | 1996-02-16 | Philips Electron Nv | Multiplex-frequency spectrometer |
| EP0689045A1 (en) | 1994-06-23 | 1995-12-27 | Koninklijke Philips Electronics N.V. | Multi-frequency modulation spectrometer |
| JP3844815B2 (en) * | 1996-08-30 | 2006-11-15 | 浜松ホトニクス株式会社 | Method and apparatus for measuring absorption information of scatterers |
| US5973782A (en) * | 1997-01-09 | 1999-10-26 | Southwest Sciences Incorporated | Phaseless wavelength modulation spectroscopy |
| DE69941741D1 (en) | 1998-01-22 | 2010-01-14 | British Telecomm | Reception of narrow band interference speiseband signals |
| US6356350B1 (en) * | 1998-07-30 | 2002-03-12 | Southwest Sciences Incorporated | Wavelength modulation spectroscopy with multiple harmonic detection |
| EP1307714A4 (en) | 2000-07-12 | 2007-04-04 | Macquarie Res Ltd | Optical heterodyne detection in optical cavity ringdown spectroscopy |
| DE10209257A1 (en) | 2002-03-01 | 2003-09-11 | Philips Intellectual Property | Process for the elastographic examination of an object |
| WO2005108939A1 (en) * | 2004-05-12 | 2005-11-17 | Macquarie University | Cavity ringdown spectroscopy with swept-frequency laser |
| US7387027B2 (en) * | 2004-07-23 | 2008-06-17 | Massachusetts Institute Of Technology | Characterization of materials with optically shaped acoustic waveforms |
| US20070229834A1 (en) | 2004-10-22 | 2007-10-04 | Patel C Kumar N | System and method for high sensitivity optical detection of gases |
| WO2007034681A1 (en) * | 2005-09-07 | 2007-03-29 | National University Corporation Nagoya University | Spectroscopic method and device |
| US7505748B2 (en) | 2005-09-28 | 2009-03-17 | Freescale Semicondductor, Inc. | Linear voltage controlled variable attenuator with linear DB/V gain slope |
| DE102009015746B4 (en) * | 2009-03-31 | 2011-09-29 | Globalfoundries Dresden Module One Limited Liability Company & Co. Kg | Method and system for material characterization in semiconductor positioning processes based on FTIR with variable angle of incidence |
| US8144323B2 (en) * | 2010-03-25 | 2012-03-27 | Goodrich Corporation | Apparatus, method and computer-readable storage medium for determining the ring-down time in a spectrometer system |
-
2011
- 2011-08-19 AU AU2011291414A patent/AU2011291414B2/en active Active
- 2011-08-19 WO PCT/AU2011/001071 patent/WO2012021943A1/en active Application Filing
- 2011-08-19 KR KR1020137002250A patent/KR101706640B1/en active IP Right Grant
- 2011-08-19 JP JP2013524308A patent/JP6022456B2/en active Active
- 2011-08-19 CN CN201180040415.6A patent/CN103154684B/en active Active
- 2011-08-19 US US13/809,569 patent/US10345235B2/en active Active
- 2011-08-19 EP EP11817586.8A patent/EP2606324B1/en active Active
Also Published As
| Publication number | Publication date |
|---|---|
| EP2606324A4 (en) | 2015-07-01 |
| EP2606324B1 (en) | 2019-09-25 |
| AU2011291414A1 (en) | 2013-01-24 |
| JP2013534317A (en) | 2013-09-02 |
| US20130144561A1 (en) | 2013-06-06 |
| WO2012021943A1 (en) | 2012-02-23 |
| KR101706640B1 (en) | 2017-02-15 |
| CN103154684A (en) | 2013-06-12 |
| EP2606324A1 (en) | 2013-06-26 |
| CN103154684B (en) | 2016-06-08 |
| AU2011291414B2 (en) | 2015-12-03 |
| US10345235B2 (en) | 2019-07-09 |
| KR20130139222A (en) | 2013-12-20 |
Similar Documents
| Publication | Publication Date | Title |
|---|---|---|
| JP6022456B2 (en) | Method and system for determining the decay constant of a time domain signal | |
| US6356350B1 (en) | Wavelength modulation spectroscopy with multiple harmonic detection | |
| EP2072979B1 (en) | Method for measuring the concentration of a gas component in a measuring gas | |
| EP1510798B1 (en) | Wavelength modulation spectroscopy method and system | |
| EP1544604B1 (en) | Wavelength modulation spectroscopy method | |
| US9329123B2 (en) | Multiplexed spectroscopic absorbance from CRDS wave forms | |
| US9797832B2 (en) | Method and gas analyzer for measuring the concentration of a gas component in a sample gas | |
| CN110553993A (en) | Spectrum measurement system and multi-heterodyne beat frequency signal detection and data processing method | |
| Brumfield et al. | Characterization of a swept external cavity quantum cascade laser for rapid broadband spectroscopy and sensing | |
| He et al. | Off-axis integrated cavity output spectroscopy for real-time methane measurements with an integrated wavelength-tunable light source | |
| Elmaleh et al. | THz cavity ring-down quantitative gas phase spectroscopy | |
| Lucchesini et al. | Diode laser spectroscopy of overtone bands of acetylene | |
| Mao et al. | High-sensitivity all-optical PA spectrometer based on fast swept laser interferometry | |
| Li et al. | Wavelength modulation‐based active laser heterodyne spectroscopy for standoff gas detection | |
| Petrov et al. | Multipass Raman gas analyzer for monitoring of atmospheric air composition | |
| He et al. | Continuous-wave cavity ringdown absorption spectroscopy with a swept-frequency laser: rapid spectral sensing of gas-phase molecules | |
| Wu et al. | High sensitivity open‐path gas sensor based on a triangular multi‐pass cell | |
| Nagarajan et al. | Cavity-based medium resolution spectroscopy (CBMRS) in the THz: A bridge between high-and low-resolution techniques for sensor and spectroscopy applications | |
| Friedrichs | Sensitive absorption methods for quantitative gas phase kinetic measurements. Part 2: Cavity ringdown spectroscopy | |
| Makowiecki et al. | Wavelength modulation spectroscopy for measurements of temperature and species concentration downstream from a supersonic nozzle | |
| Corsi et al. | Detection of HCl on the first and second overtone using semiconductor diode lasers at 1.7 μm and 1.2 μm. | |
| Pupeza et al. | Field-resolved spectroscopy approaching ultimate detection sensitivity | |
| Orr et al. | Cavity-based absorption spectroscopy techniques | |
| Lehmann et al. | Sub-doppler Double-resonance Spectroscopy Of Methane Using A Frequency Comb Probe | |
| Hofer et al. | Field-resolved spectroscopy approaching ultimate detection sensitivity.(submitted to Nature) |
Legal Events
| Date | Code | Title | Description |
|---|---|---|---|
| A621 | Written request for application examination |
Free format text: JAPANESE INTERMEDIATE CODE: A621 Effective date: 20140728 |
|
| A131 | Notification of reasons for refusal |
Free format text: JAPANESE INTERMEDIATE CODE: A131 Effective date: 20150728 |
|
| A521 | Request for written amendment filed |
Free format text: JAPANESE INTERMEDIATE CODE: A523 Effective date: 20151021 |
|
| A131 | Notification of reasons for refusal |
Free format text: JAPANESE INTERMEDIATE CODE: A131 Effective date: 20160315 |
|
| TRDD | Decision of grant or rejection written | ||
| A01 | Written decision to grant a patent or to grant a registration (utility model) |
Free format text: JAPANESE INTERMEDIATE CODE: A01 Effective date: 20160906 |
|
| A61 | First payment of annual fees (during grant procedure) |
Free format text: JAPANESE INTERMEDIATE CODE: A61 Effective date: 20161005 |
|
| R150 | Certificate of patent or registration of utility model |
Ref document number: 6022456 Country of ref document: JP Free format text: JAPANESE INTERMEDIATE CODE: R150 |
|
| R250 | Receipt of annual fees |
Free format text: JAPANESE INTERMEDIATE CODE: R250 |
|
| R250 | Receipt of annual fees |
Free format text: JAPANESE INTERMEDIATE CODE: R250 |
|
| R250 | Receipt of annual fees |
Free format text: JAPANESE INTERMEDIATE CODE: R250 |
|
| R250 | Receipt of annual fees |
Free format text: JAPANESE INTERMEDIATE CODE: R250 |
|
| R250 | Receipt of annual fees |
Free format text: JAPANESE INTERMEDIATE CODE: R250 |