JP5868216B2 - Clustering apparatus and clustering program - Google Patents
Clustering apparatus and clustering program Download PDFInfo
- Publication number
- JP5868216B2 JP5868216B2 JP2012040134A JP2012040134A JP5868216B2 JP 5868216 B2 JP5868216 B2 JP 5868216B2 JP 2012040134 A JP2012040134 A JP 2012040134A JP 2012040134 A JP2012040134 A JP 2012040134A JP 5868216 B2 JP5868216 B2 JP 5868216B2
- Authority
- JP
- Japan
- Prior art keywords
- series data
- local time
- time series
- cluster
- local
- Prior art date
- Legal status (The legal status is an assumption and is not a legal conclusion. Google has not performed a legal analysis and makes no representation as to the accuracy of the status listed.)
- Active
Links
- 238000000034 method Methods 0.000 claims description 78
- 238000012545 processing Methods 0.000 claims description 51
- 238000013075 data extraction Methods 0.000 claims description 43
- 238000001514 detection method Methods 0.000 claims description 34
- 238000000611 regression analysis Methods 0.000 claims description 16
- 230000008929 regeneration Effects 0.000 claims description 11
- 238000011069 regeneration method Methods 0.000 claims description 11
- 238000011156 evaluation Methods 0.000 claims description 7
- 230000005856 abnormality Effects 0.000 description 48
- 238000013499 data model Methods 0.000 description 33
- 238000010586 diagram Methods 0.000 description 28
- 239000000446 fuel Substances 0.000 description 13
- 230000015654 memory Effects 0.000 description 12
- 238000013450 outlier detection Methods 0.000 description 10
- 230000006866 deterioration Effects 0.000 description 8
- 230000006870 function Effects 0.000 description 6
- 238000000491 multivariate analysis Methods 0.000 description 6
- 239000013598 vector Substances 0.000 description 6
- 230000002159 abnormal effect Effects 0.000 description 4
- 238000004364 calculation method Methods 0.000 description 4
- 238000004891 communication Methods 0.000 description 4
- 230000020169 heat generation Effects 0.000 description 4
- 238000012731 temporal analysis Methods 0.000 description 4
- 238000000700 time series analysis Methods 0.000 description 4
- 238000009499 grossing Methods 0.000 description 3
- 230000003287 optical effect Effects 0.000 description 3
- 230000011218 segmentation Effects 0.000 description 3
- 238000004458 analytical method Methods 0.000 description 2
- 230000006399 behavior Effects 0.000 description 2
- 230000007423 decrease Effects 0.000 description 2
- 230000003247 decreasing effect Effects 0.000 description 2
- 230000000694 effects Effects 0.000 description 2
- 239000000284 extract Substances 0.000 description 2
- 238000000605 extraction Methods 0.000 description 2
- 239000004973 liquid crystal related substance Substances 0.000 description 2
- 238000012423 maintenance Methods 0.000 description 2
- 238000012544 monitoring process Methods 0.000 description 2
- 238000005192 partition Methods 0.000 description 2
- 238000007639 printing Methods 0.000 description 2
- 238000010187 selection method Methods 0.000 description 2
- 230000002123 temporal effect Effects 0.000 description 2
- 229910000831 Steel Inorganic materials 0.000 description 1
- 230000005540 biological transmission Effects 0.000 description 1
- 238000006243 chemical reaction Methods 0.000 description 1
- 238000000354 decomposition reaction Methods 0.000 description 1
- 230000001419 dependent effect Effects 0.000 description 1
- 239000006185 dispersion Substances 0.000 description 1
- 238000005516 engineering process Methods 0.000 description 1
- 230000001747 exhibiting effect Effects 0.000 description 1
- 238000000556 factor analysis Methods 0.000 description 1
- 238000012417 linear regression Methods 0.000 description 1
- 238000007726 management method Methods 0.000 description 1
- 230000001172 regenerating effect Effects 0.000 description 1
- 238000005070 sampling Methods 0.000 description 1
- 239000010865 sewage Substances 0.000 description 1
- 239000010959 steel Substances 0.000 description 1
- 239000000126 substance Substances 0.000 description 1
- 230000001502 supplementing effect Effects 0.000 description 1
- XLYOFNOQVPJJNP-UHFFFAOYSA-N water Substances O XLYOFNOQVPJJNP-UHFFFAOYSA-N 0.000 description 1
Images


Description
本発明は、プラントを構成する機器の故障や性能劣化等の異常の予兆を検知するためのプラントの異常検知装置に関する。 The present invention relates to a plant abnormality detection apparatus for detecting a sign of abnormality such as a failure of a device constituting a plant or performance deterioration.
火力、水力、原子力などの発電プラント、化学プラント、鉄鋼プラント、上下水道プラントなどでは、プラントのプロセスを制御するための計装システムが導入されている。これらのプラントの計装システムでは、装置に取り付けられたセンサが取得した種々の時系列データが蓄積されている。この時系列データを用いて、プラントの監視や保守に役立てたいというニーズがある。 In power plants such as thermal power, hydropower, and nuclear power, chemical plants, steel plants, and water and sewage plants, instrumentation systems for controlling plant processes are introduced. In these plant instrumentation systems, various time-series data acquired by sensors attached to the apparatus are accumulated. There is a need to use this time-series data for plant monitoring and maintenance.
例えば、以下に示した特許文献1では、過去のプラントのセンサ信号のデータと、観測データとの類似度を計算することにより、観測データの外れ度合いを出力することにより、異常検知する方法が記載されている。しかし、プラントでは、起動、定常、停止などの運転モード、燃料の成分による発熱効率の差異、設備の劣化などにより、過去のプラントのセンサ信号のデータのばらつきが大きいため、学習の対象となるセンサ信号のデータを、運転条件毎に集める必要があり、この負荷が大きいという課題があった。
For example,
上記の課題を解決する方法として、以下に示した特許文献2では、時系列データを時間的な変化に基づいて、データ空間の軌跡を複数の軌跡区分に分割して、各々の軌跡区分毎に対象をモデル化することにより、プラントを構成する機器の性能劣化状態を定常的に評価する方法が記載されている。
As a method for solving the above-described problem, in
上記の特許文献2の方法では、対象データを時間に沿ってデータ間の距離が定めたしきい値を超えれば、別のクラスタとし、しきい値を超えなければ、同じクラスタとして扱うという方法に分割している。このため、プラントの起動、定常、停止などの運転条件に起因する複数のセンサ信号間の関係を捉えることができるため、過去のデータを運転条件毎に集める作業を不要としている。しかし、異常の判定時には、過去に類似した分割区分があるかどうかで判定するので、その分割区分の異常がどの程度まれに生じるものかといった統計的な偏りについては、判定することができないという課題がある。したがって、収集したデータ中に、センサ故障等による異常データや、異常となる直前のデータが混入している場合には、そのデータに起因して、異常検知の精度が低下する可能性がある。
In the method of
また、統計的な処理に基づく異常検知は、検知精度は100%にはならないので、プラントの保守員や監視員が対処をとる際には、異常とする判断の根拠をわかりやすく説明する機能が求められる。しかし、従来技術(特許文献2)では、区分された軌跡によりプラントシステムを部分空間法によりモデル化しているので、数学的に変換した結果に対する異常判定となっており、センサ信号間の関係や異常判断の根拠の説明が難しいという課題がある。 In addition, abnormality detection based on statistical processing does not have a detection accuracy of 100%. Therefore, when plant maintenance personnel and supervisors take measures, there is a function that easily explains the basis for determining an abnormality. Desired. However, in the prior art (Patent Document 2), since the plant system is modeled by the subspace method based on the segmented trajectory, it is an abnormality determination for the result of mathematical conversion, and the relationship between the sensor signals and the abnormality There is a problem that it is difficult to explain the grounds of judgment.
この発明は、計装システムが蓄積する時系列データを活用することにより、プラントを構成する設備や機器の故障や性能劣化等の異常の予兆を検知する装置の、異常検知の精度を向上させることを目的とする。 This invention improves the accuracy of abnormality detection of an apparatus for detecting a sign of abnormality such as a failure of a facility or equipment constituting a plant or performance deterioration by utilizing time series data accumulated by an instrumentation system. With the goal.
この発明のクラスタリング装置は、
種類の異なる複数の時系列データから、第1時間範囲から第N時間範囲の異なるN個(Nは2以上の整数)の時間範囲ごとにその時間範囲に属する時系列データを抽出し、その時間範囲における複数の時系列データの組からなるN個の局所時系列データを生成する局所時系列データ抽出部と、
前記局所時系列データ抽出部が抽出したN個の局所時系列データを、初期クラスタ分割の規則として予め設定された初期クラスタ分割規則に従って、予め設定された初期クラスタ数の初期クラスタに分割し、分割した初期クラスタごとに初期クラスタの特性を指標する代表情報を生成し、生成した代表情報ごとにN個の局所時系列データを再クラスタリングの規則として予め設定された再クラスタリング規則に従って分配することによりN個の局所時系列データをクラスタに分割する再クラスタリングを実行し、再クラスタリングしたクラスタごとに代表情報を再生成し、再生成した代表情報ごとに前記局所時系列データ抽出部が抽出したN個の局所時系列データを再クラスタリングし、
以降同様に、
N個の局所時系列データの再クラスタリングと、代表情報の再生成とを繰り返すと共に、代表情報を再生成するたびに、今回生成した代表情報が直前に生成した代表情報に対して変化があるかどうかを判定し、変化があるときには次回の代表情報の再生成処理を継続し、変化がないときには次回の代表情報の再生成処理を継続することなくN個の局所時系列データの再クラスタリングと代表情報の再生成との処理を終了する局所時系データクラスタリング部と
を備えたことを特徴とする。
The clustering device of this invention
Time series data belonging to the time range is extracted for each N time ranges (N is an integer of 2 or more) from the first time range to the Nth time range from a plurality of different time series data. A local time-series data extraction unit that generates N local time-series data including a plurality of sets of time-series data in a range;
N local time-series data extracted by the local time-series data extraction unit is divided into initial clusters having a predetermined number of initial clusters according to an initial cluster dividing rule set in advance as an initial cluster dividing rule, and divided. N is generated by generating representative information indicating the characteristics of the initial cluster for each initial cluster, and distributing N local time-series data according to the re-clustering rule set in advance as a re-clustering rule for each generated representative information. Re-clustering is performed to divide the local time-series data into clusters, representative information is regenerated for each re-clustered cluster, and N local time-series data extraction units extracted for each re-generated representative information Re-cluster local time series data,
Similarly,
Repeat the re-clustering of N local time-series data and the regeneration of the representative information, and every time the representative information is regenerated, is the representative information generated this time changed from the representative information generated immediately before? When there is a change, the next representative information regeneration process is continued, and when there is no change, the next representative information regeneration process is continued without re-clustering and representing the N local time-series data. And a local time system data clustering unit that terminates the process of regenerating information.
この発明により、プラントを構成する設備や機器の故障や性能劣化等の異常の予兆を検知する装置において、検知精度を向上させることができる。 According to the present invention, detection accuracy can be improved in an apparatus for detecting a sign of abnormality such as a failure or performance deterioration of equipment or equipment constituting a plant.
実施の形態1.
図1は、本実施の形態1に係るプラント異常検知装置100の一実施例の構成を示すブロック図である。各構成要素の機能概要を説明する。以下の実施の形態の説明では、tは時間を示す。
(1)プラント時系列データベース101は、異常検知の対象となるプラント機器等について、時間の経過に従って順次観測して得た複数の時系列データを格納するデータベースである。
(2)局所時系列データ抽出部102は、プラント時系列データベース101中の多次元時系列データを入力とする。例えば後述の図2のような、投入燃料に対する発熱量y(t)、燃料投入量x1(t)、及び温度x2(t)の組、(y(t)、x1(t)、x2(t))のような多次元時系列データを入力とする。局所時系列データ抽出部102は、その入力データの時間的な変化の仕方に従って、この入力データを「時間」や「データの値」で区分することにより、区分された時系列データを抽出する。この区分された時系列データを「局所時系列データ301」と呼ぶ。
(3)局所時系列データモデル推定部103は、局所時系列データ抽出部102が抽出した局所時系列データ301を、多変量解析、または、時系列解析手法によりモデル推定する。モデル推定とは、例えば、「局所時系列データ301」ごとに、回帰式を求める処理である。
(4)局所時系列データクラスタリング部104は、局所時系列データモデル推定部103が推定した局所時系列データ301の「モデルの集合」をクラスタに分割すると共に、クラスタ毎にクラスタを代表する「代表局所パラメータ」を推定(算出)する。
(5)大域的時系列データモデル推定部105は、局所時系列データクラスタリング部104が推定したモデルを接続することにより、大域的な代表時系列データモデルを推定する。
(6)外れ値検出部106は、別途与えられた区分データに対して、局所時系列データクラスタリング部104あるいは、大域的時系列データモデル推定部105により得られた代表局所時系列データモデルの集合における外れ値が大きいものを異常として検出する。
FIG. 1 is a block diagram showing a configuration of an example of a plant
(1) The plant time-
(2) The local time series
(3) The local time series data
(4) The local time series
(5) The global time series data
(6) The
(多次元時系列データの例)
図2は、局所時系列データ抽出部102が入力する時系列データの説明図である。時系列データとは、時刻tに対して、時刻tのセンサ信号値を対応させる関数x(t)として表現できるものである。時刻tは、連続であってもよいし、サンプリングによって一定周期ごとに記録されるものであってもよい。本明細書では、上記のように、複数の時系列データの組み(多次元時系列データ)を扱う。
図2は、
(a)時系列データy(t)、
(b)時系列データx1(t)、
(c)時系列データx2(t)、
の三組の時系列データの例を示している。複数の時系列データの組は、時刻tのベクトル値関数(y(t),x1(t),x2(t))とみなすことができる。
(Example of multidimensional time series data)
FIG. 2 is an explanatory diagram of time-series data input by the local time-series
FIG.
(A) Time series data y (t),
(B) Time series data x 1 (t),
(C) Time series data x 2 (t),
An example of three sets of time series data is shown. A set of a plurality of time series data can be regarded as a vector value function (y (t), x 1 (t), x 2 (t)) at time t.
(時系列データの区分けの例:その1)
図3は、局所時系列データ抽出部102による時系列データの区分けの例を示す図であり、局所時系列データ抽出部102の動作の一例を示す説明図である。
(a)は、プラント時系列データベース101に格納されている元データである時系列データx(t)の例である。
(b)は、局所時系列データ抽出部102が時系列データ(a)を平滑化することにより得られた「平滑化処理後の時系列データ」の例である。
(c)は、時系列データ(b)に対して、時間差分(x(ti+1)−x(ti))をとった値をもつ時系列データの例である。つまり(c)はΔx/Δtを示す。
(d)は、(c)の値の絶対値がある閾値以上である時刻で、元信号データ(a)を区分することにより得られた、局所時系列データ301の例である。(d)では、元信号データ(a)が、8つの区分に分割されている。つまり、(d)では(a)の時系列データx(t)が、8つの局所時系列データ301に区分された場合を示している。
(Example of time-series data classification: Part 1)
FIG. 3 is a diagram illustrating an example of time-series data segmentation by the local time-series
(A) is an example of time-series data x (t) that is original data stored in the plant time-
(B) is an example of “time-series data after smoothing processing” obtained by the local time-series
(C) is an example of time-series data having a value obtained by taking a time difference (x (t i + 1 ) −x (t i )) with respect to time-series data (b). That is, (c) indicates Δx / Δt.
(D) is an example of the local time series data 301 obtained by classifying the original signal data (a) at a time when the absolute value of the value of (c) is equal to or greater than a threshold value. In (d), the original signal data (a) is divided into eight sections. That is, (d) shows a case where the time series data x (t) of (a) is divided into eight local time series data 301.
(時系列データの区分けの例:その2)
図4は、局所時系列データ抽出部102による時系列データの区分けの別の例を示す図であり、センサ信号間の相関関係の変化の一例(連続的な変化)を示す説明図である。(a)と(b)は、時系列データの例である。(a)をy(t)、(b)をx(t)とする。(c)は、y(t)とx(t)との相関関係を示す時系列データの例である。(c)の例では、相関関係を時系列データy(t)とx(t)を回帰分析した際の係数としてとらえており、時間の経過と共に少しずつ連続的に値が小さくなっている。設備の劣化などにより、設備の効率が少しずつ低下している場合には、このように連続的に値が変化する。例えば、y(t)を発熱量、x(t)を燃料投入量とすると、設備の劣化により、設備の効率が少しずつ低下していることを表している。局所時系列データ抽出部102は図4(c)の5つの区間を、それぞれ局所時系列データ301とすることができる。
(Example of time-series data classification: Part 2)
FIG. 4 is a diagram illustrating another example of time-series data segmentation by the local time-series
(時系列データの区分けの例:その3)
図5は、局所時系列データ抽出部102による時系列データの区分けの別の例を示す図であり、センサ信号間の相関関係の変化の一例(不連続な変化)を示す説明図である。(a)と(b)は、時系列データの例である。各々、y(t)、x(t)とする。(c)は、y(t)とx(t)の相関関係を示す時系列データの例である。(c)の例では、相関関係を時系列データy(t)とx(t)を回帰分析した際の係数としてとらえており、時間の経過と共に、値が不連続に二つの値をとっている。区間1、区間2、区間5は、高い値であり、区間3、区間4、区間6は低い値になっている。例えば、y(t)を発熱量、x(t)を燃料投入量とすると、燃料の種別により、設備の効率が異なる場合には、このような相関関係になる。区間1、区間2、区間5のグループと、区間3、区間4、区間6のグループでは、燃料の種別が異なり、前者のグループは、後者のグループに対して、同じ燃料量での発熱効率がよいことを表している。局所時系列データ抽出部102は、(c)において、区間1,2、5からなる局所時系列データ301と、区間3,4、6からなる局所時系列データ301との二つの局所時系列データを区分けすることができる。
(Example of time-series data classification: Part 3)
FIG. 5 is a diagram illustrating another example of time-series data classification by the local time-series
(時間で区分した時系列データを、さらに時系列データの値のレンジで区分する例)
図6は、局所時系列データ抽出部102による時系列データの区分けの別の例を示す図であり、センサ信号間の相関関係の変化の一例(値の区間への依存性)を示す説明図である。図6は、時間で区分した時系列データを、さらに時系列データの値のレンジで区分する場合を説明する。(a)と(b)は、時系列データの例である。各々、y(t)、x(t)とする。(c)は、y(t)とx(t)の相関関係を示す時系列データの例である。(c)の例では、相関関係を時系列データy(t)とx(t)とを回帰分析した際の係数としてとらえており、時間の経過に対して、相関値の変化傾向が変化している。区間1と区間3は、係数は一定の値であり、区間2では、係数がその一定の値の間を連続的に変化している。この相関関係の変化は、時刻に依存するのではなく、時系列データx(t)の値への依存性を表していると解釈することができる。例えば、y(t)を発熱量、x(t)を燃料投入量とするとき、設備の制御システムにより、燃料を多く投入しても、ある一定の発熱量以上にはあがらないように制御されている場合には、このような挙動を示す。このような挙動を示すセンサ信号間の関係をとらえるためには、時系列データ(y(t)あるいはx(t))を、値のレンジにより区分することが有効である。(d)に、相関値の値の変動する点を、値yの区分として抽出した場合の、局所信号データを示す。(d)では、時系列データyを値の区分A、区分B、および、区分Cに分割している。(d)では、区間1、2、3がそれぞれ局所時系列データ301となる。このとき局所時系列データ抽出部102は、時間で区分した得た局所時系列データ301を、さらに時系列データの値(この例では(a)のy(t)の値を採用している)のレンジで区分することで、区間2の局所時系列データ301については、局所時系列データ301を、さらに、区間2−1と区間2−2とのデータとに分けている。
(Example of dividing time-series data divided by time into a range of time-series data values)
FIG. 6 is a diagram illustrating another example of time-series data segmentation by the local time-series
(局所クラスタと大域クラスタ)
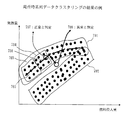
図7は、局所時系列データクラスタリングの一例を示す説明図である。図7は、局所時系列データモデル推定部103、局所時系列データクラスタリング部104、及び大域的時系列データモデル推定部105の処理結果を概念的に示す図である。図7のグラフは、縦軸を発熱量y、横軸を燃料投入量xとする散布図である。
「散布図」とは、ある時刻の時系列データx(t)とy(t)の組を点<x(t),y(t)>として、2次元のグラフにマッピングしたものである。図5に示したような信号間の関係がある場合には、散布図上の時系列データの組は、クラスタ701とクラスタ702との二つのクラスタに分類できる。以下に図7を説明する。
(Local and global clusters)
FIG. 7 is an explanatory diagram showing an example of local time-series data clustering. FIG. 7 is a diagram conceptually illustrating processing results of the local time series data
The “scatter diagram” is a set of time series data x (t) and y (t) at a certain time mapped as a point <x (t), y (t)> on a two-dimensional graph. When there is a relationship between signals as shown in FIG. 5, a set of time series data on the scatter diagram can be classified into two clusters, a
図7では、クラスタとして小さなクラスタ703、704と、大きなクラスタ701、702とを示した。小さなクラスタ703、704等を局所クラスタ(局所時系列クラスタともいう)と呼び、大きなクラスタ701、702等を大域クラスタと呼ぶこととする。大域クラスタ701は、効率のよい燃料を使用した場合のxとyの値の組に対応している。大域クラスタ702は、効率のよくない燃料を使用した場合のxとyの値の組に対応している。大域クラスタ701は上昇傾向が頭打ちになっているが、大域クラスタ702は直線になっている。これは、図6に示したような信号間の関係がなりたつ例を示している。
In FIG. 7,
局所クラスタ703、704の範囲(枠線)は、局所時系列データクラスタリング部104による局所時系列データ301のクラスタリングの結果得られたクラスタの例である。時間区分と値のレンジの区分で分割された局所時系列データ301に対応している。この局所時系列データ301において、回帰分析やARモデル等により推定された回帰式(代表局所パラメータ)が各々回帰式705、706である。異常判定対象データ707、708は、異常判定対象の時系列データの例である。異常検知では、最も近い回帰式からの距離がある閾値以上であるものを異常と判定する。707は、最も近い回帰式704と近いため、正常と判定する。708は、最も近い回帰式704からある一定以上は離れているため、異常と判定する。
The ranges (frame lines) of the
図8は、大域的時系列データモデルの推定の一例を示す説明図である。(a)の801、802、803、804は、局所時系列データ301の集合をクラスタリングすることにより得られた代表回帰式である。(b)の809は、(a)の801、802、803、804を接続して得られる大域的な代表回帰式である。同様に、(b)の810は、(a)の805、806、807、808を接続して得られる大域的な代表回帰式である。
FIG. 8 is an explanatory diagram showing an example of estimation of a global time series data model.
(動作の説明)
以下、図9〜図21のフロー図を用いて、本実施の形態1の動作を説明する。図9は、プラント異常検知装置の処理の全体の流れを説明するフロー図である。図10は、局所時系列データクラスタリング部104の処理の流れを説明するフロー図である。図11〜図20は、図10の処理説明を補足する図である。
図21は、大域的時系列データモデル推定部105の処理の流れを説明するフロー図である。
(Description of operation)
Hereinafter, the operation of the first embodiment will be described with reference to the flowcharts of FIGS. FIG. 9 is a flowchart for explaining the overall processing flow of the plant abnormality detection apparatus. FIG. 10 is a flowchart illustrating the processing flow of the local time series
FIG. 21 is a flowchart for explaining the processing flow of the global time-series data
(S901,S902:局所時系列データ抽出部102の処理)
S901は、局所時系列データ抽出部102が実行する局所時系列データ抽出処理である。S901では、複数の時系列データの組を入力として、入力データの時間的な変化の仕方に従って、入力データを区分する。入力区分を求める手順(所定の局所時系列データ生成規則)は、例えば、複数の入力データ中の一つを目的変数とし、それ以外を説明変数として、
(1)参考文献(河口至商著,多変量解析2pp.60〜64,森北出版)に記載の「区分的な回帰分析」や、
(2)参考文献(北川源四郎著,時系列解析入門,pp113−124,岩波書店)の局所定常ARモデルを用いる。
(3)あるいは、初等的に、図3に示すように、時系列データを平滑化処理と時間差分処理を作用させた後に、閾値で区分を抽出してもよい。S902も局所時系列データ抽出部102が実行する処理である。
(S901, S902: processing of local time series data extraction unit 102)
S <b> 901 is a local time series data extraction process executed by the local time series
(1) "Categorical regression analysis" described in references (Kawaguchi Zhisho, Multivariate Analysis 2pp. 60-64, Morikita Publishing)
(2) The local stationary AR model of the reference (Genjiro Kitagawa, Introduction to Time Series Analysis, pp113-124, Iwanami Shoten) is used.
(3) Alternatively, as shown in FIG. 3, the time series data may be subjected to smoothing processing and time difference processing and then the sections may be extracted with threshold values. S902 is also processing executed by the local time-series
S902では、局所時系列データ抽出部102は、S901で得られた局所区分時系列データを、データの値のレンジでさらに区分することにより、新たな時系列データを抽出する処理である。具体的には、時間で区分された時系列データの集合

但し、(Tis,,Tie]は、S901で得られた区間区分とする。
以下では、Lkiを局所時系列データ301として、局所時系列データLkiと呼ぶ。なお、以下では、Lkiを局所時系列データと呼んで説明するが、データ区分を含まない時間範囲のみで分割したものも局所時系列データ(広義)である。
In S902, the local time-series
However, (T is,, T ie ] shall be obtained interval division in S901.
In the following, the L ki as a local time-series data 301, referred to as a local time-series data L ki. In the following description, L ki is referred to as local time-series data, but local time-series data (in a broad sense) is also divided only by a time range that does not include data sections.
図11を参照して、上記(式1)〜(式3)の意味を具体的に説明する。図11は、時系列データy(t)、時系列データx1(t)、時系列データx2(t)の3つの場合の例である。以下、時系列データy(t)を単にy(t)のように記載する場合もある。x1(t)、x2(t)と2つなので(式1)において「M=2」である。(式1)は時間区分を示すiに関する1〜NのN個の時系列データの集合を示すが、「i=1」の場合の(式1)の示す時系列データは、図11のT1s,<t≦T2eの範囲に含まれる
y(t)、x1(t)、x2(t)
である。
また(式2)のデータの値のレンジでの分割は、図11のy(t)の縦軸に関する、Y1〜Y2、Y2〜Y3のような分割を意味する。y(t)のY1〜Y2の範囲は、(式3)におけるk=1の場合に相当する。つまり(式3)において、
Y1<yi=1≦Y2
の場合である。
(式3)においてk=1、i=1の場合、つまりL11の例を以下に説明する。i=1の場合は図11のT1s,<t≦T2eの時間の帯(縦の帯)に含まれるy(t)、x1(t)、x2(t)のグラフ部分が対応する。またi=1の下でのk=1の場合は、y(t)のグラフのうち、Y1〜Y2のデータ範囲に属する部分のy(t)のグラフがL11に属する部分である。これを図11のy(t)の太線部分(時間範囲の両側のY左側、Y右側)として示した。またL11に属するx1(t)、x2(t)は、L11に属するy(t)決まり、図11ではそれぞれ、
x1左側、x1右側、x2左側、x2右側である。
同様にして、k=2、i=1の場合のL21は、図11に示す斜線で示すグラフ部分である。
With reference to FIG. 11, the meanings of the above (formula 1) to (formula 3) will be described in detail. FIG. 11 is an example of three cases of time series data y (t), time series data x 1 (t), and time series data x 2 (t). Hereinafter, the time series data y (t) may be described simply as y (t). Since x 1 (t) and x 2 (t) are two, “M = 2” in (Expression 1). (Expression 1) represents a set of N time-series data of 1 to N related to i indicating a time section, and the time-series data indicated by (Expression 1) in the case of “i = 1” is T in FIG. 1s, <t ≦ T 2e included in the range y (t), x 1 (t), x 2 (t)
It is.
Further, the division in the range of the data value of (Expression 2) means the division such as Y1 to Y2 and Y2 to Y3 with respect to the vertical axis of y (t) in FIG. The range of Y1 to Y2 of y (t) corresponds to the case of k = 1 in (Expression 3). That is, in (Equation 3),
Y1 <y i = 1 ≦ Y2
This is the case.
In the case of k = 1 and i = 1 in (Equation 3), that is, an example of L 11 will be described below. When i = 1, the graph portions of y (t), x 1 (t), and x 2 (t) included in the time zone (vertical zone) of T 1s, <t ≦ T 2e in FIG. 11 correspond. To do. For k = 1 under i = 1 In addition, of the graph of y (t), the graph of y (t) of the portion belonging to the data range of Y1~Y2 is part belonging to L 11. This is shown as a thick line portion of y (t) in FIG. 11 (Y left side and Y right side on both sides of the time range). The x 1 belonging to L 11 (t), x 2 (t) is determined y (t) belonging to L 11, respectively 11,
x 1 left side, x 1 right side, x 2 left side, x 2 right side.
Similarly, L 21 in the case of k = 2, i = 1 is a graph portion shown by oblique lines shown in FIG. 11.
(S903:局所時系列データモデル推定部103の処理)
S903では、局所時系列データモデル推定部103(局所時系列データ回帰式生成部の一例)が、局所時系列データLkiを、多変量解析、または、時系列解析手法によりモデル推定する。「モデル推定」とは例えば、回帰式を求める処理である。例えば、S902でセンサ信号(注目変数y)の値のレンジで分割した区間k毎にN個存在する局所時系列データ301の要素である時系列データ
以下では、多変量解析の例として線形回帰分析を用いて説明するが、因子分析、特異値分解、ARモデル、状態空間モデルなどでもよい。時系列データLki(t)に対して回帰分析を実施すると、
回帰式y(t)=Fki(x1,x2,…,xM)と、残差の平方和Ekiを得る。
以下では、(x1,x2,…,xM)をベクトルxとして記載し、
Fki(x1,x2,…,xM)をFki(x)と記載する。
以下では、
時系列データLki(t)、
yの区間(Yk,Yk+1]、
回帰式Fki(x)、
残差の平方和Ekiの
四つ組(Lki(t),(Yk,Yk+1],Fki(x),Eki)を、
局所時系列データ301の集合Lkiに対する局所構造S(Lki)と呼ぶ。
(S903: Processing of local time series data model estimation unit 103)
In step S903, the local time series data model estimation unit 103 (an example of a local time series data regression equation generation unit) estimates the local time series data L ki using a multivariate analysis or a time series analysis method. “Model estimation” is, for example, processing for obtaining a regression equation. For example, time-series data that is an element of the local time-series data 301 that exists for each section k divided in the range of the value of the sensor signal (target variable y) in S902
In the following, linear regression analysis is used as an example of multivariate analysis, but factor analysis, singular value decomposition, AR model, state space model, and the like may be used. When regression analysis is performed on the time series data L ki (t),
The regression equation y (t) = F ki (x 1 , x 2 ,..., X M ) and the residual sum of squares E ki are obtained.
In the following, (x 1 , x 2 ,..., X M ) is described as a vector x,
F ki (x 1 , x 2 ,..., X M ) is denoted as F ki (x).
Below,
Time series data L ki (t),
y section (Yk, Yk + 1],
Regression equation F ki (x),
A quadruple of residual sums of squares E ki (L ki (t), (Yk, Yk + 1], F ki (x), E ki ),
This is called a local structure S (L ki ) for the set L ki of the local time series data 301.
(局所構造)
つまり、
局所構造S(Lki)={Lki(t),(Yk,Yk+1],Fki(x),Eki}
である。
(Local structure)
That means
Local structure S (L ki ) = {L ki (t), (Yk, Yk + 1], F ki (x), E ki }
It is.
図12は、上記で述べた局所時系列データモデル推定部103の処理を概念的に示す。局所時系列データモデル推定部103は、局所時系列データ抽出部102の抽出した、ある(k、i)の一つの局所時系列データLkiに、S(Lki)を対応させる。この場合、時間の区分数を示す「i」は(式1)に示すように1〜NまでのN個である。また、注目変数y(t)(指定時系列データ)についてのデータ区分数を示すkは1〜Kとする((式2)においてm=1〜Kに対応)。
つまり、i=1〜N、k=1〜K
であるので、局所時系列データLkiは「N×K」個できる。
よって、局所構造S(Lki)も「N×K」個できる。図13は、「N×K」個の局所構造S(Lki)を概念的に示す。図13は、横軸を時間の区分数「i」、縦軸をデータ区分数「k」とした。その場合、一つのセルが、あるS(Lki)に対応する。
FIG. 12 conceptually shows the processing of the local time series data
That is, i = 1 to N, k = 1 to K.
Therefore, “N × K” pieces of local time series data L ki can be generated .
Therefore, “N × K” local structures S (L ki ) can be formed. FIG. 13 conceptually shows “N × K” local structures S (L ki ). In FIG. 13, the horizontal axis represents the number of time divisions “i”, and the vertical axis represents the number of data divisions “k”. In that case, one cell corresponds to a certain S (L ki ).
(S904:局所時系列データクラスタリング部104の動作)
S904は、局所時系列データクラスタリング部104が実行する局所データクラスタリング処理である。S904では、局所時系列データモデル推定部103が推定した局所時系列データモデルの集合(つまりN・K個のS(Lki))をクラスタに分割すると共に、クラスタ毎にクラスタを代表する代表局所パラメータを推定する。
図10は、局所時系列データクラスタリング部104が実行する、S904の処理の流れの詳細を示すフローチャートである。図10の動作の主語は局所時系列データクラスタリング部104であるが、煩雑になるので省略する。S904は、S903により得られた局所構造
S(Li)=(Li(t),(Yk,Yk+1],Fi(x),Ei)
の集合を入力とする。ただし、k毎(データ区分ごと)に実行するので、簡潔さのために、L,F,Eの添え字kは省略して説明する。また、大文字のNは、局所時系列データ(Li)の数とし(つまり、時間範囲の数)、上記のようにデータ区分数「i」は、1からNの値をとるとする。
(S904: Operation of Local Time Series Data Clustering Unit 104)
S904 is a local data clustering process executed by the local time-series
FIG. 10 is a flowchart showing details of the processing flow of S904 executed by the local time-series
As a set. However, since it is executed for each k (each data section), the subscript k of L, F, and E is omitted for the sake of brevity. Further, the capital letter N is the number of local time series data (L i ) (that is, the number of time ranges), and the number of data sections “i” takes values from 1 to N as described above.
このことを図13で説明すれば、局所時系列データクラスタリング部104がk毎にS(Li)を実行するとは、例えば「k=2」とする場合、図13の斜線部のデータである、S(L1)〜S(LN)を実行するという意味である。
If this is explained with reference to FIG. 13, the local time-series
(S1001)
S1001では、Siの中から、最小のEiをもつSiを探す。最小のEiをもつSiはS3であるとする。k=2とすれば、図13において局所時系列データクラスタリング部104は、S1〜SNの中から、最小のEiをもつSiを探す。
次に、代表局所パラメータの候補変数m1にFiを代入する。この場合は、最小のEiをもつS3に属するF3(回帰式)を代表局所パラメータの候補変数m1に代入する。
この場合、
m1=F3
である。
次に、変数cに1を代入する。
つまり
c=1
である。
なお、後述のS1003で登場する局所クラスタ数の設定数を変数cとの区別するため「C*」とする。
(S1001)
In S1001, from among the S i, look for the S i with the minimum of E i. Let S i with the smallest E i be S 3 . If k = 2, the local time-series
Next, F i is substituted into candidate variable m 1 of the representative local parameter. In this case, F 3 (regression equation) belonging to S 3 having the smallest E i is substituted into the candidate variable m 1 of the representative local parameter.
in this case,
m 1 = F 3
It is.
Next, 1 is substituted into the variable c.
That is, c = 1
It is.
Note that the set number of local clusters that appear in S1003, which will be described later, is “C *” to distinguish it from the variable c.
(S1002)
変数c=1の場合、
dist(F1,m1)〜dist(FN,m1)のN個の距離のなかから、最大の距離を探す。例えば、dist(F5,m1)が最大とする(i=5)。
つまり、
max=dist(F5,m1) 次に、mc+1に、Fi(x)を代入する。次に、cに、c+1を代入する。
この設例では、
m1+1=m2=F5,
c=1+1=2
となる。
(S1002)
If variable c = 1,
The maximum distance is searched from among N distances of dist (F 1 , m 1 ) to dist (F N , m 1 ). For example, dist (F 5 , m 1 ) is the maximum (i = 5).
That means
max = dist (F 5 , m 1 ) Next, F i (x) is substituted into m c + 1 . Next, c + 1 is substituted for c.
In this example,
m 1 + 1 = m 2 = F 5 ,
c = 1 + 1 = 2
It becomes.
(S1003)
S1003では、変数cが定数C*に等しいかどうかを判定する。
但し、上述のように定数C*は、局所クラスタ数を示す数として、あらかじめパラメータとして与えられているものとする。等しい場合は、S1004に進む。等しくない場合は、S1002に戻る。
(S1003)
In S1003, it is determined whether or not the variable c is equal to the constant C *.
However, as described above, the constant C * is assumed to be given as a parameter in advance as a number indicating the number of local clusters. If equal, the process proceeds to S1004. If they are not equal, the process returns to S1002.
この設例では、現在、c=2なのでS1002に戻るとする。
S1002に戻った状態では、
c=2、
m2=F5,
である。
また、S1001より、
m1=F3,
である。
そして、最初のS1002(c=1のとき)と同様に、(式5)に基づき、最大の距離を探す。
図14の「c=2」は、S1002でc=2の場合の(式5)の意味を示している。
変数c=2の場合、
「dist(F1,m1)+(F1,m2)」〜「dist(FN,m1)+(FN,m2)」のN個の距離の中から最大の距離を探す。
後の動作は前回のS1002と同じである。
そして、
c=C*となると、処理はS1004に進む。
この例では、c=20(局所クラスタ数)となった場合である。
In this example, it is assumed that the process returns to S1002 because c = 2 at present.
In the state returned to S1002,
c = 2,
m 2 = F 5 ,
It is.
From S1001,
m 1 = F 3 ,
It is.
Then, similarly to the first S1002 (when c = 1), the maximum distance is searched based on (Expression 5).
“C = 2” in FIG. 14 indicates the meaning of (Formula 5) in the case where c = 2 in S1002.
If variable c = 2,
The maximum distance is searched from N distances “dist (F 1 , m 1 ) + (F 1 , m 2 )” to “dist (F N , m 1 ) + (F N , m 2 )”. .
The subsequent operation is the same as the previous S1002.
And
When c = C *, the process proceeds to S1004.
In this example, c = 20 (the number of local clusters).
以上のS1002、S1003の処理でC*個のmが求まるが、これを以下では、
mj、j=1,2,・・・,C*、
としている。
The above processing of S1002 and S1003 determines C * number of m.
mj, j = 1, 2,..., C *,
It is said.
以下、後述するDj,j=1,2,・・・,C*を、局所構造をクラスタリングすることにより得られたC*個のクラスタとする。 Hereinafter, D j , j = 1, 2,..., C *, which will be described later, are C * clusters obtained by clustering the local structure.
(S1004)
S1004では、クラスタDjの初期化処理を実施する。例えば、図13(k=2)のN個のLi(SiはLiを要素に持つ)に対して、C*個のdistlm(Li,mj)(所定の距離定義式)が最小となるmjを探す。
次に、クラスタDjに、Liを代入する。
図15はこの処理を概念的に示す図である。
例えばL1を考える。L1と、m1〜mc*のそれぞれとの距離distlm(Li,mj)を計算し、距離が最小となるmjを探す。距離を求める式は、S1002で用いたように回帰式の係数をベクトルとみなした場合のベクトル間の距離とする方式でもよいし、それ以外の式でもよい。
この場合の距離distlm(Li,mj)は、
時系列データLiと同一の局所構造Siに所属する回帰式Fiを意味する。これは(式5)の距離式の場合と同様である。
つまり、
distlm(Li,mj)=distlm(Fi,mj)
であり、Fi,mjとも回帰式であるから、回帰式どうしの距離が求まる。
ただし、クラスタリングの対象は時系列データであるのでLiを用いて表現している。
例えば、L1(F1)はm1との距離が最小であったとすると、時系列データL1はクラスタD1に所属する。
同様に、図15のようにL2(F2)もm1との距離が最小であったとすると、時系列データL2もクラスタD1に所属する。
同様に、L3(F3)はm2との距離が最小であったとすると、時系列データL3はクラスタD2に所属する。
以下、L4〜LNまで同様である。
以上のS1004の処理によって、L1〜LNはD1〜Dc*のいずれかのクラスタDjに所属することになる。
(S1004)
In S1004, carried initializes the cluster D j. For example, for N L i (S i has L i as an element) in FIG. 13 (k = 2), C * dist lm (L i , m j ) (predetermined distance defining formula) Find m j that minimizes.
Next, L i is substituted into cluster D j .
FIG. 15 is a diagram conceptually showing this processing.
For example, consider the L 1. The distance dist lm (L i , m j ) between L 1 and each of m 1 to m c * is calculated, and m j that minimizes the distance is searched for. The equation for obtaining the distance may be a method for determining the distance between vectors when the coefficient of the regression equation is regarded as a vector as used in S1002, or may be another equation.
The distance dist lm (L i , m j ) in this case is
It means the regression equation F i belonging to the same local structure S i as the time series data L i . This is the same as in the case of the distance formula of (Formula 5).
That means
dist lm (L i , m j ) = dist lm (F i , m j )
Since both F i and m j are regression equations, the distance between the regression equations can be obtained.
However, it is expressed using the L i because the clustering of the target is a time-series data.
For example, if L 1 (F 1 ) has the shortest distance from m 1 , the time series data L 1 belongs to the cluster D 1 .
Similarly, if L 2 (F 2 ) has the shortest distance from m 1 as shown in FIG. 15, the time-series data L 2 also belongs to cluster D 1 .
Similarly, if L 3 (F 3 ) has the smallest distance from m 2 , the time series data L 3 belongs to the cluster D 2 .
Hereinafter, the same to L 4 ~L N.
Through the processing in S1004, L 1 to L N belong to any cluster D j of D 1 to D c * .
(S1005)
S1005以降(S1005,S1006、S1004のループ)は、S1003→S1004で設定された初期クラスタをもとに、局所時系列データLi(i=1〜N)を再クラスタリングする処理である。S1005では、C*個のDjに対して、あるjであるクラスタDjに属する局所時系列データLjk(この例ではk=2)の和集合∪Ljk∈Djに対して、回帰分析する。この回帰分析により、そのクラスタDjの回帰式Fj(x)を求める。
次に、そのクラスタDjの代表回帰式の候補mjに、求めた回帰式Fj(x)を代入する。
図16はS1005の処理を概念化した図であり、再クラスタリング規則を示している。
最初のS1004の処理が終わった段階で、
クラスタD1には局所時系列データL1、L2が所属し、
クラスタD2には局所時系列データL3〜L5が所属し、
・・・とする。
その場合、
クラスタD1については、和集合L1∪L2に対して回帰式Fj=1を求め、
クラスタD2については、和集合L1∪L2∪L3に対して回帰式Fj=2を求める。他のクラスタに関しても同様である。
この処理によって、クラスタD1〜DC*のC*個の各クラスタに回帰式が定まる。
このC*個の回帰式を、図15(S1002,S1003)で求めたm1〜mC*に対して、新たなm1〜mC*とする。
(S1005)
After S1005 (the loop of S1005, S1006, and S1004) is a process of reclustering the local time series data Li (i = 1 to N) based on the initial cluster set in S1003 → S1004. In S1005, with respect to C * number of D j, with respect to the union ∪L jk ∈D j of the local time-series data L jk belonging to the cluster D j is some j (in this example k = 2), the regression analyse. By this regression analysis, a regression formula F j (x) of the cluster D j is obtained.
Next, the obtained regression equation F j (x) is substituted into the representative regression equation candidate m j of the cluster D j .
FIG. 16 is a diagram conceptualizing the processing of S1005, and shows a reclustering rule.
At the stage when the processing of the first S1004 is finished,
Cluster D 1 includes local time series data L 1 and L 2 ,
A member of the local time-
... and so on.
In that case,
For cluster D 1 , find regression equation F j = 1 for union L 1 ∪L 2 ,
For the cluster D 2 , the regression equation F j = 2 is obtained for the union L 1 ∪L 2 ∪L 3 . The same applies to other clusters.
By this processing, a regression equation is determined for each of C * clusters of the clusters D 1 to D C * .
The C * regression equations are set as new m 1 to m C * with respect to m 1 to m C * obtained in FIG. 15 (S1002, S1003).
S1006では、「C*個のmiのすべてに変化がない」かどうかを判定する。
最初のS1006では、前回の「m1〜mC*」はS1002、S1003のループで作成された、いわゆる初期値である。よって、通常、最初のS1005で求めた「m1〜mC*」との間に変化がある。
変化がある場合は、S1004に戻る。
変化がない場合は、終了する。
終了した際のD1,D2,…,DC*のC*個のクラスタが、局所時系列クラスタである。終了時点での「m1〜mC*」を大文字を用いて「M1,M2,…,MC*」と記載するが、これらが局所時系列クラスタ「D1〜DC*」のそれぞれの代表局所パラメータである。
In S <b> 1006, it is determined whether or not “C * m i are all unchanged”.
In the first S1006, the previous “m 1 to m C * ” is a so-called initial value created in the loop of S1002 and S1003. Therefore, there is usually a change between “m 1 to m C * ” obtained in the first S1005.
If there is a change, the process returns to S1004.
If there is no change, exit.
The C * clusters of D 1 , D 2 ,..., D C * when finished are local time series clusters.
(複数回目のS1004)
最初のS1006からS1004に戻った場合を説明する。図17は、2回目(3回目以上も同様)の処理を示す概念図である。2回目が最初のS1004と異なるのは、「m1〜mC*」が、S1005で求められた「新たなm1〜mC*」になっている点のみある。つまり、複数回目のS1004では、直前のS1005で求められた「新たなm1〜mC*」を使用し、「L1〜LN」のクラスタリングのやり直しを行う。つまり新たな「新たなm1〜mC*」を使用し、「L1〜LN」の再クラスタリングを行う。
(Multiple S1004)
A case where the process returns from S1006 to S1004 will be described. FIG. 17 is a conceptual diagram showing the second processing (the same applies to the third and subsequent times). The second time is different from the first S1004 only in that “m 1 to m C * ” is “new m 1 to m C * ” obtained in S1005. That is, in S1004 for a plurality of times, “new m 1 to m C * ” obtained in the immediately preceding
図10はk毎の処理であるので、k=2、k=3のような順に実行された場合、図18に示すように、k=2についてSi(i:1〜N)が処理され、次にk=3についてSi(i:1〜N)が処理される。したがって図18に示すように、k=2について局所クラスタD1〜DC*が決まり、k=3について局所クラスタD1〜DC*が決まる。よって、1〜Kについて実行すれば、図19に示すように、1〜Kのそれぞれに、局所クラスタD1〜DC*が決まる。そして局所クラスタD1〜DC*のそれぞれについて代表局所パラメータが定まっている。これを図示したものが図7であり、クラスタ703、704等が局所クラスタを示す。また、回帰式705,706が各局所クラスタの代表局所パラメータである。図19のk違いの場合は、図7において、kごとの局所クラスタ、代表局所パラメータとして表示されるが、図7にはk違いは表現していない。
Since FIG. 10 shows processing for each k, when executed in the order of k = 2 and k = 3, S i (i: 1 to N) is processed for k = 2 as shown in FIG. Next, S i (i: 1 to N) is processed for k = 3. Thus, as shown in FIG. 18, for k = 2 the
(外れ値検出部106)
外れ値検出部106は、図7に示す局所クラスタ、代表局所パラメータを対象として、別途与えられた区分データが外れ値に該当するかどうかを判定する。即ち、外れ値検出部106は、局所時系列データクラスタリング部104が決定した代表局所パラメータに基づき、評価対象として別途与えられた評価対象データであって、局所時系列データの生成の元になる種類の異なる複数の時系列データと種類を同じくする複数の時系列データの組からなる所定期間の評価対象データに対して、距離として定義された値が、いずれかの代表局所パラメータとの間で閾値を超えるかどうかを検出する。外れ値検出部106は、閾値を超えた場合、その評価対象データ(図7で異常と判定されたで異常判定対象データ708)を外れ値と判定する。
(Outlier detection unit 106)
The
なお、以上の局所クラスタリング(図10)の説明では注目変数をyとし、データ区分を考慮した場合を説明したが、データ区分を反映することは必須ではない。データ区分を反映しない場合(広義の局所時系列データ)は、例えば図13、図19等でk=1のみの場合に対応する。 In the above description of local clustering (FIG. 10), the variable of interest is assumed to be y and the data partition is considered. However, it is not essential to reflect the data partition. The case where the data classification is not reflected (broadly defined local time-series data) corresponds to the case where only k = 1 in FIGS.
なお、S1001、S1002、S1003は、局所時系列データクラスタリングの初期クラスタを設定する方法(初期クラスタ分割規則)の一例を示している。この初期クラスタの選択方法は、ランダムに選択するなど、クラスタリングの既知の選択方法に置き換えてもよい。 Note that S1001, S1002, and S1003 show an example of a method (initial cluster division rule) for setting an initial cluster for local time-series data clustering. This initial cluster selection method may be replaced with a known selection method of clustering such as selecting at random.
図20、及び図10のフローチャートを参照してランダムに選択する場合を説明する。
初期クラスタをDj (0)(j=1〜C*)と表記する。
図10ではk=2とする。
説明の単純化のため、局所時系列データLiは10個とし、
局所クラスタの設定数C*は、3とする。
ランダムに選択する場合、局所時系列データクラスタリング部104は、
局所時系列データL1〜L10を、たとえば次のように初期クラスタに分割する(S01,S02)。
D1 (0)=L1〜L3、
D2 (0)=L4〜L6、
D3 (0)=L7〜L10。
これは、図10のS1004(1回目)の処理が終了した状態である。
つぎに、S1005(1回目)でD1 (0)〜D3 (0)の回帰式を求め、これを
「m1 (1)〜m3 (1)」(代表情報である第1回帰式)とする(S02)。
次にS1004(2回目)で各Liとの距離がS1004の定義式(所定の距離定義式)に基づき最小となるmj (1)を特定する(S03)。
そして、S1005(2回目)で、特定したmj (1)(第1回帰式)を同じくする「時系列データ回帰式(S(Lki)に属するF(x))」の元になる局所時系列データから構成されるクラスタである第1クラスタD1 (1)〜D3 (1)を、m1 (1)〜m3 (1)に対応させて生成する。
D1 (1)=L2〜L4、
D2 (1)=L5〜L7、
D3 (1)=L8〜L10、L1、
とする。
そして、第1クラスタD1 (1)〜D3 (1)に対して回帰分析を実施することにより第1クラスタD1 (1)〜D3 (1)ごとにm1 (2)〜m3 (2)(代表情報である第2回帰式)を生成する(S04)。
そして、S1006において、今回生成のm1 (2)〜m3 (2)が前回生成のm1 (1)〜m3 (1)に対して変化があるかどうかを判定する。変化がなければ処理は終了し、変化があればS1004(3回目)に進む。
S1004(3回目)では、各Liについてm1 (2)〜m3 (2)との距離がS1004の定義式に基づき最小となるmj (2)を特定する(S05)。
そして、S1005(3回目)で、特定したmj (2)(第1回帰式)を同じくする「時系列データ回帰式(S(Lki)に属するF(x))」の元になる局所時系列データから構成されるクラスタである第2クラスタD1 (2)〜D3 (2)を、m1 (2)〜m3 (2)に対応させて生成する。
D1 (2)=L3〜L5、
D2 (2)=L6〜L8、
D3 (2)=L9〜L10、L1〜L2、
とする。
そして、
第2クラスタD1 (2)〜D3 (2)に対して回帰分析を実施することにより第2クラスタD1 (2)〜D3 (2)ごとにm1 (3)〜m3 (3)(代表情報である第3回帰式)を生成する(S06)。
そして、S1006において、今回生成のm1 (3)〜m3 (3)が前回生成のm1 (2)〜m3 (2)に対して変化があるかどうかを判定する。変化がなければ処理は終了し、
変化があればS1004(4回目)に進む。
S1004(4回目)を経て(S07)、S1005(4回目)では、上記と同様にして、今回のm1 (4)〜m3 (4)が生成される(S08)。
そして、S1006において、今回生成のm1 (4)〜m3 (4)が前回生成のm1 (3)〜m3 (3)に対して変化がなければ処理は終了するが、m1 (4)〜m3 (4)は前回生成のm1 (3)〜m3 (3)に対して変化がないとする。この場合、処理は終了する。
この場合、処理が終了した時点の第3クラスタD1 (3)〜D3 (3)が局所クラスタであり、
m1 (4)〜m3 (4)が各局所クラスタを代表する代表局所パラメータ(局所クラスタ代表情報)である。
The case of selecting at random with reference to the flowcharts of FIGS. 20 and 10 will be described.
The initial cluster is denoted as D j (0) (j = 1 to C *).
In FIG. 10, k = 2.
For simplification of explanation, the local time series data L i is assumed to be 10 pieces,
The set number C * of local clusters is 3.
When selecting at random, the local time series
The local time series data L 1 to L 10 are divided into initial clusters as follows, for example (S01, S02).
D 1 (0) = L 1 to L 3 ,
D 2 (0) = L 4 to L 6 ,
D 3 (0) = L 7 ~
This is a state in which the processing of S1004 (first time) in FIG. 10 has been completed.
Next, a regression equation of D 1 (0) to D 3 (0) is obtained in S1005 (first time), and this is obtained as “m 1 (1) to m 3 (1) ” (first regression equation that is representative information ). (S02).
Next S1004 distances between the L i in
Then, in S1005 (second time), the local that becomes the basis of the “time series data regression equation (F (x) belonging to S (L ki ))” that uses the identified m j (1) (first regression equation). First clusters D 1 (1) to D 3 (1) , which are clusters composed of time-series data, are generated in correspondence with m 1 (1) to m 3 (1) .
D 1 (1) = L 2 to L 4 ,
D 2 (1) = L 5 to L 7 ,
D 3 (1) = L 8 to L 10, L 1 ,
And
The first cluster D 1 (1) ~D 3 ( 1) first cluster D 1 by performing a regression analysis on (1) ~D 3 (1) each to m 1 (2) ~m 3 (2) Generate (second regression equation as representative information) (S04).
In step S < b > 1006, it is determined whether m 1 (2) to m 3 (2) generated this time is changed from m 1 (1) to m 3 (1) generated last time. If there is no change, the process ends. If there is a change, the process proceeds to S1004 (third time).
In S1004 (third time), for each L i , m j (2) is specified that minimizes the distance from m 1 (2) to m 3 (2) based on the definition formula of S1004 (S05).
Then, in S1005 (third time), the local that is the basis of “time series data regression equation (F (x) belonging to S (L ki ))” that uses the identified m j (2) (first regression equation). Second clusters D 1 (2) to D 3 (2) , which are clusters composed of time-series data, are generated in correspondence with m 1 (2) to m 3 (2) .
D 1 (2) = L 3 to L 5 ,
D 2 (2) = L 6 to L 8 ,
D 3 (2) = L 9 to L 10 , L 1 to L 2,
And
And
The second cluster D 1 (2) ~D 3 second cluster D 1 (2) by performing a regression analysis on (2) ~D 3 (2) m 1 (3) every ~m 3 (3 ) (Third regression equation as representative information) is generated (S06).
In step S < b > 1006, it is determined whether m 1 (3) to m 3 (3) generated this time has a change from m 1 (2) to m 3 (2) generated last time. If there is no change, the process ends.
If there is a change, the process proceeds to S1004 (fourth time).
Through S1004 (the fourth) (S07), the S1005 (fourth), in the same manner as described above, the current m 1 (4) ~m 3 (4) is generated (S08).
In S1006, if m 1 (4) to m 3 (4) generated this time is not changed from m 1 (3) to m 3 (3) generated last time, the process ends, but m 1 ( 4) to m 3 (4) are assumed to be unchanged from the previously generated m 1 (3) to m 3 (3) . In this case, the process ends.
In this case, the third clusters D 1 (3) to D 3 (3) at the end of the process are local clusters,
m 1 (4) to m 3 (4) are representative local parameters (local cluster representative information) representing each local cluster.
図10のS1001、S1002、S1003、S1004、S1005は、回帰式を生成する回帰式生成処理であり、S1006は、新たな回帰式を生成するたびに前回生成した回帰式から変化があるかどうかを判定し、変化があるときには次の新たな回帰式の回帰式生成処理を継続し、変化がないときには次の新たな回帰式の回帰式生成処理を継続することなく、回帰式生成処理を終了する判定処理である。 In FIG. 10, S1001, S1002, S1003, S1004, and S1005 are regression equation generation processes for generating a regression equation, and S1006 indicates whether or not there is a change from the previously generated regression equation each time a new regression equation is generated. When there is a change, the regression formula generation process of the next new regression formula is continued, and when there is no change, the regression formula generation process is terminated without continuing the regression formula generation process of the next new regression formula This is a determination process.
また、S1002におけるdistlm(S(Li),{m1,…,mC}の定義も一例を示している。この距離では、クラスタリング分野でいう誤差2乗和基準を用いたが、最小分散、散布基準、トレース基準、行列式基準、不変量基準などを用いてもよい(参考文献:Richard O.Duda他著、尾上守夫監訳,パターン識別,pp.543−548,株式会社新技術コミュニケーション)。 Also, the definition of dist lm (S (L i ), {m 1 ,..., M C } in S1002 shows an example.In this distance, the error square sum criterion used in the clustering field is used. Dispersion, scattering criteria, trace criteria, determinant criteria, invariant criteria, etc. may be used (reference: Richard O. Duda et al., Translated by Morio Onoe, Pattern Identification, pp. 543-548, New Technology Communication Co., Ltd.) ).
(S905:大域的時系列データモデル推定部105の動作)
S905は、大域的時系列データモデル推定部105が実行する大域的データモデル推定である。S905では、局所時系列データクラスタリング部104が推定したモデルを接続することにより大域的な代表時系列データモデルを推定する。
図21は、S905の処理の流れの詳細を示すフローチャートである。
(S905: Operation of Global Time Series Data Model Estimation Unit 105)
S905 is global data model estimation executed by the global time-series data
FIG. 21 is a flowchart showing details of the processing flow of S905.
S1101で、大域的時系列データ候補の初期集合Gを作り、S1102以降で集合の要素を併合しながら、最終的な大域的データ推定モデルを得る。S1101は、局所時系列データクラスタリングの結果得られるクラスタDiを順に取り出し、大域的時系列データ候補の初期集合Gを作る。初期集合Gは、S904の処理により得られたクラスタDiの局所構造S(Di)の
集合{S(D1),S(D2),…,S(DN)}
とする。
局所時系列データクラスタは、Yの区間l毎にCl個あり、
全部でN=ΣCl個ある。以下では、S(Di)は、クラスタ併合後の局所構造を表現できるように、
目的変数の区間(yis,yie]、
クラスタの代表回帰式Fik(x)の集合、
残差の平方和Eil、
局所時系列データLi、
Liが定義されている時間区間Tilの
5つ組((yis,yie],{Fik(x)},{Eik},Li,{Til})とする。
ここで、目的変数の区間
(yis,yie]は、
yis<y≦yieを示している。
And
There are C l local time-series data clusters for each interval l of Y,
There are N = ΣC l in total. In the following, S (Di) can represent the local structure after cluster merging,
Objective variable interval (y is , y ie ],
A set of cluster representative regression equations Fik (x),
Residual sum of squares Eil,
Local time series data Li,
A set of five time intervals Til in which Li is defined ((y is , y ie ], {Fik (x)}, {Eik}, Li, {Til}).
Here, the interval (y is , y ie ) of the objective variable is
y is <y ≦ y ie .
S1102では、大域的時系列推定処理における接続処理を終了するかどうかを判定する。接続処理は、目的変数の区分が隣り合っており、かつ、クラスタの要素である局所時系列データ301の時間区間と代表回帰関数が近い組み合わせを含むという条件を満たす場合に、実行する。 In S1102, it is determined whether or not to terminate the connection process in the global time series estimation process. The connection process is executed when the objective variable classifications are adjacent to each other and the condition that the time interval of the local time series data 301 that is an element of the cluster and the representative regression function are included is included.
例えば、集合Gのすべての要素Di,Djの組に対して、
条件Dist(S(Di),S(Dj))<δ
を満たすかどうかを判定する。条件を満たす場合には、S1105に進む。条件を満たさない場合は、S1103に進む。
ここで、
Dist(S(Di),S(Dj))は、例えば、以下で定義する。
Condition Dist (S (Di), S (Dj)) <δ
Judge whether to satisfy. If the condition is satisfied, the process proceeds to S1105. If the condition is not satisfied, the process proceeds to S1103.
here,
Dist (S (Di), S (Dj)) is defined below, for example.
S1103では、大域的時系列推定処理における併合処理を実行する。例えば、集合GのすべてのDi,Djの組に対して、Dist(S(Di),S(Dj))が最小となるDi,Djを求める。 In S1103, the merge process in the global time series estimation process is executed. For example, Di and Dj that minimize Dist (S (Di), S (Dj)) are obtained for all Di and Dj pairs in the set G.
S1104では、大域的時系列データの候補集合Gを更新する。集合Gから、S(Di)とS(Dj)を削除し、S(Di+Dj) を追加する。但し、S(Di+Dj)は、例えば、下記で定義する。
の場合にしか定義されないので、併合後のyの区間は連続した一つの区間
(yis,yje]になる。
In S1104, the global time-series data candidate set G is updated. Delete S (Di) and S (Dj) from set G and add S (Di + Dj). However, S (Di + Dj) is defined below, for example.
Therefore, the y section after merging becomes one continuous section (y is , y je ]).
S1105では、集合GのすべてのDiに対して、区分的な回帰分析を実施する。このときの区分数は、自由に選択してもよいし、クラスタDiの構成要素となるG初期化時のクラスタ数(すなわち、S(Di)に含まれる代表回帰式の数に等しい)としてもよい。S1105で得られた区分的な回帰式が、推定された大域的な時系列データモデルである。 In S1105, piecewise regression analysis is performed on all Di in the set G. The number of sections at this time may be freely selected, or may be the number of clusters at the time of G initialization that is a component of the cluster Di (that is, equal to the number of representative regression equations included in S (Di)). Good. The piecewise regression equation obtained in S1105 is the estimated global time series data model.
(S906:外れ値検出部106の動作)
S906は、外れ値検出部106が実行する外れ値検出処理である。別途与えられた区分データに対して、大域的時系列データモデル推定部105により得られた代表局所時系列データモデルの集合における外れ値が大きいものを異常として検出する。
(S906: Operation of Outlier Detection Unit 106)
S906 is an outlier detection process executed by the
以上のように、実施の形態1のプラント異常検知装置100では、時間やセンサ信号の値で区分された局所時系列データの集合をクラスタリングするS904の処理により、頻度の少ない局所時系列データは代表局所パラメータにはあまり影響されてないため、収集したデータ中に、設備の劣化に起因するデータのばらつきや、異常となる直前のデータが混入している場合でも、それらの頻度が少ない場合には、異常検知の精度低下を防ぐ効果が得られる。
また、S904で得られた局所時系列データクラスタリング部104が推定したモデルを接続することにより大域的な代表時系列データモデルを生成することで、センサ信号間の大域的な関係式を求めることができるようになる。したがって、この大域的な関係グラフからの偏差により異常と判定したことをユーザに示すことで、異常判断の根拠の説明をわかりやすく説明することができるようになる。
この大域的な関係式を求める処理は、図8に示すように、信号間の関係があらかじめ不明である非線形な関係にある場合でも、局所的に線形で表現された関係を接続しているので、大域的な関係式を求めることができるという効果も持つ。
As described above, in the plant
Further, it is possible to obtain a global relational expression between sensor signals by generating a global representative time series data model by connecting the models estimated by the local time series
As shown in FIG. 8, the processing for obtaining this global relational expression connects locally expressed relationships even when the relationship between signals is a non-linear relationship that is unknown in advance. It also has the effect that a global relational expression can be obtained.
(1)本実施の形態のプラント異常検出装置は、時間区分に分割して得られた軌跡区分をクラスタリングすることにより、軌跡区分の中で頻度が多いという意味で代表的な軌跡区分を抽出する。これにより、まれにしか生じない軌跡区分の影響を小さくすることにより、異常検知の精度を向上させることができる。
(2)また、大域的時系列データモデル推定部105が、上記の代表的な軌跡区分を接続することにより、大域的な代表的な軌跡を生成する。従って、センサ信号間の大域的な関係グラフを求め、この大域的な関係グラフからの偏差により異常と判定したことをユーザに示すことができるため、異常判断の根拠の説明をユーザにわかりやすく説明することができる。
(1) The plant abnormality detection apparatus according to the present embodiment extracts a representative trajectory segment in the sense that the trajectory segment has a high frequency by clustering the trajectory segments obtained by dividing into time segments. . Thereby, the accuracy of abnormality detection can be improved by reducing the influence of the trajectory segment that occurs rarely.
(2) Further, the global time series data
実施の形態2.
図22、図23を参照して実施の形態4を説明する。実施の形態2は、コンピュータであるプラント異常検知装置100のハードウェア構成を説明する。図22は、コンピュータであるプラント異常検知装置100の外観の一例を示す図である。図23は、実施の形態1で述べたCPU割当時間管理装置1000のハードウェア資源の一例を示す図である。
The fourth embodiment will be described with reference to FIGS.
外観を示す図22において、プラント異常検知装置100は、システムユニット830、CRT(Cathode・Ray・Tube)やLCD(液晶)の表示画面を有する表示装置813、キーボード814(Key・Board:K/B)、マウス815、コンパクトディスク装置818(CDD:Compact Disk Drive)などのハードウェア資源を備え、これらはケーブルや信号線で接続されている。システムユニット830はネットワークに接続している。
In FIG. 22 showing the appearance, the plant
またハードウェア資源を示す図23において、プラント異常検知装置100は、プログラムを実行するCPU810(Central Processing Unit)を備えている。CPU810は、バス825を介してROM(Read Only Memory)811、RAM(Random Access Memory)812、表示装置813、キーボード814、マウス815、通信ボード816、CDD818、磁気ディスク装置820と接続され、これらのハードウェアデバイスを制御する。磁気ディスク装置820の代わりに、光ディスク装置、フラッシュメモリなどの記憶装置でもよい。
In FIG. 23 showing hardware resources, the plant
RAM812は、揮発性メモリの一例である。ROM811、CDD818、磁気ディスク装置820等の記憶媒体は、不揮発性メモリの一例である。これらは、「記憶装置」あるいは記憶部、格納部、バッファの一例である。通信ボード816、キーボード814などは、入力部、入力装置の一例である。また、通信ボード816、表示装置813などは、出力部、出力装置の一例である。通信ボード816は、ネットワークに接続されている。
The
磁気ディスク装置820には、オペレーティングシステム821(OS)、ウィンドウシステム822、プログラム群823、ファイル群824が記憶されている。プログラム群823のプログラムは、CPU810、オペレーティングシステム821、ウィンドウシステム822により実行される。
The
上記OS821,プログラム群823には、以上の実施の形態の説明において「〜部」として説明した機能を実行するプログラムが記憶されている。プログラムは、CPU810により読み出され実行される。
The
ファイル群824には、以上の実施の形態の説明において、「〜の判定結果」、「〜の算出結果」、「〜の抽出結果」、「〜の生成結果」、「〜の処理結果」として説明した情報や、データや信号値や変数値やパラメータなどが、「〜ファイル」や「〜データベース」の各項目として記憶されている。「〜ファイル」や「〜データベース」(例えばプラント時系列データベース101)は、ディスクやメモリなどの記録媒体に記憶される。ディスクやメモリなどの記憶媒体に記憶された情報やデータや信号値や変数値やパラメータは、読み書き回路を介してCPU810によりメインメモリやキャッシュメモリに読み出され、抽出・検索・参照・比較・演算・計算・処理・出力・印刷・表示などのCPUの動作に用いられる。抽出・検索・参照・比較・演算・計算・処理・出力・印刷・表示のCPUの動作の間、情報やデータや信号値や変数値やパラメータは、メインメモリやキャッシュメモリやバッファメモリに一時的に記憶される。
In the description of the above embodiment, the
また、以上に述べた実施の形態の説明において、データや信号値は、RAM812のメモリ、CDD818のコンパクトディスク、磁気ディスク装置820の磁気ディスク、その他光ディスク、ミニディスク、DVD(Digital・Versatile・Disk)等の記録媒体に記録される。また、データや信号は、バス825や信号線やケーブルその他の伝送媒体によりオンライン伝送される。
In the description of the embodiment described above, the data and signal values are the memory of the
また、以上の実施の形態の説明において、「〜部」として説明したものは、「〜手段」、であってもよく、また、「〜ステップ」、「〜手順」、「〜処理」であってもよい。すなわち、「〜部」として説明したものは、ソフトウェアのみ、或いは、ソフトウェアとハードウェアとの組み合わせ、さらには、ファームウェアとの組み合わせで実施されても構わない。ファームウェアとソフトウェアは、プログラムとして、磁気ディスク、フレキシブルディスク、光ディスク、コンパクトディスク、ミニディスク、DVD等の記録媒体に記憶される。プログラムはCPU810により読み出され、CPU810により実行される。すなわち、プログラムは、以上に述べた「〜部」としてコンピュータを機能させるものである。あるいは、以上に述べた「〜部」の手順や方法をコンピュータに実行させるものである。
In the above description of the embodiment, what has been described as “to part” may be “to means”, and “to step”, “to procedure”, and “to processing”. May be. That is, what has been described as “˜unit” may be implemented by software alone, a combination of software and hardware, or a combination of firmware. Firmware and software are stored as programs in a recording medium such as a magnetic disk, a flexible disk, an optical disk, a compact disk, a mini disk, and a DVD. The program is read by the
以上の実施の形態では、プラント異常検知装置100を説明したが、プラント異常検知装置100の動作を、コンピュータに実行させるためのプログラムとしても把握できることは以上の説明から当然である。また、以上の実施の形態で説明したプラント異常検知装置100の動作を、プラント異常検知装置100の各部が行う検出方法、検知方法と把握することも可能である。
In the above embodiment, although the plant
以上の実施の形態では、
時間の経過に従って順次観測して得た複数の時系列データの組を入力データとして、入力データの時間的な変化の仕方に従って、前記入力データを時間で区分することにより、時間で区分された時系列データを抽出する局所時系列データ抽出部と、
前記の区分されたデータを、多変量解析、または、時系列解析手法によりモデル推定する局所時系列データモデル推定部と、
前記により推定された局所時系列データのモデルの集合をクラスタに分割すると共に、クラスタ毎にクラスタを代表する代表局所パラメータを推定する局所時系列データクラスタリング部と、
別途与えられた区分データに対して、前記により得られた代表局所時系列データモデルの集合における外れ値が大きいものを異常として検出する外れ値検出部
とを有するプラント異常検知装置を説明した。
In the above embodiment,
When a set of time-series data obtained by observing sequentially over time is used as input data, and the input data is divided by time according to how the input data changes over time. A local time series data extraction unit for extracting series data;
A local time series data model estimation unit for estimating the modeled data by multivariate analysis or a time series analysis method;
A local time series data clustering unit that divides a set of models of local time series data estimated as described above into clusters, and estimates representative local parameters representing the clusters for each cluster;
A plant abnormality detection apparatus having an outlier detection unit that detects, as an abnormality, a large outlier in the set of representative local time series data models obtained as described above with respect to separately provided segment data has been described.
以上の実施の形態では、
時間で区分された時系列データを、さらに、時系列データの値のレンジで区分することにより得られる時系列データを抽出することを特徴とする局所時系列データ抽出部を備えたプラント異常検知装置を説明した。
In the above embodiment,
A plant abnormality detection apparatus having a local time-series data extraction unit, characterized by extracting time-series data obtained by further classifying time-series data divided by time into a range of values of time-series data Explained.
以上の実施の形態では、
代表局所時系列データの推定モデルを接続することにより得られる大域的な代表時系列データの候補を生成する大域的時系列データモデル推定部を備えたこプラント異常検知装置を説明した。
In the above embodiment,
This plant abnormality detection apparatus provided with the global time series data model estimation part which produces | generates the candidate of the global representative time series data obtained by connecting the estimation model of representative local time series data was demonstrated.
100 プラント異常検知装置、101 プラント時系列データベース、102 局所時系列データ抽出部、103 局所時系列データモデル推定部、104 局所時系列データクラスタリング部、105 大域的時系列データモデル推定部、106 外れ値検出部、301 局所時系列データ、701 クラスタ、702 クラスタ、703 クラスタ、704 クラスタ、705 回帰式(代表局所パラメータ)、706 回帰式(代表局所パラメータ)、707,708 異常判定対象データ、901,902 局所時系列データの対応範囲。
DESCRIPTION OF
Claims (4)
前記局所時系列データ抽出部が抽出したN個の局所時系列データを、初期クラスタ分割の規則として予め設定された初期クラスタ分割規則に従って、予め設定された初期クラスタ数の初期クラスタに分割し、分割した初期クラスタごとに初期クラスタの特性を指標する代表情報を生成し、生成した代表情報ごとにN個の局所時系列データを再クラスタリングの規則として予め設定された再クラスタリング規則に従って分配することによりN個の局所時系列データをクラスタに分割する再クラスタリングを実行し、再クラスタリングしたクラスタごとに代表情報を再生成し、再生成した代表情報ごとに前記局所時系列データ抽出部が抽出したN個の局所時系列データを再クラスタリングし、
以降同様に、
N個の局所時系列データの再クラスタリングと、代表情報の再生成とを繰り返すと共に、代表情報を再生成するたびに、今回生成した代表情報が直前に生成した代表情報に対して変化があるかどうかを判定し、変化があるときには次回の代表情報の再生成処理を継続し、変化がないときには次回の代表情報の再生成処理を継続することなくN個の局所時系列データの再クラスタリングと代表情報の再生成との処理を終了する局所時系列データクラスタリング部と、
前記局所時系列データ抽出部が生成したN個の局所時系列データに対応する回帰式である局所時系列データ回帰式をN個の局所時系列データごとに生成する局所時系列データ回帰式生成部と
を備え、
前記局所時系列データクラスタリング部は、
分割した各初期クラスタに所属する局所時系列データの和集合に対して回帰分析を実施することにより初期クラスタごとに代表情報として第1回帰式を生成し、N個の局所時系列データのそれぞれの時系列データ回帰式に対して初期クラスタごとに生成したそれぞれの第1回帰式のうち再クラスタリング規則である所定の距離定義式に従って計算した距離が最短になる第1回帰式を特定し、特定した第1回帰式を同じくする時系列データ回帰式の元になる局所時系列データから構成されるクラスタである第1クラスタを、互いに異なる第1回帰式に対応させて生成することで再クラスタリングし、各第1クラスタに所属する局所時系列データの和集合に対して回帰分析を実施することにより第1クラスタごとに代表情報である第2回帰式を生成する回帰式生成処理を実行し、
以下同様にして、
N個の局所時系列データのそれぞれの時系列データ回帰式に対して第pクラスタ(pは1以上の整数)ごとに生成した代表情報であるそれぞれの第p+1回帰式のうち前記所定の距離定義式に従って計算した距離が最短になる第p+1回帰式を特定し、特定された第p+1回帰式を同じくする時系列データ回帰式の元になる局所時系列データから構成されるクラスタである第p+1クラスタを、互いに異なる第p+1回帰式ごとに対応させて生成することで再クラスタリングし、各第p+1クラスタに所属する局所時系列データの和集合に対して回帰分析を実施することにより第p+1クラスタごとに代表情報である第p+2回帰式を生成する回帰式生成処理を実行すると共に、
新たな第p+1回帰式を生成するたびに前回生成した第p回帰式から変化があるかどうかを判定し、変化があるときには次の新たな第p+2回帰式の回帰式生成処理を継続し、変化がないときには次の新たな第p+2回帰式の回帰式生成処理を継続することなく、回帰式生成処理を終了する判定処理を実行し、
前記局所時系列データ抽出部は、
種類の異なる複数の時系列データのうち予め指定されている指定時系列データのデータ値の範囲を、第1データ範囲から第K個データ範囲(Kは2以上の整数)の異なるK個のデータ範囲に区分し、区分したK個のデータ範囲ごとに、所定の局所時系列データ生成規則を用いてN個の局所時系列データを生成し、
前記局所時系列データ回帰式生成部は、
前記局所時系列データ抽出部が、区分されたK個のデータ範囲ごとに生成した総数K×Nの個数の局所時系列データに対応する局所時系列データ回帰式をK×Nの個数の局所時系列データごとに生成し、
前記局所時系列データクラスタリング部は、
前記局所時系列データ抽出部が区分したK個のデータ範囲ごとに、回帰式生成処理と判定処理とを、前記局所時系列データ抽出部が生成したデータ範囲に対応する局所時系列データと、前記局所時系列データ回帰式生成部が生成した局所時系列データ回帰式であって前記局所時系列データ抽出部が生成したデータ範囲を局所時系列データと同じくする局所時系列データ回帰式とを用いて実行するクラスタリング装置。 Time series data belonging to the time range is extracted for each N time ranges (N is an integer of 2 or more) from the first time range to the Nth time range from a plurality of different time series data. A local time-series data extraction unit that generates N local time-series data including a plurality of sets of time-series data in a range;
N local time-series data extracted by the local time-series data extraction unit is divided into initial clusters having a predetermined number of initial clusters according to an initial cluster dividing rule set in advance as an initial cluster dividing rule, and divided. N is generated by generating representative information indicating the characteristics of the initial cluster for each initial cluster, and distributing N local time-series data according to the re-clustering rule set in advance as a re-clustering rule for each generated representative information. Re-clustering is performed to divide the local time-series data into clusters, representative information is regenerated for each re-clustered cluster, and N local time-series data extraction units extracted for each re-generated representative information Re-cluster local time series data,
Similarly,
Repeat the re-clustering of N local time-series data and the regeneration of the representative information, and every time the representative information is regenerated, is the representative information generated this time changed from the representative information generated immediately before? When there is a change, the next representative information regeneration process is continued, and when there is no change, the next representative information regeneration process is continued without re-clustering and representing the N local time-series data. the local time-series data clustering unit to end the process with regeneration of the information,
A local time series data regression equation generating unit that generates a local time series data regression equation corresponding to the N local time series data generated by the local time series data extracting unit for each of the N local time series data. When
With
The local time series data clustering unit
By performing regression analysis on the union of local time series data belonging to each divided initial cluster, a first regression equation is generated as representative information for each initial cluster, and each of the N local time series data is generated. The first regression equation that has the shortest distance calculated according to a predetermined distance definition equation that is a reclustering rule among the first regression equations generated for each initial cluster with respect to the time series data regression equation is identified and identified. Re-clustering by generating a first cluster that is a cluster composed of local time-series data that is the basis of a time-series data regression formula that is the same as the first regression formula, corresponding to different first regression formulas, By performing a regression analysis on the union of local time series data belonging to each first cluster, a second regression equation that is representative information is generated for each first cluster. Regression formula generation process is executed for,
Similarly,
The predetermined distance definition among the respective p + 1 regression equations that are representative information generated for each pth cluster (p is an integer of 1 or more) with respect to each of the time series data regression equations of the N local time series data. The p + 1-th cluster which is a cluster composed of local time-series data that identifies the time-series data regression equation that identifies the p + 1-th regression equation with the shortest distance calculated according to the equation Are re-clustered by generating corresponding to each different p + 1-th regression equation, and regression analysis is performed on the union of local time series data belonging to each p + 1-th cluster for each p + 1-th cluster While executing a regression equation generation process for generating the p + 2 regression equation that is representative information,
Each time a new p + 1th regression equation is generated, it is determined whether there is a change from the previously generated pth regression equation. If there is a change, the next new p + 2 regression equation regression expression generation process is continued and the change is made. When there is not, the determination processing for ending the regression equation generation processing is executed without continuing the regression equation generation processing of the next new p + 2 regression equation,
The local time series data extraction unit includes:
A range of data values of designated time-series data specified in advance among a plurality of different types of time-series data is set to K pieces of data that differ from the first data range to the K-th data range (K is an integer of 2 or more). Divide into ranges, and generate N local time series data using a predetermined local time series data generation rule for each of the divided K data ranges,
The local time series data regression equation generation unit
The local time series data extraction unit calculates a local time series data regression equation corresponding to the total number of K × N local time series data generated for each of the divided K data ranges as K × N local times. Generate for each series data,
The local time series data clustering unit
For each of the K data ranges divided by the local time series data extraction unit, a regression formula generation process and a determination process are performed, and the local time series data corresponding to the data range generated by the local time series data extraction unit, A local time series data regression formula generated by the local time series data regression formula generation unit, and a local time series data regression formula in which the data range generated by the local time series data extraction unit is the same as the local time series data Clustering device to execute.
判定処理において回帰式生成処理を終了すると判定したときは、最後に生成した回帰式の生成の元になるクラスタを局所クラスタと決定し、決定した局所クラスタに対応する回帰式を、そのクラスタを代表する局所クラスタ代表情報と決定することを特徴とする請求項1に記載のクラスタリング装置。 The local time series data clustering unit
When it is determined that the regression equation generation processing is to be terminated in the determination processing, the cluster that is the source of the last generated regression equation is determined as a local cluster, and the regression equation corresponding to the determined local cluster is represented by that cluster. The clustering apparatus according to claim 1 , wherein local cluster representative information to be determined is determined.
前記局所時系列データクラスタリング部が決定した局所クラスタ代表情報に基づき、評価対象として別途与えられた評価対象データであって、局所時系列データの生成の元になる種類の異なる複数の時系列データと種類を同じくする複数の時系列データの組からなる所定期間の評価対象データに対して、距離として定義された値がいずれかの局所クラスタ代表情報との間で閾値を超えるかどうかを検出する外れ値検出部を備えたことを特徴とする請求項1または請求項2に記載のクラスタリング装置。 The clustering apparatus includes:
Based on local cluster representative information determined by the local time-series data clustering unit, the evaluation target data separately given as an evaluation target, and a plurality of different types of time-series data from which local time-series data is generated An error in detecting whether the value defined as the distance exceeds any threshold with any local cluster representative information for the evaluation target data consisting of multiple sets of time series data of the same type. clustering apparatus according to claim 1 or claim 2, characterized in that with a value detection unit.
前記局所時系列データ抽出処理が抽出したN個の局所時系列データを、初期クラスタ分割の規則として予め設定された初期クラスタ分割規則に従って、予め設定された初期クラスタ数の初期クラスタに分割し、分割した初期クラスタごとに初期クラスタの特性を指標する代表情報を生成し、生成した代表情報ごとにN個の局所時系列データを再クラスタリングの規則として予め設定された再クラスタリング規則に従って分配することによりN個の局所時系列データをクラスタに分割する再クラスタリングを実行し、再クラスタリングしたクラスタごとに代表情報を再生成し、再生成した代表情報ごとに前記局所時系列データ抽出処理が抽出したN個の局所時系列データを再クラスタリングし、 The N local time-series data extracted by the local time-series data extraction process are divided into initial clusters having a preset number of initial clusters in accordance with an initial cluster division rule set in advance as an initial cluster division rule. N is generated by generating representative information indicating the characteristics of the initial cluster for each initial cluster, and distributing N local time-series data according to the re-clustering rule set in advance as a re-clustering rule for each generated representative information. Re-clustering is performed to divide the local time-series data into clusters, representative information is regenerated for each re-clustered cluster, and the N time-series data extraction processes extracted for each re-generated representative information Re-cluster local time series data,
以降同様に、Similarly,
N個の局所時系列データの再クラスタリングと、代表情報の再生成とを繰り返すと共に、代表情報を再生成するたびに、今回生成した代表情報が直前に生成した代表情報に対して変化があるかどうかを判定し、変化があるときには次回の代表情報の再生成処理を継続し、変化がないときには次回の代表情報の再生成処理を継続することなくN個の局所時系列データの再クラスタリングと代表情報の再生成との処理を終了する局所時系列データクラスタリング処理と、 Repeat the re-clustering of N local time-series data and the regeneration of the representative information, and every time the representative information is regenerated, is the representative information generated this time changed from the representative information generated immediately before? When there is a change, the next representative information regeneration process is continued, and when there is no change, the next representative information regeneration process is continued without re-clustering and representing the N local time-series data. Local time series data clustering processing to finish the process of information regeneration,
前記局所時系列データ抽出処理が生成したN個の局所時系列データに対応する回帰式である局所時系列データ回帰式をN個の局所時系列データごとに生成する局所時系列データ回帰式生成処理と Local time series data regression equation generation processing for generating a local time series data regression equation corresponding to N local time series data generated by the local time series data extraction processing for each N local time series data When
を実行させると共に、And execute
前記局所時系列データクラスタリング処理は、 The local time series data clustering process is:
分割した各初期クラスタに所属する局所時系列データの和集合に対して回帰分析を実施することにより初期クラスタごとに代表情報として第1回帰式を生成し、N個の局所時系列データのそれぞれの時系列データ回帰式に対して初期クラスタごとに生成したそれぞれの第1回帰式のうち再クラスタリング規則である所定の距離定義式に従って計算した距離が最短になる第1回帰式を特定し、特定した第1回帰式を同じくする時系列データ回帰式の元になる局所時系列データから構成されるクラスタである第1クラスタを、互いに異なる第1回帰式に対応させて生成することで再クラスタリングし、各第1クラスタに所属する局所時系列データの和集合に対して回帰分析を実施することにより第1クラスタごとに代表情報である第2回帰式を生成する回帰式生成処理を実行し、 By performing regression analysis on the union of local time series data belonging to each divided initial cluster, a first regression equation is generated as representative information for each initial cluster, and each of the N local time series data is generated. The first regression equation that has the shortest distance calculated according to a predetermined distance definition equation that is a reclustering rule among the first regression equations generated for each initial cluster with respect to the time series data regression equation is identified and identified. Re-clustering by generating a first cluster that is a cluster composed of local time-series data that is the basis of a time-series data regression formula that is the same as the first regression formula, corresponding to different first regression formulas, By performing a regression analysis on the union of local time series data belonging to each first cluster, a second regression equation that is representative information is generated for each first cluster. Regression formula generation process is executed for,
以下同様にして、 Similarly,
N個の局所時系列データのそれぞれの時系列データ回帰式に対して第pクラスタ(pは1以上の整数)ごとに生成した代表情報であるそれぞれの第p+1回帰式のうち前記所定の距離定義式に従って計算した距離が最短になる第p+1回帰式を特定し、特定された第p+1回帰式を同じくする時系列データ回帰式の元になる局所時系列データから構成されるクラスタである第p+1クラスタを、互いに異なる第p+1回帰式ごとに対応させて生成することで再クラスタリングし、各第p+1クラスタに所属する局所時系列データの和集合に対して回帰分析を実施することにより第p+1クラスタごとに代表情報である第p+2回帰式を生成する回帰式生成処理を実行すると共に、 The predetermined distance definition among the respective p + 1 regression equations that are representative information generated for each pth cluster (p is an integer of 1 or more) with respect to each of the time series data regression equations of the N local time series data. The p + 1-th cluster which is a cluster composed of local time-series data that identifies the time-series data regression equation that identifies the p + 1-th regression equation with the shortest distance calculated according to the equation Are re-clustered by generating corresponding to each different p + 1-th regression equation, and regression analysis is performed on the union of local time series data belonging to each p + 1-th cluster for each p + 1-th cluster While executing a regression equation generation process for generating the p + 2 regression equation that is representative information,
新たな第p+1回帰式を生成するたびに前回生成した第p回帰式から変化があるかどうかを判定し、変化があるときには次の新たな第p+2回帰式の回帰式生成処理を継続し、変化がないときには次の新たな第p+2回帰式の回帰式生成処理を継続することなく、回帰式生成処理を終了する判定処理を実行し、 Each time a new p + 1th regression equation is generated, it is determined whether there is a change from the previously generated pth regression equation. If there is a change, the next new p + 2 regression equation regression expression generation process is continued and the change is made. When there is not, the determination processing for ending the regression equation generation processing is executed without continuing the regression equation generation processing of the next new p + 2 regression equation,
前記局所時系列データ抽出処理は、 The local time series data extraction process includes:
種類の異なる複数の時系列データのうち予め指定されている指定時系列データのデータ値の範囲を、第1データ範囲から第K個データ範囲(Kは2以上の整数)の異なるK個のデータ範囲に区分し、区分したK個のデータ範囲ごとに、所定の局所時系列データ生成規則を用いてN個の局所時系列データを生成し、 A range of data values of designated time-series data specified in advance among a plurality of different types of time-series data is set to K pieces of data that differ from the first data range to the K-th data range (K is an integer of 2 or more). Divide into ranges, and generate N local time series data using a predetermined local time series data generation rule for each of the divided K data ranges,
前記局所時系列データ回帰式生成処理は、 The local time series data regression formula generation process is:
前記局所時系列データ抽出処理が、区分されたK個のデータ範囲ごとに生成した総数K×Nの個数の局所時系列データに対応する局所時系列データ回帰式をK×Nの個数の局所時系列データごとに生成し、 In the local time series data extraction processing, the local time series data regression equation corresponding to the total number K × N of local time series data generated for each of the divided K data ranges is represented as K × N local times. Generate for each series data,
前記局所時系列データクラスタリング処理は、 The local time series data clustering process is:
前記局所時系列データ抽出処理が区分したK個のデータ範囲ごとに、回帰式生成処理と判定処理とを、前記局所時系列データ抽出処理が生成したデータ範囲に対応する局所時系列データと、前記局所時系列データ回帰式生成処理が生成した局所時系列データ回帰式であって前記局所時系列データ抽出処理が生成したデータ範囲を局所時系列データと同じくする局所時系列データ回帰式とを用いて実行するクラスタリングプログラム。 For each of the K data ranges divided by the local time-series data extraction process, a regression equation generation process and a determination process are performed, the local time-series data corresponding to the data range generated by the local time-series data extraction process, A local time series data regression formula generated by the local time series data regression formula generation process, and a local time series data regression formula in which the data range generated by the local time series data extraction process is the same as the local time series data Clustering program to execute.
Priority Applications (1)
| Application Number | Priority Date | Filing Date | Title |
|---|---|---|---|
| JP2012040134A JP5868216B2 (en) | 2012-02-27 | 2012-02-27 | Clustering apparatus and clustering program |
Applications Claiming Priority (1)
| Application Number | Priority Date | Filing Date | Title |
|---|---|---|---|
| JP2012040134A JP5868216B2 (en) | 2012-02-27 | 2012-02-27 | Clustering apparatus and clustering program |
Publications (3)
| Publication Number | Publication Date |
|---|---|
| JP2013175108A JP2013175108A (en) | 2013-09-05 |
| JP2013175108A5 JP2013175108A5 (en) | 2015-01-08 |
| JP5868216B2 true JP5868216B2 (en) | 2016-02-24 |
Family
ID=49267944
Family Applications (1)
| Application Number | Title | Priority Date | Filing Date |
|---|---|---|---|
| JP2012040134A Active JP5868216B2 (en) | 2012-02-27 | 2012-02-27 | Clustering apparatus and clustering program |
Country Status (1)
| Country | Link |
|---|---|
| JP (1) | JP5868216B2 (en) |
Cited By (1)
| Publication number | Priority date | Publication date | Assignee | Title |
|---|---|---|---|---|
| CN106933204A (en) * | 2015-10-09 | 2017-07-07 | 费希尔-罗斯蒙特系统公司 | Distributed industrial performance monitoring and analysis |
Families Citing this family (16)
| Publication number | Priority date | Publication date | Assignee | Title |
|---|---|---|---|---|
| US9558220B2 (en) | 2013-03-04 | 2017-01-31 | Fisher-Rosemount Systems, Inc. | Big data in process control systems |
| US10551799B2 (en) | 2013-03-15 | 2020-02-04 | Fisher-Rosemount Systems, Inc. | Method and apparatus for determining the position of a mobile control device in a process plant |
| WO2017061028A1 (en) | 2015-10-09 | 2017-04-13 | 株式会社日立製作所 | Abnormality detection device |
| JP6798825B2 (en) * | 2016-08-29 | 2020-12-09 | 公立大学法人大阪 | Data analysis device, control device, control method of data analysis device, control program, and recording medium |
| JP6105141B1 (en) | 2016-09-30 | 2017-03-29 | 株式会社日立パワーソリューションズ | Preprocessor and diagnostic device |
| JP7035842B2 (en) * | 2017-07-14 | 2022-03-15 | 株式会社明電舎 | Monitoring system |
| JP7139625B2 (en) * | 2017-08-04 | 2022-09-21 | 富士電機株式会社 | Factor analysis system, factor analysis method and program |
| JP7009961B2 (en) * | 2017-12-04 | 2022-01-26 | 株式会社明電舎 | Abnormality diagnosis device and abnormality diagnosis method |
| US11293989B2 (en) | 2018-03-15 | 2022-04-05 | Nec Corporation | Anomaly detection device, anomaly detection method, and recording medium |
| US11599083B2 (en) * | 2018-05-31 | 2023-03-07 | Mitsubishi Electric Corporation | Work analysis apparatus for analyzing work including series of actions performed by working subject |
| WO2019239542A1 (en) | 2018-06-14 | 2019-12-19 | 三菱電機株式会社 | Abnormality sensing apparatus, abnormality sensing method, and abnormality sensing program |
| WO2019239607A1 (en) | 2018-06-15 | 2019-12-19 | 三菱電機株式会社 | Diagnosis device, diagnosis method and program |
| JP6929260B2 (en) * | 2018-11-01 | 2021-09-01 | 株式会社東芝 | Time-series feature extraction device, time-series feature extraction method and program |
| CN110134839B (en) * | 2019-03-27 | 2023-06-06 | 平安科技(深圳)有限公司 | Time sequence data characteristic processing method and device and computer readable storage medium |
| WO2021100148A1 (en) * | 2019-11-20 | 2021-05-27 | 三菱電機株式会社 | Operational know-how estimation device and operational know-how estimation method |
| CN113657533B (en) * | 2021-08-24 | 2023-11-14 | 河海大学 | Space-time scene construction-oriented multi-element time sequence segmentation clustering method |
Family Cites Families (6)
| Publication number | Priority date | Publication date | Assignee | Title |
|---|---|---|---|---|
| JP3732681B2 (en) * | 1999-06-29 | 2006-01-05 | アルパイン株式会社 | Audio sound canceling device |
| JP2006350730A (en) * | 2005-06-16 | 2006-12-28 | Toshiba Corp | Clustering device, clustering method, and program |
| JP5031088B2 (en) * | 2008-02-27 | 2012-09-19 | 三菱重工業株式会社 | Plant state monitoring method, plant state monitoring computer program, and plant state monitoring apparatus |
| JP5260343B2 (en) * | 2009-02-03 | 2013-08-14 | 三菱重工業株式会社 | Plant operating condition monitoring method |
| JP5364530B2 (en) * | 2009-10-09 | 2013-12-11 | 株式会社日立製作所 | Equipment state monitoring method, monitoring system, and monitoring program |
| JP4832609B1 (en) * | 2011-06-22 | 2011-12-07 | 株式会社日立エンジニアリング・アンド・サービス | Abnormal sign diagnosis device and abnormality sign diagnosis method |
-
2012
- 2012-02-27 JP JP2012040134A patent/JP5868216B2/en active Active
Cited By (1)
| Publication number | Priority date | Publication date | Assignee | Title |
|---|---|---|---|---|
| CN106933204A (en) * | 2015-10-09 | 2017-07-07 | 费希尔-罗斯蒙特系统公司 | Distributed industrial performance monitoring and analysis |
Also Published As
| Publication number | Publication date |
|---|---|
| JP2013175108A (en) | 2013-09-05 |
Similar Documents
| Publication | Publication Date | Title |
|---|---|---|
| JP5868216B2 (en) | Clustering apparatus and clustering program | |
| JP5538597B2 (en) | Anomaly detection method and anomaly detection system | |
| JP6312630B2 (en) | How to detect anomalies in time series data | |
| JP5301717B1 (en) | Equipment condition monitoring method and apparatus | |
| JP5301310B2 (en) | Anomaly detection method and anomaly detection system | |
| JP5048625B2 (en) | Anomaly detection method and system | |
| JP5342708B1 (en) | Anomaly detection method and apparatus | |
| US20120296606A1 (en) | Method, computer program, and system for performing interpolation on sensor data for high system availability | |
| JP6183450B2 (en) | System analysis apparatus and system analysis method | |
| Fujiwara et al. | Development of correlation-based pattern recognition algorithm and adaptive soft-sensor design | |
| JP5498540B2 (en) | Anomaly detection method and system | |
| US11796989B2 (en) | Monitoring system and monitoring method | |
| He et al. | Dynamic mutual information similarity based transient process identification and fault detection | |
| JP5669553B2 (en) | Abnormality detection device, abnormality detection method and abnormality detection program | |
| JP6489235B2 (en) | System analysis method, system analysis apparatus, and program | |
| Zhu et al. | Evaluating and predicting energy efficiency using slow feature partial least squares method for large-scale chemical plants | |
| Qian et al. | Soft sensing model visualization: Fine-tuning neural network from what model learned | |
| EP4160341A1 (en) | Abnormal modulation cause identifying device, abnormal modulation cause identifying method, and abnormal modulation cause identifying program | |
| JPWO2019073512A1 (en) | System analysis method, system analyzer, and program | |
| Li et al. | A recursively updated Map-Reduce based PCA for monitoring the time-varying fluorochemical engineering processes with big data | |
| JP7139625B2 (en) | Factor analysis system, factor analysis method and program | |
| Gatta et al. | Capability of the Bayesian Forecasting Method to Predict Field Time Series | |
| Hamadouche | Model-free direct fault detection and classification | |
| JP6615892B2 (en) | Time-varying profiling engine for physical systems | |
| Wang et al. | Using multivariate pattern segmentation to assess process performance and mine good operation conditions for dynamic chemical industry |
Legal Events
| Date | Code | Title | Description |
|---|---|---|---|
| A521 | Request for written amendment filed |
Free format text: JAPANESE INTERMEDIATE CODE: A523 Effective date: 20141118 |
|
| A621 | Written request for application examination |
Free format text: JAPANESE INTERMEDIATE CODE: A621 Effective date: 20141118 |
|
| A977 | Report on retrieval |
Free format text: JAPANESE INTERMEDIATE CODE: A971007 Effective date: 20150916 |
|
| A131 | Notification of reasons for refusal |
Free format text: JAPANESE INTERMEDIATE CODE: A131 Effective date: 20150929 |
|
| A521 | Request for written amendment filed |
Free format text: JAPANESE INTERMEDIATE CODE: A523 Effective date: 20151104 |
|
| TRDD | Decision of grant or rejection written | ||
| A01 | Written decision to grant a patent or to grant a registration (utility model) |
Free format text: JAPANESE INTERMEDIATE CODE: A01 Effective date: 20151208 |
|
| A61 | First payment of annual fees (during grant procedure) |
Free format text: JAPANESE INTERMEDIATE CODE: A61 Effective date: 20160105 |
|
| R150 | Certificate of patent or registration of utility model |
Ref document number: 5868216 Country of ref document: JP Free format text: JAPANESE INTERMEDIATE CODE: R150 |
|
| R250 | Receipt of annual fees |
Free format text: JAPANESE INTERMEDIATE CODE: R250 |
|
| R250 | Receipt of annual fees |
Free format text: JAPANESE INTERMEDIATE CODE: R250 |
|
| R250 | Receipt of annual fees |
Free format text: JAPANESE INTERMEDIATE CODE: R250 |
|
| R250 | Receipt of annual fees |
Free format text: JAPANESE INTERMEDIATE CODE: R250 |
|
| R250 | Receipt of annual fees |
Free format text: JAPANESE INTERMEDIATE CODE: R250 |
|
| R250 | Receipt of annual fees |
Free format text: JAPANESE INTERMEDIATE CODE: R250 |