JP5705307B2 - Dynamic adaptive process discovery and compliance - Google Patents
Dynamic adaptive process discovery and compliance Download PDFInfo
- Publication number
- JP5705307B2 JP5705307B2 JP2013509051A JP2013509051A JP5705307B2 JP 5705307 B2 JP5705307 B2 JP 5705307B2 JP 2013509051 A JP2013509051 A JP 2013509051A JP 2013509051 A JP2013509051 A JP 2013509051A JP 5705307 B2 JP5705307 B2 JP 5705307B2
- Authority
- JP
- Japan
- Prior art keywords
- graph
- node
- snapshot
- pair
- activity log
- Prior art date
- Legal status (The legal status is an assumption and is not a legal conclusion. Google has not performed a legal analysis and makes no representation as to the accuracy of the status listed.)
- Expired - Fee Related
Links
- 238000000034 method Methods 0.000 title claims description 247
- 230000008569 process Effects 0.000 title claims description 125
- 230000003044 adaptive effect Effects 0.000 title description 3
- 230000007704 transition Effects 0.000 claims description 59
- 230000000694 effects Effects 0.000 claims description 46
- 230000008859 change Effects 0.000 claims description 15
- 238000013459 approach Methods 0.000 claims description 7
- 238000004590 computer program Methods 0.000 claims description 3
- 238000005457 optimization Methods 0.000 claims description 3
- 230000003247 decreasing effect Effects 0.000 claims 2
- 230000009466 transformation Effects 0.000 claims 2
- 238000004040 coloring Methods 0.000 claims 1
- 239000011159 matrix material Substances 0.000 claims 1
- 238000013508 migration Methods 0.000 description 20
- 230000005012 migration Effects 0.000 description 20
- 230000008520 organization Effects 0.000 description 9
- 238000004364 calculation method Methods 0.000 description 4
- 238000013507 mapping Methods 0.000 description 4
- 235000019645 odor Nutrition 0.000 description 4
- 241000257303 Hymenoptera Species 0.000 description 3
- 239000013598 vector Substances 0.000 description 3
- 230000002238 attenuated effect Effects 0.000 description 2
- 230000001419 dependent effect Effects 0.000 description 2
- 238000010586 diagram Methods 0.000 description 2
- 238000000605 extraction Methods 0.000 description 2
- 238000012544 monitoring process Methods 0.000 description 2
- 230000037361 pathway Effects 0.000 description 2
- 238000012545 processing Methods 0.000 description 2
- 238000004458 analytical method Methods 0.000 description 1
- 230000003466 anti-cipated effect Effects 0.000 description 1
- 230000005540 biological transmission Effects 0.000 description 1
- 238000004422 calculation algorithm Methods 0.000 description 1
- 230000001186 cumulative effect Effects 0.000 description 1
- 238000013500 data storage Methods 0.000 description 1
- 238000012217 deletion Methods 0.000 description 1
- 230000037430 deletion Effects 0.000 description 1
- 238000005516 engineering process Methods 0.000 description 1
- 238000003780 insertion Methods 0.000 description 1
- 230000037431 insertion Effects 0.000 description 1
- 230000033001 locomotion Effects 0.000 description 1
- 238000007726 management method Methods 0.000 description 1
- 239000003016 pheromone Substances 0.000 description 1
- 230000000246 remedial effect Effects 0.000 description 1
- 238000012546 transfer Methods 0.000 description 1
- 230000001960 triggered effect Effects 0.000 description 1
Images


Classifications
-
- G—PHYSICS
- G06—COMPUTING; CALCULATING OR COUNTING
- G06T—IMAGE DATA PROCESSING OR GENERATION, IN GENERAL
- G06T11/00—2D [Two Dimensional] image generation
- G06T11/20—Drawing from basic elements, e.g. lines or circles
- G06T11/206—Drawing of charts or graphs
-
- G—PHYSICS
- G06—COMPUTING; CALCULATING OR COUNTING
- G06Q—INFORMATION AND COMMUNICATION TECHNOLOGY [ICT] SPECIALLY ADAPTED FOR ADMINISTRATIVE, COMMERCIAL, FINANCIAL, MANAGERIAL OR SUPERVISORY PURPOSES; SYSTEMS OR METHODS SPECIALLY ADAPTED FOR ADMINISTRATIVE, COMMERCIAL, FINANCIAL, MANAGERIAL OR SUPERVISORY PURPOSES, NOT OTHERWISE PROVIDED FOR
- G06Q10/00—Administration; Management
- G06Q10/06—Resources, workflows, human or project management; Enterprise or organisation planning; Enterprise or organisation modelling
Landscapes
- Engineering & Computer Science (AREA)
- Business, Economics & Management (AREA)
- Entrepreneurship & Innovation (AREA)
- Human Resources & Organizations (AREA)
- General Physics & Mathematics (AREA)
- Strategic Management (AREA)
- Economics (AREA)
- Theoretical Computer Science (AREA)
- Physics & Mathematics (AREA)
- Educational Administration (AREA)
- Game Theory and Decision Science (AREA)
- Development Economics (AREA)
- Marketing (AREA)
- Operations Research (AREA)
- Quality & Reliability (AREA)
- Tourism & Hospitality (AREA)
- General Business, Economics & Management (AREA)
- Management, Administration, Business Operations System, And Electronic Commerce (AREA)
- Information Retrieval, Db Structures And Fs Structures Therefor (AREA)
Description
本開示は、プロセス発見に関し、より詳細には動的適応型プロセス発見及び遵守のためのシステム及び方法に関する。 The present disclosure relates to process discovery, and more particularly to systems and methods for dynamic adaptive process discovery and compliance.
ビジネス・プロセスは、特定のタスク又は目的を達成するために実施される一連の手続きステップである。ステップは、手作業で、コンピュータの支援の下で、又は完全に自動的に実施することができる。あるタスクを達成することが可能な多くの方式が存在するので、ビジネス・プロセスの実行には多大な多様性が存在する。しばしば、組織体は、ビジネス・プロセスを正式なものにすることにより、ビジネス・オペレーションを能率化し、一貫した高い品質を保持しようと努めている。ビジネス・プロセスの正式化(formalization)は、正式なプロセス・モデルを、公開された手続き及び他のポリシー表明の形で公表することを含む。 A business process is a series of procedural steps that are performed to accomplish a specific task or purpose. The steps can be performed manually, with the aid of a computer, or completely automatically. Because there are many ways in which a task can be accomplished, there is a great diversity in the execution of business processes. Often, organizations seek to streamline business operations and maintain consistent high quality by formalizing business processes. Business process formalization involves publishing formal process models in the form of published procedures and other policy statements.
しかしながら、組織体が、正式化されたビジネス・プロセスを公表した後であっても、遵守を監視及び励行し、且つ、現実の実践が正式化されたプロセスにどの程度整合しているかを判定することは難しいことがある。従って、遵守の監視及び励行に関連した困難という観点から見ると、組織体は、ビジネス・オペレーションを迅速且つ効果的に最適化する能力を欠くことがある。 However, even after the organization publishes a formalized business process, it monitors and enforces compliance and determines how well the actual practice is aligned with the formalized process It can be difficult. Thus, from the perspective of difficulties associated with compliance monitoring and enforcement, organizations may lack the ability to optimize business operations quickly and effectively.
ビジネス・プロセス管理(BPM)は、ビジネス・プロセス・ステップがその上で実行され得る技術的プラットフォームを提供することにより、種々のビジネス・プロセスの実施を促進するために情報技術を利用し得る組織体を管理する手法である。BPMは、ビジネス・プロセスを継続的に改善しようと努めることができる一方で、正式なビジネス・プロセスの遵守の監視及び励行に関連した困難により、BPMの有効性は制限されることがある。 Business Process Management (BPM) is an organization that can utilize information technology to facilitate the implementation of various business processes by providing a technical platform upon which business process steps can be performed. It is a technique to manage. While BPM can strive to continually improve business processes, difficulties associated with monitoring and enforcing compliance with formal business processes can limit the effectiveness of BPM.
動的適応型プロセス発見及び遵守のための、プロセスをモデル化するためのシステム及び方法を提供する。 Systems and methods for modeling processes for dynamic adaptive process discovery and compliance are provided.
プロセスのモデル化のための方法は、1つ又は複数のアクティビティ・ログ・ファイルから、実行されたプロセス・ステップに付随するデータを収集することを含む。収集されたデータを構文解析して、実施済みプロセス・ステップのセットが判定される。実施済みプロセス・ステップの実施順序を示すプロセス・スレッドが識別される。収集されたデータの各々の識別されたプロセス・スレッド内で、各々の実施済みプロセス・ステップが他の各々の実施済みプロセス・ステップの後に続いた回数を表す、発生頻度値が判定される。各々の実施済みプロセス・ステップをグラフのノードとして表し、各々のプロセス・スレッド内のプロセス・ステップ間の各々の移行をグラフ上のエッジとして表すことにより、実行されたプロセスのモデルを表すグラフが生成される。グラフの所与のノード対のいずれについても、ノード対を接続するエッジに対して、対の第1のノードによって表されるプロセス・ステップの後に対の第2のノードによって表されるプロセス・ステップが続いた回数に対応する発生頻度値に依存する数が割り当てられる。生成されたグラフは、ユーザに対してアクセス可能にされる。 A method for process modeling includes collecting data associated with executed process steps from one or more activity log files. The collected data is parsed to determine a set of performed process steps. A process thread is identified that indicates the order in which performed process steps are performed. In each identified process thread of the collected data, an occurrence frequency value is determined that represents the number of times each performed process step lasted after each other performed process step. Represent each executed process step as a node in the graph, and each transition between process steps within each process thread as an edge on the graph, creating a graph that represents a model of the executed process Is done. For any given node pair in the graph, for the edge connecting the node pair, the process step represented by the second node of the pair after the process step represented by the first node of the pair Is assigned a number that depends on the occurrence frequency value corresponding to the number of times that has continued. The generated graph is made accessible to the user.
プロセスのモデル化のための方法は、1つ又は複数のアクティビティ・ログ・ファイルから、実行されたプロセス・ステップに付随するデータを収集することを含む。収集されたデータを構文解析して、実施済みプロセス・ステップのセットが判定される。収集されたデータの各々の実施済みプロセス・ステップが他の各々の実施済みプロセス・ステップの後に続いた回数を表す、発生頻度値が判定される。各々の実施済みプロセス・ステップをグラフのノードとして表し、プロセス・ステップ間の各々の移行をグラフ上のエッジとして表すことにより、実行されたプロセスのモデルを表すグラフが生成される。グラフの所与のノード対のいずれについても、ノード対を接続するエッジに対して、対の第1のノードによって表されるプロセス・ステップの後に対の第2のノードによって表されるプロセス・ステップが続いた回数に対応する発生頻度値に依存する数が割り当てられる。生成されたグラフは、表示される。 A method for process modeling includes collecting data associated with executed process steps from one or more activity log files. The collected data is parsed to determine a set of performed process steps. An occurrence frequency value is determined that represents the number of times each performed process step of the collected data lasted after each other performed process step. By representing each performed process step as a node in the graph and representing each transition between process steps as an edge on the graph, a graph representing a model of the executed process is generated. For any given node pair in the graph, for the edge connecting the node pair, the process step represented by the second node of the pair after the process step represented by the first node of the pair Is assigned a number that depends on the occurrence frequency value corresponding to the number of times that has continued. The generated graph is displayed.
プロセスのモデル化のためのコンピュータ・プログラム製品は、コンピュータ可読プログラム・コードが組み入れられたコンピュータ可読ストレージ媒体を含む。コンピュータ可読プログラム・コードは、1つ又は複数のアクティビティ・ログ・ファイルから、実行されたプロセス・ステップに付随するデータを収集するように構成されたコンピュータ可読プログラム・コードと、収集されたデータを構文解析して、実施済みプロセス・ステップのセットを判定するように構成されたコンピュータ可読プログラム・コードと、収集されたデータの各々の実施済みプロセス・ステップが他の各々の実施済みプロセス・ステップの後に続いた回数を表す発生頻度値を判定するように構成されたコンピュータ可読プログラム・コードと、実行されたプロセスのモデルを表すグラフを、各々の実施済みプロセス・ステップをグラフのノードとして表し、且つ、プロセス・ステップ間の各々の移行をグラフ上のエッジとして表すことにより生成するように構成されたコンピュータ可読プログラム・コードであって、グラフの所与のノード対のいずれについても、ノード対を接続するエッジに対して、対の第1のノードによって表されるプロセス・ステップの後に対の第2のノードによって表されるプロセス・ステップが続いた回数に対応する発生頻度値に依存する数が割り当てられる、コンピュータ可読プログラム・コードと、生成されたグラフを表示するように構成されたコンピュータ可読プログラム・コードと、を含む。 A computer program product for process modeling includes a computer readable storage medium incorporating computer readable program code. Computer readable program code is configured to collect data associated with an executed process step from one or more activity log files and the collected data Computer readable program code configured to analyze and determine a set of performed process steps, and each performed process step of the collected data is after each other performed process step Computer readable program code configured to determine an occurrence frequency value representing a subsequent number of times, a graph representing a model of the executed process, each implemented process step as a node of the graph, and Each transition between process steps is shown on the graph. Computer readable program code configured to be generated by representing as, for any given pair of nodes in the graph, represented by a first node of the pair relative to an edge connecting the pair of nodes Computer readable program code, and a generated graph, assigned a number that depends on an occurrence frequency value corresponding to the number of times the process step represented by the second node of the pair followed by the processed process step Computer readable program code configured to be displayed.
本開示及びそれに付随する態様のうちの多くのもののより完全な認識は、添付の図面との関連において考察した場合に以下の詳細な説明を参照することによってそれらがより良く理解されるようになったときに、容易に得られることになるであろう。 A more complete appreciation of the present disclosure and many of the attendant aspects will become better understood by reference to the following detailed description when considered in conjunction with the accompanying drawings. Will be easily obtained.
図面において例証される本開示の例示的な実施形態を説明するに当たり、分かりやすくするために特定の用語が用いられる。しかしながら、本開示はそのように選択された特定の用語に限定されることを意図するものではなく、各々の特定の要素は、同様の方式で動作する全ての技術的等価物を含むものと理解すべきである。 In describing example embodiments of the present disclosure that are illustrated in the drawings, specific terminology is used for the sake of clarity. However, this disclosure is not intended to be limited to the specific terms so selected, and it is understood that each specific element includes all technical equivalents that operate in a similar manner. Should.
実際には、現実のビジネス・プロセスは、規定された及び/又は正式化された手続きから逸脱したやり方で実行されることがある。この逸脱は、手続きが正式化された時点では予測されなかった障害又は能率の悪さ、時間経過に伴うプロセスの進化、及び/又は従業員が遵守しないことにより生じ得る。したがって、現実のプロセス実施を正確に測定することは、作業フローの改善のための有用な努力であり得る。 In practice, real business processes may be performed in ways that deviate from prescribed and / or formalized procedures. This divergence can be caused by a failure or inefficiency that was not anticipated when the procedure was formalized, process evolution over time, and / or employee non-compliance. Thus, accurately measuring actual process performance can be a useful effort to improve workflow.
本発明の例示的な実施形態は、現実のビジネス・プロセス実行をモデル化するための自動化された手法を提供することを目指すものであり得る。現実のビジネス・プロセス実行を正確にモデル化することにより、組織体は、合意のレベルを確認するため、及び、逸脱点を割り出すために、現実のプロセスを正式化されたプロセス及びその他の指令と比較することが可能になり得るので、正式化されたプロセスの遵守を達成するため、及び将来のポリシーに影響を与えるための改善アクションをとることができる。 Exemplary embodiments of the present invention may aim to provide an automated approach for modeling real business process execution. By accurately modeling real business process execution, an organization can identify real processes with formalized processes and other directives to confirm the level of agreement and to identify deviations. Since comparisons can be possible, remedial actions can be taken to achieve compliance with formalized processes and to influence future policies.
本発明の例示的な実施形態は、現実のビジネス・プロセス実行をグラフによって表現することを可能にし、このグラフにおいて、グラフの各ノードはビジネス・プロセスにおけるステップを表し、一連のエッジは種々のノードを接続して、観測された1つのノードから次のノードへの移行を表す。各エッジの太さは、第1のステップの実行が第2のステップの実行を先導する観測された傾向に比例させることができる。したがって、単一のグラフで、あるビジネス・プロセスが幾つかのプロセス実行にわたって現実に実施される様子を示すことが可能であり得る。 Exemplary embodiments of the present invention allow real business process execution to be represented by a graph, where each node of the graph represents a step in the business process, and a series of edges represent various nodes. To represent the observed transition from one node to the next. The thickness of each edge can be proportional to the observed tendency that execution of the first step leads to execution of the second step. Thus, a single graph may be able to show how a business process is actually implemented over several process runs.
グラフ生成は完全に自動化することができるので、ビジネス・プロセスの現実の実施を、組織リソースを著しく消費することなく、直裁的且つ直観的な方式で表すことができる。グラフ生成は、詳細なアクティビティ・ログの保存に資する種々のコンピュータ化プラットフォーム内でプロセス・ステップが完了したときに通常のビジネス過程において生成される1つ又は複数のアクティビティ・ログ・ファイルを収集することにより、実施することができる。収集されたアクティビティ・ログを自動的に構文解析して、プロセス・ステップを識別し、1つのプロセス・ステップから次のプロセス・ステップへの作業フローの性質を確認することができる。グラフの生成に用いることができるのは、この情報である。 Because graph generation can be fully automated, the actual implementation of business processes can be represented in an intuitive and intuitive manner without significantly consuming organizational resources. Graph generation collects one or more activity log files that are generated during a normal business process when process steps are completed within various computerized platforms that help preserve detailed activity logs Can be implemented. The collected activity log can be automatically parsed to identify process steps and confirm the nature of the work flow from one process step to the next. It is this information that can be used to generate the graph.
グラフは、定期的に更新することも、又はリアルタイムに更新することもできる。次いで、グラフを正式化されたビジネス・プロセスと比較して出発点(point of departure)を識別することができる。グラフを以前のグラフと比較して、変化を判定することもできる。グラフを他の下部組織又は他の組織体由来の同様のグラフと比較して、異なる実体が同様のタスクをどのように処理しているのか示す指標を提供することもできる。このようにして生成されるグラフのためのその他の重要な用途を見出すことができるので、本発明はこのようにして生成されるグラフのための特定の用途に限定されるものではない。実施される分析の性質に関わりなく、これらのグラフの自動的な生成及び提示を既存のBPMシステムと共に又はそれ自体で用いて、組織体のオペレーションを能率化し、品質を保証することができる。 The graph can be updated regularly or in real time. The graph can then be compared with a formalized business process to identify a point of departure. The graph can also be compared to previous graphs to determine changes. The graph can also be compared to similar graphs from other sub-organizations or other tissues to provide an indication of how different entities are processing similar tasks. The present invention is not limited to a particular application for the graph generated in this way, since other important applications for the graph generated in this way can be found. Regardless of the nature of the analysis performed, the automatic generation and presentation of these graphs can be used in conjunction with the existing BPM system or on its own to streamline the operation of the organization and ensure quality.
本明細書において説明されるように生成されるビジネス・プロセス・グラフの一例は、図4に提示され、これは後でさらに詳細に説明する。 An example of a business process graph generated as described herein is presented in FIG. 4, which will be described in more detail later.
図1は、本発明の例示的な実施形態による、上記の、観測されたビジネス・プロセス・グラフの生成を示すフローチャートである。最初に、アクティビティ・ログ・ファイルを収集及び構文解析することができる(ステップS11)。アクティビティ・ログ・ファイルを収集することは、評価対象の所与のビジネス・プロセスの実行に関与する1つ又は複数のコンピュータ化されたシステムから、格納されたアクティビティ・ログ・ファイルを検索することを含むことができる。アクティビティ・ログが多数のソースから収集される場合、相互参照を実施してビジネス・プロセス・ステップを組み合わせることで、たとえ種々のステップが複数のアクティビティ・ログ・ファイルにわたって記録されていた場合であっても、個々のビジネス・プロセス実行をビジネス・ステップからビジネス・ステップへとトレースすることができる。1つ又は複数のアクティビティ・ログを構文解析することは、実施済みの現実のビジネス・プロセス・ステップを識別すること、及び、ビジネス・プロセス・ステップが実行された順序を判定することを含むことができる。 FIG. 1 is a flowchart illustrating the generation of the observed business process graph described above, according to an illustrative embodiment of the invention. Initially, the activity log file can be collected and parsed (step S11). Collecting activity log files involves retrieving stored activity log files from one or more computerized systems involved in the execution of the given business process being evaluated. Can be included. If activity logs are collected from a number of sources, cross-referencing and combining business process steps, even if the various steps were recorded across multiple activity log files Also, individual business process executions can be traced from business step to business step. Parsing one or more activity logs may include identifying the actual business process steps that have been performed and determining the order in which the business process steps were performed. it can.
本発明の例示的な実施形態は、複数のソースにわたるアクティビティ・ログを組み合わせるための公知のビジネス・プロブナンス・ベース(business provenance based)のシステムを利用して、エンド・ツー・エンド型ビジネス・プロセスの単一インスタンスの実行に関連したイベントの首尾一貫したリストを収容する、単一の実行ログを生成することができる。ビジネス・プロブナンスは、ビジネスの機能的、組織的、日時的、及びリソース的側面を発見するために、ビジネス・アーチファクト(artifacts)のリネージ(系統)を捕捉し、管理するプロセスであると理解される。したがって、ビジネス・プロブナンスを、本発明の例示的な実施形態に従い、アクティビティ・ログの収集及び構文解析を行ってプロセス・ステップが実施された順序を判定するために用いることができ、それゆえ、ビジネス・プロセス実行中に正に起こったとおりのことを、アクティビティ・ログから得られるデータのような操作データを収集し、相関させ、分析することによって自動的に発見するために用いることができる。 An exemplary embodiment of the present invention utilizes a well-known business provenance based system for combining activity logs across multiple sources to provide an end-to-end business process. A single execution log can be generated that contains a consistent list of events associated with the execution of a single instance. Business Provenance is understood as the process of capturing and managing the lineage of business artifacts to discover the functional, organizational, date-time, and resource aspects of the business . Thus, business probabilities can be used to collect activity logs and parse to determine the order in which process steps were performed in accordance with an exemplary embodiment of the present invention, and thus business It can be used to automatically discover what exactly happened during process execution by collecting, correlating and analyzing operational data such as data obtained from activity logs.
本発明の例示的な実施形態に関連して用いることができるビジネス・プロブナンス・ベースのシステムの例は、例えば、各々がその全体が本明細書に組み入れられる、米国特許出願番号第12/265,975号、第12/265,986号、第12/265,993号、及び第12/266,052号において見出すことができる。 Examples of business provenance-based systems that can be used in connection with exemplary embodiments of the invention include, for example, US patent application Ser. No. 12/265, each incorporated herein in its entirety. 975, 12 / 265,986, 12 / 265,993, and 12 / 266,052.
アクティビティ・ログ・ファイルが収集され構文解析された後、最初のビジネス・プロセス実行をグラフ化することができる(ステップS12)。最初のビジネス・プロセス実行は、所定のビジネス・プロセスの1回の実行中に実施された一連のプロセス・ステップの単一のトレースを表すことができる。ビジネス・プロセスをグラフ化することは、アクティビティ・ログから識別された各プロセス・ステップについてノードを定めること、及び、各ノード間に、最初のビジネス・プロセス実行中にプロセス・ステップが実施された順序を表すエッジを形成することを含むことができる。例えば、最初のビジネス・プロセス実行が3つのステップ「A」、「B」及び「C」を含み、ステップ「A」が第1に実施され、ステップ「C」が第2に実施され、ステップ「B」が最後に実施される場合、この最初の実行のグラフ化は、3つのノード「A」、「B」及び「C」を含み、第1のエッジが「A」と「C」とを接続し、第2のエッジが「C」と「B」とを接続するものとすることができる。各エッジは、方向と太さの両方を示すベクトルとして表現することができる。よって、「A」を「C」に接続するエッジは、「C」を「A」に接続するエッジと区別されることになる。エッジの太さは、そのエッジにより表現される移行が起こる頻度を表す。例えば、太いエッジは通例生じる移行を表すことができ、一方、細いエッジはまれに生じる移行を表すことができる。 After the activity log file is collected and parsed, the initial business process execution can be graphed (step S12). An initial business process execution may represent a single trace of a series of process steps performed during a single execution of a given business process. Graphing a business process defines a node for each process step identified from the activity log, and the order in which the process steps were performed between each node during the initial business process execution Forming an edge representing. For example, the first business process execution includes three steps “A”, “B”, and “C”, step “A” is performed first, step “C” is performed second, and step “ If “B” is implemented last, this first run graph contains three nodes “A”, “B” and “C”, with the first edge representing “A” and “C”. The second edge may connect “C” and “B”. Each edge can be expressed as a vector indicating both direction and thickness. Therefore, the edge connecting “A” to “C” is distinguished from the edge connecting “C” to “A”. The thickness of an edge represents the frequency at which the transition represented by that edge occurs. For example, a thick edge can represent a transition that typically occurs, while a thin edge can represent a transition that occurs infrequently.
最初のビジネス・プロセス実行がグラフ化された後で、追加的なビジネス・プロセス実行により、グラフを更新することができる(ステップS13)。追加的なビジネス・プロセス実行は、ステップS12においてグラフ化された最初のビジネス・プロセスと同様のビジネス・プロセスのその後の実施を表すことができる。その後の実施は、同一又は異なる個人、及び/又は自動化システムにより実行されたものであり得る。その後の実施に付随するデータは、最初の実行と同じアクティビティ・ログ、異なるアクティビティ・ログ、又は更新されたアクティビティ・ログから構文解析することができる。例えば、グラフが更新されている間も、ログは新しい実行により更新され続けることがある。この点で、グラフ化は、ビジネス・プロセスの実行と同時に実施することができる。 After the first business process execution is graphed, the graph can be updated by additional business process execution (step S13). The additional business process execution may represent a subsequent implementation of a business process similar to the first business process graphed in step S12. Subsequent implementations may have been performed by the same or different individuals and / or automated systems. Data associated with subsequent implementations can be parsed from the same activity log as the first run, a different activity log, or an updated activity log. For example, the log may continue to be updated with new runs while the graph is being updated. In this regard, the graphing can be performed simultaneously with the execution of the business process.
例えば、ビジネス・プロセスが大規模な組織体内で実行される場合には、所与のビジネス・プロセスは、一日に何百何千回と実行されることがある。特定のビジネス・プロセスの各々の実行に付随するアクティビティ・ログを用いてグラフをリアルタイムで更新し、その結果、利用可能な最も完全なデータ・セットをグラフが表すようにすることができる。しかしながら、本発明の例示的な実施形態は、グラフを生成及び更新するために全ての利用可能なデータを使用することに限定されるものではなく、グラフの生成及び更新の目的で、利用可能なデータのサブセットを無作為に又は他の手段で選択することもまた可能である。例えば、完全なデータ・セットが特に膨大であるような場合には、そのような戦略が望ましいものであり得る。 For example, if a business process is executed within a large organization, a given business process may be executed hundreds or thousands of times a day. The activity log associated with each execution of a particular business process can be used to update the graph in real time so that the graph represents the most complete data set available. However, exemplary embodiments of the present invention are not limited to using all available data to generate and update graphs, but can be used for graph generation and update purposes. It is also possible to select a subset of the data randomly or by other means. For example, such a strategy may be desirable when the complete data set is particularly large.
追加的な実行をグラフ化する際に、新たなステップが実施されたところに新たなノードを追加することができる。また、1つのステップから別のステップへの移行が生じる頻度の変化を反映するように、エッジの太さを更新することができる。例えば、1つのステップから別のステップへの移行が生じるたびに、これらのステップを接続するエッジの太さを1尺度ずつ太くすることができる。代替的に、エッジの太さを更新するためのより洗練された技術を、例えば以下で詳述するように実施することができる。 When graphing additional executions, new nodes can be added where new steps are performed. In addition, the thickness of the edge can be updated to reflect the change in frequency at which the transition from one step to another step occurs. For example, each time a transition from one step to another occurs, the thickness of the edge connecting these steps can be increased by one scale. Alternatively, a more sophisticated technique for updating the edge thickness can be implemented, for example, as detailed below.
追加的なデータによりグラフを更新するステップ(ステップS13)は、繰り返し行うことができる。繰り返しは、設定した繰り返し回数だけ続けることも、全てのアクティビティ・ログ・データがグラフに反映されるまで続けることも、又は、新たなアクティビティ・ログ・データが収集されたときにグラフを更新しながら無期限に続けることもできる。 The step of updating the graph with additional data (step S13) can be repeated. The iteration can continue for the set number of iterations, continue until all activity log data is reflected in the graph, or while updating the graph as new activity log data is collected It can continue indefinitely.
収集されたアクティビティ・ログ・データに基づくグラフの更新が終了すると、グラフを提示することができる(ステップS14)。グラフの提示は、1人又は複数のユーザに対してグラフを実際に表示すること、将来の参照のためにグラフを格納すること、又はグラフを他の何らかの仕方で利用することを含むものとすることができる。提示は、グラフの更新が完了した後で実施するのではなく、又は完了した後で実施することに加えて、ステップS13においてグラフが更新されているときに連続的に実施することができる。このようにして、グラフが変更されたときにグラフを提示することができるので、ユーザは任意の所与の時点でグラフの現在の状態を観察することができる。 When the graph update based on the collected activity log data is completed, the graph can be presented (step S14). Presentation of a graph may include actually displaying the graph to one or more users, storing the graph for future reference, or utilizing the graph in some other way. it can. Presentation can be performed continuously when the graph is being updated in step S13, rather than being performed after the graph update is completed, or in addition to being performed after the graph is completed. In this way, the graph can be presented when the graph is changed so that the user can observe the current state of the graph at any given time.
提示されたグラフをチェックして、警告が妥当であるかどうか判定することができる(ステップS15)。警告は、特定の閾値を超過した場合に妥当とすることができる。閾値は、ユーザにより選択された基準又は他の所定の基準に従って定めることができる。閾値は、例えば、特定のノード数、特定のエッジ太さ、又は正式化されたプロセスからの逸脱の過剰度とすることができる。閾値を超過したと判定された場合には(ステップS15の「はい」)、警告を発生させることができる(ステップS16)。警告は、1つ又は複数の所定の電子メールアドレスに電子メールを自動送信すること、又は他の何らかの通知形式を含むことができる。 The presented graph can be checked to determine if the warning is valid (step S15). A warning can be reasonable if a certain threshold is exceeded. The threshold can be defined according to criteria selected by the user or other predetermined criteria. The threshold can be, for example, a specific number of nodes, a specific edge thickness, or an excess of deviation from a formalized process. If it is determined that the threshold has been exceeded (“Yes” in step S15), a warning can be generated (step S16). The alert can include automatically sending an email to one or more predetermined email addresses, or some other form of notification.
本発明の例示的な実施形態による随意的な特徴は、生成されたグラフから正式プロセス・モデルを抽出することである。グラフは現実に実施されたプロセスを表すことができるので、プロセスを正式化することを要望する組織体は、正式プロセスを確立するための基礎として、生成されたグラフを利用することができる。 An optional feature according to an exemplary embodiment of the present invention is to extract a formal process model from the generated graph. Since a graph can represent a process that has actually been implemented, an organization that wants to formalize the process can use the generated graph as a basis for establishing a formal process.
このような場合には、正式プロセスは、例えば、アクティビティ・ログ・ファイルからグラフが生成される、及び/又は、アクティビティ・ログ・ファイルを用いてグラフが更新される所定の長さの時間の後に、生成されたグラフから抽出することができる。代替的に、抽出は、所定のトリガ・イベントが発生したとき、例えば、その後のモデル更新がグラフの外観にもはや著しい変化をもたらさなくなったとき、又は、グラフにおける特定の特性が変化したときに行われることもある。例えば、直近のビジネス・プロセス・モデル・グラフと初期グラフとの間の距離が所定の数値範囲より大きい場合に、正式モデルの抽出をトリガすることができる。ここで、数値範囲は、以下で詳述されるようなスナップショット値の計算のための手法に従って計算することができる。 In such a case, the formal process may occur after a predetermined length of time, for example, when the graph is generated from the activity log file and / or the graph is updated using the activity log file. Can be extracted from the generated graph. Alternatively, extraction is performed when a predetermined trigger event occurs, for example, when subsequent model updates no longer cause a significant change in the appearance of the graph, or when certain characteristics in the graph change. Sometimes it is. For example, formal model extraction may be triggered when the distance between the most recent business process model graph and the initial graph is greater than a predetermined numerical range. Here, the numerical range can be calculated according to a technique for calculating a snapshot value as detailed below.
グラフを他のグラフ、または異なる時点における同じグラフと比較する目的で、特定の時点におけるグラフの状態が格納されることが望まれる場合には、グラフの現在の状態の「スナップショット」を取得することができる(ステップS17)。スナップショットは、特定の瞬間に存在していたとおりのグラフのコピーを含むことができ、これはノードとエッジの両方を含むことになる。スナップショットは、グラフの生成に用いられたアクティビティ・ログ・データが取得された日付、グラフが警告閾値を超えたかどうかを示すブール値、同様の又は同一のグラフに遭遇した回数を示すカウンタ、又はその他の関連データなどのようなメタデータを含むこともできる。 Takes a “snapshot” of the current state of a graph if it is desired to store the state of the graph at a particular point in time for the purpose of comparing the graph to another graph or the same graph at a different point in time (Step S17). A snapshot can include a copy of the graph as it existed at a particular moment, which would include both nodes and edges. The snapshot is the date when the activity log data used to generate the graph was acquired, a Boolean value indicating whether the graph exceeded the warning threshold, a counter indicating the number of times similar or identical graphs were encountered, or Metadata such as other related data can also be included.
スナップショットは、他のグラフに比べたそのグラフの特徴を何らかの方法で説明する特定のスナップショット値に換算することができる。特定のスナップショットについての値を特徴付けるための多数の手法が存在し得る。そのような手法の単純化された例は、ノード及びエッジの総数を数えることである。もっと洗練されたメトリック(metric)を用いて、プロセス・モデル・グラフを数値によって表すこともできる。次にこれらの値を用いて、2つのプロセス・モデル・グラフの間の差異の尺度を、値間の「距離」について計算することができる。2つのプロセス・モデルMとM’との間のこの距離は、MをM’に変換するのに必要とされる高次の変更操作(例えば、アクティビティの挿入、削除、又は移動)の最小数として定義することができる。2つのプロセス・モデル間の距離を求めることは、非決定性多項式時間困難問題として表すことができる。この問題に適用される発見的アルゴリズムは極めて複雑なものとなり得る。従って、本発明の例示的な実施形態は、各々のプロセス・モデル・グラフのスナップショットに数値を割り当てるための1つ又は複数のメトリックを定義することができる。本明細書において用いられるf(sk)は、各スナップショットskに値を割り当てるメトリック関数を表す。 A snapshot can be converted to a specific snapshot value that explains the characteristics of that graph relative to other graphs in some way. There can be many ways to characterize the value for a particular snapshot. A simplified example of such an approach is to count the total number of nodes and edges. A more sophisticated metric can be used to represent the process model graph numerically. These values can then be used to calculate a measure of the difference between the two process model graphs for the “distance” between the values. This distance between the two process models M and M ′ is the minimum number of higher order change operations (eg, activity insertion, deletion, or movement) required to convert M to M ′. Can be defined as Finding the distance between two process models can be expressed as a non-deterministic polynomial time difficulty problem. The heuristic algorithm applied to this problem can be quite complex. Accordingly, exemplary embodiments of the present invention may define one or more metrics for assigning a numerical value to each process model graph snapshot. As used herein, f (s k ) represents a metric function that assigns a value to each snapshot s k .
第1の手法によれば、

であり、ここで、Eは、プロセス・スナップショットskの依存図式(dependency graph)におけるエッジ数であり、Vは頂点(ノード)数である。
According to the first approach,
, And the where, E is a number of edges in the process snapshot s k dependent Scheme (dependency `graph), V is the number of vertices (nodes).
上述の手法は、プロセス・モデル・グラフ及び/又はスナップショットを、比較の目的で単純なスカラー値として表現することができる方法の一例を提供するが、他の妥当なメトリックを同様に使用することもでき、本発明は、上記の特定の手法に限定されるものと理解すべきではない。 While the above approach provides an example of how a process model graph and / or snapshot can be represented as a simple scalar value for comparison purposes, other reasonable metrics should be used as well. It should also be understood that the present invention is not limited to the specific approach described above.
単純なスカラーは、特定の時点におけるプロセス・モデル・グラフ(スナップショット)をカテゴリ分類するための便利な手法を代表するが、将来の参照及び/又は比較のために、スナップショット全体を適切なデータ構造を用いて格納することもできる。本発明の例示的な実施形態は、スナップショットを、例えば、B木データ構造又は数値トライ木データ構造のような樹状データ構造内に格納することができる(ステップS18)。トライ木データ構造は、探索を容易にすることができる特定の有意味な性質に従って分割された群及び下位群の木の中にデータが格納及び配列されるデータ構造である。トライ木データ構造は、根ノード(root node)と、その根の内の1つ又は複数のビン・ノード(bin node)と、各ビン・ノード内の一連のバケツ・ノード(bucket node)とを含む。各ビンは、全ての根データのサブセットを含み、そのデータ・サブセットが入る特定の範囲によって定義される。各バケツは、その親ビン範囲のサブセットを含み、バケツが含むデータの範囲によって定義される。全てのビンが等しいサイズの範囲を表す必要はなく、同様に、全てのバケツが等しいサイズの範囲を表す必要もない。従って、ビンの範囲又はバケツの範囲のサイズは、異なるビン又はバケツごとに異なっていてもよい。トライ木データ構造は、範囲の変更が所望されたときには再平衡化(rebalance)することもできる。 A simple scalar represents a convenient way to categorize a process model graph (snapshot) at a specific point in time, but for future reference and / or comparison, the entire snapshot is represented as appropriate data. It can also be stored using a structure. The exemplary embodiment of the present invention may store the snapshot in a tree-like data structure, such as a B-tree data structure or a numerical trie tree data structure (step S18). A trie tree data structure is a data structure in which data is stored and arranged in groups and subgroup trees divided according to certain meaningful properties that can facilitate searching. A trie tree data structure consists of a root node, one or more bin nodes within the root, and a series of bucket nodes within each bin node. Including. Each bin contains a subset of all root data and is defined by a specific range that contains the data subset. Each bucket contains a subset of its parent bin range and is defined by the range of data that the bucket contains. Not all bins need to represent an equal size range, and similarly, not every bucket needs to represent an equal size range. Thus, the bin range or bucket range size may be different for different bins or buckets. The trie tree data structure can also be rebalanced when a range change is desired.
それゆえ、数値トライ木データ構造は、ビン及びバケツが特定の数値範囲を表すデータ構造であり、これをここでは上述のスナップショット値とすることができる。ビンは、順序付きリストの形で格納することができる。これにより、所望のスナップショットをすばやく見つけるための、例えばスナップショット値による、二分探索の実施を可能にすることができる。ビン・ノード当たりのバケツ・ノードの数は、分岐比とも呼ばれ、全てのビンについて同じにすることができる。同様に、バケツ当たりのビンの最大数は、例えば、効率的な検索を可能にするために、何らかの比較的低い値に固定することができる。 Therefore, the numerical trie tree data structure is a data structure in which bins and buckets represent a specific numerical range, which can be the above-described snapshot value here. Bins can be stored in an ordered list. Thereby, it is possible to perform a binary search, for example, using a snapshot value in order to quickly find a desired snapshot. The number of bucket nodes per bin node, also called branch ratio, can be the same for all bins. Similarly, the maximum number of bins per bucket can be fixed at some relatively low value, for example, to allow efficient searching.
バケツの範囲は、親ビンの範囲のサブセットとすることができるので、これをサブ範囲と呼ぶことができる。ビン及びバケツの範囲及びサブ範囲は、それぞれ、その兄弟に関して重なり無しである。 Because the bucket range can be a subset of the parent bin range, it can be referred to as a sub-range. Each bin and bucket range and sub-range are non-overlapping with respect to their siblings.
本発明の例示的な実施形態による随意的な特徴は、生成されたグラフに1つ又は複数の規則を適用して、グラフの1つ又は複数のノード又はエッジについてビジネス上の意味(business semantics)を判定することを含むことができる(ステップS19)。次いで、正式ビジネス・プロセス・モデルを、例えば判定されたビジネス上の意味を用いて、グラフから抽出することができる。次いで、抽出された複数の正式ビジネス・プロセス・モデルをデータ構造内に格納することができる。使用されるデータ構造は、効率的な検索、及び、抽出された複数の正式ビジネス・プロセス・モデル間の変化に基づいて警告を発する能力を可能にするものとすることができる。 An optional feature according to an exemplary embodiment of the present invention is that business semantics are applied to one or more nodes or edges of the graph by applying one or more rules to the generated graph. Can be included (step S19). A formal business process model can then be extracted from the graph using, for example, the determined business meaning. The extracted formal business process models can then be stored in a data structure. The data structure used may allow for efficient searching and the ability to issue alerts based on changes between multiple formal business process models that have been extracted.
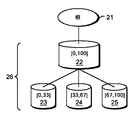
図2は、本発明の例示的な一実施形態によるビジネス・プロセス・グラフ・スナップショットを格納するために用いることができる数値トライ木データ構造の一例を示す。根21は、データ・セット全体を表す。根から、第1のビン22が存在し得る。1つより多くのビンが存在し得るが、図示した例においては1つのビン22が存在する。ビン22の範囲、ここでは[0,100]は、0乃至100のスカラー・スナップショット値を有するスナップショットがその中に格納されているという事実を表す。第1のレベル26は、ビン22と全ての子バケツ23、24、及び25として定義することができる。第1の子バケツ23は、範囲[0,33]を有するものとすることができ、それゆえ0乃至33のスカラー・スナップショット値を有するスナップショットを収容することができる。第2の子バケツ24は、範囲(33,67]を有するものとすることができ、それゆえ34乃至67のスカラー・スナップショット値を有するスナップショットを収容することができる。第3の子バケツ25は、範囲(67,100]を有するものとすることができ、それゆえ68乃至100のスカラー・スナップショット値を有するスナップショットを収容することができる。3つ全ての子バケツ間で、完全なビン範囲[0,100]が表される。
FIG. 2 illustrates an example of a numerical trie tree data structure that can be used to store business process graph snapshots according to an illustrative embodiment of the invention.
数値トライ木データ構造は、利用可能なビンの現時点の範囲を超えるスナップショット値を有するビジネス・プロセス・グラフ・スナップショットの追加に対応する十分な融通性を有することができる。例えば、新たなデータが、例えば158のスナップショット値を有するビジネス・プロセス・グラフ・スナップショットに関して提示された場合、この数値トライ木データ構造に、例えば(100,200]の範囲を表す追加的なビンを追加することができる。このビン内に、例えば、必要に応じて、新たなデータを収容するために新たなバケツを追加することができる。 The numeric trie tree data structure can have sufficient flexibility to accommodate the addition of business process graph snapshots with snapshot values that exceed the current range of available bins. For example, if new data is presented for a business process graph snapshot with a snapshot value of, eg, 158, this numerical trie tree data structure may contain additional values representing, for example, a range of (100, 200). A bin can be added, for example a new bucket can be added in this bin to accommodate new data as needed.
数値トライ木データ構造はまた、再平衡化するのに十分な融通性を有することができる。再平衡化とは、ビン及びバケツの範囲の変更と、それに伴う1つのカテゴリから別のカテゴリへのデータの再配置である。再平衡化は、例えば、いずれかの1つのカテゴリに多数の値が追加された場合に所望されることがある。データ構造の再平衡化により、探索の効率性を保つことができ、且つ、ビンのオーバーフローを回避することができる。 The numerical trie tree data structure can also have sufficient flexibility to rebalance. Rebalancing is the changing of bin and bucket ranges and the accompanying relocation of data from one category to another. Rebalancing may be desired, for example, when multiple values are added to any one category. By rebalancing the data structure, search efficiency can be maintained and bin overflow can be avoided.
本発明の例示的な実施形態による数値トライ木データ構造の再平衡化の手法は、追加的なビンを追加すること、及び、ビン範囲のサイズを小さくすることを含むことができる。これは、木を浅く保ち、木の幅を追加する効果を有する。代替的に、分岐比を高めることで追加的な組織レベルを導くことができる。第1の選択肢は、根からビンに到達するのに必要とされる時間を短縮することにより、二分探索技術を用いた迅速で計算コストが安い探索を促進することができる。同様に、第2の選択肢も、バケツ間にわたる探索を速くすることができるので、計算コストが安いものとなり得る。再平衡化のプロセス自体が、計算コストが高いものであり得るので、本発明の例示的な実施形態は、ビンがバケツではなく子ビンを有することを可能にすることにより第2のレベルを作成することで、再平衡化に関連した計算コストを削減することができる。 Techniques for rebalancing a numerical trie tree data structure according to an exemplary embodiment of the present invention can include adding additional bins and reducing the size of the bin range. This has the effect of keeping the tree shallow and adding the width of the tree. Alternatively, increasing the branching ratio can lead to additional organizational levels. The first option can facilitate a quick and low-cost search using a binary search technique by reducing the time required to reach the bin from the root. Similarly, the second option can also speed up the search across buckets, and thus can be computationally cheap. Since the rebalancing process itself can be computationally expensive, exemplary embodiments of the invention create a second level by allowing bins to have child bins rather than buckets. By doing so, it is possible to reduce the calculation cost related to rebalancing.
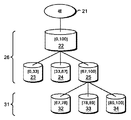
図3は、本発明の例示的な実施形態による、多重レベルを有する数値トライ木データ構造の一例を示す。ここでは、第1のレベル26のバケツ25は、第2のレベル31に関してはビンとなり得、そのビン内には複数のバケツ32、33、及び34が存在することができる。追加的なレベルを可能にすることにより、数値トライ木を再平衡化させる必要性を減らすことができ、計算費用を回避することができる。
FIG. 3 illustrates an example of a numerical trie tree data structure with multiple levels, according to an illustrative embodiment of the invention. Here, the
さらに、ビン・ノードがバケツではなく子ビンを有することを許容することで、初期のビン幅(図3の例では100として示される)及び分岐比(図3の例では3として示される)、並びにバケツのサイズを保持しつつ、任意の数のレベルを作成することができる。それで、本発明の例示的な実施形態は、任意のトライ木深さに対応するような方式での数値トライ木データ構造内の探索を可能にすることができる。例えば、あるビンの所与の子がバケツ又はビンのどちらであるかを判定することができる。子がバケツである場合には、バケツを通じた線形探索を実施することができ、子がビンである場合には、再帰下降を実施することができる。 In addition, by allowing bin nodes to have child bins rather than buckets, the initial bin width (shown as 100 in the example of FIG. 3) and branching ratio (shown as 3 in the example of FIG. 3), In addition, any number of levels can be created while maintaining the bucket size. Thus, exemplary embodiments of the present invention can allow searching within a numerical trie tree data structure in a manner that accommodates any trie tree depth. For example, it can be determined whether a given child of a bin is a bucket or a bin. If the child is a bucket, a linear search through the bucket can be performed, and if the child is a bin, a recursive descent can be performed.
プロセス・スナップショットの格納及び効率的な検索を可能にすることに加えて、数値トライ木データ構造は、警告の発生を容易にすることもできる。警告は、(1)任意の所与のバケツ内のスナップショットの数のような要因に基づいて発生させることができる。いずれかの単一のバケツ内のスナップショットの数が特定の閾値を超えた場合、例えば数値トライ木の再平衡化に先立ち、警告を発生させることができる。追加的に、警告は、(2)スナップショットの位置に基づいて発生させることができる。例えば、特定のバケツが1つ又は複数のスナップショットを有する場合、これらのスナップショットが特定の範囲(例えば、バケツ範囲)内の数値を有するというメッセージを伝える警告を発することができる。 In addition to enabling storage and efficient retrieval of process snapshots, the numerical trie tree data structure can also facilitate the generation of warnings. Alerts can be generated based on factors such as (1) the number of snapshots in any given bucket. If the number of snapshots in any single bucket exceeds a certain threshold, a warning can be generated, for example, prior to rebalancing the numerical trie tree. Additionally, a warning can be generated based on (2) the location of the snapshot. For example, if a particular bucket has one or more snapshots, a warning can be issued that conveys a message that these snapshots have a numeric value within a particular range (eg, bucket range).
警告を発生させるスナップショットの依存図式、移行ベクトル及びその他の格納されたメタデータを分析して、警告をトリガする状況の性質に関する洞察を得ることができる。警告は、銀行及び保険会社のような組織体が自身のビジネス・プロセスをチェック及び検証するための予防手段として用いることができる。警告は、プロセスが特定の手続き又はガイドラインを遵守していないときに発生させることもできる。例えば、組織体は、各プロセス・スナップショットにメトリック値を割り当てて、そのプロセスがガイドラインを遵守していないことを示すスナップショットのメトリック値の範囲のリストを確立することができる。この場合、組織体は、数値トライ木内のこれらの範囲に対応するビンにマークを付けて、それらの中に所与の数を超えたスナップショットが格納されたときに警告を発生させることができる。さらに、組織体は、次にこれらのビン内のスナップショットを分析して、そのプロセスがいつ、どのくらいの頻度で、どのような状況下で遵守に違反するのかということについて、より良い理解を得ることができる。 The snapshot dependency diagram, transition vector, and other stored metadata that generate the alert can be analyzed to gain insight into the nature of the situation that triggers the alert. Alerts can be used as a safeguard for organizations such as banks and insurance companies to check and verify their business processes. An alert can also be generated when a process does not comply with a particular procedure or guideline. For example, the organization may assign a metric value to each process snapshot to establish a list of snapshot metric value ranges that indicate that the process does not comply with the guidelines. In this case, the organization can mark the bins corresponding to these ranges in the numeric trie tree and raise a warning when more than a given number of snapshots are stored in them. . In addition, the organization then analyzes the snapshots in these bins to gain a better understanding of when, how often, and under what circumstances the process violates compliance be able to.
数値トライ木における劇的なストレージ過負荷を防止するために、ユーザは、スナップショットのサブセットを格納し、したがって残りのスナップショットの格納を拒否するように決めることができる。ユーザはこれを、例えば、あるスナップショットを格納すべきか否かを判定する基準を指定することにより達成することができる。本発明はいずれかの特定の基準に限定されるものではないが、本発明の例示的な実施形態は、スナップショットを格納するための基準としてトポロジー変化の尺度を用いることができる。例えば、ユーザは、メトリックを初期化して、2つの連続したスナップショット間の注目に値するトポロジー変化を検出することができ、そして次に、スナップショットの格納をメトリックに依存したものとすることができる。トポロジー変化Tは、例えば、グラフのノード及びエッジの関数によって定義することができる。そのような関数の例は、以下のように表すことができる。
ここで、e(st)はスナップショットst内のエッジの総数を表し、v(st)はスナップショットst内の頂点の総数を表し、k1及びk2は、例えばユーザにより設定することができる、定数である。st−1とstとの間のトポロジー変化が予め指定された閾値より大きい場合に、スナップショットstを格納することができる。
In order to prevent dramatic storage overload in the numerical trie tree, the user can decide to store a subset of the snapshots and therefore refuse to store the remaining snapshots. The user can achieve this, for example, by specifying criteria for determining whether a snapshot should be stored. Although the present invention is not limited to any particular criteria, exemplary embodiments of the present invention may use a measure of topology change as a criteria for storing snapshots. For example, a user can initialize a metric to detect a noticeable topology change between two consecutive snapshots, and then make the storage of the snapshot metric dependent . The topology change T can be defined by a function of a node and an edge of the graph, for example. An example of such a function can be expressed as:
Here, e (s t ) represents the total number of edges in the snapshot s t , v (s t ) represents the total number of vertices in the snapshot s t , and k 1 and k 2 are set by the user, for example. A constant that can be. A snapshot s t can be stored if the topology change between s t-1 and s t is greater than a pre-specified threshold.
数値トライ木データ構造におけるスナップショットの格納を実装するために、以下のプロセスを用いることができる。最初に、指定された時間間隔でプロセス・スナップショットをとることができる。プロセス・スナップショットは、例えば上述するように、頂点と、エッジと、頂点ごとの移行確率ベクトルとを有する依存図式から成るものとすることができる。次に、所定のメトリックを用いて、スナップショットについての数値を計算することができる。次いで、現在のスナップショットが直前に格納されたスナップショットに比べて所定の閾値基準を十分に満たすほど大きいトポロジー変化を表しているか否かを、チェックすることができる。トポロジー変化が十分に大きいと判定された場合には、スナップショットを、例えば妥当なメタデータと共に、その数値に従い数値トライ木データ構造内に格納することができる。次いで、この新たに追加されたデータが、警告を発生させるための所定の基準を満たすか否かを判定することができ、この基準が満たされた場合には、適切な警告を発生させることができる。このプロセスはその後、次回の指定された時間間隔において繰り返すことができる。 The following process can be used to implement snapshot storage in a numerical trie tree data structure. Initially, process snapshots can be taken at specified time intervals. A process snapshot may consist of a dependency diagram having vertices, edges, and transition probability vectors for each vertex, as described above, for example. A numerical value for the snapshot can then be calculated using a predetermined metric. It can then be checked whether the current snapshot represents a topology change that is large enough to meet a predetermined threshold criterion compared to the last stored snapshot. If it is determined that the topology change is sufficiently large, the snapshot can be stored in a numeric trie tree data structure according to its numeric value, for example, with valid metadata. It can then be determined whether this newly added data meets a predetermined criterion for generating a warning, and if this criterion is met, an appropriate warning can be generated. it can. This process can then be repeated at the next specified time interval.
図4は、本発明の例示的な実施形態により生成されるビジネス・プロセス・グラフの一例であり、図5は、図4のグラフのエッジ太さにより表される移行比を示す表である。上述のように、本発明の例示的な実施形態は、現実のビジネス・プロセス実行がビジネス・プロセス・ステップからビジネス・プロセス・ステップへと移行する、観測された頻度を表すグラフを生成することができ、ここで、グラフの各ノードは、ビジネス・プロセスにおけるステップを表し、種々のノードを接続する各エッジは、起点ノードから宛先ノードへの観測された移行率を表す。この移行率は、宛先ノードによって表されるビジネス・プロセス・ステップが、起点ノードによって表されるビジネス・プロセス・ステップの後に続く頻度を表すことができる。移行率は、そのような移行が生じた累積回数として表現することもでき、又は、所与の移行が生じた回数を、所与のノードを起点とする移行の総数で割った比として表現することもできる。 FIG. 4 is an example of a business process graph generated by an exemplary embodiment of the present invention, and FIG. 5 is a table showing the transition ratio represented by the edge thickness of the graph of FIG. As described above, exemplary embodiments of the present invention are capable of generating a graph that represents the observed frequency of actual business process execution transitioning from business process step to business process step. Where each node in the graph represents a step in the business process, and each edge connecting the various nodes represents the observed transition rate from the origin node to the destination node. This migration rate can represent the frequency that the business process step represented by the destination node follows the business process step represented by the origin node. The transition rate can be expressed as the cumulative number of times such a transition has occurred, or it can be expressed as the ratio of the number of times a given transition has occurred divided by the total number of transitions originating at a given node. You can also.
移行率は、「移行確率」として概念化することができるが、それは、この値が、起点ノードによって表されるビジネス・プロセス・ステップが実施された後に宛先ノードによって表されるビジネス・プロセス・ステップが続くことになる、推論される確率を表すことができるからである。しかし、移行確率は、そのような移行が将来生じる見込み(オッズ)に関する事前の知識を表すものではない。ノード「a」からノード「b」への移行率、又は移行確率は、
![]()
と表すことができる。
The migration rate can be conceptualized as a “transition probability”, which is the value of the business process step represented by the destination node after the business process step represented by the origin node is performed. This is because the inferred probability that will continue can be expressed. However, transition probabilities do not represent prior knowledge about the likelihood that such a transition will occur in the future (odds). The transition rate or transition probability from the node “a” to the node “b” is:
![]()
It can be expressed as.
図4の例示的なグラフから分かるように、観測されたビジネス・プロセス・ステップを表す6つのノードがある。各ノードにおいて、エッジ(矢印で示される)は、観測された移行率を表し、太いエッジほど大きい移行率を表す。したがって、ほとんどの場合、ノード「A」に関連付けられたビジネス・プロセス・ステップが実施されると、その後でノード「C」に関連するビジネス・プロセス・ステップが実施されることが分かる。しかし、その後にノード「B」に関連付けられたビジネス・プロセス・ステップが実施されるときもあり、又は、ノード「A」に関連付けられたビジネス・プロセス・ステップが繰り返されることもある。図5の表は、図4の例示的なグラフと一致し得る例示的な移行率を示す。これから分かるように、第1のノードから第2のノードへの全ての移行率の合計は、そのような移行が見出される場合には1になり、又は、移行が見出されない場合、例えば所与のノードに関連付けられたビジネス・プロセス・ステップがそのビジネス・プロセスにおける終端ステップであるような場合にはゼロになり、そのどちらかである。例えば、
の合計=1であり、他方、ノード「F」は終端ステップを表すので、
の合計=0である。
As can be seen from the exemplary graph of FIG. 4, there are six nodes that represent the observed business process steps. In each node, an edge (indicated by an arrow) represents an observed transition rate, and a thicker edge represents a larger transition rate. Thus, in most cases, it can be seen that when the business process step associated with node “A” is performed, then the business process step associated with node “C” is performed. However, subsequent business process steps associated with node “B” may be performed, or business process steps associated with node “A” may be repeated. The table of FIG. 5 shows exemplary transition rates that may be consistent with the exemplary graph of FIG. As can be seen, the sum of all migration rates from the first node to the second node will be 1 if such a migration is found, or if no migration is found, eg, given Zero if the business process step associated with the node is the terminal step in the business process, or either. For example,
Since the node “F” represents a termination step,
Total = 0.
移行率を、上記では、第1のノードから第2のノードへの移行を第1のノードからの移行の総数で割った比を表すものとして説明したが、その他のより洗練された移行率計算の手法を用いることができる。例えば、より最近の移行に対して、最近は観察されていない移行よりも重く重み付けすることが望ましい場合、本発明の例示的な実施形態は、移行率の計算の中に所望の重み付けを表現するための種々の技術を提供することができる。例えば、本発明の幾つかの例示的な実施形態は、移行率の計算に対して「アントコロニー最適化」に基づく手法を利用することができる。アントコロニー最適化は、アリが仲間に餌の在り処を教えるために匂い(フェロモンとしても知られる)の跡を残していくやり方に基づく手法である。各々のアリが匂いの跡を残していくので、餌の在り処から同じ経路を辿るアリが多いほど、匂いの経路はより強力になる。匂いの経路は蒸発する傾向があるので、付加的なアリにより強化されなかった経路は減衰し得る。 Although the migration rate has been described above as representing the ratio of the migration from the first node to the second node divided by the total number of migrations from the first node, other more sophisticated migration rate calculations Can be used. For example, if it is desirable to weight more recent transitions more heavily than transitions that have not been observed recently, exemplary embodiments of the present invention express the desired weighting in the transition rate calculation. Various techniques can be provided. For example, some exemplary embodiments of the present invention may utilize an approach based on “ant colony optimization” for migration rate calculation. Ant colony optimization is a technique based on how ants leave a trail of odors (also known as pheromones) to teach their friends where to eat. As each ant leaves a trail of odors, the more ants that follow the same path from where the food is, the stronger the odor path. Since odor pathways tend to evaporate, pathways that were not enhanced by additional ants can be attenuated.
本発明の例示的な実施形態に適用されると、移行率は、所与の起点ノードから所与の宛先ノードへの追加的な移行によりてこ入れされ得るが、強化されない場合にはやはり時間の経過に伴い減衰し得る。この技術は、例えば、ノード「a」からノード「b」への移行がアクティビティ・ログ内で検出されたときに以下の方程式を用いて移行率を更新することにより、実装することができる。
ここで、
は初期移行率を表し、
は新たな移行率を表し、rは、アクティビティ・ログから移行が観測された回数のカウントに依存し得る強化パラメータを表す。
When applied to an exemplary embodiment of the invention, the transition rate can be leveraged by additional transitions from a given origin node to a given destination node, but again over time if not enhanced Can be attenuated. This technique can be implemented, for example, by updating the migration rate using the following equation when a transition from node “a” to node “b” is detected in the activity log.
here,
Represents the initial migration rate,
Represents a new migration rate and r represents an enhancement parameter that may depend on the count of the number of times a migration has been observed from the activity log.
強化パラメータは、本発明の例示的な実施形態により、r=f(cost(a,b))と定義することができ、ここでrは、aからbへの移行におけるエッジのコストの関数である。ここで、cost(a,b)は、以下で詳述されるように、ある特定の移行に、他の移行よりも高いコストがかかるべきであることを所望するユーザ選択に従い設定することができる、コスト関数とすることができる。 The enhancement parameter may be defined as r = f (cost (a, b)) according to an exemplary embodiment of the invention, where r is a function of the cost of the edge in the transition from a to b. is there. Here, cost (a, b) can be set according to a user selection that desires that certain transitions should cost more than others, as detailed below. Can be a cost function.
残りの、状態aから状態kへの移行率、
は、時間t+1において、例えば以下の方程式に従い減衰し得る。
May decay at
上述のように、移行比を減衰で更新することの代替法は、移行比を、アクティビティ・ログ内でのその発生レベルのみに基づいて更新することである。例えば、ノード「a」からノード「b」へのエッジe1についての移行比を更新することは、現実のビジネス・プロセス実行のトレースにおいてe1が検出された回数のc(e1)で表されるカウントをとり続けることであり、このトレースは1...,Tと記述され、Tは直近に受け取ったトレースであり、総計で|T|個のトレースをこれまでに受け取っている。したがって、
本発明の例示的な実施形態により、移行比をアクティビティ・ログ・データに基づき
![]()
から
![]()
に更新する際に、随意的に、信頼度関数が有効になるようにすることができる。信頼度関数を用いて、特定の移行の発生の重み付けを調整することができる。例えば、ある特定の移行が正常な操作に特徴的であり得ることが既知である場合、アクティビティ・ログから引き出されるこれらの移行のインスタンスには、きわめて異常であると理解される移行のインスタンスよりも重く重み付けすることができる。このようにして、ビジネス・プロセス・グラフの生成を、信頼できる移行の方により多く偏らせ、疑わしい移行の方にはより少なく偏らせるようにすることができる。
In accordance with an exemplary embodiment of the present invention, the migration ratio is based on activity log data.
![]()
From
![]()
Optionally, the reliability function can be enabled when updating to. A confidence function can be used to adjust the weighting of the occurrence of a particular transition. For example, if it is known that certain migrations may be characteristic of normal operations, these migration instances drawn from the activity log are more likely than migration instances that are understood to be very unusual. It can be heavily weighted. In this way, the generation of business process graphs can be biased more towards reliable migrations and less towards suspicious migrations.
信頼度関数自体は、例えば、ある特定の移行を起こりそうにないこと及び/又は不可能なことにする実世界の制約を考慮に入れて、ユーザが提供することができる。ユーザは、信頼度関数を用いて、どの移行を偏らせるか選択することもでき、又は、いずれの移行も偏らせないことを選択することもできる。この特徴は、上述のように、随意的に実装することができる。 The confidence function itself may be provided by the user, taking into account, for example, real world constraints that make certain transitions unlikely and / or impossible. The user can use the confidence function to select which transitions are biased, or can choose not to bias any transitions. This feature can optionally be implemented as described above.
生成されたビジネス・プロセス・グラフ上の不合理な移行の重要性を、信頼度関数を用いて最小化する代わりに、信頼度関数は、疑わしい可能性がある特定の移行の露出及び顕著さ(prominence)を増大させるために用いることができる。例えば、ビジネス・プロセスが通常は「A」から「B」へ、そして「C」へと続くものであり、その理由が、例えばステップ「B」が承認を求められるステップであるような場合には、「A」から直接「C」への移行に対して、生成されたグラフ上でのそのような移行の顕著さを増大させる信頼度関数を割り当てて、これらのような疑わしい移行が、生成されたグラフを観察するユーザの注意を引き易くするようにさせると同時に、その一方で、より普通の移行には、より少ない顕著さを与えるようにすることができる。 Instead of minimizing the importance of irrational transitions on the generated business process graph using a confidence function, the confidence function is exposed to the suspicion of a particular transition that may be suspicious ( It can be used to increase (prominence). For example, if a business process usually follows from “A” to “B” and then “C”, for example if step “B” is a step that requires approval , Assigning a confidence function that increases the prominence of such a transition on the generated graph for the transition from “A” to “C” directly, such suspicious transitions are generated. This makes it easier to draw the attention of the user observing the graph while at the same time giving less notice to more normal transitions.
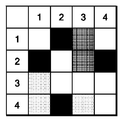
本発明の例示的な実施形態は、ビジネス・プロセス・グラフ・スナップショットの表現をきわめて洞察に満ちた画像ベースの形式で表示するための手法を提供することができる。図6は、本発明の例示的な一実施形態によるビジネス・プロセス・グラフ・スナップショットの表現を表示するための例示的な画像ベースの形式を示す。 Exemplary embodiments of the present invention can provide a technique for displaying a representation of a business process graph snapshot in a highly insightful image-based format. FIG. 6 illustrates an exemplary image-based format for displaying a representation of a business process graph snapshot according to an exemplary embodiment of the present invention.
図6に示されるように、単一の画像内に複数のプロセス・スナップショットを表示することができる。総計でn2個のスナップショットが存在する場合、これらのスナップショットは、マッピング関数を用いて、図6に示されるようにn掛けるn画素(pixel)のサイズの画像にマッピングすることができる。このように用いられるマッピング関数は、スナップショットのトポロジー、信頼度関数、及び/又は移行比を利用して、各スナップショットに固有の色値を生成し、次にその色値をマッピング内の画素として表示することができる。色値は、2ビットカラー(黒又は白)から、例えば、可能な各色が8ビットの赤レベル及び8ビットの緑レベル及び8ビットの青レベルによって表される24ビットカラーまでの任意の所望の色深度とすることができる。 As shown in FIG. 6, multiple process snapshots can be displayed in a single image. If there are a total of n 2 snapshots, these snapshots can be mapped to an image with a size of n pixels multiplied by n as shown in FIG. 6 using a mapping function. The mapping function used in this way uses the snapshot topology, reliability function, and / or transition ratio to generate a unique color value for each snapshot, and then uses that color value as a pixel in the mapping. Can be displayed as The color value can be any desired color from 2 bit color (black or white) to, for example, 24 bit color where each possible color is represented by 8 bit red level and 8 bit green level and 8 bit blue level. It can be the color depth.
マッピング関数は、例えば、Mathematicaのような標準的な数理計算パッケージを用いて、n×n画素を全て含む最終的な単一画像にフィッティングさせることができる。次いで、例えば、この多項式を微分することにより、マイニング(mining)されたビジネス・プロセス・モデル・グラフの連続したスナップショットの変化率を判定し、表示することができる。 The mapping function can be fitted to a final single image containing all n × n pixels using a standard mathematical package such as Mathematica, for example. Then, for example, by differentiating this polynomial, the rate of change of successive snapshots of the mined business process model graph can be determined and displayed.
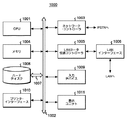
図7は、本開示の方法及びシステムを実装することができるコンピュータ・システムの一例を示す。本開示のシステム及び方法は、例えばメインフレーム、パーソナル・コンピュータ(PC)、携帯型コンピュータ、サーバなどのコンピュータ・システム上で実行されるソフトウェア・アプリケーションの形で実装することができる。ソフトウェア・アプリケーションは、コンピュータ・システムによりローカルにアクセスすることができ、且つ、例えばローカル・エリア・ネットワーク又はインターネットなどのネットワークへの有線又は無線接続を経由してアクセスすることができる、記録媒体上に格納することができる。 FIG. 7 illustrates an example of a computer system that can implement the methods and systems of the present disclosure. The systems and methods of the present disclosure can be implemented in the form of software applications running on a computer system such as a mainframe, personal computer (PC), portable computer, server, and the like. The software application can be accessed locally by a computer system and on a recording medium that can be accessed via a wired or wireless connection to a network such as a local area network or the Internet, for example. Can be stored.
概略的にシステム1000と呼ばれるコンピュータ・システムは、例えば、中央演算処理ユニット(CPU)1001、ランダム・アクセス・メモリ(RAM)1004、プリンタ・インターフェース1010、表示ユニット1011、ローカル・エリア・ネットワーク(LAN)データ伝送コントローラ1005、LANインターフェース1006、ネットワーク・コントローラ1003、内部バス1002、及び、例えばキーボード、マウスなどの1つ又は複数の入力デバイス1009を含むことができる。図示されるように、システム1000は、リンク1007を経由して、例えばハードディスク1008のようなデータ・ストレージ・デバイスに接続することができる。
A computer system generally referred to as
本明細書において説明された例示的な実施形態は説明的なものであり、本開示の主旨、又は添付の特許請求の範囲から逸脱することなく、多くの変形を導入することができる。例えば、別の例示的な実施形態の要素及び/又は特徴を、本開示及び添付の特許請求の範囲内で互いに組み合わせ、及び/又は互いに置き換えることができる。 The exemplary embodiments described herein are illustrative and many variations can be introduced without departing from the spirit of the present disclosure or the appended claims. For example, elements and / or features of other exemplary embodiments can be combined and / or replaced with each other within the present disclosure and appended claims.
21:根
22:ビン
23、24:バケツ
25:ビン又はバケツ
26:第1のレベル
31:第2のレベル
1000:システム
1002:内部バス
21: root 22: bin 23, 24: bucket 25: bin or bucket 26: first level 31: second level 1000: system 1002: internal bus
Claims (23)
1つ又は複数のアクティビティ・ログ・ファイルから、実行されたプロセス・ステップに付随するデータを収集することと、
前記収集されたデータを構文解析して、実施済みプロセス・ステップのセットを判定することと、
前記実施済みプロセス・ステップの実施順序を示すプロセス・スレッドを識別することと、
前記収集されたデータの前記各々の識別されたプロセス・スレッド内で、各々の前記実施済みプロセス・ステップが他の各々の前記実施済みプロセス・ステップの後に続いた回数を表す発生頻度値を判定することと、
前記実行されたプロセスのモデルを表すグラフを、各々の前記実施済みプロセス・ステップを前記グラフのノードとして表し、且つ、各々の前記プロセス・スレッド内の前記プロセス・ステップ間の各々の移行を前記グラフ上のエッジとして表すことにより生成することであって、前記グラフの所与のノード対のいずれについても、前記ノード対を接続する前記エッジに対して、前記対の第1のノードによって表される前記プロセス・ステップの後に前記対の第2のノードによって表されるプロセス・ステップが続いた回数に対応する前記発生頻度値に依存する数が割り当てられる、生成することと、
前記生成されたグラフをユーザに対してアクセス可能にすることと、
を含み、
前記生成されたグラフは、前記実行されたステップに付随する追加データが前記アクティビティ・ログ・ファイルに追加されたときに更新され、前記更新することは、前記ノード、前記エッジ、又は前記エッジに割り当てられた前記数のうちの1つ又は複数を変更することを含み、
前記生成されたグラフは、前記アクティビティ・ログ・ファイルに対する変更を自動的に検出すること、及び前記アクティビティ・ログ・ファイルに対する前記変更が検出されたときに、前記追加データを用いて前記グラフを更新することによって、継続的に更新され、
前記ステップの各々がコンピュータ・システムを用いて実施される、方法。 A method for modeling a process,
Collecting data associated with executed process steps from one or more activity log files;
Parsing the collected data to determine a set of performed process steps;
Identifying a process thread that indicates the execution order of the performed process steps;
Determining an occurrence frequency value representing the number of times each performed process step followed each other performed process step within each identified process thread of the collected data. And
A graph representing a model of the executed process represents each performed process step as a node of the graph, and each transition between the process steps within each process thread is represented in the graph For any given pair of nodes in the graph, represented by the first node of the pair with respect to the edge connecting the pair of nodes. Generating a number depending on the occurrence frequency value corresponding to the number of times the process step followed by the process step represented by the second node of the pair;
Making the generated graph accessible to a user;
Including
The generated graph is updated when additional data associated with the executed step is added to the activity log file, and the updating is assigned to the node, the edge, or the edge. Changing one or more of the given numbers,
The generated graph automatically detects changes to the activity log file and updates the graph with the additional data when the change to the activity log file is detected Is continuously updated,
A method wherein each of the steps is performed using a computer system.
1つ又は複数のアクティビティ・ログ・ファイルから、実行されたプロセス・ステップに付随するデータを収集することと、
前記収集されたデータを構文解析して、実施済みプロセス・ステップのセットを判定することと、
前記収集されたデータの各々の前記実施済みプロセス・ステップが他の各々の前記実施済みプロセス・ステップの後に続いた回数を表す、発生頻度値を判定することと、
前記実行されたプロセスのモデルを表すグラフを、各々の前記実施済みプロセス・ステップを前記グラフのノードとして表し、且つ、前記プロセス・ステップ間の各々の移行を前記グラフ上のエッジとして表すことにより生成することであって、前記グラフの所与のノード対のいずれについても、前記ノード対を接続する前記エッジに対して、前記対の第1のノードによって表される前記プロセス・ステップの後に前記対の第2のノードによって表されるプロセス・ステップが続いた回数に対応する前記発生頻度値に依存する数が割り当てられる、生成することと、
前記生成されたグラフを表示することと、
を含み、
前記生成されたグラフは、前記実行されたステップに付随する追加データが前記アクティビティ・ログ・ファイルに追加されたときに更新され、前記更新することは、前記ノード、前記エッジ、又は前記エッジに割り当てられた前記数のうちの1つ又は複数を変更することを含み、
前記生成されたグラフは、前記アクティビティ・ログ・ファイルに対する変更を自動的に検出すること、及び前記アクティビティ・ログ・ファイルに対する前記変更が検出されたときに、前記追加データを用いて前記グラフを更新することによって、継続的に更新され、
前記ステップの各々がコンピュータ・システムを用いて実施される、方法。 A method for modeling a process,
Collecting data associated with executed process steps from one or more activity log files;
Parsing the collected data to determine a set of performed process steps;
Determining an occurrence frequency value that represents the number of times each performed process step of each of the collected data lasted after each other performed process step;
A graph representing a model of the executed process is generated by representing each performed process step as a node of the graph and representing each transition between the process steps as an edge on the graph. For any given pair of nodes in the graph, for the edge connecting the pair of nodes, after the process step represented by the first node of the pair, the pair A number is assigned that depends on the occurrence frequency value corresponding to the number of times the process step represented by the second node of
Displaying the generated graph;
Including
The generated graph is updated when additional data associated with the executed step is added to the activity log file, and the updating is assigned to the node, the edge, or the edge. Changing one or more of the given numbers,
The generated graph automatically detects changes to the activity log file and updates the graph with the additional data when the change to the activity log file is detected Is continuously updated,
A method wherein each of the steps is performed using a computer system.
1つ又は複数のアクティビティ・ログ・ファイルから、実行されたプロセス・ステップに付随するデータを収集するように構成されたコンピュータ可読プログラム・コードと、
前記収集されたデータを構文解析して、実施済みプロセス・ステップのセットを判定するように構成されたコンピュータ可読プログラム・コードと、
前記収集されたデータの各々の前記実施済みプロセス・ステップが他の各々の前記実施済みプロセス・ステップの後に続いた回数を表す発生頻度値を判定するように構成されたコンピュータ可読プログラム・コードと、
前記実行されたプロセスのモデルを表すグラフを、各々の前記実施済みプロセス・ステップを前記グラフのノードとして表し、且つ、前記プロセス・ステップ間の各々の移行を前記グラフ上のエッジとして表すことにより生成するように構成されたコンピュータ可読プログラム・コードであって、前記グラフの所与のノード対のいずれについても、前記ノード対を接続する前記エッジに対して、前記対の第1のノードによって表される前記プロセス・ステップの後に前記対の第2のノードによって表されるプロセス・ステップが続いた回数に対応する、前記発生頻度値に依存する数が割り当てられる、コンピュータ可読プログラム・コードと、
前記生成されたグラフを表示するように構成されたコンピュータ可読プログラム・コードと、
を含み、
前記生成されたグラフは、前記実行されたステップに付随する追加データが前記アクティビティ・ログ・ファイルに追加されたときに更新され、前記更新することは、前記ノード、前記エッジ、又は前記エッジに割り当てられた前記数のうちの1つ又は複数を変更することを含み、
前記生成されたグラフは、前記アクティビティ・ログ・ファイルに対する変更を自動的に検出すること、及び前記アクティビティ・ログ・ファイルに対する前記変更が検出されたときに、前記追加データを用いて前記グラフを更新することによって、継続的に更新される、
コンピュータ・プログラム。 A computer program for process modeling,
Computer readable program code configured to collect data associated with executed process steps from one or more activity log files;
Computer readable program code configured to parse the collected data to determine a set of performed process steps;
Computer readable program code configured to determine a frequency of occurrence value representing the number of times each performed process step of each of the collected data has been followed by each other performed process step;
A graph representing a model of the executed process is generated by representing each performed process step as a node of the graph and representing each transition between the process steps as an edge on the graph. Computer readable program code configured to be represented by a first node of the pair for any given node pair of the graph with respect to the edge connecting the node pair. Computer readable program code, assigned a number depending on the occurrence frequency value corresponding to the number of times the process step followed by the process step represented by the pair of second nodes;
Computer readable program code configured to display the generated graph;
Including
The generated graph is updated when additional data associated with the executed step is added to the activity log file, and the updating is assigned to the node, the edge, or the edge. Changing one or more of the given numbers,
The generated graph automatically detects changes to the activity log file and updates the graph with the additional data when the change to the activity log file is detected Will be updated continuously,
Computer program.
Applications Claiming Priority (3)
| Application Number | Priority Date | Filing Date | Title |
|---|---|---|---|
| US12/772,629 | 2010-05-03 | ||
| US12/772,629 US8619084B2 (en) | 2010-05-03 | 2010-05-03 | Dynamic adaptive process discovery and compliance |
| PCT/US2011/024330 WO2011139393A1 (en) | 2010-05-03 | 2011-02-10 | Dynamic adaptive process discovery and compliance |
Publications (3)
| Publication Number | Publication Date |
|---|---|
| JP2013533528A JP2013533528A (en) | 2013-08-22 |
| JP2013533528A5 JP2013533528A5 (en) | 2014-06-19 |
| JP5705307B2 true JP5705307B2 (en) | 2015-04-22 |
Family
ID=44857904
Family Applications (1)
| Application Number | Title | Priority Date | Filing Date |
|---|---|---|---|
| JP2013509051A Expired - Fee Related JP5705307B2 (en) | 2010-05-03 | 2011-02-10 | Dynamic adaptive process discovery and compliance |
Country Status (5)
| Country | Link |
|---|---|
| US (1) | US8619084B2 (en) |
| JP (1) | JP5705307B2 (en) |
| CN (1) | CN102870129B (en) |
| DE (1) | DE112011101559T5 (en) |
| WO (1) | WO2011139393A1 (en) |
Families Citing this family (23)
| Publication number | Priority date | Publication date | Assignee | Title |
|---|---|---|---|---|
| JP5520763B2 (en) * | 2010-09-24 | 2014-06-11 | ジャパンマリンユナイテッド株式会社 | Marker movement route optimization method |
| US20120259792A1 (en) * | 2011-04-06 | 2012-10-11 | International Business Machines Corporation | Automatic detection of different types of changes in a business process |
| US20170109637A1 (en) * | 2011-05-08 | 2017-04-20 | Panaya Ltd. | Crowd-Based Model for Identifying Nonconsecutive Executions of a Business Process |
| US20170109676A1 (en) * | 2011-05-08 | 2017-04-20 | Panaya Ltd. | Generation of Candidate Sequences Using Links Between Nonconsecutively Performed Steps of a Business Process |
| US20170109667A1 (en) * | 2011-05-08 | 2017-04-20 | Panaya Ltd. | Automaton-Based Identification of Executions of a Business Process |
| US8700678B1 (en) * | 2011-12-21 | 2014-04-15 | Emc Corporation | Data provenance in computing infrastructure |
| US20130311242A1 (en) * | 2012-05-21 | 2013-11-21 | International Business Machines Corporation | Business Process Analytics |
| US20140067443A1 (en) * | 2012-08-28 | 2014-03-06 | International Business Machines Corporation | Business process transformation recommendation generation |
| US9324038B2 (en) | 2013-11-15 | 2016-04-26 | Xerox Corporation | Method and system for clustering, modeling, and visualizing process models from noisy logs |
| US9443034B2 (en) * | 2014-05-29 | 2016-09-13 | Microsoft Technology Licensing, Llc | Estimating influence using sketches |
| CN104462349B (en) * | 2014-12-05 | 2019-02-19 | 曙光信息产业(北京)有限公司 | A kind of document handling method and device |
| KR101680448B1 (en) * | 2015-02-17 | 2016-11-28 | 부산대학교 산학협력단 | Method for evaluating the process model |
| US11282035B2 (en) * | 2017-06-21 | 2022-03-22 | Accenture Global Solutions Limited | Process orchestration |
| US11544068B2 (en) * | 2019-09-26 | 2023-01-03 | Visier Solutions, Inc. | Systems and methods for generating a pipeline of stages for a process |
| US11093459B2 (en) * | 2020-01-21 | 2021-08-17 | Oracle International Corporation | Parallel and efficient technique for building and maintaining a main memory, CSR-based graph index in an RDBMS |
| US11367008B2 (en) | 2020-05-01 | 2022-06-21 | Cognitive Ops Inc. | Artificial intelligence techniques for improving efficiency |
| US11853270B2 (en) | 2020-06-30 | 2023-12-26 | UiPath, Inc. | Method and apparatus for visualizing a process map |
| US11403120B1 (en) | 2021-01-27 | 2022-08-02 | UiPath, Inc. | Enterprise process graphs for representing RPA data |
| US11500868B2 (en) | 2021-01-29 | 2022-11-15 | Oracle International Corporation | Efficient identification of vertices and edges for graph indexes in an RDBMS |
| US11829766B2 (en) | 2021-05-04 | 2023-11-28 | International Business Machines Corporation | Compliance enforcement via service discovery analytics |
| US11921785B2 (en) | 2022-01-25 | 2024-03-05 | Oracle International Corporation | Inline graph algorithm execution with a relational SQL engine |
| US20230316188A1 (en) * | 2022-03-29 | 2023-10-05 | International Business Machines Corporation | Workflow transformation framework |
| EP4369264A1 (en) * | 2022-11-08 | 2024-05-15 | Celonis SE | Adjustable event logs |
Family Cites Families (23)
| Publication number | Priority date | Publication date | Assignee | Title |
|---|---|---|---|---|
| US6751789B1 (en) | 1997-12-12 | 2004-06-15 | International Business Machines Corporation | Method and system for periodic trace sampling for real-time generation of segments of call stack trees augmented with call stack position determination |
| US6539339B1 (en) | 1997-12-12 | 2003-03-25 | International Business Machines Corporation | Method and system for maintaining thread-relative metrics for trace data adjusted for thread switches |
| US6182210B1 (en) | 1997-12-16 | 2001-01-30 | Intel Corporation | Processor having multiple program counters and trace buffers outside an execution pipeline |
| JP2001155062A (en) * | 1999-11-26 | 2001-06-08 | Hitachi Ltd | System and method for predicting arrival of work flow and storage medium stored with program related to the same method |
| US7197561B1 (en) * | 2001-03-28 | 2007-03-27 | Shoregroup, Inc. | Method and apparatus for maintaining the status of objects in computer networks using virtual state machines |
| GB2381633A (en) * | 2001-11-02 | 2003-05-07 | Nokia Corp | Controlling transactions |
| US7337443B2 (en) | 2003-06-30 | 2008-02-26 | Microsoft Corporation | Method and apparatus for processing program threads |
| JP2005267476A (en) * | 2004-03-22 | 2005-09-29 | Mitsubishi Electric Corp | Inter-workflow management system |
| US7631304B2 (en) * | 2005-01-14 | 2009-12-08 | Bearman Ian M | Software tool with modeling of asynchronous program flow |
| US8266600B2 (en) | 2005-03-28 | 2012-09-11 | Nec Laboratories America, Inc. | Model checking of multi threaded software |
| US7434723B1 (en) * | 2005-05-26 | 2008-10-14 | Sprint Communications Company L.P. | Mobile payment authorization system and method |
| US7614549B2 (en) * | 2005-07-15 | 2009-11-10 | Revolution Money Inc. | System and method for immediate issuance of transaction cards |
| US7774189B2 (en) * | 2006-12-01 | 2010-08-10 | International Business Machines Corporation | System and method for simulating data flow using dataflow computing system |
| US7629889B2 (en) * | 2006-12-27 | 2009-12-08 | Cardiac Pacemakers, Inc. | Within-patient algorithm to predict heart failure decompensation |
| WO2008083504A1 (en) * | 2007-01-10 | 2008-07-17 | Nick Koudas | Method and system for information discovery and text analysis |
| US20080250450A1 (en) * | 2007-04-06 | 2008-10-09 | Adisn, Inc. | Systems and methods for targeted advertising |
| JP5119816B2 (en) * | 2007-09-04 | 2013-01-16 | 富士ゼロックス株式会社 | Business risk management device, method and program |
| US20090094074A1 (en) | 2007-10-04 | 2009-04-09 | Nikovski Daniel N | Method for Constructing Business Process Models from Task Execution Traces |
| JP5169560B2 (en) * | 2008-07-11 | 2013-03-27 | 富士通株式会社 | Business flow processing program, method and apparatus |
| JP5169559B2 (en) * | 2008-07-11 | 2013-03-27 | 富士通株式会社 | Business flow analysis program, method and apparatus |
| JP5224953B2 (en) * | 2008-07-17 | 2013-07-03 | インターナショナル・ビジネス・マシーンズ・コーポレーション | Information processing apparatus, information processing method, and program |
| US8194075B2 (en) * | 2008-10-01 | 2012-06-05 | International Business Machines Corporation | Method and system for generating and displaying an interactive dynamic list view of multiply connected objects |
| US20100114832A1 (en) * | 2008-10-31 | 2010-05-06 | Lillibridge Mark D | Forensic snapshot |
-
2010
- 2010-05-03 US US12/772,629 patent/US8619084B2/en not_active Expired - Fee Related
-
2011
- 2011-02-10 JP JP2013509051A patent/JP5705307B2/en not_active Expired - Fee Related
- 2011-02-10 CN CN201180022188.4A patent/CN102870129B/en active Active
- 2011-02-10 DE DE112011101559T patent/DE112011101559T5/en active Pending
- 2011-02-10 WO PCT/US2011/024330 patent/WO2011139393A1/en active Application Filing
Also Published As
| Publication number | Publication date |
|---|---|
| US8619084B2 (en) | 2013-12-31 |
| DE112011101559T5 (en) | 2013-02-07 |
| CN102870129A (en) | 2013-01-09 |
| US20110267351A1 (en) | 2011-11-03 |
| WO2011139393A1 (en) | 2011-11-10 |
| CN102870129B (en) | 2016-06-15 |
| JP2013533528A (en) | 2013-08-22 |
Similar Documents
| Publication | Publication Date | Title |
|---|---|---|
| JP5705307B2 (en) | Dynamic adaptive process discovery and compliance | |
| US8676818B2 (en) | Dynamic storage and retrieval of process graphs representative of business processes and extraction of formal process models therefrom | |
| US20190340518A1 (en) | Systems and methods for enriching modeling tools and infrastructure with semantics | |
| US11941137B2 (en) | Use of multi-faceted trust scores for decision making, action triggering, and data analysis and interpretation | |
| US9652559B2 (en) | Managing information assets using feedback re-enforced search and navigation | |
| US9392003B2 (en) | Internet security cyber threat reporting system and method | |
| US8751487B2 (en) | Generating a semantic graph relating information assets using feedback re-enforced search and navigation | |
| US8150717B2 (en) | Automated risk assessments using a contextual data model that correlates physical and logical assets | |
| Bolt et al. | Multidimensional process mining using process cubes | |
| US20160094431A1 (en) | Service Analyzer Interface | |
| US20220122010A1 (en) | Long-short field memory networks | |
| US9195943B2 (en) | Behavioral rules discovery for intelligent computing environment administration | |
| US20060294220A1 (en) | Diagnostics and resolution mining architecture | |
| US20150066575A1 (en) | Enterprise risk assessment | |
| US20170109636A1 (en) | Crowd-Based Model for Identifying Executions of a Business Process | |
| US9304991B2 (en) | Method and apparatus for using monitoring intent to match business processes or monitoring templates | |
| US20120239596A1 (en) | Classification of stream-based data using machine learning | |
| KR20170040210A (en) | Visual tools for failure analysis in distributed systems | |
| US20150039555A1 (en) | Heuristically modifying dbms environments using performance analytics | |
| JP2016100005A (en) | Reconcile method, processor and storage medium | |
| US20190245893A1 (en) | Policy evaluation trees | |
| CN109815042B (en) | Abnormal factor positioning method, abnormal factor positioning device, server and storage medium | |
| JP2006048702A (en) | Automatic configuration of transaction-based performance model | |
| US20170004188A1 (en) | Apparatus and Method for Graphically Displaying Transaction Logs | |
| CN114022051A (en) | Index fluctuation analysis method, storage medium and electronic equipment |
Legal Events
| Date | Code | Title | Description |
|---|---|---|---|
| A621 | Written request for application examination |
Free format text: JAPANESE INTERMEDIATE CODE: A621 Effective date: 20131111 |
|
| A521 | Request for written amendment filed |
Free format text: JAPANESE INTERMEDIATE CODE: A523 Effective date: 20140430 |
|
| A977 | Report on retrieval |
Free format text: JAPANESE INTERMEDIATE CODE: A971007 Effective date: 20140514 |
|
| A131 | Notification of reasons for refusal |
Free format text: JAPANESE INTERMEDIATE CODE: A131 Effective date: 20140527 |
|
| A521 | Request for written amendment filed |
Free format text: JAPANESE INTERMEDIATE CODE: A523 Effective date: 20140812 |
|
| TRDD | Decision of grant or rejection written | ||
| A01 | Written decision to grant a patent or to grant a registration (utility model) |
Free format text: JAPANESE INTERMEDIATE CODE: A01 Effective date: 20150203 |
|
| A61 | First payment of annual fees (during grant procedure) |
Free format text: JAPANESE INTERMEDIATE CODE: A61 Effective date: 20150224 |
|
| R150 | Certificate of patent or registration of utility model |
Ref document number: 5705307 Country of ref document: JP Free format text: JAPANESE INTERMEDIATE CODE: R150 |
|
| LAPS | Cancellation because of no payment of annual fees |