JP5576775B2 - Image processing apparatus, image processing method, and image processing program - Google Patents
Image processing apparatus, image processing method, and image processing program Download PDFInfo
- Publication number
- JP5576775B2 JP5576775B2 JP2010265795A JP2010265795A JP5576775B2 JP 5576775 B2 JP5576775 B2 JP 5576775B2 JP 2010265795 A JP2010265795 A JP 2010265795A JP 2010265795 A JP2010265795 A JP 2010265795A JP 5576775 B2 JP5576775 B2 JP 5576775B2
- Authority
- JP
- Japan
- Prior art keywords
- evaluation value
- evaluation
- image processing
- region
- texture component
- Prior art date
- Legal status (The legal status is an assumption and is not a legal conclusion. Google has not performed a legal analysis and makes no representation as to the accuracy of the status listed.)
- Active
Links
Images


Classifications
-
- G—PHYSICS
- G06—COMPUTING; CALCULATING OR COUNTING
- G06T—IMAGE DATA PROCESSING OR GENERATION, IN GENERAL
- G06T7/00—Image analysis
- G06T7/40—Analysis of texture
- G06T7/41—Analysis of texture based on statistical description of texture
-
- G—PHYSICS
- G06—COMPUTING; CALCULATING OR COUNTING
- G06T—IMAGE DATA PROCESSING OR GENERATION, IN GENERAL
- G06T7/00—Image analysis
- G06T7/0002—Inspection of images, e.g. flaw detection
- G06T7/0012—Biomedical image inspection
-
- G—PHYSICS
- G06—COMPUTING; CALCULATING OR COUNTING
- G06T—IMAGE DATA PROCESSING OR GENERATION, IN GENERAL
- G06T2207/00—Indexing scheme for image analysis or image enhancement
- G06T2207/10—Image acquisition modality
- G06T2207/10024—Color image
-
- G—PHYSICS
- G06—COMPUTING; CALCULATING OR COUNTING
- G06T—IMAGE DATA PROCESSING OR GENERATION, IN GENERAL
- G06T2207/00—Indexing scheme for image analysis or image enhancement
- G06T2207/10—Image acquisition modality
- G06T2207/10068—Endoscopic image
-
- G—PHYSICS
- G06—COMPUTING; CALCULATING OR COUNTING
- G06T—IMAGE DATA PROCESSING OR GENERATION, IN GENERAL
- G06T2207/00—Indexing scheme for image analysis or image enhancement
- G06T2207/20—Special algorithmic details
- G06T2207/20021—Dividing image into blocks, subimages or windows
-
- G—PHYSICS
- G06—COMPUTING; CALCULATING OR COUNTING
- G06T—IMAGE DATA PROCESSING OR GENERATION, IN GENERAL
- G06T2207/00—Indexing scheme for image analysis or image enhancement
- G06T2207/30—Subject of image; Context of image processing
- G06T2207/30004—Biomedical image processing
- G06T2207/30028—Colon; Small intestine
Landscapes
- Engineering & Computer Science (AREA)
- Physics & Mathematics (AREA)
- Computer Vision & Pattern Recognition (AREA)
- Theoretical Computer Science (AREA)
- General Physics & Mathematics (AREA)
- Medical Informatics (AREA)
- Quality & Reliability (AREA)
- Radiology & Medical Imaging (AREA)
- Nuclear Medicine, Radiotherapy & Molecular Imaging (AREA)
- Health & Medical Sciences (AREA)
- General Health & Medical Sciences (AREA)
- Probability & Statistics with Applications (AREA)
- Image Analysis (AREA)
- Endoscopes (AREA)
- Studio Devices (AREA)
Description
本発明は、被検者の生体内を撮像した生体内画像を処理する画像処理装置、画像処理方法、及び画像処理プログラムに関するものである。 The present invention relates to an image processing apparatus, an image processing method, and an image processing program for processing an in-vivo image obtained by imaging an in-vivo body of a subject.
従来から、患者等の被検者の体内に導入されて管腔内を観察する医用観察装置として、内視鏡が広く普及している。近年では、カプセル型の筐体内部に撮像装置及び通信装置等を収容し、撮像装置により撮像された画像データを体外に無線送信する飲み込み型の内視鏡(カプセル内視鏡)も開発されている。このような医用観察装置によって撮像された一連の生体内画像(消化管内画像)は膨大な数(数万枚以上)に上ると共に、各消化管内画像に対する観察及び診断には多くの経験が必要とされる。そのため、医師による診断を補助する医療診断支援機能が望まれている。この機能を実現する画像認識技術の1つとして、消化管内画像から病変等の異常部分を自動的に検出して、重点的に診断すべき画像を示す技術が提案されている。 2. Description of the Related Art Conventionally, endoscopes are widely used as medical observation apparatuses that are introduced into the body of a subject such as a patient and observe the inside of a lumen. In recent years, a swallowable endoscope (capsule endoscope) has been developed that houses an imaging device, a communication device, and the like inside a capsule-type housing and wirelessly transmits image data captured by the imaging device to the outside of the body. Yes. A series of in-vivo images (in-gastrointestinal images) taken by such a medical observation apparatus is enormous (tens of thousands or more), and observation and diagnosis for each in-gastrointestinal image requires a lot of experience. Is done. Therefore, a medical diagnosis support function that assists diagnosis by a doctor is desired. As one of image recognition techniques for realizing this function, a technique has been proposed in which an abnormal part such as a lesion is automatically detected from an image in the digestive tract and an image to be diagnosed with priority is shown.
ところで、消化管内画像には、診断において観察対象となる粘膜領域の他に、残渣のように観察不要な内容物が映し出されている場合がある。このような粘膜領域と内容物領域(即ち、領域のカテゴリ)とを判別する技術として、例えば、特許文献1には、一連の消化管内画像から複数の画像を選択し、選択された複数の画像の画素毎又は小領域毎の色特徴量を算出し、これらの色特徴量に基づいて、一連の消化管内画像を構成する各画像内の粘膜領域を判別する画像処理方法が開示されている。
By the way, in the gastrointestinal tract image, in addition to the mucosal region to be observed in diagnosis, there are cases where contents such as residues that are not required to be observed are projected. As a technique for discriminating between such a mucous membrane region and a content region (that is, a category of the region), for example, in
また、画像に映し出された互いに異なる領域を判別する技術として、同時生起行列を用いたテクスチャ特徴量による方法も知られている(例えば、非特許文献1参照)。同時生起行列とは、画素iと、画素iから一定の変位δ=(d,θ)(dは距離、θは角度)だけ離れた画素jの画素値をそれぞれLi、Ljとした場合に、画素値の対(Li,Lj)が生じる確率Pδ(Li,Lj)を要素とする行列である。この行列を用いることにより、画素値の一様性、方向性及びコントラスト等の性質を示す特徴量が求められる。 Further, as a technique for discriminating different regions displayed in an image, a method using a texture feature amount using a co-occurrence matrix is also known (for example, see Non-Patent Document 1). The co-occurrence matrix means that pixel values of pixel i and pixel j separated from pixel i by a fixed displacement δ = (d, θ) (d is a distance and θ is an angle) are L i and L j , respectively. Is a matrix whose elements are the probabilities P δ (L i , L j ) of pixel value pairs (L i , L j ). By using this matrix, a feature value indicating properties such as uniformity, directionality, and contrast of pixel values is obtained.
ところで、生体内画像に映し出された各領域のカテゴリを、色特徴量を用いて判別する場合、撮像条件(照明条件等)の影響を受けることがある。また、同時生起行列を用いたテクスチャ特徴量を利用する場合、対象物を考慮したパラメータを用いなければならないため、処理時間の速いアルゴリズムを作成することが困難となる。そのため、消化管内画像のように画像枚数が非常に多い生体内画像について領域を判別する場合、処理時間が長くなってしまう。 By the way, when the category of each area projected on the in-vivo image is determined using the color feature amount, it may be influenced by the imaging conditions (such as illumination conditions). In addition, when a texture feature quantity using a co-occurrence matrix is used, it is difficult to create an algorithm with a fast processing time because a parameter that takes into account the object must be used. Therefore, when an area is determined for an in-vivo image having a very large number of images such as an in-gastrointestinal image, the processing time becomes long.
本発明は、上記に鑑みてなされたものであって、生体内画像に含まれる各領域のカテゴリを、撮像条件に影響されることなく、且つ従来よりも速いアルゴリズムで適切に判別することができる画像処理装置、画像処理方法、及び画像処理プログラムを提供することを目的とする。 The present invention has been made in view of the above, and it is possible to appropriately determine the category of each region included in the in-vivo image without being influenced by the imaging conditions and using an algorithm faster than the conventional one. An object is to provide an image processing apparatus, an image processing method, and an image processing program.
上述した課題を解決し、目的を達成するために、本発明に係る画像処理装置は、生体内画像においてカテゴリ判別対象となる評価領域を設定する評価領域設定手段と、前記評価領域内の生体内画像からテクスチャ成分を取得するテクスチャ成分取得手段と、前記テクスチャ成分の均質性を示す評価値を算出する評価値算出手段と、前記評価値に基づいて、前記評価領域のカテゴリを判別する判別手段とを備えることを特徴とする。 In order to solve the above-described problems and achieve the object, an image processing apparatus according to the present invention includes an evaluation area setting unit that sets an evaluation area that is a category discrimination target in an in-vivo image, and an in-vivo in the evaluation area. A texture component acquisition unit that acquires a texture component from an image, an evaluation value calculation unit that calculates an evaluation value indicating homogeneity of the texture component, and a determination unit that determines a category of the evaluation region based on the evaluation value; It is characterized by providing.
本発明に係る画像処理方法は、生体内画像においてカテゴリ判別対象となる評価領域を設定する評価領域設定ステップと、前記評価領域内の生体内画像からテクスチャ成分を取得するテクスチャ成分取得ステップと、前記テクスチャ成分の均質性を示す評価値を算出する評価値算出ステップと、前記評価値に基づいて、前記評価領域のカテゴリを判別する判別ステップとを含むことを特徴とする。 The image processing method according to the present invention includes an evaluation region setting step for setting an evaluation region to be a category discrimination target in an in-vivo image, a texture component acquiring step for acquiring a texture component from the in-vivo image in the evaluation region, An evaluation value calculating step for calculating an evaluation value indicating the homogeneity of the texture component, and a determining step for determining a category of the evaluation region based on the evaluation value are included.
本発明に係る画像処理プログラムは、生体内画像においてカテゴリ判別対象となる評価領域を設定する評価領域設定手順と、前記評価領域内の生体内画像からテクスチャ成分を取得するテクスチャ成分取得手順と、前記テクスチャ成分の均質性を示す評価値を算出する評価値算出手順と、前記評価値に基づいて、前記評価領域のカテゴリを判別する判別手順とをコンピュータに実行させることを特徴とする。 An image processing program according to the present invention includes an evaluation region setting procedure for setting an evaluation region to be a category discrimination target in an in-vivo image, a texture component acquisition procedure for acquiring a texture component from the in-vivo image in the evaluation region, An evaluation value calculation procedure for calculating an evaluation value indicating the homogeneity of a texture component and a determination procedure for determining a category of the evaluation region based on the evaluation value are executed by a computer.
本発明によれば、評価領域内部における生体内画像のテクスチャ成分の均一性に基づいて当該評価領域のカテゴリを判別するので、撮像条件に影響されることなく、且つ処理時間の速いアルゴリズムで、適切な判別結果を得ることが可能となる。 According to the present invention, since the category of the evaluation region is determined based on the uniformity of the texture component of the in-vivo image within the evaluation region, the algorithm is not affected by the imaging condition and is appropriately processed with a fast processing time. It is possible to obtain a correct discrimination result.
以下、本発明の実施の形態に係る画像処理装置について、図面を参照しながら説明する。なお、これら実施の形態によって本発明が限定されるものではない。また、各図面の記載において、同一部分には同一の符号を付して示している。 Hereinafter, an image processing apparatus according to an embodiment of the present invention will be described with reference to the drawings. Note that the present invention is not limited by these embodiments. Moreover, in description of each drawing, the same code | symbol is attached | subjected and shown to the same part.
以下に説明する実施の形態に係る画像処理装置は、例えば内視鏡やカプセル内視鏡等の医用観察装置により撮像された被検者の生体内画像(消化管内画像)を処理するものであり、具体的には、消化管内画像に映し出された領域のカテゴリを判別(即ち、診断において観察対象となる粘膜領域や、観察が不要な残渣領域を識別)する処理を行う。また、以下の実施の形態において、医用観察装置によって撮像される消化管内画像は、例えば、各画素がR(赤)、G(緑)、B(青)の各色成分に対する画素レベル(画素値)を有するカラー画像である。 An image processing apparatus according to an embodiment described below processes an in-vivo image (in-gastrointestinal image) of a subject taken by a medical observation apparatus such as an endoscope or a capsule endoscope. Specifically, a process of discriminating the category of the region displayed in the intra-gastrointestinal tract image (that is, identifying the mucosal region to be observed in diagnosis and the residual region that does not require observation) is performed. Further, in the following embodiment, an in-gastrointestinal image captured by a medical observation apparatus is, for example, a pixel level (pixel value) for each color component of R (red), G (green), and B (blue). Is a color image.
(実施の形態1)
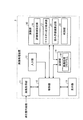
図1は、本発明の実施の形態1に係る画像処理装置の構成を示すブロック図である。図1に示すように、画像処理装置1は、画像取得部11と、入力部12と、表示部13と、記録部14と、演算部15と、画像処理装置1全体の動作を制御する制御部10とを備える。
(Embodiment 1)
FIG. 1 is a block diagram showing a configuration of an image processing apparatus according to
画像取得部11は、医用観察装置によって撮像された消化管内画像の画像データを取得する。画像取得部11は、医用観察装置を含むシステムの態様に応じて適宜構成される。例えば、医用観察装置がカプセル内視鏡であり、医用観察装置との間の画像データの受け渡しに可搬型の記録媒体が使用される場合、画像取得部11は、この記録媒体を着脱自在に装着し、保存された消化管内画像の画像データを読み出すリーダ装置により実現される。また、医用観察装置によって撮像された消化管内画像の画像データを保存しておくサーバを設置する場合、画像取得部11は、サーバと接続される通信装置等により実現され、サーバとの間でデータ通信を行って消化管内画像の画像データを取得する。或いは、画像取得部11を、内視鏡等の医用観察装置からケーブルを介して画像信号を入力するインタフェース装置等で構成しても良い。
The
入力部12は、例えばキーボード、マウス、タッチパネル、各種スイッチ等の入力デバイスよって実現され、ユーザがこれらの入力デバイスを操作することにより入力された入力信号を制御部10に出力する。
The
表示部13は、LCDやELディスプレイ等の表示装置によって実現され、制御部10の制御の下で、消化管内画像を含む各種画面を表示する。
The
記録部14は、更新記録可能なフラッシュメモリ等のROMやRAMといったICメモリ、内蔵若しくはデータ通信端子で接続されたハードディスク、又は、CD−ROM等の情報記録媒体及びその読取装置等によって実現される。記録部14は、画像取得部11によって取得された消化管内画像の画像データの他、画像処理装置1を動作させると共に、種々の機能を画像処理装置1に実行させるためのプログラムや、このプログラムの実行中に使用されるデータ等を格納する。具体的には、記録部14は、消化管内画像に含まれる粘膜領域と残渣領域とを判別するための画像処理プログラム141を格納する。
The
演算部15は、CPU等のハードウェアと、そこに読み込まれた画像処理プログラム141とによって実現され、消化管内画像の画像データを処理して粘膜領域と残渣領域とを判別するための種々の演算処理を行う。演算部15は、評価領域設定部16と、テクスチャ成分取得部17と、評価領域におけるテクスチャ成分の均質性を示す評価値を算出する評価値算出手段としての偏り評価値算出部18と、判別部19とを有する。
The
評価領域設定部16は、消化管内画像から、粘膜領域と残渣領域とを判別する対象である評価領域を設定する。
The evaluation
テクスチャ成分取得部17は、評価領域内の消化管内画像から構造成分を除くことにより、テクスチャ成分を取得する。テクスチャ成分の取得方法としては、例えば、モフォロジ(モルフォロジー)のオープニング処理(小畑秀文著、「モルフォロジー」、コロナ社、第82〜85頁参照)が用いられる。 The texture component acquisition unit 17 acquires the texture component by removing the structural component from the digestive tract image in the evaluation region. As a method for acquiring the texture component, for example, a morphology (morphology) opening process (see Hidefumi Obata, “Morphology”, Corona, pages 82 to 85) is used.
図2は、モフォロジのオープニング処理によりテクスチャ成分を取得する方法を説明する図である。モフォロジのオープニング処理においては、まず、2次元画像を構成するxy平面上の各画素の画素値を高度(z軸)とみなした3次元空間における画像Gに対し(図2(a))、構造要素と呼ばれる基準図形GEを、画像Gの画素値の小さい方から外接させながら移動させて、基準図形GEの外周の最大値が通過する軌跡SCを得る(図2(b))。この軌跡SCは、元の画像Gに含まれる構造成分に相当する。さらに、画像Gから軌跡(構造成分)SCを差し引くことにより、テクスチャ成分TCを得ることができる(図2(c))。 FIG. 2 is a diagram for explaining a method of acquiring a texture component by a morphology opening process. In the opening process of morphology, first, for an image G in a three-dimensional space in which the pixel value of each pixel on the xy plane constituting the two-dimensional image is regarded as an altitude (z axis) (FIG. 2A), the structure the reference graphic G E called element, is moved while being circumscribed from the smallest pixel value of the image G, the maximum value of the outer periphery of the reference graphic G E to obtain a trajectory SC passing (Figure 2 (b)). The trajectory SC corresponds to a structural component included in the original image G. Furthermore, the texture component TC can be obtained by subtracting the trajectory (structural component) SC from the image G (FIG. 2C).
図3は、粘膜領域からテクスチャ成分を取得したシミュレーション結果を示す。図3に示すように、粘膜領域の画像GM(図3(a))から、オープニング処理により得られた構造成分SCM(図3(b))を差し引くことにより、粘膜領域のテクスチャ成分TCM(図3(c))が取得される。図3(c)に示すように、粘膜領域のテクスチャ成分TCMは、比較的均質な性状となる。 FIG. 3 shows a simulation result of acquiring a texture component from the mucous membrane region. As shown in FIG. 3, by subtracting the structural component SC M (FIG. 3B) obtained by the opening process from the image G M of the mucosa region (FIG. 3A), the texture component TC of the mucosa region is subtracted. M (FIG. 3C) is acquired. As shown in FIG. 3 (c), the texture component TC M mucosal region, a relatively homogeneous properties.
一方、図4は、残渣領域からテクスチャ成分を取得したシミュレーション結果を示す。図4に示すように、粘膜領域の画像GR(図4(a))から、オープニング処理により得られた構造成分SCR(図4(b))を差し引くことにより、残渣領域のテクスチャ成分TCR(図4(c))が取得される。図4(c)に示すように、残渣領域のテクスチャ成分TCRは、凹凸に富んだ非均質な性状となる。 On the other hand, FIG. 4 shows a simulation result obtained by acquiring a texture component from the residue region. As shown in FIG. 4, the image G R mucosal region (FIG. 4 (a)), by subtracting the structural component obtained by opening process SC R (FIG. 4 (b)), the texture component of the residue area TC R (FIG. 4C) is acquired. As shown in FIG. 4 (c), the texture component TC R of residue area is a non-homogeneous nature rich irregularities.
なお、テクスチャ成分の取得方法としては、上記説明以外にも、既知の様々な方法を用いることができる。例えば、消化管内画像にフーリエ変換を施し、ハイパスフィルタ処理を行って低周波成分をカットする。それによって得られた画像に逆フーリエ変換を施すことにより、テクスチャ成分を取得しても良い。 In addition to the above description, various known methods can be used as the texture component acquisition method. For example, the image in the digestive tract is subjected to Fourier transform, and high-pass filter processing is performed to cut low frequency components. The texture component may be acquired by performing inverse Fourier transform on the image obtained thereby.
偏り評価値算出部18は、座標空間上におけるテクスチャ成分の均質性を示す評価値を算出する。具体的には、偏り評価値算出部18は、座標重心距離算出部181を備える。座標重心距離算出部181は、評価領域の内部において、座標重心と、テクスチャ成分の画素値(輝度)で重み付けした座標重心との間の距離を、均質性を示す評価値として算出する。 The bias evaluation value calculation unit 18 calculates an evaluation value indicating the homogeneity of the texture component on the coordinate space. Specifically, the bias evaluation value calculation unit 18 includes a coordinate centroid distance calculation unit 181. The coordinate centroid distance calculation unit 181 calculates the distance between the coordinate centroid and the coordinate centroid weighted by the pixel value (luminance) of the texture component as an evaluation value indicating homogeneity within the evaluation region.
判別部19は、偏り評価値算出部18により算出された評価値に基づいて、評価領域のカテゴリを判別する。具体的には、判別部19は、評価値がテクスチャ成分の均質性を示す場合、評価領域は粘膜領域であると判別する(図3(c)参照)。一方、判別部19は、評価値がテクスチャ成分の均質性を示さない場合、評価領域は残渣領域であると判別する(図4(c)参照)。評価値がテクスチャ成分の均質性を示すか否かは、当該評価値が所定の範囲に含まれるか否かによって判定される。
The
制御部10は、CPU等のハードウェアによって実現され、記録部14に格納された各種プログラムを読み込むことにより、画像取得部11から入力される画像データや入力部12から入力される操作信号等に従って、画像処理装置1を構成する各部への指示やデータの転送等を行い、画像処理装置1全体の動作を統括的に制御する。
The
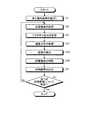
次に、画像処理装置1の動作について、図5を参照しながら説明する。図5は、画像処理装置1による粘膜領域と残渣領域とを判別する画像処理の動作を示すフローチャートである。また、以下においては、図6に示す消化管内画像に対する画像処理を例として説明する。図6に示すように、消化管内画像100を含む一連の消化管内画像群には、粘膜領域101を主として、時に残渣領域102や、病変領域103等が映されている。
Next, the operation of the
画像処理装置1に取り込まれた消化管内画像群の画像データが記録部14に格納されると、演算部15は、記録部14から処理対象の消化管内画像100を読み出す(ステップS1)。
When the image data of the gastrointestinal tract image group taken into the
ステップS2において、評価領域設定部16は、消化管内画像100に対して評価領域を設定する。具体的には、評価領域設定部16は、図7に示すように消化管内画像100を複数の矩形領域に分割し、各領域を順次評価領域105に設定する。なお、図7においては消化管内画像100を16個の領域に分割しているが、分割する数や、各領域の大きさ及び形状はこれに限定されず、所望に設定して良い。例えば、1つ又は数画素分の領域を1つの評価領域に設定しても良いし、消化管内画像100全体(即ち、分割しない)を1つの評価領域に設定しても良い。
In step S <b> 2, the evaluation
ステップS3において、テクスチャ成分取得部17は、消化管内画像100及び評価領域105を表す情報(例えば、座標情報)を受け取り、評価領域105内の消化管内画像から構造成分106を除去することにより、テクスチャ成分を取得する。
In step S <b> 3, the texture component acquisition unit 17 receives information (for example, coordinate information) representing the
ステップS4において、座標重心距離算出部181は、評価領域105におけるテクスチャ成分の均質性を示す評価値(以下、単に「評価値」ともいう)として、評価領域105内部の座標重心と、評価領域105内部をテクスチャ成分の画素値で重み付けした座標重心との間の距離である座標重心距離を算出する。
In step S <b> 4, the coordinate centroid distance calculation unit 181 uses the coordinate centroid within the
図8は、テクスチャ成分の均質性を示す評価値の算出処理を示すフローチャートである。まず、ステップS11において、座標重心距離算出部181は、評価領域設定部16から、評価領域105を表す情報(例えば、座標情報)を取得すると共に、テクスチャ成分取得部17から評価領域105のテクスチャ成分を取得する。
FIG. 8 is a flowchart showing processing for calculating an evaluation value indicating the homogeneity of texture components. First, in step S <b> 11, the coordinate centroid distance calculation unit 181 acquires information (for example, coordinate information) representing the
ステップS12において、座標重心距離算出部181は、式(1)を用いて評価領域105内に含まれる画素の座標重心(gx,gy)を算出する。

ステップS13において、座標重心距離算出部181は、式(2)を用いて評価領域105内に含まれる画素をテクスチャ成分の画素値で重み付けした座標重心(Gx,Gy)を算出する。
さらに、ステップS14において、ステップS12及びS13の算出結果及び式(3)を用いて、座標重心距離DG-gを算出する。
ここで、テクスチャ成分が均質である場合、重み付けした座標重心(Gx,Gy)は、座標重心(gx,gy)とほぼ一致するため、座標重心距離DG-gの値は小さくなる。一方、テクスチャ成分が均質でない場合、重み付けした座標重心(Gx,Gy)が座標重心(gx,gy)から離れるため、座標重心距離DG-gの値は大きくなる。 Here, when the texture components are homogeneous, the weighted coordinate centroid (G x , G y ) substantially coincides with the coordinate centroid (g x , g y ), and thus the value of the coordinate centroid distance D Gg becomes small. On the other hand, when the texture components are not homogeneous, the weighted coordinate centroid (G x , G y ) is separated from the coordinate centroid (g x , g y ), and thus the value of the coordinate centroid distance D Gg increases.
座標重心距離算出部181は、上記ステップS11〜S14の処理により算出された座標重心距離DG-gを、テクスチャ成分の均質性を示す評価値として判別部19に出力する。
The coordinate center-of-gravity distance calculation unit 181 outputs the coordinate center-of-gravity distance D Gg calculated by the processes in steps S11 to S14 to the
ステップS5において、判別部19は、座標重心距離算出部181により算出された座標重心距離DG-gを評価値として、評価領域105のカテゴリを判別する。具体的には、判別部19は、まず、評価値を予め設定された所定の閾値と比較する。そして、この評価値が所定の閾値より小さい場合、テクスチャ成分は均質であり、評価領域105は粘膜領域であると判別する。一方、評価値が所定の閾値以上である場合、判別部19は、テクスチャ成分は非均質であり、評価領域105は残渣領域であると判別する。さらに、判別部19は、評価領域105の判別結果を出力して表示部13に表示させると共に、この判別結果を記録部14に記録させる(ステップS6)。
In
カテゴリの判別が終了していない評価領域105が残っている場合(ステップS7:No)、動作はステップS2に移行する。一方、全ての評価領域105について判別処理が実行されると(ステップS7:Yes)、消化管内画像100に対する画像処理の動作は終了する。
When the
以上説明したように、実施の形態1によれば、評価領域におけるテクスチャ成分の均質性に着目して、評価領域が粘膜領域であるか残渣領域であるかを判別する。従って、様々な大きさや形状を取り得る判別対象領域(評価領域)に対し、処理時間の速いアルゴリズムで、且つ撮影条件に影響されることなく適切にカテゴリを判別することが可能となる。また、実施の形態1によれば、テクスチャ成分の均質性を示す評価値として座標重心距離を算出するので、簡単な演算処理でテクスチャ成分の均質性を判定することが可能となる。 As described above, according to the first embodiment, whether the evaluation area is a mucosal area or a residue area is determined by paying attention to the homogeneity of the texture components in the evaluation area. Therefore, it is possible to appropriately determine a category for a determination target region (evaluation region) that can take various sizes and shapes by using an algorithm with a fast processing time and without being affected by imaging conditions. Further, according to the first embodiment, the coordinate centroid distance is calculated as an evaluation value indicating the homogeneity of the texture component, so that it is possible to determine the homogeneity of the texture component with a simple arithmetic process.
(変形例1−1)
評価領域の設定(ステップS2)は、上述した方法以外にも様々な方法で行うことができる。例えば、消化管内画像を色特徴量ごとに分割し(特許文献1参照)、分割された各領域を評価領域としても良い。或いは、動的輪郭法(snakes法)により抽出された閉曲線の内部を1つの評価領域としても良い。動的輪郭法とは、初期値として与えられた閉曲線の形状を変形させながら、閉曲線の連続性や滑らかさ、閉曲線上でのエッジ強度に基づくエネルギー和が最も安定するような閉曲線を抽出するものである(参考:CG−ARTS協会、ディジタル画像処理、p.197〜p.199)。
(Modification 1-1)
The setting of the evaluation area (step S2) can be performed by various methods other than the method described above. For example, the image in the digestive tract may be divided for each color feature amount (see Patent Document 1), and each divided area may be set as an evaluation area. Alternatively, the inside of the closed curve extracted by the dynamic contour method (snakes method) may be used as one evaluation region. The dynamic contour method extracts a closed curve that stabilizes the energy sum based on the continuity and smoothness of the closed curve and the edge strength on the closed curve while deforming the shape of the closed curve given as the initial value. (Reference: CG-ARTS Association, Digital Image Processing, p. 197 to p. 199).
(変形例1−2)
テクスチャ成分の画素値で重み付けした座標重心を算出する際には(ステップS13)、全ての画素を画素値で重み付けするのではなく、所定の条件を満たす画素のみを重み付けしても良い。具体的には、評価領域内における画素値の最大値に対し、所定の割合(例えば50%)以上の画素値を有する画素を重み付けする。或いは、テクスチャ成分の連続分布において画素値がピークとなる画素(即ち、一次微分がゼロ、且つ二次微分が負となる画素)のみに対して重み付けしても良い。それにより、テクスチャ成分が非均質の場合、通常の座標重心(gx,gy)と重み付けした座標重心(Gx,Gy)との乖離がさらに顕著となるので、粘膜領域と残渣領域との判別がより簡単になる。
(Modification 1-2)
When calculating the coordinate centroid weighted by the pixel value of the texture component (step S13), not all pixels may be weighted by pixel values, but only pixels that satisfy a predetermined condition may be weighted. Specifically, pixels having a pixel value equal to or higher than a predetermined ratio (for example, 50%) are weighted with respect to the maximum pixel value in the evaluation region. Alternatively, weighting may be applied only to pixels whose pixel values have a peak in the continuous distribution of texture components (that is, pixels whose primary differentiation is zero and whose secondary differentiation is negative). Thereby, when the texture component is non-homogeneous, the difference between the normal coordinate centroid (g x , g y ) and the weighted coordinate centroid (G x , G y ) becomes more prominent. The discrimination becomes easier.
(実施の形態2)
次に、本発明の実施の形態2に係る画像処理装置について説明する。
図9は、実施の形態2に係る画像処理装置の構成を示すブロック図である。図9に示す画像処理装置2は、演算部20を備える。演算部20は、評価値算出手段としての偏り評価値算出部21と、偏り評価値算出部21の算出結果に基づいて評価領域のカテゴリを判別する判別部22とを有する。本実施の形態2における演算部20は、評価領域のテクスチャ成分を連続分布から離散分布に変換し、この離散分布に基づいてテクスチャ成分の均質性を示す評価値を算出することを特徴とする。その他の構成は、図1に示すものと同様である。
(Embodiment 2)
Next, an image processing apparatus according to
FIG. 9 is a block diagram illustrating a configuration of the image processing apparatus according to the second embodiment. The
偏り評価値算出部21は、離散分布算出部211及び均質性評価値算出部212を有する。離散分布算出部211は、連続分布で表されたテクスチャ成分から、複数の離散点からなる離散分布データを生成する。均質性評価値算出部212は、この離散分布データから、テクスチャ成分の均質性を示す評価値を算出する。判別部22は、この評価値からテクスチャ成分の均質性を判定し、さらに、この判定結果に基づいて、評価領域が粘膜領域であるか又は残渣領域であるかの判別を行う。
The bias evaluation
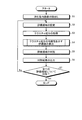
次に、画像処理装置2の動作について、図10〜図12を参照しながら説明する。図10は、画像処理装置2の動作を示すフローチャートである。なお、ステップS1〜S3、S6、及びS7の動作は、実施の形態1において説明したものと同様である。
Next, the operation of the
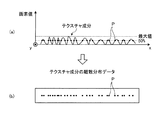
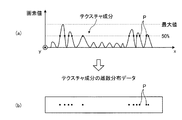
ステップS21において、離散分布算出部211は、連続分布で表されたテクスチャ成分から離散分布データを生成する。図11は、粘膜領域におけるテクスチャ成分を表す離散分布データを生成する処理を説明する図である。図12は、残渣領域におけるテクスチャ成分を表す離散分布データを生成する処理を説明する図である。具体的には、離散分布算出部211は、評価領域設定部16から評価領域を表す情報(座標情報)を受け取ると共に、テクスチャ成分取得部17から連続分布で表されたテクスチャ成分を受け取り、評価領域内における画素値の最大値を取得する(図11(a)、図12(a))。
In step S21, the discrete distribution calculation unit 211 generates discrete distribution data from the texture components represented by the continuous distribution. FIG. 11 is a diagram for explaining processing for generating discrete distribution data representing texture components in the mucous membrane region. FIG. 12 is a diagram for explaining processing for generating discrete distribution data representing texture components in the residue region. Specifically, the discrete distribution calculation unit 211 receives information (coordinate information) representing the evaluation region from the evaluation
続いて、離散分布算出部211は、画素値の最大値に対する所定の割合の値(以下、サンプリング値という)を取得する。図11(a)及び図12(a)においては、一例として、サンプリング値を最大値の50%としている。さらに、離散分布算出部211は、サンプリング値と同じ画素値を有する画素(座標)を抽出し、これらの画素を、離散分布を構成する点(離散点P)として離散分布データを生成する(図11(b)、図12(b))。 Subsequently, the discrete distribution calculation unit 211 acquires a predetermined ratio value (hereinafter referred to as a sampling value) with respect to the maximum pixel value. In FIG. 11A and FIG. 12A, as an example, the sampling value is 50% of the maximum value. Further, the discrete distribution calculation unit 211 extracts pixels (coordinates) having the same pixel value as the sampling value, and generates discrete distribution data using these pixels as points (discrete points P) constituting the discrete distribution (see FIG. 11 (b), FIG. 12 (b)).
ステップS22において、均質性評価値算出部212は、離散分布算出部211により生成された離散分布データに基づいて、テクスチャ成分の均質性を示す評価値を算出する。その際に、均質性評価値算出部212は、所謂空間解析法を用いる。空間解析法は、離散分布データを「分散型」又は「集中型」に分類する方法である。実施の形態2においては、空間解析法の一例として、離散点P間の距離に基づいて離散点Pの分布を解析する最近隣距離法を用いる方法を説明する。
In step S <b> 22, the homogeneity evaluation
まず、図13に示すように、離散分布データを構成する各離散点Pi(i=1〜n)から最も近い別の離散点までの距離diを求める。そして、これらの距離diの平均である平均最近隣距離Wを、式(4)を用いて算出する。
図14は、評価領域A1における離散点Pのばらつき(分散又は集中)と、そのときの平均最近隣距離Wとの関係を示す図である。離散点Pが評価領域A1のほぼ1箇所に集中している場合(図14(a))、平均最近隣距離Wは比較的小さい値となる(W=W1)。また、離散点Pの集中箇所が増加すると(図14(b))、平均最近隣距離Wは若干大きくなる(W=W2>W1)。例えば、図14(b)において、離散点Pは評価領域A1の2箇所に集中している。これらの場合の平均最近隣距離の値W1、W2は、例えば図12(b)のように、テクスチャ成分の分布が非均一であることを示す。一方、離散点Pが評価領域A1の全体に広がっている場合(図14(c))、平均最近隣距離Wは大きくなる(W=W3>W2)。このような場合の平均最近隣距離の値W3は、例えば図11(b)のように、テクスチャ成分が均一であることを示す。 FIG. 14 is a diagram showing the relationship between the variation (dispersion or concentration) of the discrete points P in the evaluation area A1 and the average nearest neighbor distance W at that time. When the discrete points P are concentrated at almost one place in the evaluation area A1 (FIG. 14A), the average nearest neighbor distance W is a relatively small value (W = W 1 ). Further, when the number of points where the discrete points P are concentrated increases (FIG. 14B), the average nearest neighbor distance W slightly increases (W = W 2 > W 1 ). For example, in FIG. 14B, the discrete points P are concentrated at two places in the evaluation area A1. The average nearest neighbor distance values W 1 and W 2 in these cases indicate that the distribution of the texture components is non-uniform as shown in FIG. On the other hand, when the discrete points P are spread over the entire evaluation area A1 (FIG. 14C), the average nearest neighbor distance W becomes large (W = W 3 > W 2 ). The average value W 3 of nearest neighbor distances is the case, for example, as shown in FIG. 11 (b), the show that the texture component is uniform.
続くステップS23において、判別部22は、均質性評価値算出部212により算出された評価値(平均最近隣距離W)に基づいて、テクスチャ成分の均質性及び評価領域のカテゴリを判別する。具体的には、判別部22は、式(5)により算出される期待値E[W]を閾値として、評価値の均質性を判定する。式(5)に示す期待値E[W]は、離散分布データにおいて離散点Pがランダムに分布していると仮定した場合の期待値である。
これより、テクスチャ成分の均質性は以下のように判定される。
W<E[W] :均質である
W≧E[W] :均質でない
From this, the homogeneity of the texture component is determined as follows.
W <E [W]: homogeneous W ≧ E [W]: not homogeneous
さらに、判別部21は、テクスチャ成分が均質である場合、評価領域は粘膜領域であると判別する。一方、テクスチャ成分が均質でない場合、評価領域は残渣領域であると判別する。
Furthermore, when the texture component is homogeneous, the
以上説明したように、実施の形態2によれば、テクスチャ成分を表す離散分布データに基づいて、テクスチャ成分の均質性及び評価領域のカテゴリを判別するので、トータルの演算量を低減して、より短時間で判別結果を得ることができる。 As described above, according to the second embodiment, since the homogeneity of the texture component and the category of the evaluation region are determined based on the discrete distribution data representing the texture component, the total calculation amount can be reduced and more A discrimination result can be obtained in a short time.
なお、離散分布データに基づく評価値の算出(ステップS22)は、上述した方法以外にも様々な方法で行うことができる。以下に、離散分布データに基づく評価値の別の算出方法の例を変形例2−1〜2−3として説明する。 The calculation of the evaluation value based on the discrete distribution data (step S22) can be performed by various methods other than the method described above. Below, the example of another calculation method of the evaluation value based on discrete distribution data is demonstrated as modification 2-1 to 2-3.
(変形例2−1)K−関数法による評価値の算出
K−関数法は、最近隣距離法では判別が困難な分布を識別するために開発された方法である。K−関数法による評価値K(h)は、式(6)により算出される。
このような評価値K(h)を用いる場合、テクスチャ分布の均質性の判定及び評価領域のカテゴリの判別は以下のように行われる。
まず、式(7)により、K−関数の期待値E[K(h)]を算出する。
![]()
First, the expected value E [K (h)] of the K-function is calculated by Equation (7).
![]()
テクスチャ分布の均質性は、この期待値E[K(h)]を閾値として以下のように判定される。
K(h)<E[K(h)] :均質である
K(h)≧E[K(h)] :均質でない
これより、テクスチャ成分が均質である場合、評価領域は粘膜領域であると判別される。一方、テクスチャ成分が均質でない場合、評価領域は残渣領域と判別される。
The homogeneity of the texture distribution is determined as follows using the expected value E [K (h)] as a threshold value.
K (h) <E [K (h)]: homogeneous K (h) ≧ E [K (h)]: non-homogeneous From this, when the texture component is homogeneous, the evaluation area is a mucosal area. Determined. On the other hand, when the texture component is not homogeneous, the evaluation area is determined as a residue area.
(変形例2−2)χ2検定による評価値の算出
図16に示す評価領域A3について評価する場合、まず、評価領域A3を、形状及び面積の等しい複数の領域(例えば矩形領域)Bに分割することを想定する。評価領域A3に離散点Pが均等に分布していると仮定すると、各領域Bに含まれる離散点Pの生起確率は一定となる。例えば、図16(a)においては、各領域Bに1つの離散点Pが等しい確率で存在している。一方、図16(b)に示すように、離散点Pの分布に偏りがある場合、各領域Bにおける離散点Pの生起確率は異なってくる。従って、離散点Pが均等であると仮定した場合の離散点Pの生起確率と、実際の離散点Pの生起確率との乖離の度合いを求めれば、この乖離の度合いをテクスチャ成分の均質性を示す評価値として利用することができる。
(Modification 2-2) Calculation of Evaluation Value by χ 2 Test When evaluating the evaluation area A3 shown in FIG. 16, first, the evaluation area A3 is divided into a plurality of areas (for example, rectangular areas) B having the same shape and area. Assuming that Assuming that the discrete points P are evenly distributed in the evaluation region A3, the occurrence probability of the discrete points P included in each region B is constant. For example, in FIG. 16A, one discrete point P exists in each region B with an equal probability. On the other hand, as shown in FIG. 16B, when the distribution of the discrete points P is biased, the occurrence probabilities of the discrete points P in each region B are different. Therefore, if the degree of divergence between the occurrence probability of the discrete points P and the actual occurrence probability of the discrete points P when the discrete points P are assumed to be equal is obtained, the degree of divergence can be expressed as the homogeneity of the texture component. It can be used as an evaluation value to be shown.
χ2検定は、j番目の領域Bjに離散点Pが入る確率をPRjとした場合、該確率による理論値と、n個の離散点Pの実際の分布とが一致するか否かを検定する方法である。χ2検定を用いてテクスチャ成分の均質性を判定する際には、全ての領域Bの生起確率PRをPR=1/M(Mは矩形領域Cの数)として、式(8)によりχ2を算出する。
上式(8)により算出されたχ2が、テクスチャ分布の均質性を示す評価値として用いられる。即ち、χ2が所定の閾値より小さい場合(即ち、上記乖離の度合いが小さい場合)、テクスチャ分布は均一と判定される。この場合、評価領域は粘膜領域であると判別される。一方、χ2が所定の閾値以上の場合(即ち、上記乖離の度合いが大きい場合)、テクスチャ成分は非均一であると判定される。この場合、評価領域は残渣領域であると判別される。 Χ 2 calculated by the above equation (8) is used as an evaluation value indicating the homogeneity of the texture distribution. That is, when χ 2 is smaller than a predetermined threshold (that is, when the degree of deviation is small), it is determined that the texture distribution is uniform. In this case, the evaluation area is determined to be a mucosal area. On the other hand, when χ 2 is greater than or equal to a predetermined threshold (that is, when the degree of deviation is large), it is determined that the texture component is non-uniform. In this case, it is determined that the evaluation area is a residue area.
(変形例2−3)多様度指数による評価値の算出
図16(a)に示すように、評価領域A3に離散点Pが均等に分布している場合、離散点Pを含む領域Bの数が多くなる。一方、図16(b)に示すように、離散点Pの分布に偏りがある場合、離散点Pを含まない領域Bは増加する。従って、複数の領域Bへの離散点Pの分布の度合いを求めれば、この度合いをテクスチャ成分の均質性を示す評価値として利用することができる。
(Modification 2-3) Calculation of Evaluation Value Using Diversity Index As shown in FIG. 16A, when the discrete points P are evenly distributed in the evaluation region A3, the number of regions B including the discrete points P Will increase. On the other hand, as shown in FIG. 16B, when the distribution of the discrete points P is biased, the region B that does not include the discrete points P increases. Therefore, if the degree of distribution of the discrete points P in the plurality of regions B is obtained, this degree can be used as an evaluation value indicating the homogeneity of the texture components.
複数の領域Bへの離散点Pの分布の度合いを算出する手段としては、例えば多様度指数が用いられる。多様度指数は、群集(N)の中に種類(M)がどの程度豊富に含まれるかを評価する指標である。具体的には、種類(M)として領域Bの個数を用い、式(9)を用いてシンプソン(Simpson)の多様度指数Dを算出する。
このような多様度指数Dを用いる場合、テクスチャ分布の均質性の判定及び評価領域のカテゴリの判別は次のように行われる。即ち、多様度指数Dが所定の閾値より大きい場合(即ち、離散点Pの分布が多様である場合)、テクスチャ分布は均一であり、評価領域は粘膜領域であると判別される。一方、多様度指数Dが所定の閾値以下の場合(即ち、離散点Pの分布が偏っている場合)、テクスチャ成分は非均一であり、評価領域は残渣領域であると判別される。 When such a diversity index D is used, the determination of the homogeneity of the texture distribution and the determination of the category of the evaluation area are performed as follows. That is, when the diversity index D is greater than a predetermined threshold (that is, when the distribution of the discrete points P is diverse), it is determined that the texture distribution is uniform and the evaluation area is a mucosal area. On the other hand, when the diversity index D is equal to or less than a predetermined threshold (that is, when the distribution of the discrete points P is biased), it is determined that the texture component is non-uniform and the evaluation area is a residue area.
或いは、複数の領域Bへの離散点Pの分布の度合いとして、式(10)によるシャノン(Shannon)指数H’を算出しても良い。
この場合、シャノン指数H’が所定の閾値より大きい場合、テクスチャ分布は均一であり、評価領域は粘膜領域であると判別される。一方、シャノン指数H’が所定の閾値より小さい場合、テクスチャ成分の分布は非均一であり、評価領域は残渣領域であると判別される。 In this case, when the Shannon index H ′ is larger than a predetermined threshold value, the texture distribution is uniform and the evaluation region is determined to be a mucosal region. On the other hand, when the Shannon index H ′ is smaller than the predetermined threshold, the texture component distribution is non-uniform, and the evaluation area is determined to be a residue area.
(実施の形態3)
次に、本発明の実施の形態3に係る画像処理装置について説明する。
図17は、実施の形態3に係る画像処理装置の構成を示すブロック図である。図17に示す画像処理装置3は、演算部30を備える。演算部30は、評価値算出手段としての歪み評価値算出部31と、歪み評価値算出部31の算出結果に基づいて評価領域のカテゴリを判別する判別部32とを有する。その他の構成は、図1に示すものと同様である。
(Embodiment 3)
Next, an image processing apparatus according to
FIG. 17 is a block diagram illustrating a configuration of the image processing apparatus according to the third embodiment. The
歪み評価値算出部31は、評価領域のテクスチャ成分について画素値(強度)の頻度分布を求め、この頻度分布の形状の歪みに基づいて、テクスチャ成分の均質性を示す評価値を算出する。判別部32は、この評価値からテクスチャ成分の均質性を判定し、さらに、この判定結果に基づいて、評価領域が粘膜領域であるか又は残渣領域であるかの判別を行う。
The distortion evaluation
ここで、図18及び図19を参照しながら、実施の形態3におけるカテゴリの判別原理について説明する。図18(a)及び図19(a)において、横軸は、評価領域に含まれる画素のx座標を示し、縦軸は、画素値Iと評価領域における画素値の平均μとの差分I’を示す。また、図18(b)及び図19(b)において、横軸は画素値Iと平均μとの差分I’を示し、縦軸は差分I’の頻度を示す。 Here, the principle of category discrimination in the third embodiment will be described with reference to FIGS. In FIG. 18A and FIG. 19A, the horizontal axis indicates the x coordinate of the pixels included in the evaluation region, and the vertical axis indicates the difference I ′ between the pixel value I and the average μ of the pixel values in the evaluation region. Indicates. In FIGS. 18B and 19B, the horizontal axis indicates the difference I ′ between the pixel value I and the average μ, and the vertical axis indicates the frequency of the difference I ′.
図18(a)は、粘膜領域のテクスチャ成分の特性を示す。粘膜領域において、テクスチャ成分の画素値は比較的均一になっている。このようなテクスチャ成分についてヒストグラムを作成する場合、ヒストグラムは、平均値(I’=0)を中心に左右対称の歪みの少ない形状となる(図18(b))。一方、図19(a)は、残渣領域のテクスチャ成分の特性を示す。残渣領域において、テクスチャ成分の画素値には大きなバラツキが見られる。このようなテクスチャ成分についてヒストグラムを作成する場合、ヒストグラムに歪みが生じる(図19(b))。そこで、テクスチャ成分の画素値のヒストグラムについての対称性(歪み)を求めることにより、テクスチャ成分の均質性を判定することができ、この均一性に基づいて評価領域が粘膜領域か残渣領域であるかを判別することができる。 FIG. 18A shows the characteristics of the texture component of the mucosal area. In the mucous membrane region, the pixel values of the texture component are relatively uniform. When a histogram is created for such a texture component, the histogram has a shape with little distortion left and right symmetrical about the average value (I ′ = 0) (FIG. 18B). On the other hand, FIG. 19A shows the characteristics of the texture component in the residue region. In the residue region, there is a large variation in the pixel values of the texture component. When a histogram is created for such a texture component, distortion occurs in the histogram (FIG. 19B). Therefore, the homogeneity of the texture component can be determined by determining the symmetry (distortion) of the histogram of the pixel values of the texture component. Based on this uniformity, whether the evaluation region is the mucosal region or the residue region Can be determined.
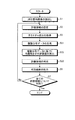
次に、画像処理装置3の動作について説明する。図20は、画像処理装置3の動作を示すフローチャートである。なお、ステップS1〜S3、S6、及びS7の動作は、実施の形態1において説明したものと同様である。
Next, the operation of the
まず、ステップS31において、歪み評価値算出部31は、テクスチャ成分取得部17からテクスチャ成分を取得し、画素値の頻度分布を算出する。
First, in step S31, the distortion evaluation
続くステップS32において、歪み評価値算出部31は、式(11)を用い、ステップS31において求めた頻度分布の対称性を示す評価値として、歪度(Skewness)Skを算出する。
歪度Skは、データ(画素値Ii)が平均値(平均μ)に対して非対称に分布している度合いを示す値である。頻度分布に歪みがない場合(即ち、正規分布)、歪度Skはゼロとなり、歪みが大きくなるほど、歪度Skはゼロから離れる。なお、頻度分布がI’<0側に偏っている場合(例えば、図19(a)に示す場合)、Sk<0となる。一方、頻度分布がI’>0側に偏っている場合、Sk>0となる。 The skewness Sk is a value indicating the degree to which the data (pixel value I i ) is distributed asymmetrically with respect to the average value (average μ). When there is no distortion in the frequency distribution (that is, a normal distribution), the skewness Sk becomes zero, and as the distortion increases, the skewness Sk departs from zero. When the frequency distribution is biased toward I ′ <0 (for example, as shown in FIG. 19A), Sk <0. On the other hand, if the frequency distribution is biased toward I ′> 0, Sk> 0.
ステップS33において、判別部32は、歪み評価値算出部31によって算出された評価値(歪度)に基づいて、テクスチャ成分の均質性及び評価領域のカテゴリを判別する。具体的には、判別部32は、式(11)により算出される歪度Skを予め取得された所定の閾値Thresh1及びThresh2と比較することにより、以下のとおりテクスチャ成分の均質性を判定する。
Thresh1<Sk<Thresh2 :均質である
Thresh1≧Sk、又は、Thresh2≦Sk :均質でない
In step S <b> 33, the
Thresh1 <Sk <Thresh2: homogeneous
Thresh1 ≧ Sk or Thresh2 ≦ Sk: not homogeneous
さらに、判別部32は、テクスチャ成分が均質である場合、評価領域は粘膜領域であると判別する。一方、テクスチャ成分が均質でない場合、評価領域は残渣領域であると判別する。
Furthermore, when the texture component is homogeneous, the
以上説明したように、実施の形態3によれば、画素値の頻度分布に基づいて、テクスチャ成分の均質性及び評価領域のカテゴリを判別するので、処理時間の速いアルゴリズムで判別結果を得ることができる。 As described above, according to the third embodiment, the homogeneity of the texture component and the category of the evaluation region are determined based on the frequency distribution of the pixel values, so that the determination result can be obtained with an algorithm having a fast processing time. it can.
以上の実施の形態1〜3においてそれぞれ説明した画像処理装置1〜3は、予め用意されたプログラムをパーソナルコンピュータやワークステーション等のコンピュータシステムで実行することによって実現することができる。以下、画像処理装置1〜3と同様の機能を有し、記録部14に格納された画像処理プログラム141を実行するコンピュータシステムについて説明する。
The
図21は、コンピュータシステム4を示すシステム構成図である。また、図22は、図21に示す本体部41の構成を示すブロック図である。図21に示すように、コンピュータシステム4は、本体部41と、本体部41からの指示によって表示画面421に画像等の情報を表示するためのディスプレイ42と、このコンピュータシステム4に種々の情報を入力するためのキーボード43と、ディスプレイ42の表示画面421上の任意の位置を指定するためのマウス44とを備える。
FIG. 21 is a system configuration diagram showing the
本体部41は、CPU411と、RAM412と、ROM413と、ハードディスクドライブ(HDD)414と、CD−ROM46を受け入れるCD−ROMドライブ415と、USBメモリ47を着脱可能に接続するUSBポート416と、ディスプレイ42、キーボード43、及びマウス44を接続するI/Oインタフェース417と、ローカルエリアネットワーク又は広域エリアネットワーク(LAN/WAN)N1に接続するためのLANインタフェース418とを備える。
The
さらに、コンピュータシステム4には、インターネット等の公衆回線N3に接続するためのモデム45が接続されるとともに、LANインタフェース418及びローカルエリアネットワーク又は広域エリアネットワークN1を介して、他のコンピュータシステムであるパーソナルコンピュータ(PC)5、サーバ6、プリンタ7等が接続される。
Further, a
コンピュータシステム4は、記録媒体に記録された画像処理プログラム(例えば図1に示す画像処理プログラム141)を読み出して実行することで、実施の形態1〜3において説明した画像処理装置1〜3を実現する。ここで、記録媒体とは、CD−ROM46やUSBメモリ47の他、MOディスクやDVDディスク、フレキシブルディスク(FD)、光磁気ディスク、ICカード等を含む「可搬用の物理媒体」、コンピュータシステム4の内外に備えられるHDD414やRAM412、ROM413等の「固定用の物理媒体」等、コンピュータシステム4によって読み取り可能な画像処理プログラムを記録するあらゆる記録媒体を含む。この意味で、モデム45を介して接続される公衆回線N3や、他のコンピュータシステムであるPC5やサーバ6が接続されるローカルエリアネットワーク又は広域エリアネットワークN1等のように、プログラムの送信に際して短期にプログラムを記憶する「通信媒体」等も記録媒体に含まれる。なお、画像処理プログラムは、コンピュータシステム4によって実行されることに限定されるものではなく、他のコンピュータシステムであるPC5やサーバ6が画像処理プログラムを実行する場合や、これらが協働して画像処理プログラムを実行するような場合にも、本発明を同様に適用することができる。
The
なお、本発明は、実施の形態1〜3及び各々の変形例に限定されるものではなく、各実施の形態や変形例に開示されている複数の構成要素を適宜組み合わせることによって、種々の発明を形成できる。例えば、各実施の形態や変形例に示される全構成要素からいくつかの構成要素を除外して形成しても良いし、異なる実施の形態や変形例に示した構成要素を適宜組み合わせて形成しても良い。 The present invention is not limited to the first to third embodiments and the respective modifications, and various inventions can be made by appropriately combining a plurality of constituent elements disclosed in the respective embodiments and modifications. Can be formed. For example, some constituent elements may be excluded from all the constituent elements shown in each embodiment or modification, or may be formed by appropriately combining the constituent elements shown in different embodiments or modifications. May be.
1、2、3 画像処理装置
4 コンピュータシステム
5 パーソナルコンピュータ(PC)
6 サーバ
7 プリンタ
10 制御部
11 画像取得部
12 入力部
13 表示部
14 記録部
141 画像処理プログラム
15、20、30 演算部
16 評価領域設定部
17 テクスチャ成分取得部
18 偏り評価値算出部
181 座標重心距離算出部
19、22、32 判別部
21 偏り評価値算出部
211 離散分布算出部
212 均質性評価値算出部
31 歪み評価値算出部
41 本体部
42 ディスプレイ
43 キーボード
44 マウス
45 モデム
47 メモリ
100 消化管内画像
101 粘膜領域
102 残渣領域
103 病変領域
105 評価領域
106 構造成分
415 ドライブ
416 ポート
417 インタフェース
418 インタフェース
421 表示画面
N1 ローカルエリアネットワーク又は広域エリアネットワーク
N3 公衆回線
1, 2, 3
6 Server 7
Claims (15)
前記評価領域内の生体内画像からテクスチャ成分を取得するテクスチャ成分取得手段と、
前記テクスチャ成分の均質性を示す評価値を算出する評価値算出手段と、
前記評価値に基づいて、前記評価領域のカテゴリを判別する判別手段と、
を備え、
前記評価値算出手段は、画素の位置を表す座標の空間である座標空間上におけるテクスチャ成分の均質性を示す評価値を算出する偏り評価値算出部を備え、
前記判別手段は、前記評価値が、前記テクスチャ成分が均質であることを示す所定の範囲に含まれる場合、前記評価領域のカテゴリは粘膜領域であると判別することを特徴とする画像処理装置。 Evaluation region setting means for setting an evaluation region to be a category discrimination target in the in-vivo image;
Texture component acquisition means for acquiring a texture component from the in-vivo image in the evaluation region;
Evaluation value calculating means for calculating an evaluation value indicating the homogeneity of the texture component;
Discrimination means for discriminating the category of the evaluation area based on the evaluation value;
With
The evaluation value calculation means includes a bias evaluation value calculation unit that calculates an evaluation value indicating the homogeneity of texture components on a coordinate space that is a space of coordinates representing the position of a pixel ,
The image processing apparatus according to claim 1, wherein the determination unit determines that the category of the evaluation region is a mucosal region when the evaluation value is included in a predetermined range indicating that the texture component is homogeneous .
連続分布で表された前記テクスチャ成分から、複数の離散点からなる離散分布データを生成する離散分布算出部と、
前記複数の離散点の座標情報に基づいて、前記評価値を算出する均質性評価値算出部と、
を備えることを特徴とする請求項1に記載の画像処理装置。 The bias evaluation value calculation unit
A discrete distribution calculation unit that generates discrete distribution data including a plurality of discrete points from the texture component represented by a continuous distribution;
A homogeneity evaluation value calculation unit that calculates the evaluation value based on coordinate information of the plurality of discrete points;
The image processing apparatus according to claim 1, further comprising:
前記評価領域内の生体内画像からテクスチャ成分を取得するテクスチャ成分取得ステップと、
前記テクスチャ成分の均質性を示す評価値を算出する評価値算出ステップと、
前記評価値に基づいて、前記評価領域のカテゴリを判別する判別ステップと、
を含み、
前記評価値算出ステップは、画素の位置を表す座標の空間である座標空間上におけるテクスチャ成分の均質性を示す評価値を算出し、
前記判別ステップは、前記評価値が、前記テクスチャ成分が均質であることを示す所定の範囲に含まれる場合、前記評価領域のカテゴリは粘膜領域であると判別することを特徴とする画像処理方法。 An evaluation area setting step for setting an evaluation area to be a category discrimination target in the in-vivo image;
A texture component acquisition step of acquiring a texture component from the in-vivo image in the evaluation region;
An evaluation value calculating step for calculating an evaluation value indicating the homogeneity of the texture component;
A determination step of determining a category of the evaluation area based on the evaluation value;
Including
The evaluation value calculating step calculates an evaluation value indicating the homogeneity of the texture component on the coordinate space, which is a coordinate space representing the position of the pixel ,
The image processing method according to claim 1, wherein the determining step determines that the category of the evaluation area is a mucosal area when the evaluation value is included in a predetermined range indicating that the texture component is homogeneous .
Priority Applications (4)
| Application Number | Priority Date | Filing Date | Title |
|---|---|---|---|
| JP2010265795A JP5576775B2 (en) | 2010-11-29 | 2010-11-29 | Image processing apparatus, image processing method, and image processing program |
| US13/303,367 US8913806B2 (en) | 2010-11-29 | 2011-11-23 | Texture homogeneity based in-vivo image identifying device, method, and computer-readable recording device |
| EP11009363.0A EP2458555A3 (en) | 2010-11-29 | 2011-11-25 | Image processing device, image processing method, and image processing program |
| CN201110386605.5A CN102567988B (en) | 2010-11-29 | 2011-11-29 | Image processing apparatus and image processing method |
Applications Claiming Priority (1)
| Application Number | Priority Date | Filing Date | Title |
|---|---|---|---|
| JP2010265795A JP5576775B2 (en) | 2010-11-29 | 2010-11-29 | Image processing apparatus, image processing method, and image processing program |
Publications (3)
| Publication Number | Publication Date |
|---|---|
| JP2012115342A JP2012115342A (en) | 2012-06-21 |
| JP2012115342A5 JP2012115342A5 (en) | 2014-01-16 |
| JP5576775B2 true JP5576775B2 (en) | 2014-08-20 |
Family
ID=45507327
Family Applications (1)
| Application Number | Title | Priority Date | Filing Date |
|---|---|---|---|
| JP2010265795A Active JP5576775B2 (en) | 2010-11-29 | 2010-11-29 | Image processing apparatus, image processing method, and image processing program |
Country Status (3)
| Country | Link |
|---|---|
| US (1) | US8913806B2 (en) |
| EP (1) | EP2458555A3 (en) |
| JP (1) | JP5576775B2 (en) |
Cited By (1)
| Publication number | Priority date | Publication date | Assignee | Title |
|---|---|---|---|---|
| JP7157358B2 (en) | 2016-11-18 | 2022-10-20 | テイ・エス テック株式会社 | seat device |
Families Citing this family (10)
| Publication number | Priority date | Publication date | Assignee | Title |
|---|---|---|---|---|
| JP5214367B2 (en) * | 2008-08-08 | 2013-06-19 | 株式会社東芝 | Feature amount extraction device, feature amount extraction method, image processing device, and program |
| KR20120073887A (en) * | 2010-12-27 | 2012-07-05 | 삼성전자주식회사 | Image processing apparatus and method for porcessing image thereof |
| JP6062955B2 (en) * | 2012-11-16 | 2017-01-18 | パナソニック インテレクチュアル プロパティ コーポレーション オブ アメリカPanasonic Intellectual Property Corporation of America | Camera, camera system, and self-diagnosis method |
| JP6150617B2 (en) * | 2013-05-30 | 2017-06-21 | オリンパス株式会社 | Detection device, learning device, detection method, learning method, and program |
| JP6168878B2 (en) * | 2013-06-27 | 2017-07-26 | オリンパス株式会社 | Image processing apparatus, endoscope apparatus, and image processing method |
| WO2015118733A1 (en) * | 2014-02-10 | 2015-08-13 | オリンパス株式会社 | Wireless image transmission system and wireless image transmission method |
| CO7020178A1 (en) * | 2014-05-14 | 2014-08-11 | Leon Ricardo Antonio Mendoza | Method for automatic segmentation and quantification of body tissues |
| US10402696B2 (en) * | 2016-01-04 | 2019-09-03 | Texas Instruments Incorporated | Scene obstruction detection using high pass filters |
| JP6202177B1 (en) * | 2016-01-21 | 2017-09-27 | 東洋インキScホールディングス株式会社 | Electromagnetic shielding sheet and printed wiring board |
| CN106157294B (en) * | 2016-04-28 | 2019-02-19 | 中国人民解放军第一七五医院 | One kind knowing method for distinguishing and application for tumor in digestive tract endoscopic image |
Family Cites Families (9)
| Publication number | Priority date | Publication date | Assignee | Title |
|---|---|---|---|---|
| JP2001155019A (en) * | 1999-11-25 | 2001-06-08 | Olympus Optical Co Ltd | Similar image retrieving device |
| US7907759B2 (en) * | 2006-02-02 | 2011-03-15 | Wake Forest University Health Sciences | Cardiac visualization systems for displaying 3-D images of cardiac voxel intensity distributions with optional physician interactive boundary tracing tools |
| US7623690B2 (en) * | 2004-03-30 | 2009-11-24 | Carestream Health, Inc. | System and method for classifying in vivo images according to anatomical structure |
| JP2006218138A (en) * | 2005-02-14 | 2006-08-24 | Yoshihiro Sasaki | Filing of hi-vision digital endoscopic images and computer-aided diagnosing apparatus |
| EP1870020B1 (en) | 2005-04-13 | 2015-08-05 | Olympus Medical Systems Corp. | Image processing apparatus and image processing method |
| JP4624841B2 (en) * | 2005-04-13 | 2011-02-02 | オリンパスメディカルシステムズ株式会社 | Image processing apparatus and image processing method in the image processing apparatus |
| JP4616076B2 (en) * | 2005-05-19 | 2011-01-19 | オリンパスメディカルシステムズ株式会社 | Image display device |
| GB0705223D0 (en) * | 2007-03-19 | 2007-04-25 | Univ Sussex | Method, apparatus and computer program for analysing medical image data |
| JP5305850B2 (en) | 2008-11-14 | 2013-10-02 | オリンパス株式会社 | Image processing apparatus, image processing program, and image processing method |
-
2010
- 2010-11-29 JP JP2010265795A patent/JP5576775B2/en active Active
-
2011
- 2011-11-23 US US13/303,367 patent/US8913806B2/en not_active Expired - Fee Related
- 2011-11-25 EP EP11009363.0A patent/EP2458555A3/en not_active Withdrawn
Cited By (1)
| Publication number | Priority date | Publication date | Assignee | Title |
|---|---|---|---|---|
| JP7157358B2 (en) | 2016-11-18 | 2022-10-20 | テイ・エス テック株式会社 | seat device |
Also Published As
| Publication number | Publication date |
|---|---|
| EP2458555A2 (en) | 2012-05-30 |
| CN102567988A (en) | 2012-07-11 |
| US8913806B2 (en) | 2014-12-16 |
| JP2012115342A (en) | 2012-06-21 |
| EP2458555A3 (en) | 2013-07-31 |
| US20120134556A1 (en) | 2012-05-31 |
Similar Documents
| Publication | Publication Date | Title |
|---|---|---|
| JP5576775B2 (en) | Image processing apparatus, image processing method, and image processing program | |
| JP6998474B2 (en) | Computer classification of living tissue | |
| JP6265588B2 (en) | Image processing apparatus, operation method of image processing apparatus, and image processing program | |
| JP5576782B2 (en) | Image processing apparatus, image processing method, and image processing program | |
| JP5800468B2 (en) | Image processing apparatus, image processing method, and image processing program | |
| JP5980555B2 (en) | Image processing apparatus, operation method of image processing apparatus, and image processing program | |
| JP5851160B2 (en) | Image processing apparatus, operation method of image processing apparatus, and image processing program | |
| EP3095376B1 (en) | Endoscopic image diagnosis support system | |
| JP5830295B2 (en) | Image processing apparatus, operation method of image processing apparatus, and image processing program | |
| CN103945755B (en) | Image processing apparatus | |
| JP5442542B2 (en) | Pathological diagnosis support device, pathological diagnosis support method, control program for pathological diagnosis support, and recording medium recording the control program | |
| WO2015040990A1 (en) | Disease analysis device, control method, and program | |
| JP2007151645A (en) | Medical diagnostic imaging support system | |
| JP2012120799A (en) | Image processing apparatus, image processing method, and image processing program | |
| US20110299746A1 (en) | Image processing apparatus and medical image diagnosis apparatus | |
| JP5784751B2 (en) | Image processing apparatus, operation method of image processing apparatus, and image processing program | |
| JP2006346094A (en) | Method for outputting detected information and medical image processing system | |
| JP2006325640A (en) | Method of displaying abnormal shadow candidate and medical image processing system | |
| JP5800549B2 (en) | Image processing apparatus, operation method of image processing apparatus, and image processing program | |
| JP2006340835A (en) | Displaying method for abnormal shadow candidate, and medical image processing system | |
| JP2006334140A (en) | Display method of abnormal shadow candidate and medical image processing system | |
| ES2695178T3 (en) | Procedures for quantification and imaging of the ecotexture characteristic | |
| Lensink et al. | Segmentation of pulmonary opacification in chest ct scans of covid-19 patients | |
| JP2004209059A (en) | Abnormal shadow candidate detecting device | |
| JP2003310587A (en) | Display device for abnormal shadow detected result |
Legal Events
| Date | Code | Title | Description |
|---|---|---|---|
| A521 | Request for written amendment filed |
Free format text: JAPANESE INTERMEDIATE CODE: A523 Effective date: 20131125 |
|
| A621 | Written request for application examination |
Free format text: JAPANESE INTERMEDIATE CODE: A621 Effective date: 20131125 |
|
| A977 | Report on retrieval |
Free format text: JAPANESE INTERMEDIATE CODE: A971007 Effective date: 20140312 |
|
| A131 | Notification of reasons for refusal |
Free format text: JAPANESE INTERMEDIATE CODE: A131 Effective date: 20140408 |
|
| A521 | Request for written amendment filed |
Free format text: JAPANESE INTERMEDIATE CODE: A523 Effective date: 20140604 |
|
| TRDD | Decision of grant or rejection written | ||
| A01 | Written decision to grant a patent or to grant a registration (utility model) |
Free format text: JAPANESE INTERMEDIATE CODE: A01 Effective date: 20140624 |
|
| A61 | First payment of annual fees (during grant procedure) |
Free format text: JAPANESE INTERMEDIATE CODE: A61 Effective date: 20140704 |
|
| R151 | Written notification of patent or utility model registration |
Ref document number: 5576775 Country of ref document: JP Free format text: JAPANESE INTERMEDIATE CODE: R151 |
|
| S531 | Written request for registration of change of domicile |
Free format text: JAPANESE INTERMEDIATE CODE: R313531 |
|
| R350 | Written notification of registration of transfer |
Free format text: JAPANESE INTERMEDIATE CODE: R350 |
|
| R250 | Receipt of annual fees |
Free format text: JAPANESE INTERMEDIATE CODE: R250 |
|
| R250 | Receipt of annual fees |
Free format text: JAPANESE INTERMEDIATE CODE: R250 |
|
| R250 | Receipt of annual fees |
Free format text: JAPANESE INTERMEDIATE CODE: R250 |
|
| R250 | Receipt of annual fees |
Free format text: JAPANESE INTERMEDIATE CODE: R250 |
|
| R250 | Receipt of annual fees |
Free format text: JAPANESE INTERMEDIATE CODE: R250 |