JP5563580B2 - System and method for optimizing a scene - Google Patents
System and method for optimizing a scene Download PDFInfo
- Publication number
- JP5563580B2 JP5563580B2 JP2011530238A JP2011530238A JP5563580B2 JP 5563580 B2 JP5563580 B2 JP 5563580B2 JP 2011530238 A JP2011530238 A JP 2011530238A JP 2011530238 A JP2011530238 A JP 2011530238A JP 5563580 B2 JP5563580 B2 JP 5563580B2
- Authority
- JP
- Japan
- Prior art keywords
- scene
- attention
- visual
- objects
- robustness
- Prior art date
- Legal status (The legal status is an assumption and is not a legal conclusion. Google has not performed a legal analysis and makes no representation as to the accuracy of the status listed.)
- Expired - Fee Related
Links
Images


Classifications
-
- G—PHYSICS
- G06—COMPUTING; CALCULATING OR COUNTING
- G06T—IMAGE DATA PROCESSING OR GENERATION, IN GENERAL
- G06T11/00—2D [Two Dimensional] image generation
- G06T11/60—Editing figures and text; Combining figures or text
-
- G—PHYSICS
- G06—COMPUTING; CALCULATING OR COUNTING
- G06V—IMAGE OR VIDEO RECOGNITION OR UNDERSTANDING
- G06V10/00—Arrangements for image or video recognition or understanding
- G06V10/40—Extraction of image or video features
- G06V10/44—Local feature extraction by analysis of parts of the pattern, e.g. by detecting edges, contours, loops, corners, strokes or intersections; Connectivity analysis, e.g. of connected components
- G06V10/443—Local feature extraction by analysis of parts of the pattern, e.g. by detecting edges, contours, loops, corners, strokes or intersections; Connectivity analysis, e.g. of connected components by matching or filtering
- G06V10/449—Biologically inspired filters, e.g. difference of Gaussians [DoG] or Gabor filters
- G06V10/451—Biologically inspired filters, e.g. difference of Gaussians [DoG] or Gabor filters with interaction between the filter responses, e.g. cortical complex cells
- G06V10/454—Integrating the filters into a hierarchical structure, e.g. convolutional neural networks [CNN]
-
- G—PHYSICS
- G06—COMPUTING; CALCULATING OR COUNTING
- G06V—IMAGE OR VIDEO RECOGNITION OR UNDERSTANDING
- G06V10/00—Arrangements for image or video recognition or understanding
- G06V10/40—Extraction of image or video features
- G06V10/46—Descriptors for shape, contour or point-related descriptors, e.g. scale invariant feature transform [SIFT] or bags of words [BoW]; Salient regional features
- G06V10/462—Salient features, e.g. scale invariant feature transforms [SIFT]
-
- H—ELECTRICITY
- H04—ELECTRIC COMMUNICATION TECHNIQUE
- H04N—PICTORIAL COMMUNICATION, e.g. TELEVISION
- H04N9/00—Details of colour television systems
- H04N9/79—Processing of colour television signals in connection with recording
- H04N9/87—Regeneration of colour television signals
Landscapes
- Engineering & Computer Science (AREA)
- General Physics & Mathematics (AREA)
- Theoretical Computer Science (AREA)
- Physics & Mathematics (AREA)
- Multimedia (AREA)
- Computer Vision & Pattern Recognition (AREA)
- Evolutionary Computation (AREA)
- Artificial Intelligence (AREA)
- Health & Medical Sciences (AREA)
- Life Sciences & Earth Sciences (AREA)
- Biodiversity & Conservation Biology (AREA)
- Biomedical Technology (AREA)
- General Health & Medical Sciences (AREA)
- Molecular Biology (AREA)
- Signal Processing (AREA)
- Image Analysis (AREA)
- Processing Or Creating Images (AREA)
- User Interface Of Digital Computer (AREA)
Description
(関連出願の相互参照)
本出願は、米国特許仮出願第61/102625号(2008年10月3日に出願)の利益を主張する。
(Cross-reference of related applications)
This application claims the benefit of US Provisional Application No. 61 / 102,625 (filed Oct. 3, 2008).
(関連出願)
本出願はまた、米国特許仮出願第61/102618号(2008年10月3日に出願)及び同第61/102670号(2008年10月3日)に関連する。
(Related application)
This application is also related to US Provisional Patent Application Nos. 61/102618 (filed October 3, 2008) and 61/102670 (October 3, 2008).
ヒトの視覚的システムは、容量が限定されたシステムであり、そこでは、それは所与の時間で比較的少量のオブジェクトしか処理できない。いずれか所与の時間で見ることができる多くのオブジェクトが存在するという事実に反して、これは本当である。ヒトに見えるオブジェクトの配列から、ヒトの視覚的システムは、いずれか所与の時間で1つ(又は非常に少ない)オブジェクトに注意を払い、又はこれを処理する。ヒトが画像又はシーンを見るとき、彼の視覚的システムは1つのオブジェクトから別のものへと注意(及び思考プロセス)を移す。 The human visual system is a limited capacity system where it can only handle a relatively small amount of objects at a given time. This is true, contrary to the fact that there are many objects that can be seen at any given time. From an array of human-visible objects, the human visual system pays attention to or processes one (or very few) objects at any given time. When a human sees an image or scene, his visual system transfers attention (and thought processes) from one object to another.
ヒトの視覚的注意の分野において相当量の研究がされている。この研究は、多くの調査を、ヒトの視覚的注意の挙動、並びに視覚的注意の多くの計算モデルの理解に向けている。これらの計算モデル(視覚的注意モデル、視線予測モデル、注意モデル、又は顕著性モデルと呼ばれることもある)は、所与の視覚刺激(例えば、写真又はシーン)で、ある人がその視覚的注意又は視線をどこに払うかということを予測する。 Considerable work has been done in the field of human visual attention. This study directs much research to understanding the behavior of human visual attention as well as many computational models of visual attention. These computational models (sometimes referred to as visual attention models, gaze prediction models, attention models, or saliency models) are given visual stimuli (eg, photographs or scenes) where one person has that visual attention. Or predict where to look at.
これらのモデルは、視覚的注意を引き付けるシーン内のオブジェクト又は領域についての予測を提供する。典型的な現実世界のシーンは、しかしながら、高度にダイナミックである。ヒトに投影される画像は、例えばその人の視点が変化すると、シーン内のオブジェクトは、位置又は配向を変化させ、あるいは照明が変化する(異なる影がかかる)。更に、観察者自身が、不確実性を予想内に生じさせる場合がある(観察者は先入観を抱いているか、ないしは別の理由で特定の注意パターンに気が向くことがある)。シーンから投影された画像におけるいずれかの変動、又は観察者にわたる変動、又はシーンそれ自体への小さな変化でさえも、これらのモデルによって作られる予測を著しく変える場合がある。これは、適用された設定において視覚的注意モデルを使用するときに問題となることもある。 These models provide predictions about objects or regions in the scene that attract visual attention. Typical real world scenes, however, are highly dynamic. When an image projected on a human is changed, for example, when the viewpoint of the person changes, the object in the scene changes its position or orientation, or the lighting changes (a different shadow is applied). In addition, the observer himself may cause uncertainty within expectations (the observer may be prejudiced or may be concerned about a particular attention pattern for another reason). Any variation in the image projected from the scene, or variation across the viewer, or even small changes to the scene itself, can significantly change the predictions made by these models. This can be a problem when using a visual attention model in an applied setting.
シーン内のオブジェクトのプロパティを最適化して、視覚的目標を達成するためのシステム及び方法。代表的な実施形態では、コストはシーンに対する許容可能な変更に関連付けられ、次いで多くのシーンが、許容可能な変更の分野に基づいて生成される。多くのシーンは次いで、視覚的注意モデルを使用して解析され、視覚的目標を達成するシーン及び多くのシーンに生じさせる変更に関連する可能性のあるコストを判定する。他の代表的な実施形態では、報酬が特定の視覚的目標と関連付けられてもよく、報酬を最大限にする一方で、コストを最小限にする多くのシーンに関する研究がなされた。複数の視点の状況において、報酬は、そこから潜在的な観察者がオブジェクトを見るべき視点に関して定義され得る。いくつかの代表的な実施形態では、堅牢性(robustness)がシーン最適化ルーチンにおいて使用され得る。例えば、視覚的目標は、堅牢性(特定のオブジェクトは頑丈であることが望ましい)に関して定義されてもよく、又は特定の視覚的目標を達成すると判定されているシーンは、堅牢性に関して後で評価されてもよい(例えば、視覚的目標を達成する堅牢なシーンに対してバイアスを用いて)。更に多くの代表的な実施形態では、オブジェクトが見える時間は、シーン最適化システムによって考慮されてもよい。 A system and method for optimizing the properties of objects in a scene to achieve visual goals. In an exemplary embodiment, costs are associated with acceptable changes to the scene, and many scenes are then generated based on the field of acceptable changes. Many scenes are then analyzed using a visual attention model to determine the scene that achieves the visual goal and the costs that may be associated with the changes that occur in many scenes. In other exemplary embodiments, rewards may be associated with specific visual goals, and research has been done on many scenes that maximize rewards while minimizing costs. In a multiple viewpoint situation, rewards can be defined with respect to the viewpoint from which potential observers should see the object. In some exemplary embodiments, robustness may be used in the scene optimization routine. For example, a visual goal may be defined in terms of robustness (a particular object should be robust), or a scene that has been determined to achieve a particular visual goal is evaluated later in terms of robustness. (E.g., using a bias against a robust scene that achieves a visual goal). In many more exemplary embodiments, the time that an object is visible may be taken into account by the scene optimization system.
一実施形態では、複数のオブジェクトからなるシーンに関し、少なくとも1つの視覚的目標を定義することであって、視覚的目標は、視覚的注意モデルによって注意が払われると予測されることが望まれている、シーン内の少なくとも1つのオブジェクトを指定する、視覚的目標を定義することと、シーンに対する許容可能な変更を定義する入力を受信することと、許容可能な変更の少なくともいくつかに、コストの見積りを割り当てることと、修正されたシーンを作るように、定義された許容可能な変更と一致する、複数のオブジェクトのいくつかを自動的に修正することと、視覚的注意モデルを用いて、修正されたシーンを評価することと、この評価に基づいて、シーンに関する少なくとも1つの視覚的目標を達成する、修正されたシーンの少なくともいくつかを判定することと、を含む、コンピュータ実行型の方法が記載される。 In one embodiment, for a scene consisting of a plurality of objects, defining at least one visual goal, wherein the visual goal is desired to be predicted to be paid attention by a visual attention model. Defining at least one object in the scene, defining a visual goal, receiving input defining acceptable changes to the scene, and at least some of the acceptable changes Assign estimates, automatically modify some of the objects that match the defined acceptable changes to create a modified scene, and modify using visual attention models A modified scene that evaluates the rendered scene and achieves at least one visual goal for the scene based on the assessment. Of includes determining a least some, a method of computer-implemented is described.
他の実施形態では、複数のオブジェクトからなるシーンに関し、少なくとも1つの視覚的目標を定義することであって、視覚的目標は、視覚的注意モデルによって注意が払われると予測されないことが望まれている、シーン内の少なくとも1つのオブジェクトを指定する、視覚的目標を定義することと、シーンに対する許容可能な変更を定義する入力を受信することであって、これは、目標を達成するために、複数のオブジェクトの少なくともいくつかが、どのように変更され得るかを定義する、入力を受信することと、許容可能な変更の少なくともいくつかに、コストの見積りを割り当てることと、修正されたシーンを作るように、定義された許容可能な変更と一致する、複数のオブジェクトのいくつかを自動的に修正することと、視覚的注意モデルを用いて、修正されたシーンを評価することと、評価に基づいて、変更されたシーンのうちのどれが、シーンに対する少なくとも1つの視覚的目標を達成するかを判定することと、を含む、コンピュータ実行型の方法が記載される。 In another embodiment, it is desirable to define at least one visual goal for a scene consisting of a plurality of objects, wherein the visual goal is not predicted to be paid attention by a visual attention model. Defining at least one object in the scene, defining a visual goal, and receiving input defining an acceptable change to the scene, in order to achieve the goal, Receiving inputs that define how at least some of the objects can be changed, assigning cost estimates to at least some of the allowable changes, and modifying the scene To automatically modify some of the multiple objects that match the defined acceptable changes, Using the intention model to evaluate the modified scene and, based on the evaluation, determining which of the modified scenes achieves at least one visual goal for the scene. A computer-implemented method is described, including.
他の実施形態では、コンピュータシステムは、プロセッサ及びメモリと、(1)プロパティを有する複数のオブジェクトからなるシーンに関し、少なくとも1つの視覚的目標を定義する入力を受信し、(2)許容可能な変更を定義する入力を受信し、これはどのようにプロパティが変更され得るかを定義し、(3)許容可能な変更をコストの見積りと関連付けし、(4)許容可能な変更と一致するオブジェクトのプロパティを変更することによって、変更されたシーンを生成し、(5)視覚的注意モジュールと相互作用して、どの変更されたシーンが視覚的目標を達成するかを判定し、及び(6)修正されたシーンの少なくともいくつかにおいて関連するコストを判定するように、少なくとも機能するシーン最適化モジュールと、シーンを評価して視覚的注意を引き付ける傾向がある、シーン内のオブジェクトを予測するように機能する視覚的注意モジュールと、を含む。 In another embodiment, a computer system receives an input defining at least one visual goal for a scene consisting of a processor and memory and (1) a plurality of objects having properties, and (2) acceptable changes Which defines how properties can be changed, (3) associates acceptable changes with cost estimates, and (4) of objects that match acceptable changes Generating a changed scene by changing properties, (5) interacting with the visual attention module to determine which changed scene achieves the visual goal, and (6) correction Assess the scene with at least a functioning scene optimization module to determine the associated costs in at least some of the scenes There is a tendency to attract visual attention to, including the visual attention module that functions to predict the objects in the scene, the.
視覚的注意モデル(VISUAL ATTENTION MODELS)
視覚的注意モデルは、シーン内の領域が、それらが視覚的注意を引き付ける、又は眼球動作を引き付ける尤度に関して異なる程度を決定する。シーンは、視覚的注意モデルによる評価に適している入力の任意の形態(例えば、グラフィック画像)であり、例えば、デジタル写真、バーチャル3Dシーン、ウェブページ、ドキュメント、又はビデオであってもよい。
VISUAL ATTENTION MODELS
The visual attention model determines the extent to which regions in a scene differ in terms of the likelihood that they attract visual attention or attract eye movement. A scene is any form of input (eg, a graphic image) that is suitable for evaluation by a visual attention model, and may be, for example, a digital photograph, a virtual 3D scene, a web page, a document, or a video.
オブジェクトへの視覚的注意モデルの配置は、視覚的注意のモデルが、シーン内のオブジェクトの相対顕著性をどのように特徴付けるかということを指す。例えば、一部の視覚的注意モデルは、予測されたオブジェクトの周辺においてトレースラインを重ね合わせる。他の視覚的注意モデルは、画像の上に重ね合わされ得る、又は画像から別々に見られ得るヒートマップ(heat maps)を生成する。更に他のものが、オブジェクトの顕著性を関連用語で示す値と共に、特定のオブジェクト及び/又は領域に値を生成し、割り当ててもよい。トレース線との関連で、オブジェクトの配置は、モデルによって(トレースされたときに)、「選択された」又は「選択されていない」と見なされ得る。ヒートマップとの関連で、オブジェクトの配置は、アルゴリズムがオブジェクトを選択した(又はオブジェクトを選択しない)程度である。顕著性の数との関連で、オブジェクトの配置は、顕著性の数それ自体であってもよい。 The placement of a visual attention model on an object refers to how the visual attention model characterizes the relative saliency of the objects in the scene. For example, some visual attention models overlay trace lines around the predicted object. Other visual attention models generate heat maps that can be overlaid on the image or viewed separately from the image. Still others may generate and assign values to specific objects and / or regions, along with values that indicate object saliency in related terms. In the context of trace lines, the placement of an object may be considered “selected” or “not selected” by the model (when traced). In the context of the heat map, the placement of the object is such that the algorithm has selected the object (or does not select the object). In the context of the number of saliency, the placement of the object may be the number of saliency itself.
シーン内のどこに、人の視覚的注意が割り当てられるかを予測する多くの視覚的注意モデルが存在する。一般的に、これらの視覚的注意モデルは、入力として環境の単一の画像をとり、そのシーン内のどこに注意が割り当てられるかに関する予測を生成する。実証的アプローチは、ヒトをシーンに対して露出させ、彼らの眼球運動を追跡する。この実証的アプローチはリソース集中型ではあるが、しかしシーンの少なくとも一部分において、解析によって注意を予測しようと試みる多くの数学モデルが開発されてきている。この前述の実証的アプローチは、本明細書で記載されるシステム及び方法の一部として使用することができ、本明細書で使用されるとき、実証的アプローチは、視覚的注意モデルリングの1つのタイプと見なされる。 There are many visual attention models that predict where a person's visual attention is assigned in the scene. In general, these visual attention models take a single image of the environment as input and generate predictions about where attention is assigned in the scene. An empirical approach exposes humans to the scene and tracks their eye movements. This empirical approach is resource intensive, but many mathematical models have been developed that attempt to predict attention by analysis in at least a portion of the scene. This aforementioned empirical approach can be used as part of the systems and methods described herein, and as used herein, the empirical approach is one of visual attention modeling. Considered a type.
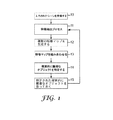
3つのモデルのうちの1つの基本的な方法論は、図1に示されており、これはItti,L.& Koch,C.(2000年発表)の「A saliency−based search mechanism for overt and covert shifts of visual attention」(Vision Research,vol.40,1489〜1506頁)によって提案されている。上位レベルでは、図1は、「ボトムアップ」特徴(例えば、色、動き、輝度、エッジ等)の評価によって、どのように予測が視覚的注意に対してなされるかを示し、これらはヒトの視覚の一部の視点を調節する、視覚的表示の構成要素として機能する。まず、1つのシーン、例えばデジタル写真の形態のシーンが、Itti & Kochモデルのコンピュータ実行型版へ提供される(ステップ10)。次いで、特徴抽出プロセスは、色、強度、配向、又は他のシーンのキュー、例えば、動き、中継、ターミネータ、又はステレオ視差、及び陰影からの形状に対するデジタル写真を解析する(ステップ11)。特徴抽出プロセスは、複数の特徴マップを生じさせ(ステップ12)、これは組み合わされて顕著性マップを作る(ステップ13)。Itti & Kochモデルの場合では、顕著性データは、視覚的注意が次に割り当てられるとモデルが予測している「最も輝度の高い」オブジェクトを有するオリジナルのデジタル写真のレンダリングとして、ユーザーに提供される。この予測されたオブジェクトは、「勝者独占方式(winner-take-all)」タイプのアルゴリズムにおいて、視覚的に突出していると識別され(ステップ14)、そのプロセスは次いで、複数のオブジェクトがモデルによって識別されるまで繰り返す(ステップ15)。 The basic methodology of one of the three models is shown in FIG. & Koch, C.I. (Announced in 2000), "A saliency-based search mechanism for over and cover shifts of visual attention" (Vision Research, vol. 40, pages 1489 to 1506). At a high level, FIG. 1 shows how predictions are made to visual attention by evaluating “bottom-up” features (eg, color, motion, brightness, edges, etc.), which are It functions as a component of visual display that adjusts the visual point of view. First, a scene, such as a scene in the form of a digital photograph, is provided to a computer-implemented version of the Itti & Koch model (step 10). The feature extraction process then analyzes digital photographs for shapes from color, intensity, orientation, or other scene cues, such as motion, relay, terminator, or stereo parallax, and shading (step 11). The feature extraction process yields a plurality of feature maps (step 12), which are combined to create a saliency map (step 13). In the case of the Itti & Koch model, saliency data is provided to the user as a rendering of the original digital photograph with the “brightest” object that the model predicts when visual attention is next assigned. . This predicted object is identified as visually prominent in a “winner-take-all” type algorithm (step 14), and the process then identifies multiple objects by the model. (Step 15).
図2は、例えばItti & Kochの視覚的注意モデルに提供され得るシーン201の、アーティストのレンダリングである。それは説明の目的のみの本明細書に含まれる簡易化されたシーンであり、実際には、シーンは実際のデジタル写真又はビデオであることが多く、はるかに複雑である。図2は、例えば星202、花203、顔204、星205、矢印206、カップ207など、シーン内に多くのオブジェクトを含む。
FIG. 2 is an artist rendering of a
図3Aは、Itti & Kochモデルからの出力がどのように表され得るかを示す、アーティストのレンダリングである。強調された(かつ、この代表的な図においては、丸で囲まれた)オブジェクトは、モデルが、視覚的に顕著であると予測するものである。例えば、星202は、この図では強調された縁208内にあり、花203は縁209内にあり、顔204は縁210内にあり、星205は縁211内にあり、矢印206は縁212内にあり、カップ207は、縁213内にある。したがって、この例におけるモデルは、他のオブジェクトに対して、より視覚的に顕著である6つのオブジェクトを決定している。この特定のモデルはまた、一部の視覚的顕著性の閾値よりも上であると決定されたオブジェクト間で、どのように注意が移動するかも予測する。例えば、経路301、302、303、304、及び305は予測された視覚的注意を示す。
FIG. 3A is an artist's rendering showing how the output from the Itti & Koch model can be represented. The highlighted object (and circled in this representative figure) is what the model expects to be visually significant. For example,
図3Bは、Itti & Kochモデルからの出力が表されることもある、更なる方式を示す、第2のアーティストのレンダリングである。図3Aに示されているものに加えて、図3Bは、予測された視覚的注意のシーケンスを含む。例えば、星202は、「1」とラベル付けされ(注意シーケンス番号214)、花203は、「2」等とラベル付けされる(注意シーケンス番号215)。
FIG. 3B is a second artist's rendering showing a further scheme in which the output from the Itti & Koch model may be represented. In addition to what is shown in FIG. 3A, FIG. 3B includes a sequence of predicted visual attention. For example,
勿論、図3A及び図3Bは、視覚的注意の予測が、ユーザーに伝達され得る1つの方法に過ぎず、異なるモデルが異なる方法でこの情報(又はそれの一部の部分集合)を表す。例えば、全てのモデルが、予測された注意シーケンスを決定するわけではないが、そのような注意シーケンスは、視覚的顕著性の最高度を有するオブジェクトを決定し、次いでそのオブジェクトを排除し、次の上位レベルのものを見つける等によって達することができる。 Of course, FIGS. 3A and 3B are just one way in which prediction of visual attention can be communicated to the user, and different models represent this information (or a subset thereof) in different ways. For example, not all models determine the predicted attention sequence, but such attention sequences determine the object with the highest degree of visual saliency, then eliminate that object and It can be reached by finding a higher level one.
Itti & Kochのモデルは、「ボトムアップ」の視覚的注意モデルの代表的なものであり、そこでは、このモデルは、シーンの特定のものの解析に基づいてその予測を行う。他のボトムアップの視覚的に顕著なモデルが、Gao,Mahadevan,and Vesconcelos等の参考文献(2008年発行)に記載されている。 The Itti & Koch model is representative of a “bottom-up” visual attention model, where the model makes its prediction based on an analysis of a particular thing in the scene. Other bottom-up visually prominent models are described in references (issued in 2008) by Gao, Mahadevan, and Vesconcelos.
ボトムアップモデルに加えて、視覚的注意の「トップダウン」モデルと呼ばれる別のクラスのモデルがある。ボトムアップモデルと対照的に、これらのモデルはシーンと、明白なタスク(例えば、障害を避けること及びオブジェクトを収集すること)、又は特定の検索タスク中に、注意が割り当てられる場所に影響を与える、対象世界に関する事前知識(例えば、椅子はどちらかといえば床の上にあり、天井にはない)のいずれかで始まる。この知識(タスク及びシーンに基づく)は、ボトムアップ特徴と併せて使用され、観察されたシーン内のオブジェクトに注意を向けさせる。一部の代表的なトップダウンモデルがRothkopf,C.A.,Ballard,D.H.& Hayhoe,M.M.の「Task and context Determine Where You Look」(2007、Journal of Vision 7(14):16,1〜20)に、及びTorralba,A.の「Contextual Modulation of Target Saliency」(Adv.in Neural Information Processing Systems 14(NIPS)(2001)(MIT Press,2001)にも記載されている。例えば、視覚的注意のTorralbaのモデルは、特定のタイプのオブジェクトを含む特徴に関する事前知識、及びシーン内のこれらのオブジェクトの絶対位置及び相対位置に関する情報を有する。この事前知識は、シーン内の特定の標的の検索において「トップダウン」の影響をもたらす。 In addition to the bottom-up model, there is another class of models called “top-down” models of visual attention. In contrast to bottom-up models, these models affect the scene and the location where attention is assigned during obvious tasks (eg avoiding obstacles and collecting objects) or during certain search tasks , Starting with one of the prior knowledge of the target world (eg chairs are rather on the floor and not on the ceiling). This knowledge (based on tasks and scenes) is used in conjunction with bottom-up features to draw attention to objects in the observed scene. Some representative top-down models are Rothkopf, C .; A. Ballard, D .; H. & Hayhoe, M .; M.M. In "Task and context Determine Where You Look" (2007, Journal of Vision 7 (14): 16, 1-20), and Torralba, A. et al. "Contextual Modulation of Target Salary" (Adv. In Neural Information Processing Systems 14 (NIPS) (2001) (MIT Press, 2001). With prior knowledge about features including the objects and information about the absolute and relative positions of these objects in the scene, this prior knowledge has a “top-down” effect in the search for specific targets in the scene.
当該技術分野は、ボトムアップ及びトップダウン設計の両方の特徴を有するハイブリッドな視覚的注意モデルを含むように発達し、モデルが露出されるシーンのタイプ(例えばビデオ対静止画像、屋外画像対ウェブページ等)における相違に適合している。 The art has evolved to include hybrid visual attention models with features of both bottom-up and top-down designs, and the type of scene in which the model is exposed (eg video vs. still images, outdoor images vs. web pages) Etc.).
堅牢性(ROBUSTNESS)
堅牢性とは視覚的注意モデルから出力された予測の感度を指し、以下のいずれか、又は以下のいくつかの組み合わせを指す。
Robustness (ROBUSTNESS)
Robustness refers to the sensitivity of predictions output from a visual attention model, and refers to any of the following, or some combination of:
(a)シーンの視覚的特性内の変化及び/又は変動、例えばシーン内のオブジェクトの照明、オブジェクトの色等を含む変化及び変動(「外部変動」と呼ばれる)、又は、
(b)観察者内の変化及び/又は変動、又は観察のモデル内の変化及び/又は変動(「内部変動」と呼ばれる)。
(A) changes and / or variations in the visual characteristics of the scene, such as changes and variations (referred to as “external variations”), including lighting of objects in the scene, color of objects, etc
(B) Changes and / or variations within the observer, or changes and / or variations within the model of observation (referred to as “internal variation”).
用語「オブジェクト」は、本明細書で使用されるとき、シーン内のもの又はエリア若しくは領域を、場合によっては、あるいは、視覚的注意モデルによって解析されるシーン内の領域のいずれかを指す。用語「オブジェクト」は、場合により「エリア」又は「領域」と同じ意味で用いられる。 The term “object” as used herein refers to either something or an area or region in the scene, possibly or a region in the scene that is analyzed by a visual attention model. The term “object” is sometimes used interchangeably with “area” or “region”.
2つのタイプの変化(a)及び(b)は、総称して内部又は外部、即ちIE変化と呼ばれ、かかる変化を生じさせ、次いでこれを評価する様々な方法が以下に更に記載される。 The two types of changes (a) and (b) are collectively referred to as internal or external, ie IE changes, and various methods for producing such changes and then evaluating them are further described below.
堅牢性評価は、シーン内のどこで注意が割り当てられるかに対するIE変化の影響を測定する方法である。シーン内のオブジェクトの堅牢性は、次いで、IE変化に関わらず、視覚的注意モデルの予測した、特定のオブジェクトが変化する、又は変化しない配置の程度である。 Robustness evaluation is a method of measuring the impact of IE changes on where attention is assigned in the scene. The robustness of objects in the scene is then the degree of placement that a particular object will or will not change, as predicted by the visual attention model, regardless of IE changes.
オブジェクトのグループの堅牢性は、2つ以上のオブジェクト(オブジェクトの集合体)に対して視覚的注意モデルの配置が、IE変化と共に変化する、又は変化しない程度である。 The robustness of a group of objects is such that the placement of the visual attention model for two or more objects (a collection of objects) changes or does not change with IE changes.
シーンの堅牢性は、シーン内の視覚的注意モデルの、オブジェクトの配置が、IE変化に関わらず、変化する、又は変化しない程度の尺度である。例えば、視覚的注意モデルが、シーン内の同じ4つのオブジェクトにされる注意又は凝視を予測し、かつこれらの4つのオブジェクトがIE変化に関わらず、視覚的注意モデルによって予測されたままの傾向にある場合、4つのオブジェクトがIE変化に続いて変化した場合よりも、シーンは、より堅牢である傾向がある。 Scene robustness is a measure of the degree to which visual object models in a scene change or do not change object placement regardless of IE changes. For example, the visual attention model predicts attention or gaze being made to the same four objects in the scene, and these four objects tend to remain predicted by the visual attention model regardless of IE changes. In some cases, the scene tends to be more robust than when four objects change following an IE change.
視覚的注意堅牢性評価システム(VISUAL ATTENTION ROBUSTNESS ASSESSMENT SYSTEM)
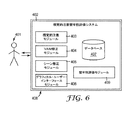
図6は、視覚的注意堅牢性評価システム403内の代表的な機能性モジュールを示す図であり、これはシーンの堅牢性、シーン内のオブジェクトの堅牢性、又は複数のシーンにわたるオブジェクトの堅牢性を評価するためのシステムである。勿論、これらの方法は手動で実施されてよい。図6に示す実施形態において、視覚的注意堅牢性評価システムは、コンピュータシステム408内である。コンピュータシステム408は、いずれかの汎用又は用途専用コンピュータ若しくはデバイスであってもよい。それはスタンドアローンのラップトップコンピュータ、又は複数のネットワーク接続コンピュータであってもよい。更にコンピュータシステム408は、携帯式コンピュータ、デジタルカメラ、若しくはタブレットPC、又は更には携帯電話であってもよい。コンピュータシステム408は、一実施形態では、オペレーティングシステムを含む様々な機能性モジュール(図6には示さず)を有する。かかるオペレーティングシステムは、コンピュータシステムのリソースに対する視覚的注意堅牢性評価システムのアクセスを促進する。コンピュータシステム408は、プロセッサ及びメモリ、並びに従来の入力/出力インターフェースを有する。
VISUAL ATTENTION ROBUSTNESS ASSESSMENT SYSTEM
FIG. 6 illustrates an exemplary functionality module within the visual attention
視覚的注意モジュール403は、任意の視覚的注意モデル又はモデルの組み合わせの任意の実施形態である。先に記載したように、異なるタイプの視覚的注意モデルが存在するが、それらは全て、ある程度、そこに視覚的注意が割り当てられる傾向にある、シーン内のオブジェクト又はエリアを予測する。視覚的注意モジュール403は、視覚的注意堅牢性評価システム402の一部として図6に示されているが、他の実施形態における視覚的注意モジュール403は、スタンドアローンコンピュータプロセス、又は更にはリモートコンピュータにおいてコンピュータネットワークのいずれかのタイプ(例えばWorld Wide Web)にわたって提供されるサービスとして動作する。
VAM修正モジュール404は、視覚的注意モジュール修正モジュールである。VAM修正モジュール404は、視覚的注意モジュールのパラメータ又はアーキテクチャの態様を修正する。この修正は、視覚的注意モジュール403の実施によって決まる多くのやり方で達成することができる。例えば、視覚的注意モジュール403はそれ自体が、どのように視覚的注意モジュールが働くかという態様を修正する関数コールを支持してもよい。一実施形態では、視覚的注意モジュール403は、シーンの特定の態様(例えば輝度)に与えられた重み付けを修正する関数コールを支持してもよい。他の実施形態では、視覚的注意モジュールがコマンドラインを介して呼び出された場合、様々なスイッチを利用して、視覚的注意モジュール内にある変数を変更することができる。あるいは、視覚的注意モジュール403がスクリプト又はプログラミングコード内に統合されている場合、IE修正モジュールは、スクリプト又はプログラミングコードそれ自体を修正することができる。他の実施形態では、全体の視覚的注意モデルは、別の視覚的注意モデルによって置き換えられる。VAM修正モジュール404が視覚的注意モジュール403の下層の視覚的注意モデル(又はかかるモデルの、シーンへの適用)を修正する特別な方法が更に以下に記載されているが、一例は、顕著性マップを生成するために使用される複数の特徴マップに関連する重み付けを修正するためのものであってもよい。これは、許容可能な値の分布に基づいて、これらの値を修正する関数コールを介して達成することができる。
The
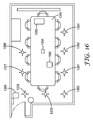
シーン修正モジュール405は、解析のために視覚的注意モジュール403に提供されるシーンを修正する。シーン変更は、環境のダイナミックな性質をシミュレーションする、外部環境に関連する変更である。このような外部変動には、例えば、シーン内のオブジェクトを動かすこと(例えば、歩行者の配置)、照明方向における変更による影の変化、又は大気条件での変化(例えば、空中の塵)を挙げることができる。この変動は、多くの方法で生成することができる。1つの方法は、シーン内にカメラを配置し、異なる時間で画像を捕捉することである。これは、実際のシーンの自然変動を捕捉する。別の方法は、シーンの単一の画像を捕捉し、個々の要素及びそのシーン内のオブジェクトにされ得る、可能性のある変更を特定することである。かかる技法の図は、図7に示される。シーン801は、最初のシーンの表示である。シーン802は、シーン変動要素、例えば影及び他のオブジェクト(例えば、車、鳥のようなシーン内に配置され得る任意のオブジェクト)で置換されたシーン801からのオブジェクトを示す。シーン803、804、805、及び806は、シーン変動要素を有する最初のシーン801の異なる組み合わせを示す。当業者は、例えば登録商標「Photoshop」でAdobe Systems(San Jose,California)から販売されていているように、市販されている画像編集ソフトウェアを使用するなど、シーンを修正する、数えきれない異なる手法があるということを理解するであろう。いくつが本明細書に非限定的な例として示される。
The
シーン修正モジュール405は、シーンに外部変動を追加し、これはひいては、複数のバージョンのシーン又はシーンの例となる。シーンの例の収集は、一実施形態では、シーン内の変動を捕捉する。オブジェクトの堅牢性又はシーンの堅牢性を測定するために、各シーンの例は、視覚的注意モジュール403に送られ、視覚的注意が各シーンの例内のどこに(すなわち、どのオブジェクトに)割り当てられるかという予測を作りだす。各ランに関連する情報はデータベース407内に保存され、次いで堅牢性評価モジュール409は、データを評価し、これらの異なる例にわたって、注意が割り当てられるであろうと、モデルが予測したオブジェクトに基づいた統計値を生成する(先に記載されたより、更なる詳細に記載)。
The
グラフィカル・ユーザー・インターフェースモジュール406は、ユーザー401との相互作用を促進する。グラフィカル・ユーザー・インターフェースモジュール406は、例えばユーザー401からの入力を求めるための、グラフィカル・ユーザー・インターフェースを構築するために、オペレーティングシステムのリソース(コンピュータシステム408からの)を求めることができる。一実施形態におけるこの入力は、シーンの場所、並びに視覚的注意堅牢性評価システムのための他の動作パラメータを含む。この入力は、一実施形態では、ユーザー401が評価に関心があるシーン内の領域及び/又は場所を特定する。かかる場所を特定することに加え、ユーザー401は、視覚的注意モジュール403によって、どのようなタイプの変動が考慮されるかということを特定することができる。これは一般的若しくは特定の内部変動、又は一般的若しくは特定の外部変動を含んでもよい。例えば、1つの特定のタイプの外部変動は、照明方向における変動により、画像を変更してもよい。光が変わると、作られた影も変化する。これは特定のタイプの外部変動であり、なぜならば、それは例えばダイナミックなオブジェクト、大気収差等の他の要因を考慮しないためである。一般的な内部変動の例は、各特徴マップのための重み付けが独立して変化するのが可能である状態である。特定の内部変動の例は、特徴マップの1つのセットの重み付け(例えば輝度)が変化するが、他のものは変化しないときである。グラフィカル・ユーザー・インターフェースモジュール406もまた、場合によってユーザーからの、どこからシーンの画像を得るべきであるかに関する入力を得るのを促進する。可能性のある場所には、例えばデータベース又はフラットファイルが挙げられる。
Graphical
堅牢性評価モジュール409は、シーン内のオブジェクトの堅牢性又はシーンそれ自体の堅牢性を評価するために、他のモジュールの相互作用を制御する。例えば、堅牢性評価モジュール409は、不可欠なものとして、視覚的注意モジュール403、並びにVAM修正モジュール404及びシーン修正モジュール405を呼び出す。堅牢性評価モジュール409が様々なモジュールを呼び出す方法は、例えばグラフィカル・ユーザー・インターフェースモジュール406を介して堅牢性評価モジュール409に提供された、ユーザー401からの入力によって修正されてもよい。堅牢性評価モジュール409は、他のモジュールによって提供されたデータも評価し、必要に応じてリポートを生成する。
The
データベース407は、視覚的注意堅牢性評価システム402のデータ保管への需要に対処する。特に、データベース407はシーンの画像を保持することができる。データベース407は任意のコンピュータメモリであってもよい。それは、ランダムアクセスメモリ、又はフラットファイル、又は1つ以上のデータベースサーバーを実行する1つ以上のデータベース管理システム(DBMS)であってもよい。データベース管理システムは、リレーショナル(RDBMS)、階層(HDBMS)、多次元(MDBMS)、オブジェクト指向(ODBMS若しくはOODBMS)、又はオブジェクトリレーショナル(ORDBMS)データベース管理システムであってもよい。データベース407は、例えば、Microsoft CorporationからのSQLサーバーなど単一のリレーショナルデータベースであってもよい。
ユーザー401は、視覚的注意堅牢性評価システムの任意のユーザーである。一部の実施形態では、視覚的注意堅牢性評価システム402の使用は十分に優しいため、視覚的顕著性理論になじみの薄い人がシステムを使用して、オブジェクト、領域、又はシーンの堅牢性を評価できる。ユーザー401は、彼らの環境内のサイン及び非サインオブジェクトの位置決めを評価するために、企業で働く従業員によって雇用されたコンサルタント又はこの従業員であってもよい。ユーザー401は、ページの視覚的特性が変化し得るウェブページ上のデザイン及びデジタルオブジェクトの配置の評価に関心のあるコンテンツデザイナーであってもよい。
図8は、視覚的注意堅牢性評価システムの他の実施形態を示し、ここでは視覚的注意堅牢性評価システムは更にウェブサーバーモジュール501を含む。ウェブサーバーモジュール501は、便宜上、視覚的注意堅牢性評価システム402の一部として示される。ウェブサーバーモジュールは、しかしながら別個のメモリ空間内でコンピュータシステム408上で動いているソフトウェアモジュールとして具体化されてもよい。あるいは、ウェブサーバーモジュール501は、ネットワークを介して視覚的注意堅牢性評価システム402に連結された別個のコンピュータシステム上にあってもよい。
FIG. 8 illustrates another embodiment of a visual attention robustness evaluation system, where the visual attention robustness evaluation system further includes a
ウェブサーバーモジュール501は、インターフェースを提供し、これによってユーザー401は、クライアントコンピュータ503を介して、かつネットワーク502を介して、視覚的注意堅牢性評価システム402と通信することができる。1つの構成では、ウェブモジュール501は、Microsoft Corporation(Redmond,Washington)からのInternet Information Serverなどのウェブサーバーソフトウェアを実行する。ウェブサーバーモジュール501は、例えば、Active Server Pages(ハイパーテキスト・マークアップ・ランゲージ(HTML)で書かれたウェブページ)又はダイナミックHTML、ActiveXモジュール、Lotusスクリプト、Java(登録商標)スクリプト、Java(登録商標) Apple Distributed Component Object Modules(DCOM)の使用を介して、遠隔ユーザー401と相互作用するためのメカニズムを提供する。
コンピュータシステム408によって提供されるオペレーティング環境内で実行する「サーバー側」のソフトウェアモジュールとして示されているが、視覚的注意堅牢性評価システム402を含む機能性モジュールは、ユーザー401によって使用されるとき、コンピューティングデバイス、例えばクライアントコンピュータ503上で実行する「クライアント側」ソフトウェアモジュールとして容易に実行することができる。視覚的注意堅牢性評価システム402は、例えば、クライアントコンピュータ503上で実行するウェブブラウザによって実行されるActive Xモジュールとして実行することができる。
Although shown as a “server-side” software module that executes within the operating environment provided by the
ネットワーク502は、任意の種類のネットワーク、公開又は非公開であってもよい。一実施形態では、ネットワーク502はインターネットである。
The
図7及び8でのユーザー401はインターネットの任意のユーザーであってもよい。一実施形態では、ユーザー401は、視覚的注意堅牢性評価システムの機能性にアクセスするために、ライセンスによって事前に配置されていてもよい。
The
図9は、視覚的注意堅牢性評価システム402が、シーン内のオブジェクト又はシーン自体の堅牢性を評価するために利用することができるプロセスの1つの実施形態を示す上位レベルのフローチャートである。まず、視覚的注意モジュールが、呼び出され、入力されたシーンがモジュールに提供される(ステップ601)。シーン内から予想されるオブジェクトは次いで、視覚的注意モジュールから受信される(ステップ602)。次いで、モデルが、高度な相対顕著性を有すると予測する場所/オブジェクト/領域の一部の表示が、データベースに保存される(ステップ603)。はっきり、何がデータベースに保存されるかは、視覚的注意モジュールからステップ602で受信された出力のタイプに大きく依存する。データベースは、一実施形態では、閾値の顕著性の値に到達するオブジェクトに関する情報を保存する。他の実施形態では、データベースは、マトリックスの値(イメージ内に識別された各オブジェクトに対して1つ)を保存し、例えば、オブジェクトが閾値の顕著性の値に到達した回数を保存する。次いで、プロセスが完了したかを見るためのチェックがなされる(ステップ605)。一実施形態では、このチェックは、現在の繰り返しが、ユーザー401によって最初に設定された繰り返しの数を超えているかを決定することができる。他の実施形態では、繰り返しの数はアルゴリズムによって決定されてもよい。更に他の実施形態では、繰り返しの数は、堅牢性の尺度を考慮して、シーン又は統計のプロパティによって決定されてもよい。例えば、特定のサイトにおいて、2つの広告のうちどちらがより良いかを決定しようとする場合、2つの広告の堅牢性の値の間に統計的に信頼性のある効果があるまで、アルゴリズムを走らせることができる。
FIG. 9 is a high-level flowchart illustrating one embodiment of a process that the visual attention
堅牢性評価が完了していない場合(ステップ605において「いいえ」)、IE変化は、視覚的注意モデルの視覚的注意モデル又は入力されたシーンのいずれかに生じさせられる。IE変化は、構造化及びランダムの2つのカテゴリに分けることができる。ランダム変動は相関性のない変動である。例えば、シーン内のランダムな変動は、個々のピクセルの色及び/又は明度におけるランダムな変動を含んでもよい。そのような場合、ピクセルの変動は相関関係がない。対照的に、構造化変動は、修正される要素間で相関関係を有する。例えば、シーン内のオブジェクトの動作をシミュレーションすることによって、又はシーン内のオブジェクトを追加する若しくは除去することによって修正ざれるシーンは、構造化されたシーン変動を構成する。そのような場合、ピクセル修正における変化は相関関係がある。ランダムな内部変動は、視覚的注意モジュールによって使用される注意モデルにおけるランダムな変動を含んでもよい。構造化変動は、一方では、他に対して注意マップの一部における注意のためのプログラム的バイアスであり得る。変動を生成するタイプの方法が表1にまとめられている。IE変化を生じさせるサブプロセスは、以下に更に詳細に記載されている。 If the robustness assessment has not been completed (“No” in step 605), an IE change is caused to either the visual attention model of the visual attention model or the input scene. IE changes can be divided into two categories: structured and random. Random variations are uncorrelated variations. For example, random variations in the scene may include random variations in the color and / or brightness of individual pixels. In such cases, pixel variations are uncorrelated. In contrast, structured variation has a correlation between the modified elements. For example, a scene that is modified by simulating the behavior of objects in the scene or by adding or removing objects in the scene constitutes structured scene variation. In such cases, changes in pixel correction are correlated. Random internal variation may include random variation in the attention model used by the visual attention module. Structured variation, on the one hand, can be a programmatic bias for attention in part of the attention map relative to the other. The types of methods for generating the variation are summarized in Table 1. The sub-process that produces the IE change is described in more detail below.

いったんIE変化がなされると、プロセスはステップ601に戻る。 Once an IE change is made, the process returns to step 601.
いったんプロセスが完了すると(ステップ605における「はい」)、視覚的注意モジュールによって予測されたオブジェクトが一連の繰り返しにおいて、どのように、そしてどの程度変化したかに対して解析がされる(ステップ606)。この解析は、以下に更に詳細が記載される。 Once the process is complete ("Yes" in step 605), an analysis is made of how and to what extent the object predicted by the visual attention module has changed in a series of iterations (step 606). . This analysis is described in further detail below.
最終的に、堅牢性を示す出力が生成される(ステップ607)。一実施形態では、この出力は、グラフィカル・ユーザー・インターフェースモジュール406を介してユーザーに提供される。しかしながら、出力は他の形態に、例えば他のプログラム又は呼び出し機能で提供されてもよい。
Finally, an output showing robustness is generated (step 607). In one embodiment, this output is provided to the user via the graphical
視覚的注意モデルへの変化(CHANGES TO THE VISUAL ATTENTION MODEL)
視覚的注意モデルを修正する(前述の図9におけるステップ604において生じさせることができる変化のタイプ)の1つの例は、シーン内の、又はシーン内の特定のエリア内の特定の特徴に向けて、バイアスをプログラムで生じさせることである。視覚的注意モデルへのかかる変動は、注意が割り当てられる場所への影響を有し、観察者及び/又は次から次へとシーンを経験するヒト観察者間の変動をシミュレーションする。例として、シーンの視覚的注意堅牢性を評価するためにItti & Kochのボトムアップの視覚的顕著性モデルを使用してもよい。そのようなモデルでは、顕著性「マップ」は、異なる視覚的特徴マップからの入力を組み合わせることによって生成される。例えば、いくつかの具体例では、3つの特徴マップがあり、第1は色に対して感度が高く、もう1つは配向に対して、第3は輝度に関連するものである。顕著性マップへの入力は、これらの3つのマップの重み付けされた組み合わせである。典型的に、これらの3つのマップは顕著性マップに同一の重み付けを有し、もう一方に対して1つのタイプの特徴に対するバイアスはないということを示し、かつ重み付けベクトルとして示され得る(例えば、3つの機能マップの等しい重み付けに対して[1 1 1])。観察者のバイアスにおける変動を生成する1つの方法は、もう一方に対して1つの特徴の方にバイアスされる可能性のある視聴者をシミュレーションしながら、これらの重み付けを修正することである。例えば、ある人は環境内の品目を、[0.5 0.5 2]に重み付けを設定することによって、より明るいものに偏倚させ得る。内部の変動を生成する(又は視聴者の変動をシミュレーションする)1つの方法は、異なる重み付け値を有するモデルの集合体を生成することである。これは、各モデルに対して値をランダムに設定することによって実施され得る。
CHANGES TO THE VISUAL ATTENTION MODEL
One example of modifying the visual attention model (the type of change that can occur in
別のアプローチは、シーンのモデルの内部の表示をランダムに表示することである。例えば、ヒト視覚的システムにおけるニューロンは、幾分ノイズが多いため、それらの活性化は同じ画像の表示でさえも変化する。この変動をシミュレーションすることは、視覚的注意モデルがシーンに対応して発達する、個々の特徴マップ(例えば、色、形状、配向、輝度)に関連する値の内部の表示を混乱させることによって実施され得る。 Another approach is to display the internal representation of the scene model randomly. For example, neurons in the human visual system are somewhat noisy and their activation varies even with the same image display. Simulating this variation is done by confusing the internal display of values associated with individual feature maps (eg, color, shape, orientation, brightness) that a visual attention model develops for the scene. Can be done.
他のモデルは、画像のどの領域が最も顕著であるかを識別するのに使用される顕著性マップにおける値を混乱させることである。例えば、それぞれの凝視計算に続いて、内部の表示を混乱させる、又はシーンが表示される度に値を独立して混乱させてもよい。 Another model is to confuse the values in the saliency map that are used to identify which areas of the image are most prominent. For example, following each gaze calculation, the internal display may be confused, or the value may be confused independently each time the scene is displayed.
シーンに対する変更(CHANGES TO THE SCENE)
シーンは、シーンのプロパティが変化される、既に存在しているシーンに基づいて、グラフィックエディタ(例えばPhotoshop)、シーンの3D表示(例えば、バーチャルリアリティモデル)、又はビデオ(また、本明細書において全て総称して「シーン」と呼ばれる)を使用して新しい画像を作ることによって変えられる。例えば、そのような変化したプロパティは、照明においてシミュレーションされた(又は実際の)変更、又は新しく追加された、又は取り除かれたオブジェクト(実際の、又はバーチャルの)を含むことができ、すなわちピクセルの色をランダムに変化させる。
CHANGES TO THE SCENE
A scene can be a graphic editor (eg, Photoshop), a 3D display of a scene (eg, a virtual reality model), or a video (and all (Collectively called "scenes") to create new images. For example, such altered properties can include simulated (or actual) changes in lighting, or newly added or removed objects (real or virtual), ie pixel Change the color randomly.
シーンを変化させるのに多くの異なる方法がある。どのような外部変化を作るべきかの決定は、状況から状況へと変化してもよい。シーンにどのようなタイプの変化をなすべきかを決定する1つの方法は、シーン内に典型的に発生するシーン変動のタイプを決定し、解析される画像にこれらの変化を生じさせることである。例えば、ホテルのロビーの人々は、シーンにわたって動いている。時には、ゲストはカウンターに立っており、時にはエレベータで立っており、又はあるいはある場所からある場所へ歩いている。これらの状況をシミュレーションすることは、実際のシーンにおいて変動を捕捉するための方法を提供する。 There are many different ways to change the scene. The decision on what external changes to make may vary from situation to situation. One way to determine what types of changes should be made to the scene is to determine the types of scene variations that typically occur in the scene and cause these changes to occur in the image being analyzed. . For example, people in a hotel lobby are moving across the scene. Sometimes a guest is standing at the counter, sometimes standing in an elevator, or even walking from one place to another. Simulating these situations provides a way to capture variations in real scenes.
外部変動がシーンに追加される程度を変化させたい、及び/又は測定したい場合がある。外部変動の程度を定量化するための1つの方法は、シーン内に操作されるオブジェクトの数を変化させることである。例えば、歩行者を有するホテルロビーの例に戻りながら、シーン内の歩行者の数を変化させてもよい。歩行者が少ないのは、小さな量の変動に変換し、多くの歩行者は多くの変動に変換する。変動を測定する他の方法は、生成されるイメージの全てに対してピクセル変動を測定することである。ピクセル変動の1つの例示の尺度は、生成されるイメージのセットに対する各ピクセルの平均分散変動を測定することである。いったん各ピクセルの変動が算出されると、ピクセルの全ての平均分散量を算出することとによって、単一の数字を出すことができる。また、イメージ内の変動が増加するとき、この値もまた増加する。 There may be a desire to change and / or measure the extent to which external variation is added to the scene. One way to quantify the degree of external variation is to change the number of objects manipulated in the scene. For example, the number of pedestrians in the scene may be changed while returning to the example of a hotel lobby having pedestrians. Less pedestrians translate into a small amount of variation, and many pedestrians translate into more variation. Another way to measure the variation is to measure the pixel variation for all of the generated images. One exemplary measure of pixel variation is to measure the average variance variation of each pixel for the set of images that are generated. Once the variation of each pixel is calculated, a single number can be obtained by calculating the average amount of dispersion for all of the pixels. Also, as the variation in the image increases, this value also increases.
変更を作る1つの方法は、例えば登録商標「Photoshop」でSan JoseのAdobe Systems Inc.によって販売されているような、市販の画像編集ソフトウェアを使用して、デジタルで画像を修正することによって、画像を変更させることである。この方法を使用しながら、デジタルでオブジェクトを配置する、オブジェクトを除去する、又は照明変化をシミュレーションすることによって、シーンを修正することができる。これらの変化は次いで、モデルによって読み込まれ、解析される画像の集合体に変換される。これらの変化はまた、レイヤーを画像にアルゴリズム的に重ね合わせることによって自動にイメージに適用することができる。 One way to make the change is, for example, under the registered trademark “Photoshop” in San Jose's Adobe Systems Inc. The image is modified by digitally modifying the image using commercially available image editing software, such as that sold by. Using this method, the scene can be modified by digitally placing objects, removing objects, or simulating lighting changes. These changes are then read by the model and converted into a collection of images to be analyzed. These changes can also be automatically applied to the image by overlaying the layer algorithmically on the image.
外部の構造的変動を生成するための他の方法は、シーンのバーチャルな表示を生成することである。このアプローチを使用して、オブジェクトの配置、オブジェクトのプロパティ、及び照明条件を容易に修正することができる。これらのバーチャル表示から、画像は、オブジェクト、それらのプロパティ、それらのポーズ及び照明条件が変化された状態で生成され得る。 Another way to generate external structural variations is to generate a virtual representation of the scene. Using this approach, object placement, object properties, and lighting conditions can be easily modified. From these virtual representations, images can be generated with the objects, their properties, their poses and lighting conditions changed.
これまで、シーンを変化させるアプローチは「合成」であるといえ、すなわち、それらはシーンそれ自体というよりはむしろ、シーンの表現に対する変化である。シーンを修正するための別のアプローチは実際のシーンを修正することである。例えば、一連の時間差の画像(例えば、定義された期間で300秒毎の写真)を撮ってもよい。この一連の写真は次いで、視覚的注意堅牢性評価システムの、連続する繰り返しに使用することができる。そのような解析(時間にわたるマルチ画像)は、外部の構造変動の尺度を提供する。更に、そのような変動を与えられて(例えば、太陽の位置における変化により、照明方向における変化と共に移動する人々及びオブジェクト)を与えられて、環境内のどこに注意が一般的に割り当てられるかということを解析することができる。 So far, the scene changing approach is said to be “compositing”, ie, they are changes to the representation of the scene rather than the scene itself. Another approach to modifying the scene is to modify the actual scene. For example, a series of time difference images (eg, photographs every 300 seconds for a defined period) may be taken. This series of photographs can then be used for successive iterations of the visual attention robustness assessment system. Such analysis (multi-image over time) provides a measure of external structural variation. Furthermore, given such variations (eg, people and objects that move with changes in lighting direction due to changes in the position of the sun), where in the environment is the attention generally assigned? Can be analyzed.
外部及び内部の変動の追加に加えて、無差別に、シーン内の異なるオブジェクトの視覚的顕著性による変動を生じさせることもできる。例えば、注意が割り当てられる変動の程度を減少させ、かつ注意が割り当てられないこれらの領域に対して注意を増加させたい場合がある。 In addition to adding external and internal variations, it can also indiscriminately cause variations due to visual saliency of different objects in the scene. For example, you may want to reduce the degree of variation to which attention is assigned and increase attention to those areas where attention is not assigned.
堅牢性の評価(EVALUATING ROBUSTNESS)
例えば、「ヒートマップ」グラフィック表示、内部エントロピー値、堅牢性係数、又は堅牢性の値などを使用する、シーンの堅牢性を特徴付ける多くの方法がある。視覚的注意モデルをシーンに繰り返し適用し、その一方で、各繰り返しに対して、あるタイプのIE変化を提供することから統合された結果を要約する1つの基本的なアプローチは、シーンの表示上に重ねられる相対値又は領域のグラフィック表示を生成することである。そのようなアプローチは、ヒートマップに類似ものものであり、クエスチョンにおける変動に対し、より堅牢性である、より「明るい」オブジェクトを備える。
Evaluating robustness (EVALUATING ROBUSTNESS)
There are many ways to characterize the robustness of a scene, for example using “heat map” graphical representations, internal entropy values, robustness factors, or robustness values. One basic approach to summarizing the combined results from applying a visual attention model to a scene iteratively while providing some type of IE change for each iteration is on the display of the scene. To generate a graphic representation of the relative value or region that is overlaid on. Such an approach is similar to a heat map, with more “brighter” objects that are more robust to variations in the question.
視覚的注意モデルの予測を阻害するノイズの影響の評価に加えて、堅牢性を評価する他の方法は、シーンの、モデルの内部表示における変動性を測定することである。例えば、Itti & Kochモデルは、内部の「顕著性マップ」表示を使用して、視覚的注意が配置される場所を決定する。IE変化の関数として、顕著性マップのこの内部表示における変化の量又はエントロピーを、堅牢性の測定基準として測定することができる(方法だけでなく)。個々の特徴マップの、又は視覚的注意モデルの他の内部の表示の応答を見て、IE変化の影響を測定することもできる。 In addition to assessing the effects of noise that interferes with the prediction of the visual attention model, another way of assessing robustness is to measure the variability of the scene in the internal representation of the model. For example, the Itti & Koch model uses an internal “saliency map” display to determine where visual attention is placed. As a function of IE change, the amount or entropy of change in this internal representation of the saliency map can be measured (not just the method) as a measure of robustness. The effects of IE changes can also be measured by looking at the response of individual feature maps or other internal representations of the visual attention model.
堅牢性の測定基準を生成する他の方法は、IE変化がパラメータ化できるときである。これは、例えばランダムな輝度のノイズをシーンに追加する(したがって、ノイズ量を、イメージ内の輝度エネルギーに対して、ノイズの輝度エネルギーを修正することによって、変化させる)場合である。又は、視覚的注意モデルの接続の重み付けの変動を増加させ、エントロピーの測定基準として、変化の程度を特徴付けることができる。オブジェクト、オブジェクトの群、又はシーンの堅牢性を特徴付ける他の方法は、これらのオブジェクトが、それらの視覚的顕著性の階層を保持しながら、耐えることができるノイズの量を決定することである。この測定基準の方法は、生成された変動の量の関数として、オブジェクトが割り当てられる尤度を測定することである。高度に堅牢であるこれらのオブジェクト及び/又はシーンは、注意がノイズ要素に引き付けられ、オブジェクト/領域には引き付けられない前の大容量のノイズにも耐性がある。得られる測定基準は、オブジェクトからノイズに向けて注意が引き付けられる前に、オブジェクトが耐え得るノイズのレベルである。 Another way to generate a robustness metric is when IE changes can be parameterized. This is the case, for example, when adding random luminance noise to the scene (and thus changing the amount of noise relative to the luminance energy in the image by modifying the luminance energy of the noise). Alternatively, the variation in visual attention model connection weighting can be increased and the degree of change can be characterized as a measure of entropy. Another way to characterize the robustness of objects, groups of objects, or scenes is to determine the amount of noise that these objects can tolerate while retaining their visual saliency hierarchy. This metric method is to measure the likelihood that an object will be assigned as a function of the amount of variation generated. These objects and / or scenes that are highly robust are also resistant to large amounts of noise before attention is drawn to the noise element and not to the object / region. The resulting metric is the level of noise that the object can withstand before attention is drawn from the object towards the noise.
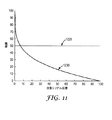
図4は、オブジェクトに対する注意対2つのオブジェクトに対する変動の確率を示すグラフであり、2つのオブジェクトとは、低ノイズ耐性(低堅牢性の値)を有する第1オブジェクト451及び高ノイズ耐性(高堅牢性の値)を有する第2オブジェクト452を示す。グラフは、オブジェクト451及びオブジェクト452に注意が割り当てられるかどうかにおける変動の効果を示し、それぞれは異なる対応の堅牢性係数を有する。この例では、少量の変動を追加することは、注意がオブジェクト451に割り当てられるということをモデルが予測するという確率に著しく影響を及ぼす。これは、少量の変動のみを有する確率における降下によって、図4に示される。対照的に、オブジェクト452は、少量の変動によって影響を受けない。これは、より大きなレベルの変動と共に発生する「減少」ポイントによって示される。これらの「減少」ポイントを測定することにより、堅牢性係数に関して、シーン内の異なるオブジェクトを定量化することができる。
FIG. 4 is a graph showing the attention to an object versus the probability of variation for two objects. The two objects are a
ちょうど記載されたヒートマップのアプローチよりはむしろ、又はこれに加えてシーン内の特定のオブジェクト(又は複数のオブジェクト)の堅牢性を定量化することは時には有用であり得る。そのような定量化は、シーン内の特定のオブジェクトの顕著性の程度を低減するために始まるIE変化の程度の決定することなど、後に続く解析を可能にし得る。 Rather than, or in addition to, the heat map approach just described, it may sometimes be useful to quantify the robustness of a particular object (or objects) in the scene. Such quantification may allow subsequent analysis, such as determining the degree of IE change that begins to reduce the degree of saliency of a particular object in the scene.
また、シーン自体の堅牢性を評価する、及び/又は定量化することは、時には有用であり得る。オブジェクトとシーン堅牢性との間の区分は、多くのタイプの、興味深い後に続く解析に対して門戸を開く。例えば、シーンが低い堅牢性の値を有するということ(すなわちモデルが、視覚的注意を集めると予測するオブジェクトのセットは、IE変化の関数として変化する)が可能であり、同時にそのシーン内のオブジェクトは高い堅牢性の値を有する。「高い」オブジェクトの堅牢性の値及び「低い」シーンの堅牢性の値の例は、例えば、標的オブジェクトが、上位3つの注視状態に常にあるが、他のオブジェクトは著しく変化すると見なされるものである。 Also, it can sometimes be useful to evaluate and / or quantify the robustness of the scene itself. The division between object and scene robustness opens the door to many types of interesting subsequent analysis. For example, it is possible that a scene has a low robustness value (i.e., the set of objects that the model expects to gather visual attention will vary as a function of IE changes) and at the same time objects in that scene Has a high fastness value. An example of a “high” object robustness value and a “low” scene robustness value is, for example, that the target object is always in the top three gaze states, while other objects are considered to change significantly. is there.
表2は、標的オブジェクトが、低い及び高い堅牢性の値を有するシーンにわたって高い及び低い堅牢性の値を有する例示のデータを提供する。この表において、1つの、可能性のある堅牢性測定基準が示され、ここでは「堅牢性の値」と以下に呼ばれる正規化された尤度が、各オブジェクトに対して算出される。各シーンに対して、左の列は、IE変化があるときに、オブジェクトが最初の3つのサッカード(saccades:眼球の衝動)に現れる時間のパーセントを示す。表2に示される例において、シーン内には14のオブジェクトがあり、1つは標的オブジェクトであり、13ディストラクタであり、ディストラクタは、顕著性を有する非標的オブジェクト又は領域である。モデルがこれらのオブジェクトをランダムに選択する場合、各オブジェクトは21.42%の選択される可能性を有する(3×1/14=0.2142)。これは、非常に少ないオブジェクト及び/又はシーン堅牢性があるという状況であり、したがって、それは重要な基準として働き、これによってシーンの堅牢性を比較する。これは、確率に機会のものに確率が近づくにつれて、堅牢性が減少するためである。この例では、堅牢性の値は、選択される可能性%によって分られた、数学的に注意が払われる%であり、したがって最初の堅牢性の値4.6667=100%/21.42%である。シーンのための堅牢性の値を計算する1つの方法は、上位Kオブジェクト(注意選択の数)の平均堅牢性の値を算出することである。表2の下は、上位3つのオブジェクトの平均堅牢性の値である。 Table 2 provides example data where the target object has high and low robustness values over a scene with low and high robustness values. In this table, one possible robustness metric is shown, where a normalized likelihood, referred to below as the “robustness value”, is calculated for each object. For each scene, the left column shows the percentage of time an object appears in the first three saccades when there is an IE change. In the example shown in Table 2, there are 14 objects in the scene, one is the target object, 13 distractors, which are non-target objects or regions with saliency. If the model selects these objects randomly, each object has a 21.42% chance of being selected (3 × 1/14 = 0.142). This is a situation where there are very few objects and / or scene robustness, so it serves as an important criterion, thereby comparing scene robustness. This is because robustness decreases as the probability approaches that of the opportunity. In this example, the robustness value is the mathematically noticed% divided by the% likelihood selected, and thus the initial robustness value 4.6667 = 100% / 21.42% It is. One way to calculate the robustness value for a scene is to calculate the average robustness value of the top K objects (number of attention selections). Below Table 2 are the average robustness values of the top three objects.
表2は、注意が割り当てられる場所を、オブジェクトによって分類する。しかし、前述のように、用語「オブジェクト」は画像(即ち、シーン)内の領域又はエリアとして大まかに定義される。本明細書に記載される方法及びシステムは、オブジェクトベースのアプローチに限定されないが、他の同様なアプローチもまた機能する。例えば、等しいサイズ領域であり得るグリッドは、ヒト視覚的システム(例えば、視聴者の中心窩のサイズ)のプロパティに基づいて、シーン又はシーンの領域にわたって定義される。 Table 2 classifies places where attention is assigned by object. However, as mentioned above, the term “object” is broadly defined as a region or area within an image (ie, a scene). The methods and systems described herein are not limited to object-based approaches, but other similar approaches will also work. For example, a grid that may be an equally sized region is defined across a scene or region of a scene based on properties of a human visual system (eg, the size of the viewer's fovea).
シーンにわたる堅牢性の評価(ASSESSING ACROSS SCENE ROBUSTNESS)
上記の方法がオブジェクト又はシーンの堅牢性を評価すると仮定すると、次に、他の方法で堅牢性の評価を広げることは可能である。例えば、「シーンにわたる堅牢性」とは、オブジェクト(又はオブジェクトのグループ)が、異なるシーンにわたってどのように変化するかという尺度である。オブジェクトに対する堅牢性測定基準を提供することにより(上記のように)、シーンから別個に、異なるシーンにおける特定のオブジェクトの堅牢性を評価することができる。例えば、広告主が、3つの異なるシーンにある、3つの異なる看板に配置される予定の2点の異なる広告コンテンツのどちらかに決めようとしている状況を考える。図5は、このシナリオの一例の表示を提供する。シーン703は看板700を含む。看板700は、シーン704及び705において繰り返される。同様に、看板706はシーン707、708及び709に見られる。
Assessing robustness across scenes (ASSESSING ACROSS SCENE ROBUSTNESS)
Given that the above method evaluates the robustness of an object or scene, it is then possible to extend the robustness evaluation in other ways. For example, “robustness across scenes” is a measure of how an object (or group of objects) changes across different scenes. By providing a robustness metric for an object (as described above), the robustness of a particular object in different scenes can be assessed separately from the scene. For example, consider a situation where an advertiser is deciding on one of two different advertising content that will be placed on three different signs in three different scenes. FIG. 5 provides a display of an example of this scenario. The
先に記載された方法(例えば、シーンのグラフィック表示に広告コンテンツを重ね合わせること)を使用して、3つのシーンのそれぞれにおいて、各看板の堅牢性の値を決定することができる。すなわち6つの異なるオブジェクト堅牢性の値を生成する。顧客は次いで、一番高い平均の堅牢性の値(又は、堅牢性の値の集合に基づく他の測定基準)を有する広告(オブジェクト)を選択することができる。 Using the previously described methods (eg, overlaying advertising content on the graphic representation of the scene), the robustness value of each sign can be determined in each of the three scenes. That is, six different object robustness values are generated. The customer can then select an advertisement (object) having the highest average robustness value (or other metric based on a set of robustness values).
1セットのオブジェクトを有するが、オブジェクトを配置するシーンのセットからも選択する必要があるときに、同様な解析を使用することもできる。この看板広告の例で続けると、顧客は、彼らが2つの異なるシーンに配置したい単一の広告を有してもよい。上記の技法を採用して、3つの異なるシーンにおいて各広告の堅牢性の値を生成するために使用され得るデジタル画像を生成することができる。シーン選択を促進するために、最も高い堅牢性の値を有する2つのシーン(広告がシーン内に重ね合わされた状態で)を顧客は選択することができる。 A similar analysis can be used when you have a set of objects but you also need to select from a set of scenes where you want to place the objects. Continuing with this billboard example, customers may have a single advertisement that they want to place in two different scenes. The above technique can be employed to generate a digital image that can be used to generate a robustness value for each advertisement in three different scenes. To facilitate scene selection, the customer can select the two scenes with the highest robustness value (with the advertisements superimposed in the scene).
シーンの固定されたセットのためのオブジェクトの集合から、単一のオブジェクト(例えば、広告看板)を、又は単一のオブジェクトのためのシーンのセットを選択することに加えて、オブジェクトを堅牢性の値に基づいて特定のシーンに割り当てることができる。例えば、顧客は、彼らが開発した3つの異なる広告(看板上に配置されているコンテンツ)及びこれらの表示がその上に配置され得る20の異なる看板を有することができる。20のシーンに配置された3つの広告のそれぞれに対して堅牢性の値を生成することによって、顧客は次いで、各個々のシーンに対して一番高い堅牢性の値を有する広告の使用を選択することができる。更に、最も良い広告を、最も高い堅牢性の値を備える10のシーンに割り当てることができる。 In addition to selecting a single object (eg, billboard) or a set of scenes for a single object from a collection of objects for a fixed set of scenes, Can be assigned to a specific scene based on the value. For example, a customer may have three different advertisements they have developed (content placed on a sign) and 20 different signs on which these displays can be placed. By generating a robustness value for each of the three advertisements placed in the 20 scenes, the customer then chooses to use the advertisement with the highest robustness value for each individual scene can do. Furthermore, the best advertisement can be assigned to the 10 scenes with the highest robustness values.
これまで例示は、どのように堅牢性の値の測定基準が、看板及び広告に関してなされる選択を改善するために使用することができるかを示しているが、堅牢性の測定基準の効果は、この定義域に限定されず、店又はホテル内のデジタル表示、静止表示、製品表示、製品パッケージ構成、又はウェブサイト間など、コンテクストの集合体及び視覚刺激(オブジェクト)の集合体を有する任意の定義域において使用することができる。 The illustrations so far show how the robustness metric can be used to improve the choices made for signs and advertisements, but the effect of the robustness metric is Any definition that has a collection of contexts and a collection of visual stimuli (objects), such as a digital display in a store or hotel, a static display, a product display, a product packaging structure, or between websites, not limited to this domain. Can be used in the region.
シーン内のオブジェクトの堅牢性を評価するための、本明細書に記載のシステム及び方法は、視覚的注意を決定するためのいずれか特定の測定方法に依存しない。むしろ、それらは一般的に、視覚的注意を評価する任意のモデルと共に使用することができ、一部の実施形態では、複数の異なる視覚的注意モデルは、オブジェクト又はシーンの堅牢性を評価するために使用され得る。 The systems and methods described herein for assessing the robustness of objects in a scene do not rely on any particular measurement method for determining visual attention. Rather, they can generally be used with any model that assesses visual attention, and in some embodiments, multiple different visual attention models are used to assess the robustness of an object or scene. Can be used.
堅牢性及び注視シーケンス(ROBUSTNESS AND ATTENTIONAL FIXATION SEQUENCE)
ここまでの考察は、大部分はシーン内のオブジェクトの堅牢性、又はシーン若しくはシーン内のオブジェの集合体の堅牢性に集中しており、オブジェクトが割り当てられる順序の考察がなかった。例えば、ここまでの解析は、注意がオブジェクトに割り当てられたか否かということをモデルが実際に予測したかどうかを評価するのみであった。しかしながら、要素が実施に問題になる、順序における状況が存在する。例えば、マルチ−オブジェクトのシーンに対して、他のオブジェクトの前にどのくらいの頻度で1つのオブジェクトが現われるかということ、及び2つの別個のオブジェクトに対する注意の間に随行する介在オブジェクト(いわゆる介在オブジェクト)があるかどうかを知りたい場合がある。
Robustness and attention sequence (ROBUSTNESS AND ATTENTIONAL FIXATION SEQUENCE)
The discussion so far has largely focused on the robustness of the objects in the scene, or the robustness of the scene or collection of objects in the scene, and there has been no consideration of the order in which the objects are assigned. For example, the analysis so far has only evaluated whether the model actually predicted whether attention was assigned to the object. However, there are situations in order where elements are a problem for implementation. For example, how often an object appears in front of other objects in a multi-object scene, and intervening objects that accompany attention to two separate objects (so-called intervening objects) You may want to know if there is.
変動をシーンに生じさせることに関して、上記の方法を使用し、注視シーケンスの集合体を有効にさせる。このデータを使用して、標的順序(例えば、オブジェクトBの前にオブジェクトAに注意を払う)が得られるシーケンスの全てを識別することができる。シーケンス堅牢性解析は、シーケンス標的堅牢性の尺度として標的シーケンスを取得する確率を使用することができる。シーケンス標的堅牢性を測定する1つの方法は、ランダムにオブジェクトを選択する場合、標的順序(すなわち、オブジェクトBの前にオブジェクトA)が発生するという尤度を算定することである。シーケンス標的堅牢性の値は、標的シーケンスが、それが偶然発生する尤度により割ることによって得られた確率である。この測定基準の背後の原則は、上記の堅牢性の値の背後の原則と同様である。 With respect to causing variation in the scene, the above method is used to enable a collection of gaze sequences. This data can be used to identify all of the sequences in which the target order (eg, pay attention to object A before object B) is obtained. Sequence robustness analysis can use the probability of acquiring a target sequence as a measure of sequence target robustness. One way to measure sequence target robustness is to calculate the likelihood that a target order (ie, object A before object B) will occur when randomly selecting objects. The sequence target robustness value is the probability obtained by dividing the target sequence by the likelihood that it will occur by chance. The principle behind this metric is similar to the principle behind the robustness value above.
注意の相対順序が問題とはならないが、介在オブジェクトが問題となる第1の場合を考える。例えば、会社が、レストラン自体の近くで、看板上にレストランのディナースペシャルを広告している場合であるとき、目的は、オブジェクトBの前にオブジェクトAに引き付けられた注意を有することである。会社は、ディナースペシャルの2つの控えめな広告を検討している場合がある。目標は、近くを通る人々をまずディナースペシャルの広告に注意を払わせ、続いてレストラン自体に注意を払わせることである。2つの異なる広告(すなわち、デジタル画像に広告を挿入し、よって、それらが看板上にあるように見える)を評価するために上記の方法を使用して、シーン内に配置し、次いでIE変化を適用し、レストランの前に、どのくらいの頻度で看板が視覚的注意を集めるかを計算することができる。表3及び4は、それらが全く注意を集めていないかどうか(オブジェクト−# Not Att.)と共に、オブジェクトA及びオブジェクトBの相対順序を示す、可能性のある尤度を提供する。これらの表から、オブジェクトBの前にオブジェクトAが、広告コンテンツ1と共に時間の65%、しかし広告コンテンツ2と共に40%のみ発生したということが分かる。したがって、このシーケンスが重要である場合、顧客は広告コンテンツ−1を選択する傾向にあり得る。
Consider the first case where the relative order of attention does not matter, but intervening objects matter. For example, when a company is advertising a restaurant dinner special on a signboard near the restaurant itself, the purpose is to have the attention attracted to object A before object B. The company may be considering two modest advertisements for dinner specials. The goal is to let people passing nearby pay attention to the dinner special ad first, and then pay attention to the restaurant itself. Using the above method to evaluate two different advertisements (i.e. inserting advertisements into a digital image and thus appearing to be on a sign), place them in the scene and then IE changes Apply and calculate how often the signage will attract visual attention before the restaurant. Tables 3 and 4 provide possible likelihoods indicating the relative order of object A and object B, along with whether they have received no attention (Object- # Not Att.). From these tables, it can be seen that object A occurred 65% of the time with advertising content 1 but only 40% with
堅牢性及びマルチサンプル状況(ROBUSTNESS AND MULTI-SAMPLE CONDITIONS)
本記載はこれまで、単一の場所からオブジェクトを観察するときに焦点を当ててきた。しかしながら、世界は高度にダイナミックであり、観察者は空間を通って移動することが多い。観察者が空間を通って移動するとき、観察者は、特定のオブジェクトを「処理」するための複数の機会を有する場合がある。しかしながら、この動作は、オブジェクトが見られる時間及び凝視の回数であり、変化し得る堅牢性解析に対する他の重要な態様を生成する。本発明者らは、これを「視認性持続時間」と呼ぶ。すなわち、どのくらいの長さで特定のシーン又はオブジェクトが、観察者によって見られるかということである。視認性持続時間を捕捉するための1つの方法は、視覚的注意の場所の予測されたシーケンスをリポートするモデルを使用することによる。これらのモデルを有して、視認性持続時間は、シーンに対する堅牢性評価のためにモデルが考慮する凝視の数を限定することによって特定され得る(これはまた、以下に記載されるシーン最適化にも適用される)。より長い視認性持続時間は、より多くの凝視に対応し、同時に、より短い視認性持続時間は、より少ない凝視に対応する。視認性持続時間における変化は、堅牢性解析に有意な影響を与える場合がある。
Robustness and multi-sample conditions (ROBUSTNESS AND MULTI-SAMPLE CONDITIONS)
The description so far has focused on observing objects from a single location. However, the world is highly dynamic and observers often move through space. As an observer moves through space, the observer may have multiple opportunities to “process” a particular object. However, this action is the time and number of gazes at which the object is seen, creating another important aspect to robustness analysis that can vary. We refer to this as “visibility duration”. That is, how long a particular scene or object can be seen by an observer. One way to capture visibility duration is by using a model that reports a predicted sequence of visual attention locations. With these models, the visibility duration can be specified by limiting the number of gazes that the model considers for robustness assessment to the scene (this is also the scene optimization described below) Also applies). A longer visibility duration corresponds to more gazes, while a shorter visibility duration corresponds to less gazes. Changes in visibility duration can have a significant impact on robustness analysis.
シーンを処理し得る凝視の数が限定されているときに、オブジェクトが注意を集めるか否かは、それが視覚的注意シーケンス内にあるかどうかによって決まる。例えば、顧客はホテル内にデジタル表示を配置してもよい。デジタル表示は次から次へと2つのコンテンツを表示している。1つのコンテンツは3秒間、2番目のものは6秒間表示される。その限定された視認性持続時間を前提として、3秒のコンテンツは、6秒のコンテンツよりも注意シーケンスにおいてより早く現われる必要がある。例えば、人々が毎秒2回の凝視をする場合、モデルは、最初の6回の凝視で、注意がオブジェクトに引き付けられるということをモデル予測しなければならない。一方、6秒のコンテンツは、最初の12の凝視で視覚的注意を集めなければならない。これらのダイナミクスを前提として、それらと同様に他のものは、視認性持続時間を考慮しないと、人々がシーン内に注意を払うオブジェクトに関して不正確な予測につながる恐れがある。 Whether the object attracts attention when the number of gazes that can process the scene is limited depends on whether it is in the visual attention sequence. For example, a customer may place a digital display in a hotel. The digital display displays two contents from one to the next. One content is displayed for 3 seconds and the second is displayed for 6 seconds. Given its limited visibility duration, 3 second content needs to appear earlier in the attention sequence than 6 second content. For example, if people gaze twice per second, the model must predict that attention will be drawn to the object in the first six gazes. On the other hand, 6 seconds of content must attract visual attention with the first 12 gazes. Given these dynamics, others like them can lead to inaccurate predictions about objects that people pay attention to in the scene, unless visibility duration is taken into account.
これを示すために、本発明者らは、看板の例を拡大する(しかし、この同じコンセプトはダイナミックに変化する任意のディスプレイに適用する)。道路に沿って複数の表示がある長い道路を検討する。更に、この道路は平坦であり、看板以外の他のオブジェクトはない。この条件下で、看板の全ては同じ視認性持続時間を有する。すなわち、視覚的システムがいずれか特定の看板を処理する時間は同じであり、車の速度、表示のサイズ、及びシーン内のいずれかの大気の収差によって決定される。 To illustrate this, we expand the signage example (but this same concept applies to any display that changes dynamically). Consider a long road with multiple indications along the road. Furthermore, the road is flat and there are no other objects other than signs. Under this condition, all of the signs have the same visibility duration. That is, the time that the visual system processes any particular sign is the same and is determined by the speed of the car, the size of the display, and any atmospheric aberrations in the scene.
ここで、道路上の最後の看板の1つの前側に500フィート(152.4m)の木の列がある、同じ道路を検討する。他の看板の全ては同じ視認性持続時間を有するが、この最終看板は、より短い視認性持続時間を有する。視認性持続時間におけるこの変化を前提として、堅牢性評価のためにモデルが考慮する凝視の回数を限定したい。この第1のセットの看板は、多数の凝視を有し、その一方で、最終看板の持続時間を考慮するとき、画像内に動画又はより少ない凝視から、より少ないフレームを考慮することができる。 Now consider the same road with a 500 foot (152.4 m) row of trees in front of one of the last signs on the road. All other signs have the same visibility duration, but this final sign has a shorter visibility duration. Given this change in visibility duration, we want to limit the number of gazes that the model considers for robustness assessment. This first set of billboards has a large number of gazes, while when considering the duration of the final billboard, fewer frames can be considered from moving images or fewer gazes in the image.
視認性持続時間のこの態様は、シーン内に多数のオブジェクトがある状況を考慮するとき、重要な役割を果たし得る。一部の状況下では、オブジェクトが処理されるのに十分な顕著性(又は注意を捕捉)であるが、しかし、シーン内の他のオブジェクトの妨げになるほど顕著性ではないように、注意捕捉要素を分散させたい場合がある。(この概念は、シーン最適化にも関連し、これは特定の目標を達成する方法でシーンを修正することを考慮する。シーン最適化は、以下で更に記載される。)これを仮定すると、オブジェクト、オブジェクト又はシーンの集合体の堅牢性を解析するとき、視認性持続時間を考慮したいであろう。例えば、パス上で短い視認性持続時間を有するオブジェクトに対して、顕著性要素(例えば、動き、輝度、色、コントラスト等)を増加させて、特定のオブジェクトが、その短い視認性持続時間中に処理される尤度を増加させる。しかしながら、その同じパスに沿って見える他のオブジェクトは、より長い視認性持続時間を有し、そのオブジェクトを処理する機会がより多くあるという事実を利用することができ、したがって、そのオブジェクトに顕著性要素をより少なく、又はより弱い顕著性要素を割り当ててもよい。 This aspect of visibility duration can play an important role when considering the situation where there are a large number of objects in the scene. In some situations, an attention capture element so that the object is sufficiently saliency (or captures attention) to be processed, but not so significant that it interferes with other objects in the scene May want to be distributed. (This concept also relates to scene optimization, which considers modifying the scene in a way that achieves a specific goal. Scene optimization is described further below.) When analyzing the robustness of an object, an object or a collection of scenes, one would want to consider the visibility duration. For example, for objects that have a short visibility duration on the path, increase the saliency factors (eg, motion, brightness, color, contrast, etc.) so that a particular object Increase the likelihood of being processed. However, other objects that appear along that same path can take advantage of the fact that they have a longer visibility duration and have more opportunities to process that object, and are therefore more prominent in that object. Fewer or weaker saliency elements may be assigned.
視認性持続時間は、オブジェクトがパスに沿ったどこかで視覚的注意を集めたかどうかを考慮することによって、堅牢性解析に組み入れられる。このように、他よりも長い視認性持続時間を有する特定のオブジェクトは、それらに関連する、より多くの注視を有し、注意が、そのシーケンスに沿ったどこかでオブジェクトに割り当てられた場合、それは「ヒット」と見なされる。したがって、より長い視認性持続時間を有するオブジェクトは、より多くのサンプルを有し、処理されることのより高い尤度を有し、したがって、処理されるためにはより低いレベルの顕著性を必要とする場合がある。より短い視認性持続時間を有するオブジェクトは、より少ないサンプルを有し、したがって、注意が払われる可能性はより少なくなり、したがって、その短いシーケンス中に、検出されるべき、より上位な顕著性を必要とする場合がある。 Visibility duration is incorporated into the robustness analysis by considering whether the object has gathered visual attention somewhere along the path. In this way, certain objects that have a longer visibility duration than others have more gaze associated with them, and if attention is assigned to an object somewhere along its sequence, It is considered a “hit”. Thus, objects with longer visibility durations have more samples and have a higher likelihood of being processed, and therefore require a lower level of saliency to be processed It may be. Objects with shorter visibility durations have fewer samples and are therefore less likely to be paid attention, and therefore have a higher saliency to be detected during that short sequence. You may need it.
シーン最適化(SCENE OPTIMIZATION)
ここまでは、本開示は堅牢性に焦点を当ててきた。ここで、本発明者らは、一部の実施形態で、前述の堅牢性関連方法及びシステムから利益を享受することができるが、堅牢性の評価を必ずしも必要としない他の視覚的注意モデルに戻る。1つのそのような概念は、シーン最適化のものである。
Scene optimization (SCENE OPTIMIZATION)
So far, this disclosure has focused on robustness. Here, we can benefit from the robustness-related methods and systems described above in some embodiments, but to other visual attention models that do not necessarily require robustness assessment. Return. One such concept is that of scene optimization.
先に記載したように、被検体が、シーン内でどこに、その視覚的注意を割り当てるかを予測することができる視覚的注意モデルが存在する。しかしながら、そのようなモデルは、特定の視覚的目標を得るために、どのようにシーンが修正され得るかということを識別するためのいずれのメカニズムも提供しない。なぜならば、ヒトの視覚的システムは、シーンの見えるエリア全体を実際には処理せず、代わりに、注意が引き付けられたこれらの領域のみを処理するからであり、多くの実際の状況では、人々に、シーン内の特定のオブジェクトを「見える」ようにするだけでなく、彼らに、特定のオブジェクトに「注意を払わせる」ようにすることが望ましい。 As described above, there is a visual attention model that can predict where an object will assign its visual attention in the scene. However, such a model does not provide any mechanism for identifying how the scene can be modified to obtain a specific visual goal. This is because the human visual system does not actually process the entire visible area of the scene, but instead processes only those areas that have received attention, and in many practical situations people In addition, it is desirable not only to “see” certain objects in the scene, but also to “pay attention” to certain objects.
視覚的目標は、次いで、被験者がシーン内のオブジェクトに注意を払う方法を指す。例えば、視覚的目標は、単に特定のオブジェクトが注意を払われるということを望むものであってもよい(すなわち、重要ではない、又は有害とさえ見なされるオブジェクトの集合体に加えて、ある人が視覚的注意の観点から重要であると判定するシーン内のオブジェクトの集合体)。あるいは、それは、特定のシーケンス、又は特定の時間に注意が払われる特定のオブジェクトを有することを望むものであってもよく、又はそれは特定の視点から注意が払われるが、しかし必ずしも他からは注意が払われない特定のオブジェクトを有することを望むものであり得る。このセクションの残りは、視覚的注意の計算モデルを利用して、視覚的目標を達成するためにシーンを最適化する方法に関して記載する。記載される方法の一部は、先に記載したように、堅牢性の評価(assessment or robustness)を利用するが、利用しないものもある。 The visual goal then refers to how the subject pays attention to the objects in the scene. For example, a visual goal may simply be that a particular object desires attention (i.e., in addition to a collection of objects that are not important or even considered harmful, A collection of objects in a scene that you consider important from a visual attention point). Alternatively, it may be desired to have a specific sequence, or a specific object that is paid attention at a specific time, or it is paid attention from a specific point of view, but not necessarily from the other. May want to have certain objects that are not paid for. The rest of this section describes how to optimize a scene to achieve a visual goal using a visual attention calculation model. Some of the methods described use an assessment or robustness, as described above, but some do not.
図10を参照して説明すると、いったん視覚的目標が定義される(ステップ1201)と、明確なコスト/報酬構造をシーン内のオブジェクトに割り当てることによって、シーン最適化が開始される(ステップ1205)。そのような割り当ては、定量的に視覚的目標を定義する。コスト/報酬構造は、シーン内のどのオブジェクトが高い値のオブジェクト、低い値のオブジェクト、及び更には、気をそらす又は視覚的目標に弊害をもたらすものであるとしてユーザーが見るオブジェクトであるかということを定義する。ユーザーは、視覚的目標(有益な報酬)又は有害である(負のコスト)の一部であると見なすオブジェクトのそれぞれに「注意有用性」を配置する。又は、ユーザーは、どの要素が、他よりも視覚的目標に「より」価値があるかを特定しながら重点を置くことができる。 Referring to FIG. 10, once a visual goal has been defined (step 1201), scene optimization is initiated by assigning a clear cost / reward structure to objects in the scene (step 1205). . Such an assignment quantitatively defines the visual goal. The cost / reward structure is what objects in the scene are high value objects, low value objects, and even objects that the user sees as distracting or detrimental to visual goals. Define The user places a “attention utility” on each of the objects that are considered part of a visual goal (beneficial reward) or harmful (negative cost). Or, the user can focus on identifying which elements are “more” worthy of visual goals than others.
次いで、シーンに対して可能性のある多くの変更が定義される(ステップ1210)。これは、例えば照明、オブジェクトの色、オブジェクトの位置決め等の単純な変更、又は、例えばロビー内のどこに受付が建てられるべきかというような、より複雑なデザインの変更であり得る。勿論、理想的に、受付の配置など基本的な何かを評価するときは、ホテルのロビーを建てる前にされるのが一番であり、よって、本明細書に記載されるシーン最適化方法の1つの利用は、そのようなシーン内の、合成又は部分的に合成のシーン/デザインレイアウトの選択であると予測される。 A number of possible changes to the scene are then defined (step 1210). This can be a simple change, eg lighting, object color, object positioning, etc., or a more complex design change, eg where in the lobby the reception should be built. Of course, ideally, when evaluating something basic, such as the arrangement of reception, it is best to do it before building the hotel lobby, so the scene optimization method described herein One use of is expected to be the selection of a composite or partially composite scene / design layout within such a scene.
実際の現実世界の「コスト」(すなわち見積)は、次いで各可能性のあるシーン変更に関連する(ステップ1215)。例えば、常連が、特定の表示に注意を払うことが目標であるホテルロビーの場合、表示の色を変更することは、比較的安く($200の見積もられた変化値として割り当てられる)、その一方で花崗岩の床の色を変えることは高価である($20,000見積もられた変化値として割り当てられる)。現実世界のコスト見積りを割り当てることで、複数の変化に伴う価格数字を関連付けることが可能である。例えば、シーンに対して可能性のある変化の範囲を考慮することができ、そのうちの一部は全ての目標に達し、その内の一部は大半の目標に達し、そのうちの一部は目標に達し、かつ最も安く達成し、定義された目標の90%を達成し、目標の残りの10%を達成するために、不均衡な投資資本をとるということを見出すことができる。換言すれば、現実世界のコストを一部の実施形態で可能性のある変化と関連付けることは、オプションの、より有意な評価を可能にする。結局、本方法は、注意の有用性を最大化しながら、同時に、オブジェクトの特徴構成と関連付けられたコストを最小化するシーン構成を提供する(ステップ1220)。 The actual real world “cost” (ie, estimate) is then associated with each possible scene change (step 1215). For example, in a hotel lobby where the goal is to pay attention to a particular display, changing the color of the display is relatively cheap (assigned as an estimated change of $ 200) On the other hand, changing the color of the granite floor is expensive (assigned as a $ 20,000 estimated change). By assigning real world cost estimates, it is possible to associate price figures with multiple changes. For example, you can consider the range of possible changes to the scene, some of which reach all goals, some of which reach most of the goals, some of which meet the goals It can be found that it takes unbalanced investment capital to reach and achieve the cheapest, achieve 90% of the defined target, and achieve the remaining 10% of the target. In other words, associating real-world costs with possible changes in some embodiments allows for a more meaningful assessment of options. Ultimately, the method provides a scene composition that maximizes the usefulness of attention while simultaneously minimizing the costs associated with the object feature composition (step 1220).
現実世界のコストは単に、特定の変更の相対コストがどのように共相関され得るか、すなわち他のシステム、例えば特定の変更に関してより高いコストと共相関する高い点を有するポイントシステム、及びより安価な変更である、より低いポイントはちょうど容易に使用され得るということに注意されたい。 Real-world costs are simply how the relative costs of a particular change can be co-correlated, i.e. other systems, e.g. point systems with high points co-correlated with higher costs for a particular change, and cheaper Note that the lower point, which is a minor change, can just be easily used.
別個のオブジェクトを追跡し、操作することができるグラフィックエディタは、シーンに対して可能性のある変化を定義するのに有用であり得る。例えば、そのようなグラフィックエディタ内で見られるシーンにおける表示は、識別(例えば、マウスで右クリック)されることができ、ユーザーはそのオブジェクトの変更可能なプロパティを選択することができる。これらの変更可能なプロパティは、色、照明、レイヤー内の位置決め(例えば、オブジェクトは一部の他のオブジェクトの前又は背後に置かれてもよい)、コントラスト、影、サイズ等を挙げることができる。変更され得る個々のプロパティを選択することに加えて、ユーザーは、許可された範囲の変更又は他の関連パラメータを定義する能力を有してもよい。例えば、色に関しては、シーン内にある特定の壁に対して、クライアント又はユーザーが許容可能であると見なし得る色は茶褐色の陰影であってもよい。したがって、色の属性は、特定のスペクトル範囲内で変化するのみであると定義される。同様に、属性がサイズである場合、オブジェクトのサイズがクライアント又はユーザーにとって許容可能でない前に、特定のオブジェクトが拡大され得る(又は、縮小され得る)サイズに対する明らかな制限がある。先に記載したとおり、実際の現実世界の「コスト」は、各可能性のある変更に関連する。可能性のある変更の範囲があるところでは、ユーザーは、その範囲内の例示のポイントのコストを定義することができ、支持するコンピュータシステム(後述する)は、例示のポイントに対してベストフィットカーブを外挿する。ユーザーは、多くの可能性のあるベストフィットアルゴリズムと共に表示され得、したがって、どれを使うべきか選択するよう依頼される。例えば、ユーザーは、表示のサイズに関して、最小の許容可能な表示コストは$100であり、中間表示のコストは、2つのコストのポイント間で線状に上昇する(サイズに基づいて)と定義したいだけである場合がある。 A graphic editor that can track and manipulate separate objects can be useful in defining possible changes to the scene. For example, the display in a scene seen in such a graphic editor can be identified (eg, right click with the mouse) and the user can select a modifiable property of the object. These modifiable properties can include color, lighting, positioning within the layer (eg, an object may be placed in front of or behind some other object), contrast, shadow, size, etc. . In addition to selecting individual properties that can be changed, the user may have the ability to define allowed range changes or other related parameters. For example, with respect to color, the color that a client or user may consider acceptable for a particular wall in the scene may be a brown shade. Thus, the color attribute is defined to only change within a specific spectral range. Similarly, when the attribute is size, there is an obvious limit on the size that a particular object can be scaled up (or scaled down) before the size of the object is not acceptable to the client or user. As noted above, the actual real world “cost” is associated with each possible change. Where there is a range of possible changes, the user can define the cost of an example point within that range, and the supporting computer system (discussed below) can best curve fit the example point. Extrapolate. The user can be displayed with many possible best fit algorithms and is therefore asked to select which one to use. For example, the user wants to define that for the size of the display, the minimum acceptable display cost is $ 100 and the cost of the intermediate display rises linearly (based on size) between two cost points. There may only be.
定義された目標(又は複数の目標)、目標のための注意の有用性、可能性のあるシーンの変更、及び定義された可能性のあるシーン変更のコストと共に、次のステップはシーンに対する可能性のある変更の効果を評価し、ステップ1201で定義される視覚性目標を達成するシーン構成を見つけようとすることである。これは、一実施形態では、予測された報酬を最大化するシーンのプロパティ、又はコストを最小限にする一方で、報酬を最大にするシーンの構成、又は最小コストに対して定義された目標を単に達成するシーン構成をアルゴリズムで修正することによって実施される。この期待された報酬は、特定のオブジェクトが注意を集め、及びこれらのオブジェクトに注意が払われるための報酬/コストを受容する尤度として算出される。シーン内の場所に注意を払うための報酬/コストに加えて、最適化ルーチンもまた、シーンに特定のタイプの変更をする(例えば、シーン内の色及び/又は位置を変更することを)ためのコスト/報酬における要因である。注目を集めるオブジェクトの尤度を算出する1つの方法は、前のセクションで記載された堅牢性の解析を使用して測定され得る。
With the defined goal (or goals), the usefulness of attention for the goal, possible scene changes, and the cost of potential scene changes defined, the next step is the potential for the scene And trying to find a scene composition that achieves the visual goal defined in
等式1は、視覚的注意の計算モデルを使用して、ユーティリティ関数を公式化する1つの例を提供する。 Equation 1 provides one example of formulating a utility function using a computational model of visual attention.
Fはシーン内のオブジェクトに関する変更可能な属性のセットである。例えば、それは、シーン内のオブジェクトのそれぞれに対する色、テクスチャー、又は位置を含む。Aは、モデルが所与のこの特徴構成Fを予測する注視のセットである。R(Oxy)は、特徴セットfと共に位置(xy)においてオブジェクトに注意を払うための報酬(正及び負の両方)である。a(xy)は、モデルが場所xyに割り当てられる注意を予測する尤度である。視覚的注意の一部のモデル及びアプローチに対して、a(xy)はバイナリ値(注意が場所に対して割り当てられる、又は割り当てられないかどうかを示す0又は1)であってもよく、一方で他のモデル及びアプローチに対して、これはこの位置(0...1)に割り当てられる尤度であり得る。どちらにしても、等式のこの部分は、現在のオブジェクト特徴セットに対する注意の割り当てに対して報酬を特定する。 F is a set of modifiable attributes for objects in the scene. For example, it includes a color, texture, or position for each of the objects in the scene. A is the set of gazes that the model predicts for a given feature configuration F. R (Oxy) is a reward (both positive and negative) for paying attention to the object at position (xy) along with feature set f. a (xy) is the likelihood that the model will predict the attention assigned to location xy. For some models and approaches of visual attention, a (xy) may be a binary value (0 or 1 indicating whether attention is assigned to a location or not), while For other models and approaches, this can be the likelihood assigned to this location (0 ... 1). In any case, this part of the equation specifies a reward for assigning attention to the current object feature set.
機能の他の部分は、オブジェクトoに対して特徴セットfを使用することに対するコストを特定する。R(Of)はオブジェクトoにおいて特徴セットfを使用することに対する報酬/コストを特定する。場合によっては、特定の特徴に対するコストは0.0であってもよい(例えば、これはオブジェクトoに対する現在の特徴セットに対するコストであってもよい)。しかしながら、モデルが、同じように難しい全ての可能性のある特徴の組み合わせを考慮することを望む場合がある。この場合では、全ての特徴に対する報酬は同等である(又は最も容易に0.0)。しかしながら、一部の状況では(例えば、シーン内のカーペットの色を変化させることに対して、花瓶を動かすこと)、許容可能な特徴構成における制約がある。そのような状況では、オブジェクト(o)及び特徴(f)上のコスト/報酬に関してこれらの値を特定することができるか、又はそれらは単に許容可能な変化として非許容可能な特徴構成を定義することを単に控えることができる。 The other part of the function specifies the cost for using feature set f for object o. R (O f ) specifies the reward / cost for using feature set f in object o. In some cases, the cost for a particular feature may be 0.0 (eg, this may be the cost for the current feature set for object o). However, the model may want to consider all possible feature combinations that are equally difficult. In this case, the reward for all features is equivalent (or most easily 0.0). However, in some situations (eg, moving the vase against changing the color of the carpet in the scene), there are constraints on the acceptable feature configuration. In such situations, these values can be specified in terms of cost / reward on object (o) and feature (f), or they simply define an unacceptable feature configuration as an acceptable change. You can simply refrain from that.
この報酬関数を使用して、解空間は、述べられた報酬関数を最適化させる特徴構成に対して展開される。いったん報酬関数が特定されると、最適の解を達成するための多くの方法がある。これらの方法には、閉形式の等式、Monte Carloシミュレーション、Simulated Annealing、Genetic Algorithms、及びStochastic Gradient Descentが挙げられるがこれらに限定されない。これらの近似値アプローチに加えて、一部の視覚的注意モデルに対しては、閉形式の解析を実施することができる。 Using this reward function, the solution space is developed for feature configurations that optimize the stated reward function. Once the reward function is specified, there are many ways to achieve an optimal solution. These methods include, but are not limited to, closed form equations, Monte Carlo simulation, Simulated Annealing, Genetic Algorithms, and Stochastic Gradient Descent. In addition to these approximation approaches, closed-form analysis can be performed on some visual attention models.
目標及び関連の付随するコスト情報を達成する解空間からの解は、次いで評価されるために利用できる。 Solutions from the solution space that achieve the goal and associated associated cost information can then be used to be evaluated.
多くの例はこれまで、そのシーン内のオブジェクトの視覚的顕著性を増加させることによってシーンを最適化することに焦点を合わせていることに注意されたい。しかしながら、一部の視覚的目標は、他のオブジェクトからの視覚的注意(又は乱れ)を低減することによって達成され得るということに注意されたい。どのようにコストモデルが設定されるかということによって決定される、本明細書に記載されるシーン最適化方法は、シーンの態様をミュートすることになり得る(常にオブジェクトを、より視覚的に顕著性があるようにしていない)。 It should be noted that many examples so far have focused on optimizing the scene by increasing the visual saliency of the objects in the scene. It should be noted, however, that some visual goals can be achieved by reducing visual attention (or disturbance) from other objects. The scene optimization method described herein, which is determined by how the cost model is set, can result in muting aspects of the scene (always make objects more visually noticeable) Not to have sex).
シーン最適化及び注意シーケンス(SCENE OPTIMIZATION AND ATTENTION SEQUENCE)
上記のとおり、一部の目標はオブジェクトに注意が払われる順序を考慮しない場合がある。そのような条件下では、オブジェクトに注意を払うための報酬/コストは、シーケンス内のその位置及び/又は既存の注視の前若しくは後に注意が払われたオブジェクトによって影響を受けない。しかしながら、シーン内のオブジェクトの注視順序は重要であり得る状況が存在する。例えば、被検体が、指示の特定のシーケンスに従うとき、順序が問題になる傾向がある。
Scene optimization and attention sequence (SCENE OPTIMIZATION AND ATTENTION SEQUENCE)
As noted above, some goals may not consider the order in which attention is paid to objects. Under such conditions, the reward / cost to pay attention to an object is not affected by its position in the sequence and / or the object that has been paid attention before or after an existing gaze. However, there are situations where the order of gaze of objects in the scene can be important. For example, when a subject follows a particular sequence of instructions, the order tends to be a problem.
この、より複雑な視覚的目標に対処するために、上記(等式1)の期待された報酬関数は、期待された報酬が順序依存であるように、特徴構成を最適化するよう拡大されてもよい。これは、サッカードの数の関数として、可変報酬構造を利用することによって実施され得る。等式1では、オブジェクトに注意を払うことに対する報酬は、ここの注意サッカード(Ra)によってインデックスが付けられる。サッカードのシーケンシャル位置(a)によって異なる報酬を特定することによって、それに沿ってシーンが予測されたサッカード順序によって最適化される方法を作ることができる。図11は、2つの報酬構造を示すグラフである。1つの報酬構造は、サッカード位置(列1225)と恒常的によって示され、2番目はサッカード位置(列1230)に依存する。サッカード依存の報酬構造は、この特定のオブジェクトに注意を払うことに対する期待された報酬は、それが早く発生した場合には非常に高いが、シーケンスにおいて、注意が後で割り当てられるときは減少するということを特定する。このタイプの報酬構造は、たとえば構造体区域のシーンにおける歩行者など、「高価値」のオブジェクトに関連されてもよい。 To address this more complex visual goal, the expected reward function in (Equation 1) above has been expanded to optimize the feature structure so that the expected reward is order dependent. Also good. This can be done by utilizing a variable reward structure as a function of the number of saccades. In Equation 1, the reward for paying attention to an object is indexed by the attention saccade (Ra) here. By identifying different rewards depending on the saccade's sequential position (a), a method can be created in which the scene is optimized by the predicted saccade order. FIG. 11 is a graph showing two reward structures. One reward structure is indicated by permanent saccade position (column 1225) and the second depends on saccade position (column 1230). The saccade-dependent reward structure, the expected reward for paying attention to this particular object is very high if it occurs early, but decreases in the sequence when attention is later assigned That is specified. This type of reward structure may be associated with a “high value” object, such as a pedestrian in a structure area scene.
注意シーケンスにおいてどれくらい早くオブジェクトが注意を払われるかという報酬に基点を置くこと(図11が例示するように)よりはむしろ、シーケンスを基準とした目標における報酬を基点とし、オブジェクトの報酬は、それの前及びそれの後に注意を集めるオブジェクトに基づく。例えば、ホテルのオーナーは、2つの屋外の表示を有している場合がある。1つは、彼らのレストランでスペシャルを広告し、2番目は彼らのホテルの名前及びロゴを表示する。特別な表示広告は、ホテルの表示の前に見られるべきであることが重要であるとホテルのオーナーは確信する。この視覚的目標を前提として、解析は、ホテル名の前に「レストランスペシャル」の表示がいつ注意を払われるかということに非常に高い報酬を設定する。更に、低い報酬は、ホテル名が「スペシャル広告」表示の前に注意が払われたときに与えられ、もしどちらか1つが他のものがない状態で注意が払われた場合は、報酬が与えられない場合がある。シーケンスは相対シーケンス(前対後)であってもよく、又は絶対シーケンス(視覚的注意を集める第1オブジェクトとしてオブジェクトAが発生し、オブジェクトBは視覚的注意を集める第2のオブジェクトであるとき、オブジェクトAが発生するまでオブジェクトA及びBに注意を払うことに対して報酬はない)であってもよい。勿論、報酬構造が当業者によって理解されるように、定式化され得る多くの他の方法がある。 Rather than basing on the reward of how quickly an object is paid attention in the attention sequence (as illustrated in FIG. 11), the reward of the object is Based on objects that gather attention before and after. For example, a hotel owner may have two outdoor displays. One advertises specials at their restaurant and the second displays their hotel name and logo. The hotel owner believes that it is important that special display advertisements should be seen before the hotel display. Given this visual goal, the analysis sets a very high reward for when the “Restaurant Special” indication is paid attention in front of the hotel name. In addition, a low reward is given when the hotel name is paid attention before the “special ad” display, and if one is paid without any other, a reward is given. It may not be possible. The sequence may be a relative sequence (front vs. back), or an absolute sequence (when object A occurs as the first object that collects visual attention and object B is the second object that collects visual attention, There is no reward for paying attention to objects A and B until object A occurs). Of course, there are many other ways in which the reward structure can be formulated, as will be appreciated by those skilled in the art.
これまで、このセクションは、サッカードの位置又はサッカードの順序が報酬に影響を与える2つの可能性のある報酬関数を記載している。当業者は、いずれかの任意のシーケンシャルな報酬関数を、オブジェクトのセット及びサッカードのセットにわたって定義してもよいということを理解するであろう。より一般的に、クエスチョンにおけるサッカードシーケンスの長さである、M次元の空間(各オブジェクトに対して一次元)を定義することによって、報酬構造の、このシーケンシャルな構成要素を定義することができる。 So far, this section describes two possible reward functions where the position of saccades or saccade order affects rewards. One skilled in the art will appreciate that any arbitrary reward function may be defined across a set of objects and a set of saccades. More generally, this sequential component of the reward structure can be defined by defining an M-dimensional space (one dimension for each object), which is the length of the saccade sequence in the question. .
この最適化ルーチンが設定されて、所与の報酬構造へのシーンに対する最良の構成を提供し得るが、得られるシーンは「推薦」であって、適切ではないということが見出すことができる。例えば、それをより顕著に、又はより顕著にしないようにするために、1つのオブジェクトの色を修正しようとした場合、どのように注意シーケンスが変化するか疑問に思う場合がある。1つのオブジェクトをより顕著にすることは、非自明な、非線形の効果を予想されるシーケンスに有する場合がある。これは、注意の割り当てが、ゼロサムゲームの定義によるという事実に起因しているためであり、1つのオブジェクトに注意を割り当てることは、必ずしも注意が他のオブジェクトから割り当てられるというということを必ずしも意味しない。したがって、1つのオブジェクトの特徴を、その顕著性を増加させるために修正することは、このオブジェクトが注意を集める(かつそれが注意集める注意シーケンスにおいて)尤度を変化させるだけでなく、他のオブジェクトが注意を集めるという尤度及びこれらのオブジェクトが注意を集める注意シーケンスにおいても影響を及ぼす。 This optimization routine can be set up to provide the best configuration for a scene to a given reward structure, but it can be found that the resulting scene is “recommended” and not appropriate. For example, you may be wondering how the attention sequence changes if you try to modify the color of an object to make it more or less noticeable. Making one object more prominent may have non-trivial, non-linear effects in the expected sequence. This is due to the fact that the assignment of attention is due to the definition of a zero-sum game, and assigning attention to one object does not necessarily mean that attention is assigned from another object. . Therefore, modifying a feature of one object to increase its saliency will not only change the likelihood that this object will attract attention (and in the attention sequence it attracts attention), but also other objects It also affects the likelihood that will collect attention and the attention sequence that these objects collect attention.
最適化ルーチンへの1つのアプローチは、複数の特徴構成を自動的に考慮するため、解空間を定義する多くの(又は全ての)可能性のある構成は展開されているであろう。非最適な解は、ユーザー又はクライアントの大きな関心であり得る。例えば、どの色が表示を、その位置、例えばサッカードシーケンスの25番目の位置からトップ5に移動させるかを知りたいと思う場合がある。システムは保存された注意シーケンスを検索し、そこでは、他のオブジェクトの全ての特徴が一定に保たれており、感心のオブジェクトはトップ5のサッカードにある。 One approach to the optimization routine automatically considers multiple feature configurations, so many (or all) possible configurations that define the solution space may have been developed. Non-optimal solutions can be of great interest to users or clients. For example, you may want to know which color moves the display from its position, for example, the 25th position in the saccade sequence, to the top five. The system searches the stored attention sequence, where all the features of other objects are kept constant, and the object of interest is in the top five saccades.
堅牢性は、上記のとおりシーン最適化でも使用され得る。例えば、その画像のプロパティに対してのみではなく、一日の又は異なる視聴者に対してシーンが見える場合があるシーンに対して、シーンを最適化することができる。すなわち、最適化ルーチンは、シーンが経験し得る変動に対して堅牢であるシーンを推奨する。これまで、本発明者らは、入力されたシーン及びモデルに対する内部及び外部変動を捕捉し、生成する方法を記載した。これらのアプローチの目的は、実際のシーンの予測変動をシミュレーション(又は捕捉)することであった。例えば、観察者の変動を捕捉する1つの方法は、視覚的注意モデルのパラメータを変化させることであり(例えば、顕著性を計算するための個々の機能マップの重み付け)及びこれらのモデルを同じイメージ上に走らせることである。異なるモデルパラメータ(内部変動)の多数のインスタンスによって、各シーン構成を走らせることは、特定のシーン構成に対して複数のスコア(各モデルに対して1つの注意シーケンス)を与える。各モデルに対する平均スコアをとることによって、所与の変動を有するシーン構成に対する期待されたスコアを生成することができる。平均において最良のスコアを提供するシーン構成を推奨する場合がある。 Robustness can also be used in scene optimization as described above. For example, the scene can be optimized not only for the properties of the image, but also for scenes where the scene may be visible to the day or to different viewers. That is, the optimization routine recommends a scene that is robust to the variations that the scene can experience. So far, we have described a method for capturing and generating internal and external variations for input scenes and models. The purpose of these approaches was to simulate (or capture) actual scene prediction variations. For example, one way to capture observer variation is to change the parameters of the visual attention model (eg, weighting of individual function maps to calculate saliency) and the same image To run up. Running each scene configuration with multiple instances of different model parameters (internal variation) gives multiple scores (one attention sequence for each model) for a particular scene configuration. By taking an average score for each model, an expected score for a scene composition with a given variation can be generated. A scene configuration that provides the best score on average may be recommended.
また、堅牢性に関して視覚的目標を定義し、特定の堅牢性の値にシーンのオブジェクトを最適化する場合がある。 It may also define visual goals for robustness and optimize objects in the scene for specific robustness values.
視認性持続時間(Visibility Duration)
堅牢性の記載に関して言及したように、異なるオブジェクト又は異なるシーンは異なる視認性持続時間を有する場合がある。備忘として、視認性持続時間は、オブジェクト及び/又はシーンが見られる時間を指す。時間に関して特定され得る視認性持続時間は、典型的には、最適化ルーチンにおいて考慮される、多くの予測された注視(又は顕著性領域)に変換される。視認性持続時間は、様々なシーンの解析に使用される凝視のセットを限定するのに使用される。より具体的には、それは視覚的目標解析において使用される。
Visibility Duration
As mentioned with respect to the robustness description, different objects or different scenes may have different visibility durations. As a reminder, visibility duration refers to the time that an object and / or scene is viewed. The visibility duration that can be specified in terms of time is typically converted into a number of predicted gazes (or saliency regions) that are considered in the optimization routine. Visibility duration is used to limit the set of gazes used in the analysis of various scenes. More specifically, it is used in visual goal analysis.
視認性持続時間は、多数の視覚的目標を考慮するときに効果を有することができる。例として、異なる報酬(例えば報酬値は1、2、3、4、5、6)を備える、6つの視覚的目標を有するドキュメント又はコンテンツを有する場合がある。コンテンツがデジタル表示に5秒間表示された場合、人々は毎秒約2つの凝視をして、これは10の凝視の視認性持続時間に変換する。視認性持続時間が10の凝視とすると、視認性持続時間は、視覚的目標の全てを捕捉するのに十分長い。この条件下で、モデルは比較的等しい6つの品目の顕著性を作る(シーン内には他のオブジェクトはなく、変化を作るためには等しいコストであると仮定する)。視認性持続時間と共に最適化ルーチンがおおよそ等しい視覚的目標を作る理由は、モデルが、この状況下でターゲットの全てに注意を払う傾向があるということである。標的(例えば、最も高い報酬を備えるオブジェクト)のうちの1つの顕著性が、他のオブジェクトのうちの1つの顕著性よりも著しく高い場合、大半の視覚的注意モデルは、最も顕著なオブジェクトに、次いで2番目に最も顕著なものへ注意を払うが、それは典型的には最も顕著性のあるオブジェクトに再び戻る。前のオブジェクトに戻ることに関して追加的な報酬がない場合、この注視は全体的な報酬を増加させない。しかしながら、オブジェクトを顕著性において比較的等しくすることにより、モデルは、標的オブジェクトの全てに注意を払う傾向があり、したがって、視認性持続時間を与えられた、より多くの視覚的目標(全部ではないが)を達成する。最適化ルーチンのこの態様及び視認性持続時間は、標的オブジェクトの報酬又は関連性を相関付けられたオブジェクトの顕著性を単に作ることとは非常に異なる。
Visibility duration can have an effect when considering a number of visual goals. As an example, you may have a document or content with six visual goals with different rewards (eg
図12は、シーン最適化システム1255の上位レベルのダイアグラムである。この図において、類似の名前の構成要素は、先に記したこれらのモデルの機能性及び能力に類似である。シーン最適化システム1255は、データベースグラフィカル・ユーザー・インターフェース1245を含み、これは、ネットワーク502にわたってユーザー401からの、コンピュータ503を介した入力を受信し、シーン及びシーンに対して可能性のある変更のための1つ以上の視覚的目標を定義する。シーン内のオブジェクトに対するこれらの可能性のある変化はデータベース1235に保存される。シーン最適化モジュール1260は、視覚的目標を達成する、可能性のあるシーンの分野を繰り返し適用して検索し、シーン修正モジュール1240を呼び出して、ユーザー401によって定義された可能性のある変化と一致する方法で入力されたシーンを修正する。これは修正されたシーンを作り出し、修正されたシーンは視覚的注意モジュール403に提供され、視覚的注意モジュール403は視覚的注意に関する出力を提供し、視覚的注意はデータベース1235に保存される。シーン最適化システム1255は、ユーザー401が遠隔である場合(かつ図12に示されているように)ウェブサーバーモジュール1250を含んでもよい。
FIG. 12 is a high level diagram of the
複数の視点のシーン解析(MULTI-PERSPECTLVE SCENE ANALYSIS)
この点まで、本記載は、単一の静止画像又はムービーをを利用して、画像内のどこに注意が割り当てられるかということを予測する、視覚的注意モデリングに主に焦点を当ててきた。これらの2つのアプローチはしばしば多くの状況に対して有用であるが、それらは、実際には複雑な3次元であるものの単一の2次元ビューで動作するということに制限される。
Multiple viewpoint scene analysis (MULTI-PERSPECTLVE SCENE ANALYSIS)
To this point, the description has focused primarily on visual attention modeling that uses a single still image or movie to predict where attention is assigned in an image. These two approaches are often useful for many situations, but they are limited to operating in a single two-dimensional view, although in fact complex three-dimensional.
我々が生きる3Dの世界では、全体像における小さな変化は、観察者の網膜上に投影されている画像上に著しい変化を有する場合がある。1つの全体像から見えるオブジェクトは、他においては全く見えない場合がある。更に、オブジェクト間の空間的な関係(すなわち、網膜上の、第2オブジェクトに対する1つのオブジェクトの投影された画像の位置)は、1つの全体像から他のものへと著しく変化し得る。全体像における変化は、網膜に投影される画像において大きな変動を生成することができ、それらはまた、ヒトの視覚的注意がシーン内のどこに割り当てられるかということに有意な著しい影響を有する。例えば、図13Aは、デジタル表示1290をデスクの背後に有する受付デスクを含む、ホテルロビーのシーンのアーティストのレンダリングである。シーンは、図13Aにおいて最も注意を引き付ける2つのオブジェクトが、デジタル表示1290及び広告カード1285であると予測する、視覚的注意モデルによって解析されている。図13Bは、同じホテルロビー内の同じ受付エリアであるが、デジタル表示1290は、視覚的注意モデルによって特定されたいくつかのオブジェクトの中にはない。視覚的目標が、常連にデジタル表示1290に注意を払わせることであり、図13Aに示されるシーンのみが解析される場合、視覚的目標が一貫して達成されているという、間違った安心感が存在するであろう。しがたって、3Dシーン内のシーンコンテンツを測定し、評価する効果的な方法を有する必要がある。
In the 3D world in which we live, small changes in the overall picture may have significant changes on the image projected on the viewer's retina. An object visible from one overall picture may not be visible at all. Furthermore, the spatial relationship between objects (ie, the position of the projected image of one object relative to the second object on the retina) can vary significantly from one overall image to another. Changes in the overall picture can produce large variations in the image projected onto the retina, which also have a significant and significant impact on where in the scene human visual attention is assigned. For example, FIG. 13A is a rendering of an artist in a hotel lobby scene that includes a reception desk with a
3Dシーン評価(本明細書では、複数の視点のシーン解析と呼ぶ)は、ムービーシーケンスなどのものに対する2Dの視覚的注意の単なる拡大と同じではないことに注意されたい。そのようなアプローチは多くの全体像からのデータを提供するが、最終的には、それが空間を通る特定の動作に対する注意の割り当てを解析する能力を有するものを提供することができるという点で、単一の画像アプローチのものと似た限定を有するが、空間を通る他のパス及び/又は動きを考慮する能力を提供することはできない。静止シーンの視覚的注意又は連続する複数の静止シーン(ビデオ)の視覚的注意の解析のいずれも、画像が3D設定から生じているという事実に効果的に対処していない。 Note that 3D scene evaluation (referred to herein as multi-view scene analysis) is not the same as simply expanding 2D visual attention to things such as movie sequences. Such an approach provides data from many overall views, but in the end it can provide what has the ability to analyze attention assignments to specific movements through space. It has limitations similar to those of the single image approach, but cannot provide the ability to consider other paths and / or motion through space. Neither the visual attention of a still scene or the analysis of the visual attention of a series of still scenes (videos) has effectively addressed the fact that the image originates from a 3D setting.
よって、観察者が、3次元である地理的空間横断することができる3次元及び無数の方法を提供する複数の視点のモデリングプロセスを有することは有用である。 Thus, it is useful to have a multiple viewpoint modeling process that provides a three-dimensional and myriad ways in which an observer can traverse a geographic space that is three-dimensional.
図15は、複数の視点の視覚的注意モデリングプロセスを示すフォローチャートである。このプロセスはサイト計画(ステップ1329)で始まり、これは3Dシーン内のどの場所及びオブジェクトを解析したいかを決定することから構成される。実際には、これは、解析される3Dシーンの平面図を取得する、又は開発すること、並びにユーザーの観察視点の代表するであろう平面図における場所を決定することを意味する。勿論、3Dシーンの平面図がないと、厳密性の少ないアプローチが使用される可能性があり、そこではユーザーは単にサイトに行き、どの場所が関心のものであるかという決定を行い、これらの場所から写真を撮る。更に、ユーザーは、画像が撮られた位置及び向き記録する場合があり、これは報告目的には有用であり得る。 FIG. 15 is a follow chart illustrating the visual attention modeling process for multiple viewpoints. This process begins with site planning (step 1329), which consists of determining which places and objects in the 3D scene you want to analyze. In practice, this means obtaining or developing a plan view of the 3D scene to be analyzed, and determining a location in the plan view that will be representative of the user's viewing viewpoint. Of course, without a plan view of the 3D scene, a less rigorous approach may be used, where the user simply goes to the site and decides which location is of interest, and these Take a picture from the place. In addition, the user may record the position and orientation at which the image was taken, which may be useful for reporting purposes.
写真よりはむしろ、フレームがビデオ又はビデオシーケンスから捕捉されるビデオ技術もまた使用することができる。フレーム(ビデオからの画像)又は画像(例えば(or example)デジタルカメラからの)が使用されるとき、ユーザーは、2つの異なる画像間にあるビューを生成するためのビュー補間技法を使用することもできる。先述のように、画像は実際の環境から生成されるものに限定されず、それらは合成(バーチャル)環境からも生成され得る。しかしながら、2つの場合では、画像が撮られる環境における場所、及びカメラの視点(どのような方法でカメラが向けられたか)を記録若しくは事前に特定しなければならない。場所を特定するための単純なアプローチは、次いで、北、東、南、西軸の周囲を90度を進展する(以下の例で実施されるように)全体像からそれぞれ連続する画像を有することである。しかし、場所の事前特定及びカメラ照準プロトコルがない場合は、カメラは、代わりに、光学追跡技術と組み合わせで、GPS追跡技術を使用して追跡することができる。例えば、画像が撮られる度に、機器はカメラに取り付けられ、3つの位置寸法(X、Y、Z)、及び3つの方向寸法(ヨー、ピッチ及びロール)を記録し、画像が捕捉される場所からの視点の明確な表示を提供する。これらの6つの値はメモリに保存され、その時に捕捉された画像に関連付けられる。勿論、カメラ位置及び向きは手動で記録されてもよい。 Rather than photographs, video techniques in which frames are captured from a video or video sequence can also be used. When frames (images from video) or images (eg, from an example digital camera) are used, the user may also use view interpolation techniques to generate a view that is between two different images. it can. As mentioned above, images are not limited to those generated from real environments, they can also be generated from synthetic (virtual) environments. However, in the two cases, the location in the environment where the image is taken and the viewpoint of the camera (how the camera was directed) must be recorded or specified in advance. A simple approach to identify the location then has 90 degrees each around the north, east, south and west axes (as practiced in the example below), each having a continuous image from the whole picture It is. However, in the absence of location pre-identification and camera aiming protocols, the camera can instead be tracked using GPS tracking technology in combination with optical tracking technology. For example, each time an image is taken, the device is attached to the camera and records three position dimensions (X, Y, Z) and three directional dimensions (yaw, pitch and roll), where the image is captured Provide a clear indication of the point of view. These six values are stored in memory and associated with the image captured at that time. Of course, the camera position and orientation may be recorded manually.
測定された3Dシーンと共に、次に、3D環境からの次の多数の画像が受信され、多数の画像は、観察者が3D環境を通してやりとりし、ナビゲートするとき、観察者が経験し得るビューのセットを表示する(ステップ1330)。一実施形態では、これは、3Dシーン内(再び、ホテルのロビーなど)の複数の位置及び向きから撮られた複数の写真によって達成される。他の実施形態では、観察者がいるであろうと予期され得る多数の代表的なエリアから撮られたショット共に、ビデオは3Dシーンで作成される。更に他の実施形態では、バーチャル3Dモデルが使用されて、ビューは、バーチャル3Dモデルを通してバーチャルカメラを移動させることによって生成される。どれくらい生成されたとしても、結果は、3Dシーン内の様々な位置からの複数の2Dイメージとなる。事前に指定されていない場合、3D環境内の場所及びカメラの向きを示すデータも収集される。このデータは、観察者が3D空間を通じて、とる可能性がある多くの異なるパスの評価と共に、多くの視点からシーンを評価できるようにする。 Along with the measured 3D scene, the next multiple images from the 3D environment are then received, and the multiple images are of the view that the viewer can experience when interacting and navigating through the 3D environment. The set is displayed (step 1330). In one embodiment, this is accomplished by multiple photos taken from multiple locations and orientations within the 3D scene (again, such as a hotel lobby). In other embodiments, the video is created in a 3D scene, along with shots taken from a number of representative areas that could be expected to have an observer. In yet another embodiment, a virtual 3D model is used and the view is generated by moving a virtual camera through the virtual 3D model. No matter how much is generated, the result is multiple 2D images from various locations in the 3D scene. If not specified in advance, data indicating the location in the 3D environment and the camera orientation is also collected. This data allows the viewer to evaluate the scene from many viewpoints, along with an evaluation of many different paths that the observer may take through the 3D space.
いったん画像が収集されると、対象のオブジェクトに対応する2次元の画像の領域が選択され、特定される(ステップ1335)。これは、これらのオブジェクトを自動で抽出する方法、領域の手動選択、又は自動及び手動のタグ付け及びラベル付け技法の両方を使用する混合の技法を含む(しかしこれらに限定されない)多くの異なる方法を使用して達成することができる。このプロセスを達成するための1つの方法(手動の)のグラフィック結果の表示が、図14A及び14Bに示されている。壁画1310、デジタル表示1315、及び花瓶1320などのオブジェクトは、マニュアル選択プロセスによって特定されている。
Once the images are collected, a two-dimensional image region corresponding to the object of interest is selected and identified (step 1335). This includes many different methods including (but not limited to) methods of automatically extracting these objects, manual selection of regions, or mixed techniques using both automatic and manual tagging and labeling techniques. Can be achieved using. A display of one way (manual) graphical results to accomplish this process is shown in FIGS. 14A and 14B. Objects such as
次に、関心のオブジェクトを含む画像は、視覚的注意データを作るために視覚的注意モデルを使用して処理される(ステップ1340)。先に言及したように、1つのそのようなモデルは、Itti & Koch(2001)によって記載されているが、任意の視覚的注意モデルが使用されてもよい。観察者が各視点にいるときに、視覚的注意が割り当てられるであろうとモデルが予測する2次元の場所が、次いで例えばデータベースに記録される。モデルが注意を集めると予測する、見えるエリア内のオブジェクトを決定するために、これらの場所は次いで、各視点に対してタグ付けされ、ラベル付けされた領域と比較される。 Next, the image containing the object of interest is processed using a visual attention model to create visual attention data (step 1340). As mentioned above, one such model is described by Itti & Koch (2001), but any visual attention model may be used. The two-dimensional location that the model predicts that the visual attention will be assigned when the observer is at each viewpoint is then recorded, for example, in a database. These locations are then tagged for each viewpoint and compared to the labeled region to determine the objects in the visible area that the model expects to attract attention.
それぞれ個々の視点を解析し、それぞれ個々の視点に対して視覚的注意を集めると予測するオブジェクトの算定の後、どの場所からどのオブジェクトに注意が払われるかを検討するデータが生成され、保存される。このデータは次いで、例えば、特定のオブジェクトが潜在的な観察者によって、その者が3Dシーンを先回するときに見られる(全く見られない)尤度;実際に特定のオブジェクトを3Dシーン内で観察する潜在的な観察者のパーセント;特定のビューのサブセットに対して注意が払われるオブジェクトの尤度(ロビーに入ることに対してロビーを出るなど、特定の移動パスに関する情報の解析に有用であり得る)、又はオブジェクトが見えるとき(一部のオブジェクトは、環境内の可能性のある視点の大半から目立たない必要がある得るが、オブジェクトが見える視点に関しては、それに対して注意が引き付けられる、高度な確実性を有したい場合がある)、又はオブジェクトが3Dシーン内で見えるとき(又はオブジェクトに注意が払われる)オブジェクトに注意が払われる尤度をを決定するために使用することができる。 After analyzing each individual viewpoint and calculating the objects that are predicted to collect visual attention for each individual viewpoint, data is generated and stored that considers which object will receive attention from which location. The This data is then, for example, the likelihood that a particular object will be seen by a potential observer when that person goes ahead in the 3D scene (it is not seen at all); Percentage of potential observers to observe; the likelihood of an object being paid attention to a particular subset of views (useful for analyzing information about a particular travel path, such as leaving the lobby for entering the lobby) Possible) or when an object is visible (some objects may need to be inconspicuous from most of the possible viewpoints in the environment, but with regard to the viewpoint from which the object is visible, attention is drawn to it, May want to have a high degree of certainty), or when an object is visible in a 3D scene (or attention is paid to the object) That) the likelihood that attention to objects is taken may be used to determine.
この3D視覚的注意モデリングは、シーン最適化に関して上記のシステム及び方法と組み合わせることができる。3D視覚的注意モデリングに関して定義され得る視覚的目標は、しかしながら異なってもよい。例えば、90%の潜在的観察者が、実際にある点で特定のデジタル表示を観察し、同時にホテルのロビーを横切るように、視覚的目標が定義されてもよい。 This 3D visual attention modeling can be combined with the systems and methods described above for scene optimization. The visual goals that can be defined for 3D visual attention modeling, however, may be different. For example, a visual goal may be defined such that 90% of potential observers actually observe a particular digital display at a certain point and at the same time cross a hotel lobby.
シーン最適化と組み合わされた3D視覚的注意モデリングを適用する例として、一部の視点から観察されたときはオブジェクトが目立たないままであり、オブジェクトが関連性のあるときは、他の視点から目立つようにしたいケースを検討する。例えば、その顧客に見て欲しく、かつ彼らの滞在中に注意を払って欲しい、3つの異なる形態の広告コンテンツを有するホテル。第1のコンテンツは、部屋のアップグレードに関するスペシャルを広告することであり、第2のコンテンツは、ルームサービスに関する広告であり、第3のコンテンツはホテルのダンスホールで行われる劇のチケットを広告することである。これらの異なる形態のコンテンツは、顧客の滞在中に異なる時間に関連する。部屋のアップグレードは、顧客がホテルにチェックインするときに関連があるが、他の時間では関連がない。ルームサービスは、顧客が彼らの部屋に行くときに関連があるが、顧客がホテルを去るときには必要ではない。劇のチケットは、反対に、ほぼどんな時でも顧客に関連する。シーン最適化技法と組み合わされた3D視覚的注意モデリング(両方とも上で記載された)を使用して、以下の方法でこれらの広告材料の配置及びコンテンツを最適化することができる。第1に、情報が最も関連するホテルのロビーにおける場所を決定することができる。例えば、部屋のアップグレードは、顧客がホテルにチェックインするときに関連があり、これは通常、顧客がチェックインカウンタの前に立っているときに発生する。エレベータの隣のエリアは、一般的な広告(芝居のチケットなど)に最適であり得る。ちょうどホテルが、特定のタスクに対応する視点から特定の表示が目立つように望む場合があるように、ホテルはまた、関連がない表示には目立たないようにしたい(例えば、エレベータを待つときに、部屋のアップグレード)。チェックインカウンタにおいて立っているときに、その状態であろう位置及び向きのセットに基づいて、広告材料の位置及びコンテンツを解析することができる。 As an example of applying 3D visual attention modeling combined with scene optimization, objects remain inconspicuous when viewed from some viewpoints, and stand out from other viewpoints when objects are relevant Consider the case you want to do. For example, a hotel with three different forms of advertising content that its customers want to see and want to pay attention to during their stay. The first content is to advertise specials related to room upgrades, the second content is related to room services, and the third content is to advertise tickets for plays performed in hotel dance halls. It is. These different forms of content are associated with different times during the customer's stay. Room upgrades are relevant when customers check into the hotel, but not at other times. Room service is relevant when the customer goes to their room, but is not necessary when the customer leaves the hotel. Play tickets, on the contrary, are relevant to customers at almost any time. Using 3D visual attention modeling combined with scene optimization techniques (both described above), the placement and content of these advertising materials can be optimized in the following manner. First, the location in the hotel lobby where the information is most relevant can be determined. For example, room upgrades are relevant when a customer checks in to a hotel, which usually occurs when the customer is standing in front of a check-in counter. The area next to the elevator may be ideal for general advertising (such as a play ticket). Just as a hotel may want a particular display to stand out from a perspective that corresponds to a particular task, the hotel also wants to make it less noticeable on unrelated displays (for example, when waiting for an elevator Room upgrade). When standing at the check-in counter, the location and content of the advertising material can be analyzed based on the set of locations and orientations that would be in that state.
3D視覚的注意モデリング及びシーン最適化方法の一実施形態を試験するために、本発明者らは、彼らの試験3Dシーンとして標準的な会議室で行い、このダイアグラムは図16に見ることができる。会議室はテーブル1345、黄色の表示1350、緑色のバスケット1360、電話1355、紫色の表示1365、並びに会議室に見出すことが予測される他の典型的なもの(椅子、ゴミ箱、スクリーン)を含む。観察者が部屋を見ることを期待され得るものからの代表的な点は、マニュアルで決定され、8つの代表的な観察場所が生じた(観察場所1366、1377、1378、1379、1380、1381、1382、及び1383)。この試験に関して、観察場所は、部屋の邪魔されない(家具のない)領域全体で約4フィート(1.2m)離間していた。デジタルカメラを使用して4つの画像が撮られ、8つの観察場所のそれぞれから、32の画像が生じた。観察場所から外側に延びる矢印は、デジタルカメラが各写真に対して向けられた一般的な方向を示し、各観察場所において、各写真に対して約90度の向きである。32の異なる画像のそれぞれに対する場所及び向きが記録された。
To test one embodiment of the 3D visual attention modeling and scene optimization method, we performed in a standard conference room as their test 3D scene, and this diagram can be seen in FIG. . Meeting rooms include a table 1345, a
本発明者らは次いで、32の画像の少なくとも1つに見出された12の異なるオブジェクトに関連するピクセルを特定し、タグを付けた。これは、32の画像のそれぞれ上で、関心のオブジェクトを包む2D領域を画定する多角形領域をユーザーに選択させることによって実施された。図17A及び17Bは、32の画像のうちの2つの、アーティストのレンダリングを示し、多角形は、関心のオブジェクト、例えば緑色のバスケット1360及び黄色の表示1350を囲む。「タグ付け」は単に、オブジェクト(例えば「黄色の表示」)を含む領域の名前を付けるこという。オブジェクトを囲む多角形は、タグ付けソフトウェアの目的の代表であり、下線のある画像は、実際には多角形で修正されてはおらず、識別された領域は、ユーザーによっていったん特定されると、最初の画像上でどんな方法でも重要ではない。
We then identified and tagged pixels associated with 12 different objects found in at least one of the 32 images. This was done by having the user select a polygonal region on each of the 32 images that defines a 2D region that encloses the object of interest. FIGS. 17A and 17B show the artist's rendering of two of the 32 images, where the polygon surrounds the object of interest, such as a
画像をタグ付けし、ラベル付けした後、画像は視覚的注意モデルに提出され、視覚的注意が割り当てられると、モデルが予測する画像において場所を収集する。画像の全てを送信した後、各画像に対してコンピュータは、視覚的注意が割り当てられると、モデルが予測したx、y座標を記録する。コンピュータはまた、これらの注意のそれぞれに対して、ユーザーによってタグ付け及びラベル付けされた画像の領域内にそれが入るかどうか、算出した。コンピュータはまた、注意を集めると予測されなかった(「ミス」)タグ付き領域を含む各画像を記録した。全てのデータはデータベースに保存され、これは次いで、シーン内のオブジェクトの顕著性に関する一連のサマリーを生成するために使用された。 After tagging and labeling the image, the image is submitted to a visual attention model and, when assigned visual attention, collects locations in the image that the model predicts. After sending all of the images, for each image, the computer records the x, y coordinates predicted by the model when visual attention is assigned. The computer also calculated for each of these notices whether it would fall within the area of the image tagged and labeled by the user. The computer also recorded each image including a tagged area that was not expected to attract attention ("miss"). All the data was stored in a database, which was then used to generate a series of summaries about the saliency of objects in the scene.
図18は、会議室内でタグ付けされ、ラベル付けされた12のオブジェクト1400に実施された、3つの異なる実施例解析を示すグラフ1395を示す。第1の解析は、オブジェクトが可視である可能性、即ち見える(p(可視))尤度である。これは、オブジェクトが、画像が、画像の全数によって割られた画像内にある画像の比率である。p(可視)は次いで、関心のオブジェクトが、どれくらいうまく設定内に配置されるかという、いくつかのの表示を与える測定基準である。決定される測定基準は、それが可視である(p(注意|可視))ということを仮定されて、オブジェクトに注意が払われた尤度であり、これは、オブジェクトが可視であり、その凝視を予測した視覚的注意モデルが、特定のオブジェクトを定義する領域内に発生するかどうかを特定する可能性である。計算された測定基準は、特定のオブジェクトが全てに注意が払われる尤度(p(注意))であり、これはモデルが、少なくとも1回のオブジェクトへの注意の割り当てを予測し、次いでその値を画像の全部の総数によってわっている。
FIG. 18 shows a
複数の視点のシーン解析は、標的オブジェクトが多くの異なる距離から見ることができるという事実を示す。例えば、上記の看板の例を検討する。長い平坦な道を運転しているとき、看板に関心を向け、したがって、これを処理する多くの機会が存在する。一方、他の看板に関して、極めて最後の瞬間まで表示を遮蔽する丘又は木の群がある場合がある。これらの異なる視点を考慮し、オブジェクトが、それが見られ得る異なる視点から視覚的注意を集める尤度をより正確に解析できる。複数の視点なしで、かつ単一のビューのみを使用して、それが注意を払われる可能性のある多くの視点を仮定すると、オブジェクトが視覚的注意を集める、又は集めないということを誤って予測する場合がある。 Multiple viewpoint scene analysis shows the fact that the target object can be seen from many different distances. For example, consider the above signboard example. When driving a long flat road, there are many opportunities to focus on the sign and thus handle it. On the other hand, for other signs, there may be a group of hills or trees that shield the display until the very last moment. Considering these different viewpoints, the likelihood that an object will gather visual attention from different viewpoints from which it can be seen can be analyzed more accurately. Without using multiple viewpoints and using only a single view and assuming many viewpoints where it can be noticed, it is false that an object will or will not collect visual attention May be predicted.
図18は、上記の解析から得られるデータで実施することができる、可能性のある評価のサブセットを示す。このデータから引き出せる多くの結論がある。第1に、紫色の表示オブジェクトは、スクリーンオブジェクトよりも見えないことが多いということに注意されたい(即ち、それは、環境内で撮られた少ない画像であった)。しかしながら、これらの2つのオブジェクトの黒いバーを見ると、紫色の表示が見えるとき(すなわち、画像内にそれが存在する)、それは常に注意が払われており(p(注意|可視)=1.0)、しかしスクリーンが見えるときは、注意が払われていない。紫色の表示は、極めて見られないことが多い定置に配置されているが、それがビュー内にあるときは、モデルはそれに注意が割り当てられているということを予測する。 FIG. 18 shows a subset of possible assessments that can be performed on the data obtained from the above analysis. There are many conclusions that can be drawn from this data. First, note that the purple display object is often less visible than the screen object (ie, it was a lesser picture taken in the environment). However, looking at the black bars of these two objects, when a purple display is seen (ie, it is present in the image), it is always paid attention (p (attention | visible) = 1. 0) But when the screen is visible, no attention is paid. The purple display is placed in a stationary position that is often very invisible, but when it is in view, the model predicts that attention has been assigned to it.
紫色の表示のオブジェクトは次いで、ホテルのロビーとの関連で、望ましいと先に記載された、プロパティのタイプを生成する。すなわち、多くの場所から見えない表示(それは目立たない)が、それが見える場所に人々がいるときに(チェックインカウンタの側)、彼らはそのオブジェクトに常に関心を向ける。これは、紫色の表示のオブジェクトが見える確立(白いバー)は約15%であるという事実によって示される。しかし、それが見えるときに、注意は紫色の表示によって捕捉される確率(黒いバー)は1.0である。 The purple display object then generates the type of property described above as desirable in the context of the hotel lobby. That is, a display that is invisible from many places (it is inconspicuous), but when people are in the place where it is visible (on the side of the check-in counter), they always focus on that object. This is indicated by the fact that the probability of seeing a purple display object (white bar) is about 15%. However, the probability (black bar) that attention is captured by the purple display when it is visible is 1.0.
図19は、複数の視点のシーン解析システム1415を含む上位レベルの機能性モジュールを示すブロック図であり、これは、様々な実施形態において、図15に関して記載された複数の視点の視覚的注意モデリングプロセスを実行することができる。それは、一実施形態では、コンピュータシステム408内に存在し、これは多くの他の機能性モジュール(例えばオペレーティングシステム)及びハードウェア、例えばメモリ又はプロセッサ(それらのいずれも図19には示されていない)を含む。単一のコンピュータとして図19に示されているが、実際には,機能性の様々な部分が、ネットワーク構成でいくつか又は多くのコンピュータ間に広がっている。複数の視点のシーン解析システム1415は、視覚的注意モジュール403(上記)を含む。それは、必要に応じて、関心の解析(図15のステップ1340に関して先に記載されている)をするために視覚的注意モジュール403を呼び出す複数の視点のシーン解析モジュール1425も含み、解析から結果(どの定義されたオブジェクトが、どの画像内の視覚的注意モジュールによって特定されたかを含む)を受理し、これらの結果又は結果の要約をデータベース1410に保存する。データベース1410は、コンピュータ炭層ファイル、コンピュータメモリ、又はデータベースなど、いずれかのデータ保存装置又はシステムである。複数の視点のシーン解析システム1415は、グラフィカル・ユーザー・インターフェースモジュール1420も含み、これは多数の画像(図15のステップ1330で得られた)の入力促進し、次いで、この実施形態では、画像内の関心のオブジェクトの識別及びタグ付け(図15におけるステップ1335)を促進する。
FIG. 19 is a block diagram illustrating a high-level functionality module that includes a multiple viewpoint
ユーザー1405は、複数の視点のシーン解析システムと相互作用することに興味のあるいずれかの人間又は他のコンピュータシステムである。一実施形態では、ユーザー1405は、会社に雇用されたコンサルタントであって、会社に所有された又は管理された3Dシーンへの構成変化を解析及び推薦する。
視聴者は十分な時間、同じ場所に残ることが多い。例えば、ある人が食料品店、ホームセンター、又はホテルから、支払いをするために列で待っている場合がある。この間、個人は「視覚的採餌」作業を行う場合がある。視覚的採餌とは、観察者が特に何かを探してはいないが、興味のある何かを、環境周辺で単に見回していることである。この視覚的採餌中に、人はその目を動かすことによってことある情報に関心を向け、その人の目がそれらの回転軸の縁部に到達したとき、その人は頭を動かす。典型的に、その人は関心の品目が凝視の中心にあるように頭と目を動かす。現在の最先端技術は、画像上への、このタイプの再センタリング作用をシミュレーションしない。かわりに、画像が解析されるとき、画像の中心は常に凝視されたままである。凝視ポイントが、画像(又は視界)の縁部にあるときでさえ、これは本当である。再センタリングすることなく、現在の最先端技術のアプローチは、画像の縁部に固定できるのみであり、その点を超えては決して固定しない。一方、ヒトは、彼らの目が凝視のセンターに整列されるように、彼らの視界の縁部に関心を向け彼らの頭を回転する。これは視覚的システムが、同じ方向において他の凝視を作るのを可能にする。単一の画像と共に、画像の縁部から出る情報はもはやないという事実により、同じ方向で凝視を作ることができない。 Viewers often remain in the same place for a sufficient amount of time. For example, a person may be waiting in line to pay from a grocery store, home improvement center, or hotel. During this time, the individual may perform a “visual foraging” operation. Visual foraging means that the observer is not looking for anything in particular, but simply looking around for something of interest around the environment. During this visual foraging, a person focuses on certain information by moving their eyes, and when they reach the edge of their axis of rotation, they move their heads. Typically, the person moves his head and eyes so that the item of interest is in the center of the gaze. Current state of the art does not simulate this type of recentering effect on the image. Instead, when the image is analyzed, the center of the image always remains stared. This is true even when the gaze point is at the edge of the image (or view). Without re-centering, current state-of-the-art approaches can only be fixed to the edge of the image, never beyond that point. Humans, on the other hand, rotate their heads with interest at the edge of their field of view so that their eyes are aligned with the center of gaze. This allows the visual system to make other gazes in the same direction. Due to the fact that with a single image there is no longer any information coming out of the edge of the image, a gaze cannot be made in the same direction.
本明細書に記載のこのシステム及び方法は、一部の実施形態では、シーンの多数のビュー又は単一のパノラマビューを使用して、視覚的採餌中に目の再センタリングをシミュレーションする。これは以下のとおり実施され得る。 This system and method described herein, in some embodiments, uses multiple views of a scene or a single panoramic view to simulate eye recentering during visual foraging. This can be done as follows.
1.単一の視点から多数の画像を生成する。画像は、360度のパノラマカメラ、又は視点軸(又は別の方法で垂直)の周りで回転された多数の単一画像によって生成される。多数の画像が撮られてもよく、ここでビューは互いに「重なり合う」。ビューの向きはまた、各ビューに割り当てられる。 1. Generate multiple images from a single viewpoint. The image is generated by a 360 degree panoramic camera or multiple single images rotated around the viewpoint axis (or otherwise vertical). Multiple images may be taken, where the views “overlap” each other. A view orientation is also assigned to each view.
2.最初のビュー(「開始ビュー」)は、視覚的注意モデルに与えられる。ビューは、誰かがそれらの視覚的採餌(例えばお店の列において、それはキャッシャーの方へ「前方」を見ている場合がある)を開始する典型的な視認包囲によって測定され得る。ランダムに選択された向きで開始してもよい。パノラマビューの場合では、パノラマビューの「スライス」が、「開始」ビューの中心に置かれて使用され得る。多数のビュー/画像の場合では、開始場所の中心に最も近い画像が使用される。 2. The first view (“starting view”) is given to the visual attention model. The view can be measured by a typical visual siege where someone initiates their visual foraging (eg, in a store row, it may be looking “forward” towards the cashier). You may start with a randomly selected orientation. In the case of a panoramic view, a “slice” of the panoramic view may be used centered on the “start” view. In the case of multiple views / images, the image that is closest to the center of the starting location is used.
3.「開始ビュー」は、視覚的注意モデルで解析される。初期の凝視は、モデルによって予測される。この凝視の方向が計算される(これは三角法を使用して実施され得る)。パノラマビューが使用される場合、パノラマビューの新しい「スライス」が、この新しい凝視の中心にされる。多数の画像が使用される場合、新しい凝視に最も近く中心にされる画像が使用される。 3. The “starting view” is analyzed with a visual attention model. The initial gaze is predicted by the model. The direction of this gaze is calculated (this can be done using trigonometry). If a panoramic view is used, the new “slice” of the panoramic view is centered on this new gaze. If multiple images are used, the image that is closest and centered on the new gaze is used.
4.この新しいビューを備えて、システムは次の顕著性のある領域を解析する。 4). With this new view, the system analyzes the next significant area.
a.このプロセスは次いで、繰り返す(凝視を決定し、視点を中心に置く)。 a. This process is then repeated (determining the gaze and centering the viewpoint).
いくつかの非限定的な例が以下に提供され、これらはどのように前述のシステム及び方法が実用化され得るかということを示す。 Some non-limiting examples are provided below, which show how the aforementioned systems and methods can be implemented.
実施例1:外部変動を使用する、堅牢性の計算
背景:ホテルのオーナーは2つのデジタル表示をホテルのロビーに設置したいと思っている。彼女は、顧客がそれらに気付いて欲しく、3つの潜在的な場所のいずれかにそれらを置くことができ、2つのデジタル表示の、3つの可能性のある構成となった(すなわち、場所1〜2、1〜3、又は2〜3における表示)。堅牢性は、気付かれるために最も良い表示の場所を推薦するために算出される。
Example 1: Calculation of robustness using external variation Background: The hotel owner wants to install two digital displays in the hotel lobby. She wanted the customer to notice them and put them in any of the three potential locations, resulting in three possible configurations of two digital displays (ie locations 1 Display in 2, 1-3, or 2-3). Robustness is calculated to recommend the best display location to be noticed.
1.デジタルカメラを使用してホテルのロビーの画像を捕捉し、この画像を、注意モデルを走らせることができるコンピュータにダウンロードする。コンピュータは、Matlab(登録商標)(The MathWorks(Natick,Massachusetts)から入手可能)と共に、インストールされた視覚的注意モデルソフトウェア(例えばKoch & Itti)を有する。 1. A digital camera is used to capture an image of the hotel lobby and download this image to a computer that can run the attention model. The computer has installed visual attention model software (eg, Koch & Itti) with Matlab® (available from The MathWorks, Natick, Massachusetts).
2.画像を修正してシミュレーションされたデザイン表示を含む。3つの修正された画像を生成し、それぞれは3つの潜在的な場所において2つの表示の全ての組み合わせが作られるように、それぞれ2つのデジタル表示をシミュレーションする。Photoshop(登録商標)(Adobe Co.(San Jose,CA)から入手可能)など、標準のデジタル写真操作プログラムを使用する。各シミュレーションされたデザイン表示は、正しく拡大縮小され、コンテンツ、例えばホテルのロゴのグラフィックなどコンテンツをシミュレーションした。ピクセルのアドレスによって定義されたように、コンピュータ上のファイル内の3つのデジタル表示の場所のそれぞれと関連して、画像領域を保存する。 2. Includes simulated design displays with image modifications. Three modified images are generated, each simulating two digital displays, such that all combinations of the two displays are made at three potential locations. Standard digital photo manipulation programs such as Photoshop® (available from Adobe Co. (San Jose, Calif.)) Are used. Each simulated design display was scaled correctly to simulate content, such as a hotel logo graphic. An image area is stored in association with each of the three digital display locations in the file on the computer, as defined by the pixel address.
3.注意モデルを介して修正された画像を走らせる。出力は修正された画像の予測された顕著性のある領域を含む。それぞれ顕著性のある領域は、ステップ2で保存されたデジタル表示ピクセルアドレスと比較される。顕著性のある領域が保存されたピクセルのアドレス内にある、又はそれと重なり合う場合、期待された注意は望ましい場所に行く。3つの修正された画像のそれぞれは、上位10の凝視状態にあるデジタル表示を示し、したがって3つの場所のいずれかがを良好な候補であるということを確認する。
3. Run the modified image through the attention model. The output includes the predicted salient areas of the modified image. Each significant area is compared to the digital display pixel address stored in
4.一連の静止写真を使用して、又はビデオ及びビデオストリームからのサンプル画像のいずれかを使用して、同じシーンの複数の画像を捕捉する。画像は16時間にわたって毎5分とられ、したがって、シーンの外部変動を捕捉し、照明状態及び歩行者の動きの変動となる。目標は、これらのタイプの変動(照明及び歩行者の動作)に、このタイプの変動に対して耐性のある表示場所を有する。コンピュータにこれらの画像をロードし、ステップ2で記載されたようにそれらをシミュレーションされたデジタル表示と共に修正する。
4). Multiple images of the same scene are captured using either a series of still pictures or using sample images from a video and video stream. Images are taken every 5 minutes for 16 hours, thus capturing external variations in the scene, resulting in variations in lighting conditions and pedestrian movement. The target has a display location that is resistant to these types of variations (lighting and pedestrian behavior). Load these images into the computer and modify them with the simulated digital display as described in
5.ステップ4からのそれぞれ修正された画像は、注意モデルによって解析され、ステップ3に記載されたように、保存されたピクセルアドレスを比較される。表示場所1及び2に関連する修正された画像のシリーズは、画像の20%において、予測された凝視が両方のデジタル表示場所に行くということを示した。同様に、場所1及び3は、両方の表示場所に行く凝視の35%を有し、一方で、場所2は、両方の表示場所に行く凝視の85%を有する。場所2及び3において設置された表示を有することは、最も耐性のある構成となり、ホテルにとって最良の解を提供する。この解をホテルのオーナーに推薦した。
5. Each modified image from step 4 is analyzed by the attention model and compared to the stored pixel addresses as described in
実施例2:内部変動を使用する、堅牢性の計算
背景:ホテルのオーナーは2つのデジタル表示をホテルのロビーに設置したいと思っている。彼女は、顧客がそれらに気付いて欲しく、3つの潜在的な場所の1つにそれらを置くことができ、2つのデジタル表示の、3つの可能性のある構成となった(すなわち、場所1〜2、1〜3、又は2〜3における表示)。堅牢性は、気付かれるために最も良い表示の場所を推薦するために算出される。
Example 2: Robustness calculation using internal variation Background: The hotel owner wants to install two digital displays in the hotel lobby. She wanted the customer to notice them and put them in one of three potential locations, resulting in three possible configurations of two digital displays (ie, locations 1 Display in 2, 1-3, or 2-3). Robustness is calculated to recommend the best display location to be noticed.
1.デジタルカメラを使用してホテルのロビーの画像を捕捉し、この画像を、注意モデルを走らせることができる汎用コンピュータにダウンロードする。コンピュータは、Matlab(登録商標)(The MathWorks(Natick,Massachusetts)から入手可能)と共に、インストールされた視覚的注意モデルソフトウェア(例えばKoch & Itti)を有する。 1. A digital camera is used to capture the image of the hotel lobby and download this image to a general-purpose computer that can run the attention model. The computer has installed visual attention model software (eg, Koch & Itti) with Matlab® (available from The MathWorks, Natick, Massachusetts).
2.画像を修正してシミュレーションされたデザイン表示を含む。3つの修正された画像を生成し、それぞれは3つの潜在的な場所において2つの表示の全ての組み合わせが作られるように、それぞれ2つのデジタル表示をシミュレーションする。Photoshop(登録商標)(Adobe Co.(San Jose,CA)から入手可能)など、標準のデジタル写真操作プログラムを使用する。各シミュレーションされたデザイン表示は、正しく拡大縮小され、コンテンツ、例えばホテルのロゴのグラフィックなどコンテンツをシミュレーションした。ピクセルのアドレスによって定義されたように、コンピュータ上のファイル内の3つのデジタル表示の場所のそれぞれと関連して、画像領域を保存する。 2. Includes simulated design displays with image modifications. Three modified images are generated, each simulating two digital displays, such that all combinations of the two displays are made at three potential locations. Standard digital photo manipulation programs such as Photoshop® (available from Adobe Co. (San Jose, Calif.)) Are used. Each simulated design display was scaled correctly to simulate content, such as a hotel logo graphic. An image area is stored in association with each of the three digital display locations in the file on the computer, as defined by the pixel address.
3.注意モデルを介して修正された画像を走らせる。出力は修正された画像の予測された顕著性のある領域を含む。それぞれ顕著性のある領域は、ステップ2で保存されたデジタル表示ピクセルアドレスと比較される。顕著性のある領域が保存されたピクセルのアドレス内にある、又はそれと重なり合う場合、期待された注意は望ましい場所に行く。3つの修正された画像のそれぞれは、上位10の凝視状態にあるデジタル表示を示し、したがって3つの場所のいずれかがを良好な候補であるということを確認する。
3. Run the modified image through the attention model. The output includes the predicted salient areas of the modified image. Each significant area is compared to the digital display pixel address stored in
4.ステップ1に指定されたように、Koch & Ittiの基本的な視覚的注意モデルと共に開始する。修正された画像(例えば100のモデル変動)の解析に利用するためのモデル変動の数を指定する。各視覚的注意モデルは3つの異なる特徴マップ(色、向き、及び輝度)を有し、顕著性マップはこれらのマップのそれぞれの、重み付けされた組み合わせとして算出される。基本的な視覚的注意モデルは、各マップに対する重み付けパラメータを等しいように(1,1,1)設定する。100のモデル変動を作るために、各モデルの重み付けベクトルをランダムに設定する。これは、各重み付けをランダムに設定し、重み付けの合計を3に標準化するアルゴリズムによって完了される(3*(RandWeights/sum(RandWeights))。 4). Start with the basic visual attention model of Koch & Itti, as specified in Step 1. Specifies the number of model variations to be used for analysis of a modified image (eg, 100 model variations). Each visual attention model has three different feature maps (color, orientation, and brightness), and the saliency map is calculated as a weighted combination of each of these maps. The basic visual attention model sets the weighting parameters for each map to be equal (1, 1, 1). In order to create 100 model variations, the weighting vector for each model is set randomly. This is completed by an algorithm that sets each weighting randomly and normalizes the total weighting to 3 (3 * (RandWeights / sum (RandWeights)).
5.100の視覚的注意モデルの変動(100のランダムに重み付けしている値によって定義される)によって各画像を解析し、ステップ2及び3に記載されているように、これらの結果を保存されたピクセルアドレスと比較する。デジタル表示場所1及び2に関連する修正された画像のシリーズは、予測された凝視が両方のデジタル表示場所に、画像の20%に行くとことを示す。同様に、場所1及び3は、両方の表示場所に行く凝視の35%を有し、一方で、場所2及び3は、両方の表示場所に行く凝視の85%を有する。場所2及び3において設置された表示を有することは、ホテルにとって最も耐性のある構成となる。この推薦をホテルのオーナーに提供する。
5. Analyze each image by 100 visual attention model variations (defined by 100 randomly weighted values) and save these results as described in
実施例3:シーン最適化
背景:ホテルのオーナーは、彼女のロビー及び2つのデジタル表示に表示されるコンテンツを視覚的に最適化したいと思う。彼女の具体的な視覚目標は、顧客が4つの標的オブジェクトに気付くことである:第1及び第2デジタル表示、ホテルのレストランを広告する静止グラフィック表示、及びチェックインカウンタの後ろにいるスタッフ。
Example 3: Scene Optimization Background: A hotel owner wants to visually optimize the content displayed in her lobby and two digital displays. Her specific visual goal is for the customer to notice four target objects: a first and second digital display, a static graphic display advertising a hotel restaurant, and a staff behind a check-in counter.
1.最適化オプションのためのスコアを生成するために、標的オブジェクトに注意を引いた変化には報酬が与えられ、現実世界のコストは、許容可能な変化に関連付けられる。労働力及び供給コストに関連する、ドルで見積もられたコストは、以下のように考慮される潜在的な変化に割り当てられる。 1. To generate a score for an optimization option, changes that draw attention to the target object are rewarded, and real-world costs are associated with acceptable changes. Costs estimated in dollars related to labor and supply costs are allocated to potential changes that are considered as follows.
チェックインカウンタの背後の配置された絵を移動させること:$100、
レストランの表示の背後の照明を変更すること:$2500、及び
2つのデジタル表示に表示されるコンテンツを再度デザインすること:各$250。
Move the picture placed behind the check-in counter: $ 100,
Changing the lighting behind the restaurant display: $ 2500, and redesigning the content displayed on the two digital displays: $ 250 each.
視覚的目標を達成するために割り当てられた報酬値は以下のとおり。 The reward values assigned to achieve the visual goal are:
2つのデジタル表示に注意を引き付けること:それぞれ$500、
レストランの表示に注意を引き付けること:$250、
チェックインカウンタの背後のスタッフに注意を引き付けること:$150。
Attract attention to two digital displays: $ 500 each
Attract attention to the restaurant display: $ 250
Attract attention to the staff behind the check-in counter: $ 150.
2.デジタルカメラを使用して既存のロビーの画像を捕捉し、この画像を、注意モデルを走らせることができるコンピュータにダウンロードする。コンピュータは、Matlab(登録商標)(The MathWorks,Natick,Massachusetts)と共に、視覚的注意モデリングソフトウェア(例えばKoch & Itti)を有する。 2. A digital camera is used to capture an image of an existing lobby, and this image is downloaded to a computer that can run the attention model. The computer has visual attention modeling software (eg, Koch & Itti) along with Matlab® (The MathWorks, Natick, Massachusetts).
3.可能性のある変化の全ての可能性のある組み合わせと関連付けられた複数の画像を作るために、検討される変更を反映するために画像を修正する。Photoshop(Adobe(San Jose,CA)から入手可能)など、標準のデジタル写真操作プログラムを使用する。顧客の視覚的目標に関連する標的オブジェクトのピクセルのアドレスもまた特定され、メモリに保存される。 3. To create multiple images associated with all possible combinations of possible changes, the image is modified to reflect the changes being considered. Standard digital photo manipulation programs are used, such as Photoshop (available from Adobe (San Jose, Calif.)). The address of the target object pixel associated with the customer's visual goal is also identified and stored in memory.
4.注意モデルを使用して、ステップ3からの各画像を解析し、モデルによって予測された顕著なオブジェクト、標的オブジェクトのための保存されたピクセルのアドレスと比較する。標的オブジェクトのためのピクセルのアドレスと共に、予測された視覚的注意の重なり合いによって示された、修正された画像において視覚的目標を達成するために、報酬値からの変化に対するコストを引くことによって、各シミュレーションされた構成に対してスコアが算定される。例えば、注意がレストランの表示に割り当てられるとき、絵の移動の変化を使用して、スコアは$250−$100=$150である。シミュレーションされた画像の全てを解析した後、見出された、最もコスト的に有効な解決策は、$100のコストで絵を動かし、$250のコストでコンテンツのうちの1つの色を修正することである(総コスト$350)。これらの変化は、視覚的目標の全てが、得られるのを可能にし、$1400の報酬スコア及び$1050の合計スコアを生み出す。
4). Using the attention model, each image from
実施例4:複数の視点のシーン解析
背景:実施例3から続いて、推奨された変化がなされている。ホテルのオーナーは、ホテルのロビーにおいて多数の視点から見られたときの各標的オブジェクトの視覚的顕著性を知りたいと思っている。
Example 4: Scene analysis from multiple viewpoints Background: Following Example 3, recommended changes have been made. The hotel owner wants to know the visual saliency of each target object when viewed from multiple viewpoints in the hotel lobby.
1.ロビー全体に分散された4つの関心の場所が特定され、4つのデジタル写真が、カメラを90度インクリメントにおいて回転させることによって撮られ、合計16画像となり、各画像は1つの視点を表している。画像は、デジタルカメラを使用して撮られた写真である。画像を、注意モデルを走らせることができるコンピュータにダウンロードする。コンピュータは、Matlab(登録商標)(The MathWorks,Natick,Massachusetts)と共に、視覚的注意モデルソフトウェア、例えばKoch & Ittiを有する。各視点に対して、標的オブジェクトのためのピクセルのアドレスが特定され、コンピュータのメモリに保存され、標的オブジェクトは識別子でタグ付けされた。 1. Four places of interest distributed throughout the lobby are identified and four digital photos are taken by rotating the camera in 90 degree increments for a total of 16 images, each representing one viewpoint. An image is a picture taken using a digital camera. Download the image to a computer that can run the attention model. The computer has visual attention model software, such as Koch & Itti, along with Matlab (R) (The MathWorks, Natick, Massachusetts). For each viewpoint, the address of the pixel for the target object was identified and stored in computer memory, and the target object was tagged with an identifier.
2.ステップ1からの16画像のそれぞれは、注意モデルを使用して解析される。各画像に関して、どの標的オブジェクトが見ることができ、どのオブジェクトが、注意を引き付けると予想されるかは、視覚的注意モデルによって決められる。 2. Each of the 16 images from step 1 is analyzed using an attention model. For each image, which target object can be seen and which object is expected to attract attention is determined by the visual attention model.
3.各標的オブジェクトが画像の全てにわたって見ることができる確率が算定され、それが注意を払われる確率もまた算定される。このデータは、ホテルのオーナーへの報告に示され、様々な視点からのロビーにおける視覚的特性のより良い理解をもたらす。 3. The probability that each target object can be seen across all of the images is calculated, and the probability that it is paid attention is also calculated. This data is presented in a report to the hotel owner and provides a better understanding of the visual characteristics in the lobby from various perspectives.
本明細書に記載の方法及びシステムのための例示の用途は、記載された特定の用途を超えて広い用途を有するということに注意されたい。例えば、これらの用途には小売りの環境が挙げられる。 Note that the exemplary applications for the methods and systems described herein have broad application beyond the specific applications described. For example, these applications include retail environments.
Claims (2)
前記シーンに対する許容可能な変更を定義する入力を受信することと、
前記許容可能な変更の少なくともいくつかに、コストの見積りを割り当てることと、
修正されたシーンを作るように、前記定義された許容可能な変更と一致する、前記複数のオブジェクトのいくつかを自動的に修正することと、
視覚的注意モデルを用いて、前記修正されたシーンを評価することと、
前記評価に基づいて、前記シーンに関する前記少なくとも1つの視覚的目標を達成する、前記修正されたシーンの少なくともいくつかを決定することと、を含む、コンピュータ実行型の方法。 It is desired to define at least one visual goal for a scene, wherein the scene consists of a plurality of objects, and the visual goal is predicted to be paid attention by a visual attention model Specifying and defining at least one object in the scene;
Receiving input defining acceptable changes to the scene;
Assigning a cost estimate to at least some of the allowable changes;
Automatically modifying some of the plurality of objects consistent with the defined acceptable changes to create a modified scene;
Using a visual attention model to evaluate the modified scene;
Determining at least some of the modified scenes that achieve the at least one visual goal for the scene based on the evaluation.
プロセッサ及びメモリと、
シーン最適化モジュールであって、
(1)プロパティを有する複数のオブジェクトからなるシーンに関する関して、少なくとも1つの視覚的目標を定義する入力を受信し、
(2)どのように前記プロパティが変更され得るかを定義する、許容可能な変更を定義する入力を受信し、
(3)前記許容可能な変更をコストの見積りと関連付けし、
(4)前記許容可能な変更と一致する前記オブジェクトのプロパティを変更することによって、変更されたシーンを生成し、
(5)視覚的注意モジュールと相互作用して、どの変更されたシーンが前記視覚的目標を達成するかを決定し、及び
(6)前記修正されたシーンの少なくともいくつかにおいて関連する前記コストを決定するように、少なくとも機能する、シーン最適化モジュールと、
前記シーンを評価し、視覚的注意を引き付ける傾向がある、前記シーン内のオブジェクトを予測するように機能する視覚的注意モジュールと、を含む、コンピュータシステム。 A computer system,
A processor and memory;
A scene optimization module,
(1) receiving an input defining at least one visual goal with respect to a scene comprising a plurality of objects having properties;
(2) receiving an input defining an acceptable change that defines how the property can be changed;
(3) associating said acceptable changes with a cost estimate;
(4) generating a modified scene by changing a property of the object that matches the allowable change;
(5) interacting with the visual attention module to determine which modified scene achieves the visual goal; and (6) the cost associated with at least some of the modified scenes. A scene optimization module that at least functions to determine, and
A visual attention module that functions to predict objects in the scene that tend to evaluate the scene and attract visual attention.
Applications Claiming Priority (3)
| Application Number | Priority Date | Filing Date | Title |
|---|---|---|---|
| US10262508P | 2008-10-03 | 2008-10-03 | |
| US61/102,625 | 2008-10-03 | ||
| PCT/US2009/059243 WO2010039966A1 (en) | 2008-10-03 | 2009-10-01 | Systems and methods for optimizing a scene |
Publications (3)
| Publication Number | Publication Date |
|---|---|
| JP2012504828A JP2012504828A (en) | 2012-02-23 |
| JP2012504828A5 JP2012504828A5 (en) | 2012-11-22 |
| JP5563580B2 true JP5563580B2 (en) | 2014-07-30 |
Family
ID=41394073
Family Applications (1)
| Application Number | Title | Priority Date | Filing Date |
|---|---|---|---|
| JP2011530238A Expired - Fee Related JP5563580B2 (en) | 2008-10-03 | 2009-10-01 | System and method for optimizing a scene |
Country Status (8)
| Country | Link |
|---|---|
| US (1) | US9131204B2 (en) |
| EP (1) | EP2359336A1 (en) |
| JP (1) | JP5563580B2 (en) |
| KR (1) | KR20110086010A (en) |
| CN (1) | CN102239505B (en) |
| AU (1) | AU2009298428B2 (en) |
| CA (1) | CA2739023C (en) |
| WO (1) | WO2010039966A1 (en) |
Families Citing this family (25)
| Publication number | Priority date | Publication date | Assignee | Title |
|---|---|---|---|---|
| WO2013109457A2 (en) * | 2012-01-16 | 2013-07-25 | 3M Innovative Properties Company | Systems and methods for rule-based content optimization |
| EP3992921A1 (en) * | 2013-06-12 | 2022-05-04 | 3M Innovative Properties Company | Presenting results of visual attention modeling |
| US9432703B2 (en) * | 2014-11-17 | 2016-08-30 | TCL Research America Inc. | Method and system for inserting contents into video presentations |
| KR101623826B1 (en) * | 2014-12-10 | 2016-05-24 | 주식회사 아이디스 | Surveillance camera with heat map |
| US10235808B2 (en) * | 2015-08-20 | 2019-03-19 | Microsoft Technology Licensing, Llc | Communication system |
| GB2545661A (en) * | 2015-12-21 | 2017-06-28 | Nokia Technologies Oy | A method for analysing media content |
| US10163251B2 (en) | 2016-03-25 | 2018-12-25 | Outward, Inc. | Arbitrary view generation |
| US10163250B2 (en) | 2016-03-25 | 2018-12-25 | Outward, Inc. | Arbitrary view generation |
| US11232627B2 (en) | 2016-03-25 | 2022-01-25 | Outward, Inc. | Arbitrary view generation |
| US11989821B2 (en) | 2016-03-25 | 2024-05-21 | Outward, Inc. | Arbitrary view generation |
| US11222461B2 (en) | 2016-03-25 | 2022-01-11 | Outward, Inc. | Arbitrary view generation |
| US11972522B2 (en) | 2016-03-25 | 2024-04-30 | Outward, Inc. | Arbitrary view generation |
| US9996914B2 (en) | 2016-03-25 | 2018-06-12 | Outward, Inc. | Arbitrary view generation |
| US10163249B2 (en) | 2016-03-25 | 2018-12-25 | Outward, Inc. | Arbitrary view generation |
| US11989820B2 (en) | 2016-03-25 | 2024-05-21 | Outward, Inc. | Arbitrary view generation |
| US9830529B2 (en) * | 2016-04-26 | 2017-11-28 | Xerox Corporation | End-to-end saliency mapping via probability distribution prediction |
| US9600939B1 (en) * | 2016-05-19 | 2017-03-21 | Augmently, LLC | Augmented reality platform using captured footage from multiple angles |
| US10366540B2 (en) | 2017-03-23 | 2019-07-30 | Htc Corporation | Electronic apparatus and method for virtual reality or augmented reality system |
| US10445614B2 (en) * | 2017-04-16 | 2019-10-15 | Facebook, Inc. | Systems and methods for evaluating content |
| EP3496099A1 (en) | 2017-12-08 | 2019-06-12 | Nokia Technologies Oy | Method and apparatus for defining a storyline based on path probabilities |
| EP3496100A1 (en) | 2017-12-08 | 2019-06-12 | Nokia Technologies Oy | Method and apparatus for applying video viewing behavior |
| CN111582002A (en) * | 2019-02-15 | 2020-08-25 | 北京小米移动软件有限公司 | Scene recognition method and device and electronic equipment |
| EP4055567A4 (en) * | 2019-11-08 | 2023-12-06 | Outward, Inc. | Arbitrary view generation |
| CN111460570B (en) * | 2020-05-06 | 2023-01-06 | 北方工业大学 | Complex structure node auxiliary construction method based on BIM technology |
| CN113139667B (en) * | 2021-05-07 | 2024-02-20 | 深圳他米科技有限公司 | Hotel room recommending method, device, equipment and storage medium based on artificial intelligence |
Family Cites Families (17)
| Publication number | Priority date | Publication date | Assignee | Title |
|---|---|---|---|---|
| KR100821847B1 (en) * | 2000-02-17 | 2008-04-11 | 브리티쉬 텔리커뮤니케이션즈 파블릭 리미티드 캄퍼니 | Visual attention system |
| US20020154833A1 (en) * | 2001-03-08 | 2002-10-24 | Christof Koch | Computation of intrinsic perceptual saliency in visual environments, and applications |
| US7130461B2 (en) * | 2002-12-18 | 2006-10-31 | Xerox Corporation | Systems and method for automatically choosing visual characteristics to highlight a target against a background |
| US7260261B2 (en) * | 2003-02-20 | 2007-08-21 | Microsoft Corporation | Systems and methods for enhanced image adaptation |
| US7471827B2 (en) * | 2003-10-16 | 2008-12-30 | Microsoft Corporation | Automatic browsing path generation to present image areas with high attention value as a function of space and time |
| GB2415562B (en) | 2004-06-23 | 2007-11-21 | Hewlett Packard Development Co | Image processing |
| GB2417808A (en) | 2004-09-02 | 2006-03-08 | Hewlett Packard Development Co | Document creation system |
| US7548936B2 (en) * | 2005-01-12 | 2009-06-16 | Microsoft Corporation | Systems and methods to present web image search results for effective image browsing |
| US7595809B2 (en) * | 2005-05-11 | 2009-09-29 | Hewlett-Packard Development Company, L.P. | Method and system for determining an occlusion cost for concurrently presenting one or more images in a shared viewing region |
| EP1793344A1 (en) * | 2005-11-30 | 2007-06-06 | THOMSON Licensing | Method of emendation for attention trajectory in video content analysis |
| US20070156382A1 (en) * | 2005-12-29 | 2007-07-05 | Graham James L Ii | Systems and methods for designing experiments |
| US7620267B2 (en) | 2006-04-28 | 2009-11-17 | Hewlett-Packard Development Company, L.P. | Collage generation with occlusion costing |
| US7848596B2 (en) * | 2006-05-24 | 2010-12-07 | Hewlett-Packard Development Company, L.P. | Templated collage generation with occlusion costing |
| US7668400B2 (en) | 2006-07-31 | 2010-02-23 | Hewlett-Packard Development Company, L.P. | Image layout constraint generation |
| CN1945628A (en) * | 2006-10-20 | 2007-04-11 | 北京交通大学 | Video frequency content expressing method based on space-time remarkable unit |
| US8577156B2 (en) * | 2008-10-03 | 2013-11-05 | 3M Innovative Properties Company | Systems and methods for multi-perspective scene analysis |
| US8358855B2 (en) * | 2009-07-08 | 2013-01-22 | Honeywell International Inc. | Determining probabilities from compared covariance appearance models to detect objects of interest in images |
-
2009
- 2009-10-01 CN CN200980148605.2A patent/CN102239505B/en not_active Expired - Fee Related
- 2009-10-01 WO PCT/US2009/059243 patent/WO2010039966A1/en active Application Filing
- 2009-10-01 KR KR20117009778A patent/KR20110086010A/en not_active Application Discontinuation
- 2009-10-01 EP EP09793250A patent/EP2359336A1/en not_active Ceased
- 2009-10-01 AU AU2009298428A patent/AU2009298428B2/en not_active Ceased
- 2009-10-01 CA CA2739023A patent/CA2739023C/en not_active Expired - Fee Related
- 2009-10-01 JP JP2011530238A patent/JP5563580B2/en not_active Expired - Fee Related
-
2013
- 2013-05-31 US US13/906,858 patent/US9131204B2/en active Active
Also Published As
| Publication number | Publication date |
|---|---|
| US20130259448A1 (en) | 2013-10-03 |
| EP2359336A1 (en) | 2011-08-24 |
| JP2012504828A (en) | 2012-02-23 |
| CA2739023A1 (en) | 2010-04-08 |
| US9131204B2 (en) | 2015-09-08 |
| CA2739023C (en) | 2017-07-04 |
| CN102239505B (en) | 2014-10-22 |
| CN102239505A (en) | 2011-11-09 |
| KR20110086010A (en) | 2011-07-27 |
| WO2010039966A1 (en) | 2010-04-08 |
| AU2009298428B2 (en) | 2013-03-14 |
| AU2009298428A1 (en) | 2010-04-08 |
Similar Documents
| Publication | Publication Date | Title |
|---|---|---|
| JP5563580B2 (en) | System and method for optimizing a scene | |
| JP5486006B2 (en) | System and method for evaluating robustness | |
| JP5667061B2 (en) | System and method for scene analysis of multiple viewpoints | |
| US8577156B2 (en) | Systems and methods for multi-perspective scene analysis | |
| US20180101629A1 (en) | Systems and methods for improving visual attention models |
Legal Events
| Date | Code | Title | Description |
|---|---|---|---|
| A521 | Request for written amendment filed |
Free format text: JAPANESE INTERMEDIATE CODE: A523 Effective date: 20120928 |
|
| A621 | Written request for application examination |
Free format text: JAPANESE INTERMEDIATE CODE: A621 Effective date: 20120928 |
|
| A977 | Report on retrieval |
Free format text: JAPANESE INTERMEDIATE CODE: A971007 Effective date: 20131030 |
|
| A131 | Notification of reasons for refusal |
Free format text: JAPANESE INTERMEDIATE CODE: A131 Effective date: 20131112 |
|
| TRDD | Decision of grant or rejection written | ||
| A01 | Written decision to grant a patent or to grant a registration (utility model) |
Free format text: JAPANESE INTERMEDIATE CODE: A01 Effective date: 20140513 |
|
| A61 | First payment of annual fees (during grant procedure) |
Free format text: JAPANESE INTERMEDIATE CODE: A61 Effective date: 20140612 |
|
| R150 | Certificate of patent or registration of utility model |
Ref document number: 5563580 Country of ref document: JP Free format text: JAPANESE INTERMEDIATE CODE: R150 |
|
| R250 | Receipt of annual fees |
Free format text: JAPANESE INTERMEDIATE CODE: R250 |
|
| R250 | Receipt of annual fees |
Free format text: JAPANESE INTERMEDIATE CODE: R250 |
|
| R250 | Receipt of annual fees |
Free format text: JAPANESE INTERMEDIATE CODE: R250 |
|
| R250 | Receipt of annual fees |
Free format text: JAPANESE INTERMEDIATE CODE: R250 |
|
| R250 | Receipt of annual fees |
Free format text: JAPANESE INTERMEDIATE CODE: R250 |
|
| LAPS | Cancellation because of no payment of annual fees |