JP5520380B2 - Methods, products, and apparatus for creating and visualizing temperature zones - Google Patents
Methods, products, and apparatus for creating and visualizing temperature zones Download PDFInfo
- Publication number
- JP5520380B2 JP5520380B2 JP2012524761A JP2012524761A JP5520380B2 JP 5520380 B2 JP5520380 B2 JP 5520380B2 JP 2012524761 A JP2012524761 A JP 2012524761A JP 2012524761 A JP2012524761 A JP 2012524761A JP 5520380 B2 JP5520380 B2 JP 5520380B2
- Authority
- JP
- Japan
- Prior art keywords
- airflow
- location
- space
- region
- given
- Prior art date
- Legal status (The legal status is an assumption and is not a legal conclusion. Google has not performed a legal analysis and makes no representation as to the accuracy of the status listed.)
- Active
Links
Images


Classifications
-
- G—PHYSICS
- G06—COMPUTING; CALCULATING OR COUNTING
- G06F—ELECTRIC DIGITAL DATA PROCESSING
- G06F1/00—Details not covered by groups G06F3/00 - G06F13/00 and G06F21/00
- G06F1/16—Constructional details or arrangements
- G06F1/20—Cooling means
- G06F1/206—Cooling means comprising thermal management
-
- G—PHYSICS
- G06—COMPUTING; CALCULATING OR COUNTING
- G06F—ELECTRIC DIGITAL DATA PROCESSING
- G06F30/00—Computer-aided design [CAD]
- G06F30/10—Geometric CAD
- G06F30/13—Architectural design, e.g. computer-aided architectural design [CAAD] related to design of buildings, bridges, landscapes, production plants or roads
-
- H—ELECTRICITY
- H05—ELECTRIC TECHNIQUES NOT OTHERWISE PROVIDED FOR
- H05K—PRINTED CIRCUITS; CASINGS OR CONSTRUCTIONAL DETAILS OF ELECTRIC APPARATUS; MANUFACTURE OF ASSEMBLAGES OF ELECTRICAL COMPONENTS
- H05K7/00—Constructional details common to different types of electric apparatus
- H05K7/20—Modifications to facilitate cooling, ventilating, or heating
- H05K7/20709—Modifications to facilitate cooling, ventilating, or heating for server racks or cabinets; for data centers, e.g. 19-inch computer racks
- H05K7/20836—Thermal management, e.g. server temperature control
Description
本発明は、空気流分析に関し、より具体的には、データ・センタなどのスペース内の温度ゾーン(thermal zone)をモデル化するために空気流分布を使用するための技法に関する。 The present invention relates to airflow analysis, and more particularly to techniques for using airflow distribution to model a thermal zone in a space such as a data center.
大規模なコンピューティング施設(またはデータ・センタ)にとって、エネルギー・コストの上昇、エネルギーの需要と供給、および、高性能が多大に要求される情報通信技術(ICT)機器の急増によって引き起こされる、エネルギー消費は、重要な問題となってきている。データ・センタは、全世界の総電力のおよそ2%、すなわち1830億キロワット(KW)時の電力を消費し、この電力消費は毎年12%の割合で増加している。この電力消費のかなりの割合、すなわち最高50%が、発熱機器の冷却に向けられている。したがって、データ・センタのエネルギーおよび冷却効率の改善は非常に重要である。最良実施例が広く公表されてはいるが、データ・センタのオペレータは適切な冷却量を設定することに苦心している。特に、データ・センタ内の異なる熱密度(すなわち、データ・センタ内の異なる領域が非常に異なる冷却量を必要とする可能性がある)を考慮することは困難である。 For large computing facilities (or data centers), the energy caused by rising energy costs, energy demand and supply, and the proliferation of information and communications technology (ICT) equipment that demands high performance Consumption has become an important issue. Data centers consume approximately 2% of total global power, or 183 billion kilowatt hours (KW), and this power consumption is growing at a rate of 12% annually. A significant percentage of this power consumption, ie up to 50%, is devoted to cooling the heat generating equipment. Therefore, improving the energy and cooling efficiency of the data center is very important. Although the best practice is widely published, data center operators are struggling to set an appropriate amount of cooling. In particular, it is difficult to consider the different heat densities in the data center (ie, different regions in the data center may require very different amounts of cooling).
したがって、データ・センタ内の熱密度を明らかにすること、およびそれによって冷却効率を上昇させることを対象とする技法が望ましい。 Therefore, techniques that are aimed at identifying the heat density in the data center and thereby increasing the cooling efficiency are desirable.
本発明は、温度ゾーンをモデル化するために空気流分布を使用するための技法を提供する。本発明の一態様では、たとえばデータ・センタなどのスペース内の温度ゾーンをモデル化するための方法が提供される。方法は以下の諸ステップを含む。スペースのグラフィック表示が提供される。モデル化するためにスペース内で少なくとも1つの領域(以下、ドメインともいう)が画定される。複数のノードを相互接続する細分化領域(以下、サブドメインともいう)のセットにドメインを細分化することによって、ドメイン内にメッシュが作成される。ドメイン内の空気流がドメイン内に入る場所(空気流流入場所,以下、空気流のソースともいう)および空気流がドメインを出る場所(空気流流出場所,以下、空気流のシンクともいう)が識別される。空気流のソースおよびシンクのうちの1つまたは複数から、空気流測定値が取得される。空気流のソースおよびシンクから取得された空気流測定値を使用して、それぞれのサブドメインの中心の空気流速度ベクトルが決定される。各速度ベクトルは空気流ソースのうちの1つへとトレースされ、空気流ソースのうちの所与の1つへのトレースの組み合わせが、スペース内の温度ゾーンを表す。 The present invention provides a technique for using airflow distribution to model temperature zones. In one aspect of the invention, a method is provided for modeling a temperature zone in a space, such as a data center. The method includes the following steps. A graphic representation of the space is provided. At least one region (hereinafter also referred to as a domain ) is defined in the space for modeling. A mesh is created in a domain by subdividing the domain into a set of subdivided regions (hereinafter also referred to as subdomains ) interconnecting a plurality of nodes. Where the airflow in the domain enters the domain (airflow inflow place, hereinafter also referred to as airflow source ) and where the airflow exits the domain (airflow outflow place, hereinafter also referred to as airflow sink ) Identified. Airflow measurements are obtained from one or more of the airflow sources and sinks. Airflow measurements taken from the airflow source and sink are used to determine the airflow velocity vector at the center of each subdomain. Each velocity vector is traced to one of the air flow sources, and the combination of traces to a given one of the air flow sources represents a temperature zone in the space.
以下の詳細な説明および図面を参照することによって、本発明ならびに本発明の他の特徴および利点がさらに完全に理解されよう。 The invention and other features and advantages of the invention will be more fully understood by reference to the following detailed description and drawings.
本明細書には、データ・センタに関する冷却の、より適切な提供およびより効率的な使用を可能にする、温度ゾーンを動的に作成および視覚化するための技法が提示されている。本技法について、データ・センタの冷却システムとの関連において説明されているが、本明細書に提示された概念は、一般に、冷却システムあるいは加熱システムまたはその両方に全体として適用可能であることに留意されたい。 Provided herein are techniques for dynamically creating and visualizing temperature zones that allow for a better provision and more efficient use of cooling for a data center. Although the technique is described in the context of a data center cooling system, it should be noted that the concepts presented herein are generally applicable to cooling systems and / or heating systems in general. I want to be.
図1は、例示的データ・センタ100を示す図である。データ・センタ100は、サーバ・ラック101と、熱気を(典型的には上から、空調ユニット(ACU)内の1つまたは複数の空気の戻りを通じて)取り込み、冷却気を下の下地床プレナム(plenum)に排出する空調ユニット(ACU)を備えた、高床冷却システム102(コンピュータ室空調装置(CRAC)とも呼ばれることがある)とを有する。データ・センタ100を通る熱気流は白矢印110で示され、データ・センタ100を通る冷却気は黒矢印112で示される。以下の説明では、下地床プレナムの上のデータ・センタは単に高床と呼び、下地床プレナムは単にプレナムと呼ぶことがある。したがって単なる例を挙げると、図1に示されるように、ACUは温かい空気を高床から取り込み、冷却気をプレナム内に放出する(以下を参照のこと)。
FIG. 1 is a diagram illustrating an
図1では、サーバ・ラック101は前面から背面への冷却を使用し、下に下地床104を備えた高床106上に配置される。すなわちこの方式に従えば、冷却気は各ラックの前面(吸気口)を通って引き込まれ、暖気は各ラックの背面(排気口)から排出される。ラックの前面に引き込まれた冷却気は、内部の各情報技術(IT)機器コンポーネント(たとえばサーバ)の吸気口へと供給される。高床106と下地床104との間のスペースが、下地床プレナム108を画定する。下地床プレナム108は、たとえばACU102からラックへの冷却気を移送するための導管として働く。図1に示されるように、高床106は、複数のフロア・タイルからなり、そのうちのいくつかは穿孔されている。適切に組織化されたデータ・センタ(データ・センタ100など)では、ラック101は、暖気通路冷気通路構成、すなわち、交互方向に吸気口と排気口とを有するように配置構成される。すなわち、冷却気は、下地床プレナム108から冷気通路内へと、穿孔されたフロア・タイル114(通気孔(vent)とも呼ばれる)を通って高床106に吹き込まれる。その後、冷却気は、ラックの吸気口側にある吸気口を介してラック101内に引き込まれ、ラックの排気口側にある排気口を介して、暖気通路内へと放出される。
In FIG. 1,
ACUは、典型的には、冷凍冷蔵プラント(図示せず)から冷水を受け取る。各ACUは、典型的には、ACUを介して空気を循環させ、たとえば下地床プレナム内へ冷却気を吹き込むための、ブロワ・モータ(blower motor)を備える。したがって、ほとんどのデータ・センタでは、ACUは、主に冷却気を下地床プレナム内へ吹き込むために必要な電力を消費する、単純な熱交換器である。典型的には、サーバ・ラック101への電力を配分する、1つまたは複数の電力配分装置(PDU)(図示せず)が存在する。
The ACU typically receives chilled water from a refrigeration plant (not shown). Each ACU typically includes a blower motor for circulating air through the ACU, for example, to blow cooling air into the ground floor plenum. Thus, in most data centers, the ACU is a simple heat exchanger that consumes mainly the power required to blow cooling air into the ground floor plenum. There are typically one or more power distribution units (PDUs) (not shown) that distribute power to the
ACUの効率を最適化することが重要である。たとえば、Hamann等の「Uncovering Energy-EfficiencyOpportunities in Data Centers」、IBM Journal of Research andDevelopment、vol.53、no.3(2009年)(以下「Hamann」とする)を参照してみる。そのために、ACUの利用率レベル(すなわち利用率(UT)=除去熱/公称熱負荷除去能力)または性能係数(COP)(COP=除去熱/ACUファンに関する電力消費)を考慮することが有用である。いくつかのデータ・センタにおけるACUの利用率レベルは、10%と低いことがわかっている(COP〜1.8)。しかしながら、効率の最適化が実践された場合、利用レベルは(何らかの冗長性を伴う場合であっても)潜在的に約80%から約100%の範囲内とし、対応するCOPはそれぞれ約14から約18とすることができる。ほとんどのデータ・センタは、何らかの冗長性を必要とする。たとえば、8つのACUを備えたデータ・センタでは、冗長性は1つのACUの障害(たとえば機械的故障による)を許容する。したがって基本的に、N+1の冗長性(N=8)とならないため、目標利用率レベルを7/8(87.5%)とすることはできない。 It is important to optimize the efficiency of the ACU. For example, see “Uncovering Energy-Efficiency Opportunities in Data Centers” by Hamann et al., IBM Journal of Research and Development, vol. 53, no. 3 (2009) (hereinafter referred to as “Hamann”). To that end, it is useful to consider the ACU utilization level (ie utilization (UT) = removed heat / nominal heat load removal capability) or performance factor (COP) (COP = removed heat / power consumption for ACU fan). is there. The utilization level of ACU in some data centers has been found to be as low as 10% (COP˜1.8). However, when efficiency optimization is practiced, the utilization level (even with some redundancy) is potentially in the range of about 80% to about 100%, and the corresponding COP is from about 14 each. It can be about 18. Most data centers require some redundancy. For example, in a data center with eight ACUs, redundancy allows for one ACU failure (eg, due to a mechanical failure). Therefore, basically, there is no N + 1 redundancy (N = 8), so the target utilization level cannot be 7/8 (87.5%).
ACU使用の最適化を阻害するものの1つが、可視性の欠如、すなわち、異なるACUがデータ・センタ内のどの物理的領域またはゾーンに対して冷却気を供給しているかが認識できないことである。温度ゾーンは、データ・センタ内の物理的領域(2次元(2D))またはボリューム(3次元(3D))である。各ACUは、本明細書では「供給ゾーン」と呼ばれることもあり、典型的にはプレナムに適用される、データ・センタ内の特定の温度ゾーンへ空気を供給する。各ACUは、本明細書では「戻りゾーン」と呼ばれることもあり、典型的には高床に適用される、データ・センタ内の特定の温度ゾーンからの戻り空気も取得する。 One of the obstacles to optimizing ACU usage is the lack of visibility, i.e., the inability to recognize which physical areas or zones in the data center are supplying cooling air to different ACUs. A temperature zone is a physical region (2D (2D)) or volume (3D (3D)) within a data center. Each ACU, sometimes referred to herein as a “supply zone”, supplies air to a particular temperature zone within the data center, typically applied to the plenum. Each ACU is sometimes referred to herein as a “return zone” and also obtains return air from a particular temperature zone within the data center, typically applied to elevated floors.
データ・センタにとっては、データ・センタのスペース全体にわたって多少ランダムに分散された、50を超えるACUを有することも珍しくはない。各ACUから生じる温度ゾーン(供給ゾーンあるいは戻りゾーンまたはその両方)は、各ACUによって生成される空気流のみならず、データ・センタ全体の通気孔または穿孔タイルの配置によっても左右される(以下のように、通気孔または穿孔タイルは、少なくとも部分的に、データ・センタ内でACUからの空気が向かう場所へと向けられるため)。データ・センタにとって、1000を超える通気孔または穿孔タイルを有することは、珍しくはない。これらの温度ゾーンは、各ACUの実際の空気流の寄与に基づくものであるため、対応する効率または性能係数(COP)を、それぞれ個々のACUのそれぞれの温度ゾーンに割り当てることができる。データ・センタ全体の空気流分布は、多くの態様によって左右される。本技法は、プレナムにゾーン概念を適用することによって、データ・センタ内の空気流分布の最も単純な形を使用する。ACUは、ファンを使用してプレナム内に空気を排出し、結果としてプレナムは加圧される。通気孔または穿孔タイルの配置は、空気が高床上のどこでプレナムを逃れるかを左右する。この通気孔/穿孔タイルの配置によって、ゾーン(すなわち、どのACUによってどの領域に供給されるか)が決定される。 It is not uncommon for a data center to have more than 50 ACUs that are distributed somewhat randomly throughout the space of the data center. The temperature zone (supply zone and / or return zone) arising from each ACU depends not only on the airflow generated by each ACU, but also on the placement of vents or perforated tiles throughout the data center (see below). As such, the vents or perforated tiles are at least partially directed to where the air from the ACU is directed in the data center). It is not uncommon for a data center to have more than 1000 vents or perforated tiles. Since these temperature zones are based on the actual airflow contribution of each ACU, a corresponding efficiency or coefficient of performance (COP) can be assigned to each temperature zone of each individual ACU. The airflow distribution throughout the data center depends on many aspects. The technique uses the simplest form of air flow distribution in the data center by applying the zone concept to the plenum. The ACU uses a fan to exhaust air into the plenum, with the result that the plenum is pressurized. The placement of vents or perforated tiles will determine where air will escape the plenum on the raised floor. This vent / perforated tile arrangement determines the zone (ie, which area is supplied by which ACU).
本明細書では、これらの温度ゾーンのモデル化、すなわち作成および視覚化のための技法が開示される。以下でより詳細に説明されるように、温度ゾーンを画定、すなわち作成するために、速度場が使用される(すなわち、ゾーンは事前に確定されないため、作成しなければならない)。ゾーンの作成/画定は、いかに効率的に各ACUが使用されているかを(COP測定によって)判別するための方法を提供するため、本技法の重要な態様である。図2は、室内、たとえばデータ・センタ100などのスペース内の、温度ゾーンをモデル化するための例示的方法200を示す図である。ステップ202では、スペースのグラフィック表示が提供される。たとえば、以下で説明される図4では、データ・センタの2次元のグラフィック表示が提供される。データ・センタの場合、グラフィック表示は、たとえばサーバ・ラック、通気孔または穿孔タイル、およびACUの、レイアウトを含むことができる。グラフィック表示は、サーバ・ラックなどの資産を「描写」する、ソフトウェア・アプリケーションを使用して作成可能である。その一例が、移動管理技術ソフトウェア・アプリケーション(図4に示されたグラフィック表示の作成に使用された)である。
Disclosed herein are techniques for modeling, ie creating and visualizing, these temperature zones. As will be described in more detail below, a velocity field is used to define or create a temperature zone (ie, the zone must be created because it is not predetermined). Zone creation / definition is an important aspect of the present technique because it provides a method for determining (by COP measurement) how efficiently each ACU is being used. FIG. 2 is a diagram illustrating an
ステップ204では、温度ゾーンのモデル化のための少なくとも1つのドメインがスペース内に画定される。各ドメインは2次元または3次元のドメインとすることができる。以下で説明されるように、データ・センタがモデル化される例示的一実施形態では、ドメインは下地床プレナムの寸法によって画定される。さらに以下で説明されるように、所与のスペースに対して複数のドメインを画定することができる。本技法が適用されるスペースの物理的レイアウトなどの特定のアプリケーションに依存して、ドメインは、スペース全体、またはその一部を含むことができる。
In
ステップ206では、スペースをモデル化するために有限要素が採用されているため、各ドメインを、複数のノードを相互接続するサブドメインのセットに細分化することによって、それぞれのドメイン内に有限要素メッシュが作成される。以下で詳細に説明されるように、サブドメイン(本明細書では「要素」とも呼ばれる)は三角形(2次元ドメインの場合)または四面体(3次元ドメインの場合)とすることができる。三角形および四面体の使用は、有限要素法において標準的な選択肢である。ノードは、xおよびyの座標(2次元ドメインの場合)またはx、y、およびzの座標(3次元ドメインの場合)に対応する。
In
ステップ208では、ドメイン内に空気流ソース(空気流がドメイン内に入る場所)および空気流シンク(空気流がドメインを出る場所)が識別される。データ・センタを参照してみると、ドメインが下地床プレナムを含む場合、穿孔タイルは空気流シンクとみなすことが可能であり(ACUによって供給される冷却気が下地床プレナムを出て高床に入る場所の穿孔タイルにあるため)、ACUは空気流ソースとみなすことが可能である(空気流がACUから発生する/下地床プレナムに入るため)。他方で、ドメインが高床を含む場合、穿孔タイルは空気流ソースとみなすことが可能であり(プレナムからの冷却気が高床に入る場所の穿孔タイルにあるため)、ACUはシンクとみなすことが可能である(暖気は循環してACU内に戻り、ACUで高床を出るため)。
In
ステップ210では、空気流測定値が、空気流ソースおよびシンクのうちの1つまたは複数から取得される。例示的実施形態によれば、これらの空気流測定値は、移動測定技術(MMT)を使用して取得される。MMTについては、Hamann等に対して発行された「Method and Apparatus for Three-DimensionalMeasurements」という名称の米国特許第7366632号(以下、「米国特許第7366632号」と呼ぶ)で説明されている。MMT V1.0は、エネルギーおよびスペースの効率を改善するために、データ・センタ・インフラストラクチャを最適化するための技術であり、最適なスペースおよび最も効率の良いエネルギー利用のために、所与の温度エンベロープ内でデータ・センタを最適化するための、データ・センタの高速計測/調査のための高度な計測技法(たとえば、米国特許第7366632号を参照のこと)と、測定基準ベースの査定およびデータ・ベースの最良実施例の実装(たとえば、整理参照番号第YOR920070242US1号として指定され、Claassen等によって出願された「Techniques for Analyzing Data Center EnergyUtilization Practices」という名称の米国特許明細書第11/750325号を参照のこと)との組み合わせを含む。
In
ステップ212では、空気流ソースおよびシンクから取得される空気流測定値は、各サブドメイン(要素)の中心の空気流速度ベクトルを決定するために使用される。潜在的流動理論を使用してこれらの空気流速度ベクトルを決定するための例示的プロセスについて、以下で詳細に説明する。
In
ステップ214では、各速度ベクトルは、空気流ソースのうちの1つへとトレースされる。ドメインが下地床プレナムを備えるデータ・センタ・モデルを参照してみると、各速度ベクトルは特定のACUへとトレースすることができる。速度ベクトルをトレースするための例示的プロセスについて、以下で詳細に説明する。空気流ソース(たとえばACU)のうちの所与の1つへのトレースの組み合わせは、スペース内の温度ゾーンを表す。例示的温度ゾーンは、たとえば以下で説明する図10に示される。
In
図2に示されるように、方法200のステップ208〜214は、ソース/シンクのうちの1つまたは複数、ドメインに追加される1つまたは複数の新しいソース/シンク、あるいは、ドメインから除去されるソース/シンクのうちの1つまたは複数、またはそれらすべてにおける、空気流の変化に応答して、反復することができる。たとえばデータ・センタを参照してみると、通気孔または穿孔タイルのうちの1つまたは複数で空気流が増加または減少する可能性がある、あるいは、通気孔または穿孔タイルのうちの1つまたは複数が再配置または除去される可能性がある、またはそれら両方の可能性がある。以下で詳細に説明されるように、有利なことには、ドメイン/有限要素メッシュが変化しない限り、これらの要素は方法の後続の反復で再利用することができる。
As shown in FIG. 2, steps 208-214 of
前述の諸ステップが反復されるごとに、空気流ソースおよびシンクから更新された空気流測定値(使用可能であれば)を獲得することが可能であるため、高速技法(instant techniques)はスペース内の状況の変化に敏感になる。単なる例として挙げると、ステップ210〜214は、更新された空気流測定データを獲得するために周期的に(たとえば所定の時間間隔で)反復することができる。所定の時間間隔は、たとえば、更新された測定データが入手可能な頻度、あるいはスペース内で変更が発生する頻度、またはその両方に基づいて、設定可能である。 As the above steps are repeated, updated air flow measurements (if available) can be obtained from the air flow source and sink, so instant techniques are in space. Be sensitive to changes in the situation. Merely by way of example, steps 210-214 may be repeated periodically (eg, at predetermined time intervals) to obtain updated airflow measurement data. The predetermined time interval can be set based on, for example, the frequency at which updated measurement data is available, the frequency at which changes occur in the space, or both.
ステップ216では、各空気流ソースについて、冷却能力が決定される。たとえばデータ・センタのモデル化を参照すると、各通気孔または穿孔タイルの冷却能力を決定することができる。冷却能力を決定するための例示的プロセスは、以下で詳細に説明する。
In
上記で明らかなように、例示的一実施形態では、空気密度が一定である(温度に依存しない)こと、境界を越えて進むこと、および粘性力が無視できることを想定した、潜在的流動理論(potential flow theory)が採用される。潜在的流動理論の一般的な説明については、たとえば、L.D.Landau等の「Fluid Mechanics」、PergamonPress(1959年)を参照されたい。 As is apparent above, in an exemplary embodiment, a potential flow theory (assuming that the air density is constant (independent of temperature), proceeds beyond the boundary, and that the viscous force is negligible ( potential flow theory). For a general explanation of latent flow theory, see, for example, “Fluid Mechanics” by L.D.Landau et al., PergamonPress (1959).
空気速度v(vx,vy,vz)が非回転(irrotational)である、すなわち回転(curl)v=0であると想定される場合、速度はスカラ関数φの勾配であるものと取ることができる。この関数φが「速度(または空気量)ポテンシャル」と呼ばれ、ポアソン方程式を満たす。言い換えれば、(空気)速度場は、適切な境界条件を伴う、以下の式の解に対応する。
![]()
![]()
ここで、fは流れのソースまたはシンクを表し、vx、vy、およびvzは、それぞれx、y、およびz方向の速度成分である。本技法に従って、乱流モデル(turbulence model)および散逸(dissipation)を含むことが可能な、他の複数の包括的な偏微分方程式(PDE)が使用可能であることに留意されたい。
If the air velocity v (v x , v y , v z ) is assumed to be non-rotational, that is, curl v = 0, the velocity is assumed to be the slope of the scalar function φ. be able to. This function φ is called “velocity (or air amount) potential” and satisfies the Poisson equation. In other words, the (air) velocity field corresponds to a solution of the following equation with appropriate boundary conditions.
![]()
![]()
Where f represents a flow source or sink, and v x , v y , and v z are velocity components in the x, y, and z directions, respectively. Note that a number of other comprehensive partial differential equations (PDEs) can be used in accordance with the present technique, which can include turbulence models and dissipation.
前述の問題に関する境界条件を提供するために、たとえば、通気孔または穿孔タイル(あるいはACUの出力)を「ソース」(
![]()
=−(測定された)穿孔タイルからの出力速度)として、ACUへの戻りを「シンク」(φ=0)として、モデル化することが可能であるが、同時にラックは、シンク(
![]()
=(測定された)吸気口ラック流れ)およびソース(
![]()
=−(測定された)排気口ラック流れ)である。前述のように、ソースおよびシンクはドメインに依存して変化する可能性がある(たとえば、ドメインが下地床プレナムを含む場合、穿孔タイルおよびACUはそれぞれシンクおよびソースであるとみなすことが可能であり、他方で、ドメインが高床を含む場合、穿孔タイルおよびACUはそれぞれソースおよびシンクであるとみなすことが可能である)。他の代替は、数式1における非ゼロの右側fを介して、ソースおよびシンクをモデル化することである。ソースまたはシンクがPDEの解ドメインの境界上に配置される場合、前者の手法が適切である(ノイマン境界条件の指定に対応する場合)。解ドメイン内に配置された(すなわち境界上にない)ソースまたはシンクの場合、数式1における非ゼロの右側fを介したモデル化の方が好適となる。
To provide boundary conditions for the aforementioned problems, for example, vents or perforated tiles (or the output of an ACU) can be “sourced” (
![]()
=-(Measured) output speed from perforated tiles) can be modeled as a “sink” (φ = 0) return to the ACU, but at the same time the rack is
![]()
= (Measured) inlet rack flow) and source (
![]()
=-(Measured) outlet rack flow). As described above, the source and sink may vary depending on the domain (eg, if the domain includes a ground floor plenum, the perforated tiles and the ACU may be considered to be sinks and sources, respectively. On the other hand, if the domain includes raised floors, the perforated tiles and the ACU can be considered as sources and sinks, respectively). Another alternative is to model the source and sink via the non-zero right f in
本明細書では、空気流ポテンシャルを算出するために有限要素解法(finite element solver)が実施される。有限要素法に関する標準的な参照については、T.J.R.Hughesによる「The Finite Element Method:Linear Static and DynamicFinite Element Analysis」第1章、Dover Publications(2000年)(初版は1987年、Prentice-Hallによって出版)を参照されたい。本技法の一実施例は、Cプログラミング言語で実行され、その後、いくつかの類似した有限要素実施は、J.Alberty等による「Remarks Around 50 Lines of Matlab: ShortFinite Element Implementation」Numerical Algorithms 20、117〜138ページ(1999年)(以下、「Alberty」)による、Matlab(R)で実施された。
Herein, a finite element solver is implemented to calculate the airflow potential. For a standard reference on finite element methods, see TJRHughes' “The Finite Element Method: Linear Static and Dynamic Finite Element Analysis”,
この解法は、指定されたドメイン内のノード、ならびに、これらのノードを接続する三角形(2次元ドメインの場合)または四面体(3次元ドメインの場合)のセットからなる、メッシュの仕様を必要とする。上記で明らかなように、三角形(または四面体)は、本明細書ではメッシュの要素とも呼ばれる。ノードは2次元ドメインの(x,y)座標(または3次元ドメインの(x,y,z)座標)に対応する。有限要素メッシュの例が、図3に示される。すなわち図3は、2次元ドメイン内に9個のノードおよび8個の要素のセットを含む、例示的有限要素メッシュ300を示す図である。8個の各要素Eおよび対応ノードの凡例が、メッシュの右側に提供されている。
This solution requires a mesh specification consisting of a set of nodes in the specified domain and the triangles (in the case of a two-dimensional domain) or tetrahedron (in the case of a three-dimensional domain) that connect these nodes. . As is apparent above, the triangle (or tetrahedron) is also referred to herein as a mesh element. The node corresponds to the (x, y) coordinates of the two-dimensional domain (or (x, y, z) coordinates of the three-dimensional domain). An example of a finite element mesh is shown in FIG. That is, FIG. 3 is a diagram illustrating an exemplary
数式1に対する近似解
![]()
が、N個の基底関数Ψiの線形結合、i=1、・・・、Nとして求められる。
![]()
がメッシュ内のj番目のノードを示すものとすると、i=jの場合は
![]()
そうでなければ
![]()
であるように、基底関数が選択される。これは、有限要素近似の典型であり、数式3の線形結合内の係数
![]()
は、i番目のノードの解の近似値にも対応する。Albertyにあるように、区分線形(piecewise linear)基底関数を使用して、数式1の解を近似することができる。ここでも、これは有限要素近似における標準的な選択である。ガラーキン有限要素離散化を好適な境界条件で数式1に適用すると、以下の連立一次方程式が得られる。
![]()
数式4の連立方程式の結果を求めるために、ガラーキン有限要素離散化を数式1に適用するためのプロセスは、当業者であれば明らかであるため、本明細書では詳細に説明しない。数式4の解
![]()
は、有限要素メッシュのノードでの空気流ポテンシャルφへの近似解を与える。問題は、数式2で速度場を定義する場合、ポテンシャルの勾配を得ることにあるため、数式4の線形システムが解かれると、数式3と数式4のシステムの解
![]()
の線形結合から、勾配φへの数値近似を得ることができる。これにより、数式2で定義されたような空気流場が提供される。しかしながら基底関数の選択により、メッシュ・ノードでの勾配に対する近似を得ることは意味がない。代わりに、各要素内の点での近似が有効である。各要素の中心は便宜的かつ標準の座標点、すなわち、速度場を近似するための場所として選択することができる。次に、以下で説明するように、空気流の流路(trajectories)から温度ゾーンを定義することができる。
Approximate solution for
![]()
Is obtained as a linear combination of N basis functions ψ i , i = 1,.
![]()
Let j denote the jth node in the mesh, if i = j
![]()
Otherwise
![]()
The basis function is selected such that This is typical of the finite element approximation, and the coefficient in the linear combination of
![]()
Corresponds to the approximate value of the solution of the i-th node. As in Alberty, a piecewise linear basis function can be used to approximate the solution of
![]()
The process for applying Galerkin finite element discretization to
![]()
Gives an approximate solution to the airflow potential φ at a node of a finite element mesh. The problem is that when the velocity field is defined by
![]()
From this linear combination, a numerical approximation to the gradient φ can be obtained. This provides an air flow field as defined by
次に、大規模な(たとえば50,000平方フィート(4645平方メートル)を上回る)データ・センタの下地床プレナムに関する空気流ポテンシャルを計算するための、上記技法の2次元実施について説明する。以下では、「プレナム」上の温度ゾーンに焦点を当てるが、同じ原理が「プレナム上方」または高床データ・センタ全体に適用可能である。図4は、複数のACU402および穿孔タイル404を含む、データ・センタのグラフィック表示400を示す図である。こうしたグラフィック表示は、たとえば以下のようにMMTクライアントを使用して作成可能である。領域406などのデータ・センタ内のある領域は、たとえば、領域406がプレナムと分離されているために、計算から除外される。ドメイン境界408は、プレナム全体の物理的寸法を画定する。
Next, a two-dimensional implementation of the above technique for calculating the airflow potential for a large (eg, greater than 50,000 square feet) data center underfloor plenum is described. In the following, the focus is on the temperature zone on the “plenum”, but the same principle can be applied to “above the plenum” or the entire elevated data center. FIG. 4 is a diagram illustrating a data center
前述のように、下地床プレナムによってドメインが画定されると、ノイマン境界条件として適用されるように、ACUを空気流ソースとし、穿孔タイルを空気流シンクとすることができる。この特定の実施形態では、数式1の右側はゼロに設定される。上記で明らかなように、ACUおよび穿孔タイルに関する空気流測定値は、MMTを使用して取得可能である。ACUと穿孔タイルの両方に関する必要な入力データを得るための好適な技法は、たとえば、H.F.Hamann等による「Methods and Techniques for Measuring andImproving Data Center Best Practices」IEEEProceedings of ITherm 2008 Conference、フロリダ州オーランド、1146〜1152ページ(2008年5月)でも説明されている。
As described above, once the domain is defined by the ground floor plenum, the ACU can be an air flow source and the perforated tile can be an air flow sink, as applied as a Neumann boundary condition. In this particular embodiment, the right side of
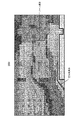
図5に示されたグラフィック表示400の一部の拡大図500は、メッシュが作成されていることを示す。この2次元モデル内では、ノードは三角形と接続されている。ソース(たとえばACU)およびシンク(たとえば穿孔タイル)は、図5ではラベル付けされて表示されている。
A magnified
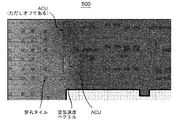
図6は、前述の計算の実行から結果が得られた、空気流ポテンシャルφならびに対応する空気流速度ベクトルを示す図である。グラフィック表示400の同じ部分500が図6に示されている。暗い領域は高い空気流ポテンシャルに対応し、明るい影付き領域は低い空気流ポテンシャルに対応する。図6に示されるように、いくつかのACUはオフになっているため、境界は適用されていない。基礎となるグリッドは、データ・センタ内で通常使用されるタイル・グリッドを示す。
FIG. 6 is a diagram showing the air flow potential φ and the corresponding air flow velocity vector obtained from the execution of the above-described calculation. The
空気流速度場が(上記の数式2に従って)計算されると、データ・センタの各領域から/領域への空気流は、発生元/戻りACUへとトレース・バックされる(空気流速度ベクトルは集合的に空気流の流線(以下、空気流パターンともいう)を示し、これが温度ゾーン(これらの空気流パターンによって与えられる)を画定するために速度場が使用される理由である)。データ・センタ内の空気流をトレースするための例示的方法は、たとえば以下の図12の説明と関連して説明する。この特定の例では、空気流は下地床プレナム全体にわたってトレースされるが、高床についても同じ方法で実行することができる。トレースは、特定のACUとその対応する温度ゾーンとを接続する。
Once the airflow velocity field is calculated (in accordance with
個々の粒子がたどる経路である、これらのトレース(本明細書では「空気流流路」とも呼ばれる)、ならびに対応する温度ゾーンが、図7に示されている。ここでも、グラフィック表示400の同じ部分500が図7に示されている。図7では、温度ゾーンの概要が(ゾーン境界によって)示されている。線影パターン(hatched pattern)のACUはオフになっている。たとえば穿孔タイルが除去される、異なるタイル・タイプが配置される、またはACUがオフにされるなど、条件が変更された場合、計算を反復し、それに応じてデータ・センタ・プレナムのゾーンを変更することができる。異なるタイプのタイルは異なるレベルの穿孔を有し、これは、所与の圧力勾配についてタイルにどのくらいの量の空気流を押し通すかをどのようにして制御できるかである。一般に、タイルの開口部の「レベル」について言及する。したがって、たとえば25%から最高50%までのオープン・タイルが存在する。25%オープン・タイルは、50%オープン・タイルよりも抵抗が大きい。抵抗またはインピーダンスRは、タイルの開放性および何らかの他の因子の特性である。圧力差pがわかっている場合、空気流fは以下のように計算可能である。
p=R×f2
These traces (also referred to herein as “air flow channels”), as well as the corresponding temperature zones, are the paths that the individual particles follow. Again, the
p = R × f 2
この点で、こうした変更が有限要素メッシュに対する修正を含まない限り、ノードおよび要素を毎回再生成する必要がないため、計算の反復に必要な時間が少なくなることに留意されたい。さらに、数式4を解くために線形システムに関する直接解法が使用される場合、数式4内の行列Aが未変更のままである限り、計算時間の節約も可能である(これは、条件変更がソースおよびシンクで測定される流れにおける修正にのみ対応している場合、この結果が数式4の右側bのみを修正することになるためである)。典型的には、直接解法は係数行列の数値的因数分解と、それに続く行列が因数分解されたシステムの解との、2つの位相を採用するため、行列が未変更のままである限り、係数行列の数値的因数分解を1回実行するのみで良い。数値的因数分解は、2つの位相の時間を最も節約するものであるため、厳密に必要な場合のみ因数分解を実行することにより、結果として大幅な計算時間の節約となる。
In this regard, it should be noted that unless such changes involve modifications to the finite element mesh, nodes and elements do not need to be regenerated each time, thus reducing the time required to repeat the computation. Furthermore, if a direct solution for the linear system is used to solve
本技法は、冗長計算を避けることによって、条件が変化するそれぞれの空気流パターンをより速く解決するための方法を提供することが可能な、重ね合わせの原理の開発を含むことができる。具体的に言えば、ポテンシャルφについて解決する数式1は、∇・(∇φ)=fと書き直すことが可能であり、ここで∇・は発散演算子である。重ね合わせの原理を使用し、数式1の2つの解φ1およびφ2(または一般に、任意数の解)を合計して、φ1およびφ2が同じドメイン(ジオメトリ)に関する数式1に対する解である限り、第3の解φ3=φ1+φ2を取得することができる。すなわち、φ1が∇・(∇φ1)=f1を解決し、φ2が∇・(∇φ2)=f2を解決するものとすると、φ3=φ1+φ2は∇・(∇φ3)=f1+f2を解決する。たとえば、φ1は、ACU1のみが(所与のファン速度設定で)オンであり、他のすべてのACUがオフの状態で得られる解であり、φ2は、ACU2のみが(所与のファン速度設定で)オンであり、他のすべてのACUがオフの状態で得られる解であるものとする。ACU1のみがオンの状態のシナリオでの速度場はv1=∇φ1であり、ACU2のみがオンの状態のシナリオでの速度場はv2=∇φ2である。次に、v3=v1+v2は、ACU1およびACU2がオンであり、他のすべてのACUがオフの状態のシナリオでの速度場に対応する。
The technique can include the development of superposition principles that can provide a way to resolve each airflow pattern with varying conditions faster by avoiding redundant computations. Specifically,
例示的一実施形態では、グラフィック・ソフトウェア(たとえばMMTクライアント)を使用して、たとえばデータ・センタなどのグラフィック表示を提供し、ドメインを画定し、シンクおよびソースを編集し、シンクおよびソースを画定するためにセンサ・データ(使用可能な場合)を送り、計算を初期設定し、温度ゾーンを事後処理および視覚化する。MMTクライアントは、データ・センタ・レイアウトのグラフィック表示と、空気流流路、ゾーン、および空気流ベクトルの視覚化とを可能にする、ソフトウェア・アプリケーションである。 In an exemplary embodiment, graphics software (eg, an MMT client) is used to provide a graphical display, eg, a data center, define domains, edit sinks and sources, and define sinks and sources Send sensor data (if available) for initialization, initialize calculations, post-process and visualize temperature zones. The MMT client is a software application that allows a graphic display of the data center layout and visualization of airflow channels, zones, and airflow vectors.
たとえば、データ・センタのグラフィック表示801を含む、(たとえば以下に示す、コンピュータ・モニタなどのビデオ・ディスプレイ上に表示されるような)例示的グラフィカル・インターフェース800を示す図である、図8を参照する。例示の目的で、サーバ・ラックおよび穿孔タイルなどのデータ・センタ内の構造には、グラフィック表示801内でラベルが付けられている(さらに、プロセスの実際の実施ではラベル付けされるかまたはされない可能性がある)。プレナムのドメインは、x点およびy点の多角形として、たとえば境界806によって画定される。ここでは、外部および内部の2つのドメインが画定されている(この描写では内部ドメインは見えない)。外部ドメインはデータ・センタの外周を決定し、内部ドメインは分離された制御ルームをカバーする。ディリクレ境界条件も定義されている(ポテンシャルは一定値に、ほとんどの場合ゼロに設定される)。
See, for example, FIG. 8, which illustrates an exemplary graphical interface 800 (eg, as shown on a video display such as a computer monitor, shown below), including, for example, a data center
上記で明らかなように、ソース/シンクのうちの1つまたは複数での空気流は変化する可能性がある。さらに、ソース/シンクをドメインに追加すること、あるいはドメインから除去すること、またはその両方が可能である。図9は、ドメイン内のこうした変化を反映するように(図8の)インターフェース800をグラフィカルに編集する方法を示す図である。この特定の例では、穿孔タイルに関する空気流が指定される。穿孔タイルは対話形式で移動、重複可能であり、タイル特性(タイプ、空気流インピーダンスなど)は容易に操作可能である。例示的一実施形態では、たとえばプレナム内に配置されたリアルタイム・センサを使用して、モデル入力を更新することができる。具体的に言えば、プレナム内の圧力を測定し、通気孔または穿孔タイルの空気流インピーダンスと組み合わせることによって、空気流を自動的に計算し、ゾーニング・モデルに適用することができる。以下の数式によって、穿孔空気流タイル・インピーダンスR(Pa/cfm2)が与えられる。
![]()
ρは空気密度、Aはタイルの面積、Kは損失係数である。圧力差と空気流とは以下のように関係付けられる。
Δρ=R・f2 airflow
圧力差はリアルタイム・センサで再測定され、Δρ=R・f2 airflowを使用して各タイルを通る空気流を計算する。前述のように、空気流は境界として適用される。
As is apparent above, the air flow at one or more of the sources / sinks can vary. In addition, sources / sinks can be added to the domain and / or removed from the domain. FIG. 9 is a diagram illustrating a method for graphically editing the interface 800 (of FIG. 8) to reflect these changes in the domain. In this particular example, the air flow for the perforated tile is specified. Perforated tiles can move and overlap interactively, and tile characteristics (type, airflow impedance, etc.) can be easily manipulated. In one exemplary embodiment, model inputs can be updated using, for example, real-time sensors located within the plenum. Specifically, by measuring the pressure in the plenum and combining it with the air flow impedance of the vent or perforated tile, the air flow can be automatically calculated and applied to the zoning model. The following formula gives the perforated airflow tile impedance R (Pa / cfm 2 ).
![]()
ρ is the air density, A is the tile area, and K is the loss factor. The pressure difference and the air flow are related as follows.
Δρ = R · f 2 airflow
The pressure difference is re-measured with a real-time sensor and Δρ = R · f 2 airflow is used to calculate the airflow through each tile. As mentioned above, airflow is applied as a boundary.
モデルが定義およびセットアップされる(すなわち、グラフィック表示が提供される、すべてのドメインが画定されるなど)と、ユーザ入力に基づくか、あるいは、(たとえば前述のように、空気流変化、あるいは、ドメインからのソース/シンクの追加/除去、またはその両方を検出することが可能な)センサ・ネットワークを使用してデータ・センタ内で測定された変化によってトリガされるかの、いずれかで、温度ゾーンを(前述のように)モデル化することができる。図10は、(図8の)インターフェース800上での温度ゾーンの視覚化を示す図である。図10に示される例示的実施形態では、灰色の陰影付けを使用して、様々な温度ゾーンのエネルギー効率が差別化され、たとえば温度ゾーン1002内で使用される陰影付けは最高効率を示す。上記で明らかなように、効率は「利用率」またはさらに望ましくは「COP」によって特徴付けることができる。所与のノミネータ(nominator)COPで「除去熱」を増加させると、利用率が増加し、したがって効率(すなわち、利用率(UT)=除去熱/公称熱負荷除去能力)または性能係数(COP)(COP=除去熱/ACUファンに関する電力消費)が上昇する。次に、インターフェース800の下部に提示された棒グラフは、利用率およびCOPを示す。棒グラフの上の線1004および1006は、それぞれACUの排出温度および戻り温度に対応し、これは(MMTクライアントで編集可能である)静的データから、または、(たとえば前述のように、データ・センタ内の条件を更新するために、リアルタイム・センサからMMTクライアント内へ送られる)リアルタイム・データからの、いずれかで取得可能である。例示の目的で、温度ゾーンのうちの1つ(54%の利用率および9のCOPを有する)が、矢印1008によって対応する棒グラフとリンク付けて示されている。
Once the model is defined and set up (ie, a graphical display is provided, all domains are defined, etc.), it can be based on user input or (eg, as described above, airflow changes or domains Temperature zone, either triggered by changes measured in the data center using a sensor network (which can detect the addition / removal of sources / sinks, or both) Can be modeled (as described above). FIG. 10 is a diagram illustrating the visualization of temperature zones on the interface 800 (of FIG. 8). In the exemplary embodiment shown in FIG. 10, gray shading is used to differentiate the energy efficiency of the various temperature zones, for example, the shading used within
最終的に、本技法は、各通気孔または穿孔タイルからそれぞれの冷却能力を決定するためにも使用可能であることに留意されたい。すなわち、(Hamannに記載されたような)温度モデルに関連して、通気孔または穿孔タイルの排出温度TDが計算可能である(すなわち、速度場
![]()
が取得されると、温度分布に関して解決するために、これがエネルギー式
![]()
で使用され、温度は(たとえばサーバの吸気口および排気口での)境界として指示される)。したがって、温度分布は(たとえば2次元の場合)、xおよびy座標の関数T(x,y)として計算可能である。穿孔タイルがどこにあるか(xt,yt)を知ることによって、タイル排出温度Td=T(xt,yt)を取得することができる。
Finally, it should be noted that the technique can also be used to determine the respective cooling capacity from each vent or perforated tile. That is, (as described in Hamann) in relation to the temperature model, discharge temperature T D of the vent hole or perforation tiles can be calculated (i.e., velocity field
![]()
Is obtained, this is the energy formula to solve for the temperature distribution
![]()
And the temperature is indicated as a boundary (eg at the server inlet and outlet). Thus, the temperature distribution (eg in the case of two dimensions) can be calculated as a function T (x, y) of x and y coordinates. By knowing where the perforated tile is (xt, yt), the tile discharge temperature Td = T (xt, yt) can be obtained.
空気流速度または総空気流と、サーバの許容可能な吸気口温度Tinletとを組み合わせると、
![]()
によって、各通気孔または穿孔タイルについて、1タイル当たりの冷却力を決定することができる。速度ベクトルが(本実施形態におけるように、境界として測定および使用されるのではなく)計算される場合、流れは、
![]()
によって、タイルまたは通気孔の領域全体にわたって垂直速度ベクトル成分(ほとんどの場合vz)を積分することによって、取得可能である。この機能の例が図11に示されている。具体的に言えば、図11は、データ・センタ内の冷却能力を示す概略図1100である。図11では、レイアウト表示が擬似3次元イメージとして3次元棒グラフとオーバレイされており、棒の高さは冷却容量(すなわち冷却力)を示す。
Combining the airflow velocity or total airflow with the allowable inlet temperature T inlet of the server,
![]()
Allows the cooling power per tile to be determined for each vent or perforated tile. If the velocity vector is calculated (rather than measured and used as a boundary as in this embodiment), the flow is
![]()
Can be obtained by integrating the vertical velocity vector component (in most cases v z ) over the entire area of the tile or vent. An example of this function is shown in FIG. Specifically, FIG. 11 is a schematic diagram 1100 illustrating the cooling capacity within a data center. In FIG. 11, the layout display is overlaid with a three-dimensional bar graph as a pseudo three-dimensional image, and the height of the bar indicates the cooling capacity (ie, cooling power).
図12は、ACUなどの空気流ソースへと空気流速度ベクトルをトレースするための例示的方法1200を示す図である。方法1200は、前述の(図2の)方法200のステップ214を実行するための例示的プロセスを表す。ステップ1202では、プロセスが所与の位置(これがプロセスの最初の反復である場合、初期の位置ともみなされる)で始まり、所与の(たとえば初期の)位置が選択される。例示的実施形態によれば、モデル化されているスペースがデータ・センタの場合、このプロセスに従って説明される各位置は、データ・センタの高床内の所与のタイル(穿孔タイルのみでなく、任意のタイル)の位置に対応する。その場合、初期の位置は任意のタイルとすることができる。プロセスはその初期のタイル(位置)から開始し、その後、データ・センタ内のすべてのタイルを通ってループすることができる。ステップ1204では、所与の位置(プロセスの最初の反復における初期の位置)に関する速度ベクトルが参照される(すなわち、データ・センタ全体にわたる速度ベクトルがすでに決定されており、たとえば前述の方法200のステップ212を参照のこと)。前述のように、スペース、すなわちデータ・センタ全体にわたる空気流速度ベクトルは、ソース/シンクから取得された空気流データに基づき、有限要素技法を使用して(すなわち、複数のサブドメイン内で)決定することができる。しかしながら、所与の位置に関する速度ベクトルが未だ決定されていない場合、標準的な補間技法を使用して抽出可能である。たとえば、流路を計算する場合、最終的には、空気流ベクトルが未だ具体的に計算されていない位置に到達する。しかし、もちろん、空気流ベクトルが計算された位置に近接した位置が存在する。こうしたシナリオについて、いくつかの異なる手法がテストされている。その手法の1つは、最も近い速度ベクトルを使用することである。他の手法は、複数の(たとえば9つの)隣接速度ベクトルの距離重み付け平均を使用することである。しかしながら、一般に、任意の補間技法が使用可能である。
FIG. 12 is a diagram illustrating an
ステップ1206では、新しい次の位置が決定、すなわち計算される。このステップでは、データ・センタのタイルを位置点とする上記の例を使用して、次のタイルが選択される。2次元ドメインでは、次の位置xtおよびytは以下のように選択可能であり、xt(steps)=(xt(steps−1)+vx*stepsize*n)およびyt(steps)=(yt(steps−1)+vy*stepsize*n)であり、上式で、速度ベクトルの大きさはv=sqrt(vx2+vy2)であり、n=0.2/vである。v=sqrt(vx2+vy2)...n=0.2/vは、vxおよびvyと関連付けながらステップサイズ(stepsize)を制御し、速度ベクトルが小さい場合にステップが小さくなり過ぎるのを防止する、パラメータである。言い換えれば、速度が非常に遅い場合、方法が遅くなり過ぎないように、サイズ変更可能なステップを1つの位置から次の位置へと依然として移動することを確実にするように、変数nが導入される。ステップサイズはユーザによる選択が可能である。
In
ステップ1208では、新しい位置が空気流ソース、たとえばACUの領域内にあるかどうかが判別される。流路がACUと交差している場合、ステップ1210で、そのACUに以前の位置が割り当てられる。たとえば、タイル1が初期の(以前の)位置であり、タイル2が新しい位置である場合、タイル2はACU1の領域内にあり、タイル1はACU1に割り当てられる。次に、新しい位置、たとえばタイル2に関する速度ベクトルを参照すること(ステップ1204)、たとえばタイル3の他の新しい位置を決定すること(ステップ1206)、などによって、プロセスが(スペース、たとえばデータ・センタ全体にわたる、n個の位置、たとえばタイルについて)反復される。ACU位置は、たとえばMMTクライアントのグラフィック表示から認識される。その表示はACUのx,y座標、ならびにACUの幅、長さ、および高さ(すなわち領域の画定)を含む。xtおよびyt(ステップ1206を参照のこと)がACU領域内にあれば、他の新しい位置が決定される、と言う具合である。
In
他方で、新しい位置(たとえば上記の例を使用するタイル2)がACUの領域内にない場合、ステップ1212で、作成されたステップが多すぎるか否かに関する決定を実行することが可能であり、すなわち、流路がACUで終わらない場合、最大数のステップが存在する。これを考慮する別の方法は、空気流ソースの領域内にある位置(たとえばタイル)を有することなくステップ1204および1206が反復可能な回数に、制限が課せられる可能性があることである。実際に、作成されたステップが多すぎる(すなわち限界に達した)場合、ステップ1214で、以前の位置、たとえばタイル1は、その位置に温度ゾーンが割り当てられていないことを意味する、「ゾーンなし」と指定される。その後、このプロセスは、スペース全体にわたるn個の位置に関して、新しい位置、たとえばタイル2に関する速度ベクトルを参照すること(ステップ1204)、たとえばタイル3の他の新しい位置を決定すること(ステップ1206)、などによって、反復される。他方で、ステップの最大数に達していない(すなわち限界に達していない)場合(および、新しい位置、たとえばタイル2がACUの領域内にない(ステップ1208)場合)、ステップ1204から始まるプロセスが、すなわち、新しい位置、たとえばタイル2に関する速度ベクトルを参照すること(ステップ1204)、たとえばタイル3の他の新しい位置を決定すること(ステップ1206)、などによって、反復される。方法1200は、スペース、すなわちデータ・センタ内の、n個の位置、すなわちタイルのそれぞれについて反復される。このようにして、各速度ベクトルは特定の空気流ソース(たとえばACU)へとトレースされるか、または、特定の温度ゾーンに関連付けられていないものとして指定される。特定の空気流ソースへと速度ベクトルをトレースするため、およびそれによってスペース内の温度ゾーンを画定するための、例示的コードが、以下に提供される。
On the other hand, if the new location (eg,
次に図13に見ると、本発明の一実施形態に従った、データ・センタ100(図1)などのスペース内、たとえば室内の、温度ゾーンをモデル化するための装置1300のブロック図が示されている。装置1300は、図2の方法200を実施するための一実施形態を表すものであることを理解されたい。
Turning now to FIG. 13, a block diagram of an
装置1300は、コンピュータ・システム1310および取り外し可能メディア1350を備える。コンピュータ・システム1310は、プロセッサ・デバイス1320、ネットワーク・インターフェース1325、メモリ1330、メディア・インターフェース1335、および(たとえば前述の、図8のグラフィカル・インターフェース800を表示するための)オプションのディスプレイ1340を備える。ネットワーク・インターフェース1325は、コンピュータ・システム1310をネットワークに接続できるようにするものであり、メディア・インターフェース1335は、コンピュータ・システム1310が、ハード・ドライブまたは取り外し可能メディア1350などのメディアと対話できるようにするものである。
当分野で知られているように、本明細書で考察される方法および装置は、実行された場合に本発明の諸実施形態を実装する1つまたは複数のプログラムを含む、機械読み取り可能メディアをそれ自体が備える製品として、配布可能である。たとえば、機械読み取り可能メディアは、スペースのグラフィック表示を提供し、モデル化のために少なくとも1つのドメインをスペース内に画定し、複数のノードを相互接続するサブドメインのセットにドメインを細分化することによってドメイン内にメッシュを作成し、ドメイン内の空気流のソースおよびシンクを識別し、空気流のソースおよびシンクのうちの1つまたは複数から空気流測定値を取得し、空気流のソースおよびシンクから取得された空気流測定値を使用してそれぞれのサブドメインの中心の空気流速度ベクトルを決定し、空気流ソースのうちの1つへと各速度ベクトルをトレースし、空気流ソースのうちの所与の1つへのトレースの組み合わせがスペース内の温度ゾーンを表すように構成された、プログラムを含むことができる。 As is known in the art, the methods and apparatus discussed herein comprise a machine-readable medium containing one or more programs that, when executed, implement embodiments of the present invention. It can be distributed as a product itself. For example, machine-readable media, provides a graphical overview of the space, fractionated constant at least one domain in the space for modeling, subdivided domain to a set of interconnect to salicylate subdomains multiple nodes To create a mesh in the domain, identify airflow sources and sinks in the domain, obtain airflow measurements from one or more of the airflow sources and sinks, and And the airflow measurements taken from the sinks are used to determine the airflow velocity vector at the center of each subdomain, tracing each velocity vector to one of the airflow sources, Includes a program where the combination of traces to a given one of them represents a temperature zone in the space It can be.
機械読み取り可能メディアは、記録可能メディア(たとえば、フレキシブルディスク、ハード・ドライブ、取り外し可能メディア1350などの光ディスク、またはメモリ・カード)とするか、あるいは、伝送メディア(たとえば、光ファイバ、ワールド・ワイド・ウェブ、ケーブル、あるいは、時分割多重アクセス、符号分割多重アクセス、または他の無線周波数チャネルを使用する無線チャネルを備える、ネットワーク)とすることができる。コンピュータ・システムで使用するのに好適な情報を格納可能な、知られているかまたは開発される任意のメディアが使用可能である。
The machine readable medium can be a recordable medium (eg, a flexible disk, a hard drive, an optical disk such as
プロセッサ・デバイス1320は、本明細書で開示された方法、ステップ、および機能を実装するように構成可能である。メモリ1330は分散されるかまたはローカルとすることが可能であり、プロセッサ1320は分散されるかまたは単一とすることが可能である。メモリ1330は、電気、磁気、または光メモリ、あるいは、これらまたは他のタイプのストレージ・デバイスの任意の組み合わせとして、実装可能である。さらに「メモリ」という用語は、プロセッサ・デバイス1320によってアクセスされるアドレス指定可能スペース内のアドレスからの読み取り、またはそのアドレスへの書き込みが可能な、任意の情報を包含するように十分であるものと、広義に解釈されるべきである。この定義を用いると、ネットワーク・インターフェース1325を介してアクセス可能なネットワーク上の情報は、プロセッサ・デバイス1320がネットワークからその情報を取り出すことができるため、依然としてメモリ1330内にあることになる。プロセッサ・デバイス1320を構成する各分散プロセッサは、一般に、それ専用のアドレス指定可能メモリ・スペースを含むことに留意されたい。コンピュータ・システム1310の一部または全部は、特定用途向け集積回路または汎用集積回路に組み込み可能であることにも留意されたい。
The
オプションのビデオ・ディスプレイ1340は、装置1300の人間ユーザと対話するために好適な任意のタイプのビデオ・ディスプレイである。一般に、ビデオ・ディスプレイ1340は、コンピュータ・モニタまたは他の同様のビデオ・ディスプレイである。
以下は、速度ベクトルを特定の空気流ソースへとトレースし、それによってスペース内の温度ゾーンを画定するための、PV−WAVE(R)プログラミング言語の例示的コードである。

以上、本明細書では、本発明の例示的諸実施形態について説明してきたが、本発明はそれらの精密な諸実施形態に限定されるものではなく、本発明の範囲を逸脱することなく、当業者による様々な他の変更および修正が実行可能であることを理解されよう。 As mentioned above, although exemplary embodiments of the present invention have been described in the present specification, the present invention is not limited to these precise embodiments, and without departing from the scope of the present invention. It will be appreciated that various other changes and modifications can be made by the vendor.
Claims (17)
前記スペースのグラフィック表示を提供するステップであって、前記グラフィック表示は、コンピュータ機器ラックと、空調ユニットと、通気孔又は窄孔タイルとのレイアウトを含む、前記提供するステップと、
モデル化するために前記スペース内で少なくとも1つの領域を画定するステップと、
前記領域を細分化し、複数の細分化領域のセットにすることによって、前記領域内にメッシュを作成するステップと、
前記領域内において空気流が当該領域内に入る複数の場所(以下、複数の空気流流入場所という)および空気流が当該領域を出る複数の場所(以下、複数の空気流流出場所という)を識別するステップと、
前記複数の空気流流入場所および前記複数の空気流流出場所のうちの1つまたは複数から、空気流測定値を取得するステップと、
前記複数の空気流流入場所および前記複数の空気流流出場所のうちの前記1つまたは複数から取得された前記空気流測定値を使用して、細分化領域それぞれの中心の空気流速度ベクトルを決定するステップと、
前記空気流速度ベクトルそれぞれを前記空気流流入場所のうちの1つへとトレースするステップであって、前記空気流速度ベクトルは集合的に空気流の流線を示し、前記温度ゾーンが、前記トレースを組み合わせて、前記空気流の流線によって与えられ、前記スペース内で画定される、前記トレースするステップと
を実行することを含み、
前記トレースするステップが、
前記スペース内の所与の位置を選択するステップと、
前記選択された所与の位置で、前記細分化領域の中心で決定された前記空気流速度ベクトルを参照するステップと、
前記スペース内において、前記選択された所与の位置から計算される次の位置を決定するステップであって、前記次の位置は、前記選択された所与の位置と前記空気流速度ベクトルとから計算される、前記決定するステップと、
前記スペース全体にわたるn個の位置それぞれについて、前記空気流速度ベクトルを参照するステップ、および、前記次の位置を決定するステップを反復するステップであって、当該反復時に前記次の位置に基づいてさらに次の位置が決定され、前記次の位置が前記空気流流入場所のうちの所与の1つがある領域内にある場合に前記選択された所与の位置を前記所与の1つの空気流流入場所に割り当てる、前記反復するステップと
をさらに含む、前記方法。 A method for modeling a temperature zone in a space given by a streamline of airflow , wherein the device comprises:
Providing a graphical representation of the space, the graphical representation comprising a layout of a computer equipment rack, an air conditioning unit, and vent or stenosis tiles ;
Defining at least one region within the space for modeling;
Creating a mesh in the region by subdividing the region into a set of subdivided regions;
Identify multiple locations within the region where airflow enters the region (hereinafter referred to as multiple airflow inflow locations) and multiple locations where airflow exits the region (hereinafter referred to as multiple airflow outflow locations) And steps to
Obtaining an airflow measurement from one or more of the plurality of airflow inlet locations and the plurality of airflow outlet locations;
Using the airflow measurements obtained from the one or more of the plurality of airflow inflow locations and the plurality of airflow outflow locations, a central airflow velocity vector for each subdivision region is determined. And steps to
Tracing each of the air flow velocity vectors to one of the air flow inlet locations, wherein the air flow velocity vectors collectively represent air flow streamlines , and the temperature zone is the trace. in combination, provided by the streamlines of the airflow, the is defined by the space, seen including to perform the steps of said trace,
The step of tracing comprises:
Selecting a given position in the space;
Referencing the airflow velocity vector determined at the center of the subdivision region at the selected given location;
Determining a next position calculated from the selected given position within the space, wherein the next position is determined from the given given position and the airflow velocity vector; Calculating said determining step;
Referencing the airflow velocity vector and determining the next position for each of the n positions throughout the space, and repeating the steps based on the next position during the iteration A next position is determined, and if the next position is in a region where a given one of the airflow inflow locations is in an area, the selected given position is determined to be the given one airflow inflow. Assigning to a location, said repeating step and
The method further comprising:
前記速度ベクトルのそれぞれを前記空調ユニットのうちの1つへとトレースするステップであって、前記空調ユニットのうちの所与の1つへの前記トレースの組み合わせが前記スペース内の温度ゾーンを表す、前記トレースするステップ
をさらに実行することを含む、請求項6に記載の方法。 The device is
Tracing each of the velocity vectors to one of the air conditioning units, wherein the combination of traces to a given one of the air conditioning units represents a temperature zone in the space; The method of claim 6, further comprising performing the tracing step.
前記領域内の前記空気流流入場所および前記空気流流出場所のうちの1つまたは複数での空気流の変化に応答して、前記識別、取得、使用、およびトレースするステップを反復するステップ
をさらに実行することを含む、請求項1〜7のいずれか一項に記載の方法。 The device is
Repeating the step of identifying, obtaining, using, and tracing in response to a change in airflow at one or more of the airflow inflow location and the airflow outflow location in the region. The method according to claim 1, comprising performing.
前記空気流流入場所および前記空気流流出場所のうちの1つまたは複数が前記領域から除去されることに応答して、前記識別、取得、決定、およびトレースするステップを反復するステップ
をさらに実行することを含む、請求項1〜7のいずれか一項に記載の方法。 The device is
Repeating the step of identifying, obtaining, determining, and tracing in response to removal of one or more of the airflow entry location and the airflow exit location from the region. The method according to claim 1, comprising:
1つまたは複数の新しい空気流流入場所および空気流流出場所が前記領域に追加されることに応答して、前記識別、取得、決定、およびトレースするステップを反復するステップ
をさらに実行することを含む、請求項1〜9のいずれか一項に記載の方法。 The device is
Further comprising repeating the steps of identifying, obtaining, determining, and tracing in response to one or more new airflow inflow locations and airflow outflow locations being added to the region. The method according to any one of claims 1 to 9.
各空気流流入場所について冷却能力を決定するステップ
をさらに実行することを含む、請求項1〜10のいずれか一項に記載の方法。 The device is
The method according to claim 1, further comprising: determining a cooling capacity for each airflow inlet location.
前記空気流流入場所および前記空気流流出場所からの前記空気流測定値を更新するために、取得、決定、およびトレースするステップを周期的に反復するステップ
をさらに実行することを含む、請求項1〜11のいずれか一項に記載の方法。 The device is
The method further comprises the step of periodically repeating the steps of obtaining, determining, and tracing to update the airflow measurements from the airflow inflow location and the airflow outflow location. The method as described in any one of -11.
メモリと、
前記メモリに結合された少なくとも1つのプロセッサ・デバイスであって、
請求項1〜15のいずれか一項に記載の方法の各ステップを実行可能な前記少なくとも1つのプロセッサ・デバイスと
を備えている、前記装置。 An apparatus for modeling a temperature zone in a space given by a streamline of airflow ,
Memory,
At least one processor device coupled to said memory, comprising:
16. The apparatus comprising: the at least one processor device capable of performing the steps of the method according to any one of claims 1-15 .
Applications Claiming Priority (3)
| Application Number | Priority Date | Filing Date | Title |
|---|---|---|---|
| US12/540,034 US8229713B2 (en) | 2009-08-12 | 2009-08-12 | Methods and techniques for creating and visualizing thermal zones |
| US12/540,034 | 2009-08-12 | ||
| PCT/US2010/044740 WO2011019615A1 (en) | 2009-08-12 | 2010-08-06 | Methods and techniques for creating and visualizing thermal zones |
Publications (3)
| Publication Number | Publication Date |
|---|---|
| JP2013501913A JP2013501913A (en) | 2013-01-17 |
| JP2013501913A5 JP2013501913A5 (en) | 2013-10-17 |
| JP5520380B2 true JP5520380B2 (en) | 2014-06-11 |
Family
ID=43586406
Family Applications (1)
| Application Number | Title | Priority Date | Filing Date |
|---|---|---|---|
| JP2012524761A Active JP5520380B2 (en) | 2009-08-12 | 2010-08-06 | Methods, products, and apparatus for creating and visualizing temperature zones |
Country Status (8)
| Country | Link |
|---|---|
| US (1) | US8229713B2 (en) |
| JP (1) | JP5520380B2 (en) |
| CN (1) | CN102473029B (en) |
| CA (1) | CA2770450A1 (en) |
| DE (1) | DE112010002543B4 (en) |
| GB (1) | GB2484617B (en) |
| TW (1) | TWI498073B (en) |
| WO (1) | WO2011019615A1 (en) |
Cited By (1)
| Publication number | Priority date | Publication date | Assignee | Title |
|---|---|---|---|---|
| US11250175B2 (en) | 2015-09-15 | 2022-02-15 | Kabushiki Kaisha Toshiba | Spatial-information generation apparatus, spatial-information generation method, and non-transitory computer readable medium |
Families Citing this family (40)
| Publication number | Priority date | Publication date | Assignee | Title |
|---|---|---|---|---|
| US7885795B2 (en) | 2005-05-02 | 2011-02-08 | American Power Conversion Corporation | Methods and systems for managing facility power and cooling |
| US20090138313A1 (en) | 2007-05-15 | 2009-05-28 | American Power Conversion Corporation | Methods and systems for managing facility power and cooling |
| CA2648441A1 (en) * | 2007-12-31 | 2009-06-30 | Exocortex Technologies, Inc. | Fast characterization of fluid dynamics |
| US8209056B2 (en) | 2008-11-25 | 2012-06-26 | American Power Conversion Corporation | System and method for assessing and managing data center airflow and energy usage |
| US20100185420A1 (en) * | 2009-01-18 | 2010-07-22 | Ejiang Ding | Computer system for computing the motion of solid particles in fluid |
| US8219362B2 (en) | 2009-05-08 | 2012-07-10 | American Power Conversion Corporation | System and method for arranging equipment in a data center |
| US8249825B2 (en) | 2009-05-08 | 2012-08-21 | American Power Conversion Corporation | System and method for predicting cooling performance of arrangements of equipment in a data center |
| US8397088B1 (en) | 2009-07-21 | 2013-03-12 | The Research Foundation Of State University Of New York | Apparatus and method for efficient estimation of the energy dissipation of processor based systems |
| US8630724B2 (en) * | 2009-08-12 | 2014-01-14 | International Business Machines Corporation | Measurement and management technology platform |
| US8805590B2 (en) * | 2009-12-24 | 2014-08-12 | International Business Machines Corporation | Fan speed control of rack devices where sum of device airflows is greater than maximum airflow of rack |
| US20110257938A1 (en) * | 2010-04-16 | 2011-10-20 | William Eyers | System and method for use in designing air intakes |
| US8972217B2 (en) | 2010-06-08 | 2015-03-03 | Schneider Electric It Corporation | System and method for predicting temperature values in a data center |
| US8233274B2 (en) | 2010-07-21 | 2012-07-31 | International Business Machines Corporation | Computer chassis cooling sidecar |
| US8270161B2 (en) | 2010-08-06 | 2012-09-18 | International Business Machines Corporation | Hot or cold aisle computer chassis |
| US8509959B2 (en) | 2010-08-12 | 2013-08-13 | Schneider Electric It Corporation | System and method for predicting transient cooling performance for a data center |
| US8996180B2 (en) | 2010-09-17 | 2015-03-31 | Schneider Electric It Corporation | System and method for predicting perforated tile airflow in a data center |
| US8812275B2 (en) * | 2010-09-18 | 2014-08-19 | International Business Machines Corporation | Modeling movement of air under a floor of a data center |
| US8825451B2 (en) * | 2010-12-16 | 2014-09-02 | Schneider Electric It Corporation | System and methods for rack cooling analysis |
| US8688413B2 (en) | 2010-12-30 | 2014-04-01 | Christopher M. Healey | System and method for sequential placement of cooling resources within data center layouts |
| US9223905B2 (en) | 2011-03-25 | 2015-12-29 | Schneider Electric It Corporation | Systems and methods for predicting fluid dynamics in a data center |
| US20120259594A1 (en) * | 2011-04-08 | 2012-10-11 | Azam Khan | Bim based 3-d visualization |
| US9292972B2 (en) * | 2011-05-17 | 2016-03-22 | Autodesk, Inc. | Occupant centric capture and visualization of building performance data |
| US8725307B2 (en) * | 2011-06-28 | 2014-05-13 | Schneider Electric It Corporation | System and method for measurement aided prediction of temperature and airflow values in a data center |
| US8601428B2 (en) * | 2011-12-13 | 2013-12-03 | Qualcomm Incorporated | System and method for use case-based thermal analysis of heuristically determined component combinations and layouts in a portable computing device |
| US9830410B2 (en) | 2011-12-22 | 2017-11-28 | Schneider Electric It Corporation | System and method for prediction of temperature values in an electronics system |
| AU2011384046A1 (en) | 2011-12-22 | 2014-07-17 | Schneider Electric It Corporation | Analysis of effect of transient events on temperature in a data center |
| US9727064B2 (en) | 2011-12-23 | 2017-08-08 | Schneider Electric It Corporation | Dropped ceiling system cooling prediction |
| WO2014007828A1 (en) | 2012-07-06 | 2014-01-09 | Hewlett-Packard Development Company, L.P. | Management of airflow provisioning to meet a cooling influence redundancy level |
| JP6083174B2 (en) * | 2012-09-27 | 2017-02-22 | 富士通株式会社 | Flow visualization system and air conditioning method |
| US10157245B2 (en) | 2012-10-31 | 2018-12-18 | Schneider Electric It Corporation | System and method for fluid dynamics prediction with an enhanced potential flow model |
| EP2939176A4 (en) | 2012-12-27 | 2016-07-27 | Schneider Electric It Corp | Systems and methods of visualizing airflow |
| JP5925954B2 (en) * | 2013-02-20 | 2016-05-25 | パナソニック インテレクチュアル プロパティ コーポレーション オブ アメリカPanasonic Intellectual Property Corporation of America | Information terminal control method and program |
| US20150026077A1 (en) * | 2013-07-18 | 2015-01-22 | Netapp, Inc. | Centralized Method for Customer Assistance and System Verification |
| US20150026076A1 (en) * | 2013-07-18 | 2015-01-22 | Netapp, Inc. | System and Method for Providing Customer Guidance in Deploying a Computing System |
| US10001761B2 (en) | 2014-12-30 | 2018-06-19 | Schneider Electric It Corporation | Power consumption model for cooling equipment |
| US10102313B2 (en) | 2014-12-30 | 2018-10-16 | Schneider Electric It Corporation | Raised floor plenum tool |
| US10145576B2 (en) * | 2015-03-06 | 2018-12-04 | Mitsubishi Electric Research Laboratories, Inc. | System and method for controlling operations of air-conditioning system |
| US11076509B2 (en) | 2017-01-24 | 2021-07-27 | The Research Foundation for the State University | Control systems and prediction methods for it cooling performance in containment |
| US20190057180A1 (en) * | 2017-08-18 | 2019-02-21 | International Business Machines Corporation | System and method for design optimization using augmented reality |
| CN112765859B (en) * | 2021-01-27 | 2024-02-06 | 胜达克半导体科技(上海)股份有限公司 | Temperature management method based on automatic testing machine |
Family Cites Families (30)
| Publication number | Priority date | Publication date | Assignee | Title |
|---|---|---|---|---|
| FR2610410B1 (en) * | 1987-01-30 | 1989-06-16 | Onera (Off Nat Aerospatiale) | FIBER OPTIC MOSAIC VELOCIMETER |
| US6510687B1 (en) * | 1996-06-14 | 2003-01-28 | Sharav Sluices Ltd. | Renewable resource hydro/aero-power generation plant and method of generating hydro/aero-power |
| US7024342B1 (en) * | 2000-07-01 | 2006-04-04 | Mercury Marine | Thermal flow simulation for casting/molding processes |
| JP3778546B2 (en) | 2001-04-09 | 2006-05-24 | 川崎重工業株式会社 | Retractable aircraft engine run-up equipment |
| US20030147770A1 (en) * | 2001-05-17 | 2003-08-07 | Purepulse Technologies, Inc. | Light treatment monitoring and data collection in a fluid treatment system using light for the treatment of fluid products |
| US6832644B2 (en) * | 2001-06-20 | 2004-12-21 | Siemens Vdo Automotive Inc. | Cooling module with air dams |
| US7096145B2 (en) * | 2002-01-02 | 2006-08-22 | Intel Corporation | Deterministic power-estimation for thermal control |
| US7114555B2 (en) * | 2002-05-31 | 2006-10-03 | Hewlett-Packard Development Company, L.P. | Controlled cooling of a data center |
| JP4151780B2 (en) * | 2002-09-09 | 2008-09-17 | 財団法人生産技術研究奨励会 | Air age distribution property analysis system and air life expectancy distribution property analysis system |
| DE102004022514A1 (en) * | 2004-05-05 | 2005-12-01 | Babcock-Hitachi Europe Gmbh | Steam generator and method for operating a steam generator |
| RU2389521C2 (en) * | 2005-01-12 | 2010-05-20 | Иклипс Эйвиейшн Корпорейшн | Fire suppression systems |
| US7366632B2 (en) | 2005-08-02 | 2008-04-29 | International Business Machines Corporation | Method and apparatus for three-dimensional measurements |
| US8073662B2 (en) * | 2006-04-13 | 2011-12-06 | Osaka University | Design support method, design support system, and design support program for heat convection field |
| WO2008008936A2 (en) * | 2006-07-13 | 2008-01-17 | The Regents Of The University Of Colorado | Echo particle image velocity (epiv) and echo particle tracking velocimetry (eptv) system and method |
| US7346468B2 (en) * | 2006-08-08 | 2008-03-18 | International Business Machines Corporation | Method and apparatus for detecting heat sink faults |
| US7397661B2 (en) * | 2006-08-25 | 2008-07-08 | International Business Machines Corporation | Cooled electronics system and method employing air-to-liquid heat exchange and bifurcated air flow |
| US20080155441A1 (en) * | 2006-12-22 | 2008-06-26 | Long Bruce T | Method for performing a data center hardware upgrade readiness assessment |
| ES2604783T3 (en) | 2007-01-24 | 2017-03-09 | Schneider Electric It Corporation | System and method to evaluate the cooling performance of equipment racks |
| US20090138313A1 (en) * | 2007-05-15 | 2009-05-28 | American Power Conversion Corporation | Methods and systems for managing facility power and cooling |
| US20080288193A1 (en) | 2007-05-17 | 2008-11-20 | International Business Machines Corporation | Techniques for Analyzing Data Center Energy Utilization Practices |
| US8306794B2 (en) * | 2008-06-26 | 2012-11-06 | International Business Machines Corporation | Techniques for thermal modeling of data centers to improve energy efficiency |
| US8849630B2 (en) * | 2008-06-26 | 2014-09-30 | International Business Machines Corporation | Techniques to predict three-dimensional thermal distributions in real-time |
| CN101334415A (en) * | 2008-07-22 | 2008-12-31 | 上海电力学院 | Microfluid drive and control method for MEMS hermetic cavity electricity-solid-micro- airflow coupling analysis |
| US8346398B2 (en) * | 2008-08-08 | 2013-01-01 | Siemens Industry, Inc. | Data center thermal performance optimization using distributed cooling systems |
| US9250663B2 (en) * | 2008-09-29 | 2016-02-02 | International Business Machines Corporation | System and method for dynamically modeling data center partitions |
| US8165855B2 (en) * | 2009-05-27 | 2012-04-24 | King Fahd University Of Petroleum & Minerals | Method for modeling fluid flow over porous blocks |
| US8155922B2 (en) * | 2009-06-04 | 2012-04-10 | Eaton Corporation | Electrical device cooling efficiency monitoring |
| US8059405B2 (en) * | 2009-06-25 | 2011-11-15 | International Business Machines Corporation | Condenser block structures with cavities facilitating vapor condensation cooling of coolant |
| US8018720B2 (en) * | 2009-06-25 | 2011-09-13 | International Business Machines Corporation | Condenser structures with fin cavities facilitating vapor condensation cooling of coolant |
| US8244502B2 (en) * | 2009-08-12 | 2012-08-14 | International Business Machines Corporation | Knowledge-based models for data centers |
-
2009
- 2009-08-12 US US12/540,034 patent/US8229713B2/en active Active
-
2010
- 2010-08-02 TW TW099125619A patent/TWI498073B/en not_active IP Right Cessation
- 2010-08-06 DE DE112010002543.6T patent/DE112010002543B4/en not_active Expired - Fee Related
- 2010-08-06 GB GB1200475.0A patent/GB2484617B/en not_active Expired - Fee Related
- 2010-08-06 WO PCT/US2010/044740 patent/WO2011019615A1/en active Application Filing
- 2010-08-06 CN CN201080035439.8A patent/CN102473029B/en not_active Expired - Fee Related
- 2010-08-06 CA CA2770450A patent/CA2770450A1/en not_active Abandoned
- 2010-08-06 JP JP2012524761A patent/JP5520380B2/en active Active
Cited By (1)
| Publication number | Priority date | Publication date | Assignee | Title |
|---|---|---|---|---|
| US11250175B2 (en) | 2015-09-15 | 2022-02-15 | Kabushiki Kaisha Toshiba | Spatial-information generation apparatus, spatial-information generation method, and non-transitory computer readable medium |
Also Published As
| Publication number | Publication date |
|---|---|
| TW201138606A (en) | 2011-11-01 |
| DE112010002543T5 (en) | 2012-08-30 |
| GB2484617A (en) | 2012-04-18 |
| WO2011019615A1 (en) | 2011-02-17 |
| DE112010002543B4 (en) | 2016-10-06 |
| TWI498073B (en) | 2015-08-21 |
| US8229713B2 (en) | 2012-07-24 |
| CN102473029B (en) | 2014-09-24 |
| GB201200475D0 (en) | 2012-02-22 |
| US20110040529A1 (en) | 2011-02-17 |
| CA2770450A1 (en) | 2011-02-17 |
| CN102473029A (en) | 2012-05-23 |
| GB2484617B (en) | 2013-11-27 |
| JP2013501913A (en) | 2013-01-17 |
Similar Documents
| Publication | Publication Date | Title |
|---|---|---|
| JP5520380B2 (en) | Methods, products, and apparatus for creating and visualizing temperature zones | |
| JP5593387B2 (en) | Methods, products and apparatus for knowledge base modeling for data centers | |
| DK2915080T3 (en) | System and method for predicting fluid dynamics with an improved potential-flow model | |
| US8756040B2 (en) | Computational fluid dynamics modeling of a bounded domain | |
| Lopez et al. | Heat transfer modeling in data centers | |
| US8594985B2 (en) | Techniques for determining physical zones of influence | |
| JP5479112B2 (en) | System and method for evaluating cooling performance of equipment racks | |
| US20120284216A1 (en) | Knowledge-Based Models for Data Centers | |
| US20090326879A1 (en) | Techniques for Thermal Modeling of Data Centers to Improve Energy Efficiency | |
| WO2012040479A2 (en) | Method and apparatus for optimizing hvac systems in buildings | |
| JP2010527491A (en) | Method and system for managing power and cooling of equipment | |
| JP2013501913A5 (en) | ||
| VanGilder et al. | Potential Flow Model for Predicting Perforated Tile Airflow in Data Centers. | |
| US11681971B2 (en) | Rapid exploration of building design options for ventilation | |
| US20150347651A1 (en) | System and Method for Determining Heat and Fluid Flow in or Around Objects | |
| Ahmad et al. | Navier-Stokes simulation of air-conditioning facility of a large modern computer room | |
| US8321182B2 (en) | System and method for positioning and controlling air conditioning tiles for optimal cooling using Voronoi diagrams | |
| Seymour et al. | Computational fluid dynamics applications in data centers | |
| Sammakia et al. | Numerical modeling of data center clusters | |
| Hamann et al. | Real-time modeling of heat distributions | |
| Sakaino | A dynamic stochastic optimization control model for data centers based on numerical modeling | |
| JP2016091320A (en) | Thermal fluid analysis method and apparatus for server decentralization/centralization | |
| Hu et al. | Guidance for data-center CFD (RP-1675) | |
| Nagrani et al. | Multiphysics Thermal-Acoustic Modeling of a Server in a Data Center | |
| CN112989642A (en) | Non-transitory computer readable medium, system, and method for generating a display |
Legal Events
| Date | Code | Title | Description |
|---|---|---|---|
| A621 | Written request for application examination |
Free format text: JAPANESE INTERMEDIATE CODE: A621 Effective date: 20130408 |
|
| A521 | Request for written amendment filed |
Free format text: JAPANESE INTERMEDIATE CODE: A523 Effective date: 20130805 Free format text: JAPANESE INTERMEDIATE CODE: A821 Effective date: 20130805 |
|
| A871 | Explanation of circumstances concerning accelerated examination |
Free format text: JAPANESE INTERMEDIATE CODE: A871 Effective date: 20130805 |
|
| RD12 | Notification of acceptance of power of sub attorney |
Free format text: JAPANESE INTERMEDIATE CODE: A7432 Effective date: 20130805 |
|
| A521 | Request for written amendment filed |
Free format text: JAPANESE INTERMEDIATE CODE: A821 Effective date: 20130806 |
|
| A975 | Report on accelerated examination |
Free format text: JAPANESE INTERMEDIATE CODE: A971005 Effective date: 20130823 |
|
| A131 | Notification of reasons for refusal |
Free format text: JAPANESE INTERMEDIATE CODE: A131 Effective date: 20130920 |
|
| A521 | Request for written amendment filed |
Free format text: JAPANESE INTERMEDIATE CODE: A821 Effective date: 20130925 Free format text: JAPANESE INTERMEDIATE CODE: A523 Effective date: 20130925 |
|
| A131 | Notification of reasons for refusal |
Free format text: JAPANESE INTERMEDIATE CODE: A131 Effective date: 20131220 |
|
| A521 | Request for written amendment filed |
Free format text: JAPANESE INTERMEDIATE CODE: A523 Effective date: 20140205 Free format text: JAPANESE INTERMEDIATE CODE: A821 Effective date: 20140205 |
|
| TRDD | Decision of grant or rejection written | ||
| A521 | Request for written amendment filed |
Free format text: JAPANESE INTERMEDIATE CODE: A821 Effective date: 20140320 |
|
| RD14 | Notification of resignation of power of sub attorney |
Free format text: JAPANESE INTERMEDIATE CODE: A7434 Effective date: 20140320 |
|
| A01 | Written decision to grant a patent or to grant a registration (utility model) |
Free format text: JAPANESE INTERMEDIATE CODE: A01 Effective date: 20140320 |
|
| A61 | First payment of annual fees (during grant procedure) |
Free format text: JAPANESE INTERMEDIATE CODE: A61 Effective date: 20140404 |
|
| R150 | Certificate of patent or registration of utility model |
Ref document number: 5520380 Country of ref document: JP Free format text: JAPANESE INTERMEDIATE CODE: R150 |
|
| R250 | Receipt of annual fees |
Free format text: JAPANESE INTERMEDIATE CODE: R250 |
|
| R250 | Receipt of annual fees |
Free format text: JAPANESE INTERMEDIATE CODE: R250 |
|
| R250 | Receipt of annual fees |
Free format text: JAPANESE INTERMEDIATE CODE: R250 |
|
| R250 | Receipt of annual fees |
Free format text: JAPANESE INTERMEDIATE CODE: R250 |