JP5513394B2 - System for measuring and displaying the location of radiologically contrasted material inside a luminal organ - Google Patents
System for measuring and displaying the location of radiologically contrasted material inside a luminal organ Download PDFInfo
- Publication number
- JP5513394B2 JP5513394B2 JP2010528898A JP2010528898A JP5513394B2 JP 5513394 B2 JP5513394 B2 JP 5513394B2 JP 2010528898 A JP2010528898 A JP 2010528898A JP 2010528898 A JP2010528898 A JP 2010528898A JP 5513394 B2 JP5513394 B2 JP 5513394B2
- Authority
- JP
- Japan
- Prior art keywords
- image
- target
- radiographic
- baseline
- display
- Prior art date
- Legal status (The legal status is an assumption and is not a legal conclusion. Google has not performed a legal analysis and makes no representation as to the accuracy of the status listed.)
- Active
Links
- 239000000463 material Substances 0.000 title claims description 10
- 210000000056 organ Anatomy 0.000 title description 23
- 239000002872 contrast media Substances 0.000 claims description 49
- 230000005855 radiation Effects 0.000 claims description 28
- 238000003384 imaging method Methods 0.000 claims description 26
- 230000002285 radioactive effect Effects 0.000 claims 2
- 230000037431 insertion Effects 0.000 claims 1
- 238000003780 insertion Methods 0.000 claims 1
- 238000000034 method Methods 0.000 description 47
- 238000005259 measurement Methods 0.000 description 12
- 230000000875 corresponding effect Effects 0.000 description 11
- 238000012545 processing Methods 0.000 description 11
- 210000003238 esophagus Anatomy 0.000 description 9
- 230000006870 function Effects 0.000 description 9
- 229910052788 barium Inorganic materials 0.000 description 8
- DSAJWYNOEDNPEQ-UHFFFAOYSA-N barium atom Chemical compound [Ba] DSAJWYNOEDNPEQ-UHFFFAOYSA-N 0.000 description 8
- 210000000111 lower esophageal sphincter Anatomy 0.000 description 8
- 230000009747 swallowing Effects 0.000 description 8
- 238000004458 analytical method Methods 0.000 description 7
- 238000004422 calculation algorithm Methods 0.000 description 7
- 210000003484 anatomy Anatomy 0.000 description 6
- 238000012360 testing method Methods 0.000 description 6
- 230000009471 action Effects 0.000 description 5
- 230000008602 contraction Effects 0.000 description 5
- 210000001035 gastrointestinal tract Anatomy 0.000 description 5
- 230000008569 process Effects 0.000 description 5
- 238000003745 diagnosis Methods 0.000 description 4
- 238000002059 diagnostic imaging Methods 0.000 description 4
- 230000000694 effects Effects 0.000 description 4
- 210000001942 upper esophageal sphincter Anatomy 0.000 description 4
- TZCXTZWJZNENPQ-UHFFFAOYSA-L barium sulfate Chemical compound [Ba+2].[O-]S([O-])(=O)=O TZCXTZWJZNENPQ-UHFFFAOYSA-L 0.000 description 3
- 238000010276 construction Methods 0.000 description 3
- 238000012937 correction Methods 0.000 description 3
- 238000010586 diagram Methods 0.000 description 3
- 238000002594 fluoroscopy Methods 0.000 description 3
- 230000007246 mechanism Effects 0.000 description 3
- 230000007310 pathophysiology Effects 0.000 description 3
- 230000035479 physiological effects, processes and functions Effects 0.000 description 3
- 238000012552 review Methods 0.000 description 3
- 210000005070 sphincter Anatomy 0.000 description 3
- 239000000126 substance Substances 0.000 description 3
- 208000019505 Deglutition disease Diseases 0.000 description 2
- 208000005872 Diffuse Esophageal Spasm Diseases 0.000 description 2
- 206010020772 Hypertension Diseases 0.000 description 2
- 208000031481 Pathologic Constriction Diseases 0.000 description 2
- 230000005856 abnormality Effects 0.000 description 2
- 238000013459 approach Methods 0.000 description 2
- 238000009530 blood pressure measurement Methods 0.000 description 2
- 230000008859 change Effects 0.000 description 2
- 230000002596 correlated effect Effects 0.000 description 2
- 238000002405 diagnostic procedure Methods 0.000 description 2
- 230000001631 hypertensive effect Effects 0.000 description 2
- 230000006872 improvement Effects 0.000 description 2
- 230000010354 integration Effects 0.000 description 2
- 239000003550 marker Substances 0.000 description 2
- 229910052751 metal Inorganic materials 0.000 description 2
- 239000002184 metal Substances 0.000 description 2
- 238000012986 modification Methods 0.000 description 2
- 230000004048 modification Effects 0.000 description 2
- 230000007659 motor function Effects 0.000 description 2
- 230000004118 muscle contraction Effects 0.000 description 2
- 230000008855 peristalsis Effects 0.000 description 2
- 230000001766 physiological effect Effects 0.000 description 2
- 230000036262 stenosis Effects 0.000 description 2
- 208000037804 stenosis Diseases 0.000 description 2
- 210000002784 stomach Anatomy 0.000 description 2
- 210000002438 upper gastrointestinal tract Anatomy 0.000 description 2
- ZCYVEMRRCGMTRW-UHFFFAOYSA-N 7553-56-2 Chemical compound [I] ZCYVEMRRCGMTRW-UHFFFAOYSA-N 0.000 description 1
- 208000000289 Esophageal Achalasia Diseases 0.000 description 1
- 208000016285 Movement disease Diseases 0.000 description 1
- 241000699666 Mus <mouse, genus> Species 0.000 description 1
- 241000699670 Mus sp. Species 0.000 description 1
- 206010030136 Oesophageal achalasia Diseases 0.000 description 1
- 201000000621 achalasia Diseases 0.000 description 1
- 230000004075 alteration Effects 0.000 description 1
- 235000013361 beverage Nutrition 0.000 description 1
- 230000015572 biosynthetic process Effects 0.000 description 1
- 210000004204 blood vessel Anatomy 0.000 description 1
- 238000004364 calculation method Methods 0.000 description 1
- 239000003086 colorant Substances 0.000 description 1
- 150000001875 compounds Chemical class 0.000 description 1
- 238000004590 computer program Methods 0.000 description 1
- 229940039231 contrast media Drugs 0.000 description 1
- 238000001514 detection method Methods 0.000 description 1
- 201000010099 disease Diseases 0.000 description 1
- 208000037265 diseases, disorders, signs and symptoms Diseases 0.000 description 1
- 238000005516 engineering process Methods 0.000 description 1
- 208000028299 esophageal disease Diseases 0.000 description 1
- 238000011156 evaluation Methods 0.000 description 1
- 238000013213 extrapolation Methods 0.000 description 1
- 239000000835 fiber Substances 0.000 description 1
- 230000005484 gravity Effects 0.000 description 1
- 238000002847 impedance measurement Methods 0.000 description 1
- 230000000977 initiatory effect Effects 0.000 description 1
- 230000003993 interaction Effects 0.000 description 1
- 229910052740 iodine Inorganic materials 0.000 description 1
- 239000011630 iodine Substances 0.000 description 1
- 230000001788 irregular Effects 0.000 description 1
- 238000000691 measurement method Methods 0.000 description 1
- 239000000203 mixture Substances 0.000 description 1
- 230000004899 motility Effects 0.000 description 1
- 210000003205 muscle Anatomy 0.000 description 1
- 238000009206 nuclear medicine Methods 0.000 description 1
- 230000003287 optical effect Effects 0.000 description 1
- 230000001151 other effect Effects 0.000 description 1
- 230000001575 pathological effect Effects 0.000 description 1
- 230000007170 pathology Effects 0.000 description 1
- 230000002572 peristaltic effect Effects 0.000 description 1
- 210000003800 pharynx Anatomy 0.000 description 1
- 230000000704 physical effect Effects 0.000 description 1
- 230000002250 progressing effect Effects 0.000 description 1
- 238000002601 radiography Methods 0.000 description 1
- 238000007670 refining Methods 0.000 description 1
- 239000004065 semiconductor Substances 0.000 description 1
- 239000000758 substrate Substances 0.000 description 1
- 208000024891 symptom Diseases 0.000 description 1
- 238000002604 ultrasonography Methods 0.000 description 1
- 238000012285 ultrasound imaging Methods 0.000 description 1
- 210000000626 ureter Anatomy 0.000 description 1
- 210000002229 urogenital system Anatomy 0.000 description 1
- 230000002792 vascular Effects 0.000 description 1
- 230000000007 visual effect Effects 0.000 description 1
- 238000012800 visualization Methods 0.000 description 1
Images


Classifications
-
- A—HUMAN NECESSITIES
- A61—MEDICAL OR VETERINARY SCIENCE; HYGIENE
- A61B—DIAGNOSIS; SURGERY; IDENTIFICATION
- A61B6/00—Apparatus for radiation diagnosis, e.g. combined with radiation therapy equipment
- A61B6/48—Diagnostic techniques
- A61B6/481—Diagnostic techniques involving the use of contrast agents
-
- A—HUMAN NECESSITIES
- A61—MEDICAL OR VETERINARY SCIENCE; HYGIENE
- A61B—DIAGNOSIS; SURGERY; IDENTIFICATION
- A61B6/00—Apparatus for radiation diagnosis, e.g. combined with radiation therapy equipment
- A61B6/12—Devices for detecting or locating foreign bodies
-
- A—HUMAN NECESSITIES
- A61—MEDICAL OR VETERINARY SCIENCE; HYGIENE
- A61B—DIAGNOSIS; SURGERY; IDENTIFICATION
- A61B90/00—Instruments, implements or accessories specially adapted for surgery or diagnosis and not covered by any of the groups A61B1/00 - A61B50/00, e.g. for luxation treatment or for protecting wound edges
- A61B90/06—Measuring instruments not otherwise provided for
- A61B2090/064—Measuring instruments not otherwise provided for for measuring force, pressure or mechanical tension
-
- A—HUMAN NECESSITIES
- A61—MEDICAL OR VETERINARY SCIENCE; HYGIENE
- A61B—DIAGNOSIS; SURGERY; IDENTIFICATION
- A61B90/00—Instruments, implements or accessories specially adapted for surgery or diagnosis and not covered by any of the groups A61B1/00 - A61B50/00, e.g. for luxation treatment or for protecting wound edges
- A61B90/36—Image-producing devices or illumination devices not otherwise provided for
- A61B2090/364—Correlation of different images or relation of image positions in respect to the body
-
- A—HUMAN NECESSITIES
- A61—MEDICAL OR VETERINARY SCIENCE; HYGIENE
- A61B—DIAGNOSIS; SURGERY; IDENTIFICATION
- A61B5/00—Measuring for diagnostic purposes; Identification of persons
- A61B5/03—Detecting, measuring or recording fluid pressure within the body other than blood pressure, e.g. cerebral pressure; Measuring pressure in body tissues or organs
- A61B5/036—Detecting, measuring or recording fluid pressure within the body other than blood pressure, e.g. cerebral pressure; Measuring pressure in body tissues or organs by means introduced into body tracts
-
- A—HUMAN NECESSITIES
- A61—MEDICAL OR VETERINARY SCIENCE; HYGIENE
- A61B—DIAGNOSIS; SURGERY; IDENTIFICATION
- A61B6/00—Apparatus for radiation diagnosis, e.g. combined with radiation therapy equipment
- A61B6/48—Diagnostic techniques
- A61B6/486—Diagnostic techniques involving generating temporal series of image data
- A61B6/487—Diagnostic techniques involving generating temporal series of image data involving fluoroscopy
-
- A—HUMAN NECESSITIES
- A61—MEDICAL OR VETERINARY SCIENCE; HYGIENE
- A61B—DIAGNOSIS; SURGERY; IDENTIFICATION
- A61B8/00—Diagnosis using ultrasonic, sonic or infrasonic waves
- A61B8/48—Diagnostic techniques
- A61B8/481—Diagnostic techniques involving the use of contrast agent, e.g. microbubbles introduced into the bloodstream
Description
本発明は、管腔臓器内部の放射線学的に造影された材料の位置を測定、表示する方法に関する。 The present invention relates to a method for measuring and displaying the position of a radiologically contrasted material inside a luminal organ.
関係出願の相互参照
本出願は、35USC§119(e)の下で、2007年10月11日出願の「Method of Measuring and Displaying the Position of Radiographically Contrasted Material Within Luminal Body Organs」という名称の米国特許仮出願番号60/998,526号の利益を主張するものであり、同出願は参照により本明細書に組み入れられる。
CROSS-REFERENCE This application of the relationship application, under the 35USC§119 (e), filed on Oct. 11, 2007 "Method of Measuring and Displaying the Position of Radiographically Contrasted Material Within Luminal Body Organs " in the name of US Provisional Patent No. 60 / 998,526 is claimed and is incorporated herein by reference.
様々な医療用画像化技術が、人体の内部の診断用画像を生成するために開発されている。放射線撮影法はこの目的において頻繁に使用され、蛍光透視法(fluoroscopy)は、運動中の構造物の実時間画像化を可能にする技術の1つである。蛍光透視画像は、患者を透過する放射線の強度を測定することによって形成される。この強度は患者の画像化領域の放射線不透過度と共に変化するため、その強度が画像化領域の構造を表わす。蛍光透視画像化において、検出された放射線の強度は、可視画像として表わされる。各々がビデオ画像の1フレームを表わす、連続する画像が取り込まれる。そのようなビデオ画像によって、対象領域における構造物の運動を観察することができる。 Various medical imaging techniques have been developed to generate diagnostic images inside the human body. Radiography is frequently used for this purpose, and fluoroscopy is one technique that allows real-time imaging of moving structures. A fluoroscopic image is formed by measuring the intensity of radiation transmitted through the patient. Since this intensity varies with the radiopacity of the patient's imaging area, the intensity represents the structure of the imaging area. In fluoroscopic imaging, the intensity of the detected radiation is represented as a visible image. Successive images are captured, each representing one frame of the video image. With such a video image, the movement of the structure in the target area can be observed.
ビデオ画像は、それを取り込んだ後に解析のために、モニター上に実時間で表示するか、または記録および/または再生してもよい。処置によっては、蛍光透視画像化は、体管腔内のガイドワイヤまたはステント(stent)の配置を支援するために、実時間で使用される。ガイドワイヤまたはステントは、画像化されるときに、マーカーが、相対的に放射線透過性である周囲と明確な対照をなすように、X線放射の大部分を吸収するか、または散乱させる放射線不透過性マーカーで構築してよい。これらのマーカーは、ガイドワイヤまたはステントにおける遠位端などの戦略的な位置に設置して、技術者が装置の場所を容易に特定できるようにしてもよい。 The video image may be displayed in real time on a monitor or recorded and / or played back for analysis after it is captured. In some procedures, fluoroscopic imaging is used in real time to assist in the placement of a guidewire or stent within the body lumen. A guidewire or stent, when imaged, absorbs or scatters most of the x-ray radiation so that the marker is in sharp contrast to the relatively radiolucent surrounding. It may be constructed with a permeable marker. These markers may be placed at strategic locations, such as a guidewire or the distal end of a stent, to allow the technician to easily locate the device.
また、造影物質(contrast material)を患者の内部に導入して、蛍光透視画像化を使用する検査の一部として、解剖学的構造を描き得ることも知られている。造影物質は、例えば、血管、泌尿生殖系、胃腸(GI)管の機能を明らかにすることができる。知られている造影物質としては、GI管評価のために経口的に、あるいは直腸経由で投与することのできる、硫酸バリウム(BaSO4)の形態のバリウムや、様々な適正な形態のヨウ素がある。これらの造影物質は、大量のX線放射を吸収するか、または散乱させるものであり、動的な身体的過程を実証するための実時間画像化に使用することができる。 It is also known that contrast material can be introduced inside a patient to draw anatomical structures as part of an examination using fluoroscopic imaging. Contrast materials can elucidate the function of, for example, blood vessels, urogenital system, gastrointestinal (GI) tract. Known contrast agents include barium in the form of barium sulfate (BaSO4), which can be administered orally or rectally for GI tract evaluation, and various suitable forms of iodine. These contrast materials absorb or scatter large amounts of x-ray radiation and can be used for real-time imaging to demonstrate dynamic physical processes.
造影物質を用いる放射線画像化を使用して観察された動的な身体的過程の1つが、食道蠕動である。食道蠕動とは、食物や飲料を食道を通過して胃に押し出すための、食道における環状筋の収縮を指すものである。健康な個人に対しては、収縮は食道の上端で始まり、下部食道括約筋(LES:Lower esophageal sphincter)に向かって下方に伝播する。しかし、通常のパターンの収縮が阻害される医療症状がある。このような症状としては、弛緩不能(achalasia)、嚥下障害(dysphagia)、びまん性食道痙攣(diffuse esophageal spasm)、無効性食道運動(ineffective esophageal motility)、および高血圧性LESが挙げられる。 One of the dynamic physical processes observed using radiographic imaging with contrast material is esophageal peristalsis. Esophageal peristalsis refers to the contraction of the circular muscles in the esophagus to push food and beverages through the esophagus and into the stomach. For healthy individuals, contraction begins at the top of the esophagus and propagates downward toward the lower esophageal sphincter (LES). However, there are medical conditions in which the normal pattern of contraction is inhibited. Such symptoms include inability to relax (achalasia), dysphagia, diffuse esophageal spasm, ineffective esophageal motility, and hypertensive LES.
ある医療症状の診断は、管腔臓器内の造影物質の場所と大きさを定量的に測定することによって改善される。造影物質の場所と大きさは、既知の医療用画像化技法を使用して作成された画像を処理することによって把握することができる。そのような測定は、管腔臓器の領域を表わす放射線画像内のフィールドを識別することによって行うことができる。次いで、フィールド内の強度を用いて、フィールドに対応する、管腔臓器に沿った場所における造影物質の量の定量的指標を導き出す。 Diagnosis of certain medical conditions is improved by quantitatively measuring the location and size of the contrast material in the luminal organ. The location and size of the contrast material can be ascertained by processing an image created using known medical imaging techniques. Such a measurement can be made by identifying a field in the radiographic image representing the area of the luminal organ. The intensity within the field is then used to derive a quantitative indicator of the amount of contrast material at the location along the luminal organ that corresponds to the field.
いくつかの態様においては、フィールドは、画像内で検出可能な1または2以上のターゲットを管腔臓器中に導入することによって識別される。このターゲットは、管腔臓器に沿ったセグメントを表わす局所画像フィールドを定義するのに使用される。造影物質が管腔臓器中に導入されると(例えば、「バリウム嚥下物」検査中の食道内の懸濁した硫酸バリウムのボーラス(bolus))、これらの局所画像フィールドにおける放射線画像強度は、管腔臓器に沿った場所における造影物質の位置と近似量を示す。
1つの画像からのデータを使用して、所与の時点における物質分布のプロフィールを表示してもよい。連続画像からのデータが収集される場合には、このデータを使用して、物質の検出量を位置と時間の両方の関数として示す、時空間的プロットを生成することもできる。
In some aspects, the field is identified by introducing one or more targets detectable in the image into the luminal organ. This target is used to define a local image field that represents a segment along the luminal organ. When contrast material is introduced into a luminal organ (eg, a bolus of suspended barium sulfate in the esophagus during a “barium swallow” test), the radiographic intensity in these local image fields is The position and approximate amount of contrast material in a location along the cavity organ are shown.
Data from one image may be used to display a profile of substance distribution at a given time point. If data from sequential images is collected, this data can also be used to generate a spatiotemporal plot that shows the amount of substance detected as a function of both position and time.
ボーラスの位置情報は、管腔臓器に関する他のデータと共記載して、解析のために表示することができる。例えば、筋肉収縮を表わす圧力データを、ボーラス位置情報と共記載(co-registered)して表示して、管腔臓器の検査や患者の診断を高度化することができる。
ある側面において、本発明は診断データを収集する方法に関する。この方法は、複数の連続する時点の各々において、放射線造影物質が管腔内を通過するときの患者の体管腔の放射線画像化データを含む、一連のフレームを取り込むこと;該一連のフレームを処理して、各々が管腔に沿った領域を表わす複数のフィールド、および各々のフレームに対して、造影物質の量の定量的指標を計算すること;および出力として、前記計算された定量的指標に基づいて、体管腔に沿った複数の場所の各々における造影物質の量の定量的指標を時間の関数として提供することを含む。
Bolus position information can be displayed together with other data about the luminal organ for analysis. For example, pressure data representing muscle contraction can be co-registered and displayed with bolus position information to enhance examination of luminal organs and patient diagnosis.
In one aspect, the invention relates to a method for collecting diagnostic data. The method captures a series of frames that include radiation imaging data of a patient's body lumen as the radiocontrast material passes through the lumen at each of a plurality of successive time points; Processing to calculate a quantitative indicator of the amount of contrast material for each of a plurality of fields, each representing a region along the lumen, and for each frame; and, as an output, said calculated quantitative indicator Providing a quantitative indication of the amount of contrast material at each of a plurality of locations along the body lumen as a function of time.
別の側面においては、本発明は診断データを収集するシステムに関する。このシステムは、計算装置および表示装置を含む。この計算装置は、放射線画像化システムから複数の放射線画像を受け取るように構成され、該複数の画像の各々は、放射線不透過性ターゲットおよび造影物質を包含する領域を表わし、各放射線不透過性ターゲットは放射線画像における1つの場所と関連しているとともに、さらに該計算装置は、各放射線画像から複数の値を計算するように構成され、各値は、少なくとも、経路に沿った位置に対する局所画像フィールド内の放射線画像の強度から計算され、前記経路は、少なくとも、複数の放射線不透過性ターゲットの場所に基づいている。表示装置は、複数の放射線画像の各々について、経路に沿った位置の関数として複数の値を表示するように構成されている。 In another aspect, the invention relates to a system for collecting diagnostic data. The system includes a computing device and a display device. The computing device is configured to receive a plurality of radiographic images from a radiographic imaging system, each of the plurality of images representing a region that includes a radiopaque target and a contrast material, and each radiopaque target. Is associated with a location in the radiographic image, and the computing device is further configured to calculate a plurality of values from each radiographic image, each value being at least a local image field for a position along the path. Calculated from the intensity of the radiographic image within, the path is based at least on the location of a plurality of radiopaque targets. The display device is configured to display a plurality of values as a function of position along the path for each of the plurality of radiation images.
別の側面においては、本発明は計算装置および表示装置を含む。この計算装置は、ターゲットおよび造影物質を含む領域を表わす画像を、画像化システムから受け取るように構成されており、さらに該計算装置は、前記画像から複数の値を計算するように構成され、各値は、少なくとも、経路に沿った位置についての局所画像フィールドにおける画像の強度から各々が計算され、前記経路は、少なくとも、前記画像内のターゲットの場所に基づいている。表示装置は、前記複数の値を、前記経路に沿った位置の関数として表示するように構成されている。 In another aspect, the present invention includes a computing device and a display device. The computing device is configured to receive an image representing an area including a target and a contrast material from the imaging system, and the computing device is further configured to calculate a plurality of values from the image, Values are each calculated at least from the intensity of the image in the local image field for positions along the path, the path being based at least on the location of the target in the image. The display device is configured to display the plurality of values as a function of position along the path.
さらに別の側面においては、本発明は、コンピュータ上で実行されると、放射線画像化システムからのフレームを使用して診断データを処理する方法を実施する、コンピュータ実行可能な命令を含む、コンピュータ記憶媒体に関し、前記フレームは、患者の体管腔を透過する放射線の減衰を示す強度データを含み、前記フレームは、管腔内に部材が存在する間である複数の連続する時点において取得され、前記部材は、前記フレーム内で識別可能な複数の放射線不透過性領域を含む。この方法は、各フレームについて:前記複数の放射線不透過性領域中の対応する放射線不透過性領域のまわりの領域を各々が表わす複数のフィールドを、前記フレーム内部で決定すること;前記フレーム内部の前記複数のフィールドの各フィールドについて:前記フィールド内の強度に基づいて、前記フレーム内の造影物質の数量を示す値を計算すること;およびコンピュータに結合されたコンピュータ記憶媒体において、前記数量を示す計算された値を、部材に沿った対応する放射線不透過性領域の位置に基づく管腔に沿った空間位置と関連づけることを含む。 In yet another aspect, the invention comprises a computer storage comprising computer-executable instructions that, when executed on a computer, implement a method for processing diagnostic data using frames from a radiographic imaging system. With respect to the medium, the frame includes intensity data indicative of attenuation of radiation passing through a patient's body lumen, the frame acquired at a plurality of successive time points during the presence of a member in the lumen, The member includes a plurality of radiopaque regions that are identifiable within the frame. The method includes: for each frame: determining a plurality of fields within the frame, each representing a region around a corresponding radiopaque region in the plurality of radiopaque regions; For each field of the plurality of fields: calculating a value indicating the quantity of contrast material in the frame based on the intensity in the field; and calculating the quantity in a computer storage medium coupled to a computer Associating the measured value with a spatial position along the lumen based on the position of the corresponding radiopaque region along the member.
本発明およびその態様は、以下の詳細な説明を、添付の図面と合せて読めばよりよく理解されるであろう。図においては、要素は必ずしも実寸どおりには描かれていない。一般に、複数の図において出現する同一要素は、同一参照符号で識別される。 The invention and its embodiments will be better understood when the following detailed description is read in conjunction with the accompanying drawings. In the figures, elements are not necessarily drawn to scale. In general, identical elements appearing in more than one figure are identified by the same reference numeral.
詳細な説明
本発明者は、医療用画像データの解析と表示によって、全般的および個別的な臨床症例における身体臓器の生理学および病態生理学に対する新しい洞察を得ることができることを認識、理解した。そのような洞察は、医療用画像化技法、および新画像処理および表示技法を使用して特定される管腔臓器内部の造影物質の場所と大きさの定量的な測定によって得ることができる。
データを得て解析するために、放射線不透過性ターゲットを体管腔中に導入して、放射線画像における基準点となるようにしてもよい。この基準点は、画像の強度(例えば、明るさ、不透明度)がそこで測定される、局所画像フィールドの構築のために使用してもよい。フィールド内部の画像強度は、管腔に沿った場所における、造影物質の量を示す。造影物質の動きを、放射線画像の列から時間経過と共に定量的に追跡してもよい。定量測定値を表示する適切な方法によって、運動障害などの管腔臓器の特定の疾患を、より迅速かつ確実に診断することが可能となる。
DETAILED DESCRIPTION The inventor has recognized and understood that analysis and display of medical image data can provide new insights into the physiology and pathophysiology of body organs in general and individual clinical cases. Such insight can be gained by quantitative measurement of the location and size of contrast material within a luminal organ identified using medical imaging techniques and new image processing and display techniques.
In order to obtain and analyze the data, a radiopaque target may be introduced into the body lumen to serve as a reference point in the radiographic image. This reference point may be used for the construction of a local image field where the intensity (eg, brightness, opacity) of the image is measured. The image intensity inside the field indicates the amount of contrast material at a location along the lumen. Contrast material motion may be quantitatively tracked over time from a sequence of radiographic images. Appropriate methods for displaying quantitative measurements allow for more rapid and reliable diagnosis of specific diseases of luminal organs such as movement disorders.
いくつかの態様においては、放射線不透過性ターゲットを、体管腔中に導入されるカテーテルの長さに沿って固定してもよい。造影物質の導入の前に放射線画像を撮影して、バックグラウンド強度またはベースライン強度を求めてもよい。次いで、造影物質が管腔中に導入され、造影物質の動きを観察するために、放射線画像が連続して取り込まれる。カテーテルには、圧力データなどの体管腔についてのデータを収集するのに使用することのできるセンサーを搭載してもよい。このデータは、放射線画像を処理して抽出されるボーラス位置情報と、時間的および空間的に共記載してもよい。結果として、このデータを表示するか、またはその他の方法で一緒に処理してもよい。 In some embodiments, the radiopaque target may be secured along the length of the catheter introduced into the body lumen. A radiographic image may be taken before the introduction of the contrast material to determine the background intensity or baseline intensity. A contrast material is then introduced into the lumen, and radiographic images are successively acquired to observe the motion of the contrast material. The catheter may be equipped with a sensor that can be used to collect data about the body lumen, such as pressure data. This data may be described both temporally and spatially with bolus position information extracted by processing a radiographic image. As a result, this data may be displayed or otherwise processed together.
次いで、画像を実時間で、または前記手順後に処理して、造影物質の場所と大きさを定量的に測定することができる。撮影される各放射線画像に対して、放射線不透過性ターゲットを、画像内で自動的または手動で識別することができる。例えば、放射線不透過性ターゲットの形状およびコントラストによる検出を、好適な識別アルゴリズムの基礎として使用してもよい。放射線不透過性ターゲットの主要特徴(例えば、その画像重心)を次々に連結する曲線を構築してもよい。次いで、この曲線を、セグメントと各セグメントに付随する局所画像フィールドに細分してもよい。各局所画像フィールドにおいて、局所画像フィールドにおける強度は、フィールド内部の画像強度を積分することによって測定してもよい。いくつかの態様においては、ベースライン放射線画像から求められる、ベースライン強度を差し引いて、造影物質のコントラストを強調してもよい。 The image can then be processed in real time or after the procedure to quantitatively measure the location and size of the contrast material. For each radiographic image taken, a radiopaque target can be identified automatically or manually in the image. For example, radiopaque target shape and contrast detection may be used as the basis for a suitable identification algorithm. A curve connecting the key features of the radiopaque target (eg, their image centroid) one after the other may be constructed. This curve may then be subdivided into segments and local image fields associated with each segment. For each local image field, the intensity in the local image field may be measured by integrating the image intensity within the field. In some embodiments, the contrast of the contrast material may be enhanced by subtracting the baseline intensity determined from the baseline radiographic image.
各放射線画像に対して、局所画像フィールドから、曲線に沿った局所画像フィールドの位置の関数として求められる強度測定値から、造影物質のプロフィールを構築してもよい。次いで、このプロフィールを解析および診断のために任意好適な方法で提示してもよい。例えば、プロフィールを、個別にプロット、動画表示、または時空間的プロットの一部として表示してもよい。
いくつかの態様による診断データを収集する方法100を、図1のフローチャートを参照して説明する。
For each radiographic image, a contrast material profile may be constructed from intensity measurements determined from the local image field as a function of the position of the local image field along the curve. This profile may then be presented in any suitable manner for analysis and diagnosis. For example, the profiles may be displayed individually as part of a plot, animation display, or spatiotemporal plot.
A
ステップ101において、1または2以上の放射線不透過性ターゲットが、体管腔などの対象領域中に導入される。ターゲットは、金属または金属含有フィルムもしくは化合物などの、任意好適な材料で構成してもよい。勿論のこと、材料の適性は、画像化に使用される放射線のエネルギーに依存し得る。
ターゲットは、相互に、および管腔に対して相対的に固定されている。ターゲットは、ターゲットを体管腔中に導入するのに使用されるカテーテルのような、基体の長さに沿って組み入れてもよい。
In
The targets are fixed relative to each other and to the lumen. The target may be incorporated along the length of the substrate, such as a catheter used to introduce the target into the body lumen.
いくつかの態様においては、カテーテルは、ターゲットとして作用することのできるセンサーを内蔵してもよい。その他の態様においては、ターゲットは、センサーに隣接して位置してもよい。例えば、検圧法(manometry)検査で使用される態様においては、カテーテルは、放射線不透過性ターゲットともなる圧力センサーを備えてもよい。
ステップ103において、対象領域を範囲に含む、ベースライン画像が撮影される。放射線画像を取得するのに、任意好適な機器を使用してもよい。例えば、放射線画像は、蛍光透視装置またはその他の任意好適な画像化システムを使用して形成してもよい。放射線画像は、単色画像としてもよい。例えば、放射線画像は、グレースケールで表わし、放射線不透過性点を黒で示し、放射線透過点を白で示してもよい。そのような画像において、放射線不透過性ターゲットは黒い部分として見える。
In some embodiments, the catheter may incorporate a sensor that can act as a target. In other embodiments, the target may be located adjacent to the sensor. For example, in an embodiment used in a manometry test, the catheter may include a pressure sensor that also serves as a radiopaque target.
In
ベースライン放射線画像を、造影物質が管腔中に導入される前に撮影して、画像強度における変動(放射線不透過性ターゲットを除き)が、管腔および周囲の身体構造の特性に帰するようにしてもよい。このバックグラウンド強度は、放射線撮影検査中に、相対的に一定であってもよい。
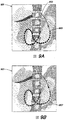
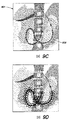
図2Aは、ステップ103において取得されるベースライン画像201の一例である。例示画像201において明瞭に見えるのは、体管腔の内側に配置された、36個の放射線不透過性ターゲット205を有するカテーテル203である。ベースライン画像の別の例が、図4Aに示されている。ここで、カテーテル403は、ターゲット405を3つだけ備える。さらに別の例が、図9Aに示されており、この場合には、カテーテル903および付随するターゲット905は、回旋状形状(convoluted shape)をとっている。
Baseline radiographs are taken before contrast material is introduced into the lumen so that variations in image intensity (except for radiopaque targets) are attributed to the characteristics of the lumen and surrounding body structures It may be. This background intensity may be relatively constant during a radiographic examination.
FIG. 2A is an example of the
図1に戻ると、ステップ105において、放射線撮影検査が開始される。検査は、当該技術で知られているように実施され、これには、造影物質に管腔の通過を開始させることを含めてもよい。例えば、放射線不透過性ターゲットが患者の食道内部に配送されている場合には、バリウム嚥下物またはその他の好適なボーラスを使用してもよい。
放射線撮影検査の間、例えば、ステップ103で使用されたのと同じ機器を使用して、一連の放射線画像が撮影される(ステップ106)。画像は、例えば、造影物質の動きを取り込むために、連続的に撮影してもよい。好適な固定フレームレートまたは不規則フレームレートを使用してもよい。画像には、タイムスタンプをつけて、適切な時間再構成を可能にしてもよい。
Returning to FIG. 1, in
During the radiographic examination, a series of radiographic images are taken (step 106), for example, using the same equipment used in
ステップ107、109、111、113、115および117は、連続画像における各画像に対して実施してもよい。いくつかの態様においては、これらのステップは実時間で実施することができる。例えば、これらのステップをパイプライン化するか、または別の画像を得るために回帰経路(return path)119を経由してステップ106に戻る前に実行してもよい。代替的に、これらのステップは、任意好適な後の時間において実行してもよい。例えば、診断手順が実施された後である。いくつかの態様においては、放射線画像は、この後に、記憶されたデータに基づいて処理される。さらに別の態様においては、放射線画像は、検査中に処理するとともに、その後に再び処理してもよい。
各放射線画像に対して、ステップ101において導入された放射線不透過性ターゲットの場所が識別される(ステップ107)。コンピュータシステムを、ターゲットを識別するために好適なアルゴリズムでプログラムするか、または手動操作での識別を可能にするように構成してもよい。ターゲットの場所が概略で識別されると、ターゲットの主要特徴を用いて、正確な位置を識別することができる。例えば、この位置は、ターゲットの画像重心によって定義してもよい。図2Bは、放射線画像201における放射線不透過性ターゲット205の位置が十字線209で識別されている一例を示す。同様に、ターゲット位置は、図4Bおよび9Bに示すように、十字線209および907によってそれぞれ識別されている。
For each radiographic image, the location of the radiopaque target introduced in
多数の可能なルーチンを使用して、ターゲット場所を自律的に識別してもよく、また任意好適なルーチンを使用してもよい。一例として、図3Aは、ラスター走査によってターゲット場所を識別するための方法300を提供する。ルーチンは、放射線不透過性ターゲットを示す画像強度の変化に対して、画像の1または2以上の行を走査する。すべてのターゲットが発見されるまで、または全画像が走査されるまで、走査される行を増分させる。ステップ301において、ラスター走査が初期化されて、様々なパラメータを設定してもよい。例えば、パラメータには、走査される画像、最小および最大のターゲット直径、明るさ閾値、同時に走査する行、および増分ごとの行数を含めてもよい。ステップ303において、画像の次の行(複数を含む)(例えば、最初に上端行または行群)が走査されて、候補ターゲットを識別する。候補ターゲットは、指定された閾値を越える、走査行または1組の走査行に沿った画像強度の変化に対応するエリアであって、その後に反対方向の変化があり、この場合に、これらの変化部の間の距離が最大ターゲット直径以下であるエリアとして識別することができる。その行にターゲットがある場合には、ターゲット場所が保存される(ステップ305)。さらに調査すべき行がある場合(ステップ307)には、走査すべき行が更新されて(ステップ309)、識別工程が反復される(ステップ303)。
A number of possible routines may be used to autonomously identify the target location, and any suitable routine may be used. As an example, FIG. 3A provides a
図示された態様において、候補ターゲット場所に対して、すべての行が走査されると、「スーパー候補」ターゲット場所が、ステップ310において識別される。スーパー候補ターゲット場所は、隣接する行における近接する(contiguous)候補場所と定義することができる。ターゲット場所がスーパー候補として識別される前に、候補ターゲット場所が存在する隣接行数を、任意好適な方法で特定してもよい。例えば、その行数は、ユーザが指定してもよく、またはターゲットの大きさおよび画像の解像度から特定してもよい。
しかし、スーパー候補場所が識別されるタイミングは変えてもよい。例えば、各連続行が走査された後に、その行に対するターゲット場所を、先に走査された行からのターゲット場所と合せて解析して、スーパー候補場所を識別してもよい。
In the illustrated aspect, once all rows have been scanned for a candidate target location, a “super candidate” target location is identified in
However, the timing at which the super candidate location is identified may be changed. For example, after each successive row is scanned, the target location for that row may be analyzed along with the target location from the previously scanned row to identify the super candidate location.
次いで、様々なアルゴリズム的に実装される制約によって、ステップ311においてスーパー候補場所をさらに区別してもよく、その制約は:最大ターゲットサイズ以下であること、候補ターゲット形状(およびその回転)を有すること、既知のターゲット間隔を有すること、およびターゲットをそれに取り付けることのできるカテーテル、および/または検査中の管状臓器の最小屈曲半径に一致する曲線に沿っていることが含まれる。図示した態様においては、スーパー候補場所の一部ではない候補ターゲット場所は、それ以上処理されない。
Then, various algorithmically implemented constraints may further distinguish the super candidate locations in
ステップ311における処理には、ターゲット場所を精密化することをさらに含めてもよい。いくつかの態様においては、ターゲット形状と組み合わせたターゲットの主要特徴を用いてターゲット場所を定義してもよい。例えば、質量中心計算を使用して、識別された各ターゲットの中心を求めてもよい。さらに、ステップ109(図1)におけるその後の曲線の形成のために、ターゲットを順序づけてもよい。
The processing in
第2の例として、図3Bは、最大ターゲットサイズよりもわずかに大きいウィンドウを使用するターゲットの識別方法312を提供する。ステップ313において、ルーチンを初期化して、ウィンドウ位置、大きさ、および走査経路などの初期パラメータを指定することができる。各位置に対して、ウィンドウ内のターゲットの存在について判定が行われる(ステップ315)。ターゲットは、例えば、大きさ、コントラスト、および/または形状によって認識することができる。ターゲットが存在する場合には、ターゲット位置が保存され(ステップ317)、走査すべき画像がさらにある場合(ステップ319)には、ウィンドウ位置が増分される(ステップ323)。全画像が走査されるか、または全ターゲットが検出されるまで、この工程が反復される。ウィンドウ移動の増分を十分に小さくすることによって、各ターゲットが少なくとも一度、ウィンドウ内に入ることを保証することができる。任意に、ステップ321を実行して、ターゲット場所の曖昧さ、または重複を解消したり、ステップ311と同様にターゲットを順序づけてもよい。
As a second example, FIG. 3B provides a
付加的な、またはさらなる代替的な選択肢として、グラフィカルユーザーインターフェイス(GUI)を、ユーザがターゲット場所を手動操作で識別するために設けてもよい。例えば、ユーザが(例えば、マウスまたはトラックボールを使用して)各映像の上にカーソルを単に置くことでターゲットを識別し、その位置を指定することのできるGUIを構築してもよい。そのようなGUIを、自動的に識別された位置を見直し、補正するのに使用してもよい。 As an additional or further alternative option, a graphical user interface (GUI) may be provided for the user to manually identify the target location. For example, a GUI may be constructed that allows a user to identify a target by simply placing the cursor over each video (eg, using a mouse or trackball) and specify its location. Such a GUI may be used to review and correct automatically identified locations.
図1に戻ると、方法100のステップ109において、ターゲットの位置に基づいて曲線が構築される。任意好適な曲線構築アルゴリズムを用いることができる。図2Cは、ターゲット場所209(図2B)の各々を通過するように曲線211が構築される例を提示する。いくつかの態様においては、ターゲット位置の配列に多項式曲線当てはめ技法を適用してもよい。いくつかの曲線形成アルゴリズムでは、当てはめアルゴリズムが連続ターゲットを適正に連結することを保証するために、ターゲットの並び(すなわち、順序)を指定することが必要となることがある。適当な並びは、例えば、カテーテルに沿った既知のターゲット間隔に基づいて決めることができる。例えば、好適なアルゴリズムの1つは、例えば図4Cの曲線409に対するように、その並びにおいて隣接するターゲットの場所を連結する一連の線群から曲線を構築する。図9Cに示すような、その他の状況においては、やや高級な曲線形成アルゴリズムが必要となる。例えば、最小曲率半径を設定することによって、曲線909の正しい解を求めることができることが、画像901から明白である。
Returning to FIG. 1, in
ステップ111においては、ステップ109において形成された曲線に沿って、局所画像フィールドが構築される。各局所画像フィールドは、画像強度の測定がその範囲内で行われる、放射線画像の領域を定義する。局所画像フィールドを定義するための多数の好適な可能性があり、任意好適な技法を用いることができる。最小値よりも小さい曲率半径を有する曲線が得られる順序はあり得ないと考え、その他の可能な曲線を構築するなどの、いくつかの説明例が示されている。
In
いくつかの態様においては、局所画像フィールドが、各ターゲット場所において図2Dに示す例のように構築される。局所画像フィールド213は、楕円として示されており、その楕円の主軸は十字線209で指示されるターゲット場所を中心とする曲線211に直角になっている。しかしながら、任意好適な形状または配置を用いることができる。例えば、図5Aにおいて、長方形画像フィールドが、ターゲット場所を中心とし、関連するターゲット場所で長辺が曲線に直角になるように、定義されている。
In some aspects, local image fields are constructed as in the example shown in FIG. 2D at each target location. The
いくつかの態様においては、異なる数のターゲットおよび局所画像フィールドが望まれ得る。局所画像フィールドは、ターゲット場所に関係なく、曲線に沿って定義される点に関連づけてもよい。これらの点は、局所画像フィールドに対する基準場所とすることができる。例えば、いくつかの態様において、識別されたターゲットまたは利用可能なターゲットの数が、望ましい局所画像フィールドの数よりも少なくてもよい。図4A〜4Dに示す放射線画像401は、そのような例を示している。好適な数の点が、曲線409(図4C)に沿って定義され、各点に対して局所画像フィールドが定義されている。図4Dは、構築された局所画像フィールド411を示す。図2Dにおけるように、局所画像フィールドは、楕円として示されているが、ここでは、各楕円の主軸は、ターゲット場所ではなく、対応する基準点において曲線に直角になっている。
In some aspects, a different number of targets and local image fields may be desired. The local image field may be associated with points defined along the curve, regardless of the target location. These points can be reference locations for the local image field. For example, in some aspects, the number of identified or available targets may be less than the number of desired local image fields.
任意好適な形状および技法を用いて、局所画像フィールドを定義することができる。図5Bは、図2Aにおいて最初に紹介した放射線画像201で、局所画像フィールドの代替構築を示す。図5Bにおいて、同等の長さの直線が、ターゲット場所の間で、曲線を中心として、かつ曲線に直角になっている。各フィールドの横方向の両端部は、図示のように、等長線の端部を相互接続することによって形成されて、局所画像フィールドを定義する閉領域を形成している。この例における局所画像フィールドは、外見が梯子形構造をしている。各四辺形領域が、その中心または中心付近でターゲット場所に関連する局所画像フィールドである。この特定の例では、曲線から指定された距離の範囲内の全てのエリアがフィールドの範囲に入ること、および曲線の曲率が十分に小さい場合(または、それと等価に曲線に垂直の線が十分に短い場合)にフィールド間に重複がないことが保証される。
Any suitable shape and technique can be used to define the local image field. FIG. 5B shows an alternative construction of the local image field with the
ステップ113において、ステップ103において得られるベースライン放射線画像から求められるベースライン強度は、任意に、各放射線画像から差し引かれる。この減算によって、各画像におけるベースラインオフセット残差(baseline offset residual)の補正が行われ、造影物質のコントラストを強調することができる。ステップ113の2つの例示態様が示されている。しかしながら、ステップ113は、任意好適な方法で実施できることを理解すべきである。ここで第1の態様を説明し、第2の態様はステップ115の説明の後で説明される。
ステップ113の第1の例示態様においては、対象領域全体におけるベースライン放射線画像が、連続画像における各放射線画像から差し引かれる。例えば、ベースライン画像と連続画像における各画像とが同一サイズおよび解像度である場合には、各ピクセルの強度値を、ピクセル単位で差し引いてもよい。
In
In the first exemplary embodiment of
ステップ115において、各放射線画像に対して、各局所画像フィールドにおける画像の強度が、任意好適な方法で求められる。いくつかの態様においては、局所画像フィールド内部の画像強度は、局所画像フィールドエリア上で積分されて、フィールド強度が求められる。例えば、ピクセル化された画像に対して、ある局所画像フィールド内部の全ピクセルのピクセル値を合計して、合計値がフィールド強度を表わしてもよい。その他の態様においては、積分は、局所画像フィールドの合計面積で重み付け、例えば局所画像フィールドの面積(例えば、フィールド内のピクセル数)で積分値を割り算して重み付けしてもよい。これは、例えば、局所画像フィールドが均一なサイズでない(例えば、梯子構造のような)場合に有用である。フィールド強度は、局所画像フィールドに関連する基準点の近傍における造影物質の大きさを示す。
In
ステップ113の第2の例示態様においては、局所画像フィールドは、ステップ111において説明したのと同じ方法で、ベースライン放射線画像に対して定義されており、これは、検査中、その後、またはその両方などの、任意好適な時間に実行することができる。次いで、ベースラインフィールド強度が、ステップ115に説明したのと同じ方法で、ベースライン画像の各フィールドについて求められる。このベースラインフィールド強度は、一連の放射線画像の各々における対応するフィールド強度から差し引かれる。図5Cは、造影物質なしで形成される画像に対して、結果として得られる強度プロフィールを示す。この例においては、局所画像フィールドは、上述のような梯子構造に形成されている。プロット510において、局所画像フィールドにおけるベースライン強度は、画像における物体の不透明度として表わされる。図のように、不透明度は、ステップ109において定義される曲線に沿った位置の関数としてプロットされている。
In the second exemplary aspect of
図5Cによって示されるように、プロット510における不透明度プロフィールは、ステップ115において各画像に対して求められたフィールド強度プロフィールから差し引かれる。この補正によって、ベースライン画像強度における変動から生じる、各フィールドの事後強度におけるバイアスを低減する。プロット520は、理想的な場合において、造影物質を含まない画像の局所画像フィールドに関連する強度値からベースラインが差し引かれると、不透明度プロフィールが曲線に沿ってゼロであることを示している。
ブロック113における処理に対する、さらに別の手法において、ベースラインは、画像全体に対して求めてもよい。次いで、このベースラインは、後続のフレームが収集されるときに、それらから差し引いてもよい。
As shown by FIG. 5C, the opacity profile in
In yet another approach to the processing at
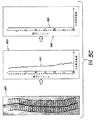
図6A〜6Dは、患者の食道を通過するバリウム嚥下物の、一連の連続放射線画像601、603、605および607、またはフレームを示す。これらの画像は、ステップ113の第1の例示態様によって、ベースライン画像寄与を相殺するために補正されている。画像の各々において、ボーラスが、暗いブロブ(blob)として見えており、ブロブ内部には、放射線不透過性ターゲット場所において、目に見えて分かるスポットがある。ボーラスは、一連の画像にわたって下方に進んでいるのが明らかに見える。また、説明の目的で、梯子局所画像フィールド構造が重ね合わされていることに注意されたい。
6A-6D show a series of sequential
図6A〜6Dにおいて、ラインプロット651、653、655および657は、各局所画像フィールド内部の不透明度を求めることによって、ボーラス場所の定量的指標をそれぞれ提供する。この例においては、造影物質のボーラスが管腔を通過するときに、連続する時間間隔で、局所画像フィールドを定義するのに、梯子構造213が用いられている。プロフィール6591〜6594は、患者の食道を降下するボーラスの進行を定量的に示している。
図のように、プロット651、653、655および657は2次元プロットであり、各々が位置の関数としての数量を示している。ここで、位置は、ステップ109において定義される曲線に沿って測定される。この例における曲線に沿った距離は、局所画像フィールドを定義するのに用いられた、等間隔に配置されたターゲットに基づいて求められる。曲線が直線ではない、図6A〜6Dの例においては、曲線に沿った位置は、画像における場所と直接的に相関しないことがある。データを解析するときには、その曲線が体管腔に追従しているので、画像座標系ではなくこの曲線を基準として位置的に表示されたデータを見るのが望ましいことがある。このようにすると、データは、体管腔を通過する動きをより直感的に表わすことができる。したがって、このプロットは、体管腔の機能の理解を容易にする、測定データの描写を提供することができる。
6A-6D, line plots 651, 653, 655, and 657 provide a quantitative indication of the bolus location, respectively, by determining the opacity within each local image field. In this example, a
As shown, plots 651, 653, 655, and 657 are two-dimensional plots, each showing quantity as a function of position. Here, the position is measured along the curve defined in
造影物質が完全に不透明であるか、または実質的に完全に不透明である態様においては、造影物質の量の定量的指標は、各ターゲット場所におけるボーラスの断面幅の指標である。ボーラスが横断面において実質的に円形である態様においては、そのような定量的指標は、体積の指標となる。しかしながら、定量的指標が体積であること、またはその他の何らかの特定の寸法を有することは、本発明の要件ではない。 In embodiments where the contrast material is completely opaque or substantially completely opaque, the quantitative measure of the amount of contrast material is a measure of the cross-sectional width of the bolus at each target location. In embodiments where the bolus is substantially circular in cross section, such a quantitative indicator is an indicator of volume. However, it is not a requirement of the present invention that the quantitative indicator is volume or have any other specific dimensions.
図7A〜7Dは、ステップ113の第2の例示態様を用いての、同一のデータセットの解析を示す。ベースライン画像201(図5C)において最初に観察されるバックグラウンド構造は、放射線画像701、703、705および707の各々において認識できる。局所画像フィールドにおける強度が各放射線画像において求められて、次いで、各画像に対して、それぞれのフィールド強度から、図5Cの副図510にプロットされたベースライン強度が差し引かれる。その結果が、プロット751、753、755および757にプロットされている。図7A〜7Dのプロフィールデータ7591〜7594を、図6A〜6Dにおけるそれぞれのプロフィールデータ6591〜6594と比較すると、この例においては、ベースライン画像強度に対するいずれの調節手法を用いても、結果がまったく同様であることが明らかである。
7A-7D illustrate analysis of the same data set using the second exemplary aspect of
図1に戻ると、処理はステップ117に続き、ここで収集されたデータが表示される。添付の図から当業者には明白であろうように、この表示は、コンピュータによって表示装置上に描画することができるが、任意好適な装置を使用してもよい。プロフィールデータは、任意好適な方法で表示することができる。例えば、プロフィールデータを、図6A〜6Dおよび図7A〜7Dで行ったように、単に一連のラインプロットとしてプロットしてもよい。代替的に、これらのラインプロットを、単軸上に重ね合わせて、例えば、異なる色、パターン、マーカー、またはそれらの任意好適な組合せを用いて区別してもよい。いくつかの態様において、ラインプロットは、見る者に対して動画表示またはビデオとして見えるように、共通の座標系に対して位置合わせされて、連続して表示される。
Returning to FIG. 1, processing continues at
別の態様においては、一連のフレームから収集されたデータを、時間軸と空間軸を有する時空間的プロット上に集合的に表示してもよい。時間軸は、各放射線画像の取得の相対的時間を表わすことができる。空間軸は、フィールド強度がそれと関連づけられる曲線に沿った位置を表わす。フィールド強度は、色、等高線、濃度パターン、またはその他任意好適な表現を用いて表わすことができる。このようにして、見る者は、複数の放射線画像から求められた、位置合わせされたデータを、単一プロット上で同時に観察することができる。 In another aspect, data collected from a series of frames may be collectively displayed on a spatiotemporal plot having a time axis and a space axis. The time axis can represent the relative time of acquisition of each radiographic image. The spatial axis represents the position along the curve with which the field intensity is associated. Field intensity can be expressed using color, contour lines, density patterns, or any other suitable representation. In this way, the viewer can simultaneously observe the aligned data determined from the plurality of radiographic images on a single plot.
いくつかの態様において、造影物質の特定の分布を表わすデータが、圧力などの他の高解像度生理学データと組み合わされ、表示のために共記載される。造影物質位置とその他の生理学的性質の分布との間の関係は、容易に識別可能であり、全般的および特に個別的な臨床事例における臓器の生理学および病態生理学の新しい洞察をもたらすことができる。 In some embodiments, data representing a specific distribution of contrast material is combined with other high resolution physiological data, such as pressure, and co-described for display. The relationship between contrast material location and the distribution of other physiological properties is easily identifiable and can provide new insights into organ physiology and pathophysiology in general and particularly individual clinical cases.
そのようなデータの共記載の一例が図8に示されている。この態様においては、データは、ユーザがデータの見え方や提示方法を操作することのできる、ユーザーインターフェイスに表示される。図8に示す一例は、体管腔に沿った圧力データの表示および解析用に開発された、ManoViewTMソフトウエアユーザーインターフェイス800を使用する態様を示している。示されたユーザーインターフェイス800において、プロフィールデータは、圧力データと組み合わせて、患者の上部GI管内のボーラスの場所を指示しており、圧力データは、GI管内の筋肉収縮の指標となることができる。
An example of such co-description of data is shown in FIG. In this aspect, the data is displayed on a user interface that allows the user to manipulate how the data is viewed and presented. The example shown in FIG. 8 illustrates an embodiment using a ManoView ™
ユーザーインターフェイスは、任意好適な方法でプロフィールデータを表示してもよい。いくつかの態様においては、表示には、データの複数の異なる表現を同時に含めることができる。ユーザーインターフェイス800の例においては、等高線表示領域810およびプロフィール表示領域830が、放射線画像820と組み合わせて表示されている。
等高線表示領域810は、ボーラス位置と圧力データの時空間的プロットを提供する。この空間軸840は垂直に延びており、時間軸850は水平に延びている。インターフェイスによって、ユーザは、検査が完了した後にデータが表示される態様において、嚥下シークエンスのどの部分を選択するかに使用することができる、任意好適なズームコントローラ813、スクロールバー815、または類似の表示コントロールを用いて、表示されたデータを操作することが可能になる。
The user interface may display the profile data in any suitable way. In some aspects, the display can include multiple different representations of data simultaneously. In the example of the
The
プロフィール表示領域830は、ある瞬間におけるデータを示す。事後表示について、この瞬間は、タイムコントロール811の位置によって選択することができる。実時間データ表示について、プロフィールプロットは、データが収集された状態で表示してもよい。
いくつかの態様において、等高線表示領域810において表示されたボーラス位置データは、空間的および時間的に軸について共記載された他のデータと重ね合わせてもよい。この例においては、圧力データは、等高線表示領域810における位置データと共に提示されている。位置または圧力データは、可変透明度を有してもよい。また、位置データおよび圧力データは、異なるカラースケールを使用して表示して、両方のデータベースを、同一組の軸上で同時に見ることができるようにしてもよい。図8に示す態様においては、圧力データを表わすのに用いられる色および/または透明度を示すために、ディスプレイスケール891が設けられている。第2のディスプレイスケール893が、ボーラス位置データを表わすのに使用される色および/または透明度を示すために設けられている。例示した態様において、色および/または透明度の連続体は、各タイプのデータである。
The
In some aspects, the bolus position data displayed in the
ボーラス位置データと、圧力データとを空間軸に沿って共記載することによって、圧力とボーラス位置の相互作用を正確かつ直感的に視覚化することができる。カテーテル上の圧力センサーが放射線不透過性ターゲットとしての役割も果たす態様においては、圧力測定値は、ターゲットの近傍におけるボーラスの数量の測定値と、容易に位置的に相関させることができる。しかし、その他の記載法も可能である。 By co-denoting bolus position data and pressure data along the spatial axis, the interaction between pressure and bolus position can be accurately and intuitively visualized. In embodiments where the pressure sensor on the catheter also serves as a radiopaque target, the pressure measurement can be easily positionally correlated with the bolus quantity measurement in the vicinity of the target. However, other notations are possible.
そのような表示はデータの見直しを容易にすることができる。圧力測定だけでは、ボーラスがどこにあるか、および嚥下シークエンスの間に適切に排除されたかどうかを判定することは、いつも可能であるとは限らない。放射線プロフィールデータのみでは、ボーラスの動きは見ることができるが、動きまたは動きの欠如が、臓器内部の運動機能(蠕動収縮および適当な収縮または括約筋の弛緩など)の結果であるか、または重力効果または構造効果などのその他の効果の結果である度合いの識別がいつも可能であるとは限らない。これらのデータの位置を共記載することによって、ボーラスの動きと、それを駆動する生理学的圧力(「運動機能」)が明瞭に表示され、分析者は、ボーラス運動異常の源を迅速に識別するとともに、逆に、ボーラス流に対する生理学的異常の機能上の影響を識別することができる。複数の特性を表示するための方法およびシステムは、「Diagnostic System for Display of High-Resolution Physiological Data of Multiple Properties」という名称の米国特許出願第12/148679号、および「Visualization of Values of a Physical Property Detected in an Organism Over Time」という名称の米国特許出願第10/281068号に記載されており、各々の全文を参照により本明細書に組み入れる。 Such a display can facilitate data review. With pressure measurements alone, it is not always possible to determine where a bolus is and whether it has been properly eliminated during the swallowing sequence. With radiation profile data alone, bolus movement can be seen, but movement or lack of movement is the result of motor functions within the organ (such as peristaltic contraction and proper contraction or sphincter relaxation) or gravity effects Or it is not always possible to identify the degree that is the result of other effects such as structural effects. By co-descripting the location of these data, the bolus movement and the physiological pressure ("motor function") that drives it are clearly displayed, and the analyst can quickly identify the source of the bolus movement abnormality And conversely, the functional impact of physiological anomalies on bolus flow can be identified. Methods and systems for displaying multiple properties are described in US patent application Ser. No. 12 / 148,679 entitled “Diagnostic System for Display of High-Resolution Physiological Data of Multiple Properties” and “Visualization of Values of a Physical Property Detected”. No. 10/281068, entitled “in an Organism Over Time”, each of which is hereby incorporated by reference in its entirety.
等高線プロットと共にその他のタイプのデータも提示してもよい。例示ユーザーインターフェイス800におけるプロフィール表示領域830は、ボーラスプロフィールのラインプロット831を提供する。圧力プロフィール837も示されており、これは放射線不透過性ターゲットに位置的に相関づけされたセンサーを使用して測定することができる。等高線プロットおよびプロフィールプロットは、プロフィール表示領域830の位置軸840が、等高線表示領域810の位置軸と位置合せされるように表示することができる。プロフィール表示領域830は、タイムバー811によって示される、時間軸850上の時間におけるボーラスプロフィール831を表示するように構成してもよい。ユーザーインターフェイス800は、ボーラスプロフィール831を決定する放射線画像820を表示するように構成してもよい。放射線画像の表示は、ベースライン画像を差し引いた後に;ベースライン補正なしで;局所画像フィールド、ターゲット場所、または重ね合わせた曲線ありで、またはなしで;あるいはその他任意好適な方法で、表示される。
Other types of data may be presented along with the contour plot. The
いくつかの態様においては、測定値が採取された領域の解剖学的構造の図示をデータと共に示してもよい。ユーザーインターフェイス800に示す例においては、測定データは、上部胃腸(GI)管に沿って収集される。身体のその領域の解剖学的構造(anatomy)の基準描画835が、プロフィール表示領域830の一部として示されている。
基準描画835は、周囲区域の重要な特徴に対して測定データの位置を明確に示すために、複数の基準特徴を有してもよい。基準描画835が上部GI管である実施例においては、基準特徴としては、咽頭832、上部食道括約筋(UES)、食道836、下部食道括約筋(LES)、胃839、その他を含めてもよい。
In some embodiments, an illustration of the anatomy of the region from which measurements were taken may be shown along with the data. In the example shown in the
The reference drawing 835 may have a plurality of reference features to clearly indicate the position of the measurement data relative to important features of the surrounding area. In embodiments where reference drawing 835 is the upper GI tract, reference features may include
図8に示すように、解剖学的構造の図解を提示するユーザーインターフェイス800は、UESおよびLESにそれぞれ対応するランドマーク834および838などの、1または2以上のランドマークを有してもよい。ランドマークは対照特徴(control feature)として働き、ユーザまたはコンピュータ処理が、表示された圧力データに基づいて軸840に対して、解剖学的構造のある部分の場所を設定することを可能にする。例えば、ユーザは、括約筋活動に伴い比較的高圧力を示す、圧力データの部分に基づいて、これらのランドマークを配置することもできる。この図表示を、設定されたランドマークの場所に対して相関づけすることによって、コンピュータは、特定の状況、例えば、異なる大きさの患者に対して、空間軸840に対してそれを変倍および配置することによって、解剖学的構造の図表示を調節することができる。
As shown in FIG. 8, a
放射線不透過性ターゲットと好適な造影物質を使用する、放射線画像化システムの実施例を用いて説明したが、当該技術において知られているその他の好適な画像化システムを使用してもよい。例えば、いくつかの態様においては、超音波画像化システムを使用してもよい。そのような態様においては、好適なターゲットおよび造影物質は、超音波画像において高いコントラストで見えるように、十分な濃度のものとすることができる。別の例として、核医学から知られている、放射線核種画像化(radionuclide imaging)技法を使用してもよい。 Although described using an embodiment of a radiographic imaging system using a radiopaque target and a suitable contrast material, other suitable imaging systems known in the art may be used. For example, in some embodiments, an ultrasound imaging system may be used. In such embodiments, suitable targets and contrast materials can be of sufficient concentration so that they appear with high contrast in the ultrasound image. As another example, radionuclide imaging techniques known from nuclear medicine may be used.
方法100のいくつかの態様においては、カテーテルが、放射線撮影検査の途中で動くことがある。図11は、放射線撮影検査の途中に、カテーテルが動く例を示している。放射線画像1110から最初に識別される、ターゲット場所1111は、放射線画像1120に対してはもはや正確ではない。動きに対する調節をするために、動きを追跡して、画像フレームに対するターゲット場所を動的に調節してもよい。そのような動きを追跡して、局所フィールドを動的に再位置決めすることは、放射線不透過性コントラスト媒体が、ときによってはターゲットを見え難くするということから、複雑になることがある。いくつかのターゲットが観察できないときに、ターゲット場所に基づいて画像を処理することは、いくつかの方法で達成することができる。例えば、造影物質の通過の間に見ることのできる状態のターゲットを追跡して、見えなくなったターゲットおよびフィールドの位置を、内挿または外挿によって推定してもよい。代替的に、材料が通過した後(例えば、バリウム嚥下検査の嚥下の間)に、ターゲットを再識別して、結果として得られる局所画像フィールドの場所および配置を設定してもよい。次いで、局所画像フィールドの初期位置および配置と、それらの再設定された位置および配置との間で、時間軸においてそれらの位置および配置を内挿することによって、局所画像フィールドを移動可能にすることができる。
In some aspects of the
方法100は、任意好適なシステムを使用して実施することができる。図10は、いくつかの態様によるシステム1000を示す。システム1000は、対象領域1010内に位置する1または2以上のターゲット1011、画像化システム1020、計算装置1030、およびディスプレイ1040を含む。市販の医療用画像化システムを使用してもよいが、対象領域1010を画像化するのに好適な任意の画像化システム1020を使用することができる。ターゲット1011は、画像化システム1020によって検出されるとともに画像化されるとターゲットとして識別できるように、好適な大きさ、形状、および材料組成のものである。
画像化システム1020は、造影物質の導入の前に対象領域を画像化して、ベースライン画像を設定してもよい。好適な造影物質が対象領域1010に導入されると、画像化システムを一連の画像を取得するように構成してもよい。
The
The
計算装置1030は、医療画像データを処理するための当該技術において知られているタイプのものでよく、画像化システム1020に動作可能に接続して、一連の画像を実時間または任意の後続時間に受け取ってもよい。計算装置1030は、装置のコンピュータ記憶媒体1037に記憶され、好適なプロセッサ1038によって実行される、コンピュータ実行可能なモジュールを使用して方法100のステップを実施するように構成してもよい。例えば、計算装置は、各画像におけるターゲット場所を識別するための、ターゲット識別モジュール1031を備えてもよい。任意選択で、ユーザが手動操作でターゲット位置を指定するために、ユーザーインターフェイスモジュール1036を設けてもよい。
The
曲線生成モジュール1032を、好適な曲線を生成するのに使用してもよい。画像フィールド生成モジュール1033を、曲線および/またはターゲット場所情報を用いて局所画像フィールドを生成するのに使用してもよい。ベースライン補正モジュール1034を任意選択で使用して、ベースライン画像の寄与を相殺してもよい。フィールド強度積分モジュール1035を使用して局所画像フィールド内のフィールド強度を求めてもよい。
ユーザーインターフェイスモジュール1036を、ディスプレイ1040に表示用のデータを出力するように構成してもよい。任意好適な表示技術を用いてもよい。
The
いくつかの態様は、医師が、体管腔を通過する造影物質の通過を迅速かつ定量的に予測することを可能にすることを理解すべきである。バリウム嚥下検査が示されている、ユーザーインターフェイス800(図8)の例において、医師は、結果として得られるデータの時間プロットを単にスクロールして、それぞれの嚥下をビデオとして見る時間をとる必要なく、ボーラスの動きの完全な表現を得ることができる。医師は、弛緩不能、嚥下障害、びまん性食道痙攣、無効性食道運動、および高血圧性LESなどの、食道疾患を示す異常を観察、診断することができる。例えば、医師は、嚥下場面を通して整合性のある低ボーラス信号を介して、管腔掩蔽(例えば、狭窄などの構造的効果)を確実に識別することができる。 It should be understood that some aspects allow a physician to quickly and quantitatively predict the passage of contrast material through a body lumen. In the example of the user interface 800 (FIG. 8) where a barium swallow test is shown, the physician does not need to simply scroll through the time plot of the resulting data to take time to view each swallow as a video, A complete representation of bolus movement can be obtained. Doctors can observe and diagnose abnormalities indicative of esophageal disease, such as inability to relax, dysphagia, diffuse esophageal spasm, ineffective esophageal movement, and hypertensive LES. For example, a physician can reliably identify luminal occultation (eg, structural effects such as stenosis) via a consistent low bolus signal throughout the swallowing scene.
ボーラス位置情報をスクローリングすることは、それによって情報を見直すことのできる機構の一例にすぎないことを理解すべきである。上記のように、定量的な位置情報を等高線プロット上に表示することができ、嚥下検査またはその他の処置中のボーラス位置の定量的履歴を、単一の画像において見ることを可能にする。対照的に、従来式手法では、分析者は、嚥下のビデオを見て、自分の想像の中で、嚥下の顕著な特徴を組み合わせて、正常または病態の判定を行う必要があった。 It should be understood that scrolling bolus location information is only one example of a mechanism by which information can be reviewed. As described above, quantitative position information can be displayed on a contour plot, allowing a quantitative history of bolus positions during a swallow test or other procedure to be viewed in a single image. In contrast, conventional approaches required an analyst to watch a video of swallowing and, in his imagination, combine prominent features of swallowing to determine normal or pathological conditions.
ボーラス位置データが、圧力などの他の高解像度生理学データと組み合わされて共記載されると、物質の位置とその他の生理学的特性の分布との関係を容易に識別して、全般的および特に個別的な臨床事例における臓器の生理学および病態生理学に対する新しい洞察をもたらすことができる。
定量的な情報は、ある病態学においては、ランドマーク(例えば、UESおよびLES)を、他方のモダリティに対して一方のモダリティ(例えば、圧力または、蛍光透視法もしくはその他の放射線画像)において、より容易に識別可能とする。複数のタイプのデータを1つの画像に組み合わせることによって、最も好適なモダリティにおいてランドマークを識別することができ、その情報は、ランドマークが確実に識別できない可能性のあるモダリティの結果の解釈を助けることができる。
When bolus position data is co-descripted in combination with other high-resolution physiological data such as pressure, it can easily identify the relationship between the position of the substance and the distribution of other physiological properties, generally and individually. New insights into organ physiology and pathophysiology in clinical cases.
Quantitative information is more likely in some pathologies to show landmarks (eg UES and LES) in one modality (eg pressure or fluoroscopy or other radiographic images) relative to the other modality. It can be easily identified. By combining multiple types of data into one image, landmarks can be identified in the most preferred modality, and that information helps to interpret the results of modalities that may not be reliably identifiable. be able to.
方法100によって得られたボーラス位置データは、例えば、ボーラスの動きなどの、確実で定量的な指標を提供することを理解すべきである。これまでは、ボーラス測定法は、ボーラスの動きの定量的な測定のみを提供し、嚥下性能の判定において曖昧さを残していた。例えば、マルチチャネル腔内インピーダンス測定において、十分なボーラスが管腔を一掃したかどうか、ボーラスが管腔内に実質的に残留しているかどうか、または意味のある「ボーラスエスケープ」(すなわち、逆流(retrograde flow))が発生したかどうかについて、曖昧さが存在する。
本発明の少なくとも1つの態様のいくつかの側面について説明したが、様々な変更形態、修正形態、および改善形態を、当業者は容易に思いつくことを理解すべきである。例えば、表示情報は、位置合わせして組み合わせてもよい。
It should be understood that the bolus position data obtained by the
Having described several aspects of at least one embodiment of the present invention, it should be understood that various changes, modifications, and improvements will readily occur to those skilled in the art. For example, the display information may be combined after being aligned.
上述の側面は別々に使用してもよく、本発明者は、それでもそれらの側面が独自であると考えるものである。例えば、局所画像フィールドにおける変化から得られる強度測定値は、プロフィールプロットまたは時空間的等高線プロット以外の技法を用いて表示してもよい。同様に、局所画像フィールドは、事後に指定してもよく、その中で時間経過により測定された変化を用いて、時間経過における造影剤の動きを説明する時空間的データセットを生成してもよい。
本方法は、食道、およびGI管の外部以外のエリア全般にも適用することができる。例えば、可動材料がその中で画像化されて、ターゲット装置を導入することのできる、尿管、血管網、およびその他の内蔵系に使用してもよい。
The above aspects may be used separately and the inventor believes they are nevertheless unique. For example, intensity measurements obtained from changes in the local image field may be displayed using techniques other than profile plots or spatio-temporal contour plots. Similarly, the local image field may be specified after the fact, and the changes measured over time in it may be used to generate a spatio-temporal data set that describes the movement of the contrast agent over time. Good.
The method can also be applied to the esophagus and general areas other than the outside of the GI tract. For example, it may be used in ureters, vascular networks, and other built-in systems in which the movable material can be imaged to introduce the target device.
さらに、造影物質の位置についての定量的な情報が、放射線画像内のターゲット場所に基づくフィールドを構築することによって導出される態様について説明した。造影物質の画像を用いてフィールドを定義することを含めて、フィールドを構築するその他の手法も可能である。例えば、バリウム嚥下蛍光透視検査を見直し、分析者によって手動で、またはコンピュータ解析を使用して、ランドマークの放射線識別特徴(signature)(例えば、括約筋におけるバリウムボーラス画像の狭窄)を介して、管腔に沿ったランドマークを識別することができる。次いで、造影物質が管腔を通過するときの造影物質の経路を識別することによって、管腔画像の軸に沿って線または曲線を構築することもできる。複数の局所画像フィールドが、この線または曲線に沿って構築される。局所フィールドが構築されると、それらの局所フィールドにおける強度の変化は、放射線不透過性マーカーが導入される場合と同様に、測定することができる。 Furthermore, an aspect has been described in which quantitative information about the position of the contrast material is derived by constructing a field based on the target location in the radiographic image. Other techniques for constructing the field are possible, including defining the field using images of contrast material. For example, review barium swallowing fluoroscopy, manually by an analyst, or using computer analysis, via landmark radiation signatures (eg, stenosis of a barium bolus image in the sphincter), lumen Can be identified. A line or curve can then be constructed along the axis of the lumen image by identifying the path of the contrast material as it passes through the lumen. Multiple local image fields are built along this line or curve. Once the local fields are built, intensity changes in those local fields can be measured as if radiopaque markers were introduced.
そのような変更、修正、および改善は、本開示の一部として、本発明の趣旨と範囲の範囲に含めることを意図するものである。したがって、前述の説明および図面は、例示としてのみのものである。本発明の上述の態様は、多数の方法の内の任意のもので実現することができる。例えば、これらの態様は、ハードウエア、ソフトウエア、またはそれらの組合せを用いて実現して、生理学的データの表示を取得、生成してもよい。ソフトウエアで実現される場合には、ソフトウエアコードを、単一コンピュータに備えられるか、または複数のコンピュータ間に分散された、任意好適なプロセッサまたはプロセッサの集合上で実行することができる。 Such alterations, modifications, and improvements are intended to be included as part of this disclosure within the spirit and scope of the invention. Accordingly, the foregoing description and drawings are by way of example only. The above-described aspects of the invention can be implemented in any of a number of ways. For example, these aspects may be implemented using hardware, software, or a combination thereof to obtain and generate a display of physiological data. If implemented in software, the software code may be executed on any suitable processor or collection of processors, provided on a single computer or distributed among multiple computers.
さらに、コンピュータは、ラックマウントコンピュータ、デスクトップコンピュータ、ラップトップコンピュータ、またはタブレットコンピュータなどの、複数の形態の任意のものに具現化することができることを理解すべきである。さらに、コンピュータは、パーソナル・ディジタイル・アシスタンツ(PDA)、スマートフォン、またはその他の任意の可搬型または固定型の電子デバイスを含む、一般的にはコンピュータとは認められないが、適当な処理能力を備えるデバイスに内蔵してもよい。 Further, it should be understood that the computer can be embodied in any of a number of forms, such as a rack mount computer, a desktop computer, a laptop computer, or a tablet computer. In addition, computers are generally not recognized as computers, including personal digital tile assistants (PDAs), smart phones, or any other portable or stationary electronic device, but with adequate processing power. It may be built into the device.
また、コンピュータは、1つまたは2つ以上の入力装置および出力装置を備えてもよい。これらのデバイスは、とりわけ、ユーザーインターフェイスを提示するのに使用することができる。ユーザーインターフェイスを提供するのに使用できる出力装置の例としては、出力の視覚提示のためのプリンタ類または表示スクリーン類、および出力の聴覚提示のためのスピーカ類またはその他の音声生成装置が挙げられる。ユーザーインターフェイスに使用することのできる入力装置の例としては、キーボード、マウス、タッチパッド、およびディジタイジングタブレットなどのポインティング装置が挙げられる。別の例として、コンピュータは、音声認識によるか、またはその他の聴覚フォーマットで入力を受け取ってもよい。 The computer may also include one or more input devices and output devices. These devices can be used, among other things, to present a user interface. Examples of output devices that can be used to provide a user interface include printers or display screens for visual presentation of output, and speakers or other sound generation devices for auditory presentation of output. Examples of input devices that can be used for the user interface include pointing devices such as keyboards, mice, touchpads, and digitizing tablets. As another example, a computer may receive input by speech recognition or in other auditory formats.
そのようなコンピュータは、ローカルエリアネットワーク、またはエンタープライズネットワークやインターネットなどのワイドエリアネットワークを含む、1または2以上のネットワークで任意好適な形態に相互接続してもよい。そのようなネットワークは、任意好適なテクノロジに基づいてもよく、任意好適なプロトコルに従って動作し、無線ネットワーク、有線ネットワーク、または光ファイバネットワークを含んでもよい。
また、本明細書で概説した様々な方法および処理は、様々なオペレーティングシステムまたはプラットフォームの任意のものを利用する、1または2以上のプロセッサ上で実行可能なソフトウエアとしてコード化してもよい。さらに、そのようなソフトウエアは、複数の好適なプログラミング言語および/またはプログラミングもしくはスクリプト記述ツールのいずれかを使用して書いてもよく、また実行可能なマシン言語コード、あるいはフレームワーク上または仮想マシン上で実行される中間コードとして、コンパイルしてもよい。
Such computers may be interconnected in any suitable form with one or more networks, including a local area network or a wide area network such as an enterprise network or the Internet. Such networks may be based on any suitable technology, operate according to any suitable protocol, and may include wireless networks, wired networks, or fiber optic networks.
Also, the various methods and processes outlined herein may be encoded as software executable on one or more processors utilizing any of a variety of operating systems or platforms. Further, such software may be written using any of a number of suitable programming languages and / or programming or scripting tools, and executable machine language code or framework or virtual machine You may compile as the intermediate code executed above.
この点で、本発明は、1または2以上のコンピュータまたはその他のプロセッサで実行されると、上記に考察した本発明の様々な態様を実現する方法を実施する、1または2以上のプログラムでコード化された、コンピュータ可読媒体(または複数のコンピュータ可読媒体)(例えば、コンピュータメモリ、1または2以上のフロッピー(登録商標)ディスク、コンパクトディスク、光ディスク、磁気テープ、フラッシュメモリ、書換え可能ゲートアレイ(FPGA)またはその他の半導体デバイスにおける回路構成、またはその他の具体的なコンピュータ記憶媒体)として具現化することもできる。コンピュータ可読媒体(単数または複数)は、それに記憶されたプログラム(単数または複数)が、1または2以上の異なるコンピュータ、またはその他のプロセッサにロードして、上述したような本発明の様々な側面を実現できるように、可搬式とすることができる In this regard, the present invention is code executed by one or more programs that, when executed on one or more computers or other processors, implement the methods of implementing the various aspects of the present invention discussed above. Computer readable medium (or computer readable media) (eg, computer memory, one or more floppy disks, compact disk, optical disk, magnetic tape, flash memory, rewritable gate array (FPGA)) ) Or other semiconductor device circuit configuration, or other specific computer storage medium). The computer readable medium (s) may be loaded with the program (s) stored thereon on one or more different computers or other processors to implement the various aspects of the invention as described above. Can be portable so that it can be realized
「プログラム」または「ソフトウエア」の用語は、本明細書においては、総称的な意味で、コンピュータまたはその他のプロセッサをプログラムして上記した本発明の様々な側面を実現するのに使用することのできる、任意の種類のコンピュータコードまたはコンピュータ実行可能な命令のセットを意味して使用される。さらに、本態様の一側面によれば、実行されると本発明の方法を実施する、1または2以上のコンピュータプログラムは、単一のコンピュータまたはプロセッサ上に常駐する必要はなく、モジュール方式で複数の異なるコンピュータまたはプロセッサ間に分散して本発明の様々な側面を実現してもよいことを理解すべきである。 The terms “program” or “software” are used herein in a generic sense to be used to program a computer or other processor to implement the various aspects of the invention described above. Can be used to mean any type of computer code or set of computer-executable instructions that can. Furthermore, according to one aspect of the present embodiment, one or more computer programs that, when executed, perform the method of the present invention need not reside on a single computer or processor, but can be modularized. It should be understood that various aspects of the invention may be implemented in a distributed manner among different computers or processors.
コンピュータ実行可能命令は、1または2以上のコンピュータまたはその他のデバイスによって実行される、プログラムモジュールなどの多数の形態とすることができる。一般に、プログラムモジュールには、特定のタスクを実施するか、または特定の抽象データ型を実現する特定のルーチン、プログラム、オブジェクト、コンポーネント、データ構造、その他が含まれる。通常、プログラムモジュールの機能は、様々な態様において望まれるように、結合または分散させることができる。 Computer-executable instructions may take many forms, such as program modules, executed by one or more computers or other devices. Generally, program modules include specific routines, programs, objects, components, data structures, etc. that perform particular tasks or implement particular abstract data types. In general, the functionality of program modules may be combined or distributed as desired in various aspects.
また、データ構造は、コンピュータ可読媒体に任意好適な形態で記憶してもよい。説明を簡単にするために、データ構造を、データ構造における場所を通して関係づけられるフィールドを有して示してもよい。このような関係は、同様にして、フィールド間の関係を伝達するコンピュータ可読媒体における場所を有するフィールドに対して記憶を割り当てることによって達成してもよい。しかしながら、ポインター、タグ、またはデータ要素間の関係を設定するその他の機構を含む、任意好適な機構を使用して、ダータ構造のフィールドにおける情報間の関係を設定してもよい。 The data structure may also be stored in any suitable form on a computer readable medium. For ease of explanation, the data structure may be shown with fields related through locations in the data structure. Such a relationship may similarly be achieved by assigning storage to a field having a location in a computer readable medium that conveys the relationship between the fields. However, any suitable mechanism may be used, including pointers, tags, or other mechanisms for setting relationships between data elements, to set relationships between information in the data structure fields.
本発明の様々な側面は、単独で、組合せて、または前記で説明した態様において具体的に考察されていない様々な配設で使用してもよく、したがって、その応用において前述の説明に記載するか、または図面に図解した構成要素の詳細および配設に限定されるものではない。例えば、一態様において記述された側面は、その他の態様において記述された側面と任意の方法で組み合わせてもよい。
また、本発明は方法として具現化してもよく、その一例を提示した。この方法の一部として実行される行為は、任意好適な方法で順序づけることができる。したがって、例証的態様においては連続行為として示されているが、例証されたものと異なる順序で行為が実行される態様や、いくつかの行為を同時に実施することを含む態様を構築してもよい。
Various aspects of the present invention may be used alone, in combination, or in a variety of arrangements not specifically discussed in the embodiments described above, and thus are described in the foregoing description in that application. It is not intended to be limited to the details and arrangement of the components illustrated in the drawings. For example, the aspects described in one embodiment may be combined in any manner with the aspects described in other embodiments.
Further, the present invention may be embodied as a method, and an example thereof is presented. The actions performed as part of this method can be ordered in any suitable way. Thus, although illustrated in the illustrative aspect as being a continuous action, aspects may be constructed in which actions are performed in a different order than that illustrated, or aspects that include performing several actions simultaneously. .
クレームにおいてクレーム要素を修飾するために「第1」、「第2」、および「第3」などの順序用語を使用することは、それ自体で、いかなる優先、選好、または別のクレーム要素に対する1つのクレーム要素の順序や、方法の行為が実行される時間的な順序を暗示するものではなく、単に、ある名称を有する1つのクレーム要素を同じ名称を有する別の要素と区別するためのラベルとして、それらのクレーム要素を区別するために使用される。
また、本明細書において使用する述語および用語は、説明の目的のものであり、限定としてみなすべきではない。本明細書において、「including(含む)」、「comprising(含む)」、または「having(有する)」、「containing(包含する)」、「involving(伴う)」、およびそれらの変形を使用するときは、その後に列挙された項目およびそれらの均等物に加えて追加の項目を包含することを意味するものである。
The use of order terms such as “first”, “second”, and “third” to qualify a claim element in a claim by itself is one priority over any preference, preference, or another claim element. It does not imply the order of one claim element or the time order in which the actions of the method are performed, but merely as a label to distinguish one claim element with one name from another with the same name. , Used to distinguish those claim elements.
Also, the predicates and terms used herein are for the purpose of explanation and should not be regarded as limiting. As used herein, when using "including", "comprising", or "having", "containing", "involving", and variations thereof Is intended to include additional items in addition to the items listed thereafter and their equivalents.
Claims (11)
以下のとおり構成された計算装置:
放射線画像化システムから複数の放射線画像を受け取り、ここで該複数の画像の各々は、放射線不透過性ターゲットおよび放射性造影物質を包含する領域を画像化し、および各放射線不透過性ターゲットと放射線画像における1つの場所が関連付けされており、
各放射線画像に対し、少なくとも放射線不透過性ターゲットの位置により定義される経路に沿った複数の局所画像フィールドを定義し、各局所画像フィールドは経路に沿ったセグメントを表し、
各放射線画像に対し前記経路に沿った位置に対する前記局所画像フィールド内の放射線画像の少なくとも強度から前記画像における各局所画像フィールドに対する値を計算し、前記値は局所画像フィールドにより表される経路に沿ったセグメントにおける放射性造影物質の量を表す;および
各放射線画像に対して、経路に沿った前記局所画像フィールドの位置の関数として、前記局所画像フィールドに対する前記値を表示するように構成された表示装置
を含む、前記システム。 A system for collecting diagnostic data,
A computing device configured as follows:
From the radiation imaging system will receive a plurality of radiation images, wherein each of the plurality of image regions include radiopaque targets and radioactive contrast material to image the and the radiopaque target and the radiation image one place in have been associated with,
For each radiographic image, define a plurality of local image fields along a path defined by at least the location of the radiopaque target, each local image field representing a segment along the path;
A value for each local image field in the image from at least the intensity of the radiation image in the local image field calculated against the position along the path for each radiation image, the values along a path represented by the local image fields Represents the amount of radiocontrast material in each segment ; and
For each radiographic image, as a function of the position of the local image fields along the path, the display device configured To display so the previous SL value for the local image fields
Including the system.
計算装置が、放射線画像から前記ベースライン画像を差し引くようにさらに構成されている、請求項1に記載のシステム。 The radiological imaging system is further configured to acquire a baseline image, the baseline image representing an area free of radioactive contrast material;
The system of claim 1, wherein the computing device is further configured to subtract the baseline image from a radiographic image.
複数の放射線画像の中の1つの放射画像について、各値を、経路に沿ったそれぞれの位置についての局所画像フィールドにおける放射線画像の強度から、各々のベースライン値を差し引くことによって計算する、請求項2に記載のシステム。 The computing device is further configured to calculate a plurality of baseline values, each baseline value being an intensity of the baseline image in the local image field for a respective position along the path;
For one radiation image in the plurality of radiographic images, each value from the intensity of the radiation image in the local image fields for each position along the path is calculated by subtracting the baseline values of each, wherein Item 3. The system according to Item 2.
計算装置が、各放射線画像に対する値を実時間で計算するように構成され、
表示装置が、実時間で、複数の値を表示するようにさらに構成されている、請求項1に記載のシステム。 Multiple radiographic images are input sequentially;
Computing device is configured values against each ray image to calculate in real time,
The system of claim 1, wherein the display device is further configured to display a plurality of values in real time.
ここで、各放射線画像について、前記対応する値の各々が、位置軸上の座標を有する経路に沿った対応する位置で、かつ放射線画像が取得された時点に対応する時間軸上の座標を有する時間においてプロットされる、請求項1に記載のシステム。 Display device, for each radiation image, a the corresponding value, is further configured to display on the spatiotemporal plot including the position axis and a time axis,
Here, each of the radiation images, each of said corresponding to that value, at corresponding positions along a path having a coordinate on the position axis, and the coordinates on the time axis corresponding to the time the radiation image is acquired The system of claim 1, plotted in time having .
該複数の圧力センサーの各々が経路に沿った位置を割り当てられ、および割り当てられる位置における圧力を感知するように設計されており、および
表示装置が、複数の値の表示と空時間的に共記載された圧力を表示するように設計されている、請求項1に記載のシステム。 The catheter further comprising a plurality of pressure sensors incorporated along the length of the catheter;
Each of the plurality of pressure sensors is assigned a position along the path and is designed to sense pressure at the assigned position ; and
Viewing device is designed to display the display and an empty time-pressure co-described multiple values, according to claim 1 system.
Applications Claiming Priority (3)
| Application Number | Priority Date | Filing Date | Title |
|---|---|---|---|
| US99852607P | 2007-10-11 | 2007-10-11 | |
| US60/998,526 | 2007-10-11 | ||
| PCT/US2008/011666 WO2009048617A2 (en) | 2007-10-11 | 2008-10-10 | Method of measuring and displaying the position of a radiographically contrasted material within luminal body organs |
Related Child Applications (1)
| Application Number | Title | Priority Date | Filing Date |
|---|---|---|---|
| JP2014064054A Division JP5832573B2 (en) | 2007-10-11 | 2014-03-26 | Method for measuring and displaying the location of radiologically contrasted material inside a luminal organ |
Publications (3)
| Publication Number | Publication Date |
|---|---|
| JP2011500147A JP2011500147A (en) | 2011-01-06 |
| JP2011500147A5 JP2011500147A5 (en) | 2011-11-24 |
| JP5513394B2 true JP5513394B2 (en) | 2014-06-04 |
Family
ID=40549782
Family Applications (2)
| Application Number | Title | Priority Date | Filing Date |
|---|---|---|---|
| JP2010528898A Active JP5513394B2 (en) | 2007-10-11 | 2008-10-10 | System for measuring and displaying the location of radiologically contrasted material inside a luminal organ |
| JP2014064054A Active JP5832573B2 (en) | 2007-10-11 | 2014-03-26 | Method for measuring and displaying the location of radiologically contrasted material inside a luminal organ |
Family Applications After (1)
| Application Number | Title | Priority Date | Filing Date |
|---|---|---|---|
| JP2014064054A Active JP5832573B2 (en) | 2007-10-11 | 2014-03-26 | Method for measuring and displaying the location of radiologically contrasted material inside a luminal organ |
Country Status (6)
| Country | Link |
|---|---|
| US (1) | US8306604B2 (en) |
| EP (1) | EP2207481B1 (en) |
| JP (2) | JP5513394B2 (en) |
| CN (1) | CN101868182B (en) |
| CA (1) | CA2702347A1 (en) |
| WO (1) | WO2009048617A2 (en) |
Families Citing this family (20)
| Publication number | Priority date | Publication date | Assignee | Title |
|---|---|---|---|---|
| KR100954989B1 (en) * | 2006-10-18 | 2010-04-30 | 주식회사 메디슨 | Ultrasound diagnostic apparatus and method for measuring size of target object |
| US8306290B2 (en) * | 2007-04-20 | 2012-11-06 | Sierra Scientific Instruments, Llc | Diagnostic system for display of high-resolution physiological data of multiple properties |
| JP5561578B2 (en) * | 2009-08-03 | 2014-07-30 | 国立大学法人名古屋大学 | Medical image observation support device |
| EP2544589A2 (en) | 2010-03-12 | 2013-01-16 | Wellsense Technologies Ltd | System and method for rapid data collection from pressure sensors in a pressure sensing system |
| CA2827897A1 (en) * | 2011-02-24 | 2012-08-30 | Enhanced Surface Dynamics, Inc. | Pressure monitoring system and method |
| JP2014521082A (en) | 2011-07-13 | 2014-08-25 | エンハンスド サーフェイス ダイナミクス,インコーポレイテッド | Method and system for manufacturing and initializing pressure sensing mat |
| EP2830485B1 (en) * | 2012-03-27 | 2021-03-10 | Koninklijke Philips N.V. | Integration delayed optical feedback in image guidance |
| EP2846688A4 (en) * | 2012-05-08 | 2015-09-23 | Angiometrix Corp | Systems for linear mapping of lumens |
| WO2013190557A2 (en) * | 2012-06-21 | 2013-12-27 | Given Imaging Ltd. | System and method for spatiotemporally synchronizing and displaying bodily organ images and physiological parameter(s) related thereto |
| JP6308728B2 (en) * | 2013-06-18 | 2018-04-11 | キヤノン株式会社 | Radiographic system and method of operating radiographic system |
| DE102013214388B4 (en) * | 2013-07-23 | 2023-04-20 | Siemens Healthcare Gmbh | Medical instrument for use with a phase contrast imaging and X-ray imaging system with phase contrast imaging |
| WO2015107963A1 (en) * | 2014-01-15 | 2015-07-23 | 株式会社 日立メディコ | X-ray ct device and contrast imaging method |
| JP5889495B2 (en) * | 2014-02-14 | 2016-03-22 | オリンパス株式会社 | Endoscope system |
| US9767559B1 (en) * | 2014-03-27 | 2017-09-19 | Given Imaging Ltd. | System and method for reconstructing sensor locations in radiographic images |
| US11083418B2 (en) | 2016-11-04 | 2021-08-10 | Wellsense, Inc. | Patient visualization system |
| US10492734B2 (en) | 2016-11-04 | 2019-12-03 | Wellsense, Inc. | Patient visualization system |
| US11730395B2 (en) | 2017-01-12 | 2023-08-22 | Navix International Limited | Reconstruction of an anatomical structure from intrabody measurements |
| CN111050641B (en) * | 2017-08-17 | 2023-06-09 | 纳维斯国际有限公司 | Remote imaging based on field gradients |
| WO2020087000A1 (en) * | 2018-10-26 | 2020-04-30 | Adventist Health System/Sunbelt, Inc. | Intravascular ultrasound catheter systems |
| US11707242B2 (en) * | 2019-01-11 | 2023-07-25 | Pie Medical Imaging B.V. | Methods and systems for dynamic coronary roadmapping |
Family Cites Families (44)
| Publication number | Priority date | Publication date | Assignee | Title |
|---|---|---|---|---|
| US3608061A (en) * | 1968-08-21 | 1971-09-21 | Edmund F Mcnally | Radiopaque esophageal marshmallow bolus |
| US4850351A (en) * | 1985-05-22 | 1989-07-25 | C. R. Bard, Inc. | Wire guided laser catheter |
| US5045071A (en) * | 1985-12-17 | 1991-09-03 | Mbo Laboratories, Inc. | Double wall catheter with internal printing and embedded marker |
| US4930510A (en) * | 1986-11-24 | 1990-06-05 | Picker International, Inc. | Parameterization for CT blood flow mapping with xenon gas enhancement |
| JPH02136126A (en) * | 1988-11-17 | 1990-05-24 | Kobayashi Pharmaceut Co Ltd | Catheter for stomach and esophagus |
| US5024240A (en) * | 1989-01-03 | 1991-06-18 | Mcconnel Fred M S | Manofluorography system, method for forming a manofluorogram and method for preparing a swallowing profile |
| US5150292A (en) * | 1989-10-27 | 1992-09-22 | Arch Development Corporation | Method and system for determination of instantaneous and average blood flow rates from digital angiograms |
| US5209730A (en) * | 1989-12-19 | 1993-05-11 | Scimed Life Systems, Inc. | Method for placement of a balloon dilatation catheter across a stenosis and apparatus therefor |
| EP0581866B1 (en) * | 1991-04-24 | 1998-03-04 | Baxter International Inc. | Exchangeable integrated-wire balloon catheter |
| US5239982A (en) * | 1991-06-07 | 1993-08-31 | Baxter International Inc. | Catheter depth gauge and method of use |
| US5263928A (en) * | 1991-06-14 | 1993-11-23 | Baxter International Inc. | Catheter and endoscope assembly and method of use |
| US5419324A (en) * | 1993-11-24 | 1995-05-30 | Endovascular Technologies, Inc. | Radiological marker board with movable indicators |
| US5411016A (en) * | 1994-02-22 | 1995-05-02 | Scimed Life Systems, Inc. | Intravascular balloon catheter for use in combination with an angioscope |
| US5606981A (en) * | 1994-03-11 | 1997-03-04 | C. R. Bard, Inc. | Catheter guidewire with radiopaque markers |
| US5571093A (en) * | 1994-09-21 | 1996-11-05 | Cruz; Cosme | Multiple-lumen catheter |
| EP0723786A1 (en) * | 1995-01-30 | 1996-07-31 | Cardiovascular Concepts, Inc. | Lesion measurement catheter and method |
| US5678563A (en) * | 1995-11-16 | 1997-10-21 | Addington; W. Robert | Aspiration screening process for assessing need for modified barium swallow study |
| US5968068A (en) * | 1996-09-12 | 1999-10-19 | Baxter International Inc. | Endovascular delivery system |
| US5921971A (en) * | 1996-09-13 | 1999-07-13 | Boston Scientific Corporation | Single operator exchange biliary catheter |
| US6036682A (en) * | 1997-12-02 | 2000-03-14 | Scimed Life Systems, Inc. | Catheter having a plurality of integral radiopaque bands |
| US6796976B1 (en) * | 1998-03-06 | 2004-09-28 | Scimed Life Systems, Inc. | Establishing access to the body |
| US6210338B1 (en) * | 1998-08-21 | 2001-04-03 | Aga Medical Corp. | Sizing catheter for measuring cardiovascular structures |
| US6278767B1 (en) * | 1999-04-28 | 2001-08-21 | General Electric Company | Methods for measuring curved distances on 3D and MIP images |
| US8442618B2 (en) * | 1999-05-18 | 2013-05-14 | Mediguide Ltd. | Method and system for delivering a medical device to a selected position within a lumen |
| US6233476B1 (en) * | 1999-05-18 | 2001-05-15 | Mediguide Ltd. | Medical positioning system |
| US7778688B2 (en) * | 1999-05-18 | 2010-08-17 | MediGuide, Ltd. | System and method for delivering a stent to a selected position within a lumen |
| US6540774B1 (en) * | 1999-08-31 | 2003-04-01 | Advanced Cardiovascular Systems, Inc. | Stent design with end rings having enhanced strength and radiopacity |
| JP2001149360A (en) * | 1999-11-25 | 2001-06-05 | Toshiba Corp | X-ray diagnostic system |
| US6856827B2 (en) * | 2000-04-28 | 2005-02-15 | Ge Medical Systems Global Technology Company, Llc | Fluoroscopic tracking and visualization system |
| US7228165B1 (en) * | 2000-06-26 | 2007-06-05 | Boston Scientific Scimed, Inc. | Apparatus and method for performing a tissue resection procedure |
| US20020115931A1 (en) * | 2001-02-21 | 2002-08-22 | Strauss H. William | Localizing intravascular lesions on anatomic images |
| US20030088195A1 (en) * | 2001-11-02 | 2003-05-08 | Vardi Gil M | Guidewire having measurement indicia |
| US7056319B2 (en) * | 2001-12-04 | 2006-06-06 | Wilson-Cook Medical, Inc. | Sphincterotome and manometry catheter |
| CA2485490A1 (en) * | 2002-05-17 | 2003-11-27 | Vincent B. Ho | Respiratory referenced imaging |
| US7004176B2 (en) * | 2003-10-17 | 2006-02-28 | Edwards Lifesciences Ag | Heart valve leaflet locator |
| US7553323B1 (en) * | 2004-01-08 | 2009-06-30 | Perez Juan I | Steerable endovascular graft delivery system |
| JP2005291945A (en) * | 2004-03-31 | 2005-10-20 | Masaki Esashi | Sensor device |
| US20060190024A1 (en) * | 2005-02-24 | 2006-08-24 | Bei Nianjiong | Recovery catheter apparatus and method |
| CN102225023B (en) * | 2005-07-21 | 2014-04-02 | 泰科医疗集团有限合伙公司 | Systems and methods for treating a hollow anatomical structure |
| JP2007044418A (en) * | 2005-08-12 | 2007-02-22 | Hitachi Medical Corp | Diagnostic imaging method, diagnostic imaging apparatus, and diagnostic imaging program |
| US7970187B2 (en) * | 2005-09-06 | 2011-06-28 | Pie Medical Imaging B.V. | Method, apparatus and computer program for contour detection of vessels using x-ray densitometry |
| DE102006055167A1 (en) * | 2005-12-23 | 2007-07-05 | Siemens Ag | X-ray device operating method for examining e.g. heart, of patient, involves determining contrast medium curve based on attenuation value detected at each scanning on patient at predefined scanning time points, and storing curve |
| US8273016B2 (en) * | 2006-03-10 | 2012-09-25 | Biosense Webster, Inc. | Esophagus isolation device |
| US20080097249A1 (en) * | 2006-10-20 | 2008-04-24 | Ellipse Technologies, Inc. | External sensing system for gastric restriction devices |
-
2008
- 2008-10-10 US US12/249,805 patent/US8306604B2/en active Active
- 2008-10-10 JP JP2010528898A patent/JP5513394B2/en active Active
- 2008-10-10 CA CA2702347A patent/CA2702347A1/en not_active Abandoned
- 2008-10-10 CN CN2008801176634A patent/CN101868182B/en active Active
- 2008-10-10 WO PCT/US2008/011666 patent/WO2009048617A2/en active Application Filing
- 2008-10-10 EP EP08837148.9A patent/EP2207481B1/en active Active
-
2014
- 2014-03-26 JP JP2014064054A patent/JP5832573B2/en active Active
Also Published As
| Publication number | Publication date |
|---|---|
| EP2207481A2 (en) | 2010-07-21 |
| EP2207481A4 (en) | 2011-05-11 |
| CA2702347A1 (en) | 2009-04-16 |
| JP5832573B2 (en) | 2015-12-16 |
| JP2014158932A (en) | 2014-09-04 |
| CN101868182A (en) | 2010-10-20 |
| WO2009048617A2 (en) | 2009-04-16 |
| CN101868182B (en) | 2012-12-05 |
| US8306604B2 (en) | 2012-11-06 |
| WO2009048617A9 (en) | 2009-07-16 |
| JP2011500147A (en) | 2011-01-06 |
| US20090257554A1 (en) | 2009-10-15 |
| EP2207481B1 (en) | 2017-11-29 |
| WO2009048617A3 (en) | 2009-06-04 |
Similar Documents
| Publication | Publication Date | Title |
|---|---|---|
| JP5832573B2 (en) | Method for measuring and displaying the location of radiologically contrasted material inside a luminal organ | |
| US11302002B2 (en) | Systems, methods, and devices for medical image analysis, diagnosis, risk stratification, decision making and/or disease tracking | |
| EP3403582B1 (en) | Method and apparatus for determining blood velocity in x-ray angiography images | |
| JP6789944B2 (en) | Interactive cardiac test data and related devices, systems, and methods | |
| JP6215236B2 (en) | System and method for displaying motility events in an in-vivo image stream | |
| JP2015509026A5 (en) | ||
| CN106489152A (en) | Graphical analysis in the case of it there is medical supply | |
| JP7073661B2 (en) | Dynamic analysis device and dynamic analysis system | |
| Panyarak et al. | Feasibility of deep learning for dental caries classification in bitewing radiographs based on the ICCMS™ radiographic scoring system | |
| Suwa et al. | Analyzing the eye movement of dentists during their reading of CT images | |
| Cheng et al. | Computer-assisted system on mandibular canal detection | |
| Alexopoulos et al. | In the search of coronary calcium | |
| Pervez | CHARACTERIZATION OF CYCLIC MOTOR PATTERNS AND HAUSTRAL ACTIVITIES IN THE HUMAN COLON BY HIGH-RESOLUTION MANOMETRY | |
| Jell et al. | Cinemanography: fusing manometric and cinematographic data to facilitate diagnostics of dysphagia |
Legal Events
| Date | Code | Title | Description |
|---|---|---|---|
| A521 | Request for written amendment filed |
Free format text: JAPANESE INTERMEDIATE CODE: A523 Effective date: 20111007 |
|
| A621 | Written request for application examination |
Free format text: JAPANESE INTERMEDIATE CODE: A621 Effective date: 20111007 |
|
| A131 | Notification of reasons for refusal |
Free format text: JAPANESE INTERMEDIATE CODE: A131 Effective date: 20130205 |
|
| A601 | Written request for extension of time |
Free format text: JAPANESE INTERMEDIATE CODE: A601 Effective date: 20130507 |
|
| A602 | Written permission of extension of time |
Free format text: JAPANESE INTERMEDIATE CODE: A602 Effective date: 20130514 |
|
| A601 | Written request for extension of time |
Free format text: JAPANESE INTERMEDIATE CODE: A601 Effective date: 20130605 |
|
| A602 | Written permission of extension of time |
Free format text: JAPANESE INTERMEDIATE CODE: A602 Effective date: 20130612 |
|
| A521 | Request for written amendment filed |
Free format text: JAPANESE INTERMEDIATE CODE: A523 Effective date: 20130705 |
|
| A131 | Notification of reasons for refusal |
Free format text: JAPANESE INTERMEDIATE CODE: A131 Effective date: 20131001 |
|
| A521 | Request for written amendment filed |
Free format text: JAPANESE INTERMEDIATE CODE: A523 Effective date: 20131227 |
|
| TRDD | Decision of grant or rejection written | ||
| A01 | Written decision to grant a patent or to grant a registration (utility model) |
Free format text: JAPANESE INTERMEDIATE CODE: A01 Effective date: 20140225 |
|
| A61 | First payment of annual fees (during grant procedure) |
Free format text: JAPANESE INTERMEDIATE CODE: A61 Effective date: 20140327 |
|
| R150 | Certificate of patent or registration of utility model |
Ref document number: 5513394 Country of ref document: JP Free format text: JAPANESE INTERMEDIATE CODE: R150 |
|
| R250 | Receipt of annual fees |
Free format text: JAPANESE INTERMEDIATE CODE: R250 |
|
| R250 | Receipt of annual fees |
Free format text: JAPANESE INTERMEDIATE CODE: R250 |
|
| R250 | Receipt of annual fees |
Free format text: JAPANESE INTERMEDIATE CODE: R250 |
|
| R250 | Receipt of annual fees |
Free format text: JAPANESE INTERMEDIATE CODE: R250 |
|
| R250 | Receipt of annual fees |
Free format text: JAPANESE INTERMEDIATE CODE: R250 |
|
| R250 | Receipt of annual fees |
Free format text: JAPANESE INTERMEDIATE CODE: R250 |
|
| R250 | Receipt of annual fees |
Free format text: JAPANESE INTERMEDIATE CODE: R250 |
|
| R250 | Receipt of annual fees |
Free format text: JAPANESE INTERMEDIATE CODE: R250 |