JP5487212B2 - Image processing method, computer system, and computer program - Google Patents
Image processing method, computer system, and computer program Download PDFInfo
- Publication number
- JP5487212B2 JP5487212B2 JP2011539498A JP2011539498A JP5487212B2 JP 5487212 B2 JP5487212 B2 JP 5487212B2 JP 2011539498 A JP2011539498 A JP 2011539498A JP 2011539498 A JP2011539498 A JP 2011539498A JP 5487212 B2 JP5487212 B2 JP 5487212B2
- Authority
- JP
- Japan
- Prior art keywords
- image
- token
- pixel
- constraint
- pixels
- Prior art date
- Legal status (The legal status is an assumption and is not a legal conclusion. Google has not performed a legal analysis and makes no representation as to the accuracy of the status listed.)
- Active
Links
- 238000004590 computer program Methods 0.000 title claims 2
- 238000003672 processing method Methods 0.000 title claims 2
- 239000000463 material Substances 0.000 claims description 152
- 238000005286 illumination Methods 0.000 claims description 105
- 238000000034 method Methods 0.000 claims description 90
- 230000003595 spectral effect Effects 0.000 claims description 61
- 230000006870 function Effects 0.000 claims description 51
- 238000000926 separation method Methods 0.000 claims description 26
- 238000001228 spectrum Methods 0.000 claims description 26
- 238000012545 processing Methods 0.000 claims description 22
- 230000014509 gene expression Effects 0.000 claims description 13
- 230000009977 dual effect Effects 0.000 claims description 2
- 230000008859 change Effects 0.000 description 52
- 238000012360 testing method Methods 0.000 description 46
- 230000000875 corresponding effect Effects 0.000 description 45
- 239000000126 substance Substances 0.000 description 42
- 239000011159 matrix material Substances 0.000 description 29
- 239000013598 vector Substances 0.000 description 28
- 238000004458 analytical method Methods 0.000 description 25
- 230000004044 response Effects 0.000 description 25
- 238000005192 partition Methods 0.000 description 22
- 238000004422 calculation algorithm Methods 0.000 description 21
- 238000010586 diagram Methods 0.000 description 19
- 230000008569 process Effects 0.000 description 19
- 238000005457 optimization Methods 0.000 description 16
- 239000000523 sample Substances 0.000 description 11
- 210000003739 neck Anatomy 0.000 description 10
- 244000025254 Cannabis sativa Species 0.000 description 6
- 230000002093 peripheral effect Effects 0.000 description 6
- 238000011156 evaluation Methods 0.000 description 5
- 230000003993 interaction Effects 0.000 description 5
- 238000005259 measurement Methods 0.000 description 5
- 238000012805 post-processing Methods 0.000 description 5
- 238000013459 approach Methods 0.000 description 4
- 230000003190 augmentative effect Effects 0.000 description 4
- 238000004364 calculation method Methods 0.000 description 4
- 238000006243 chemical reaction Methods 0.000 description 4
- 239000003086 colorant Substances 0.000 description 4
- 238000000605 extraction Methods 0.000 description 4
- 238000007781 pre-processing Methods 0.000 description 4
- 230000003416 augmentation Effects 0.000 description 3
- 238000005516 engineering process Methods 0.000 description 3
- 238000003384 imaging method Methods 0.000 description 3
- 238000001454 recorded image Methods 0.000 description 3
- 238000002310 reflectometry Methods 0.000 description 3
- 230000007704 transition Effects 0.000 description 3
- 108010063499 Sigma Factor Proteins 0.000 description 2
- 230000006978 adaptation Effects 0.000 description 2
- 230000000295 complement effect Effects 0.000 description 2
- 238000000354 decomposition reaction Methods 0.000 description 2
- 238000011161 development Methods 0.000 description 2
- 230000018109 developmental process Effects 0.000 description 2
- 230000004069 differentiation Effects 0.000 description 2
- 230000000694 effects Effects 0.000 description 2
- 238000001914 filtration Methods 0.000 description 2
- 238000010191 image analysis Methods 0.000 description 2
- 238000007689 inspection Methods 0.000 description 2
- 238000012423 maintenance Methods 0.000 description 2
- 238000007620 mathematical function Methods 0.000 description 2
- 238000007639 printing Methods 0.000 description 2
- 230000009467 reduction Effects 0.000 description 2
- 238000005316 response function Methods 0.000 description 2
- 238000010183 spectrum analysis Methods 0.000 description 2
- 238000012706 support-vector machine Methods 0.000 description 2
- 230000009466 transformation Effects 0.000 description 2
- 230000017260 vegetative to reproductive phase transition of meristem Effects 0.000 description 2
- 230000000007 visual effect Effects 0.000 description 2
- 241000283070 Equus zebra Species 0.000 description 1
- 241000220317 Rosa Species 0.000 description 1
- 230000009471 action Effects 0.000 description 1
- 230000004075 alteration Effects 0.000 description 1
- 238000003491 array Methods 0.000 description 1
- 238000013528 artificial neural network Methods 0.000 description 1
- 230000008901 benefit Effects 0.000 description 1
- 238000012512 characterization method Methods 0.000 description 1
- 238000000701 chemical imaging Methods 0.000 description 1
- 239000003795 chemical substances by application Substances 0.000 description 1
- 239000003245 coal Substances 0.000 description 1
- 230000001427 coherent effect Effects 0.000 description 1
- 230000000052 comparative effect Effects 0.000 description 1
- 239000012141 concentrate Substances 0.000 description 1
- 238000010276 construction Methods 0.000 description 1
- 230000001276 controlling effect Effects 0.000 description 1
- 230000002596 correlated effect Effects 0.000 description 1
- 230000008878 coupling Effects 0.000 description 1
- 238000010168 coupling process Methods 0.000 description 1
- 238000005859 coupling reaction Methods 0.000 description 1
- 238000003066 decision tree Methods 0.000 description 1
- 238000003708 edge detection Methods 0.000 description 1
- 230000005684 electric field Effects 0.000 description 1
- 230000005669 field effect Effects 0.000 description 1
- 230000004907 flux Effects 0.000 description 1
- 238000013467 fragmentation Methods 0.000 description 1
- 238000006062 fragmentation reaction Methods 0.000 description 1
- 238000009499 grossing Methods 0.000 description 1
- 230000006872 improvement Effects 0.000 description 1
- 230000000977 initiatory effect Effects 0.000 description 1
- 230000002452 interceptive effect Effects 0.000 description 1
- 238000003064 k means clustering Methods 0.000 description 1
- 238000002372 labelling Methods 0.000 description 1
- 239000000203 mixture Substances 0.000 description 1
- 238000012986 modification Methods 0.000 description 1
- 230000004048 modification Effects 0.000 description 1
- 238000010606 normalization Methods 0.000 description 1
- 230000003287 optical effect Effects 0.000 description 1
- 238000003909 pattern recognition Methods 0.000 description 1
- 230000003252 repetitive effect Effects 0.000 description 1
- 239000004576 sand Substances 0.000 description 1
- 230000011218 segmentation Effects 0.000 description 1
- 238000005549 size reduction Methods 0.000 description 1
- 229910000679 solder Inorganic materials 0.000 description 1
- 239000013077 target material Substances 0.000 description 1
- 238000010998 test method Methods 0.000 description 1
- 238000009966 trimming Methods 0.000 description 1
Images


Classifications
-
- G—PHYSICS
- G06—COMPUTING; CALCULATING OR COUNTING
- G06T—IMAGE DATA PROCESSING OR GENERATION, IN GENERAL
- G06T7/00—Image analysis
- G06T7/10—Segmentation; Edge detection
- G06T7/11—Region-based segmentation
-
- G—PHYSICS
- G06—COMPUTING; CALCULATING OR COUNTING
- G06V—IMAGE OR VIDEO RECOGNITION OR UNDERSTANDING
- G06V10/00—Arrangements for image or video recognition or understanding
- G06V10/20—Image preprocessing
- G06V10/26—Segmentation of patterns in the image field; Cutting or merging of image elements to establish the pattern region, e.g. clustering-based techniques; Detection of occlusion
- G06V10/273—Segmentation of patterns in the image field; Cutting or merging of image elements to establish the pattern region, e.g. clustering-based techniques; Detection of occlusion removing elements interfering with the pattern to be recognised
-
- G—PHYSICS
- G06—COMPUTING; CALCULATING OR COUNTING
- G06V—IMAGE OR VIDEO RECOGNITION OR UNDERSTANDING
- G06V10/00—Arrangements for image or video recognition or understanding
- G06V10/40—Extraction of image or video features
- G06V10/44—Local feature extraction by analysis of parts of the pattern, e.g. by detecting edges, contours, loops, corners, strokes or intersections; Connectivity analysis, e.g. of connected components
- G06V10/443—Local feature extraction by analysis of parts of the pattern, e.g. by detecting edges, contours, loops, corners, strokes or intersections; Connectivity analysis, e.g. of connected components by matching or filtering
-
- G—PHYSICS
- G06—COMPUTING; CALCULATING OR COUNTING
- G06V—IMAGE OR VIDEO RECOGNITION OR UNDERSTANDING
- G06V10/00—Arrangements for image or video recognition or understanding
- G06V10/40—Extraction of image or video features
- G06V10/44—Local feature extraction by analysis of parts of the pattern, e.g. by detecting edges, contours, loops, corners, strokes or intersections; Connectivity analysis, e.g. of connected components
- G06V10/457—Local feature extraction by analysis of parts of the pattern, e.g. by detecting edges, contours, loops, corners, strokes or intersections; Connectivity analysis, e.g. of connected components by analysing connectivity, e.g. edge linking, connected component analysis or slices
-
- G—PHYSICS
- G06—COMPUTING; CALCULATING OR COUNTING
- G06T—IMAGE DATA PROCESSING OR GENERATION, IN GENERAL
- G06T2207/00—Indexing scheme for image analysis or image enhancement
- G06T2207/10—Image acquisition modality
- G06T2207/10024—Color image
Landscapes
- Engineering & Computer Science (AREA)
- Physics & Mathematics (AREA)
- General Physics & Mathematics (AREA)
- Theoretical Computer Science (AREA)
- Multimedia (AREA)
- Computer Vision & Pattern Recognition (AREA)
- Image Analysis (AREA)
- Image Processing (AREA)
Description
コンピュータを利用して画像に関連する演算を的確かつ正確に実行するに当たっての問題は、視覚世界で発生している物理的現象を真に反映し、表現するアルゴリズムの開発である。例えば、画像内の影と有形物のエッジとを正確かつ的確に区別するコンピュータの能力は、科学者にとって解決されない問題であってきた。対象物エッジ検出のための、初期の通常アプローチには画面内の明度境界解析を含んでいた。その解析では、物質(マテリアル)対象物によって生じた境界はシャープであり、一方で陰影によって生じた境界は陰影の半影効果によってソフト又は段階的であることを仮定している。このアプローチは、コンピュータによって正確に実行することのできるアルゴリズムによって実行可能であるが、その結果はしばしば正確なものではない。現実世界では、陰影がシャープな境界を形成したり、逆に物質対象物エッジがソフトな境界を形成する多くの事例がある。したがって従来の陰影と対象物エッジ認識技術を採用する場合には、陰影認識においてフォールスポジティブ及びフォールスネガティブの可能性が大きい。つまり、例えば陰影に似た物質(マテリアル)エッジがそれによってコンピュータで陰影として誤って認識されたり、シャープな陰影境界が対象物境界として誤って解釈されたりするのである。したがって画像に関連した、例えば画像の物質(マテリアル)及び照明特性を認識することに関連したコンピュータの作用において使用可能である、正確で適切な技術の開発に対し永続的なニーズが存在する。 The problem with accurately and accurately performing computations related to images using computers is the development of algorithms that truly reflect and represent physical phenomena occurring in the visual world. For example, the ability of computers to accurately and accurately distinguish shadows in images from the edges of tangible objects has been an unsolved problem for scientists. Early normal approaches for object edge detection included in-screen brightness boundary analysis. The analysis assumes that the boundary caused by the material object is sharp, while the boundary caused by the shadow is soft or gradual due to the penumbra effect of the shadow. Although this approach can be performed by algorithms that can be accurately performed by a computer, the results are often not accurate. In the real world, there are many cases where the shadow forms a sharp boundary, and conversely the material object edge forms a soft boundary. Therefore, when the conventional shadow and object edge recognition technology is adopted, there is a high possibility of false positive and false negative in shadow recognition. That is, for example, a material (material) edge similar to a shadow is erroneously recognized as a shadow by a computer, or a sharp shadow boundary is erroneously interpreted as an object boundary. Thus, there is a permanent need for the development of accurate and appropriate technologies that can be used in computer operations related to images, for example related to recognizing image materials and lighting properties.
本発明は、画像の照明及び物質様相(アスペクト)を正確且つ適切に識別する、画像に関連する空間スペクトル情報を採用する画像処理技術を備えた方法とシステムを提供する。 The present invention provides methods and systems with image processing techniques that employ spatial spectral information associated with an image that accurately and properly identifies the illumination and material aspect of the image.
本発明の実施形態では、画像を処理するために自動化されコンピュータ化された方法がもたらされる。本発明の特徴構成にしたがい、当該方法は、多帯域色画像を供給するステップと、前記画像のための空間スペクトル演算子で表される空間スペクトル情報を生成するステップと、ここで前記空間スペクトル情報は、カラーバンドに関して前記画像の連続したピクセル間のスペクトル関係により与えられ、これらスペクトル関係は前記画像の物質特性及び照明特性と、ピクセルスペクトル関係の空間エクステント(範囲)に関連し、前記空間スペクトル情報の関数として制約条件を規定するステップと、ここで前記制約条件は、前記空間スペクトル演算子の幾つかに加えられて行列式において表された制約関係の表現式であり、及び、それぞれが前記画像に対応していて、前記画像の物質成分を表示する物質画像及び前記画像の照明成分を表示する照明画像を識別するために、前記行列式の最適化した解を有する画像分離操作で前記制約条件を使用するステップで構成される。 The implementation of the invention, an automated, computerized method for processing an image is provided. According to a feature of the present invention, the method includes providing a multi-band color image, generating spatial spectral information represented by a spatial spectral operator for the image, wherein the spatial spectral information Is given by a spectral relationship between successive pixels of the image with respect to a color band, these spectral relationships being related to the material and illumination properties of the image and the spatial extent of the pixel spectral relationship, the spatial spectral information Defining constraints as a function of: wherein the constraints are expressions of constraint relationships expressed in determinants in addition to some of the spatial spectrum operators, and each The material image for displaying the material component of the image and the illumination component of the image are displayed. To identify the illumination image that consists of using said constraint in the image separation operation with solutions obtained by optimization of the determinant.
本発明のさらに別の実施形態では、上記方法を実行するように構成された(例えばプログラムされた)1つ以上のコンピュータを備えたコンピュータシステムがもたらされる。本発明の他の実施形態にしたがい、上記実施形態を実行する1つ又は複数のコンピュータを制御操作できる処理ステップを実行可能なコンピュータをそこに格納したコンピュータ読み取り可能なメディアがもたらされる。当該自動化されコンピュータ化された方法は、デジタルコンピュータ、アナログコンピュータ、光センサ、状態機械、シーケンサ、又は本発明の方法ステップを実行するように設計され又はプログラムされ得るいかなる装置又は設備によっても実行可能である。 Yet another embodiment of the present invention provides a computer system comprising one or more computers configured (eg, programmed) to perform the above method. In accordance with another embodiment of the present invention, a computer readable medium is provided having stored thereon a computer capable of performing processing steps capable of controlling and operating one or more computers executing the above embodiment. The automated computerized method can be performed by a digital computer, analog computer, optical sensor, state machine, sequencer, or any device or facility that can be designed or programmed to perform the method steps of the present invention. is there.
次に図面を参照すると、最初に図1を参照すると、画像に関連した演算を実行するように配置され且つ構成されたコンピュータシステム10のブロック図を示している。CPU12を、例えばデジタルカメラ14のような装置に、例えばUSBポートを介して接続する。デジタルカメラ14は、カメラ14で局所的に保存された画像をCPU12へダウンロードするように働く。CPU12はメモリ16内にダウンロードされた画像を画像ファイル18として保存する。画像ファイル18には、モニタ20に表示するため又はプリンタ22で印刷するためにCPU12がアクセスすることができる。
Referring now to the drawings, and initially referring to FIG. 1, a block diagram of a
一方でCPU12は、例えばデジタルカメラ14又はロボットのような装置内に埋め込まれたマイクロプロセッサとして組み込むことが可能である。CPU12には、例えばユーザーによるロボット操作又は対話式操作について、画像に関連した同時操作用の同時操作システムも装備することが可能である。
On the other hand, the
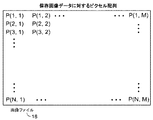
図2aに示したように、各画像ファイル18はn×mピクセル配列を有している。各ピクセルであるpは、全画像の個別部分に対応する画素である。全ピクセルが一緒になって画像ファイル18によって表現される画像を定義する。各ピクセルは、例えば画素の赤、緑、及び、青色成分(RGB)の色バンドの一セットに対応するデジタル値を有している。本発明は、各バンドが一片の電場スペクトルに対応するところのいかなる多帯域画像にも使用可能である。ピクセル配列は、ピクセルp(1,1)で始まりピクセルp(n,m)で終わるn行m列を各々有している。画像を表示又は印刷する際、その場合には恐らく一般的に知られているような画像ファイル18におけるピクセルのデジタル値の関数として、CPU12は対応する画像ファイル18をメモリ16から取り出し、モニタ20又はプリンタ22を操作する。
As shown in FIG. 2a, each
本発明の特徴構成にしたがい、画像処理においてCPU12は、例えば画像ファイル18に保存した画像ピクセルのRGB値などの情報を解析及び処理して、例えば固有画像(intrinsic image)を供給するために画像ファイル18の画像において描かれたシーンの照明及び物質アスペクトの分離等様々な目的を達成する。当該固有画像は、コンピュータ・ビジョンのようなアプリケーションにおいてより良い処理をするための、原画像に対応する物質(マテリアル)画像及び/又は照明画像を有することができる。本発明の基本的発見の基礎を成す基本観測は、物質と照明の二つの要素を含んだ一つの画像である。画像内の全ての変化はこれら要素のうち一つ又は別の要素によって生じる。空間スペクトル情報とは、画像ファイル18において描かれた画像の、連続するピクセルに関連した情報であり、例えばピクセルのRGB値のようなカラーバンドに関して連続したピクセル間のスペクトル関係、及び、例えば画像内に描かれた単一物質又は当該画像に変化をもたらす照明束(illumination flux)のような画像の特性に関連したピクセルスペクトル特性の空間エクステント(範囲)である。
In accordance with the characteristic configuration of the present invention, in the image processing, the
コンピュータシステム10によって保存された画像ファイル18の表示で人の目が見ることのできるものは、例えばデジタルカメラ14によって撮影されたシーン内の物質対象物の鏡面反射及び本体反射特性と、当該撮影がされた時に存在した照明束との間の相互作用によって生じたピクセルカラー値である。照明束は周辺光と入射光とを含んでいる。入射光は陰影を生じる光であり、陰影周囲の外側で見られる。周辺光は陰影の明るい側及び暗い側の両方に存在する光であるが、暗い領域内でより感じ取られる。本発明の特徴構成にしたがい、コンピュータシステム10は、例えば対象物エッジのような画像の物質アスペクトと、照明束において入射光と周辺光の相互作用で生じたスペクトルシフトの識別を経た照明束とを区別するように操作することが可能である。
What the human eye can see in the display of the
一つの画像内において物質と照明のうち一つが分かっている場合には、他者は直ぐに推測可能である。入射光と照明光のスペクトルは互いに異なり得る。したがって、スペクトルシフトは陰影、つまり、入射光強度の低下によって生じるのである。本発明の特徴構成にしたがい、スペクトルシフト現象が空間スペクトル情報で捉えられる。当該空間スペクトル情報はスペクトル比を含んでおり、スペクトル比とは一つの画像内に描かれたシーンの二つの領域間における、異なる物質(対象物エッジ)、照明変化(照明境界)によって又はその両者によって生じるのかもしれない色又は輝度の違いに基いている。本発明の好ましい実施形態では、当該スペクトル比は暗/明−暗に等しく、ここで暗とは、画像の陰影領域内の、照明境界における或る点でのカラーバンド値(例えばRGBカラー値)であり、明とは、同一照明境界の照明側の或る点でのカラーバンド値である。 If one of the substance and the lighting is known in one image, the other can immediately guess. The spectra of incident light and illumination light can be different from each other. Therefore, the spectral shift is caused by a shadow, that is, a decrease in incident light intensity. According to the characteristic configuration of the present invention, the spectrum shift phenomenon is captured by the spatial spectrum information. The spatial spectral information includes the spectral ratio, which is due to different materials (object edges), illumination changes (illumination boundaries), or both, between the two regions of the scene drawn in one image. Based on differences in color or brightness that may be caused by. In a preferred embodiment of the present invention, the spectral ratio is equal to dark / light-dark, where dark is the color band value (eg, RGB color value) at a point at the illumination boundary in the shaded area of the image. And bright is a color band value at a certain point on the illumination side of the same illumination boundary.
照明境界が入射光と周辺光との相互作用によって生じるので、照明変化に関係する画像全体に渡るスペクトル比は、境界の明るい側の色又は物質対象物特性に関わらず一貫しておよそ等しいはずである。照明境界に対応するスペクトル比は、画像の特性イルミナント比と呼ばれ得る。 Since the illumination boundary is caused by the interaction of incident light and ambient light, the spectral ratio across the image related to the illumination change should be consistently approximately equal regardless of the color or material object characteristics on the bright side of the boundary. is there. The spectral ratio corresponding to the illumination boundary may be referred to as the characteristic illuminant ratio of the image.
本発明のさらなる特徴構成にしたがい、空間スペクトル演算子を生じて、画像ファイル18に描かれたシーンの照明と物質様相の分離処理を容易にする。空間スペクトル演算子は、一画像の物質及び照明様相の処理において有用な空間スペクトル情報を含んでいる画像の表現又は特性をなす。空間スペクトル演算子は、ソルバー(解析プログラム、solver)への入力に対して、演算子間の制約条件空間スペクトル関係を規定する制約条件に準拠する。当該ソルバーは、画像ファイル18に保存された原画像から誘導した物質画像及び/又は照明画像のような固有画像を生じるために最適化した解を得るために、空間スペクトル演算子間の制約条件関係の関数として、数学的処理エンジン(engine)を含んでいる。
In accordance with a further feature of the present invention, a spatial spectral operator is created to facilitate the separation of scene illumination and material aspects depicted in the
空間スペクトル演算子は、例えばトークン、トークンマップ情報、ログ−色度表現値、X−ジャンクション(X−接合、X-junction)、BIDRモデル表現(画像)、境界表現(画像)、及びテクストンヒストグラム(texton histogram)に基いたピクセル表現を含む。 Spatial spectrum operators include, for example, tokens, token map information, log-chromaticity representation values, X-junction (X-junction), BIDR model representation (image), boundary representation (image), and texton histogram. Contains pixel representation based on (texton histogram).
本発明の特徴構成にしたがうと、トークンは一画像の結合した一領域であって、当該領域のピクセルは、物質及び照明の識別のように画像の特徴及び特性の識別に関連しながら互いに結び付けられている。トークンの使用は、画像の物質/照明/幾何学的特性の、特定の組み合わせが単一ピクセルを越えて広がり、及び、したがってピクセルレベルでここに記載した画像処理が実施され得る間にトークンは画像特性のより効率的な処理を促進するという事実が認められる。トークンのピクセルは、例えばピクセル間のカラー値の近い相関関係のような同種ファクタ(homogeneous factors)、又は、例えば通常テクスチャ(模様)と呼ばれるRGB空間のような色空間内において幾何学的に関連した異なるカラー値のような異質ファクタ(nonhomogeneous factors)の点から関連付けることが可能である。本発明の典型的な実施形態は、画像ファイルのより良い処理を行うために、様々な型の同種トークン(homogeneous tokens)又は異種トークン(nonhomogeneous tokens)を識別するための方法とシステムとをもたらす。本発明は、画像ファイル18内に描かれた画像の隣接するピクセルに関連した空間スペクトル情報を用いて、トークン領域を識別する。
According to a feature of the invention, a token is a combined region of an image, and the pixels in that region are tied together in relation to the identification of image features and characteristics, such as material and lighting identification. ing. The use of tokens means that a particular combination of image material / illumination / geometric properties extends beyond a single pixel, and thus the token is imaged while the image processing described herein can be performed at the pixel level. The fact of facilitating more efficient processing of properties is observed. The pixels of the token are geometrically related within a color space such as an RGB space, commonly referred to as a homogenous factor, eg, a texture (pattern), eg, a close correlation of color values between pixels. It can be related in terms of nonhomogeneous factors such as different color values. Exemplary embodiments of the present invention provide methods and systems for identifying various types of homogenous tokens or nonhomogeneous tokens for better processing of image files. The present invention identifies token regions using spatial spectral information associated with adjacent pixels of an image drawn in the
本発明の一つの典型的な実施形態にしたがい、同種トークンを各々A型トークン、B型トークン、又はC型トークンのいずれかに分類する。A型トークンとは、シーン中の単一物質を含んでいる画像の最大可能領域を表す複数の隣り合ったピクセルを有する、結合された画像領域である。B型トークンとは、シーン中の単一物質を含んでいる画像の一領域を表す複数の隣り合ったピクセルを有する、結合された画像領域であるが、必ずしもその物質に対応する最大領域ではない。C型トークンとは、トークンの隣り合ったピクセル間の類似の画像特性、ここで類似とは画像を記録するために用いられた結像システムに対するノイズモデルについて規定されている、例えば類似の色及び輝度の、結合された画像領域を含んでいる。 According to one exemplary embodiment of the present invention, homogenous tokens are each classified as either an A-type token, a B-type token, or a C-type token. An A-type token is a combined image area that has a plurality of adjacent pixels that represent the maximum possible area of the image containing a single substance in the scene. A B-type token is a combined image area with multiple adjacent pixels representing a region of an image containing a single material in a scene, but not necessarily the largest region corresponding to that material . C-type tokens are defined for similar image characteristics between adjacent pixels of the token, where similar is defined for the noise model for the imaging system used to record the image, for example similar colors and Includes luminance and combined image areas.
線形トークンとは画像の結合された領域を含む同種トークンであって、当該領域の隣り合うピクセルは、RGBスペースのシリンダ内で(陰影内の)暗端から明端(明るい端)へ右上がり斜線に沿って減少する、異なるカラー測定値を有する。色変化が画像内に描かれたシーンの単一物質に渡る陰影を形成する照明変化による場合には(即ち、照明場において入射光又は直接光と周辺光との相互作用によって入射光強度が低下する場合には)、本発明の特徴構成にしたがいシリンダ形状が二光源二色性反射モデル(BIDRモデル)によって予想される。 A linear token is a homogenous token that includes a combined region of an image, and adjacent pixels in that region are slanted to the right from the dark end (in the shade) to the bright end (the bright end) in the RGB space cylinder. With different color measurements that decrease along the line. If the color change is due to an illumination change that forms a shadow over a single substance in the scene depicted in the image (ie, the incident light intensity is reduced by the interaction of incident light or direct light and ambient light in the illumination field) In this case, the cylinder shape is predicted by the two-light source dichroic reflection model (BIDR model) according to the characteristic configuration of the present invention.
線形トークンを表現して識別して用いるために、BIDRモデルは次のように表す。
I(x,y,z,θ,φ,λ)=cb(λ)ld(λ)γb+Ma(λ)cb(λ)
ここで、I(x,y,z,θ,φ,λ)は表面の点(x,y,z)において波長λに対するθ、φ方向への輝度、cb(λ)は波長λに対する表面の幾何学的形状非依存性本体反射率、ld(λ)は波長λに対する入射光源明度、γbは陰影係数sx,y,zと幾何学的係数mb(θi)との積、及び、Ma(λ)は入射光源明度を除く、周辺光源明度と、半球に渡る幾何学的本体反射率との積分である。BIDRモデルに係る、より詳細な情報は、2006年1月27日に出願、2007年8月2日公開の、「画像処理用二光源二色性反射モデル」という名称の特許文献1を参照されたい。
In order to express and identify a linear token, the BIDR model is expressed as follows.
I (x, y, z, θ, φ, λ) = c b (λ) 1 d (λ) γ b + M a (λ) c b (λ)
Here, I (x, y, z, θ, φ, λ) is the luminance in the θ and φ directions with respect to the wavelength λ at the point (x, y, z) on the surface, and c b (λ) is the surface with respect to the wavelength λ. The geometric shape-independent body reflectance, l d (λ) is the incident light source brightness with respect to the wavelength λ, and γ b is the product of the shadow coefficient s x, y, z and the geometric coefficient m b (θ i ). M a (λ) is the integral of the ambient light source brightness, excluding the incident light source brightness, and the geometric body reflectivity over the hemisphere. For more detailed information on the BIDR model, refer to Patent
トークンマップ情報は、一画像内の複数トークンの互いに対する位置を表す。当該マップ情報を、ソルバーへの入力用に、隣り合うトークンを識別してトークン間の制約条件空間スペクトル関係に関連したトークン隣接関係の解析を実行するために用いる。 The token map information represents the positions of a plurality of tokens in one image with respect to each other. The map information is used for input to the solver to identify adjacent tokens and perform token adjacency analysis related to the constraint spatial spectral relationship between tokens.
ログ−色度表現値(色度対数表現値)は、画像のピクセルに対し照明不変値を供給する。画像ピクセルのカラーバンド値の対数値をログ−カラー空間グラフにプロットする。次に対数値を、BIDRモデルの関数として適合されたログ−色度投影面へ投影する。当該色度平面値は、各ピクセルのカラーバンド値(例えばRGB値)の代わりに使う。ログ色度表現値に係るより詳細な情報については、2006年4月13日に「ログカラー空間を用いた照明と反射を分離するための方法とシステム」という題で出願し、2007年10月18日に公開された特許文献2を参照されたい。 The log-chromaticity representation value (chromaticity logarithmic representation value) provides an illumination invariant value for the pixels of the image. Plot the logarithm of the color band value of the image pixel in a log-color space graph. The logarithmic value is then projected onto a log-chromaticity projection plane adapted as a function of the BIDR model. The chromaticity plane value is used instead of the color band value (for example, RGB value) of each pixel. For more detailed information on log chromaticity expression values, filed on April 13, 2006 under the title “Method and System for Separating Illumination and Reflection Using Log Color Space”, October 2007 See Patent Document 2 published on the 18th.
X−ジャンクションとは、物質(マテリアル)エッジと照明境界とが互いに交わるところの画像の領域である。X−ジャンクションは、画像の物質及び照明様相を精度高く解析するためには最適な場所である。 An X-junction is a region of an image where a material (material) edge and an illumination boundary intersect each other. The X-junction is an optimal place for analyzing an image substance and an illumination aspect with high accuracy.
境界画像とは、例えば隣り合うB型トークンによって形成された境界の各側におけるピクセル配列である。当該配列は、当該境界を平滑表面上における物質境界(他の種類の境界、例えば、照明エッジ、深さ境界、又は照明及び物質の同時変化に対立するものとして)として分類するための境界解析を容易にするために用いられる。当該ピクセル画像は、境界を形成している各B型トークン内のピクセルのサンプルを供給するように構成される。サンプルのピクセルは空間スペクトル解析にかけられて、その結果を比較して、各境界が物質変化に対応しているかどうか決定する。 The boundary image is a pixel array on each side of the boundary formed by, for example, adjacent B-type tokens. The array provides a boundary analysis to classify the boundary as a material boundary on a smooth surface (as opposed to other types of boundaries, such as lighting edges, depth boundaries, or simultaneous changes in lighting and material). Used for ease. The pixel image is configured to provide a sample of pixels within each B-type token that forms a boundary. Sample pixels are subjected to spatial spectral analysis and the results are compared to determine if each boundary corresponds to a material change.
テクストンとは、テクスチャを含む画像領域に対する同種画像である。画像テクスチャは、ピクセル輝度における空間変化量の関数として規定される。画像テクスチャパターンは、しばしば画像表面の物理的又は反射特性の結果である。通常、画像テクスチャは空間的均一性に関連しており、典型的には、しばしばランダムな変化を伴った(例えば、ランダムな位置、オリエンテーション、又は色)、繰り返し構造体を含んでいる。画像テクスチャは、規則性、粗さ、コントラスト、及び、異方性のような特定の視覚的特性によってもしばしば特徴づけられる。画像テクスチャの一例は、空間的には同質のようだが、特定の繰り返しパターンを形成する色強度の変化を含むように見える、シマウマの皮膚表面の画像である。幾つかの画像テクスチャは、ストライプ又はスポットのような幾何学的特性によって規定することが可能である。テクストンベースの演算子は、テクスチャ付きの物質によって生じた異なる反射のパターンを、画像のテクスチャ付き領域のスペクトル及び空間特性を捕らえる同種画像に変換する。 A texton is a homogeneous image for an image area containing a texture. Image texture is defined as a function of the amount of spatial change in pixel brightness. Image texture patterns are often the result of physical or reflective properties of the image surface. Image textures are usually associated with spatial uniformity and typically include repetitive structures, often with random changes (eg, random position, orientation, or color). Image texture is often also characterized by specific visual characteristics such as regularity, roughness, contrast, and anisotropy. An example of an image texture is an image of a zebra skin surface that appears spatially homogeneous but appears to contain changes in color intensity that form a specific repeating pattern. Some image textures can be defined by geometric properties such as stripes or spots. Texton-based operators transform different reflection patterns caused by textured material into homogeneous images that capture the spectral and spatial characteristics of the textured regions of the image.
制約条件は、例えばアンカー制約条件、同一照明制約条件、平滑照明制約条件、B型トークン制約条件、線形トークン制約条件、BIDR実施制約条件、同一テクストンヒストグラム制約条件、ログ色度類似制約条件、Xジャンクション制約条件、及び境界画像制約条件を含んでいる。各制約条件は、各制約条件で用いられる空間スペクトル演算子を定義する制約条件生成プログラムソフトウェアモジュールとして構成され、制約条件演算子に加えられた制約関係の表現式を与える。 The constraint conditions include, for example, anchor constraint conditions, identical illumination constraint conditions, smooth illumination constraint conditions, B-type token constraint conditions, linear token constraint conditions, BIDR implementation constraint conditions, identical Texton histogram constraint conditions, log chromaticity similarity constraint conditions, X It includes junction constraints and boundary image constraints. Each constraint condition is configured as a constraint condition generation program software module that defines a spatial spectrum operator used in each constraint condition, and gives an expression of the constraint relationship added to the constraint condition operator.
アンカー制約条件は、画像内の最も明るい/最も大きな多数のC型トークンを利用する。当該制約関係は、選択した最も明るい/最も大きなC型トークンでできた物質が画像内で観察された色/輝度(brightness)に対する絶対値となるように制約されることである。当該制約条件は、相対的輝度制限を回避するために、絶対輝度で、画像に対し物質マップを投錨する。 The anchor constraint utilizes the brightest / largest number of C-type tokens in the image. The constraint is that the material made of the brightest / largest C-type token selected is constrained to be an absolute value for the color / brightness observed in the image. The constraint conditions throw a material map on the image with absolute brightness to avoid relative brightness restrictions.
同一照明制約条件は、一画像内で識別したC型トークンとB型トークン、並びにトークンマップ情報を利用する。当該制約関係は、隣り合うC型トークンが同一のB型トークンの部分でなければ、トークンマップ情報によって示されたように、隣り合うC型トークンは同一照明の状態にあることである。用語「照明」に関連した用語「同一」というのは、画像を記録するのに用いられる撮像システムに対するノイズモデルについての平均値を表すために用いられている。これは、同一B型トークンの部分ではない隣り合うC型トークン間のいかなる差も、物質変化となって現れるように強制するのである。 The same lighting constraint condition uses a C-type token and a B-type token identified in one image, and token map information. The constraint relationship is that, if adjacent C-type tokens are not part of the same B-type token, adjacent C-type tokens are in the same illumination state as indicated by the token map information. The term “identical” in relation to the term “illumination” is used to represent the mean value for the noise model for the imaging system used to record the image. This forces any difference between adjacent C-type tokens that are not part of the same B-type token to appear as material changes.
平滑照明制約条件は、同一照明制約条件と類似である。しかしながら、同一照明制約条件でのように、同一照明を有するべき隣り合うC型トークンの全ピクセルを制約するのではなく、平滑照明制約条件では、当該制約条件は、隣り合うC型トークン間の共用された境界付近にあるピクセルの平均照明(明度)に基いているのである。これは、(上記で規定したものと同様の)一つのトークン全体を渡る区分的コントラストとは対照的に、照明場を幾分平滑になるように制約するのである。 The smooth illumination constraint is similar to the same illumination constraint. However, instead of constraining all pixels of adjacent C-type tokens that should have the same illumination as in the same illumination constraint, in a smooth illumination constraint, the constraint is shared between adjacent C-type tokens. It is based on the average illumination (brightness) of the pixels near the border. This constrains the illumination field to be somewhat smooth, as opposed to piecewise contrast across an entire token (similar to that defined above).
B型トークン制約条件は、C型トークンならびにB型トークンも使用する。しかしながら、制約関係は、同一のB型トークンの一部である全C型トークンが同一物質からなるように制約されるということである。この制約条件は、B型トークンの定義、つまり、シーン内の一物質を含んでいる画像領域を表現する連続したピクセルを含む結合した画像領域を、最大領域が当該物質に一致することを必ずしも必要としないで、強制するのである。つまり、同一のB型トークン内に在る全C型トークンは、必ずしも同一の照明でない、同一物質の、B型トークンに課された定義によるのである。C型トークンはしたがって、照明変化によって生じた外見上の観察差に一致するように制約されるのである。 B type token constraints also use C type tokens as well as B type tokens. However, the constraint relationship is that all C-type tokens that are part of the same B-type token are restricted to be made of the same substance. This constraint requires the definition of a B-type token, that is, a combined image area that includes consecutive pixels that represent an image area that contains a substance in the scene, and that the maximum area must match that substance. Do not do it, force it. That is, all C-type tokens in the same B-type token are based on the definition imposed on the B-type token of the same substance, not necessarily the same illumination. The C-type token is therefore constrained to match the apparent observational difference caused by illumination changes.
この結果、B型トークン制約条件は、上記したように照明変化とは対照的な、観察差を物質変化に一致するように制約する同一及び平滑照明制約条件と相補的である。このことは、同一及び平滑照明制約条件の各々において、隣り合うがB型トークンの一部ではないC型トークンが、同一の照明に制約されるという事実によるのである。これらC型トークンは異なる物質を含んでいる筈である、というのも、制約条件によってそれらは同一のB型トークン内に存在せず、したがって当該制約条件によって強制されたB型トークンの規定によって単一物質を含まないからであり、その結果、照明は一定である筈であり、且つ、いかなる観察差も物質変化に起因し得るものと考慮される。 As a result, the B-type token constraint is complementary to the same and smooth illumination constraints that constrain the observation difference to match the material change, as opposed to the illumination change as described above. This is due to the fact that in each of the same and smooth illumination constraints, C tokens that are adjacent but not part of the B token are constrained to the same illumination. These C-type tokens should contain different substances, because they are not present in the same B-type token due to constraints, and are therefore simply specified by the definition of B-type tokens enforced by the constraints. This is because it does not contain a single substance, so that the illumination should be constant and any observational difference can be attributed to the substance change.
まとめると、本発明の特徴構成にしたがい、C型及びB型トークン空間スペクトル演算子が規定されて、照明と物質の分離を可能にする画像の特徴をもたらす。C型トークンは各々、画像ファイル18に記録され保存されたのと類似の画像特性、例えば類似の色を有する結合した画像領域を含む。よって、隣り合う複数のC型トークンは、画像内の変化のある形態を示すか、さもなければ、同一のC型トークンを形成するであろう。B型トークンは単一物質を含む。同一/平滑照明制約条件及びB型トークン制約条件の相補的制約条件は、物質変化又は照明変化のいずれかを示すトークン間の関係を強制する。
In summary, according to the feature configuration of the present invention, C-type and B-type token spatial spectral operators are defined to provide image features that allow for separation of illumination and material. Each C-type token includes a combined image region having similar image characteristics, such as similar colors, as recorded and stored in the
隣り合うC型トークンが同一のB型トークン内に存在する場合には、B型トークン制約条件に従い、それらの差は、一般的なB型トークンの同一物質特性のために照明変化に対応する筈である。隣り合うC型トークンが同一のB型トークン内に存在しない場合には、同一/平滑照明制約条件に従い、それらの差はそれゆえ物質変化に対応する筈である、というのも、それらは両者ともに一般的な単一物質B型トークンでは規定されないからである。 If adjacent C-type tokens are present in the same B-type token, the difference between them will correspond to the illumination change due to the same material properties of a typical B-type token, subject to B-type token constraints. It is. If adjacent C-type tokens do not exist within the same B-type token, the difference between them should therefore correspond to material changes, subject to the same / smooth lighting constraints, since both This is because it is not defined for a general single substance B-type token.
線形トークン制約条件は、C型トークンと線形トークンを用いる。制約関係は、線形トークンによって間隔をあけられた二つのC型トークン間の差が、画像の固有の照明スペクトル比と概ね等しいという関係である。規定されたように、線形トークンは色空間を通る、右上がり斜線に沿ったシリンダ形状(円柱形状)をたどっている。BIDRモデルは、右上がりの斜線が画像の固有の照明スペクトル比に等しいことを予測している。したがって、二つのC型トークン間の色差、つまり線形トークンの各暗端及び明端の差は、画像の、各固有の照明スペクトル比の値を反映している筈である。 The linear token constraint uses a C-type token and a linear token. The constraint relationship is such that the difference between two C-type tokens spaced by a linear token is approximately equal to the image's inherent illumination spectral ratio. As specified, the linear token follows a cylinder shape (cylindrical shape) along the upward-sloping diagonal line through the color space. The BIDR model predicts that the upward-sloping diagonal line is equal to the inherent illumination spectral ratio of the image. Therefore, the color difference between the two C-type tokens, that is, the difference between the dark end and the bright end of the linear token, should reflect each unique illumination spectral ratio value of the image.
BIDR強制制約条件は、C型トークン、及び、ログ色度投影面に対する法線ベクトルを規定したBIDRモデルを用いる。当該制約関係は、画像の局所パッチ内における全C型トークンに対する照明が、ログ−カラー空間内における複数の平行線の組を形成する関係であって、当該平行線の配向は法線ベクトルを形成すたBIDRモデルによって定義される、関係である。当該制約条件はしたがって、画像内に存在する照明場を照明に対するBIDRモデル予測にきっちりと当てはまるように強制する。 The BIDR mandatory constraint uses a BIDR model that defines a C-type token and a normal vector for the log chromaticity projection plane. The constraint relationship is such that illumination for all C-type tokens in the local patch of the image forms a set of parallel lines in the log-color space, and the orientation of the parallel lines forms a normal vector A relationship defined by the BIDR model. The constraint therefore forces the illumination field present in the image to fit exactly into the BIDR model prediction for illumination.
よって各線形トークン制約条件とBIDR強制制約条件は、BIDRモデル予測を、画像の照明と物質様相を分離するための基準として用いる。BIDRモデルは、色変化が画像内に描かれたシーンの単一物質に渡る影を形成する照明の変化(つまり、照明場における入射又は直接照明と周辺照明との間の相互作用としての入射照明の強度減少)による場合には、画像内の色変化を予測する。BIDRモデルの色変化予測は、C型トークン間の全色バンド変化量を、照明場の入射照明と周辺照明成分間で発生するスペクトル変化(variations)間関係の関数として演算することにより画像内に生じる照明場効果へ厳密に制約する。したがってBIDRモデルに基いた制約条件は、全てのカラーバンド変化を一つの積分制約関係へ結びつける。 Thus, each linear token constraint and BIDR mandatory constraint use BIDR model prediction as a criterion for separating image illumination and material aspects. The BIDR model is a change in illumination in which a color change forms a shadow over a single material of the scene depicted in the image (ie incident illumination as incident in the illumination field or as an interaction between direct and ambient illumination) In the case of a decrease in the intensity of the image, a color change in the image is predicted. The color change prediction of the BIDR model is performed by calculating the amount of change in all color bands between C-type tokens as a function of the relationship between the spectral variations that occur between the incident illumination of the illumination field and the surrounding illumination components. Strictly constrain the resulting lighting field effect. Therefore, the constraint condition based on the BIDR model links all color band changes to one integral constraint relationship.
同様のテクストンヒストグラム制約条件は、C型トークンと、画像内のテクスチャ領域を識別するテクストンヒストグラム演算子とを使用する。テクストン解析が用いられるが、例えばRGBカラーバンド値のような各画像ファイル18の保存されたカラーバンド表現由来の画像の各ピクセル(又は、テクスチャを含むように識別された画像のこれら領域のピクセル)は二つのバンド表現に変換され、当該二つのバンドはテクストンラベルとテクストンヒストグラムラベルとを有している。当該二つのバンド表現は、次にテクスチャトークンを以下に記載するように識別するために用いられる。同一テクスチャトークン内の全C型トークンが同一平均物質で作られるという制約条件が課され得る。
Similar texton histogram constraints use C-type tokens and texton histogram operators that identify texture regions in the image. Texton analysis is used, but each pixel of the image from the stored color band representation of each
ログ色度類似制約条件は、C型トークンと、ログ色度表現値とを使用する。当該制約関係は、類似のログ色度表現値を備えたピクセルを有するこれらC型トークンが、同一カラー値へ制約されるが、その際、観測差は照明場内の変化量に起因する。 The log chromaticity similarity constraint condition uses a C-type token and a log chromaticity expression value. In the constraint relationship, these C-type tokens having pixels having similar log chromaticity expression values are constrained to the same color value, and at this time, the observation difference is caused by the amount of change in the illumination field.
X−ジャンクション制約条件はC型トークンとX−ジャンクション演算子とを使用する。上で述べたように、X−ジャンクションとは、物質エッジと照明境界とが互いに交わるところの画像の領域である。X−ジャンクションは、典型的には四つのC型トークンと、物質エッジを形成する二組の同一物質C型トークンによって識別されるが、その際、各同一物質組は、各同一物質をC型トークンの日向と陰影の組に分割する照明境界を含有している。制約条件関係は以下のとおり。1)B型トークン制約条件が、X−ジャンクションを形成するC型トークンの各同一物質組(間に照明境界を備えているもの)間に課される。2)同一照明制約条件が、X−ジャンクションの物質エッジを形成するC型トークンの各組間に課される。X−ジャンクションと制約トークンの関係に係るより詳細な記載については、2006年1月27日に出願され、2006年8月10日に公開された「画像における照明束を識別するための方法とシステム」という題の特許文献3を参照。 X-junction constraints use C-type tokens and X-junction operators. As mentioned above, an X-junction is a region of an image where a material edge and an illumination boundary intersect each other. An X-junction is typically identified by four C-type tokens and two sets of identical material C-type tokens that form a material edge, where each identical material group identifies each identical material as a C-type. It contains an illumination boundary that divides the token into the sun and shade pairs. The constraint relationship is as follows. 1) A B-type token constraint is imposed between each identical material set of C-type tokens (with an illumination boundary between them) forming an X-junction. 2) The same lighting constraints are imposed between each set of C-type tokens that form the material edge of the X-junction. For a more detailed description of the relationship between X-junction and constrained tokens, see “Method and System for Identifying Lighting Bundles in an Image” filed on Jan. 27, 2006 and published on Aug. 10, 2006. See, for example, US Pat.
境界画像制約条件を標準比率制約条件で規定する。物質変化を表す場合に境界画像において実行される当該解析は、境界によって規定した二つの隣り合う領域間の、例えば隣り合うB型トークン間のカラー比率の推定値を、当該領域に渡って照明が変化する場合でさえももたらす。当該制約条件は、二つの隣り合う領域のカラー比率がXであると指定する。境界画像解析がB型トークンのレベルで実行されて、境界を物質変化によって生じたものとして分類し、次に、C型トークン成分のレベルまで広げられる。当該制約条件は、境界に沿った全ての隣り合うC型トークンの対、(境界各側の一つのC型トークン、及び各境界を形成しているB型トークン内に存在する全てのC型トークン)、が、境界画像解析によって示されたように、比率Xを満たす色を有していると指定する。 The boundary image constraint condition is defined by the standard ratio constraint condition. The analysis performed in the boundary image in the case of representing a substance change is performed by calculating an estimated color ratio between two adjacent regions defined by the boundary, for example, between adjacent B-type tokens, over the region. Even when it changes. The constraint condition specifies that the color ratio of two adjacent regions is X. Boundary image analysis is performed at the B-type token level, classifying the boundary as caused by material changes, and then expanded to the C-type token component level. The constraint is that all adjacent C-type token pairs along the boundary (one C-type token on each side of the boundary, and all C-type tokens present in the B-type token forming each boundary ) Specify that it has a color that satisfies the ratio X, as shown by boundary image analysis.
本発明の好ましい実施形態にしたがい、上記各制約条件は、各々三種類の制約条件、絶対的物質カラー制約条件、同一物質制約条件、及び、相対反射制約条件のうちの一つに分類され得る。前記絶対的物質制約条件は、画像の特定位置の物質を、特定の色となるように、例えばアンカー制約条件において実行されるように制約する。前記同一物質制約条件は、画像に関連する演算子(例えば、二つのピクセル又はC型トークン)を、同一物質で構成されるように制約する。同一物質型の制約条件は、例えば、B型、X−ジャンクション、ログ色度類似性、同一テクストンヒストグラム、及び線形トークン制約条件において実行され得る。前記相対反射制約条件は、画像に関連する演算子(例えば、二つのピクセル又はC型トークン)を、平滑照明及び同一照明制約条件によって規定されたように、且つ、X−ジャンクション及び境界画像制約条件によって規定され得る、類似の反射特性を有するように制約する。 According to a preferred embodiment of the present invention, each of the constraints may be classified into one of three types of constraints, an absolute material color constraint, an identical material constraint, and a relative reflection constraint. The absolute substance restriction condition restricts the substance at a specific position in the image to be executed in a specific color, for example, an anchor restriction condition. The same material restriction condition restricts an operator related to an image (for example, two pixels or a C-type token) to be composed of the same material. Identical material type constraints can be implemented, for example, in B-type, X-junction, log chromaticity similarity, identical texton histogram, and linear token constraints. The relative reflection constraint is defined by an operator associated with the image (eg, two pixels or C-type tokens) as defined by smooth illumination and the same illumination constraint, and an X-junction and boundary image constraint. To have similar reflective properties that can be defined by
本発明の特徴構成にしたがう、模範的なソルバーは、最適関数を実行するための、例えば[A][x]=[b]ここで、選択した制約条件によって表示されるように、[A]は演算子の定義、及び当該演算子への制約関係によって満足されるべき値の行列であり、[x]は当該式が最適解を発見する変化量の行列であって、例えば画像成分のうち照明又は物質成分のうち一つが例えばピクセル又はトークンの行列であり、及び、[b]は処理用に選択された画像内で観察された値の行列であって、例えば画像ファイル18の各ピクセルのRGBカラーバンドに対し記録された値の行列である、で表現される式への結果の最適化を実行するための、数学的処理エンジンを含んでいる。最適化式は、公知の最適化ソルバーの組、例えば、最小自乗ソルバー、又は前処理付き共役勾ソルバーのような公知のとつ最適化演算の組から選択された、数学的最適化関数において実行され得る。
In accordance with a feature of the invention, an exemplary solver, for example, [A] [x] = [b] for executing an optimal function, where [A] is displayed as indicated by the selected constraint. Is a matrix of values that should be satisfied by the definition of the operator and the constraint relationship to the operator, and [x] is a matrix of the amount of change by which the formula finds the optimal solution, for example among the image components One of the illumination or material components is, for example, a matrix of pixels or tokens, and [b] is a matrix of values observed in the image selected for processing, eg, for each pixel in the
本発明の別の特徴構成にしたがい、制約関係に加え、現実世界照明と物質現象の関数として、境界を含むファクタがソルバー演算に導入され、物質/照明値を、以下に記載するリミット1、リミットインフィニティソルバー(L1,L∞)、有界最小自乗ソルバー、又は、有界L1,L∞ソルバーのような物理的にもっともらしい範囲内に維持する。 In accordance with another feature configuration of the present invention, in addition to the constraint relationship, factors including boundaries as a function of real world lighting and material phenomena are introduced into the solver operation, and the material / lighting values are set to limit 1, limit described below. It is maintained within a physically plausible range such as an infinity solver (L 1 , L ∞ ), a bounded least squares solver, or a bounded L 1 , L ∞ solver.
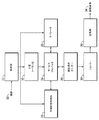
図3は、本発明の特徴構成にしたがい、例えば図1のコンピュータシステム内に実装された、画像分離システム構造の機能ブロック図である。代替として、図3の機能ブロックは、図3のブロックの機能を実行するように定められた専用のハードウェア回路に実装することも可能である。(画像ファイル18中に描かれたような)画像32を前処理ブロック33へ入力する。前処理ブロック33は、画像32内における色収差の補正、複数像を組み合わせて高増幅画像(high dynamic range image)を供給すること、画像のピクセルデータを線形化すること等、処理用に画像を最適化するような機能を実行することができる。前処理した画像は次に、以下に記述するように前処理画像内のC型トークンを識別するよう作用する、C型トークン化ブロック35へ入力する。C型トークンは、本発明の模範的実施形態において用いられる制約条件の多くに共通しているため、入力画像32に対するC型トークンの初期識別子は更なる処理を早める。
FIG. 3 is a functional block diagram of an image separation system structure implemented in, for example, the computer system of FIG. 1 according to the characteristic configuration of the present invention. Alternatively, the functional blocks of FIG. 3 can be implemented in dedicated hardware circuitry that is defined to perform the functions of the blocks of FIG. An image 32 (as drawn in the image file 18) is input to the
本発明の模範的実施形態では、CPU12がコードを実行して前処理ブロック33とC型トークン化ブロック35の両方を実施し、ならびに、(メモリ16内に構成される)中央エージェント及びキャッシング構造として機能するサービスプロバイダ24を実施し、本発明の教示にしたがう処理を目的として画像を取り扱う。前記サービスプロバイダ24は、前処理した画像と、C型トークン化ブロック35からの関連したC型トークン情報を受け入れて保存し、且つ、出現するであろう選択した制約条件に要求される画像に対する他のいかなる演算子をも生じるように定められた、(CPU12によって実行される)オペレータブロック28に結合される。前記サービスプロバイダ24は、大域的特徴抽出入力29にも結合される。前記大域的特徴抽出入力29は、例えば撮像時の光源の指示(太陽光、蛍光、白熱ランプ光)、日付、場所、領域情報のような、処理した画像に関連する情報と、例えば屋内、屋外、建物、緑の草を有する芝生、花盛りの葉をつけた木々等のような、画像本質に関連する情報と、及び、画像処理に関連する他のいかなるパラメータをもシステムに供給するために使用することが可能である。前記サービスプロバイダ24は、関連した入力画像32を大域的特性抽出入力29に格納する。
In the exemplary embodiment of the present invention,
制約条件ビルダー26をサービスプロバイダ24に結合する。前記制約条件ビルダー26は、上記した様々な制約条件に対する制約条件生成ソフトウェアモジュールを保存する、(メモリ16内に構成された)制約条件生成プログラムライブラリを用いる。前記サービスプロバイダ24と制約条件ビルダー26は、例えば[A][x]=[b]行列式において、制約条件生成ソフトウェアモジュールのうち選択したものにしたがって、前処理した画像に関連する空間スペクトル演算子を定めるように作用する。
A
(CPU12によって実行される)ソルバー30が前記制約条件ビルダー26に結合され、上記したように、前処理画像から固有画像を生じるために用いる、[A][x]=[b]行列式の最適解のために最適化操作を実行する。ソルバー30は、特定の後処理操作を行うために(CPU12によって実行される)後処理ブロック36にも結合される。前記後処理操作は、例えば単調性保守(monotonicity maintenance)を含み得る。単調性保守において、二つの大きな領域が入力画像32内で線形移行を示す場合には、当該移行は算出した固有画像34(intrinsic image)において線形移行を維持すべきである。後処理は、ソルバー30によって残された穴を埋めるために用いられる照明伝播と、照明マップに基くホワイト平衡化、及び他のフィルタリング、平滑化処理も含み得る。前記後処理ブロック36は固有画像34を算出する。
An optimal [A] [x] = [b] determinant used by the solver 30 (executed by the CPU 12) to couple to the
次に図4を参照すると、本発明の画像分離システム構造特徴構成の模範的態様に関連して用いる、図式的ユーザーインターフェース(GUI)を示している。図4のGUIがサービスプロバイダ24によってコンピュータシステム10のモニタ20上に表示されており、ユーザーが所望の画像分離操作を選択できるようになっている。GUIの左上の角には、画像をひらく、画像をトリミングする、パラメータを表示する、及び、分離するという選択項目表示を示している。ユーザーは所望の選択表示上にカーソルを動かしてクリックすることが可能である。画像をひらくという表示は、メモリ16内に現在のところ保存している全ての画像ファイル18を列挙して、ユーザーが処理用に画像を選択できるようにする。選択した画像は、モニタ20の中央上に選択した画像を表示するように作用するサービスプロバイダ24へ(前処理ブロックとC型トークン化ブロック35を通って)入力32(図3参照)される。
Referring now to FIG. 4, a graphical user interface (GUI) is shown for use in connection with the exemplary aspects of the image separation system structural features of the present invention. The GUI of FIG. 4 is displayed on the
模範的な分離システムの作用によって選択した画像から誘導された物質画像は、ソルバー30による画像分離処理の実行後に出力34(図3参照)され、且つ、モニタ20(図4)の右下側に表示される。誘導された照明画像はモニタ20の右下側に表示される。
The material image derived from the image selected by the action of the exemplary separation system is output 34 (see FIG. 3) after the image separation process by the
本発明の特徴構成にしたがうと、画像をトリミングするという選択項目は、ユーザーが選択した画像をトリミングし、それによって全画像の一部を処理できるようにする。パラメータを表示するという選択項目は、選択した画像ファイル18に関連したパラメータを表示する。各画像ファイル18のパラメータは、対応する画像ファイル18に関連したパラメータデータファイルに保存することが可能であり、且つ、例えば大域的特徴抽出入力29のような、関連した画像ファイル18に描かれた画像の処理に関連するいかなるパラメーターをも含み得る。パラメータは、例えば空間スペクトル演算子の生成における、例えばCPU12によるピクセル解析用の変数のような画像処理に関連したいかなるデータ、及び、屋内、屋外、建物、緑色の草を有する芝生、花盛りの葉を備えた木々等のような画像の本質に関連した情報のようなドメイン知識を含み得る。
In accordance with the features of the present invention, the option to crop an image allows the user to crop the selected image and thereby process a portion of the entire image. The selection item “display parameter” displays a parameter related to the selected
選択項目表示の下には、ソルバー30として使用可能な各最適化関数のリストと、制約条件ビルダー26の制約条件生成プログラムライブラリに含まれた各制約条件生成プログラムの更なるリストとが在る。ユーザーは所望の数学的操作及び選択した画像に課されるべき一つ又はそれ以上の制約条件を選択する。処理されるべき画像、課されるべき制約条件ならびに実行されるべき数学的操作の選択後、ユーザーは分離するという表示をクリックして画像分離処理を開始することができる。
Below the selection item display is a list of each optimization function that can be used as the
画像分離処理を開始次第、前記サービスプロバイダ24は、選択した制約条件に対して制約条件生成ソフトウェアモジュールを検索して選択した制約条件によって使用される空間スペクトル演算子を識別する。サービスプロバイダ24によってまだ保存されていないいかなる空間スペクトル演算子も画像を分離するためにオペレータブロック28によって生成され、サービスプロバイダ24はその結果を格納する。格納された結果は、選択された画像に対するいかなる次の操作においても、同一の関連したパラメータの組と共に再利用可能である。
Upon starting the image separation process, the
例えば選択した制約条件が同一照明制約条件である場合には、サービスプロバイダ24は、選択した画像に対しC型トークン、B型トークン、トークンマップを識別する。C型トークンはC型トークン化ブロック35によって生成された。サービスプロバイダ24はオペレータブロック28を操作して同一照明制約条件によって規定された残りの演算子を生成する。
For example, if the selected constraint is the same lighting constraint, the
次に図5aを参照すると、本発明の特徴構成にしたがって図2aの画像ファイルでC型トークン領域を生成するためのフローチャートを示している。C型トークンは、図5aのステップを用い、C型トークン化ブロック35によって画像内において迅速に識別され得る。次にオペレータブロック28は記載のとおりC型トークンを解析して処理し、選択した制約条件によって規定された時にB型トークンを組立てる。
Referring now to FIG. 5a, there is shown a flowchart for generating a C-type token area with the image file of FIG. 2a in accordance with the feature configuration of the present invention. C-type tokens can be quickly identified in the image by C-
図5aのルーチンを実行する前に、CPU12は原画像ファイル18に描かれた画像をフィルタ処理するように作用できる。前記フィルタは、例えばテクスチャ(のある)物質によって生じた異なる反射率のパターンを画像内におけるテクスチャ領域のスペクトル及び空間特性を捕らえる同種画像に変換するために、画像テクスチャフィルタを含んでもよい。一つの画像テクスチャ内においてB型トークンの識別は困難かもしれない。テクスチャ物質は、例えば定義特性として表面化する一つ以上の反射機能を有する物質を含んでいる。例えば、前記定義特性は、テクスチャが画像のテクスチャ領域内のいずれか選択したいかなるパッチ又は領域内においても特定の色分布を表示するような、テクスチャ内の色の1パターンであり得る。
Prior to executing the routine of FIG. 5 a, the
多くの事例において、画像の大部分が均一に色づけされた対象物を含んでいるので、テクスチャフィルタは入力画像の部分にのみ必要としてもよい。したがって、テクスチャフィルタの適用前に、均一色の領域を識別してマスクを取ることが有用である。テクスチャフィルタは、次にテクスチャ物質が現れるであろう領域にのみ用いられる。テクスチャ領域を識別するためのアルゴリズムの一例を以下に示す。
1)N−バンドカラー値(例えばRGB)についてC型トークン化を実行し、トークン結果を領域マップR、ここで、当該領域マップ内の各ピクセルはそれの属するトークンのトークンIDを有している(図5aの記載参照)マップに保存する。
2)領域マップRについてメディアンフィルタ(例えば、各ピクセルP_ijがP_ij周囲の7×7ボックスのメディアントークンIDによって置き換えられる)を実行する。結果をR−メディアンに保存する。
3)原画像についてフィルタを実行し、各カラーバンドに対し、各ピクセル周囲のボックス(例えば7×7)内におけるピクセルの標準偏差を計算する。結果をSに入力する。
4)S内の各ピクセルに対し、各カラーバンドに対して算出した標準偏差を推定ノイズモデル値で割る。ノイズモデルの一例は、Sn=A*maxValue+B*pixelValueであり、ここで、maxValueは最大可能なカラーバンド値であり、pixelValueは特定のバンドの強度(intensity)であり、及び、AとBは画像システムに対して実験的に決定された定数である(例えばA=0.001及びB=0.06が典型的である)。このステップは、標準偏差を各カラーバンドに対する規格化偏差に変換する。その結果をSnに保存する。
5)Sn内の各ピクセルに対し、全Nカラーバンドに対する規格化偏差の自乗を足し合わせ、その結果の平方根をとって、バンドの数Nで割って偏差値D_ijを生成する。結果として得られた偏差値D_ijを閾値(例えば1.0)と比較し、当該閾値よりも高い偏差値を有するピクセルに1を割り当てる、そうでなければピクセルに0を割り当てる。結果をテクスチャマスク画像Tに保存する。
6)T内の各ピクセルに対し、テクスチャマスク値がT_ij=1であり、且つ、メディアン領域マップR−median_ij内に於いて与えられたIDを有するトークン領域のシードサイズが閾値よりも低い場合(例えば<4)、ピクセルをテクスチャピクセルとして標識付ける。そうでなければ、同種ピクセルとして標識付ける。結果をテクスチャマスクTmaskに保存する。
In many cases, the texture filter may be needed only for the portion of the input image, since most of the image contains objects that are uniformly colored. Therefore, it is useful to identify and mask a uniform color area before applying the texture filter. The texture filter is only used for areas where the texture material will appear next. An example of an algorithm for identifying a texture region is shown below.
1) Perform C-type tokenization on N-band color values (eg RGB) and use token result as region map R, where each pixel in the region map has the token ID of the token to which it belongs (Refer to the description in FIG. 5a) Save to map.
2) Perform a median filter (eg, each pixel P_ij is replaced by a 7 × 7 box median token ID around P_ij) on the region map R. Save results to R-median.
3) Perform a filter on the original image and calculate for each color band the standard deviation of the pixels in a box (eg 7 × 7) around each pixel. Enter the result in S.
4) For each pixel in S, divide the standard deviation calculated for each color band by the estimated noise model value. An example of a noise model is Sn = A * maxValue + B * pixelValue, where maxValue is the maximum possible color band value, pixelValue is the intensity of a particular band, and A and B are images Constants determined experimentally for the system (eg, A = 0.001 and B = 0.06 are typical). This step converts the standard deviation into a normalized deviation for each color band. The result is stored in Sn.
5) For each pixel in Sn, add the squares of the standardized deviations for all N color bands, take the square root of the result, and divide by the number N of bands to generate the deviation value D_ij. The resulting deviation value D_ij is compared with a threshold value (eg 1.0) and 1 is assigned to pixels having a deviation value higher than the threshold value, otherwise 0 is assigned to the pixel. The result is stored in the texture mask image T.
6) For each pixel in T, if the texture mask value is T_ij = 1 and the seed size of the token region with the given ID in the median region map R-media_ij is lower than the threshold ( For example <4), label the pixel as a texture pixel. Otherwise, it is labeled as a homogeneous pixel. The result is stored in the texture mask Tmask.
上記アルゴリズムの結果はマスク、つまり原画像ファイル18のサイズ(n,m)の配列であるTmaskである。値1を有する配列において同一のTmaskロケーション(位置)を有するピクセル(p(n,m))は、テクスチャ物質に対応する画像領域の一部として取り扱われ、且つ、値0を有する同一のTmask配列位置を備えたピクセルは、均一色の物質に対応する画像領域の一部として取り扱われるべきである。
The result of the above algorithm is a mask, that is, Tmask which is an array of sizes (n, m) of the
CPU12は、テクスチャを扱ういかなる公知の方法、例えばローズフィルタバンク(Laws filter bank)、又はウェーブレット(wavelets)(例えば、非特許文献1、2参照)等を実装するソフトウェアモジュールを実行することが可能である。
The
本発明の一つの模範的実施形態では、C型トークンが、画像の各ピクセルに対する(又は、好ましくは、テクスチャを含むものとして識別された領域内の画像のピクセルに対する)輝度ヒストグラム表現を用いることによって生じる。輝度ヒストグラムを用いることによって生じたC型トークンは次に、B型トークンを生じるために用いられる。画像出力テクスチャフィルタ内の各ピクセルに対する輝度ヒストグラム表現が以下のアルゴリズムを用いて生成可能である。
A)Tmask配列(n,m)内の全メモリアドレス/インデックスを通りループする。
B)各メモリにおいて、Tmask配列のアドレス/インデックスが、各位置での値が1か0かを決定する。
C)Tmaskのメモリアドレス/インデックスがテクスチャを示す値1を有する場合には、
a.該当する画像ファイル18p(n,m)内の該当するメモリアドレス/インデックスを開き、そのメモリアドレス/インデックスにアクセスする;
b.データを書き込むためにそのメモリアドレス/インデックスを開く;
c.N8−ビン ヒストグラムをゼロに初期化し、各カラーバンドについては1つに初期化する;
d.pの近傍内の各ピクセルq(例えば、11×11ピクセル配列)に対して:
qの各Nカラー値Cn(例えば、各カラー値が0−255の間で設定されるRGB)に対して;
(i)Nカラー値が0と31の間にある場合には、次にカラーNの8−ビン ヒストグラムにおける最初のビンをインクリメントする;
(ii)Nカラー値が32と64の間にある場合には、次にカラーNの8−ビン ヒストグラムにおける二番目のビンをインクリメントする;
(iii)Nカラー値が65と97の間にある場合には、次にカラーNの8−ビン ヒストグラムにおける三番目のビンをインクリメントする;
(iv)Nカラー値が98と130の間にある場合には、次にカラーNの8−ビン ヒストグラムにおける四番目のビンをインクリメントする;
(v)Nカラー値が131と163の間にある場合には、次にカラーNの8−ビン ヒストグラムにおける五番目のビンをインクリメントする;
(vi)Nカラー値が164と196の間にある場合には、次にカラーNの8−ビン ヒストグラムにおける六番目のビンをインクリメントする;
(vii)Nカラー値が197と229の間にある場合には、次にカラーNの8−ビン ヒストグラムにおける七番目のビンをインクリメントする;
(viii)Nカラー値が230と255の間にある場合には、次にカラーNの8−ビン ヒストグラムにおける八番目のビンをインクリメントする;
e.N8−ビン ヒストグラム値を互いに繋いで、8×N要素ベクトルを有する一つの輝度(intensity)ヒストグラムにする;
f.8×Nエレメントベクトルを、画像ファイル配列p(n,m)内の対応するピクセルpへ代入する;
g.現在の又は次のメモリアドレス/インデックスが最後の/Tmask(n,m)でなければ、次にTmask(n,m)配列内の次のメモリアドレス/インデックスに移ってステップBを実行する;
h.現在のアドレス/インデックスが最後の/Tmask(n,m)に等しい場合には、次にTmask(n,m)配列を通るループをやめる。
D)メモリアドレス/インデックスが値0を有する場合には:
(i)現在のアドレス/インデックスがTmask(n,m)配列内の最後の要素でなければ、次にTmask(n,m)配列内の次のアドレス/インデックスに移り、ステップBを実行する;
(ii)現在のアドレス/インデックス位置がTmask(n,m)配列内の最後の要素である場合には、次にTmask(n,m)配列を通るループをやめる。
In one exemplary embodiment of the present invention, the C-type token uses a luminance histogram representation for each pixel of the image (or preferably for the pixels of the image in the region identified as containing texture). Arise. The C-type token generated by using the luminance histogram is then used to generate a B-type token. A luminance histogram representation for each pixel in the image output texture filter can be generated using the following algorithm.
A) Loop through all memory addresses / indexes in Tmask array (n, m).
B) In each memory, the address / index of the Tmask array determines whether the value at each position is 1 or 0.
C) If the memory address / index of Tmask has a
a. Open the corresponding memory address / index in the corresponding image file 18p (n, m) and access the memory address / index;
b. Open its memory address / index to write data;
c. Initialize the N8-bin histogram to zero and one for each color band;
d. For each pixel q in the neighborhood of p (eg, an 11 × 11 pixel array):
For each N color value Cn of q (e.g., RGB where each color value is set between 0-255);
(I) If the N color value is between 0 and 31, then increment the first bin in the 8-bin histogram for color N;
(Ii) if the N color value is between 32 and 64, then increment the second bin in the 8-bin histogram for color N;
(Iii) If the N color value is between 65 and 97, then increment the third bin in the 8-bin histogram for color N;
(Iv) If the N color value is between 98 and 130, then increment the fourth bin in the 8-bin histogram for color N;
(V) If the N color value is between 131 and 163, then increment the fifth bin in the 8-bin histogram for color N;
(Vi) If the N color value is between 164 and 196, then increment the sixth bin in the 8-bin histogram for color N;
(Vii) If the N color value is between 197 and 229, then increment the seventh bin in the 8-bin histogram for color N;
(Viii) If the N color value is between 230 and 255, then increment the eighth bin in the 8-bin histogram for color N;
e. N8-bin Histogram values are joined together to form an intensity histogram with 8 × N element vectors;
f. Assign an 8 × N element vector to the corresponding pixel p in the image file array p (n, m);
g. If the current or next memory address / index is not the last / Tmask (n, m), then move to the next memory address / index in the Tmask (n, m) array and execute step B;
h. If the current address / index is equal to the last / Tmask (n, m), then stop the loop through the Tmask (n, m) array.
D) If the memory address / index has the value 0:
(I) If the current address / index is not the last element in the Tmask (n, m) array, then move to the next address / index in the Tmask (n, m) array and perform step B;
(Ii) If the current address / index position is the last element in the Tmask (n, m) array, then stop the loop through the Tmask (n, m) array.
画像のテクスチャ領域における各ピクセルを、カラーバンドの組、例えばRGBから、フィルタ出力データの組を含む輝度ヒストグラムベクトル、例えば8×N連結に変換後、画像は、RGBカラーバンド値の代わりに用いられた8×N要素輝度ヒストグラムベクトルとC型トークンを関連付けることについて、元のカラーバンド画像と全く同様に取り扱われる。 After each pixel in the texture region of the image is converted from a set of color bands, eg RGB, to a luminance histogram vector containing a set of filter output data, eg 8 × N concatenation, the image is used instead of RGB color band values. Further, associating the 8 × N element luminance histogram vector with the C-type token is handled in the same manner as the original color band image.
図2bは画像ファイル18の左上側に11×11ピクセル配列を示している。図2bの11×11ピクセル配列は、上記の模範的なアルゴリズムにしたがい、配列の中央Zでピクセルp(6,6)を表示する輝度ヒストグラムを生成するために用いられている。実施例において、画像ファイル18内に描かれた画像内のチェッカーボードパターン内に11×11配列が存在すると仮定している。前記チェッカーボードパターンは、図示したように交互に並んだ赤、緑、青色ボックスのパターンを有している。したがって実施例のピクセルp(6,6)は、CPU12によって生じた該当するTmaskにおいて値1を有するであろう。
FIG. 2 b shows an 11 × 11 pixel array on the upper left side of the
実施例のアルゴリズムにしたがい、三つの8ビンヒストグラムがCPU12によって初期化され(図2c参照)、対象となるピクセルp(6,6)の各赤、緑、青色値を1つにする。次に11×11ピクセル配列が用いられて、三つのヒストグラムのbin(ビン)内における値を決定する。本実施例では11×11配列の左上側部分は、チェッカーボードパターンの赤色ボックスであり、部分(p(1,1)からp(5,5))内の各ピクセルは、(123,0,0)のRGB値を有している。右上側部分は緑であり、したがって部分(p(1,7)からp(5,11))内のピクセルは、ぞれぞれ(0,123,0)のRGB値を有している。左下側部分は青色ボックスであり、ピクセルp(7,1)からp(11,5)のそれぞれは(0,0,123)のRGB値を有している。最後に実施例の右下側部分は、再度赤色部分であり、赤、緑、青を繰り返しているチェッカーボードパターン内において、ピクセルp(7,7)からp(11,11)の各々は、(123,0,0)のRGB値を有している。 According to the algorithm of the embodiment, three 8-bin histograms are initialized by the CPU 12 (see FIG. 2c), and each target pixel p (6, 6) has one red, green, and blue value. An 11 × 11 pixel array is then used to determine the values in the bins of the three histograms. Upper left portion of the present embodiment in 11 × 11 array, a red box checkerboard pattern, each pixel in the portion (p (1, 1) p (5,5) from) is (123,0, 0) RGB value. The upper right part is green, so the pixels in the part (p (1,7) to p (5,11)) each have an RGB value of (0,123,0). The lower left part is a blue box, and each of pixels p (7,1) to p (11,5) has an RGB value of (0,0,123). Finally, the lower right portion of the embodiment is a red portion again. In the checkerboard pattern in which red, green, and blue are repeated, each of pixels p (7,7) to p (11,11) It has an RGB value of (123,0,0).
図2bに示すように、赤色象限(p(1,1)からp(5,5))、緑色象限(p(1,7)からp(5,11))、青色象限(p(7,1)からp(11,5))、及び赤色象限(p(7,7)からp(11,11))の間にある1ピクセル(1)厚みの十字型境界線、又は、p(6,1)からp(6、m)の間のいかなるピクセル、及び、p(n,6)からp(11,6)の間のいかなるピクセルも、(123,123,123)のRGB値を有することができる。中央Zのピクセルp(6,6)も(123,123,123)のRGB値を有することができる。 As shown in FIG. 2b, the red quadrant (p (1,1) to p (5,5)), the green quadrant (p (1,7) to p (5,11)), the blue quadrant (p (7, 1) to p (11,5)) and red quadrant (p (7,7) to p (11,11)) 1 pixel (1) thick cross border or p (6 , 1) to p (6, m) and any pixel between p (n, 6) to p (11,6) has an RGB value of (123,123,123) be able to. The center Z pixel p (6,6) can also have an RGB value of (123,123,123).
次に、ピクセルZを中央に有する11×11ピクセルボックス301が用いられて、ピクセルZのRGBカラーバンド値のヒストグラム表現によってピクセルZの値を以下に模範的に記載するステップを用いて決定する。図2bに示すように、p(1,1)は、赤色の存在と緑色及び青色の不在を示すRGB値(123,0,0)を有している。p(1,1)の赤色値は123なので、赤色8ビンヒストグラム内の当該数値に対応するビンは、図2cに示すようにインクリメントされるであろう、つまり、赤色8−ビン(bin)ヒストグラム内の四番目のビン(bin)がインクリメントされるであろう。この処理は、ピクセルボックス301内のp(n,m)に到達するまで繰り返される。この時までに、図2cに示すように、3つの8−ビンヒストグラムは異なる値で充てんされ得る。これらの値は次に互いに連結されて一つの8×3要素ベクトルになり、図2bの画像ファイル18内に描かれた11×11ピクセル配列内のピクセルZに代入され得る。
Next, an 11 × 11
したがって上記の模範的なアルゴリズムと図2bに記載の画像18内に示した11×11ピクセルボックス301内のチェッカーボードパターンにしたがい、3つの8−ビンヒストグラムは次のように充てんされる。
Thus, according to the above exemplary algorithm and the checkerboard pattern in the 11 × 11
赤色8−ビンヒストグラムにおいて、四番目のビンは値71を有するであろう(2つの赤色象限の25ピクセルにおける98と130間の赤色値の繰り返し量と、p(6,1)からp(6,m)の間の11ピクセルにおける98と130間の赤色値の繰り返し量と、p(n,6)からp(11,6)の間の10ピクセルにおける98と130間の赤色値の繰り返し量とを足すと、25+25+11+10=71が結果として得られる)。同様の計算で、値ゼロを有する全てのピクセルで赤を表示するために、一番目のビンは値50を有するであろう。赤色8−ビンヒストグラム内における他の全てのビンは、値0を有するだろう。したがって、赤色8−ビンヒストグラムは[50,0,0,71,0,0,0,0]となるであろう。
In the red 8-bin histogram, the fourth bin will have the value 71 (repeated amount of red value between 98 and 130 in 25 pixels in two red quadrants, and p (6,1) to p (6 , M) and the red value repeat amount between 98 and 130 in 11 pixels, and the red value repeat amount between 98 and 130 in 10 pixels between p (n, 6) and p (11, 6). And results in 25 + 25 + 11 + 10 = 71). In a similar calculation, the first bin will have the
緑色8−ビンヒストグラムにおいて、四番目のビンは値46を有するであろう(緑色象限の25ピクセルにおける98と130間の緑色値の繰り返し量と、p(6,1)からp(6,m)間の11ピクセルにおける98と130間の緑色値の繰り返し量と、p(n,6)からp(11,6)間の10ピクセルにおける98と130間の緑色値の繰り返し量とを足すと、25+11+10=46が結果として得られる)。一番目のビンは値75を有する(緑色のゼロ値のために)。緑色8−ビンヒストグラムにおける他の全てのビンは、値0を有するだろう。したがって、緑色8−ビンヒストグラムは[75,0,0,46,0,0,0,0]となるであろう。
In the green 8-bin histogram, the fourth bin will have the value 46 (the repeat amount of the green value between 98 and 130 in the 25 pixels of the green quadrant and p (6,1) to p (6, m ) And the repetition amount of the green value between 98 and 130 in 11 pixels and the repetition amount of the green value between 98 and 130 in 10 pixels between p (n, 6) and p (11,6). 25 + 11 + 10 = 46 as a result). The first bin has the value 75 (for a green zero value). All other bins in the green 8-bin histogram will have the
青色8−ビンヒストグラムにおいて、四番目のビンは値46を有するであろう(青色現象の25ピクセルにおける98と130間の青色値の繰り返し量と、p(6,1)からp(6,m)間の11ピクセルにおける98と130間の青色値の繰り返し量と、p(n,6)からp(11,6)間の10ピクセルにおける98と130間の青色値の繰り返し量とを足すと、25+11+10=46が結果として得られる)。再度ではあるが、一番目のビンは値75を有する。青色8−ビンヒストグラムにおける他の全てのビンは、値0を有するだろう。したがって、青色8−ビンヒストグラムは[75,0,0,46,0,0,0,0]となるであろう。
In the blue 8-bin histogram, the fourth bin will have the value 46 (the repeat amount of the blue value between 98 and 130 in 25 pixels of the blue phenomenon and p (6,1) to p (6, m ) And the repetition amount of the blue value between 98 and 130 in 11 pixels and the repetition amount of the blue value between 98 and 130 in 10 pixels between p (n, 6) and p (11,6). 25 + 11 + 10 = 46 as a result). Again, the first bin has the
上記アルゴリズムの結果として、各8−ビンヒストグラムは、本実施例では3つであるが、互いに繋げられて一つの8×3要素ベクトルになる。これにより、このベクトルは[50,0,0,71,0,0,0,0,75,0,0,46,0,0,0,0,75,0,0,46,0,0,0,0]となる。 As a result of the above algorithm, the 8-bin histogram, but is three in this embodiment, the 8 × 3-element vector of one being linked to each other. This makes this vector [50,0,0,71,0,0,0,0,75,0,0,46,0,0,0,0,75,0,0,46,0,0 , 0, 0].
次に、上記ベクトルは11×11配列の中央Zにp(6,6)で割り当てられ、これによって、当初は(123,123,123)であったピクセルp(6,6)のRGB値を、[50,0,0,71,0,0,0,0,75,0,0,46,0,0,0,0,75,0,0,46,0,0,0,0]として規定された輝度ヒストグラムで置き換える。 Next, the vector is assigned to the center Z of the 11 × 11 array at p (6,6), so that the RGB value of pixel p (6,6), which was originally (123,123,123), is assigned. , [50 , 0 , 0 , 71 , 0 , 0 , 0 , 0 , 75 , 0 , 0 , 46 , 0 , 0 , 0 , 0 , 75 , 0 , 0 , 46 , 0 , 0 , 0 , 0 ] Replace with the luminance histogram defined as.
1次の一様な、同種(homogeneous)C型トークンは、画像の隣接するピクセル間の一つのロバストカラー測定を含んでいる。図5aの識別ルーチンの開始では、(C型トークン化ブロック35として実行する)CPU12がメモリ内の領域マップをセットアップする。ステップ100では、CPU12は当該領域マップを消去して、領域IDを割り当て、初期には1で設定する。ピクセル数に対応するルーチンの繰り返しはi=0で設定され、且つ、トークンを決定するシードとして用いるピクセル配列の数は初期値N=Nstartで設定される。Nstartは0より大きないかなる整数であっても良く、例えば11又は15ピクセルで設定することが可能である。
The primary uniform, homogeneous C-type token includes a single robust color measurement between adjacent pixels of the image. At the start of the identification routine of FIG. 5a, the CPU 12 (running as a C-type tokenization block 35) sets up an area map in memory. In
ステップ102ではシードテストを開始する。CPU12は最初のピクセル、例えば画像ファイル18の第1N×Nサンプルの左上角にあるピクセルである、i=(1,1)を選択する(図2a参照)。当該ピクセルは次に、選択したピクセルが良好なシードの一部であるかどうか決定するために決定ブロック104においてテストする。当該テストは、選択したピクセルのカラー値を、例えばN×N配列の、シードとしての予め選択した多くのその近隣ピクセルのカラー値と比較することを含む。カラー値比較は、ピクセルの多重カラーバンド値(本実施例ではRGB)又は、上記のように、当該画像がテクスチャ領域をフィルタリングされる場合には、ピクセルのフィルタ出力データ輝度ヒストグラム表現に関連し得る。前記比較が、シード内のピクセルに対して概ね等しい値(例えば、RGB値の記録装置のノイズレベル以内)に結果としてならない場合には、次のN×Nシードサンプルに対して、CPU12は値i、例えばi=(1,2)をインクリメントし(ステップ106)、次にi=imaxかどうかを決定するためにテストする(決定ブロック108)。
In
ピクセル値がimaxである場合には、より良い結果を得るためにシードサイズの減少を決定するための閾値として選択された値、シードサイズNは、例えばN=15からN=12へ減少される(ステップ110)。本発明の模範的な実施形態では、imaxはi=(n,m)に設定することが可能である。このようにして図5aのルーチンは、減じられたNの値に対してルーチンを繰り返す前に、最初のNの値で全画像をパース(構文解析)する。 If the pixel value is i max , the value selected as the threshold for determining the seed size reduction for better results, the seed size N is reduced, for example from N = 15 to N = 12. (Step 110). In an exemplary embodiment of the invention, i max can be set to i = (n, m). Thus, the routine of FIG. 5a parses the entire image with the first N value before repeating the routine for the reduced N value.
シードサイズの減少後、ルーチンはステップ102に戻り、トークンシードのテストを続ける。Nstop値(例えばN=2)もステップ110でチェックされ、当該解析が完了したかどうか決定する。Nの値がNstopにある場合には、CPU12は画像ピクセル配列の検査を完了してルーチンを出る。
After reducing the seed size, the routine returns to step 102 and continues testing the token seed. The N stop value (eg, N = 2) is also checked at
iの値がimaxよりも小さく、且つNがNstopよりも大きい場合には、ルーチンはステップ102に戻り、トークンシードのテストを続ける。 If the value of i is less than i max and N is greater than N stop , the routine returns to step 102 and continues to test the token seed.
良好なシード(概ね等しいピクセル値を有するN×N配列)が見つかった場合には(ブロック104)、シードからトークンを成長させる。ステップ112では、CPU12はシードから待ち行列へピクセルを加える。待ち行列内の全てのピクセルは、領域マップ内の現在の領域IDによって標識付けされる。CPU12は次に待ち行列が空かどうか調査する(決定ブロック114)。待ち行列が空の場合には、ルーチンはステップ116へ進む。
If a good seed (N × N array with approximately equal pixel values) is found (block 104), a token is grown from the seed. In
ステップ116では、CPU12はフロントピクセルを待ち行列から消去し、ステップ118へ進む。ステップ118では、CPU12は対象となるピクセル周辺の、対象となるピクセルとカラー値において概ね等しい区域である、「良好な」区域を、現在の領域IDで標識付ける。標識付けした全ての良好な区域が領域マップ内に置かれ、且つ待ち行列へ加えられる。CPU12は次に決定ブロック114へ戻る。待ち行列が空になるまでステップ114、116、118のルーチンが繰り返される。その時、現在の領域内にトークンを形成している全てのピクセルは識別されて、C型トークンとして領域マップ内において標識付けされる。ピクセルが輝度ヒストグラム表現を含む場合には、トークンはCT型として識別され得る。
In
待ち行列が空になると、CPU12はステップ120へ進む。ステップ120では、CPU12は次のトークンの識別と共に用いるために領域IDをインクリメントする。CPU12は次に、新しい現在のトークン領域についてルーチンを繰り返すためにステップ106へ戻る。
When the queue is empty, the
図5aのフローチャートにおけるステップ110のN=Nstopに至る、又は画像に一致する領域マップが完成すると、ルーチンはトークン構築作業を完了する。図5bは、当該トークンの識別において一例として用いられる原画像である。当該画像は、青、陰のかかった青、ならびに、ティール、影のかかったティールの領域を示している。図5cは、例えば図5aのルーチンの実行によって識別されたような(C型トークン)、領域マップに対応するトークン領域を図5bの画像について示している。前記トークン領域はカラーコード化されて、画像の自然色(フルカラー)青とティール領域の間の半影領域、及び、色付けられた領域の陰影を含む、図5bの画像のトークン作成を表示する。
When an area map is reached that reaches N = N stop in
C型トークン化ブロック35による図5aのルーチンが完了すると、サービスプロバイダ24は選択した画像のC型トークン領域情報を保存する。識別したC型トークンからB型トークンを発生するいかなる工程をも開始する前にオペレータブロック28は、識別した各C型トークンを試験して、各C型トークンが一つの物質を含んでいることを明確にする。各C型トークンが、画像の隣接する複数のピクセル間に一つのロバストカラー測定を有する画像領域を含む限りには、トークンが物質境界を越えて成長してもよい。
When the routine of FIG. 5a by the C-
典型的に異なる複数の物質が一緒になって、陰影境界にしばしば位置するネック領域を通る一つのC型トークンに、又は、類似の色相であるが異なる輝度を有する異なる複数の物質を渡って変化する照明を有する領域になる。ネックピクセルは、隣り合うピクセルの特性を試験することによって識別され得る。一つのピクセルが、同一トークン内に存在しない向かい合った二つの隣接ピクセルを有し、且つ、同一トークン内に存在する向かい合った二つの隣接ピクセルを有する場合には、ピクセルはネックピクセルとして規定される。 Typically, different materials together to change across a single C-type token that passes through the neck region often located at the shadow boundary, or across different materials with similar hue but different brightness It becomes an area having illumination. Neck pixels can be identified by testing the characteristics of neighboring pixels. A pixel is defined as a neck pixel if it has two adjacent pixels that face each other that do not exist in the same token, and two adjacent pixels that exist in the same token.
図6はC型トークンに対するネック試験のフローチャートを示す。ステップ122では、CPU12は識別したトークンの各ピクセルを試験して、試験下にあるピクセルがネックを形成するかどうか決定する。図6のルーチンは、図5aのルーチンの実施中に特定のトークンが識別された直後に、サブルーチンとして実行することが可能である。ネックとして識別された全てのピクセルは、「成長不能」として標識付けられる。決定ブロック124では、CPU12はピクセルのいずれかが標識付けられたかどうか決定する。
FIG. 6 shows a flowchart of the neck test for the C-type token. In
(ネックピクセルが)無い場合には、CPU12は図6のルーチンを出て、図5aのルーチンへ戻る(ステップ126)。
If there is no (neck pixel), the
(ネックピクセルが)有る場合には、CPU12はステップ128に進み、図5aのルーチンに従って、シードサイズと領域IDのカウントを変更することなく、現在のトークンの識別されていないピクセルの間から選択されたシード位置からトークンを再成長するように演算する。再成長処理の間、CPU12は、以前成長不能として識別したいかなるピクセルも含有しない。トークンを再成長させた後、以前識別されたピクセルは識別がとられ、その結果、他のトークンがその中に成長し得る。
If there are (neck pixels), the
以前識別したピクセルのないトークンの再成長に引き続き、CPU12はステップ122に戻って新しく再成長したトークンをテストする。
Following the regrowth of the previously identified token without pixels,
ネックテストは、物質境界を横断するC型トークンを識別し、且つ、B型トークンを作り出すために用いるのに最適な単一物質C型トークンをもたらすために識別したトークンを再成長させる。図5dは、本発明の特徴構成にしたがい、図5cのC型トークンから生じたB型トークンを表している。本発明は、C型トークンからB型トークンを構築するための、ピクセル特性解析の幾つかの模範的な技術をもたらす。一つの模範的な技術は、任意境界除去を含んでいる。任意境界除去技術は、C型トークンがピクセルのNカラーバンド値(本実施例ではRGB)を用いて生じたのであろうとなかろうと、又は、画像がフィルタ処理された場合には、ピクセルのフィルタ出力データ画像であろうとなかろうと、C型トークンに用いることが可能である。あらゆる特定のC型トークンにおける実際の境界が、トークンを生じるために用いられたシード位置の関数となり、したがって、それら境界は、幾らか任意となるであろう。各特定のトークンに対し、典型的に多くの潜在的なシード位置が存在し、その際、各潜在的シード位置は、様々なシードのピクセルにおけるカラー値間の記録装置のノイズ範囲内での違いにより、僅かに異なる境界及び空間的範囲を有するトークンを生じる。 The neck test identifies C-type tokens that cross material boundaries and regrows the identified tokens to yield a single material C-type token that is optimal for use in creating B-type tokens. FIG. 5d represents a B-type token resulting from the C-type token of FIG. 5c in accordance with a feature of the present invention. The present invention provides several exemplary techniques for pixel characterization for building B-type tokens from C-type tokens. One exemplary technique includes arbitrary boundary removal. Arbitrary border removal techniques, whether a C-type token was generated using the pixel's N color band values (RGB in this example ) or if the image was filtered, filtered output of the pixel Whether it is a data image or not, it can be used for C-type tokens. The actual boundaries in any particular C-type token will be a function of the seed position used to generate the token, and therefore the boundaries will be somewhat arbitrary. For each particular token, there are typically many potential seed positions, where each potential seed position is the difference within the recorder's noise range between the color values at the various seed pixels. Yields tokens with slightly different boundaries and spatial extents.
図7は、本発明の特徴構成にしたがい、任意境界除去技術によりB型トークンを構築するためのフローチャートである。ステップ200では、CPU12には、生じたC型トークンの組(Tc)と、図5aのルーチンによって生じたシードサイズ(S)と、図6のルーチンによって生じたネック除去が供給される。シードサイズはS=Smax、例えば、S=4ピクセルである。ステップ202では、各C型トークンと組Tc内のtcについて、CPU12はs1からsnの潜在的(ポテンシャル)シードの数(例えば50)を選択する。本実施例では、選択された各シードはトークン領域内出身の4×4ピクセル配列であり、当該配列のピクセルは(記録装置のノイズレベル内の)概ね等しい値を有している。
FIG. 7 is a flowchart for constructing a B-type token by an arbitrary boundary removal technique according to the characteristic configuration of the present invention. In
ステップ204では、CPU12は、図5aと図6のルーチンを用いることによって、組Tc内の各トークンtcのs1からsnである各シード位置から新しいC型トークンを成長させる。各トークンtcに対して新たに成長したトークンは、トークンrc1からrcnとして表示する。各トークンtcに対して新たに成長したトークンであるrc1からrcnは、一般的に元のC型トークンtcならびに互いに重なる。
In
ステップ206では、CPU12は、各トークンtcの新たに生じたトークンであるrc1からrcnをそれぞれ組み合わせるように作用する。結果として得られるのは、組Tc内の元の各トークンtcに対応する新しいトークンRtである。各新しいトークンRtは、対応する元のトークンtcから生じた、それぞれ重なるトークンrc1からrcnの全領域を含んでいる。それぞれ組み合わせられた新しいトークンRtを含む領域の合併は、それぞれが当該組の元のC型トークンよりも遥かに広範囲なトークンである。結果として得られる、組み合わせられた新しいトークンRtは結果として画像ファイル18の複数領域になり、各トークンRtのピクセル間における変化量の幅は元のC型トークンよりも遥かに広いにもかかわらず、構成成分ピクセル間の変化量の幅は依然として比較的平滑となるであろう。RtはB型トークンの限定した形である、Bab1として規定され、本発明の特徴構成にしたがい任意境界除去技術の第一段階(ステップ200〜206)によって生じたトークンを表示する。
In
ステップ208では、CPU12はステップ202〜206においてトークンの組Tcから生じた各Bab1型トークンを保存して、ステップ210へ進む。ステップ202〜206の実行によって生じたBab1型トークンは著しく重なってもよい。ステップ210では、CPU12は、各トークンサイズの特定の割合だけ互いに重なる、ステップ208で保存されたRtトークンを組み合わせるように作用する。例えば、30%の重なりは一般的に、異なる物質を含んでいる領域を組み合わせているフォールスポジティブマージをたとえあったとしても殆どもたらさないためには十分である。マージ(併合)したトークンの新しい組は依然として重なっているトークン、例えば、30%未満の重なりを有する前もって重なっているトークンを有してもよい。全てのマージが完了した後、CPU12はステップ212へ進む。
In
ステップ212では、CPU12は一つ以上のトークン内(二つの以上のトークンの重なり部分におけるもの)の全てのピクセルを認識する。各識別したピクセルは、画像の最大範囲を占めているトークンに割り当てられる。これにより、全ての重なっているトークンは全ての重なりを除去するように修正される。
In
ステップ214では、CPU12は(C型トークン化ブロック35又はオペレーションブロック28に従って)、今やBab2として表示される、最終的に合併され且つ修正されたトークンの組を保存して、次にルーチンを終了する。先に特筆したように、Bab2型トークンは、C型トークンがピクセルのNカラーバンド値(本実施例ではRGB)を用いて生じたのであろうと、画像がフィルタ処理された場合にはピクセルのフィルタ出力データ画像を用いて生じたのであろうと、いずれにせよ、C型トークンから生じたのである。
In
本発明にしたがう第2の模範的技術は、B型トークンを作り出すためにC型トークンを用いるための、隣接する平面トークンマージン法である。当該隣接する平面トークンマージン法は、画像が均一な色の領域を表示する場合に実行され得る、画像のテクスチャの無い領域に対するものである。最初に、互いに近くに在る複数のトークンを識別するためにトークングラフが用いられる。図8は、本発明の特徴構成にしたがい、トークンマップ情報を含む、トークングラフを作り出すためのフローチャートを示している。図5a及び図6のルーチンの実行によって生じたC型トークンの組Tcは、当該組Tcの、隣り合うトークンの対tc、tnを規定しているトークン間の最大距離Dmaxと、隣り合うトークン対の各トークンにおけるトークン周辺画素の最小数Pmin、及び、Dmax内に存在するように要求された、隣り合うトークン対の各トークンの、周辺画素(周辺ピクセル)(perimeter pixel)の最小小数Fminについて評価される。 A second exemplary technique according to the present invention is an adjacent planar token margin method for using C-type tokens to create B-type tokens. The adjacent planar token margin method is for areas without an image texture that can be performed when the image displays an area of uniform color. First, a token graph is used to identify multiple tokens that are close to each other. FIG. 8 shows a flow chart for creating a token graph including token map information according to the characteristic configuration of the present invention. The C-type token set T c generated by the execution of the routines of FIGS. 5a and 6 is the maximum distance D max between the tokens defining the pair of adjacent tokens t c and t n of the set T c. , The minimum number of token peripheral pixels P min in each token of adjacent token pairs, and the perimeter pixel of each token of adjacent token pairs that are required to be within D max ) For the smallest decimal number F min .
ステップ300では、CPU12はC型トークンの組Tc内でC型トークンtcを選択し、前記トークンの周辺を形成している選択されたtcのピクセルを識別する。決定ブロック302において、CPU12は周辺画素の数がPmin、例えば10ピクセルよりも小さいかどうか決定する。
In
そうである場合には、CPU12は決定ブロック304へ進んで、C型トークンの組Tc内にトークンtcが残っているかどうか決定する。そうである場合には、CPU12はステップ300へ戻り、そうでない場合には、CPU12はルーチンを終了する。
If so, the
そうでない場合には、CPU12はステップ308へ進む。ステップ308では、CPU12は、選択したトークンtcを包み込むためのマスクとして用いられる結合ボックスを生じる。前記結合ボックスは、全ての方向におい選択したトークンよりも大きな、少なくともDmaxとなるサイズに形成される。(例えば、非特許文献3に記載のような)公知の距離変換(distance transform)を実行して、選択したトークンtcの各周辺画素から含んでいる結合ボックス内の全ピクセルまでの距離を検出する。距離変換の結果は各々結合ボックスと同じサイズを有する二つのマップ、つまり、距離マップと最短距離ピクセルマップとを含んでいる。前記距離マップは、結合ボックスの各ピクセルから、選択したトークンtcの最近接周辺画素までのユークリッド距離を含んでいる。最短距離ピクセルマップは、例えば距離マップ内の各ピクセルに対し、いずれのピクセルがそれに最も近いかを識別する。
Otherwise, the
ステップ310では、CPU12は、ステップ308で生じた距離マップをスキャンして、前記結合ボックスのピクセルに対応するトークンを(図5aのルーチンによって生じた領域マップから)識別し、結合ボックスにおいてピクセルによって表現された全てのトークンの間から、距離Dmax以内にNcn個のピクセルを有する一つのトークンを識別し、ここで、NcnはPminよりも、且つ、各トークンのFmin *周辺画素よりも大きく、各トークンとtcとの間の平均距離は、結合ボックス内のピクセルに対応するトークンのうち最低である。これらの条件が満たされれば、各トークンは、実行できるトークン対tc,tnのうちtnと表示され、リンクLcnは稼動中と表示される。
In
ステップ312において、CPU12は相互リンクLcnも稼動中と表示されているかどうか決定するためにチェックし、それが稼動中と表示されている場合には、CPU12は、トークン対tc、tnが隣り合うトークン対であるという標識をつけて、トークングラフ内に保存する。前記相互リンクは、現在の評価のtnと表示されたトークンの評価におけるリンク状態を意味する。そのトークンをまだ評価しなければならない場合には、当該対には、次のトークンtnの評価においてリンクLcnが稼動中として確認されるまで、隣り合うトークン対であるという標識はつけない。CPU12は次に、決定ブロック304へ戻って組Tc内に別のトークンが存在するか否か決定する。
In
トークングラフが完成するとすぐに、CPU12は、図9のルーチンの実行において前記グラフ内に保存されたトークン対情報を使用する。図9は、本発明の特徴構成にしたがい、隣接する平面トークンマージン(併合)技術によってB型トークンを構築するためのフローチャートを示している。隣接する平面トークンマージン技術では、トークンの対が検査されて、二次元測定において対のトークン間に、カラー値の滑らかでコヒーレントな変化があるかどうか決定する。色変化が、例えば本発明の模範的な実施形態にしたがいRGB成分のような、各カラーチャンネルの平面表示に関して検査される。滑らかな変化は、平面の組(一つの色成分について一平面)が二つの隣接するトークンのピクセル値に対して良好にフィットする条件と規定する。つまり、二次元のシーンにおける色変化が概ね平坦である場合には、隣り合う複数のトークンは、同一の物質及びB型トークンと考えられる。
As soon as the token graph is complete, the
ステップ320では、CPU12はトークングラフからトークン対tc、tnを選択する。決定ブロック322では、CPU12は、トークンtc内の平均カラーが、トークンtc内の平均カラーと著しく異なっているかどうか決定する。当該差は、公知な統計的測定(例えば、非特許文献4参照)のz−スコアの関数であることができ、例えば3.0よりも大きなz−スコアであることが可能である。
In
トークン対の平均カラーが異なる場合には、CPU12は決定ブロック324へ進んでトークングラフ内に他にトークン対が存在するか否か決定する。存在する場合には、CPU12はステップ320に戻る。存在しなければ、CPU12はルーチンを終了する(ステップ326)。
If the average color of the token pair is different, the
平均カラーがz−スコアパラメータ内に存在する場合には、CPU12はステップ328へ進む。ステップ328では、CPU12は、例えば最小中央値二乗回帰(例えば、非特許文献5参照)のような数学的操作を実行して、平面をトークン対tc、tnのピクセルの各カラーチャンネル(本実施例ではRGB)に、行n及び列m(図2参照)の関数として適合させる、前記平面は次の式:
R=XRn+YRm+ZR G=XGn+YGm+ZG B=XBn+YBm+ZB
ここで、パラメータ値X、Y、Cは、CPU12の最小中央値二乗回帰操作によって決定される。
If the average color is present in the z-score parameter, the
R = X Rn + Y Rm + Z R G = X Gn + Y Gm + Z GB B = X Bn + Y Bm + Z B
Here, the parameter values X, Y, and C are determined by the minimum median square regression operation of the
平面適合操作(plane fitting operation)が完了するとすぐに、CPU12はステップ330へ進む。ステップ330では、CPU12はトークン対tc、tnの各トークンの各ピクセルを検査して、トークンの各ピクセルと最小中央値二乗回帰操作の式によって表した平面適合の間でz−スコアを計算する。前記対の各トークンのピクセルの少なくとも閾値割合(例えば80%)が最大z−スコア内(例えば0.75)に存在する場合には、次に隣り合うトークン対は、画像内の同一物質を表示するものとしてトークングラフ内で標識付けされる。ステップ330を完了した後、CPU12は決定ブロック324へ戻る。
As soon as the plane fitting operation is complete, the
図9のルーチンを終了するとすぐに、CPU12は、同一物質を表示する全てのトークン対についてトークングラフを検査する。CPU12は、例えばユニオンファインド(UNION-FIND)アルゴリズムのような公知の技術を実行して前記検査を成し遂げることが可能である(例えば、非特許文献6参照)。簡単な例として、7つのC型トークンの組、T1、T2、T3、T4、T5、T6、T7を仮定する。図9の実行の結果、(隣接平面解析の実行)、トークンT1とT2が同一物質として標識付けされ、且つ、トークンT1及びT3も同一物質として標識付けされたと仮定する。その上、さらにトークンT4及びT5が同一物質であると標識づけられ、且つ、トークンT5及びT6も同一物質として標識づけられた結果も表示する。ユニオンファインドアルゴリズムの実行結果は、したがって、トークン{T1,T2,T3}が単一物質から成る画像内の第1グループを形成し、トークン{T4,T5,T6}が単一物質から成る画像内の第2グループを形成し、トークン{T7}が単一物質から成る画像内の第3グループを形成することを示すであろう。グループ{T1,T2,T3}、{T4,T5,T6}及び{T7}は三つのB型トークンを形成する。
As soon as the routine of FIG. 9 is finished, the
B型トークンを作り出すためにC型トークンを用いるための、本発明にしたがう第3の模範的な技術は、局所的トークン解析である。局所的トークンアプローチは、画像ファイル18内に表示されたシーンのウィンドウ解析を用いてC型トークンを生じる。そのようなトークンは、Cw型トークンとして表示される。図10は、本発明の特徴構成にしたがう、局所的トークン解析技術によりCw型トークンを発生するためのフローチャートである。
A third exemplary technique according to the present invention for using C-type tokens to create B-type tokens is local token analysis. The local token approach uses a window analysis of the scene displayed in the
ステップ400では、CPU12は固定したサイズのウィンドウ、例えば33×33ピクセル配列マスクを、画像上のスキャン位置の予め選択した列上に置く。前記ウィンドウは、四角以外の形状をし得る。前記スキャン位置は、決まった量だけ、例えば1/2ウィンドウサイズだけ互いにずれており、且つ、全体として完全に画像を覆うように定められる。各スキャン位置でのピクセルのウィンドウ領域はCw型トークンを生じるが、各スキャン位置におけるウィンドウ内の全てのピクセルが各スキャン位置で発生するCw型トークン内に存在するわけではない。
In
各スキャン位置では(ステップ402)、CPU12はウィンドウ内のピクセルの関数として、平面の組、各カラーチャンネル(例えばRGB)の強度と一致するもの、及び、ウィンドウ内の開始点I0とI1によって特徴づけられる、RGB空間内のRGBラインの各々を適合(fit)させるように作用する。前記平面適合は、ウィンドウ内のピクセル強度の空間的表示をもたらし、且つ、ライン適合は、ウィンドウ内のピクセルの空間的表示をもたらす。
At each scan position (step 402), the
平面適合に対し、平面は次の式で規定する。
R=XRn+YRm+ZR G=XGn+YGm+ZG B=XBn+YBm+ZB
ここで、パラメータ値X、Y、及びCは、上記の最小中央値二乗回帰、特異値分解のような最小自乗推定値、又は、RANSAC(例えば、非特許文献7参照)のようなロバスト推定値、のような数学的操作をCPU12が実行することによって決定される。
For plane fitting, the plane is defined by the following formula.
R = X Rn + Y Rm + Z R G = X Gn + Y Gm + Z GB B = X Bn + Y Bm + Z B
Here, the parameter values X, Y, and C are the above least median square regression, least square estimated value such as singular value decomposition, or robust estimated value such as RANSAC (see, for example, Non-Patent Document 7). The
RGBライン適合について、ラインは次の式で規定する。
I(r,g,b)=I0(r,g,b)+t(I1(r,g,b)−I0(r,g,b))
ここで、パラメータtは0から1の間の値であって、平面適合を検出するために用いられたいずれかの数学的技術を用いることによってCPU12によって決定され得る。
For RGB line adaptation, the line is defined by the following equation:
I (r, g, b) = I 0 (r, g, b) + t (I 1 (r, g, b) -I 0 (r, g, b))
Here, the parameter t is a value between 0 and 1 and can be determined by the
各スキャン位置において、ステップ402を完了した後に、CPU12はステップ404において、各ウィンドウスキャン位置に対応する平面適合表現及びRGBライン表現の各々に関してウィンドウ内の各ピクセルを検査する。各ピクセルに対し、CPU12は、各既定した平面及びRGBラインに関するピクセルのエラーファクタを決定する。前記エラーファクタは、平面適合又はRGBライン適合のいずれかから出っ張っているピクセルの絶対距離に関連している。前記エラーファクタは、記録装置内に存在するノイズの関数、又は、ウィンドウ内の最大RGB値の割合、例えば1%であり得る。空間的平面適合又は空間的ライン適合のいずれかに関連するエラーファクタ内のいずれのピクセル距離も、各スキャン位置で発生したCw型トークンの正対応(inlier)と表示される。CPU12は、各スキャン位置で発生したCw型トークンに対し、全正対応ピクセルのリストも保存する。
After completing
各スキャン位置では、ステップ404の完了後に、CPU12はステップ406において作用し、ウィンドウ内の各正対応ピクセルにメンバーシップ値を割り当てる。前記メンバーシップ値は、平面適合又はRGBライン適合のいずれかからの正対応ピクセルの距離に基づくことができる。本発明の一つの模範的な実施形態では、前記メンバーシップ値はピクセルの正対応状態を決定するために用いられた距離の逆数である。二つ目の模範的な実施形態では、標準偏差を有するゼロ中心のガウス分布が実行され、正対応ピクセルのメンバーシップ値を計算する。
At each scan position, after completion of
全てのスキャン位置が処理されてCw型トークンを生じた後に、スキャン位置毎に、CPU12はトークンデータリストをコンパイルして保存するように作用する(ステップ408)。当該トークンデータリストは二つのリストを含んでいる。一つ目のリストは、画像ファイル18内の全ピクセルと、各ピクセルについて、それが正対応ピクセルとして標識付けされている各Cw型トークンの表示、ならびに対応するメンバーシップ値を表にする。二つ目のリストは、生じた全てのCw型トークンと、各トークンについて、各トークンの正対応ピクセルの表示、ならびに対応するメンバーシップ値を表にする。トークンデータリストをコンパイルして保存した後、CPU12はルーチンを終了する(ステップ410)。
After all scan positions have been processed to produce Cw- type tokens, for each scan position, the
図11は、本発明の特徴構成にしたがい、局所的トークン解析技術によって生じたCw型トークンからB型トークンを構築するためのフローチャートである。ステップ420では、CPU12は、図10のルーチンの実行により生じた隣接する又は重なり合う複数のCw型トークンの、空間的平面寸法及びスペクトルRGBラインのパラメータの類似度を計算する。重なり合うCw型トークン及び隣接するCw型トークンは、重なり合う又は隣接する(連続する)スキャン位置に該当するトークンとして規定され得る。類似度閾値は、比較される二つの重なり合う又は隣接するCw型トークン間の、各空間的平面寸法及びスペクトルRGBラインの差の割合として定められ得る。前記割合は、例えば画像ファイル18のシーンを記録するために用いられたカメラ14のノイズの関数であることができる。類似度閾値内に算出した類似度を有する、全ての重なり合う又は隣り合うCw型トークンの対がリストに載せられる。
FIG. 11 is a flowchart for constructing a B-type token from a Cw- type token generated by a local token analysis technique according to the characteristic configuration of the present invention. In
ステップ422では、CPU12は、類似度閾値内に算出した類似度を有する、重なり合う又は隣接するCw型トークン対のリストを、最小類似対に最も似ている順に分類する。ステップ424では、CPU12は、分類、及び類似度の程度ごとの対の標識付け順に、類似なトークン対をマージ(併合)する。各併合されたトークン対は、B型トークンとみなされるだろう。ステップ426では、CPU12はB型トークンのリストを保存して、ルーチンを終了する。
In
本発明にしたがう別の模範的技術では、フィルタレスポンス(filter response)、例えば二次微分フィルタレスポンスがCPU12によって実行され、均一な物質反射を有する画像の領域を識別する。前記識別された領域は、次にB型トークンを生じるために用いられる。フィルタレスポンスは、ピクセル値の畳み込みを実施することによって実行される。畳み込みとは、ピクセルの列にフィルタマスクを適用して当該列の中央のピクセルに対し応答関数値(function response value)を決定する数学的技術である。前記フィルタマスクは、例えばガウスカーネルのラプラシアン(LoG)のような数学的関数を表している。前記LoGフィルタは公知のフィルタであり、画像の各ピクセル位置での数学的関数算出値、つまり、各ピクセル位置での微分値に関連し且つ画像内の物質エッジを検出するために用いられる算出値を決定するのに用いられる。
In another exemplary technique in accordance with the present invention, a filter response, eg, a second derivative filter response, is performed by the
図12aは、画像内の強度変化の様子(intensity profile)と、各物質エッジ、物質の部分に渡って陰影を有する単一物質、及び、一定の照明下にある単一物質に対応する一次微分及び二次微分変化の様子を表している。微分は変化率の程度である。画像において、一次微分はカラーバンドの強度の変化率、例えば画像のピクセルからピクセルへの赤色変化率を測定している。二次微分は変化率の程度である、つまり、一次微分の変化率の程度である。図12aの縦の列Aは、画像内の物質エッジにおける、強度変化の様子、及び一次及び二次微分変化の様子を表している。縦列Aに示されるように、カラー強度変化の様子は、物質境界における物質強度の急な変化率を反映する一次微分値のスパイク波形となる、物質境界での急なエッジ変化の様子を形づくっている。これによって、二次微分値は、境界において一次微分ピークにしたがいゼロを横切る正の方向のピークと、次に一次微分ピークにしたがいゼロを横切りゼロに戻る負の方向のピークを経る。 FIG. 12a shows the intensity profile in the image and the single derivative corresponding to each material edge, a single material with a shadow over the material part, and a single material under constant illumination. And the state of the second derivative change. Differentiation is a measure of the rate of change. In an image, the first derivative measures the rate of change of the intensity of the color band, for example, the rate of red change from pixel to pixel of the image. The second derivative is the rate of change, that is, the rate of change of the first derivative. The vertical column A in FIG. 12a represents the intensity change and the first and second derivative changes at the material edge in the image. As shown in column A, the color intensity change shape is a spike waveform of the first derivative value reflecting the sudden change rate of the substance intensity at the substance boundary, and forms a sudden edge change at the substance boundary. Yes. As a result, the secondary differential value passes through a positive peak that crosses zero according to the primary differential peak at the boundary and a negative peak that crosses zero and then returns to zero according to the primary differential peak.
公知のLoGフィルタ技術では、ピクセル間で高い一次微分値、第一微分ピーク、又はゼロを横切る二次微分が、図12aの縦列Aを反映するような物質エッジのしるしとして用いられる。物質エッジの一次微分ピーク及びゼロを横切る二次微分とは対照的に、図12aの縦列B及びCは各々、強度変化の様子と、物質の一部に渡る陰影を有する単一物質、及び、一定照明下の単一物質に対応する一次微分及び二次微分の変化の様子を表している。縦列Bでは、画像の強度は、単一物質を表現しているピクセルを横断して落ちている半影に対応する段階的な陰影のエッジを経ている。したがって一次微分はゆっくりと上昇し、半影の段階的な変化に伴って下降し、且つ、二次微分は、一次微分値のゆっくりとした上昇ならびに下降の間ずっと比較的低い値を維持する。縦列Cに示すように、単一物質の照明の一定値は、一次微分及び二次微分のそれぞれについて、ピクセル間で一定の低い値に結果としてなる。 In known LoG filter techniques, a high first derivative value between pixels, a first derivative peak, or a second derivative across zero is used as an indicator of the material edge as reflecting column A in FIG. 12a. In contrast to the first derivative peak of the material edge and the second derivative across zero, columns B and C of FIG. 12a each show a change in intensity and a single material with a shadow over a portion of the material, and It shows how the first and second derivatives change corresponding to a single substance under constant illumination. In column B, the intensity of the image goes through a gradual shadow edge corresponding to a penumbra falling across the pixel representing a single substance. Thus, the first derivative rises slowly, falls with a penumbra gradual change, and the second derivative maintains a relatively low value throughout the slow rise and fall of the first derivative. As shown in column C, a single material illumination constant value results in a constant low value between pixels for each of the primary and secondary derivatives.
本発明の特徴構成にしたがうと、例えばLoGフィルタのような二次微分フィルタが新規に用いられて、例えば一様に低い二次微分値を有するピクセルを含む区画(patch)のような画像の領域を、それぞれ図12aの縦列B及びCに示したように識別する。模範的な実施形態では、各区画は予め選択したサイズから成る(例えば、3×3ピクセル配列、5×5ピクセル配列、又は7×7ピクセル配列のいずれか)。先に述べたように、一様な光の下での均一な物質反射の区画は、当該区画内の各ピクセル位置で低い二次微分値に結果としてなる、区画のピクセルを横断する概ね一定のカラー値を有するだろう。さらに、段階的な半影における一定の物質反射も区画のピクセル間で低い二次微分値となるだろう。 According to the characteristic configuration of the present invention, a second-order differential filter such as a LoG filter is newly used, for example, an image region such as a patch including pixels having uniformly low second-order differential values. Are respectively identified as shown in columns B and C of FIG. 12a. In the exemplary embodiment, each partition is of a preselected size (eg, either a 3 × 3 pixel array, a 5 × 5 pixel array, or a 7 × 7 pixel array). As mentioned earlier, a section of uniform material reflection under uniform light is approximately constant across the pixels of the section, resulting in a low second derivative at each pixel location within the section. Will have a color value. In addition, constant material reflections in gradual penumbras will also result in low second derivative values between the pixels of the plot.
したがって、低い二次微分値を有する全てのピクセルの区画の位置を確実にすることは、当該区画内に物質エッジが存在せず、且つ、当該区画の全ピクセルが同一の物質反射を有している尤度(likelihood)の高い兆候をもたらす。本発明は、均一な物質反射の尤度に関連したピクセルの区画間のいかなる関数反応、例えば二次微分値、三次微分値、又は他の、画像の強度変化の様子を表す曲率の程度をも熟慮するが、ここで強度変化の様子とは、(x,y,強度)空間における画像の形状である。 Thus, ensuring the location of all pixel compartments having a low second derivative value means that no material edge is present in the compartment and that all pixels in the compartment have the same material reflection. Bring high signs of likelihood. The present invention provides any functional response between pixel sections related to the likelihood of uniform material reflection, such as a second derivative, third derivative, or other degree of curvature that describes how the image changes in intensity. Considering this, the state of the intensity change is the shape of the image in the (x, y, intensity) space.
ラプラシアンフィルタは、画像内の一点における二次偏微分の和をもたらす。ラプラシアンフィルタはしたがって、画像のピクセルに対する二次微分値に比例した関数結果を確認するために実行され得る。画像Iのラプラシアンは次のように定義する。

画像内におけるノイズ及び小さな程度の変化の存在により、画像の一次及び二次微分解析は、典型的に画像の不鮮明版に対して実行される。画像の不鮮明版は、ノイズ及び画像変化によって生じたあらゆる変調も掻き均し、且つ、あらゆる標準的なブラーリング関数(blurring function)によって得ることができる。例えば、フィルタマスクを有する画像の畳み込みはガウス関数に基づく。ガウス関数は次のように規定される。
LoG関数は、ラプラシアンとガウス関数を組み合わせて、画像をぼかし且つラプラシアン値を確実にするように働く一つの関数にし、画像のピクセルの二次微分値に比例する正確な結果をもたらす。LoG関数の代わりに、ガウシアンの差、又はブラーリング画像における一次微分マスクによる畳み込みを用いることも可能である。LoG関数式は以下のとおり。
図12bはLoGフィルタマスクの一例である。当該マスクは、2k+1×2k+1列の倍増ファクタを含んでおり、本実施例では、k=3であり、ファクタの7行に対し、それぞれ7列、したがって、中央に対して7σの長さを有しており、図12bのフィルタマスクにおいてはσ=1を有している。図12bのフィルタマスクが、図2aの画像ファイルの7×7ピクセル区画サンプルによる画像の畳み込みに関連して用いるように準備される。前記倍増ファクタはLoG関数を表現しており、対応する区画のピクセルに当てはめられ、全ての結果が合計されて次に記載するように、7×7配列の中央のピクセルに応答関数値を供給する。 FIG. 12b is an example of a LoG filter mask. The mask includes a multiplication factor of 2k + 1 × 2k + 1 columns, and in this example k = 3, and has 7 columns each for 7 rows of factors, and therefore 7σ length to the center. In the filter mask of FIG. 12b, σ = 1. The filter mask of FIG. 12b is prepared for use in connection with image convolution with 7 × 7 pixel partition samples of the image file of FIG. 2a. The doubling factor represents the LoG function and is applied to the corresponding partition pixel and all results are summed to provide the response function value to the center pixel of the 7 × 7 array as described below. .
そのため図12cは、図2aの画像ファイルの、n×mピクセル配列内の7×7列を有する代表的なピクセル区画の図を表している。図12bの実施令の7×7区画は、図2aのn×mピクセル配列の左上角を形成しており、且つ、代表的な列の中央ピクセルである、ピクセルp(4,4)(太字で示されている)の二次微分に比例する値を計算するために用いられるだろう。 Thus, FIG. 12c represents a diagram of a representative pixel partition having 7 × 7 columns in an n × m pixel array of the image file of FIG. 2a. The 7 × 7 section of the implementation in FIG. 12b forms the upper left corner of the n × m pixel array of FIG. 2a and is the central pixel of a representative column, pixel p (4,4) (bold Will be used to calculate a value proportional to the second derivative of
フィルタマスクの各倍増ファクタは、7×7区画の対応するピクセルの応答関数に一致しており、前記区画の各ピクセルに対する掛け算結果を算出するために用いられる。各ピクセルに適用される倍増ファクタは、当該技術分野において公知であるように(LoGフィルタマスク)、前記の組み合わせられたラプラシアン及びガウシアン関数に関連して決定される。フィルタマスクは、以下の総括式で表現する。
各ピクセルp(n,m)は、Nカラーバンド、例えば、ピクセルp(n,m)のカラー値の赤色、緑色及び青色成分に係るRGBによって表現される。フィルタマスクの倍増ファクタは、区画のピクセルの各カラーバンドに別々に適用され、その結果、各カラーバンドについて別々の二次微分値を生じる。本実施例では、赤色バンドに対する計算を記載する(p(n,m RED))。したがって、p(1,1 RED)にはファクタ0.00031426が掛けられ、一方で次の列のピクセル、p(1,2 RED)には0.002632078が掛けられる、などである。各列のピクセル、1−7には、列の横に順番に、LoGフィルタマスクの行及び列に対応する倍増ファクタが掛けられる。LoG関数の関数として、全ての掛け算結果が足しあわされて中央ピクセルp(4,4)の二次微分値に比例する合計をもたらす。 Each pixel p (n, m) is represented by N color bands, for example, RGB relating to the red, green and blue components of the color value of the pixel p (n, m). The filter mask doubling factor is applied separately to each color band of the pixels of the partition, resulting in a separate second derivative value for each color band. In this example, the calculation for the red band is described (p (n, m RED)). Thus, p (1,1 RED) is multiplied by a factor of 0.00031426, while the next column of pixels, p (1,2 RED) is multiplied by 0.0026332078, and so on. Each column pixel, 1-7, is multiplied by a multiplication factor corresponding to the row and column of the LoG filter mask in turn next to the column. As a function of the LoG function, all the multiplication results are added together to give a sum proportional to the second derivative of the central pixel p (4,4).
類似のフィルタレスポンス結果(output)が、n×m列の各ピクセルp(n,m)と、各ピクセルの各カラーバンドに対して実行され、画像ファイル18のピクセルp(n,m)の二次微分値のリストをコンパイルする。画像の境界領域において、例えば画像境界の3ピクセル以内のピクセルにおいて、画像境界を越えて延びる7×7区画の点のピクセル値に対し、各カラー値について以下のように様々な仮定に基づいた推定を行うことが可能である。
1.境界において、当該境界を越えて続くピクセルの値を、当該画像境界を越えて延びる区画内のピクセルの値が、最も近い境界ピクセルのカラー強度と同じカラー強度で定められていると仮定する;
2.境界で画像が反射している、例えば、当該画像境界を越える区画のピクセルの値が、画像内の対応するピクセルのミラー画像であると仮定する;又は、
3.画像の外側の全ての値が一定値である、例えば0又は最大画像値であると仮定する。
A similar filter response result (output) is executed for each pixel p (n, m) in the n × m columns and each color band of each pixel, and two pixels p (n, m) in the
1. At the boundary, assume that the value of the pixel that continues beyond the boundary is that the value of the pixel in the partition that extends beyond the image boundary is defined with the same color intensity as the color intensity of the nearest boundary pixel;
2. Assume that the image is reflected at the boundary, eg, the value of a pixel in a section that exceeds the image boundary is a mirror image of the corresponding pixel in the image; or
3. Assume that all values outside the image are constant values, for example 0 or the maximum image value.
二次微分値は正であっても負であってもよい。本発明の模範的実施形態では、絶対値が二次微分に用いられている。また、各バンドに対する値は、本実施例では、赤色、緑色及び青色が、ピクセル毎に一つの数として表されている。前記単一数値は、ピクセルのカラーバンドの間から最大二次微分フィルタレスポンス結果を取ることによって、全バンドのリフィルタレスポンス結果の平均を取ることによって、又は、超スペクトル結像において、各バンドからパーセンタイル値、例えばカラーバンドの間から90番目のパーセンタイル値をとることによって得ることができる。 The secondary differential value may be positive or negative. In an exemplary embodiment of the invention, absolute values are used for second order differentiation. In the present embodiment, the values for each band are represented by red, green and blue as one number for each pixel. The single number can be derived from each band by taking the maximum second derivative filter response result from between the pixel color bands, by taking the average of all band refilter response results, or in hyperspectral imaging. It can be obtained by taking the percentile value, for example, the 90th percentile value from among the color bands.
フィルタレスポンス特徴構成の一実施形態では、二次微分値がログスペースバージョン(log space version)又は、画像のガンマ変換において決定される。画像の領域が非常に暗く、さらに濃い影に入っている場合には、一次微分及び二次微分は小さくなり、均一物質反射領域の正確な表示として有用ではなくなる。カラー強度の対数値、又はガンマ変換の使用は、照明束(又は画像露光量)が画像に影響を及ぼすにもかかわらず、色差の相等性を維持する。 In one embodiment of the filter response feature configuration, the second derivative is determined in a log space version or gamma transformation of the image. If the area of the image is very dark and has a darker shadow, the first and second derivatives will be small and will not be useful as an accurate representation of the uniform material reflection area. The use of logarithmic values of color intensity, or gamma conversion, maintains the color difference equality despite the effect of illumination bundle (or image exposure) on the image.
図13は、本発明のフィルタレスポンス特徴構成にしたがい、図2aのn×mピクセル配列画像ファイル内の均一な物質反射の領域を識別するためのフローチャートである。ステップ500では、画像ファイル18(図2a参照)がCPU12に入力される。ステップ510では、CPU12は、画像ファイル18の各ピクセルp(n,m)についてフィルタレスポンスを計算する。本発明の模範的な実施形態では、前記フィルタレスポンスは、画像ファイル18の各ピクセルp(n,m)での二次微分に比例する値である。そのような値は、画像ファイル18の畳み込みを介しCPU12によって、つまり、図12b及び12cで記載したようなLoGフィルタマスクを用いてCPU12によって計算され得る。
FIG. 13 is a flow chart for identifying regions of uniform material reflection in the n × m pixel array image file of FIG. 2a in accordance with the filter response feature configuration of the present invention. In
フィルタレスポンスステップを実行するために、適切なフィルタパラメータがCPU12に入力される。LoGフィルタマスクの場合には、関連したパラメータは、ブラーリングの程度を決定するσファクタである。σファクタは例えば、0.5から3.0の範囲を有することが可能である。
Appropriate filter parameters are input to the
ステップ520では、CPU12は前記区画のピクセル間で均一な物質反射を表示する、フィルタレスポンスを備えたピクセル配列の区画の位置を見つけるように作用する。二次微分値の実施例では、低フィルタレスポンスは物質エッジが存在しないことを表示する、したがって、上記のように、当該区画が均一な物質反射を有する画像領域を含むことの高い尤度をもたらす。ステップ520に関連する入力パラメータは、区画サイズ及び形状、ならびに低フィルタレスポンスの規定を含んでいる。各区画は、例えば正方形、長方形、円形当であることが可能である。本実施例では、各区画は3×3正方形、又は半径9を有する円形区画を含むことが可能である。CPU12は、画像ファイル19全体に渡って一連の区画を検査し、その際、各区画は、配列の全ピクセルの中で、対象である画像ファイル18の配列のピクセルp(n,m)のうち異なる一つに集中する。
In
各検査したピクセルについて、CPU12は、検査下にある区画のピクセルのフィルタレスポンスが閾値を下まわっているかどうか決定する。前記尺度は、例えば前記区画のピクセルの平均フィルタレスポンスと比較された閾値、又は、前記区画のピクセルの間で最大の二次微分値と比較された閾値であってもよい。前記閾値は経験的に決定可能であり、その際、より低い値はより著しい細分化の傾向があり(画像をあまりにも多くの領域に分割する)、より高い値はエラーを導く(二つの領域が同一物質反射でない場合であってもそのように考慮する)。CPU12は、閾値を下回る結果を有する、従って、検査した区画内に均一物質反射の高い尤度を示す、対象となる画像ファイル18の検査した各区画を表にする。
For each examined pixel, the
ステップ530では、CPU12は、均一物質反射の高い尤度を示す区画の上記コンパイルしたリストに存在する、区画の間から十分に重なり合う全ての区画を併合し、併合した区画のリストをB型トークンとして構成するように作用する。ステップ530に関連するパラメータは、「十分に重なり合う」という規定である。例えばCPU12は、共通して5ピクセル、又は共通して10ピクセル等を有する全ての表にされた区画を併合する。各区画が均一物質反射の高い尤度を有しており、当該区画が共通して或る数のピクセルを共有すると、二つの十分に重なり合う区画は、同一の物質反射を共有する十分に重なり合う区画を有していると結論付けることが可能である。選択した数のピクセルを共有するほどまで重なり合う全ての列挙された区画が併合され、且つ、当該併合は、互いに重なり合う区画がもたらす均一な反射を有する領域の最大範囲をしだいに増大することになる。ルーチンの結果(540)はB型トークンのリスト、つまり画像の均一な反射を有する領域への分割である。各併合した領域がゼロでない一次微分を有するピクセルを含むかもしれないので、識別された各B型トークンは、かなりの照明変化を含んでいるかもしれない。
In
次に図14を参照すると、本発明の特徴構成にしたがい、図13のルーチン実行による結果と、異なるパラメータとを組み合わせるためのフローチャートを示している。図13に注釈をつけているように、様々に変化可能なパラメータをCPU12に入力する。本模範的実施形態では、可変パラメータは、σファクタ、区画サイズと形状、低フィルタレスポンスの規定、及び、十分に重なり合う規定を含んでいる。パラメータの異なる組み合わせは異なる結果を生じる。一組のパラメータは、上手く規定したB型トークンによって、画像の幾つかの部分を上手く捕らえることが可能である、しかし、多くの小さな非結合区画内の、画像の他の部分をそのまま残している、一方で、他のパラメータの組は画像の他の部分を上手く捕らえるかもしれない。したがって、パラメータの組内の値を変化することによって、且つ、図13のルーチンを幾度も実行することによって、各特定のパラメータの組につき一回、CPU12は、分割結果の複数組を得ることができ、特定パラメータの組のいずれからも得られるであろう結果から、著しく改善した全体的によりロバストな結果をもたらす。
Referring now to FIG. 14, there is shown a flow chart for combining the results of the routine execution of FIG. 13 with different parameters in accordance with the feature configuration of the present invention. As annotated in FIG. 13, various variable parameters are input to the
例えば、小さな区画サイズは物質エッジをより効果的に局在化するだろう、一方で、より大きな区画サイズはエッジが時々消滅するところの溝を横断することを回避する。閾値も区画サイズまで低下すべきであり、σファクタは増加すべきである、などである。その目的のために、ステップ550では、画像ファイル18をCPU12へ入力する。ステップ560では、CPU12は、それぞれ異なるパラメータの組を入力しながら、図11のルーチンを継続的に何度も実行する。
For example, a small compartment size will more effectively localize material edges, while a larger compartment size avoids traversing grooves where the edges sometimes disappear. The threshold should also be reduced to the partition size, the σ factor should be increased, and so on. To that end, in
ステップ570では、CPU12は、対象である画像ファイル18の幾度もの分割操作の結果を併合するように作用する。前記併合操作は、図13のルーチンの併合ステップ530と同様であり得る、例えば、選択した数のピクセルだけ重なる識別された全てのB型トークンの併合である。代替としてCPU12は、上記重なり基準を以下のように、本発明の別の模範的な次の実施形態について実行することが可能である。
In
ステップ580では、CPU12は、上記のように、図5aのルーチンの実行中にCPU12によって識別されたC型トークンに必要ならば併合することが可能である。低い二次微分値のピクセル区画の検査において、フィルタレスポンス技術は、本質的に物質エッジを避ける傾向があり、したがって当該技術は、エッジの周囲で画像領域に至ることのできないB型トークンをもたらす。二次微分フィルタレスポンス技術によって識別されたB型トークンに「記入する」ために、CPU12は、前もって識別したC型トークンに重なる、識別されたB型トークンを併合することが可能である。再度ではあるが、重なり基準は上記したように存在し得る。ステップ590では、CPU12はB型トークンのリストを出力する。
At
本発明の別の模範的実施形態では、CPU12は(オペレータブロック28のように実行して)、任意の境界除去、隣接平面トークン併合、局所的トークン解析、及び、フィルタレスポンス技術のそれぞれによって、及び/又はそれらのうち一つ以上の組み合わせによって別々に生じたB型トークンのリストをコンパイルする。用いられた技術の組み合わせの決定は特に、画像の特定の領域が画像のテクスチャのためにフィルタにかかったかどうかに依存する。上記技術によって生じた各B型トークンが変化する照明条件下で一つの物質を表現する傾向があるために、様々に異なる技術を用いることによって生じた十分なB型トークンの重なりを併合することは、単一物質を含んでいる画像のより広い区域を表現し、且つ、A型トークンの範囲に近づく、併合したB型トークンという結果をもたらす。 In another exemplary embodiment of the present invention, the CPU 12 (running like the operator block 28), with each of arbitrary boundary removal, adjacent plane token merging, local token analysis, and filter response techniques, and Compile a list of B-type tokens produced separately by one or more combinations thereof. The determination of the combination of techniques used depends in particular on whether a particular area of the image has been filtered due to the texture of the image. Because each B-type token generated by the above technique tends to represent a single substance under varying lighting conditions, merging the sufficient B-type token overlap generated by using different techniques is , Resulting in a merged B-type token representing a wider area of the image containing a single substance and approaching the range of the A-type token.
十分に重なり合うというのは、特定のピクセル特性基準を満足することによって、例えば以下のように規定することが可能である。
A)前記二つのB型トークンが、共通して初期C型トークンの少なくともn、例えばn=1を有する。
B)前記二つのB型トークンが、共通して少なくともn、例えばn=20個のピクセルを有する。
C)前記二つのB型トークンが少なくともn%の重なりを有する、つまり、前記二つのB型トークンのうち、一番目のものにおける少なくともn%、例えばn%=10%のピクセルが、前記二つのB型トークンのうち、二番目のものにおいても検出される又はその逆である。
D)前記二つのB型トークンのうち小さいほうのものにおけるピクセルの割合が、二つのB型トークンのうち大きいほうのものにおいても検出され、当該割合が予め選択した閾値、例えば15%より上である。
E)基準A〜Dの予め選択した組み合わせ。
Sufficient overlap can be defined, for example, as follows by satisfying certain pixel characteristic criteria.
A) The two B-type tokens have in common at least n of the initial C-type token, for example n = 1.
B) The two B-type tokens have in common at least n, for example n = 20 pixels.
C) The two B-type tokens have an overlap of at least n%, that is, at least n%, for example n% = 10% of pixels in the first of the two B-type tokens The second type of B-type token is also detected or vice versa.
D) The percentage of pixels in the smaller of the two B-type tokens is also detected in the larger of the two B-type tokens, and the percentage is above a preselected threshold, eg 15% is there.
E) Preselected combination of criteria A to D.
二つの十分に重なっているB型トークンの併合は、先に述べたユニオンファインドアルゴリズムの実行のような数学的操作によって達成することが可能である。二つの重なり合うB型トークンが上記基準を満たさない場合には、二つのトークンの重なり合うピクセルは、二つのB型トークンのうり大きいほうのものに割り当てられ得る。 The merging of two sufficiently overlapping B-type tokens can be achieved by mathematical operations such as the execution of the union find algorithm described above. If two overlapping B-type tokens do not meet the above criteria, the overlapping pixels of the two tokens can be assigned to the larger of the two B-type tokens.
本発明の特徴構成にしたがう、C型トークン化ブロック35及び/又はオペレータブロック28(CPU12による)のトークン発生及び併合技術による実行の結果として、画像は、シーン内に描かれた不連続な物質を表現するトークン(B型トークン)と同じ、ロバストな(頑健な)色の領域を表現するトークン(C型トークン)とに正確に分割することが可能であり、それによって、トークン画像が大きな数の構成成分ピクセルの空間スペクトル情報を捕らえるのでコンピュータ化効率の基礎をもたらす。サービスプロバイダ24は、選択した画像のあらゆる分割処理に使用するために、上記トークン発生技術の実行によって生じた全てのC型及びB型を、例えば隣接平面トークン併合技術の実行中に決定されたような関連するトークンマップ情報、及び、保存された演算子が対応付けられた選択画像ファイル18を結果として生じる相互参照と共に保存する。
As a result of execution by token generation and merging techniques of C-
同一照明制約条件の本実施例では、サービスプロバイダ24はC型トークンとB型トークンを、選択した制約条件によって必要とされる演算子として識別する。C型トークン化ブロック35はC型トークンを生じた。サービスプロバイダ24はオペレータブロック28を操作して上記技術を実行し、画像32に関連するB型トークン並びにトークンマップを生じる。制約条件ビルダー26は、生じたトークン演算子を模範的な行列式、[A][x]=[b]をソルバー30へ入力するために編成する。同一照明制約条件では、関連する制約条件生成ソフトウェアモジュールの制約条件関係は、トークンマップ情報によって表示されたような隣り合うC型トークンが、同一のB型トークンの一部でない限り、同一の照明によって照らされるということである。
In this embodiment with the same lighting constraints,
サービスプロバイダ24によって保存された各C型トークンは、領域IDによって識別され、且つ、行及び列番号による各ピクセル構成成分の表を含む。C型トークンの各ピクセルは、例えばRGB値について、画像を記録するために用いられた装置のノイズレベル内の、同一C型トークンの、他の全構成成分ピクセルのように、概ね同一カラー値で構成されるだろう。各特定のC型トークンの構成成分ピクセルの平均カラー値が、各C型トークンのカラー値を表現するために用いられ得る。各B型トークンはC型トークン構成成分によって識別され、したがって、各C型トークンによってその全てのピクセル構成成分を識別するために処理され得る。
Each C-type token stored by the
本発明の特徴構成にしたがい、画像形成用モデルは、物質と照明の二つの成分を含んでいるような画像の基本的概念を反映している。この関係は次のように表され得る、つまり、I=ML、ここでIは各画像ファイル18に記録及び保存されるような画像カラーであり、Mは記録した画像カラーの物質成分であり、Lは記録した画像カラーの照明成分である。各C型トークンのI値はしたがって、トークンのピクセル構成成分の記録したカラー値の、平均カラー値である。
In accordance with the characterizing feature of the present invention, the image forming model reflects the basic concept of an image that includes two components: matter and illumination. This relationship can be expressed as: I = ML, where I is the image color as recorded and stored in each
したがって、log(I)=log(ML)=Log(M)+log(L)である。これは次のように書き換えることが可能である。i=m+l、ここでiはlog(I)を表し、mはlog(M)を表し、及びlはlog(L)を表す。同一照明制約条件の制約関係において、三つのC型トークン、a,b,c(図15参照)が隣接トークン(且つ同一のB型トークン内には存在しない)である場合の実施例では、(全ピクセル構成成分の行及び列の数を比較することによって示され得るように)、la=lb=lcである。la=ia−ma、lb=ib−mb、及びlc=ic−mcなので、これら数学的関係は以下のように表され得る。(1)ma+(−1)mb+(0)mc=(ia−ib)、(1)ma+(0)mb+(−1)mc=(ia−ic)、及び、(0)ma+(1)mb+(−1)mc=(ib−ic) Therefore, log (I) = log (ML) = Log (M) + log (L). This can be rewritten as follows. i = m + 1, where i represents log (I), m represents log (M), and l represents log (L). In an embodiment in which three C-type tokens a, b, and c (see FIG. 15) are adjacent tokens (and do not exist in the same B-type token) in the constraint relationship of the same illumination constraint condition, ( L a = l b = l c (as can be shown by comparing the number of rows and columns of all pixel components). Since l a = i a -m a , l b = i b -m b , and l c = i c -m c , these mathematical relationships can be expressed as follows: (1) m a + (− 1) m b + (0) m c = (i a −i b ), (1) m a + (0) m b + (− 1) m c = (i a − i c ), and (0) m a + (1) m b + (− 1) m c = (i b −i c )
図15は、同一照明制約条件によって制約されたつまり隣接C型トークンa,b,cは同一照明に存在するように制約された、上記三つの隣接するC型トークン、a,b,cの実施例の数学的関係についての[A][x]=[b]行列式を表している。図15の行列式では、[b]行列内のlog(I)の様々な値は、画像分離のために選択した画像からC型トークン化ブロック35によって生じた隣接C型トークンa,b,cのピクセル構成成分について記録した平均ピクセルカラーから既知である。0、1及び−1の[A]行列は、先に述べたように選択した同一照明制約条件を表す式の組によって規定される。[A]行列の上から下までの行の数は、トークンに課せられた実際の制約条件の数と一致し、この場合は3つの、三つの隣接C型トークン間の同一照明である。[A]行列内の左から右までの列の数は、解かれるべき未知数と一致し、この場合には再度であるが三つである。したがって、[x]行列内の、各C型トークンa,b,cの物質成分の値は当該行列式で解かれ得る。各値は実際には、本実施例のRGBカラーバンドに対応する三つの値を有する一つのベクトルであることに注意すべきである。
FIG. 15 shows the implementation of the above three adjacent C-type tokens a, b, and c that are constrained by the same illumination constraint, that is, the adjacent C-type tokens a, b, and c are restricted to exist in the same illumination. [A] [x] = [b] represents the determinant for the example mathematical relationship. In the determinant of FIG. 15, the various values of log (I) in the [b] matrix are the adjacent C-type tokens a, b, c generated by the C-
したがって、制約条件ビルダー26によって決められたように、図15の行列式は制約条件ビルダー26によってソルダー30へ入力されて、選択した画像の隣接C型トークンa,b,cの物質成分の値についての最適化した解を得る。先に述べたように、本発明の模範的なGUI実施形態では、ユーザー(使用者)は制約条件[A][x]=[b]のシステムに対する最適解を見つけるために幾つかの数学的技術のうち一つを選択する。CPU12は、ユーザーによって選択された数学的操作にしたがいソルバー30を設定する。
Accordingly, as determined by the
例えば、標準最小自乗法ソルバーでは、行列式は\underset{x}{min}(Ax−b)2と書き換えられる。ソルバー30は次に標準最小自乗法操作を実行して、各ma、mb、mcについて最適化した値を決定する。ソルバー30は次に、最適ma、mb、mcに基いて物質画像を生じて画面に表示するように進行する。物質画像では、ma、mb、mc値は、初期に記録されたRGB値、つまり、それぞれのトークンの各ピクセルで置換される。前記ソルバー30は次に、記録された既知の画像値ia、ib、ic及び決定されたma、mb、mc値から、i=m+lによって表されるモデルを用いることによって照明画像を生じるようにも進行する。
For example, in the standard least squares solver, the determinant is rewritten as \ underset {x} {min} (Ax−b) 2 .
物質及び照明画像の各々はモニタ20上に表示されて、サービスプロバイダ24によって保存され、且つ、初期の画像ファイル18と相互参照され得る。
Each of the material and lighting images can be displayed on the
本発明の別の特徴構成にしたがうと、ソルバー30は、現実世界の照明及び物質現象の制限を捕捉する範囲(bounds)を導入し、最適化手法によって解[x]として決定された物質/照明値を物理的にもっともらしい範囲内に維持するように設定され得る。これは、例えば反復技術において、各反復で追加の不等式制約条件を[x]内の範囲値外へ導入して、規定の範囲内の値へ転換するように実行することが可能である。したがって上記の最小自乗技術は、([x]の全てによって表現される)個々の物質評価の最少及び最大範囲を含むように増補され得る。さらに[x]の全ては、物質評価が物質特性の経験的(a priori)知識と一致するように調整され得る。
In accordance with another feature of the present invention,
本発明の模範的実施形態では、選択した制約条件を指定するために最小自乗法ソルバーにおいて用いられた行列、[A]及び[b]は、以下の問題で表現された範囲に準拠する。
線形最小自乗式:minx:Σi(Ai Tx’−ti)2
条件:x’≧αm1
x’≦ωm1
x’≧imgj
ここで、1はあらゆる1のベクトルを表し、αmは最も暗い物質値(例えば、物質は石炭よりも暗くなることはできない)を表し、及び、ωmは最も明るい物質値を表す。imgj値は、特定のトークンjにおけるログ強度値であり、分離後の物質カラーが原画像で表されたものよりも暗くなることができないという現実世界に基いた制約条件をもたらす、というのは、照明が観察対象である物質の外見上の色のみを照らすことができるからである。
In the exemplary embodiment of the present invention, the matrices [A] and [b] used in the least squares solver to specify the selected constraints conform to the ranges expressed in the following problem.
Linear least squares: min x : Σ i (A i T x′−t i ) 2
Condition: x ′ ≧
x ′ ≦
x ′ ≧ img j
Where 1 represents any one vector, α m represents the darkest material value (eg, material cannot be darker than coal), and ω m represents the brightest material value. The img j value is the log intensity value at a particular token j, resulting in a real world constraint that the material color after separation cannot be darker than that represented in the original image This is because the illumination can illuminate only the apparent color of the substance to be observed.
線形最小自乗式では、x’についての唯一の最小解は、ATAx’=ATtで表された線形システムにおいて、目標物質差tiと推定差Ai Tx’の間における差の二乗平均を最小化する物質マップである。例えば「i番目の」制約条件Aiが二つのトークンa及びbが同一物質であると指示する場合には、ATAx’はx’におけるトークンa及びbの値の差をとり、目標値ti=0から歪を演算する。 In the linear least-squares equation, the only minimum solution for x ′ is the difference between the target material difference t i and the estimated difference A i T x ′ in a linear system expressed as A T Ax ′ = A T t. It is a material map that minimizes the root mean square. For example, if the “i-th” constraint A i indicates that two tokens a and b are the same substance, A T Ax ′ takes the difference between the values of tokens a and b at x ′ and sets the target value The distortion is calculated from t i = 0.
上記「条件」範囲によって表した不等式は、最大可能な及び最小可能な物質カラー値の現実世界の制約条件を満たすもっともらしい物質解x’の組を形成する。これは、標準の、つまり、「条件」範囲による制約条件がそれ以上無い場合にx’が、現実世界の反射観測に違反する画像の与えられた位置の値を取り、にもかかわらずminx’式についてより最適な解を達成するという公知の最小自乗解とは違う。 The inequality represented by the above “condition” range forms a set of plausible material solutions x ′ that satisfy real-world constraints on the maximum possible and minimum possible material color values. This is because x ′ takes the value of a given position of an image that violates real-world reflection observations when there are no more constraints on the standard, ie “condition” range, and min x ' Unlike the known least squares solution, which achieves a more optimal solution for the equation.
ソルバー30によって実行される最適化処理では、処理の特定の反復において、「条件」不等式に違反する物質カラー値をトークンのいずれかが有する時にはいつでも、違反している物質値の原因をつきとめる追加の仮の制約条件が、制限条件を満たす値へ加えられる。このようにして、初期の行列[A]と[b]は、新しい制限条件Aboundsとbbounds(「条件」範囲の表現として)を満たす新しい行列によって増補されて、行列式[A;Abounds][x]=[b;bbounds]の新しい増補システムを規定する。前記式の増補システムは、初期システムについてアナログ方式で、例えば公知の最小自乗処理を用いて解を与える。
In the optimization process performed by
本発明の上記制限の特徴構成にしたがい、追加の仮の制約条件が、カラー値が現実世界現象に違反する場合にはいつでも加えられる。増補式の再計算は必要に応じて初期システムATAx’=ATtから毎度(つまり、仮の制限制約条件は、反復の間に渡って実行する必要はない)繰り返し開始することが可能であり、且つ、「条件」範囲が満たされるまで増補システムA’TA’x’=A’Tt’を繰り返し解く。 In accordance with the above limiting feature of the present invention, additional temporary constraints are added whenever a color value violates a real world phenomenon. The augmented recalculation can be repeated as needed from the initial system A T Ax ′ = A T t every time (ie, the temporary constraint constraint does not need to be executed between iterations). And the augmentation system A ′ T A′x ′ = A ′ T t ′ is iteratively solved until the “condition” range is satisfied.
本発明のさらに別の特徴構成によると、L1、L∞目標関数が、少数の物質変化についての優先をコード化することによって最適解の正則化をあたえる。要するに、L1、L∞ソルバーは、物質マップが利点を有する像(figure-of-merit)内に少数の物質を含んでいる筈であるという経験的な判断を含んでいる。前記システムのソルバーには、利点を有する像をあらゆる可能な解に割り当てる式である目標関数と、与えられた目標関数にしたがい最適値である解を見つけだすために用いられたアルゴリズムとの間において区別がある。本実施例では問題が最小化、minx’:Σi(Ai Tx’−ti)2、であると明言しているので、目標関数が割り当てた値は「コスト(cost)」と特徴づけられ得る。 According to yet another feature of the invention, the L 1 , L ∞ target function provides regularization of the optimal solution by encoding priorities for a small number of material changes. In short, the L1, L∞ solver includes an empirical determination that the material map should contain a small number of materials in a figure-of-merit. The system solver distinguishes between an objective function, which is an expression that assigns an image of benefits to every possible solution, and an algorithm that is used to find the optimal solution according to a given objective function. There is. In this embodiment, since the problem is minimized, min x ′ : Σ i (A i T x′−t i ) 2 , the value assigned by the target function is “cost”. Can be characterized.
本問題では、x’をカラーバンドの多くの行と多くの列で構成された行列とし、ここでx’cはc番目のカラーバンドに関連したc番目の(縦)列を示す。最小自乗目標関数は、計算式に於いて次のように増補される。
minx’:ΣcΣi(Ai Tx’c−tci)2+γΣk|tkmaxc|Ak Tx’c|
ここで、γ|γ>0は、最小自乗項に関連したコストと、L1、L∞ペナルティとの間のトレードオフ(trade-off)を支配する。Σk|tkmaxc|Ak Tx’c|という表現は、[A]内の全同一物質制約条件に渡る最大チャンネル毎の絶対差を累算する。
In this problem, x ′ is a matrix composed of many rows and columns of color bands, where x′c denotes the c th (vertical) column associated with the c th color band. The least square target function is augmented in the formula as follows.
min x ': Σ c Σ i (A i T x' c -t c i) 2 + γΣ k | tk max c | A k T x 'c |
Here, γ | γ> 0 dominates the trade-off between the cost associated with the least squares term and the L 1 and L ∞ penalties. Σ k | tk max c | A k T x 'c | of representation, accumulates the absolute difference for each maximum channel across all the same material constraint in [A].
例えばトークンaとbの間に同一物質制約条件を与えると、L1、L∞関数はカラーチャンネルcに渡るxc aとxc bの間に最大差を有するカラーチャンネルについての項だけを含むだろう。本発明の模範的な実施形態では、例えば目標関数 minx’:ΣcΣi(Ai Tx’c−tci)2+γΣk|tkmaxc|Ak Tx’c|によって表されるような最適化処理は、縮小技術である。即ち、最小自乗問題の数列は、各回において、同一物質制約条件に違反すると決定された制約対象は縮小されるという方法で解かれる。数列の最後には、与えられた閾値を下まわる値を有する制約条件が制約条件システムから間引かれ、新しい最小自乗解を演算する。上記「条件」範囲のような範囲が、制限されたL1、L∞ソルバーをもたらすために目標関数に加えられ得ることに注目すべきである。 For example, given the same material constraint between tokens a and b, the L 1 and L ∞ functions include only terms for the color channel that has the largest difference between x c a and x c b over color channel c. right. In the exemplary embodiment of the present invention, for example, the objective function min x ': Σ c Σ i (A i T x' c -t c i) 2 + γΣ k | tk max c | A k T x 'c | by Table Such an optimization process is a reduction technique. In other words, the least-squares problem sequence is solved in such a way that each time a constraint subject determined to violate the same material constraint condition is reduced. At the end of the sequence, constraints with values below a given threshold are decimated from the constraint system to compute a new least squares solution. It should be noted that ranges such as the above “condition” ranges can be added to the objective function to yield a limited L 1 , L ∞ solver.
図16a、16b及び16cは、境界画像空間スペクトル演算子の実施例を表している。図におけるピクセル解析は、各境界を形成している画像の領域間のカラー比に関する情報を、境界画像制約条件において用いるために与える。 Figures 16a, 16b and 16c represent examples of boundary image space spectral operators. The pixel analysis in the figure provides information about the color ratio between the regions of the image forming each boundary for use in boundary image constraints.
図16aを参照すると、図5dの二つのB型トークン間における境界626の詳細が表れている。本発明の特徴構成にしたがうと、境界626の表示は、当該境界626に位置し且つ境界626を規定している各B型トークン内に延びる隣接ピクセルから構成される。前記ピクセル表示は、境界に関連するピクセルのサンプル、例えば、境界626を形成している各B型トークン内にパッド628を有するピクセル配列をもたらすように設定され、前記パッド628によって、供給されたピクセルの各カラー値(例えばR、G、B値のような)の関数として空間スペクトル解析に供することが可能となる。前記サンプルは比較され、物質変化に対応する境界626の尤度を決定する。CPU12は、最初のB型トークン630の周辺ピクセルを横断することにより、且つ、前記境界626の反対側にあるB型トークン632の対応する周辺ピクセルまでの距離を決定することにより、パッド構成を生じるように操作される。
Referring to FIG. 16a, details of the
周辺ピクセル間の最短距離の位置が見つけられると、次にその位置は画像を生じるための開始点として用いられる。対応するB型トークン630、632の周辺ピクセル間の最短距離のまさに真中にあるピクセル634(図中では図示を目的としてサイズは誇張している)が、前記画像の一つ目の分離を規定する。次にCPU12は、ピクセル634から、多くのピクセル例えば10−12ピクセルを含むB型トークン630内の、境界626に垂直方向にピクセルをトラバースする。前記位置で、CPU12は、パッド628のうち一つを、ピクセル634から10−12ピクセル離れた位置周辺で、複数ピクセルのうち一つの配列、例えば3×3配列として識別する。CPU12はB型トークン632について同様の操作を繰り返し、ピクセル634の両側で一つのパッド対628と、B型トークン630,632の各一方で、境界を形成する一つのパッド628を規定する。
Once the position of the shortest distance between surrounding pixels is found, that position is then used as a starting point for producing an image. A pixel 634 (size is exaggerated for purposes of illustration in the figure) that is exactly in the middle of the shortest distance between neighboring pixels of the corresponding B-
パッド628の対を含んでいる第1セグメント(segment)を完了するとすぐに、CPU12は、対象とする境界626の全長さに沿って、さらなる一連のパッド対を生じる。そのために、CPU12は、ピクセル634の両側で境界ピクセル636を識別するが、当該境界ピクセルは、互いに決まった数のピクセル例えば5ピクセルずつ互いに離れており、且つ、B型トークン630、632の周辺ピクセル間の境界内に各々配置している。各境界ピクセル636について、CPU12は、各ピクセル636の両側で一つのパッド対628と、B型トークン630,632の各一方で、境界を形成する一つのパッド628とを、ピクセル634周辺のパッド対に関して実行したのと同様に識別する。
As soon as the first segment containing the pair of
本発明の特徴構成にしたがい、CPU12は、境界変化が物質変化であるかどうかに関する尤度を表示するデータを生じるための計算を含む、前記画像のピクセルにおける一連の空間スペクトル試験を実行する。
In accordance with a feature of the invention, the
最初の試験は勾配一致のログを含んでいる。当該試験は、前記画像の各側(図16aの表示された画像の上側及び下側)での境界に並列な勾配間の一致を検査する。勾配のログは、異なる強度を有する物質を説明するのに用いられる。CPU12は次のように操作する。
1.和変数をゼロに、E=0に初期化する;
2.各パッド628について、
(a)各側について、現在のパッドと次のパッドの、平均カラー値の差を計算する(勾配);
(b)各側について、前記差のログを取る(勾配のログ);
(c)上側と下側のログ差(図16a中に示した画像の、上側パッド628と下側パッド628について)間の差二乗和を計算する;
(d)当該値をEへ加える;
3.Eを例えば数学的な疑似尤度(pseudo-likelihood)へ変換する:
1. Initialize the sum variable to zero and E = 0;
2. For each
(A) For each side, calculate the difference in average color values between the current pad and the next pad (gradient);
(B) For each side, log the difference (gradient log);
(C) calculating the sum of squared differences between the upper and lower log differences (for the
(D) add the value to E;
3. Convert E to, for example, mathematical pseudo-likelihood:
次の試験は、動的タイム・ワーピング(DTW)を用いた左及び右側勾配の一致を含んでいる。この試験では、CPU12は次のように操作する。
1.前記画像の各パッド対について:
(a)各側について、パッド位置からパッド位置へ、境界626と平行な線を辿る(図16b参照);
(b)各側について、上側及び下側に、各線の点をベクトル、つまりV(U)又はV(L)へ追加する(図16b参照);
2.各V(U)及びV(L)の勾配のログを演算して、結果を∇V(U)及び∇V(L)へ入れる;
3.動的タイム・ワーピングを用いて、∇V(L)を∇V(R)と比較し、エラー量Eを生ずる;
4.Eを例えば数学的擬似尤度へ変換する。
1. For each pad pair in the image:
(A) For each side, follow a line parallel to the
(B) For each side, add the points of each line to the vector, ie V (U) or V (L), on the top and bottom (see FIG. 16b);
2. Compute the log of the slope of each V (U) and V (L) and place the result in ∇V (U) and ∇V (L);
3. Using dynamic time warping, compare ∇V (L) with ∇V (R), resulting in an error amount E;
4). E is converted into, for example, a mathematical pseudo-likelihood.
三つ目の試験では、CPU12は、ログ空間一致操作(log space matching operation)を実行する。
1.各側について(図16a参照)、パッド628の全ての平均カラー値を一つのベクトルへ収集し、ピクセル強度にしたがって分類する;
2.各側について、5パーセントと95パーセントのピクセルを、例えばそれぞれ暗及び明として選択する;
3.各側について、明及び暗ピクセルのログ、即ちD(R)とD(L)間のユークリッド距離を計算する;
4.二つの距離の差、即ちE(1)=D(R)−D(L)を演算する;
5.E(1)を数学的擬似尤度へ変換する、例えばp(1)=e-10(square of E(1))
6.各側について、例えば特異値分解(SVD)を用いることによって、境界ピクセルの共分散行列の一次固有ベクトルを計算する;
7.(各側についてひとつ)二つの一次固有ベクトルの内積を計算して、結果をE(2)へ入れる;
8.E(2)を擬似尤度へ変換する、例えばそれを直接的に用いるp(2)=E(2);
9.長さ尤度と配向尤度を組み合わせて、最終的な擬似尤度、L=p(1)p(2)を生成する。
In the third test, the
1. For each side (see FIG. 16a), all the average color values of
2. For each side, select 5 percent and 95 percent pixels, for example as dark and light respectively;
3. For each side, calculate the log of light and dark pixels, ie the Euclidean distance between D (R) and D (L);
4). Compute the difference between the two distances, ie E (1) = D (R) −D (L);
5. Convert E (1) to mathematical pseudo-likelihood, eg p (1) = e -10 (square of E (1))
6). For each side, calculate the first eigenvector of the covariance matrix of the boundary pixels, for example by using singular value decomposition (SVD);
7). Calculate the inner product of two primary eigenvectors (one for each side) and put the result in E (2);
8). Convert E (2) to pseudo-likelihood, eg using it directly p (2) = E (2);
9. The final likelihood and L = p (1) p (2) are generated by combining the length likelihood and the orientation likelihood.
四つ目の試験では、CPU12は、各ムカデ様パッド対について多重スケール比一致(multi-scale ratio matching)を実行する。CPU12は次のように操作する。
1.各側について(図16a)、パッド628の全ての平均カラー値を一つのベクトルへ収集し、境界に沿った順に分類する;
2.収集変数(collection variable)Pとカウンタ変数(counter variable)Nとを初期化する;
3.各パッドiについて、
例えば1から3までの各距離dについて、
i.一方の側の、パッドiの各バンドが、反対側のその相手方よりも明るく、且つ、i+dの各バンドが、両側間で同一関係を表す場合、
− 位置iでの上側と下側パッド間の反射比が、ノイズモデル(例えば、一定の項と画像強度において線形である項とを考慮に入れた線形ノイズモデル)を用いることによって、位置i+dでの上側と下側パッドについての反射比と等しくなる確率pを計算する;
− 結果pを収集変数Pへ加える;
− カウンタ変数Nをインクリメントする
ii.そうでなければ、つまり二つのパッド位置での色が類似ではない、例えばR(mx)axよりも大きな(例えば1.3)又はR(m)inよりも小さい(例えば0.77)のカラーバンド比を有する場合には、0をPに加えて、カウンタ変数Nをインクリメントする;
4.N>0であれば、PとNから擬似尤度を計算する、例えば、L=P/N;
5.そうでなければ尤度をゼロに設定する、L=0。
In the fourth test, the
1. For each side (FIG. 16a), all the average color values of
2. Initialize a collection variable P and a counter variable N;
3. For each pad i
For example, for each distance d from 1 to 3,
i. If each band of pad i on one side is brighter than its counterpart on the opposite side and each band of i + d represents the same relationship between both sides,
The reflection ratio between the upper and lower pads at position i is at position i + d by using a noise model (eg a linear noise model taking into account a constant term and a term that is linear in image intensity) Calculate the probability p equal to the reflection ratio for the upper and lower pads of
Add the result p to the collection variable P;
-Increment the counter variable N ii. Otherwise, the colors at the two pad positions are not similar, for example a color greater than R (mx) ax (eg 1.3) or less than R (m) in (eg 0.77) If it has a band ratio, add 0 to P and increment the counter variable N;
4). If N> 0, calculate pseudo-likelihood from P and N, eg L = P / N;
5. Otherwise, the likelihood is set to zero, L = 0.
別の試験では、CPU12は画像の二光源二色性反射モデル(BIDRモデル)を用いる。BIDRモデルの予測にしたがい、二つのB型トークンの全ピクセルが、直接/周辺趾光源対下で単一物質由来である場合には、当該ピクセルはRGB空間内の線によって良好に表現されるであろう。パッド線形性試験が、前記画像(図16a)の両側におけるパッド628の平均カラー値がいかに上手くRGB空間内の線に近似するかということを決定するように考案され得る。パッド線形性試験では、CPU12は次のように操作する。
1.各側
(a)パッド628の平均カラー値を一つのベクトルへ収集する;
(b)一次及び二次固有ベクトル(e(1),e(2))と、共分散行列の固有値とを、例えばSVDを用いることによって計算する;
(c)二次固有ベクトルに対する一次固有ベクトルの比、R=e(1)/e(2)を計算し、二次固有ベクトルがゼロであり、一次固有ベクトルがゼロでない場合には、R=20とし、一次固有ベクトルもゼロである場合には、R=0とする;
(d)当該比を、例えば以下の式を用いて数学的擬似尤度に変換する、
(e)各パッド平均値を一次固有ベクトルへ投影し、当該固有ベクトルにしたがって最小及び最大距離、D(min)及びD(max)を計算する;
(f)距離D(max)−D(min)をK個のビンへ(例えば、K=5)分割する;
(g)幾つのピクセルが一次固有値にしたがう各距離に存在するかというヒストグラムを構築する;
(h)幾つのピクセルが、それらの中にC個のピクセル(例えばC=0)以上を有さないかを数えて、結果をE(s)へ保存する。
2.算出した複数の擬似尤度を一つの擬似尤度、例えば
L=R(left)R(right)(E(left)R(right)0.7
へ変換する。
In another test, the
1. Each side
(A) Collect the average color values of the
(B) calculating the primary and secondary eigenvectors (e (1), e (2)) and the eigenvalues of the covariance matrix, for example by using SVD;
(C) Calculate the ratio of the primary eigenvector to the secondary eigenvector, R = e (1) / e (2). If the secondary eigenvector is zero and the primary eigenvector is not zero, then R = 20, R = 0 if the eigenvector is also zero;
(D) converting the ratio into mathematical pseudo-likelihood using, for example, the following equation:
(E) Project each pad average value onto a primary eigenvector and calculate the minimum and maximum distances, D (min) and D (max) according to the eigenvector;
(F) Divide the distance D (max) −D (min) into K bins (eg, K = 5);
(G) construct a histogram of how many pixels are present at each distance according to the primary eigenvalue;
(H) Count how many pixels do not have more than C pixels in them (eg C = 0) and store the result in E (s).
2. A plurality of calculated pseudo-likelihoods are converted into one pseudo-likelihood, for example, L = R (left) R (right) (E (left) R (right) 0.7
Convert to
六番目の試験では、CPU12は、画像(図16a)の両側のパッド628が、妥当な二光源の直接/周辺光源対に対応するかどうかを決定する試験を実行する。この試験では、CPU12は次のように操作する。
1.各側
(a)パッド628の全ての平均カラー値を一つのベクトルへ収集する;
(b)例えばSVDを用いることによって、ピクセルの共分散行列の一次固有ベクトルe(1)を計算する;
(c)全ての要素e(1)が同一の符号を有しない場合には、R(s)=1とする;
(d)そうでない場合には、e(1)に1又は−1をかける、その結果全て正となり、その彩度(saturation)、
R(s)=max(R,G,B)−min(R,G,B)/max(R,G,B)
を計算する;
(e)R(s)を、例えば次式を用いて擬似尤度へ変換する、
1. Each side
(A) collect all average color values of
(B) calculating the first eigenvector e (1) of the pixel covariance matrix, for example by using SVD;
(C) R (s) = 1 if all elements e (1) do not have the same sign;
(D) Otherwise, e (1) is multiplied by 1 or -1, so that all are positive, and the saturation,
R (s) = max (R, G, B) −min (R, G, B) / max (R, G, B)
Calculate
(E) converting R (s) into pseudo-likelihood using, for example,
もっと別の試験では、CPU12は、画像(図16a)の両側におけるパッド628の平均カラー値間での変化量について検査する。変化量が大きければ大きいほど、境界変化の性質に係る情報量も大きくなる。CPU12はつぎのように作用する。
1.各側について、パッド628の平均カラー値のうち、最小、最大及び平均強度を計算する;
2.各側について、規格化した変化量V(side)=(maximum−minimum)/averageを計算する;
3.各側について、規格化した変化量を、例えば次式を用いて擬似尤度に変換する、
4.例えば、L=L(left)L(right)を用いて、各側についての擬似尤度を組み合わせる。
In yet another test, the
1. For each side, calculate the minimum, maximum and average intensity of the average color values of the
2. For each side, calculate the normalized change V (side) = (maximum−minimum) / average;
3. For each side, the standardized change is converted into pseudo likelihood using, for example,
4). For example, using L = L (left) L (right), the pseudo likelihoods for each side are combined.
次の試験はストリップトークン検査を含んでいる。CPU12は、境界ピクセル636毎に一つ、且つ、それぞれ各境界ピクセルから8−10ピクセル長さ及び2−4ピクセル幅延びている一連のストリップ(細長)トークン642(図16c参照)を含んでいるストリップトークン画像を計算する。CPU12は、各側でストリップトークン642の鮮明度(sharpness)を解析する、ここで鮮明度とは、全ストリップに渡る最大変化の部分として、ストリップ内で二つの隣り合うピクセル間の最大差で規定される。CPU12は以下のように操作する。
1.一組のピクセル細長片(ストリップ)の組(例えば2×8ピクセルサイズ)であって、境界に沿って中心に揃えられて且つ境界に対し垂直に配向される(図16c参照)、ピクセル細長片の組を生じる;
2.各細長片について、その鮮明度を、当該細長片内の最大及び最小強度ピクセル間の差に対する、当該細長片内の隣り合ういずれか二つのピクセル間の最大差の比として計算する;
3.全細長片の平均鮮明度を計算する;
4.平均鮮明度である、
1. A set of pixel strips (eg, 2 × 8 pixel size), centered along the boundary and oriented perpendicular to the boundary (see FIG. 16c) Results in a set of
2. For each strip, its sharpness is calculated as the ratio of the maximum difference between any two adjacent pixels in the strip to the difference between the maximum and minimum intensity pixels in the strip;
3. Calculate the average definition of all strips;
4). Average definition,
次のストリップトークン試験では、CPU12は、各細長片の直線性の解析を実行する。CPU12は次のように操作する。
1.一組のピクセル細長片の組(例えば2×8ピクセルサイズ、図16c参照)であって、境界に沿って中心に揃えられて且つ境界に対し垂直に配向される、ピクセル細長片の組を生じる;
2.各細長片について、当該細長片内におけるピクセルの共分散行列の、一次及び二次固有値の比を用いることによって、その直線性の程度を計算する;
3.各細長片iについて、その直線性l(i)を、例えば
ここで、定数の実施例値はα=0.5及びC=10である。
In the next strip token test, the
1. A set of pixel strips (eg 2 × 8 pixel size, see FIG. 16c), resulting in a set of pixel strips centered along the boundary and oriented perpendicular to the boundary ;
2. For each strip, calculate its degree of linearity by using the ratio of the primary and secondary eigenvalues of the covariance matrix of the pixels within that strip;
3. For each strip i, its linearity l (i) is
Here, the example values of the constants are α = 0.5 and C = 10.
さらに別のストリップトークン試験では、CPU12は、画像がどのようにして各ストリップトークンに対して垂直に変化するのかを検査する。CPU12は次のように操作する。
1.ピクセルのN個のストリップ(例えば、2×8ピクセルサイズ)(図16c参照)の組を生じる;
2.カウンタをC=0に初期化する;
3.各ストリップについて、ストリップのエッジピクセルを識別する
(a)各エッジピクセルpについて:
i.前記ストリップの長軸に垂直な線内のM個のピクセルを検査する
ii.M個のピクセルの各々について、ノイズモデルを用いることによって、エッジピクセルpに対する類似度を計算する
iii.M個のピクセルのいずれかがpと異なる場合には、当該ストリップが試験に不合格であるとみなして、Cをインクリメントする;
4.不合格の割合L=C/Nを計算することにより、不合格のストリップの数を、擬似尤度へ変換する。
In yet another strip token test, the
1. Results in a set of N strips of pixels (eg, 2 × 8 pixel size) (see FIG. 16c);
2. Initialize the counter to C = 0;
3. For each strip, identify the edge pixels of the strip. (A) For each edge pixel p:
i. Inspect M pixels in a line perpendicular to the long axis of the strip ii. For each of the M pixels, calculate the similarity to the edge pixel p by using a noise model iii. If any of the M pixels is different from p, consider the strip fail the test and increment C;
4). By calculating the failure rate L = C / N, the number of failed strips is converted to pseudo-likelihood.
特徴計算についての試験の組が完了するとすぐに、CPU12はコンピュータ学習技術を実行して、CPU12の試験操作によって蓄積した、数学的に決定された擬似尤度データを解析する。前記CPU12は、前記試験において決定された様々な尤度Lから特徴ベクトルを形成する。当該CPU12は次に操作されて、前記特徴ベクトルが、十中八九物質境界であり、他の種類の境界、例えば、照明エッジ、深さ境界又は、照明と物質の同時変化ではない、境界を表示するかどうかについての決定をすることが可能な、分類を学習する。例えば、各擬似尤度について入力を伴うニューラルネットワーク(neural network)を操作して決定を出力することが可能である。他の実施手法例は、サポートベクトル機械(SVM)、ベイズの決定樹、又はブースティング(boosting)を含む。前記境界が物質境界であるという尤度の決定がされるとすぐに、比Xが、境界を形成するB型トークンの物質カラーについて決定され、且つ、上記のようにC型トークンを縁取る制約条件として適用され得る。
As soon as the test set for feature calculation is completed, the
図17は、サービスプロバイダ24と制約条件ビルダー26についての汎用機能ブロック図である。全体図中の上記制約条件例をまとめると、画像32と、制約条件生成プログラムの組1,2,・・・Nから(制約条件発生プログラムソフトウェアモジュール)、例えばユーザーがGUIを用いて多くの制約条件生成プログラムの選択を成す。制約条件生成プログラムの組1−Nは、上記の制約条件と、画像についての空間スペクトル情報の関数として生じたいずれの追加制約条件関係も含んでいる。上記の制約条件の組は一例としてもたらした。本発明は、画像の物質及び照明様相に関する論理的演繹をもたらす、空間スペクトルオペレータに基いた、したがって、最適解が供与された画像の固有照明と物質構成成分とを捕らえている式の組を規定するために行列[A]と[b]を構築するための基本原理に基いた、あらゆる制約関係をも予想している。
FIG. 17 is a general-purpose functional block diagram of the
また、C型トークン化ブロック35又はオペレータブロック28によって生じた、オペレータの組1−Mは、制約条件先生プログラムモジュール1−Nにおいて規定された全てのオペレータを含んでいる。図17において示されているように、サービスプロバイダ24は、選択された制約条件生成プログラム1−Nによって要求されたように全てのオペレータ1−Mを供給し、さらに、選択された制約条件生成プログラム1−Nを制約条件アセンブリ39と、ロジカルスイッチ40を介して結合する(いずれも制約条件ビルダー26内に構築される)。選択した画像32のいずれのオペレータ1−Mもまだサービスプロバイダ24によって保存されていなければ、当該サービスプロバイダ24はオペレータブロック28を使用して、そのようなオペレータを必要に応じて上記のようにしてコンピュータで計算する。制約条件アッセンブリ39は、オペレータの関数として、選択した制約条件生成プログラムのうち各々一つに対し別々の[A][x]=[b]行列と、各制約条件生成プログラム1−Nで規定された制約関係を構築する。各々、[A][x]=[b]行列が上記と同様にして、同様の照明実施例について構築される。
The operator set 1-M generated by the C-
式[A]i[x]=[b]iのシステムの構築が完了するとすぐに、選択した制約条件生成プログラム、i={1,2,・・・N}について、制約条件アッセンブリ39は、各制約条件生成プログラムから、行列成分[A]i、[b]iを連結する。連結された各式が、異なる未知の部分集合[x]を含んでいるかもしれないので、前記アッセンブリは、[x]内の特定の未知数に制約を加える、個々の行列[A]iの対応する列が位置合せされるように実行される。前記連結された行列、[A][x]=[b]は、次にソルバー30へ入力されて、完全な[x]ベクトル内の未知数を解き、選択した最適化手順に従って、固有画像34の出力をする。結合した行列[A][x]=[b]内の個々の制約条件は、(五感で)認識される各制約条件の重要性、強度、又は経験的に決定された信頼水準のようなファクタの関数として、互いに評価され得る。
As soon as the construction of the system of the formula [A] i [x] = [b] i is completed, the
上記実施例の同一照明制約条件は、C型トークン及びB型トークン空間スペクトルオペレータを使用する。これらトークンオペレータは、人工物を含む、画像内にしばしば描かれるような一つの物質の広い表面積を含んでいる画像の優れた表現をもたらす。しかしながら多くの自然のシーンでは、砂、草、石、葉等のような非常にテクスチャ(表面模様)のついた広い面積の領域が存在する。先に述べたように、C型トークンを用いたB型トークンの識別は、一つの画像テクスチャ内では困難であろう。本発明のさらなる特徴構成にしたがうと、テクストンヒストグラムオペレータが、例えば[A][x]=[b]行列によって表現されたような制約条件に基いた最適化において有用である手法で、テクスチャ領域の均一な空間変化を統計学的に捕らえるための手法をもたらす。 The same illumination constraint in the above example uses a C-type token and a B-type token spatial spectrum operator. These token operators provide an excellent representation of images that contain a large surface area of a single substance, such as often drawn in an image, including artifacts. However, in many natural scenes, there is a large area with a very texture (surface pattern) such as sand, grass, stones, leaves and the like. As described above, identification of a B-type token using a C-type token may be difficult within one image texture. In accordance with a further feature of the present invention, the Texton Histogram operator is useful in optimization based on constraints such as those represented by, for example, an [A] [x] = [b] matrix. It provides a method for statistically capturing uniform spatial changes.
したがって本発明のこの特徴構成にしたがい、上記のようにB型トークンを識別することにおいて用いるために強度ヒストグラムから、画像のテクスチャ領域内にC型トークンを発生するのではなく、テクスチャトークンが、制約条件において用いるためにB型トークンの種として発生される。トークンヒストグラムオペレータの模範的な実施形態では、オペレータブロック28は、画像の各ピクセル(又は、テクスチャを含んでいるものとして識別された画像のこれら領域のピクセル)を、例えばRGBカラーバンド値のような、記録した各画像ファイル18のカラーバンド表現から、テクストンラベル及びテクストンヒストグラムラベルを有する二つのバンド表現へ変換する。前記ピクセルについての二つのバンド表現は、それから、次に記載のように、テクスチャトークンを識別するために用いられる。
Thus, according to this feature of the present invention, instead of generating a C-type token in the texture region of the image from the intensity histogram for use in identifying a B-type token as described above, the texture token is a constraint. Generated as a seed for B-type tokens for use in conditions. In the exemplary embodiment of the token histogram operator, the
各ピクセルに対するテクストンラベルが、クラスタ化処理の実行によって生じる。テクスチャは、テクスチャ基本要素(例えば、草テクスチャ、草の単一葉身で)によって、及び、当該基本要素の空間分布によって特徴を描写される。テクストン解析は、例えば、クラスタ化アルゴリズムによって、テクスチャ基本要素の特徴を描写するための分析的手法である。クラスタ化とは、自然群又は自然クラスタの中心をデータ内に位置決めする処理である。本発明の模範的な実施形態では、前記データは、物質要素と照明要素とに分離された画像のピクセルの間から選択されたピクセル区画を含んでいる。例えば、3×3ピクセル区画がK個の異なる群にクラスタ化され、その際、各群は指定番号(1,2,3,・・・K)を割り当てられる。3×3配列の各ピクセルに対するテクストンラベルとは、クラスタ化処理中に各区画が割り当てられた群の群番号である。 A texton label for each pixel is generated by performing the clustering process. Textures are characterized by texture primitives (eg, grass texture, with a single leaf blade of grass) and by the spatial distribution of the primitives. Texton analysis is an analytical technique for describing features of texture elementary elements by, for example, a clustering algorithm. Clustering is a process of positioning the natural group or the center of the natural cluster in the data. In an exemplary embodiment of the invention, the data includes a pixel segment selected from among the pixels of the image separated into a material element and a lighting element. For example, 3 × 3 pixel partitions are clustered into K different groups, each group being assigned a designated number (1, 2, 3,... K). The texton label for each pixel in the 3 × 3 array is the group number of the group to which each partition is assigned during the clustering process.
クラスタ化アルゴリズムの実行を速めるために、3×3区画の無作為サンプルが画像全体にわたって、又は、クラスタ化アルゴリズムにおいて処理するためのテクスチャを含んでいるとして識別された画像の領域全体にわたって選択され得る。CPU12によるクラスタ化アルゴリズムの実行後(オペレータブロック28としての処理)、画像の各3×3区画は、選択された無作為サンプルについて実行されたように、クラスタ化処理中に識別された複数のK群中央のうち最も近い一つのテクストンラベルに割り当てられる。 To speed up the execution of the clustering algorithm, a random sample of 3x3 partitions can be selected over the entire image or the entire region of the image identified as containing texture for processing in the clustering algorithm. . After execution of the clustering algorithm by the CPU 12 (processing as an operator block 28), each 3 × 3 section of the image is identified by a plurality of K identified during the clustering process as performed for the selected random sample. Assigned to the closest texton label in the center of the group.
有利には、クラスタ化アルゴリズムの実行前に、画像のピクセルを画像強度規格化する。強度に基いた距離行列を使用するクラスタ化処理では、画像の暗領域は一つの群内におかれるかもしれず、その結果、画像のテクスチャ領域の陰影領域に対する群の過少表現となる。画像の規格化は、変化する照明下でのテクストン領域に対し、より正確なテクストン表現をあたえる。ピクセルに対する規格化した強度は次の式によって表され得る。
inorm(n,m)=log(i(n,m)/ib(n,m))
ここで、inorm(n,m)はピクセルp(n,m)に対する規格化した強度であり、画像ファイル18に記録されたように、i(n,m)はピクセルp(n,m)に対する強度、及び、ib(n,m)はピクセルp(n,m)のぼかしフィルタ又は低減フィルタをかけたものである。例えば、10ピクセルのブラー半径が、いずれの標準ブラーリング関数においても用いられ得る。
Advantageously, the image pixels are image intensity normalized prior to the execution of the clustering algorithm. In a clustering process using an intensity-based distance matrix, the dark regions of the image may be in one group, resulting in an underrepresentation of the group over the shadow region of the texture region of the image. Image normalization provides a more accurate texton representation for texton areas under changing lighting. The normalized intensity for a pixel can be expressed by the following equation:
i norm (n, m) = log (i (n, m) / ib (n, m))
Here, i norm (n, m) is the normalized intensity for the pixel p (n, m), and i (n, m) is the pixel p (n, m) as recorded in the
クラスタ化は、例えばKクラスタ又は群Si、i=1,2,・・・Kが存在するK平均クラスタ化のような公知のクラスタ化アルゴリズムに従って実行することが可能であり、及び、μiは全てのデータ点
本発明の模範的な実施形態にしたがい、CPU12は、画像の3×3ピクセル区画を表現している選択した9×1ベクトルを、初期にK個の初期群Siに区分化することにより、前記アルゴリズムを実行する。CPU12は次に、各群Siについて、強度に基いた距離行列を用いることにより中央点μiを計算する。各群Siについて中央点μiを決定後、CPU12は、必要ならば群を変更することによって、各9×1ベクトルを最も近い中央点μiに関連付ける。次にCPU12は、中央点μiを再計算する。CPU12は、各9×1ベクトルを最も近い中央点μiに関連付けるステップと、中央点μiを再計算するステップとを、集束するまで繰り返し実行する。集束したとは、9×1ベクトルのいずれについても群を変更する必要がなくなった時である。その時には、CPU12は、その群の各ベクトルのピクセルに対するテクストンラベルとして、各中央点μiに対し群番号を割り当てる。
According to an exemplary embodiment of the present invention, the
先に述べたように、クラスタ化用サンプルとして選択されなかった3×3区画のピクセルは、クラスタ化処理において、選択した無作為サンプルと同様に識別された、K群中央μiのうち最も近い一つのテクストンラベルに割り当てられる。テクストンラベルマップはサービスプロバイダ24によって保存されて、図2のピクセル配列と同じ範囲を占めている。テクストンラベルマップでは、各ピクセル位置について、各テクストンラベルの表示が存在する。
As mentioned earlier, the 3 × 3 block of pixels that were not selected as the clustering sample are the closest of the K-group center μ i that were identified in the clustering process as well as the selected random sample. Assigned to one texton label. The texton label map is stored by the
画像のピクセルに対するテクストンラベル割り当てが完了するとすぐに、CPU12は、各ピクセルについてテクストンヒストグラムを生成し、画像のテクスチャ領域内の、テクストン表現の空間的変化の表示をもたらす。それを目的として、CPU12はテクストンラベルマップにアクセスする。テクストンラベルマップ内の各ピクセル位置には、例えば21×21ピクセルのピクセル区画が、現在位置の周辺に設定される。21×21区画サイズは、テクスチャの空間的変化を捉えるように、テクストン表現を生じるために用いられた3×3区画サイズよりも遥かに大きい。次にテクストンヒストグラムが、先に述べた強度ヒストグラムと同様にして、21×21区画の中央のピクセル位置に対して生成される。しかしながら、テクストンヒストグラムには、カラーバンド値に基いたビンではなく、各テクストンラベル値、1,2,3,・・・Kについてのビンが存在する。各ビンの数は、各ビンに対してテクストンラベル値を有する21×21区画内のピクセルの数と一致する。
As soon as the texton label assignment for the pixels of the image is complete, the
テクストンラベルマップの各ピクセルについてテクストンヒストグラムが生成した時に、CPU12は第2クラスタ化ステップを実行する。第2クラスタ化ステップでは、テクストンヒストグラムは、スペクトル(波長別)クラスタ化を用いることによってクラスタ化される。スペクトルクラスタ化技術は、クラスタ化の次元の数をより少数の次元に減少するように、興味の対象であるデータの相似行列のスペクトル(実施例では、テクストンヒストグラム)を用いる。供与されたデータ点の組Aについての相似行列は行列Sとして規定され得る、ここでSijは、複数の点間における類似度の基準を表す。
テクストンヒストグラムラベル(1,2,・・・)が、クラスタ化手法によって規定された各クラスタ群に割り当てられる。テクストンラベルマップの各ピクセルについて、各ピクセルの前記テクストンヒストグラムに最も近づく別のテクストンヒストグラムに対応するクラスタ群のテクストンヒストグラムラベルが、そのピクセルに割り当てられる。距離は、カイ二乗ヒストグラム距離として規定される。各ピクセルへのテクストンヒストグラムラベルの割り当てが完了するとすぐに、各ピクセルは今や、二つのバンド、つまりテクストンラベル、テクストンヒストグラムラベル表現によって表示されている。 A texton histogram label (1, 2,...) Is assigned to each cluster group defined by the clustering technique. For each pixel in the texton label map, a cluster group texton histogram label corresponding to another texton histogram closest to the texton histogram of each pixel is assigned to that pixel. The distance is defined as the chi-square histogram distance. As soon as the assignment of texton histogram labels to each pixel is complete, each pixel is now represented by two bands: a texton label, a texton histogram label representation.
本発明の特徴構成にしたがい、前記二つのバンド、つまりテクストンラベル、画像ファイル18のピクセルに対するテクストンヒストグラムラベル表現は、連結された行列[A][x]=[b]内の[A]i[x]=[b]i構成成分の構築用制約条件において用いられ得る。例えば、一つの画像の或る領域であって、当該領域内の隣接するピクセルが全て同一の二つのバンド、つまりテクストンラベル、テクストンヒストグラムラベル表現を有する領域が、当該画像内に表示されたテクスチャと同一の平均物質領域を含んでいると仮定することができる。そのような領域は、テクスチャトークン、つまりB型トークンの種として参照され得る。したがって、同一テクスチャトークン内の全てのC型トークンが同一の平均物質で成っているという制約条件を課することが可能となる。この制約条件では、前記C型トークンは、隣接するピクセルのカラーバンド値から、C型トークン化ブロック35によって生じたC型トークンである。
In accordance with a feature of the present invention, the texton histogram label representation for the two bands, ie, the texton label, pixels of the
ユーザーが、制約条件生成プログラム及びGUIを介して数学的操作を選択することによって本発明の上記模範的実施形態を書き表す間に、画像分離処理は他の操作モードで例えば自動的に、制約条件生成プログラムと数学的操作が、例えば画像パラメータの関数として自動的に選択されることによって、画像に実行される。 While the user writes the above exemplary embodiment of the present invention by selecting a mathematical operation via a constraint generator and GUI, the image separation process may generate constraint conditions in other modes of operation, eg automatically. Programs and mathematical operations are performed on the image, for example by being automatically selected as a function of image parameters.
次に図18を参照すると、図3の画像分離システム構成のような画像変換手法を試験するためのテストベッド用ブロック図を示している。前記テストベッドは、自動選択を確認して設定するために、画像分離操作を試験するのに用いられる。入力32は、画像ファイル18のようなデータとパラメータを、データ及びその関連したパラメータデータファイルとして含む。変換要素50は、実施例では、入力画像ファイル18の画像に対応する固有画像を生成することによって、データを変換するように操作する、図3の画像分離システム構成を含む。前記固有画像は、先に述べたように物質画像と照明画像とを含む。
Referring now to FIG. 18, there is shown a test bed block diagram for testing an image conversion technique such as the image separation system configuration of FIG. The test bed is used to test image separation operations to confirm and set automatic selection.
本発明の特徴構成にしたがい、生成した固有画像は、当該固有画像を入力データとして用いるテスト/アプリケーションモジュール52に入力される。本実施例の前記テスト/アプリケーションモジュール52は対象物認識手法である。前記対象物認識手法は、特徴に基いた学習フレームワーク、外観に基いた学習フレームワーク、形状に基いた解析と分類、及び、モデルに基いた対象物認識のような公知の対象物認識手法を含む。試験手順において、既知対象物の画像の組を含んでいるギャラリー54が、変換要素に入力された画像ファイル18を含むプローブ56と共に入力される。対象物認識手法は、例えば或る画像とその対応する固有画像との間のような認識能力における改善を確実にするように、プローブと固有画像の各々に実行される。
According to the characteristic configuration of the present invention, the generated unique image is input to the test /
全ての試験結果は、一連のプローブと対応する固有画像に対する全ての対象物認識結果をコンパイルするように作用する、解析モジュール58に入力される。前記コンパイルは、パブリッシュモジュール60によって表示され、フィードバックループ62に出力もされる。前記フィードバックループ62は、変換要素50とテスト/アプリケーションモジュール52の各々を制御し、異なる制約条件生成プログラム、数学的最適化操作及び変数パラメータの選択下で、同一画像に操作を実施する。
All test results are input to an
例えばB型トークンを識別するためのフィルタレスポンスの本模範的実施形態では、変換要素50の分離操作において用いられるべき変数パラメータは、σファクタ、区画サイズと形状、低フィルタレスポンスの規定、及び、十分な重なりの規定を含んでいる。異なるパラメータの組み合わせは異なる結果を生じる。一組のパラメータは一つの画像の幾つかの部分を、上手く規定されたB型トークンによって捕らえることができるが、当該画像の、多くの小さな非結合区画で存在する他の部分は捕らえられずに残っており、他のパラメータの組が画像の他の部分を上手く捕らえるかもしれない。したがって、パラメータ組内において値を変化することによって、解析及び比較についてより優れた全体的な結果をもたらす、幾つかのセグメント化結果の組が得られうる。また、用いられた特定の対象物認識手法は、様々な対象物認識手法/パラメータの組み合わせ、及び、結果への影響を解析するために、テスト/アプリケーションモジュール52内で変更することも可能である。
For example, in this exemplary embodiment of a filter response for identifying a B-type token, the variable parameters to be used in the separation operation of the
ドメイン知識も、特定の種類の画像に対し自動的な設定を確定するために、異なる制約条件及び最適化処理に相関することが可能である。例えば、冬の午後3時に撮られた広い緑色の芝を有する屋外シーンを描いている画像について、変換要素50及びテスト/アプリケーションモジュール52の各々によって、様々に異なる制約条件、最適化処理、変数パラメータ、対象物認識手法等によって操作を実行すること、及び、そのような画像に対して最善な設定を経験的に決定するように解析することが可能となる。そのために、公知の学習アルゴリズムがフィードバックループ62において実行されうる。選択した異なる制約条件の組について、各選択した制約条件に対する最適な重きを確定するために、各々のウェートを変化することも可能である。
Domain knowledge can also be correlated to different constraints and optimization processes to determine automatic settings for specific types of images. For example, for an image depicting an outdoor scene with a wide green grass taken at 3 pm in winter, each of the
上記明細書では、本発明は特定の模範的実施形態とその実施例を参照して記載されてきた。しかしながら、請求項に列挙された本発明の広い精神と範囲から逸脱することなくそれらに対する様々な修正及び変更が成されうる。したがって当該明細書と図面は、認識を限定するのではなく一つの例示手法であるとみなされる。 In the foregoing specification, the invention has been described with reference to specific exemplary embodiments and examples thereof. However, various modifications and changes may be made thereto without departing from the broad spirit and scope of the invention as recited in the claims. The specification and drawings are thus to be regarded as an exemplary approach, rather than limiting recognition.
Claims (10)
多帯域色画像を供給するステップと、
前記画像のための空間スペクトル演算子で表される空間スペクトル情報を生成するステップと、ここで前記空間スペクトル情報は、カラーバンドに関して前記画像の連続したピクセル間のスペクトル関係により与えられ、これらスペクトル関係は前記画像の物質特性及び照明特性と、ピクセルスペクトル関係の空間エクステント(範囲)に関連し、
前記空間スペクトル情報の関数として制約条件を規定するステップと、ここで前記制約条件は、前記空間スペクトル演算子の幾つかに加えられて行列式において表された制約関係の表現式であり、及び、
それぞれが前記画像に対応していて、前記画像の物質成分を表示する物質画像及び前記画像の照明成分を表示する照明画像を識別するために、前記行列式の最適化した解を有する画像分離操作で前記制約条件を使用するステップとを含む、方法。 In an automated and computer managed image processing method,
Providing a multi-band color image;
Generating spatial spectral information represented by a spatial spectral operator for the image , wherein the spatial spectral information is given by a spectral relationship between successive pixels of the image with respect to a color band, and these spectral relationships Is related to the material and lighting properties of the image and the spatial extent of the pixel spectrum.
A step of defining a function and to constraint conditions of the spatial spectral information, wherein the constraint condition, the a expression of the represented constraint relationship in some the added by the determinant of the spatial spectrum operator, as well as,
An image separation operation , each corresponding to the image , having an optimized solution of the determinant to identify a material image displaying the material component of the image and an illumination image displaying the illumination component of the image Using the constraints .
多帯域色画像を規定する画像ファイルを保存するメモリとを有するコンピュータシステムにおいて、
前記CPUは、前記画像のための空間スペクトル演算子により表される空間スペクトル情報を生成するためのルーチンを実行するように定められ且つ構成されており、ここで前記空間スペクトル情報は、カラーバンドに関して前記画像の連続したピクセル間のスペクトル関係により与えられ、これらスペクトル関係は前記画像の物質特性及び照明特性と、ピクセルスペクトル関係の空間エクステント(範囲)に関連し、
当該CPUは前記空間スペクトル情報の関数として制約条件を規定し、ここで前記制約条件は、前記空間スペクトル演算子の幾つかに加えられて行列式において表された制約関係の表現式であり、
当該CPUは、それぞれが前記画像に対応していて、前記画像の物質成分を表示する物質画像及び前記画像の照明成分を表示する照明画像を識別するために、前記行列式の最適化した解を有する画像分離操作で前記制約条件を用いる、コンピュータシステム。 CPU ,
A computer system having a memory for storing an image file defining a multiband color image;
The CPU is defined and configured to execute a routine for generating spatial spectral information represented by a spatial spectral operator for the image , wherein the spatial spectral information relates to color bands. Given by spectral relationships between successive pixels of the image, these spectral relationships being related to the material and lighting properties of the image and the spatial extent of the pixel spectral relationship,
The CPU defines a constraint as a function of the spatial spectrum information , where the constraint is an expression of the constraint relationship represented in the determinant in addition to some of the spatial spectrum operators;
The CPU corresponds to the image and determines an optimized solution of the determinant to identify a material image that displays the material component of the image and an illumination image that displays the illumination component of the image. A computer system using the constraint condition in an image separation operation.
コンピュータ制御可能な次の処理ステップ、つまり、
コンピュータメモリ内の、多帯域色画像を描いている画像ファイルを供給するステップと、
前記画像のための空間スペクトル演算子により表される空間スペクトル情報を生成するステップと、ここで前記空間スペクトル情報は、カラーバンドに関して前記画像の連続したピクセル間のスペクトル関係により与えられ、これらスペクトル関係は前記画像の物質特性及び照明特性と、ピクセルスペクトル関係の空間エクステント(範囲)に関連し、
前記空間スペクトル情報の関数として一つの制約条件を規定するステップと、ここで前記制約条件は、前記空間スペクトル演算子の幾つかに加えられて行列式において表された制約関係の表現式であり、及び、
それぞれが前記画像に対応していて、前記画像の物質成分を表示する物質画像及び前記画像の照明成分を表示する照明画像を識別するために、前記行列式の最適化した解を有する画像分離操作に前記制約条件を用いるステップとを有している、コンピュータプログラム。 In a computer program arranged on a computer-readable medium,
The next computer-controllable processing step, ie
Providing an image file depicting a multi-band color image in computer memory;
Generating spatial spectral information represented by a spatial spectral operator for the image , wherein the spatial spectral information is given by a spectral relationship between successive pixels of the image with respect to color bands, and these spectral relationships Is related to the material and lighting properties of the image and the spatial extent of the pixel spectrum.
Defining a constraint as a function of the spatial spectrum information , wherein the constraint is an expression of a constraint relationship represented in a determinant in addition to some of the spatial spectrum operators; as well as,
An image separation operation , each corresponding to the image , having an optimized solution of the determinant to identify a material image displaying the material component of the image and an illumination image displaying the illumination component of the image Using the above-mentioned constraint condition .
Applications Claiming Priority (3)
| Application Number | Priority Date | Filing Date | Title |
|---|---|---|---|
| US12/315,643 US8139850B2 (en) | 2008-12-05 | 2008-12-05 | Constraint generation for use in image segregation |
| US12/315,643 | 2008-12-05 | ||
| PCT/US2009/006308 WO2010065086A1 (en) | 2008-12-05 | 2009-11-30 | A constraint generator for use in image segregation |
Publications (3)
| Publication Number | Publication Date |
|---|---|
| JP2012511207A JP2012511207A (en) | 2012-05-17 |
| JP2012511207A5 JP2012511207A5 (en) | 2012-10-18 |
| JP5487212B2 true JP5487212B2 (en) | 2014-05-07 |
Family
ID=42231120
Family Applications (1)
| Application Number | Title | Priority Date | Filing Date |
|---|---|---|---|
| JP2011539498A Active JP5487212B2 (en) | 2008-12-05 | 2009-11-30 | Image processing method, computer system, and computer program |
Country Status (5)
| Country | Link |
|---|---|
| US (1) | US8139850B2 (en) |
| EP (1) | EP2356614B1 (en) |
| JP (1) | JP5487212B2 (en) |
| CN (1) | CN102308306B (en) |
| WO (1) | WO2010065086A1 (en) |
Families Citing this family (45)
| Publication number | Priority date | Publication date | Assignee | Title |
|---|---|---|---|---|
| US7970226B2 (en) * | 2007-04-23 | 2011-06-28 | Microsoft Corporation | Local image descriptors |
| EP2036045A1 (en) * | 2007-07-11 | 2009-03-18 | Cairos technologies AG | Video tracking method and appartus arrangement for performing the method |
| US8285055B1 (en) | 2008-09-10 | 2012-10-09 | Adobe Systems Incorporated | Determining correspondence between image regions |
| US8407575B1 (en) | 2008-09-10 | 2013-03-26 | Adobe Systems Incorporated | Video content summary |
| US8004576B2 (en) | 2008-10-31 | 2011-08-23 | Digimarc Corporation | Histogram methods and systems for object recognition |
| US8139867B2 (en) * | 2008-12-05 | 2012-03-20 | Tandent Vision Science, Inc. | Image segregation system architecture |
| US20100142846A1 (en) * | 2008-12-05 | 2010-06-10 | Tandent Vision Science, Inc. | Solver for image segregation |
| US8139850B2 (en) * | 2008-12-05 | 2012-03-20 | Tandent Vision Science, Inc. | Constraint generation for use in image segregation |
| US8391601B2 (en) * | 2009-04-30 | 2013-03-05 | Tandent Vision Science, Inc. | Method for image modification |
| US9330476B2 (en) * | 2009-05-21 | 2016-05-03 | Adobe Systems Incorporated | Generating a modified image with additional content provided for a region thereof |
| US8355592B1 (en) | 2009-05-06 | 2013-01-15 | Adobe Systems Incorporated | Generating a modified image with semantic constraint |
| US8194975B2 (en) * | 2009-06-29 | 2012-06-05 | Tandent Vision Science, Inc. | Use of an intrinsic image in face recognition |
| US9563815B2 (en) * | 2009-09-15 | 2017-02-07 | Tandent Vision Science, Inc. | Method and system for processing an image received from a remote source |
| US8892853B2 (en) * | 2010-06-10 | 2014-11-18 | Mobileye Technologies Limited | Hardware to support looping code in an image processing system |
| US8571328B2 (en) | 2010-08-16 | 2013-10-29 | Adobe Systems Incorporated | Determining correspondence between image regions |
| US20130091437A1 (en) * | 2010-09-03 | 2013-04-11 | Lester F. Ludwig | Interactive data visulization utilizing hdtp touchpad hdtp touchscreens, advanced multitouch, or advanced mice |
| US8625927B2 (en) | 2010-10-27 | 2014-01-07 | Adobe Systems Incorporated | Image processing using image web |
| US8798392B2 (en) * | 2010-11-10 | 2014-08-05 | Tandent Vision Science, Inc. | Method and system for generating intrinsic images using a smooth illumination constraint |
| US8542917B2 (en) * | 2010-11-10 | 2013-09-24 | Tandent Vision Science, Inc. | System and method for identifying complex tokens in an image |
| US8582873B2 (en) * | 2011-06-16 | 2013-11-12 | Tandent Vision Science, Inc. | Use of an object database in an image process |
| US8606050B2 (en) | 2011-06-16 | 2013-12-10 | Tandent Vision Science, Inc. | Method for processing multiple images of a same scene |
| US9053537B2 (en) * | 2011-09-21 | 2015-06-09 | Tandent Vision Science, Inc. | Classifier for use in generating a diffuse image |
| EP2745240A2 (en) | 2011-09-29 | 2014-06-25 | Koninklijke Philips N.V. | Distortion reduced signal detection |
| US8249342B1 (en) * | 2011-11-21 | 2012-08-21 | Tandent Vision Science, Inc. | Color analytics for a digital image |
| US8913829B2 (en) * | 2012-06-05 | 2014-12-16 | Tandent Vision Science, Inc. | Automatic processing scale estimation for use in an image process |
| CN104335006B (en) * | 2012-07-18 | 2017-05-24 | 形创有限公司 | 3D scanning and positioning interface |
| US8934735B2 (en) * | 2012-09-07 | 2015-01-13 | Tandent Vision Science, Inc. | Oriented, spatio-spectral illumination constraints for use in an image progress |
| US9576341B2 (en) * | 2013-10-30 | 2017-02-21 | Ricoh Imaging Company, Ltd. | Image-processing system, imaging apparatus and image-processing method |
| US9158989B1 (en) | 2014-05-08 | 2015-10-13 | Tandent Vision Science, Inc. | Color pure scale-spaced pyramid arrangement for use in an image segregation |
| US9158973B1 (en) | 2014-05-08 | 2015-10-13 | Tandent Vision Science, Inc. | Temporal constraint relationship for use in an image segregation for frames of a video |
| US9361700B2 (en) | 2014-05-08 | 2016-06-07 | Tandent Vision Science, Inc. | Constraint relationship for use in an image segregation |
| CN104200217B (en) * | 2014-08-07 | 2017-05-24 | 哈尔滨工程大学 | Hyperspectrum classification method based on composite kernel function |
| CN104298240A (en) * | 2014-10-22 | 2015-01-21 | 湖南格兰博智能科技有限责任公司 | Guiding robot and control method thereof |
| US9218534B1 (en) | 2014-11-17 | 2015-12-22 | Tandent Vision Science, Inc. | Method and system for classifying painted road markings in an automotive driver-vehicle-assistance device |
| US9361527B1 (en) * | 2014-11-17 | 2016-06-07 | Tandent Vision Science, Inc. | Method and system for classifying painted road markings in an automotive driver vehicle-assistance device |
| US9875415B2 (en) | 2014-11-17 | 2018-01-23 | Tandent Vision Science, Inc. | Method and system for classifying painted road markings in an automotive driver-vehicle-asistance device |
| US20170199845A1 (en) * | 2016-01-08 | 2017-07-13 | Rehabilitation Institute Of Chicago | Convex Relaxation Regression Systems and Related Methods |
| WO2018027259A1 (en) | 2016-08-08 | 2018-02-15 | Bionics Institute | Systems and methods for monitoring neural activity |
| WO2018213872A1 (en) | 2017-05-22 | 2018-11-29 | The Bionics Institute Of Australia | "systems and methods for monitoring neural activity" |
| US11494953B2 (en) * | 2019-07-01 | 2022-11-08 | Microsoft Technology Licensing, Llc | Adaptive user interface palette for augmented reality |
| CN111169016B (en) * | 2019-12-18 | 2021-11-16 | 西北工业大学 | 3+2 shaft unsupported 3D printing manufacturing method for blade parts |
| US11429663B2 (en) | 2020-06-02 | 2022-08-30 | Western Digital Technologies, Inc. | Storage system and method for host-assisted memory block color coding for faster media search |
| WO2022031278A1 (en) * | 2020-08-05 | 2022-02-10 | Hewlett-Packard Development Company, L.P. | Analyzing image data |
| US11710239B2 (en) * | 2020-11-10 | 2023-07-25 | Here Global B.V. | Method, apparatus, and system using a machine learning model to segment planar regions |
| CN113256776B (en) * | 2021-06-21 | 2021-10-01 | 炫我信息技术(北京)有限公司 | Image processing method and device, electronic equipment and computer readable storage medium |
Family Cites Families (35)
| Publication number | Priority date | Publication date | Assignee | Title |
|---|---|---|---|---|
| US5495536A (en) * | 1991-05-08 | 1996-02-27 | Sandia Corporation | Image processing system and method for recognizing and removing shadows from the image of a monitored scene |
| US5774112A (en) * | 1994-10-25 | 1998-06-30 | International Business Machines Corporation | Method and apparatus for tone correction of a digital color image with preservation of the chromaticity of the image |
| DE69518829T2 (en) * | 1995-05-11 | 2001-03-15 | Agfa Gevaert Nv | Radiation field detection method |
| US6061091A (en) * | 1996-05-30 | 2000-05-09 | Agfa Gevaert N.V. | Detection of and correction for specular reflections in digital image acquisition |
| KR100237284B1 (en) * | 1997-04-28 | 2000-01-15 | 윤종용 | A method for detecting the illumination color from a color image |
| AUPP764398A0 (en) * | 1998-12-11 | 1999-01-14 | Canon Kabushiki Kaisha | Method and apparatus for computing the similarity between images |
| DE19904372C2 (en) * | 1999-02-03 | 2002-08-01 | Schneider Laser Technologies | Imaging system |
| US7219086B2 (en) * | 1999-04-09 | 2007-05-15 | Plain Sight Systems, Inc. | System and method for hyper-spectral analysis |
| AU7313000A (en) * | 1999-09-17 | 2001-04-24 | Nature Technology Co., Ltd. | Image pickup system, image processor, and camera |
| DE10000779A1 (en) * | 2000-01-11 | 2001-07-12 | Stuttgart Mikroelektronik | Color image saturation method for transformation of image data involves spectral analysis and logarithmic compression |
| NL1015943C2 (en) * | 2000-08-16 | 2002-02-19 | Ocu Technologies B V | Interpretation of colored documents. |
| JP2002150315A (en) * | 2000-11-09 | 2002-05-24 | Minolta Co Ltd | Image processing device and recording medium |
| FR2832528B1 (en) * | 2001-11-22 | 2004-02-13 | Eastman Kodak Co | DETERMINING AN ILLUMINANT OF A DIGITAL COLOR IMAGE BY SEGMENTATION AND FILTERING |
| US7031525B2 (en) * | 2002-07-30 | 2006-04-18 | Mitsubishi Electric Research Laboratories, Inc. | Edge detection based on background change |
| US6892921B2 (en) | 2002-10-30 | 2005-05-17 | Porter-Cable Corporation | Apparatus and method to indicate required compressor pressure for use with pneumatic tool device |
| JP2006526783A (en) * | 2003-05-30 | 2006-11-24 | アンドリュー エム. ラビノビッチ、 | Color separation and detection of areas of interest in tissue samples |
| WO2006011261A1 (en) * | 2004-07-26 | 2006-02-02 | Matsushita Electric Industrial Co., Ltd. | Image processing method, image processing device, and image processing program |
| JP4783795B2 (en) | 2005-01-27 | 2011-09-28 | タンデント ビジョン サイエンス インコーポレーティッド | Distinguishing between illumination and reflection boundaries |
| EP1978486B1 (en) * | 2005-05-13 | 2016-12-21 | Tripath Imaging, Inc. | Method of image analysis based on chromogen separation |
| US8976174B2 (en) | 2006-01-27 | 2015-03-10 | Tandent Vision Science, Inc. | Bi-illuminant dichromatic reflection model for image manipulation |
| US8976173B2 (en) | 2006-01-27 | 2015-03-10 | Tandent Vision Science, Inc. | Bi-illuminant dichromatic reflection model for image manipulation |
| US7995058B2 (en) * | 2006-01-27 | 2011-08-09 | Tandent Vision Science, Inc. | Method and system for identifying illumination fields in an image |
| US7596266B2 (en) * | 2006-04-13 | 2009-09-29 | Tandent Vision Science, Inc. | Method and system for separating illumination and reflectance using a log color space |
| JP4753082B2 (en) * | 2006-07-11 | 2011-08-17 | 独立行政法人産業技術総合研究所 | High-order local co-occurrence feature derivation method and program |
| US7747079B2 (en) * | 2006-09-27 | 2010-06-29 | Tandent Vision Science, Inc. | Method and system for learning spatio-spectral features in an image |
| US7894662B2 (en) * | 2006-10-11 | 2011-02-22 | Tandent Vision Science, Inc. | Method for using image depth information in identifying illumination fields |
| WO2008067472A2 (en) * | 2006-11-29 | 2008-06-05 | President And Fellows Of Harvard College | A new spatio-spectral sampling paradigm for imaging and a novel color filter array design |
| US8144978B2 (en) * | 2007-08-01 | 2012-03-27 | Tandent Vision Science, Inc. | System and method for identifying complex tokens in an image |
| US8139850B2 (en) * | 2008-12-05 | 2012-03-20 | Tandent Vision Science, Inc. | Constraint generation for use in image segregation |
| US8139867B2 (en) * | 2008-12-05 | 2012-03-20 | Tandent Vision Science, Inc. | Image segregation system architecture |
| US8391601B2 (en) * | 2009-04-30 | 2013-03-05 | Tandent Vision Science, Inc. | Method for image modification |
| US8478029B2 (en) * | 2009-05-26 | 2013-07-02 | Tandent Vision Science, Inc. | Multi-resolution analysis in image segregation |
| US8311338B2 (en) * | 2009-09-15 | 2012-11-13 | Tandent Vision Science, Inc. | Method and system for learning a same-material constraint in an image |
| US9563815B2 (en) * | 2009-09-15 | 2017-02-07 | Tandent Vision Science, Inc. | Method and system for processing an image received from a remote source |
| US8452109B2 (en) * | 2010-01-11 | 2013-05-28 | Tandent Vision Science, Inc. | Image segregation system with method for handling textures |
-
2008
- 2008-12-05 US US12/315,643 patent/US8139850B2/en active Active
-
2009
- 2009-11-30 JP JP2011539498A patent/JP5487212B2/en active Active
- 2009-11-30 WO PCT/US2009/006308 patent/WO2010065086A1/en active Application Filing
- 2009-11-30 CN CN200980156305.9A patent/CN102308306B/en active Active
- 2009-11-30 EP EP09830704.4A patent/EP2356614B1/en active Active
Also Published As
| Publication number | Publication date |
|---|---|
| WO2010065086A1 (en) | 2010-06-10 |
| JP2012511207A (en) | 2012-05-17 |
| US20100142805A1 (en) | 2010-06-10 |
| CN102308306B (en) | 2014-12-03 |
| EP2356614A4 (en) | 2013-06-12 |
| CN102308306A (en) | 2012-01-04 |
| EP2356614B1 (en) | 2018-07-25 |
| EP2356614A1 (en) | 2011-08-17 |
| US8139850B2 (en) | 2012-03-20 |
Similar Documents
| Publication | Publication Date | Title |
|---|---|---|
| JP5487212B2 (en) | Image processing method, computer system, and computer program | |
| US8600169B2 (en) | Method and system for learning a same-material constraint in an image | |
| US8139867B2 (en) | Image segregation system architecture | |
| US8452109B2 (en) | Image segregation system with method for handling textures | |
| JP5998049B2 (en) | Automated computerized method for processing images and a computer program for performing such a method | |
| US8478029B2 (en) | Multi-resolution analysis in image segregation | |
| US8194975B2 (en) | Use of an intrinsic image in face recognition | |
| US8260050B2 (en) | Test bed for optimizing an image segregation | |
| US20100142846A1 (en) | Solver for image segregation | |
| US7760912B2 (en) | Image segregation system with method for handling textures | |
| US8175390B2 (en) | System and method for illumination invariant image segmentation | |
| US9542614B2 (en) | Constraint relationship for use in an image segregation | |
| US20150324662A1 (en) | Method for identifying color-based vectors for analysis of frames of a video | |
| US20150324660A1 (en) | Multi-scale pyramid arrangement for use in an image segregation | |
| US20150324661A1 (en) | Method for detection of blend pixels for use in an image segregation | |
| WO2015171355A1 (en) | A method for identifying color-based vectors for analysis of frames of a video | |
| US9158989B1 (en) | Color pure scale-spaced pyramid arrangement for use in an image segregation | |
| US9158973B1 (en) | Temporal constraint relationship for use in an image segregation for frames of a video |
Legal Events
| Date | Code | Title | Description |
|---|---|---|---|
| A521 | Request for written amendment filed |
Free format text: JAPANESE INTERMEDIATE CODE: A523 Effective date: 20120829 |
|
| A621 | Written request for application examination |
Free format text: JAPANESE INTERMEDIATE CODE: A621 Effective date: 20120829 |
|
| A977 | Report on retrieval |
Free format text: JAPANESE INTERMEDIATE CODE: A971007 Effective date: 20130628 |
|
| A131 | Notification of reasons for refusal |
Free format text: JAPANESE INTERMEDIATE CODE: A131 Effective date: 20130709 |
|
| A601 | Written request for extension of time |
Free format text: JAPANESE INTERMEDIATE CODE: A601 Effective date: 20131008 |
|
| A602 | Written permission of extension of time |
Free format text: JAPANESE INTERMEDIATE CODE: A602 Effective date: 20131016 |
|
| A601 | Written request for extension of time |
Free format text: JAPANESE INTERMEDIATE CODE: A601 Effective date: 20131108 |
|
| A602 | Written permission of extension of time |
Free format text: JAPANESE INTERMEDIATE CODE: A602 Effective date: 20131115 |
|
| A521 | Request for written amendment filed |
Free format text: JAPANESE INTERMEDIATE CODE: A523 Effective date: 20131209 |
|
| TRDD | Decision of grant or rejection written | ||
| A01 | Written decision to grant a patent or to grant a registration (utility model) |
Free format text: JAPANESE INTERMEDIATE CODE: A01 Effective date: 20140218 |
|
| A61 | First payment of annual fees (during grant procedure) |
Free format text: JAPANESE INTERMEDIATE CODE: A61 Effective date: 20140224 |
|
| R150 | Certificate of patent or registration of utility model |
Ref document number: 5487212 Country of ref document: JP Free format text: JAPANESE INTERMEDIATE CODE: R150 |
|
| R250 | Receipt of annual fees |
Free format text: JAPANESE INTERMEDIATE CODE: R250 |
|
| R250 | Receipt of annual fees |
Free format text: JAPANESE INTERMEDIATE CODE: R250 |
|
| R250 | Receipt of annual fees |
Free format text: JAPANESE INTERMEDIATE CODE: R250 |
|
| S111 | Request for change of ownership or part of ownership |
Free format text: JAPANESE INTERMEDIATE CODE: R313113 |
|
| R350 | Written notification of registration of transfer |
Free format text: JAPANESE INTERMEDIATE CODE: R350 |
|
| R250 | Receipt of annual fees |
Free format text: JAPANESE INTERMEDIATE CODE: R250 |
|
| R250 | Receipt of annual fees |
Free format text: JAPANESE INTERMEDIATE CODE: R250 |
|
| R250 | Receipt of annual fees |
Free format text: JAPANESE INTERMEDIATE CODE: R250 |
|
| S111 | Request for change of ownership or part of ownership |
Free format text: JAPANESE INTERMEDIATE CODE: R313113 |
|
| R360 | Written notification for declining of transfer of rights |
Free format text: JAPANESE INTERMEDIATE CODE: R360 |
|
| R360 | Written notification for declining of transfer of rights |
Free format text: JAPANESE INTERMEDIATE CODE: R360 |
|
| R371 | Transfer withdrawn |
Free format text: JAPANESE INTERMEDIATE CODE: R371 |
|
| S111 | Request for change of ownership or part of ownership |
Free format text: JAPANESE INTERMEDIATE CODE: R313113 |
|
| R350 | Written notification of registration of transfer |
Free format text: JAPANESE INTERMEDIATE CODE: R350 |
|
| R250 | Receipt of annual fees |
Free format text: JAPANESE INTERMEDIATE CODE: R250 |
|
| R250 | Receipt of annual fees |
Free format text: JAPANESE INTERMEDIATE CODE: R250 |