JP4901075B2 - Computer-readable medium, method and computing device - Google Patents
Computer-readable medium, method and computing device Download PDFInfo
- Publication number
- JP4901075B2 JP4901075B2 JP2004125956A JP2004125956A JP4901075B2 JP 4901075 B2 JP4901075 B2 JP 4901075B2 JP 2004125956 A JP2004125956 A JP 2004125956A JP 2004125956 A JP2004125956 A JP 2004125956A JP 4901075 B2 JP4901075 B2 JP 4901075B2
- Authority
- JP
- Japan
- Prior art keywords
- debug
- code
- probe
- processing function
- calling
- Prior art date
- Legal status (The legal status is an assumption and is not a legal conclusion. Google has not performed a legal analysis and makes no representation as to the accuracy of the status listed.)
- Expired - Fee Related
Links
Images


Classifications
-
- G—PHYSICS
- G06—COMPUTING; CALCULATING OR COUNTING
- G06F—ELECTRIC DIGITAL DATA PROCESSING
- G06F11/00—Error detection; Error correction; Monitoring
- G06F11/28—Error detection; Error correction; Monitoring by checking the correct order of processing
-
- G—PHYSICS
- G06—COMPUTING; CALCULATING OR COUNTING
- G06F—ELECTRIC DIGITAL DATA PROCESSING
- G06F11/00—Error detection; Error correction; Monitoring
- G06F11/36—Preventing errors by testing or debugging software
- G06F11/362—Software debugging
- G06F11/3624—Software debugging by performing operations on the source code, e.g. via a compiler
Landscapes
- Engineering & Computer Science (AREA)
- Theoretical Computer Science (AREA)
- Quality & Reliability (AREA)
- Physics & Mathematics (AREA)
- General Engineering & Computer Science (AREA)
- General Physics & Mathematics (AREA)
- Computer Hardware Design (AREA)
- Debugging And Monitoring (AREA)
- Devices For Executing Special Programs (AREA)
Description
本発明は、ソフトウェア開発に関する。 The present invention relates to software development.
デバッグには、通常、デバッガを使用して行われるが、デバッガとは、ソフトウェア開発者がコンピュータプログラムのランタイムでの挙動を観察し、セマンティックエラーを突き止めることを可能にするツールである。ストップコマンドなどのデバッグコマンドによって、プログラマは、いつでも動作中のプログラムの実行を止めることができる。一方、ブレークポイントを手動で挿入することによって、プログラマは、コードの予め定められた点に達した時にプロセスを停止させることができる。デバッグ対象プログラムは、命令ストリーム内のブレークオペコードに到達する(hit)まで自由に動作し、到達した点でオペレーティングシステムはデバッグ対象プログラムを停止し、その後デバッガはデバッグ対象プログラムを続行させる。したがって、コンピュータプログラムをデバッグする時には、そのプログラムは、動作中(すなわち、プロセスとして実行中)または停止のいずれかである。ステップイントゥ、ステップオーバ、およびステップアウトコマンドなどのある種のデバッグコマンドは、ブレークモード(すなわち、デバッグ対象プログラムが停止している時)に限って機能し、プログラマが、そのプログラムの状態のステップを抜けて(step through)、変数、ポインタ、および/またはその他の内容を監視し、および/または修正できるようにする。 Debugging is usually performed using a debugger, which is a tool that allows a software developer to observe the behavior of a computer program at runtime and pinpoint semantic errors. A debug command such as a stop command allows a programmer to stop the execution of a running program at any time. On the other hand, manually inserting breakpoints allows the programmer to stop the process when a predetermined point in the code is reached. The debug target program operates freely until the break opcode in the instruction stream is reached (hit), at which point the operating system stops the debug target program, and then the debugger continues the debug target program. Thus, when debugging a computer program, the program is either running (ie, running as a process) or stopped. Certain debug commands, such as step into, step over, and step out commands, only work in break mode (ie when the program being debugged is stopped), allowing the programmer to step through the state of the program. Step through, allowing variables, pointers, and / or other content to be monitored and / or modified.
従来のステップは、命令ストリームの静的解析を通して戦略ポイントにブレークオペコードを置き、その後、それぞれのパッチに遭遇する(到達する)まで自由に動作させることにより行われる。たとえば、ステップインでは、ステップインされる関数の先頭にパッチが置かれ、ステップオーバでは、ステップオーバが行われる行の後にパッチが置かれ、ステップアウトでは、現在の関数がリターンした後に実行される命令にパッチが置かれる。しかしながら、そのような従来のステップコマンドでは、プログラマが「関心のないコード」を自動的にスキップすることができない。むしろ、上述のように、プログラマは関心のあるコードに手動でブレークポイントを挿入し、ブレークポイントに到達するまで実行し、および/または関心のないコードを手動でステップを抜けて関心のあるコードに達する必要がある。言い換えると、プログラマは、繰り返し(行ごとに)関心のないコードのステップイントゥを行い、ステップを抜け、関数およびおそらくは関心のないコードの内部のステップオーバを行い、および/または関数およびおそらくは関心のないコードの内部からステップアウトを行う必要が生じる場合がある。 The conventional steps are performed by placing break opcodes at strategic points through static analysis of the instruction stream and then running freely until each patch is encountered (reached). For example, stepping in places a patch at the beginning of the function being stepped in, stepping over places the patch after the line where the stepover occurs, and stepping out executes after the current function returns. A patch is placed on the instruction. However, such conventional step commands do not allow the programmer to automatically skip over “uninteresting code”. Rather, as described above, the programmer manually inserts breakpoints into the code of interest, runs until the breakpoint is reached, and / or manually uninteresting code steps through to the code of interest. Need to reach. In other words, the programmer repeatedly steps into code that is not interested (line by line), exits steps, performs stepover inside functions and possibly uninteresting code, and / or functions and possibly is not interested You may need to step out from inside the code.
たとえば、ステップイントゥコマンドおよびステップオーバコマンドは、関数呼出しを扱う形だけが異なる。どちらのコマンドでも、デバッガはソースコードの次の行を実行するように指示される。その行に関数呼出しが含まれる場合に、ステップイントゥコマンドでは呼出し自体だけが実行され、その関数の内部のコードの最初の行が関心のないコードであるかどうかに関係なく、そのコードの最初の行で停止する。ステップオーバコマンドでは関数全体が実行され、その関数の外にある最初の行が関心のないコードであるかどうかとは無関係に、その最初の行で停止する。入れ子になった関数呼出しでは、ステップイントゥは、最も深く入れ子になった関数にステップインする。たとえば、ステップイントゥが、F1(F2())のような呼出しに対して使用される場合に、デバッガは、関数F2にステップインする。ステップアウトコマンドは、関数がリターンするまでプログラム実行を再開することによって関数のステップアウトを行うために用いられ、および関数呼出しのリターンポイントが関心のないコードに対応するかどうかとは無関係に、そのリターンポイントでブレークを行う。 For example, the Step Into command and the Step Over command differ only in the way they handle function calls. Either command instructs the debugger to execute the next line of source code. If the line contains a function call, the Step Into command only executes the call itself, regardless of whether the first line of code inside the function is uninteresting code or not. Stop at the line. A step over command executes the entire function and stops at the first line, regardless of whether the first line outside the function is uninteresting code. In a nested function call, Step Into steps into the deepest nested function. For example, if step into is used for a call such as F1 (F2 ()), the debugger steps into function F2. The stepout command is used to step out a function by resuming program execution until the function returns, and regardless of whether the return point of the function call corresponds to code that is not of interest. Break at the return point.
さらに、デバッガに、コードの各々の行のそれぞれについてステップインコマンドを反復して実行するように指示して、コードの一部を通ってシングルステップで実行することができるが、このプロセスはデバッグプロセスの性能がかなり低下し、プロセスデッドロック(すなわち、デバッガに起因する同一キャッシュラインに関する競合)の危険性がかなり高まる。たとえば、複数のステップイン動作の反復をエミュレートするために、デバッガは、コードの行ごとに次の命令にブレークポイントを挿入し、プロセスを動作させ、関連する例外をキャッチし、および命令ポインタを検査して、事前に構成されたステップポイントに達したかどうかを判定する(または、デバッガが手動で停止されるまでこれらを行う)。そのような反復動作では、デバッガは、別の例外(exception)が出力される前にコードの1行だけしか実行せず(すなわち、コードが非常に短い時間の間だけ「自由に動作」することだけを許可される)、デバッグ性能がかなり妨げられ、プロセスデッドロックの可能性が高まることが理解される。説明の目的で、自由に動作するコードとは、遭遇するブレークポイントによって妨げられずに実行されることを許可されるメソッド、または関心のないコードなどのコードの論理ブロックのことである。 In addition, you can instruct the debugger to repeat the step-in command for each line of code and execute it in a single step through a portion of the code, but this process Performance is significantly reduced and the risk of process deadlock (ie contention on the same cache line due to the debugger) is significantly increased. For example, to emulate multiple iterations of step-in behavior, the debugger inserts a breakpoint at the next instruction for each line of code, runs the process, catches the associated exception, and sets the instruction pointer Examine to determine if pre-configured step points have been reached (or do these until the debugger is manually stopped). In such repetitive actions, the debugger only executes one line of code before another exception is output (ie, the code “freely operates” for a very short time). It is understood that debugging performance is significantly hindered and the possibility of process deadlocks is increased. For illustrative purposes, free-running code is a method that is allowed to be executed unhindered by a breakpoint encountered, or a logical block of code such as code of no interest.
そのようなデバッグの制限は、デバッグされるコンピュータプログラムが、大量のコードを統合した洗練された環境で動作するように設計され、このような統合されたコードにプログラマがデバッグの際関心を持たないとき特に問題となる。そのような関心のないコードに、たとえばプログラマが記述したのではないコード、既にデバッグされたコード、他の共有コード、ネットワーク化されたサービスのコード、相互運用性フレームワークコード、および/またはその他のものを含めることができる。そのようなシナリオでは、プログラマが関心のないコードを簡単にスキップできないようなプログラムのデバッグの既存の技法により、時間のかかる労働集中型の作業が必要となり、これによって、初心者と上級者の双方のプログラマの作業が困難となる可能性がある。 Such debugging limitations are designed so that the computer program being debugged operates in a sophisticated environment that integrates a large amount of code, and programmers are not interested in debugging such integrated code. Sometimes it becomes a problem. Such uninteresting code includes, for example, code not written by the programmer, code already debugged, other shared code, networked service code, interoperability framework code, and / or other Things can be included. In such scenarios, existing techniques for debugging programs that do not allow programmers to easily skip over code that is not of interest require time-consuming and labor-intensive work that can be used by both beginners and advanced users. The programmer's work can be difficult.
したがって、関心のあるコード内に手動でブレークポイントを設定し、および/または関心のあるコードに達するために手作業で関心のないコードのステップスルーを行う必要がない、ユーザが関心のあるコードだけをデバッグできるようにするシステムおよび方法が非常に望ましい。 Therefore, only the code that the user is interested in does not need to manually set breakpoints in the code of interest and / or manually step through the code that is not of interest to reach the code of interest Systems and methods that enable debugging are highly desirable.
本明細書において、ジャストマイコード(以下JMCという)デバッグのシステムおよび方法を説明する。本発明の一態様では、デバッグプローブが、関心のあるコードを構成するそれぞれのプログラミング構造に自動的に挿入される。デバッグプローブは、ネイティブコードを生成するコンピュータプログラムコンパイル動作中に挿入される。次に、ネイティブコードをプロセスとして実行する。このプロセスには、JMCステッピング動作中に関心のないコードを介して自由に動作する1つまたは複数の実行のスレッドが含まれる。1つまたは複数のスレッドのうちの1つのスレッドが、プロセスを介してJMCのステップ実行中にデバッグプローブのアクティブな1つのデバッグプローブに到達すると、その1つのスレッドだけが関心のあるコード内で停止する。 In this specification, a system and method for just-my-code (hereinafter referred to as JMC) debugging will be described. In one aspect of the invention, debug probes are automatically inserted into the respective programming structures that make up the code of interest. The debug probe is inserted during a computer program compilation operation that generates native code. Next, the native code is executed as a process. This process includes one or more threads of execution that operate freely through code that is not of interest during the JMC stepping operation. If one of one or more threads reaches the debug probe's active debug probe during JMC stepping through the process, only that one thread stops in the code of interest To do.
以下に詳細な説明を、添付図面を参照して説明する。図面では、構成要素の符号の上1桁が、その構成要素が最初に現れる特定の図面を示すようになっている。 Detailed description will be given below with reference to the accompanying drawings. In the drawings, the first digit of a component number indicates the particular drawing in which the component first appears.
(概要)
上述した通常のデバッグ技法の制限に対処するため、デバッグ動作中に関心のないコードを自動的にスキップするジャストマイコード(JMC)デバッグのシステムおよび方法を説明する。説明において、関心のないコードとは、どのような理由であれ、その時にプログラマのデバッグの努力を生じさせないと思われるコード(たとえば、プログラマが記述したものでないコード、既にデバッグされたコードなど)のことである。「関心のあるコード」とは、デバッグ動作中にプログラマにとって関心のあるものなので、関心のないコードから類推(corollary)される。
(Overview)
To address the limitations of normal debugging techniques described above, a Just My Code (JMC) debugging system and method that automatically skips uninteresting code during a debugging operation is described. In the description, uninteresting code refers to code that, for whatever reason, does not seem to cause the programmer's debugging efforts at that time (for example, code that was not written by the programmer, code that has already been debugged, etc.) That is. “Interesting code” is of interest to the programmer during a debugging operation and is therefore collated from code that is not of interest.
具体的に言うと、本発明のさまざまな実施形態を用いて、デバッグアプリケーション(デバッガ)が、関心があるものとしてアセンブリ内の任意のメソッドにマークを付すようにすることができる。アセンブリからネイティブコードを生成するジャストインタイム(JIT)コンパイラ動作中に、デバッグプローブが、関心のあるメソッドに自動的に挿入される。デバッガを使用して、ユーザはデバッグのためプロセス中にネイティブコードをロードする。JMCステッピングの動作に応答して、関心のあるメソッドにJMCステッピングスレッドが到達する時に限って、プロセスの実行が自動的に止められる。すべての非JMCステッピングスレッドは、関心のあるコードおよび関心のないコードを通って自由に動作する。これは、ユーザが、関心のあるコード内にブレークポイントを手動でセットする必要がなく、プログラマが、関心のあるコードに達するために関心のないコードを徒渉(wade−through)する(すなわち、普通のステップ動作を実行する)必要がないことを意味する。 Specifically, various embodiments of the present invention can be used to cause a debug application (debugger) to mark any method in an assembly as of interest. During a just-in-time (JIT) compiler operation that generates native code from the assembly, a debug probe is automatically inserted into the method of interest. Using a debugger, the user loads native code during the process for debugging. In response to the JMC stepping operation, the process execution is automatically stopped only when the JMC stepping thread reaches the method of interest. All non-JMC stepping threads operate freely through interesting and uninteresting code. This eliminates the need for the user to manually set breakpoints in the code of interest and allows the programmer to wade-through code that is not of interest to reach the code of interest (ie, normal This means that there is no need to execute the step operation of
(例示的な動作環境)
図面を参照すると、等しい符号は等しい要素を指しており、本発明は適切なコンピューティング環境で実施されるものとして図示されている。必ずしも必要ではないが、パーソナルコンピュータによって実行されるプログラムモジュールなどのコンピュータ実行可能命令の全般的な文脈で本発明を説明する。プログラムモジュールには、全般的に特定のタスクを実行するか、または特定の抽象データ型を実施するルーチン、プログラム、オブジェクト、コンポーネント、データ構造などが含まれる。
(Example operating environment)
Referring to the drawings, like reference numbers indicate like elements, and the invention is illustrated as being implemented in a suitable computing environment. Although not required, the invention will be described in the general context of computer-executable instructions, such as program modules, being executed by a personal computer. Program modules generally include routines, programs, objects, components, data structures, etc. that perform particular tasks or implement particular abstract data types.
図1は、ジャストマイコード(JMC)型のデバッグに関する後述のシステム、装置、および方法を(完全または部分的のいずれかで)実施できる適切なコンピューティング環境100の例を示す図である。例示的なコンピューティング環境100は、適切なコンピューティング環境の1例にすぎず、本明細書に記載のシステムおよび方法の使用または機能性に関する制限を暗示することを意図したものではない。また、コンピューティング環境100を、コンピューティング環境100に示された構成要素の任意の1つまたはその組合せに関し依存または要件を必要とするものと解釈してはならない。
FIG. 1 is a diagram illustrating an example of a
本明細書に記載の方法およびシステムは、多数の他の汎用または特殊目的のコンピューティングシステム環境およびコンピューティングシステム構成と共に動作する。使用に適すると考えられる周知のコンピューティングシステム、コンピューティング環境、および/またはコンピューティング構成の例には、パーソナルコンピュータ、サーバコンピュータ、マルチプロセッサシステム、マイクロプロセッサベースのシステム、ネットワークPC、ミニコンピュータ、メインフレームコンピュータ、上記のシステムまたはデバイスのいずれかを含む分散コンピューティング環境などが含まれるが、これに限定されない。このフレームワークのコンパクト版またはサブセット版を、ハンドヘルドコンピュータなどの限られたリソースを有するクライアントまたは他のコンピューティングデバイスで実施することもできる。本発明は、通信ネットワークを介してリンクされたリモート処理デバイスによってタスクが実行される分散コンピューティング環境で実施することもできる。分散コンピューティング環境では、プログラムモジュールを、ローカルとリモートの両方のメモリストレージデバイスに配置することができる。 The methods and systems described herein operate with numerous other general purpose or special purpose computing system environments and computing system configurations. Examples of well-known computing systems, computing environments, and / or computing configurations that may be suitable for use include personal computers, server computers, multiprocessor systems, microprocessor-based systems, network PCs, minicomputers, mains Examples include, but are not limited to, frame computers, distributed computing environments including any of the systems or devices described above. A compact or subset version of this framework can also be implemented on a client or other computing device with limited resources, such as a handheld computer. The invention may also be practiced in distributed computing environments where tasks are performed by remote processing devices that are linked through a communications network. In a distributed computing environment, program modules can be located in both local and remote memory storage devices.
図1からわかるように、コンピューティング環境100には、コンピュータ102の形の汎用コンピューティングデバイスが含まれる。コンピュータ102のコンポーネントには、1つまたは複数のプロセッサまたは処理ユニット104、システムメモリ106、およびシステムメモリ106を含むさまざまなシステムコンポーネントをプロセッサ104に接続するバス108を含めることができるが、これに限定されない。システムバス108は、メモリバスまたはメモリコントローラ、周辺バス、accelerated graphics port、およびさまざまなバスアーキテクチャのいずれかを使用するプロセッサバスまたはローカルバスを含む、複数のタイプのバスアーキテクチャのいずれかの1つまたは複数を表す。制限ではなく例として、そのようなアーキテクチャに、Industry Standard Architecture(ISA)バス、マイクロチャネルアーキテクチャ(MCA)バス、Enhanced ISA(EISA)バス、Video Electronics Standards Association(VESA)ローカルバス、およびメザニンバスとも称するPeripheral Component Interconnects(PCI)バスが含まれる。
As can be seen in FIG. 1, the
コンピュータ102に、通常は、さまざまなコンピュータ読取可能な媒体が含まれる。そのような媒体は、コンピュータ102によってアクセス可能なすべての入手可能な媒体とすることができ、これには、揮発性および不揮発性、取外し可能および固定の両方の媒体が含まれる。図1では、システムメモリ106に、ランダムアクセスメモリ(RAM)110などの揮発性メモリおよび/または読取専用メモリ(ROM)112などの不揮発性メモリの形のコンピュータ読取可能な媒体が含まれる。起動中などにコンピュータ102内の要素の間での情報転送を支援する基本ルーチンを含む基本入出力システム(BIOS)114が、ROM112に保管される。RAM110には、通常は、プロセッサ104によって即座にアクセス可能および/または現在操作されているデータおよび/またはプログラムモジュールが含まれる。
コンピュータ102に、さらに、他の取外し可能/固定、揮発性/不揮発性のコンピュータ記憶媒体を含めることができる。たとえば、図1に、固定不揮発性磁気媒体(図示せず、通常は「ハードドライブ」と称する)から読み取り、これに書き込むハードディスクドライブ116、取外し可能不揮発性磁気ディスク120(たとえば、「フロッピディスク」)から読み取り、これに書き込む磁気ディスクドライブ118、CD−ROM/R/RW、DVD−ROM/R/RW/+R/RAM、または他の光媒体などの取外し可能不揮発性光ディスク124から読み取り、これに書き込む光ディスクドライブ122が示されている。ハードディスクドライブ116、磁気ディスクドライブ118、および光ディスクドライブ122のそれぞれは、1つまたは複数のインターフェース126によってシステムバス108に接続される。
The
ドライブおよび関連するコンピュータ読取可能な媒体によって、コンピュータ102のコンピュータ読取可能な命令、データ構造、プログラムモジュール、および他のデータの不揮発性ストレージが提供される。本明細書で説明する例示の実施形態では、ハードディスク、取外し可能磁気ディスク120、および取外し可能光ディスク124が使用されるが、磁気カセット、フラッシュメモリカード、ディジタルビデオディスク、ランダムアクセスメモリ(RAM)、読取専用メモリ(ROM)、およびその他のものなど、コンピュータによってアクセス可能なデータを保管できる他のタイプのコンピュータ読取可能な媒体も、例示の動作環境で使用できることを、当業者は理解するに違いない。
The drive and associated computer readable media provide non-volatile storage of computer readable instructions, data structures, program modules, and other data for
ユーザは、キーボード140およびポインティングデバイス142(「マウス」など)などの入力デバイスを介してコンピュータ102にコマンドおよび情報を供給することができる。他の入力デバイス(図示せず)に、マイクロホン、ジョイスティック、ゲームパッド、衛星パラボラアンテナ、シリアルポート、スキャナ、カメラなどを含めることができる。上記および他の入力デバイスは、バス108に結合されたユーザ入力インターフェース144を介してプロセッサ104に接続されるが、パラレルポート、ゲームポート、またはuniversal serial bus(USB)など、他のインターフェースおよびバス構造によって接続することができる。
A user may provide commands and information to
モニタ146または他のタイプのディスプレイデバイスも、ビデオアダプタ148などのインターフェースを介してバス108に接続される。モニタ146の他に、パーソナルコンピュータには、通常は、スピーカおよびプリンタなど、出力周辺インターフェース150を介して接続することができる、他の周辺出力デバイス(図示せず)が含まれる。
A
コンピュータ102は、リモートコンピュータ152などの1つまたは複数のリモートコンピュータへの論理接続を使用することによって、ネットワーク化された環境で動作することができる。リモートコンピュータ152に、コンピュータ102に関して本明細書で説明した要素および特徴の多数またはすべてを含めることができる。図1に示された論理接続は、ローカルエリアネットワーク(LAN)154および全般的な広域ネットワーク(WAN)156である。そのようなネットワーキング環境は、オフィス、会社全体のコンピュータネットワーク、イントラネット、およびインターネットでありふれたものである。
LANネットワーキング環境で使用される時に、コンピュータ102は、ネットワークインターフェースまたはネットワークアダプタ158を介してLAN154に接続される。WANネットワーキング環境で使用される時に、コンピュータに、通常はWAN156を介する通信を確立する、モデム160または他の手段が含まれる。モデム160は、内蔵または外付けとすることができるが、ユーザ入力インターフェース144または他の適当な機構を介してシステムバス108に接続することができる。図1には、インターネットを介するWANの特定の実施形態が図示されている。この図では、コンピュータ102によって、モデム160を使用して、インターネット162を介して少なくとも1つのリモートコンピュータ152との通信が確立される。
When used in a LAN networking environment, the
ネットワーク化された環境では、コンピュータ102に関して図示されたプログラムモジュールまたはその一部を、リモートメモリストレージデバイスに保管することができる。したがって、たとえば図1に示されているように、リモートアプリケーションプログラム164が、リモートコンピュータ152のメモリデバイスに常駐することができる。図示され説明されたネットワーク接続が、例示的なものであり、コンピュータの間の通信リンクを確立する他の手段を使用できることを理解されたい。
In a networked environment, the program modules illustrated with respect to
ランタイム環境を提供するオペレーティングシステム(OS)128、ジャストマイコード(JMC)デバッグ用のアプリケーションプログラム130、他のプログラムモジュール132(たとえばデバイスドライバなど)、およびソースコード、中間アセンブリ、および/またはその他のものなどのプログラムデータ134を含む複数のプログラムモジュールを、ハードディスク、磁気ディスク120、光ディスク124、ROM112、またはRAM110に保管することができる。
An operating system (OS) 128 that provides a runtime environment, an
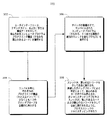
図2は、ジャストマイコード(JMC)型のデバッグに関するアプリケーションプログラム130およびプログラムデータ134を含む、図1のシステムメモリ106のさらなる例示の態様を示すブロック図である。アプリケーションプログラム130およびプログラムデータ134には、たとえばプロセス202、プライマリコンパイラ204、プロセス202をデバッグするデバッグプログラム(「デバッガ」)206、および共有ランタイムコンポーネント(「ランタイム」)208が含まれる。プロセス202は、ソースコード(図示せず)をアセンブリ(図示せず)にコンパイルした結果であり、アセンブリは、ネイティブコード210にコンパイルされており、プロセス202は、デバッガ206によりネイティブコード210が実行されるのを表している。
FIG. 2 is a block diagram illustrating a further exemplary aspect of the system memory 106 of FIG. 1 that includes an
ソースコードは、あらゆるタイプのコンピュータプログラミング言語で記述された、すべてのタイプのコンピュータプログラムコードを意味する。デバッグスイッチをオンにされた(たとえば「/debug」)、ソースコードをアセンブリ(図示せず)にコンパイルするためのプライマリコンパイラ204。そのようなプライマリコンパイラは、C、C++、C#、Visual Basicなどの任意のコンピュータプログラム言語コンパイラおよび/またはJMCデバッグを実施するように修正された他のタイプのコンパイラとすることができる。アセンブリは、既知であり、実行のためのソースコードからプラットフォーム固有のネイティブコードへの変換の中間ステージを表す。このために、そのようなアセンブリには、たとえばプラットフォーム/プロセッサ依存中間言語(IL)および対応するメタデータが含まれる。
Source code means all types of computer program code written in any type of computer programming language. A
ユーザは、デバッガ206にアセンブリをロードする。アセンブリをデバッグアプリケーションにロードする技法は、既知のものである。たとえば、アセンブリ名を指定する(たとえば、コマンドラインまたはUIを介して)または他の形でアセンブリを選択することによって、アセンブリをデバッガ206にロードすることができる。アセンブリローディング動作中に、デバッガ206によって、関心のあるコードのリスト212が生成されて、アセンブリのうちで、関心のないコードと比較した関心のあるコードである部分が区別される。ユーザコード(繰り返すが、ソースコードをアセンブリに変換したものであり、最終的には、後述するようにプロセスとして実行されるネイティブコードに変換される)には、通常、関心のあるコードと関心のないコードとの所定の組合せが含まれる。しかし、ユーザコードには、ランタイム208に属するホスティングされるコードは含まれない。一実施形態では、関心のあるコード212は、いずれかの形態のユーザ入力インターフェース144(図1)へのユーザ入力によって生成される。たとえば、ユーザは、デバッグサービスによってダイアログボックスに表示される複数のメソッドの特定の1つを選択することができ(たとえば、ポインティングデバイス、キーボード、音声アクティベーテッドテクニックなどを介して)、あるいは、ユーザが、コマンドラインインターフェースおよび/またはその他のものにプログラミング構造の名前を入力することができる。デバッガ206によって、公開されたデバッグAPI216(これによって2つの部分を実施することもでき、その部分の一方は、ランタイム208のサービスとして実施され、もう1つは216を実施するパブリックコンポーネントとして実施され、デバッガ206によって消費される)によって、識別された関心のあるコード212に関してデバッグサービス214に通知される。
The user loads the assembly into the
この点で、ユーザが、たとえばJMCメニュー項目、コマンドライン、または他のJMCイネーブリングインストラクションを使用可能にし、実行コマンドまたは開始コマンドを発行することによって、JMCデバッグ動作の開始をデバッガ206に指示する。これによって、デバッガ206が、JITコンパイラ220に、プロセス202としての後の実行のためにアセンブリをネイティブコード210に変換するように指示する。
At this point, the user instructs the
アセンブリ変換動作中に、JITコンパイラ220は、JMCイネーブリングコンポーネント、フラグ222、およびデバッグプローブ224を、ネイティブコード210のプログラミング構造(たとえば、実行可能ファイル/バイナリ、ダイナミックリンクライブラリ、クラスオブジェクトおよびメソッド、静的関数、および/またはその他のもの)に挿入する。この実施形態では、JITイネーブリングコンポーネントが、クラスメソッドおよび/または静的関数のプロローグの直後に挿入される。JITコンパイラ220は、上で説明したようにデバッガ206によって生成された関心のあるコードリスト/ID212を解析することによって、そのようなクラスメソッドおよび/または静的関数を識別する。
During assembly conversion operations, the JIT compiler 220 sends JMC enabling components, flags 222, and debug probes 224 to the native code 210 programming structure (eg, executable / binary, dynamic link library, class objects and methods, static Function and / or others). In this embodiment, the JIT enabling component is inserted immediately after the prologue of the class method and / or static function. JIT compiler 220 identifies such class methods and / or static functions by parsing the interesting codelist / ID 212 generated by
デバッグプローブ224は、コンパイル時定数ポインタ値によって、関連するフラグ222を参照して、アクティブ化されたプローブ224に到達した特定の実行のスレッドが、JMCステッピング動作を実行しているかどうかを評価し、そうである場合にプロセス202を停止するようにデバッグサービス214に要求するかどうかを判定する。今説明したように、そのような判定は、アクティブ化されていないフラグについては行われず、アクティブ化されたフラグだけについて行われる。例示的なデバッグプローブ224は、次のように表される。
if(*pFlag){call JMC_Probe}
ここで、pFlagは、対応するフラグ222へのコンパイル時定数ポインタである(「*」は、アドレスが、関連するフラグ222の値を得るために実行時に参照先の値を取得することを示す)。プローブ224の「JMC_Probe」部分は、JMC_Probe関数226への呼出しである。ポインタ間接指定の使用によって、pFlagsがそれに関して挿入された複数のプログラミング構造からのpFlagsはすべて、同一のフラグ222を指示することができる。
The debug probe 224 refers to the associated flag 222 by means of a compile time constant pointer value to evaluate whether a particular thread of execution that has reached the activated probe 224 is performing a JMC stepping operation; If so, determine whether to request the
if ( * pFlag) {call JMC_Probe}
Here, pFlag is a compile time constant pointer to the corresponding flag 222 (“ * ” indicates that the address obtains the value of the reference destination at the time of execution in order to obtain the value of the related flag 222) . The “JMC_Probe” portion of probe 224 is a call to
図からわかるように、JMC_Probe226への呼出しは条件により可能であり、参照されるフラグ222がアクティブ化されているか非アクティブ化されているかに依存する。本説明において、アクティブ化されたフラグ222は非0値を有し、非アクティブ化されたフラグ222は0またはヌルの値を有する。フラグ222がアクティブ化されている時、デバッグプローブ224はアクティブである(たとえば、アクティブなプローブ)といい、逆も同様である。たとえば、実行のスレッドが、アクティブなプローブ224に到達する時に、JMC_Probe226への呼出しが行われる。同様に、非アクティブなプローブ224に到達しても、そのような呼出しは行われない。これは、単一のフラグ222のトグルによって、各関連するプローブ224がそれぞれアクティブ化または非アクティブ化されることを意味する。次に、この新規のJMCデバッグプローブ224が、デバッグ動作中にどのように使用されるかを説明する。
As can be seen, a call to
プロセス202を(たとえば普通のブレークポイントを使用するなど、伝統的な停止機構によって)停止させている時に、デバッガ206を用いると、ユーザはJMCステッピングコマンド228(すなわち、JMCステップイントゥコマンド、JMCステップアウトコマンド、およびJMCステップオーバコマンド)によってプロセス202にJMCステップスルーを行うことができるようになる。そのようなコマンドは、たとえばコマンドラインおよび/またはユーザ入力インターフェース144(図1)のUI部分を介して、ユーザによって選択される。デバッガ206によってデバッグサービス214に送られるJMCステッピングコマンド228(すなわち、JMCステップインコマンド、JMCステップアウトコマンド、およびJMCステップオーバコマンド228)に応答して、デバッグサービス群(mass)は、フラグ222を使用可能にし、これによって関連するプローブ224をアクティブ化する。ユーザは、どのプローブがアクティブであるかを知る必要がない。
When the process 202 is stopped (eg, by a traditional stop mechanism, such as using a normal breakpoint), the
アクティブ化されたデバッグプローブ224によって、プロセス202の実行スレッドは、関心のないコードを通り抜けて自由に動作できるようになる(すなわち、実質的にフルスピードで不要な一時停止がない)。アクティブ化されたプローブ224は関心のあるコード内に配置されるが、それが到達するすべてのスレッドは、JMC_Probe226により遭遇したプローブ224が、そのスレッドがコードにJMCステップスルーを行っていると判定する時に限って停止する(TriggerMethodEntry230を介して)。このため、JMC_Probe226によってコールスタック(他のデータ232参照)をデコードして、到達した(「トリガされた」)デバッグプローブ224に関連するメソッドの命令ポインタ(ip)およびフレームポインタ(fp)を識別することによって、JMCステッピングを行っていないスレッドがフィルタにかけられる。現在のスレッドが、JMCステッピングを行っている場合に、JMC_Probe226によって、ipパラメータおよびfpパラメータが、TriggerMethodEntry230に渡され、TriggerMethodEntry230は、ipをメソッドにマッピングして、関心のあるコードリスト/ID212に示されるように、メソッドが「関心のある」ものであるかどうかを判定する(デバッグプローブ224が関心のあるコード内に配置されるかどうかをそのプローブがルックアップ動作を介して判定できることを、JITコンパイラ220が実質的に保証するのに十分な記録(bookkeeping)が、ランタイム208によって行われる)。このメソッドが、関心のあるメソッドである場合、JMC_Probe226によって、デバッグプローブ224の後にブレークオペコード(すなわち、ブレークポイント234。すべてのブレークポイント234がJMC_Probeによって注入される)が挿入され、プロセスの実行が継続され、実行中のスレッドが、ブレークポイント234に到達して関心のあるコード内で停止する。
The activated debug probe 224 allows the execution thread of the process 202 to run freely through code that is not of interest (ie, substantially full speed and no unnecessary pauses). The activated probe 224 is placed in the code of interest, but all threads it reaches determine that the probe 224 encountered by
さらに、JMCステッピングコマンド228が、
JMCステップインである場合、デバッグサービス214によって、すべてのJMC_probe224がアクティブ化され、ステップインを行っているメソッドへの呼出しの後にブレークポイントが置かれる(JMC_Probeによって挿入されるブレークポイントではない)。JMCプローブ224は、すべての関心のあるコードの先頭にあり、プローブがアクティブ化されているので、呼出しによって最終的に「関心のある」コードが(おそらくは、最終的に「関心のある」コードを呼び出す関心のない/フレームワークコードの呼出しによって間接的に)呼び出される場合、スレッドは、アクティブ化されたプローブに到達し、このプローブによって、TriggerMethodEntry230が呼び出され、スレッドが停止されてステップは関心のあるコード内で完了する。呼出しによって、関心のあるコードが呼び出されない場合には、スレッドは、ステップイントゥが行われるメソッドの呼出しの後に挿入されたブレークポイント(すなわち、JMC_Probeによって挿入されたブレークポイント234でないブレークポイント)に到達し、JMCステップイン動作は完了する。このようにして、プロセス202は、JMCステップインが開始される時とそれが終了する時の間にフルスピードで(すなわち、中間ブレークポイントオペコードによって割り込まれることなく)動作する。
Furthermore, the
If it is a JMC step-in, the
JMCステップアウトである場合、JMC_Probe226は、最初のスタックフレームによって識別される関心のあるメソッドへの戻りアドレスに、ブレークポイント234を自動的に挿入する。したがって、このブレークポイントは、デバッグプローブ224に到達したメソッドと同一のメソッドには挿入されない。関心のあるメソッドへの戻りアドレスを有する最初のスタックフレームを突き止めるため、デバッグサービス214によって、プロセススタックのフルウォークアップ(すなわち、スタックの開放(unwind))が実行される。デバッグサービス214は、「他のデータ」232の「関心のあるメソッドデータ」部分に鑑みて1つまたは複数のランタイム208サービスを使用し、どのスタックフレームアドレスが関心のあるメソッドの戻りアドレスであるかを判定する。そのような関心のあるメソッドデータには、たとえば、関心のあるメソッドの各々について実質的に一意のID(たとえば、GUID)がそれぞれ含まれる。一実施形態で、関心のあるメソッドのデータが、デバッグプローブ224の挿入動作中にJITコンパイラ220によって生成される。
If it is a JMC step out,
JMCステップオーバであり、スレッドがメソッドの終りの命令を実行していない場合、JMC_Probe226は、従来のステップオーバのように振る舞うことになる。スレッドが、メソッドの終りに来ている場合、JMC_Probe226は、ステップインおよびステップアウトの双方のアクションを実行し、スレッドは、実行される関心のあるコードの最初のインスタンス(行)で停止することとなる。
If it is a JMC step over and the thread is not executing the end-of-method instruction, the
JMCステッピングスレッドの停止によって示されるJMCステッピングコマンド228の完了に応答して、デバッグサービス214によって、すべてのプローブが使用不可にされる(デバッガ206は、JMCステッピング動作だけを理解し、プローブについては何も知らない)。デバッグプローブ224を非アクティブ化することにより性能が最適化され、そうでなければ実行中のスレッドがJMCステッピングを行っていない時に発生するJMC_Probe226の無用な呼出しを回避する。
In response to completion of the
この実施形態では、フラグ222が、モジュールごとの基礎で使用可能/使用不可にされる(すなわち、1つのフラグが、各モジュールに挿入される)。このようにして、モジュール内の各メソッドが、同一の値のpFlagを有することとなる。この特定の実施形態は、コードはモジュールごとに関心のあるものまたは関心のないものとなるという論理に基づく。特定の実施形態の設計の関数として、異なる実施形態で異なる推理を実施できることを理解されたい。たとえば、フラグ222を、メソッドごとに挿入することができるが、これによりフラグ222が多いほど、単一のフラグ222の値のフリップ/トグルによって使用可能にできるプローブが減ることとなる。 In this embodiment, flag 222 is enabled / disabled on a per module basis (ie, one flag is inserted into each module). In this way, each method in the module has the same value of pFlag. This particular embodiment is based on the logic that the code will be of interest or not per module. It should be understood that different inferences can be made in different embodiments as a function of the design of a particular embodiment. For example, a flag 222 can be inserted for each method, but the more flags 222, the fewer probes that can be enabled by flip / toggling the value of a single flag 222.
したがって、スレッドがアクティブなプローブ224に到達する場合、現在のスレッドにJMCステッピングを行っていないときであっても、常にJMC_Probe226の呼出しが行われる。JMC_Probe226により、スレッドにJMCステッピングが行われていると判定される時に限って、そのスレッドは停止する。同様に、到達したデバッグプローブ224がアクティブでない場合、JMC_Probe226の呼出しは完全にスキップされ、スレッドはプロセスを介して通常の実行を続行する(すなわち、自由に動作する)。
Thus, when a thread reaches the active probe 224, a call to
この実施形態では、JMC_Probe関数226への呼出しは引数をとらず、戻り値がないので、実質的にサイズが最適化される。これによって、すべての「呼出しサイト(callsite)」(JMC_Probe関数226へのそれぞれの呼出しが行われる位置)が最適化される。したがって、デバッグプローブ224からのJMC_Probeへの呼出しがプローブから行われる場合(たとえば、*pFlag!=0の時)、その呼出しは重い呼出しではない。これは、呼出しが関数パラメータのスタックへの挿入および取り出しを必要としないことを意味し、これは、JMC_Probe呼出しサイトが、パラメータの挿入および取り出しを行う関数への呼出しサイトと比較して、かなり負荷が小さいことを意味する。非アクティブのプローブ224に到達するスレッドがこうむるは、唯一フラグ222の評価(*pFlagを介する)および挿入されたプローブ224の次の命令へのジャンプに要するオーバヘッド処理だけである。このようにして、本明細書に記載のJMCデバッグ動作を用いると、スレッドは、関心のあるコードに到達するまで、関心のないコードのすべてを抜けて実質的にフルスピードで自由に動作できるようになる。
In this embodiment, the call to the
本実施形態では、ランタイム208は実行可能コードおよびそれが動作する仮想実行環境の仕様を提供するCLI(Common Language Infrastructure)に基づく。したがって、図2では別々に図示されているが、プロセス208およびランタイム202は、同一の実行環境の一部である(すなわち、プロセス202によってランタイム208がホスティングされる)。
In the present embodiment, the
(例示的な手順)
図3に、JMCデバッグの例示の手順300を示す。説明を目的として、手続き動作は、図1および2のプログラムモジュールおよびデータの特徴に関し説明される。ブロック302において、デバッガ206(図2)により、関心のあるコンピュータプログラムプログラミング構造(たとえば、オブジェクトメソッドおよび/または静的関数)が識別される。一実施形態では、これは、一態様としてのユーザ入力インターフェース144(図1)へユーザ入力を行うことによって達成される。たとえば、ユーザはデバッグサービスによりダイアログボックスに表示される複数のメソッドの特定の1つを(たとえば、ポインティングデバイス、キーボード、音声アクティベーテッドテクニックなどにより)選択することができ、またはユーザは、コマンドラインインターフェースおよび/またはその他のものにプログラミング構造の名前を入力することができる。ユーザ入力は、関心のあるコードリスト/ID212(図2)に保存され、リスト/ID212がランタイムコンパイラ220(図2)によって読み取られ、該当するプログラミング構造(すなわち関心のあるコード)が識別される。
(Example procedure)
FIG. 3 shows an
ブロック304において、デバッガ206(図2)は、図2のジャストインタイム(JIT)コンパイラ220などのコンパイラに対し、コンパイル動作中にコンピュータプログラムの各々のプログラミング構造(たとえばメソッド)にそれぞれJMCイネーブリングコンポーネント222および224を自動的に挿入するように指示する。本実施形態では、JITコンパイラ220がアセンブリをコンパイルしてネイティブコード210(図2)を生成し、このネイティブコード210に、それぞれのフラグ222およびデバッグプローブ224が自動的に挿入される。ブロック306において、ネイティブコード210(図2)が、プロセス202(図2)としてデバッガ206の制御の下で実行される。プロセス202には、プロセスの特定の実施形態の関数として任意の個数の実行のスレッドが含まれる。
At
ブロック308において、ユーザは、デバッガ206(図2)を使用し、JMCステッピングコマンド228(図2)の入力することにより、プロセス202を介してスレッドにJMCステッピングを行うようにすることができる。スレッドにJMCステッピングを行うことから、このスレッドを「関心のあるスレッド」と呼ぶ。プロセス202は、マルチスレッドとし、「関心のないスレッド」と呼ばれるJMCステッピングを行われないスレッドを含めることができる。関心のあるスレッドは、関心のないコード(すなわち、ブロック302において選択されたプログラミング構造の選択された/個々の1つによって識別される関心のあるコードに対応しないすべてのコード)を介して自由に(停止することなく)実行される。関心のあるスレッドは、最初にアクティブのデバッグプローブ224に到達すると、デバッグサービス214により必ず自動的に停止される。プロセス202(図2)のスレッドが関心のあるスレッドであるかどうか、および関心のあるスレッドが選択されたプログラミング構造の1つの実行中/アクセス中のコードであるかどうかの判定は、到達したデバッグプローブ224によって実行時に判定される。したがって、JMCステッピングを行われないすべてのスレッドは、関心のあるコードおよび関心のないコードの双方とも、すべての到達したデバッグプローブ224を介して自由に実行される。
At
(結論)
本明細書に記載のシステムおよび方法によって、JMCデバッグがもたらされる。システムおよび方法は、構造的特徴および方法論的動作に固有の言語で説明されたが、請求項で定義される主題は、必ずしも説明した特定の特徴または動作に制限されない。むしろ、特定の特徴および動作は、請求される主題を実施する例示的な形態として開示される。
(Conclusion)
The systems and methods described herein provide JMC debugging. Although systems and methods have been described in language specific to structural features and methodological operations, the subject matter defined in the claims is not necessarily limited to the specific features or operations described. Rather, the specific features and acts are disclosed as exemplary forms of implementing the claimed subject matter.
202 プロセス
204 プライマリコンパイラ
206 デバッグプログラム(「デバッガ」)
208 共有ランタイムコンポーネント(「ランタイム」)
210 ネイティブコード
212 関心のあるコードのリスト
214 デバッグサービス
216 デバッグAPI
220 JITコンパイラ
222 フラグ
224 デバッグプローブ
226 JMC_Probe関数
228 JMCステッピングコマンド
230 TriggerMethodEntry
232 他のデータ
234 ブレークポイント
202
208 Shared Runtime Components ("Runtime")
210 Native Code 212 List of Code of
220 JIT Compiler 222 Flag 224
232 Other data 234 Breakpoint
Claims (29)
ユーザ入力によって生成されたコードを含むプログラムコードのリストを生成するステップであって、前記リストとアセンブリとを比較することにより、ユーザ入力によって生成されたコード部分とユーザ入力によって生成されていないコード部分とが区別される、ステップと、
ネイティブコードに、デバッグ処理関数への呼出し及びコンパイル時定数ポインタを含むプログラムコードであるデバッグプローブとグローバル変数であるフラグとを挿入するステップであって、前記デバッグプローブは、前記コンパイル時定数ポインタにより、コンパイル時における前記デバッグプローブと関連付けられたフラグを参照し、前記フラグが0でない値を示す場合にデバッグ処理関数を呼び出すことが記述され、前記デバッグプローブ及び前記フラグは、前記ネイティブコードを生成するためのコンピュータプログラムコンパイル動作中に挿入される、ステップと、
前記ネイティブコードをプロセスとして実行するステップであって、前記プロセスは、ステッピング動作を実行する1つまたは複数の実行のスレッドを含み、前記実行のスレッドが前記プロセスを介してステッピング動作を実行中に前記デバッグ処理関数を呼び出しているデバッグプローブに到達すると、当該到達したデバッグプローブに関連するコード部分の命令ポインタが前記リストに示されている場合に、前記実行のスレッドを停止する、ステップと
を実行するためのコンピュータプログラム命令を含むことを特徴とするコンピュータ読取可能な媒体。 A computer readable medium containing computer program instructions for debugging, wherein the computer program instructions are executable by a processor,
And generating a list of program codes including the code generated by the user input, by comparing the list and the assembly, the code portion that is not generated by the user input and the generated code portion by a user input Is distinguished from the step,
Inserting a debug probe, which is a program code including a call to a debug processing function and a compile time constant pointer, and a flag, which is a global variable, into the native code, the debug probe using the compile time constant pointer, Reference is made to a flag associated with the debug probe at compile time, and it is described that a debug processing function is called when the flag indicates a non-zero value. The debug probe and the flag generate the native code. Inserted during the computer program compilation operation of
Executing the native code as a process, the process including one or more threads of execution that perform a stepping operation, while the thread of execution is performing a stepping operation through the process When a debug probe that calls a debug processing function is reached, and the instruction pointer of the code portion related to the reached debug probe is shown in the list, the step of stopping the thread of execution is executed. A computer-readable medium comprising computer program instructions for executing the program.
前記デバッグ処理関数を呼び出しているデバッグプローブの後のコードの行で前記スレッドを停止させるステップと、
を実行するためのコンピュータプログラム命令をさらに含むことを特徴とする請求項1に記載のコンピュータ読取可能な媒体。 In response to reaching a debug probe calling the debug processing function, obtaining a reference destination value of the compile time constant pointer corresponding to the debug probe calling the debug processing function;
Stopping the thread at a line of code after a debug probe calling the debug processing function;
The computer-readable medium of claim 1, further comprising computer program instructions for executing
前記デバッグ処理関数を呼び出しているデバッグプローブの後のコードの行で前記スレッドを停止するステップと、
前記デバッグプローブの各々に関連付けられたフラグの値を0にするステップと
を実行するためのコンピュータプログラム命令をさらに含むことを特徴とする請求項1に記載のコンピュータ読取可能な媒体。 In response to reaching a debug probe calling the debug processing function, obtaining a reference destination value of the compile time constant pointer corresponding to the debug probe calling the debug processing function;
Stopping the thread at a line of code after a debug probe calling the debug processing function;
The computer-readable medium of claim 1, further comprising computer program instructions for performing the steps of: setting a flag value associated with each of the debug probes to zero.
前記スレッドによりステップインが行なわれているコード部分への呼出しの直後のコードの行にブレークポイントを置くステップと
を実行するためのコンピュータプログラム命令をさらに含むことを特徴とする請求項1に記載のコンピュータ読取可能な媒体。 In response to reaching a debug probe calling the debug processing function, obtaining a reference destination value of the compile time constant pointer corresponding to the debug probe calling the debug processing function;
The computer program instructions for performing the steps of: placing a breakpoint on a line of code immediately following a call to a portion of code being stepped in by the thread. Computer readable medium.
前記到達したデバッグプローブに関連するコード部分への第1スタックフレームの戻りアドレスを識別するステップと、
前記戻りアドレスにブレークポイントを置くステップと
を実行するためのコンピュータプログラム命令をさらに含むことを特徴とする請求項1に記載のコンピュータ読取可能な媒体。 In response to reaching a debug probe calling the debug processing function, obtaining a reference destination value of the compile time constant pointer corresponding to the debug probe calling the debug processing function;
Identifying the return address of the first stack frame to the code portion associated with the reached debug probe;
The computer-readable medium of claim 1, further comprising computer program instructions for executing the step of placing a breakpoint at the return address.
ユーザ入力によって生成されたコードを含むプログラムコードのリストを生成するステップであって、前記リストとアセンブリとを比較することにより、ユーザ入力によって生成されたコード部分とユーザ入力によって生成されていないコード部分とが区別される、ステップと、
ネイティブコードに、デバッグ処理関数への呼出し及びコンパイル時定数ポインタを含むプログラムコードであるデバッグプローブとグローバル変数であるフラグとを挿入するステップであって、前記デバッグプローブは、前記コンパイル時定数ポインタにより、コンパイル時における前記デバッグプローブと関連付けられたフラグを参照し、前記フラグが0でない値を示す場合にデバッグ処理関数を呼び出すことが記述され、前記デバッグプローブ及び前記フラグは、前記ネイティブコードを生成するためのコンピュータプログラムコンパイル動作中に挿入される、ステップと、
前記ネイティブコードをプロセスとして実行するステップであって、前記プロセスは、ステッピング動作を実行する1つまたは複数の実行のスレッドを含み、前記実行のスレッドが前記プロセスを介してステッピング動作を実行中に前記デバッグ処理関数を呼び出しているデバッグプローブに到達すると、当該到達したデバッグプローブに関連するコード部分の命令ポインタが前記リストに示されている場合に、前記実行のスレッドを停止する、ステップと
を備え、ステッピング動作は、ステップイン動作、ステップアウト動作、またはステップオーバ動作を含むことを特徴とする方法。 A debugging method,
And generating a list of program codes including the code generated by the user input, by comparing the list and the assembly, the code portion that is not generated by the user input and the generated code portion by a user input Is distinguished from the step,
Inserting a debug probe, which is a program code including a call to a debug processing function and a compile time constant pointer, and a flag, which is a global variable, into the native code, the debug probe using the compile time constant pointer, Reference is made to a flag associated with the debug probe at compile time, and it is described that a debug processing function is called when the flag indicates a non-zero value. The debug probe and the flag generate the native code. Inserted during the computer program compilation operation of
Executing the native code as a process, the process including one or more threads of execution that perform a stepping operation, while the thread of execution is performing a stepping operation through the process Stopping a thread of execution when a debug probe that calls a debug processing function is reached and an instruction pointer of a code portion related to the reached debug probe is shown in the list, and The stepping operation includes a step-in operation, a step-out operation, or a step-over operation.
前記デバッグ処理関数を呼び出しているデバッグプローブの後のコードの行で前記スレッドを停止させるステップと、
を含むことを特徴とする請求項10に記載の方法。 In response to reaching a debug probe calling the debug processing function, obtaining a reference destination value of the compile time constant pointer corresponding to the debug probe calling the debug processing function;
Stopping the thread at a line of code after a debug probe calling the debug processing function;
The method of claim 10, comprising:
前記デバッグ処理関数を呼び出しているデバッグプローブの後のコードの行で前記スレッドを停止させるステップと、
前記デバッグプローブの各々に関連付けられたフラグの値を0にするステップと
をさらに備えたことを特徴とする請求項10に記載の方法。 In response to reaching a debug probe calling the debug processing function, obtaining a reference destination value of the compile time constant pointer corresponding to the debug probe calling the debug processing function;
Stopping the thread at a line of code after a debug probe calling the debug processing function;
The method of claim 10, further comprising: setting a flag value associated with each of the debug probes to zero.
前記スレッドによりステップインが行なわれているコード部分への呼出しの直後のコードの行にブレークポイントを置くステップと
をさらに備えたことを特徴とする請求項10に記載の方法。 In response to reaching a debug probe calling the debug processing function, obtaining a reference destination value of the compile time constant pointer corresponding to the debug probe calling the debug processing function;
11. The method of claim 10, further comprising placing a breakpoint on a line of code immediately following a call to a portion of code that is being stepped in by the thread.
前記到達したデバッグプローブに関連するコード部分への第1スタックフレームの戻りアドレスを識別するステップと、
前記戻りアドレスにブレークポイントを置くステップと
をさらに備えたことを特徴とする請求項10に記載の方法。 In response to reaching a debug probe calling the debug processing function, obtaining a reference destination value of the compile time constant pointer corresponding to the debug probe calling the debug processing function;
Identifying the return address of the first stack frame to the code portion associated with the reached debug probe;
The method of claim 10, further comprising placing a breakpoint at the return address.
プロセッサと、
前記プロセッサに結合されたメモリであって、
ユーザ入力によって生成されたコードを含むプログラムコードのリストを生成するステップであって、前記リストとアセンブリとを比較することにより、ユーザ入力によって生成されたコード部分とユーザ入力によって生成されていないコード部分とが区別される、ステップと、
ネイティブコードに、デバッグ処理関数への呼出し及びコンパイル時定数ポインタを含むプログラムコードであるデバッグプローブとグローバル変数であるフラグとを挿入するステップであって、前記デバッグプローブは、前記コンパイル時定数ポインタにより、コンパイル時における前記デバッグプローブと関連付けられたフラグを参照し、前記フラグが0でない値を示す場合にデバッグ処理関数を呼び出すことが記述され、前記デバッグプローブ及び前記フラグは、前記ネイティブコードを生成するためのコンピュータプログラムコンパイル動作中に挿入される、ステップと、
前記ネイティブコードをプロセスとして実行するステップであって、前記プロセスは、ステッピング動作を実行する1つまたは複数の実行のスレッドを含み、前記実行のスレッドが前記プロセスを介してステッピング動作を実行中に前記デバッグ処理関数を呼び出しているデバッグプローブに到達すると、当該到達したデバッグプローブに関連するコード部分の命令ポインタが前記リストに示されている場合に、前記実行のスレッドを停止する、ステップと
を実行するための命令を含む前記プロセッサによって実行可能なコンピュータプログラム命令を含むメモリと
を備えたことを特徴とするコンピューティングデバイス。 A debugging computing device, a processor,
A memory coupled to the processor, the memory comprising:
And generating a list of program codes including the code generated by the user input, by comparing the list and the assembly, the code portion that is not generated by the user input and the generated code portion by a user input Is distinguished from the step,
Inserting a debug probe, which is a program code including a call to a debug processing function and a compile time constant pointer, and a flag, which is a global variable, into the native code, the debug probe using the compile time constant pointer, Reference is made to a flag associated with the debug probe at compile time, and it is described that a debug processing function is called when the flag indicates a non-zero value. The debug probe and the flag generate the native code. Inserted during the computer program compilation operation of
Executing the native code as a process, the process including one or more threads of execution that perform a stepping operation, while the thread of execution is performing a stepping operation through the process When a debug probe that calls a debug processing function is reached, and the instruction pointer of the code portion related to the reached debug probe is shown in the list, the step of stopping the thread of execution is executed. And a memory including computer program instructions executable by the processor including instructions for.
前記デバッグ処理関数を呼び出しているデバッグプローブの後のコードの行で前記スレッドを停止させるステップと
を実行するための命令をさらに含むことを特徴とする請求項17に記載のコンピューティングデバイス。 In response to reaching a debug probe calling the debug processing function, obtaining a reference destination value of the compile time constant pointer corresponding to the debug probe calling the debug processing function;
18. The computing device of claim 17, further comprising instructions for executing the step of stopping the thread at a line of code after a debug probe that is calling the debug processing function.
前記デバッグ処理関数を呼び出しているデバッグプローブの後のコードの行で前記スレッドを停止させるステップと、
前記デバッグプローブの各々に関連付けられたフラグの値を0にするステップと
を実行するための命令をさらに含むことを特徴とする請求項17に記載のコンピューティングデバイス。 In response to reaching a debug probe calling the debug processing function, obtaining a reference destination value of the compile time constant pointer corresponding to the debug probe calling the debug processing function;
Stopping the thread at a line of code after a debug probe calling the debug processing function;
The computing device of claim 17, further comprising: executing a step of setting a value of a flag associated with each of the debug probes to zero.
前記スレッドによりステップインが行なわれているコード部分への呼出しの直後のコードの行にブレークポイントを置くステップと
を実行するための命令をさらに含むことを特徴とする請求項17に記載のコンピューティングデバイス。 In response to reaching a debug probe calling the debug processing function, obtaining a reference destination value of the compile time constant pointer corresponding to the debug probe calling the debug processing function;
18. The computing of claim 17, further comprising: executing a step of placing a breakpoint on a line of code immediately following a call to a portion of code being stepped in by the thread. device.
前記到達したデバッグプローブに関連するコード部分への第1スタックフレームの戻りアドレスを識別ステップと、
前記戻りアドレスにブレークポイントを置くステップと
を実行するための命令をさらに含むことを特徴とする請求項17に記載のコンピューティングデバイス。 In response to reaching a debug probe calling the debug processing function, obtaining a reference destination value of the compile time constant pointer corresponding to the debug probe calling the debug processing function;
Identifying the return address of the first stack frame to the code portion associated with the reached debug probe;
The computing device of claim 17, further comprising instructions for performing a step of placing a breakpoint at the return address.
ユーザ入力によって生成されたコードを含むプログラムコードのリストを生成する手段であって、前記リストとアセンブリとを比較することにより、ユーザ入力によって生成されたコード部分とユーザ入力によって生成されていないコード部分とが区別される、手段と、
ネイティブコードに、デバッグ処理関数への呼出し及びコンパイル時定数ポインタを含むプログラムコードであるデバッグプローブとグローバル変数であるフラグとを挿入する手段であって、前記デバッグプローブは、前記コンパイル時定数ポインタにより、コンパイル時における前記デバッグプローブと関連付けられたフラグを参照し、前記フラグが0でない値を示す場合にデバッグ処理関数を呼び出すことが記述され、前記デバッグプローブ及び前記フラグは、前記ネイティブコードを生成するためのコンピュータプログラムコンパイル動作中に挿入され、前記ネイティブコードは、クラスメソッドおよび/または静的関数を含む手段と、
前記ネイティブコードをプロセスとして実行する手段であって、前記プロセスは、ステッピング動作を実行する1つまたは複数の実行のスレッドを含み、前記実行のスレッドが前記プロセスを介してステッピング動作を実行中に前記デバッグ処理関数を呼び出しているデバッグプローブに到達すると、当該到達したデバッグプローブに関連するコード部分の命令ポインタが前記リストに示されている場合に、前記実行のスレッドを停止する手段と
を備えたことを特徴とするコンピューティングデバイス。 A computing device for debugging,
It means for generating a list of program codes including the code generated by the user input, by comparing the list and the assembly, the code portion that is not generated by the user input and the generated code portion by a user input Is distinguished from the means,
A means for inserting a debug probe, which is a program code including a call to a debug processing function and a compile time constant pointer, and a flag, which is a global variable, into the native code, the debug probe using the compile time constant pointer, Reference is made to a flag associated with the debug probe at compile time, and it is described that a debug processing function is called when the flag indicates a non-zero value. The debug probe and the flag generate the native code. Inserted during a computer program compilation operation, wherein the native code comprises class methods and / or static functions;
Means for executing the native code as a process, wherein the process includes one or more threads of execution that perform a stepping operation, while the thread of execution is performing a stepping operation through the process; Means for stopping the thread of execution when the instruction pointer of the code portion related to the reached debug probe is shown in the list when the debug probe calling the debug processing function is reached. A computing device characterized by.
をさらに備えたことを特徴とする請求項24に記載のコンピューティングデバイス。 25. The computing device of claim 24, further comprising means for stopping the thread at a line of code after a debug probe that is calling the debug processing function.
をさらに備えたことを特徴とする請求項24に記載のコンピューティングデバイス。 25. The computing device of claim 24, further comprising means for stopping the thread at a line of code immediately following a call to a code portion being stepped in by the thread.
前記戻りアドレスで前記スレッドを停止させる手段と
をさらに備えたことを特徴とする請求項24に記載のコンピューティングデバイス。 Means for identifying the return address of the first stack frame to the code portion associated with the reached debug probe;
The computing device of claim 24, further comprising means for stopping the thread at the return address.
Applications Claiming Priority (2)
| Application Number | Priority Date | Filing Date | Title |
|---|---|---|---|
| US10/419,384 | 2003-04-21 | ||
| US10/419,384 US7401323B2 (en) | 2003-04-21 | 2003-04-21 | Just-My-Code debugging |
Publications (3)
| Publication Number | Publication Date |
|---|---|
| JP2004326789A JP2004326789A (en) | 2004-11-18 |
| JP2004326789A5 JP2004326789A5 (en) | 2007-05-10 |
| JP4901075B2 true JP4901075B2 (en) | 2012-03-21 |
Family
ID=32990322
Family Applications (1)
| Application Number | Title | Priority Date | Filing Date |
|---|---|---|---|
| JP2004125956A Expired - Fee Related JP4901075B2 (en) | 2003-04-21 | 2004-04-21 | Computer-readable medium, method and computing device |
Country Status (5)
| Country | Link |
|---|---|
| US (1) | US7401323B2 (en) |
| EP (1) | EP1475714B1 (en) |
| JP (1) | JP4901075B2 (en) |
| KR (1) | KR100996807B1 (en) |
| CN (1) | CN100430904C (en) |
Families Citing this family (59)
| Publication number | Priority date | Publication date | Assignee | Title |
|---|---|---|---|---|
| US7143407B2 (en) * | 2001-07-26 | 2006-11-28 | Kyocera Wireless Corp. | System and method for executing wireless communications device dynamic instruction sets |
| US7493615B2 (en) * | 2003-05-01 | 2009-02-17 | Sun Microsystems, Inc. | Apparatus and method for synchronizing multiple threads in an out-of-order microprocessor |
| US20050071820A1 (en) * | 2003-09-25 | 2005-03-31 | International Business Machines Corporation | Using a debugging framework to enforce best practices in program development |
| US20050120272A1 (en) * | 2003-11-13 | 2005-06-02 | Smith Zachary S. | Systems and methods for determining bug ownership |
| US7647586B2 (en) * | 2004-08-13 | 2010-01-12 | Sun Microsystems, Inc. | System and method for providing exceptional flow control in protected code through watchpoints |
| US7882492B2 (en) * | 2004-09-17 | 2011-02-01 | Oracle America, Inc. | Intelligent computer program debugger, and system and method for implementing the same |
| US7457671B2 (en) * | 2004-09-30 | 2008-11-25 | Rockwell Automation Technologies, Inc. | Systems and methods that facilitate management of add-on instruction generation, selection, and/or monitoring during execution |
| US7493604B2 (en) * | 2004-10-21 | 2009-02-17 | Microsoft Corporation | Conditional compilation of intermediate language code based on current environment |
| CN100345120C (en) * | 2004-12-24 | 2007-10-24 | 华为技术有限公司 | Method for using information output from encoding and decoding operation |
| US20060161896A1 (en) * | 2005-01-14 | 2006-07-20 | International Business Machines Corporation | Performing debug requests that are within the debug domain of a class loader |
| US7698691B2 (en) | 2005-09-20 | 2010-04-13 | Microsoft Corporation | Server application state |
| US20070074168A1 (en) * | 2005-09-29 | 2007-03-29 | International Business Machines Corporation | Automated step type determination |
| US20070078538A1 (en) * | 2005-09-30 | 2007-04-05 | Omron Corporation | Debug device |
| US20070168972A1 (en) * | 2005-11-30 | 2007-07-19 | International Business Machines Corporation | Debugging a computer program |
| US7774761B2 (en) * | 2005-12-27 | 2010-08-10 | International Business Machines Corporation | Use of memory watch points and a debugger to improve analysis of runtime memory access errors |
| CN100485636C (en) * | 2006-04-24 | 2009-05-06 | 华为技术有限公司 | Debugging method and device for telecommunication service development based on model drive |
| US7716646B2 (en) * | 2006-05-11 | 2010-05-11 | Rekha Kaushik | Loading a chain of processors from an XML file |
| US8225286B2 (en) * | 2006-05-23 | 2012-07-17 | Microsoft Corporation | Debugging interpreted input |
| US20080083012A1 (en) * | 2006-06-26 | 2008-04-03 | Dachuan Yu | Program instrumentation method and apparatus for constraining the behavior of embedded script in documents |
| US8429613B2 (en) | 2006-10-31 | 2013-04-23 | Microsoft Corporation | Stepping and application state viewing between points |
| US7926036B2 (en) * | 2007-04-26 | 2011-04-12 | Microsoft Corporation | Technologies for code failure proneness estimation |
| US8355706B2 (en) * | 2007-07-20 | 2013-01-15 | Broadcom Corporation | Method and system for utilizing context data tags to catalog data in wireless system |
| US7882495B2 (en) * | 2007-06-14 | 2011-02-01 | Microsoft Corporation | Bounded program failure analysis and correction |
| US8291381B2 (en) * | 2007-09-27 | 2012-10-16 | Microsoft Corporation | Call stack parsing in multiple runtime environments |
| US8191074B2 (en) | 2007-11-15 | 2012-05-29 | Ericsson Ab | Method and apparatus for automatic debugging technique |
| US20090132666A1 (en) * | 2007-11-15 | 2009-05-21 | Shahriar Rahman | Method and apparatus for implementing a network based debugging protocol |
| CN101482845B (en) * | 2008-01-08 | 2011-08-10 | 国际商业机器公司 | Method and system for calling instant debugger |
| US8141056B2 (en) * | 2008-04-03 | 2012-03-20 | International Business Machines Corporation | Just-in-time dynamic instrumentation |
| US8196107B2 (en) * | 2008-06-19 | 2012-06-05 | Microsoft Corporation | Simulating stepping through interpreted code |
| US8683439B2 (en) * | 2008-08-21 | 2014-03-25 | International Business Machines Corporation | System and process for debugging object-oriented programming code leveraging preprocessors |
| US8752020B2 (en) * | 2008-08-21 | 2014-06-10 | International Business Machines Corporation | System and process for debugging object-oriented programming code leveraging runtime metadata |
| CN101739333B (en) * | 2008-11-25 | 2013-10-16 | 国际商业机器公司 | Method, tool and device for debugging application program |
| US9632909B2 (en) * | 2008-12-16 | 2017-04-25 | Microsoft Technology Licensing, Llc | Transforming user script code for debugging |
| US8732663B2 (en) * | 2010-02-24 | 2014-05-20 | Salesforce.Com, Inc. | System, method and computer program product for providing automated testing by utilizing a preconfigured point of entry in a test or by converting a test to a predefined format |
| US20110321017A1 (en) * | 2010-06-29 | 2011-12-29 | International Business Machines Corporation | Computer code debugging method and apparatus providing exception breakpoints |
| EP2477116A1 (en) * | 2011-01-13 | 2012-07-18 | Software AG | Method and system for debugging a job running on a legacy system |
| US8756572B2 (en) | 2011-03-22 | 2014-06-17 | Microsoft Corporation | Debugger-set identifying breakpoints after coroutine yield points |
| US8661413B2 (en) | 2011-04-13 | 2014-02-25 | International Business Machines Corporation | Impact indication of thread-specific events in a non-stop debugging environment |
| US8893090B2 (en) | 2011-04-15 | 2014-11-18 | Microsoft Corporation | Stepping out of an asynchronous method into its continuation in a debugger |
| US8918767B2 (en) | 2011-06-16 | 2014-12-23 | Microsoft Corporation | Pattern-based compilation of asynchronous consumption |
| US9009678B2 (en) * | 2011-06-28 | 2015-04-14 | International Business Machines Corporation | Software debugging with execution match determinations |
| JP5785474B2 (en) * | 2011-10-27 | 2015-09-30 | インターナショナル・ビジネス・マシーンズ・コーポレーションInternational Business Machines Corporation | Program debugging method, debugging apparatus, and debugging support GUI |
| US9087153B2 (en) | 2011-11-04 | 2015-07-21 | International Business Machines Corporation | Code coverage framework |
| US8776025B2 (en) * | 2011-11-04 | 2014-07-08 | International Business Machines Corporation | Integrated debugger and code coverage tool |
| EP2608057A1 (en) | 2011-12-23 | 2013-06-26 | Software AG | Computer-implemented system for analyzing an instance of a process |
| US10664384B2 (en) | 2013-03-15 | 2020-05-26 | Microsoft Technology Licensing, Llc | Javascript debugging using just my code |
| US9274931B2 (en) | 2013-05-06 | 2016-03-01 | International Business Machines Corporation | Inserting implicit sequence points into computer program code to support debug operations |
| US10127138B2 (en) * | 2013-06-06 | 2018-11-13 | Microsoft Technology Licensing, Llc. | Debugging native code by transitioning from execution in native mode to execution in interpreted mode |
| US9146834B2 (en) * | 2013-08-22 | 2015-09-29 | Oracle International Corporation | Targeted cloud-based debugging |
| US9239774B2 (en) | 2014-01-15 | 2016-01-19 | Microsoft Technology Licensing, Llc | Classification of JavaScript code for debugging using just my code |
| US9424163B2 (en) | 2014-01-15 | 2016-08-23 | Microsoft Technology Licensing, Llc | Exception and debugging behaviors for JavaScript debugging using just my code |
| US10275234B2 (en) * | 2015-05-28 | 2019-04-30 | Sap Se | Selective bypass of code flows in software program |
| US10579498B2 (en) * | 2016-07-31 | 2020-03-03 | Microsoft Technology Licensing, Llc. | Debugging tool for a JIT compiler |
| US10162731B2 (en) | 2017-01-23 | 2018-12-25 | International Business Machines Corporation | Conditional breakpoint on call stack during debugging at runtime |
| US10169197B2 (en) * | 2017-01-24 | 2019-01-01 | International Business Machines Corporation | Temporary breakpoints during debug process |
| US10120656B1 (en) | 2017-11-07 | 2018-11-06 | Bank Of America Corporation | Robotic process automation system for functional evaluation and improvement of back end instructional constructs |
| US10713145B2 (en) * | 2018-01-05 | 2020-07-14 | International Business Machines Corporation | Automated debugging with combined static and dynamic analysis |
| US11436830B2 (en) | 2020-03-11 | 2022-09-06 | Bank Of America Corporation | Cognitive robotic process automation architecture |
| US11294793B1 (en) * | 2020-10-23 | 2022-04-05 | UiPath Inc. | Robotic process automation (RPA) debugging systems and methods |
Family Cites Families (13)
| Publication number | Priority date | Publication date | Assignee | Title |
|---|---|---|---|---|
| JP2653411B2 (en) * | 1992-02-19 | 1997-09-17 | 工業技術院長 | How to set breakpoints |
| JPH0822401A (en) * | 1994-07-07 | 1996-01-23 | Hitachi Ltd | Method for interrupting program execution and debugging device |
| JPH09146776A (en) * | 1995-11-22 | 1997-06-06 | Hitachi Ltd | Object generating method and debugging method |
| JPH11194959A (en) * | 1997-12-26 | 1999-07-21 | Nec Corp | Compiling method and computer readable storage medium for recording compile program |
| US6249907B1 (en) | 1998-03-24 | 2001-06-19 | International Business Machines Corporation | Method system and article of manufacture for debugging a computer program by encoding user specified breakpoint types at multiple locations in the computer program |
| JP3130884B2 (en) * | 1998-12-17 | 2001-01-31 | 日本電気アイシーマイコンシステム株式会社 | Debug device and debugging method |
| JP2001060161A (en) * | 1999-08-24 | 2001-03-06 | Nec Ic Microcomput Syst Ltd | Debugging device and method and recording medium |
| US6681384B1 (en) * | 1999-12-23 | 2004-01-20 | International Business Machines Corporation | Multi-threaded break-point |
| US6826746B2 (en) | 2001-03-08 | 2004-11-30 | International Business Machines Corporation | Debugger probe for object oriented programming |
| US6931631B2 (en) * | 2001-06-27 | 2005-08-16 | International Business Machines Corporation | Low impact breakpoint for multi-user debugging |
| US7134115B2 (en) * | 2002-02-07 | 2006-11-07 | Matsushita Electric Industrial Co., Ltd. | Apparatus, method, and program for breakpoint setting |
| US20040123279A1 (en) * | 2002-12-18 | 2004-06-24 | International Business Machines Corporation | Method and system for auto-instrumenting java applications through probe injection |
| US20040230955A1 (en) * | 2003-02-26 | 2004-11-18 | Bea Systems, Inc. | System for multi-language debugging |
-
2003
- 2003-04-21 US US10/419,384 patent/US7401323B2/en not_active Expired - Fee Related
-
2004
- 2004-03-24 EP EP04007107.8A patent/EP1475714B1/en not_active Expired - Lifetime
- 2004-04-20 KR KR1020040026969A patent/KR100996807B1/en active IP Right Grant
- 2004-04-21 CN CNB2004100351610A patent/CN100430904C/en not_active Expired - Fee Related
- 2004-04-21 JP JP2004125956A patent/JP4901075B2/en not_active Expired - Fee Related
Also Published As
| Publication number | Publication date |
|---|---|
| JP2004326789A (en) | 2004-11-18 |
| CN1540517A (en) | 2004-10-27 |
| EP1475714A2 (en) | 2004-11-10 |
| EP1475714A3 (en) | 2008-07-16 |
| US7401323B2 (en) | 2008-07-15 |
| CN100430904C (en) | 2008-11-05 |
| US20040210876A1 (en) | 2004-10-21 |
| EP1475714B1 (en) | 2016-11-16 |
| KR100996807B1 (en) | 2010-11-25 |
| KR20040091560A (en) | 2004-10-28 |
Similar Documents
| Publication | Publication Date | Title |
|---|---|---|
| JP4901075B2 (en) | Computer-readable medium, method and computing device | |
| US7761855B2 (en) | Computer program product and system for altering execution flow of a computer program | |
| US8423969B2 (en) | Inheritance breakpoints for use in debugging object-oriented computer programs | |
| EP2359247B1 (en) | Transforming user script code for debugging | |
| EP2724235B1 (en) | N-way runtime interoperative debugging | |
| US6874140B1 (en) | Debug annotations | |
| US8527961B2 (en) | Expression-level debugging without format changes | |
| US20180107585A1 (en) | Using edit and continue to dynamically set and unset optimizations in source code while debugging | |
| US20090199163A1 (en) | Debugger assistance for locating values at runtime | |
| US8261243B2 (en) | Selective execution of trace mechanisms for applications having different bit structures | |
| JP2000181725A (en) | Method and system for altering executable code and giving addition function | |
| US9489286B2 (en) | Method and system for computer assisted hot-tracing mechanism | |
| US7694289B2 (en) | Method for embedding object codes in source codes | |
| JP2004164554A (en) | Device and method for executing and monitoring program | |
| US20090320007A1 (en) | Local metadata for external components | |
| US8533683B2 (en) | Stack walking enhancements using sensorpoints | |
| US20080127118A1 (en) | Method and system for dynamic patching of software | |
| Bouraqadi et al. | Test-driven development for generated portable Javascript apps | |
| CN111880804A (en) | Application program code processing method and device | |
| US20070250814A1 (en) | Debugging in an operating system with multiple subsystems | |
| US8104019B2 (en) | Debugging in an operating system with multiple subsystems | |
| Lee et al. | Debugging mixed‐environment programs with Blink | |
| JPH11110256A (en) | Device and method for debugging program, and computer readable recording medium recorded with the method for the same | |
| JP2007004516A (en) | Program debugging method of built-in system | |
| Clark | Transparently integrating debugging and dynamic binary instrumentation |
Legal Events
| Date | Code | Title | Description |
|---|---|---|---|
| A521 | Written amendment |
Free format text: JAPANESE INTERMEDIATE CODE: A523 Effective date: 20070320 |
|
| A621 | Written request for application examination |
Free format text: JAPANESE INTERMEDIATE CODE: A621 Effective date: 20070320 |
|
| A131 | Notification of reasons for refusal |
Free format text: JAPANESE INTERMEDIATE CODE: A131 Effective date: 20100608 |
|
| A521 | Written amendment |
Free format text: JAPANESE INTERMEDIATE CODE: A523 Effective date: 20100908 |
|
| A131 | Notification of reasons for refusal |
Free format text: JAPANESE INTERMEDIATE CODE: A131 Effective date: 20110128 |
|
| A601 | Written request for extension of time |
Free format text: JAPANESE INTERMEDIATE CODE: A601 Effective date: 20110428 |
|
| A602 | Written permission of extension of time |
Free format text: JAPANESE INTERMEDIATE CODE: A602 Effective date: 20110509 |
|
| A521 | Written amendment |
Free format text: JAPANESE INTERMEDIATE CODE: A523 Effective date: 20110714 |
|
| TRDD | Decision of grant or rejection written | ||
| A01 | Written decision to grant a patent or to grant a registration (utility model) |
Free format text: JAPANESE INTERMEDIATE CODE: A01 Effective date: 20111220 |
|
| A01 | Written decision to grant a patent or to grant a registration (utility model) |
Free format text: JAPANESE INTERMEDIATE CODE: A01 |
|
| A61 | First payment of annual fees (during grant procedure) |
Free format text: JAPANESE INTERMEDIATE CODE: A61 Effective date: 20111227 |
|
| R150 | Certificate of patent or registration of utility model |
Ref document number: 4901075 Country of ref document: JP Free format text: JAPANESE INTERMEDIATE CODE: R150 Free format text: JAPANESE INTERMEDIATE CODE: R150 |
|
| FPAY | Renewal fee payment (event date is renewal date of database) |
Free format text: PAYMENT UNTIL: 20150113 Year of fee payment: 3 |
|
| R250 | Receipt of annual fees |
Free format text: JAPANESE INTERMEDIATE CODE: R250 |
|
| S111 | Request for change of ownership or part of ownership |
Free format text: JAPANESE INTERMEDIATE CODE: R313113 |
|
| R350 | Written notification of registration of transfer |
Free format text: JAPANESE INTERMEDIATE CODE: R350 |
|
| R250 | Receipt of annual fees |
Free format text: JAPANESE INTERMEDIATE CODE: R250 |
|
| R250 | Receipt of annual fees |
Free format text: JAPANESE INTERMEDIATE CODE: R250 |
|
| R250 | Receipt of annual fees |
Free format text: JAPANESE INTERMEDIATE CODE: R250 |
|
| LAPS | Cancellation because of no payment of annual fees |