JP4607308B2 - Noninvasive living body measurement apparatus and method - Google Patents
Noninvasive living body measurement apparatus and method Download PDFInfo
- Publication number
- JP4607308B2 JP4607308B2 JP2000303901A JP2000303901A JP4607308B2 JP 4607308 B2 JP4607308 B2 JP 4607308B2 JP 2000303901 A JP2000303901 A JP 2000303901A JP 2000303901 A JP2000303901 A JP 2000303901A JP 4607308 B2 JP4607308 B2 JP 4607308B2
- Authority
- JP
- Japan
- Prior art keywords
- blood vessel
- profile
- living body
- blood
- absorption profile
- Prior art date
- Legal status (The legal status is an assumption and is not a legal conclusion. Google has not performed a legal analysis and makes no representation as to the accuracy of the status listed.)
- Expired - Fee Related
Links
Images


Landscapes
- Investigating Or Analysing Materials By Optical Means (AREA)
- Measurement Of The Respiration, Hearing Ability, Form, And Blood Characteristics Of Living Organisms (AREA)
Description
【0001】
【発明の属する技術分野】
この発明は、非侵襲生体測定方法に関し、とくに、生体から採血することなく経皮的に血管又は血液の情報、つまり、血管径、血管深さ、ヘモグロビン濃度やヘマトクリットなどを測定する方法に関する。
【0002】
【従来の技術】
末梢血液の検査は、臨床検査において最も重要で且つ頻繁に行われる検査のひとつである。特にヘモグロビン濃度は、貧血の診断を行う上で必須の検査項目である。これらの検査は現在採血によって行われているが、頻回の採血は患者の負担となるばかりか注射針の誤射による感染事故の発生が危惧される。
【0003】
以上のようなことを背景として、この検査項目を非侵襲的(経皮的)に計測しようとする装置が考案されている。つまり、血管を含む生体組織を光源で照明して撮像し、撮像された画像について血管を横切って分布する画像濃度分布を画像の濃度プロファイルとして抽出し、抽出した濃度プロファイルから血管に対応する部分をベースラインで切り取り、切り取ったプロファイルに基づいて血液成分を検査するようにした装置が知られている(例えば、国際特許公開WO97/24066号公報参照)。
【0004】
【発明が解決しようとする課題】
しかしながら、このような従来の装置では、濃度プロファイルから血管に対応する部分を切り取るベースラインを画一的に設定しているため、血管の太さや皮膚からの深さが変化すると計測結果にバラツキを生じ、従って、被検者や被検部位が変わると正しい検査結果を得ることが難しいという問題点があった。
この発明は、このような事情を考慮してなされたもので、画像濃度プロファイル(光強度分布)の形態に基づいて血管の太さや深さを考慮してベースラインを適正に設定することにより、被検者や被検部位が変化しても精度の高い計測結果を得ることが可能な非侵襲人体計測装置および方法を提供するものである。
【0005】
【課題を解決するための手段】
この発明は血管を含む生体組織の一部を照明するための光源と、照明された血管と組織を撮像する撮像部と、撮像された画像を解析する解析部を備え、解析部が、(1)撮像された画像について血管を横切って分布する画像輝度分布を対数変換し、変換した画像輝度分布から血管の中心に対応して極小となる谷状の輝度プロファイルを抽出し、(2)得られた輝度プロファイルを高さHの頂上を有する山状の吸収プロファイルに変換し、(3)前記吸収プロファイルを分布関数とみなしてHを変化させながらその関数の標準偏差бと、吸収プロファイルの高さaH(0<a<1)における幅Wを算出し、W=2бとなるHを決定して、高さaHにおける水平線をベースラインとし、(4)ベースラインより上にある吸収プロファイルの特徴を定量化し、(5)その特徴に基づいて血管又は血液情報を算出する手段を備える非侵襲生体計測装置を提供するものである。
【0006】
【発明の実施の形態】
光を血管を有する組織に透過させ、その透過光像を撮像すると、血管部分は光を吸収するためその画像は暗くなり、他の部分は光を透過させるのでその画像は明るくなる。そこで、この発明は、血管を横切った輝度分布を検出することにより、血管情報や血液成分(例えばヘモグロビン)の濃度を定量しようとするものである。
【0007】
従って、この発明では、血管を含む生体組織の一部を照明するための光源と、照明された血管と組織を撮像する撮像部と、撮像された画像を解析する解析部を備え、解析部は、撮像された画像または輝度分布を解析する。
【0008】
この発明における生体とはヒトを含む哺乳動物であり、また、生体組織の一部とは生体から分離した組織ではなく、生体のありのままの一部であって、例えば指や耳朶などがあげられる。また、撮像部が生体組織の所望の部分を撮像できるように光源と撮像部とに対して生体の一部を相対的に固定する固定機構を備えることが好ましい。
【0009】
この発明において、撮像する画像は透過光画像でも反射光画像でもよい。
この発明の光源には、半導体レーザ(以下、LD)やLEDあるいはハロゲン光源など使用でき、直接生体の一部に照射してもよいし、ファイバーを介して照射してもよい。波長としては生体組織を透過し、水の吸収が大きくない400〜950nmの範囲にあることが好ましい。光源の波長(帯)は、透過光画像の場合には、例えば600〜950nmが使用され、反射光画像の場合には、例えば400〜950nmが使用される。
【0010】
また、光源が、少なくとも2波長以上の光を選択的に照射する発光素子からなることが好ましく、少なくとも1波長は、それぞれ酸化ヘモグロビンおよび還元ヘモグロビンの実質的な等吸収波長であることが望ましい。
撮像部は、レンズなどの光学系とCCDなどの撮像デバイスから構成できる。
【0011】
撮像部では、血管を横切る方向の画像輝度プロファイルが得られればよいので、撮像素子としては、CCDの他にラインセンサーやフォトダイオードアレイが使用できる。画像輝度プロファイルとしては血管に直交する方向のものが好ましい
また、フォトダイオード1個を、血管を横切る方向に駆動させて輝度プロファイルを得ることもできる。
【0012】
解析部は、抽出部と定量化部と演算部と出力部からなり、得られた画像濃度プロファイルから血液成分の量、例えばヘモグロビン濃度を演算して出力するが、これらは市販のパーソナルコンピュータを利用してもよい。
【0013】
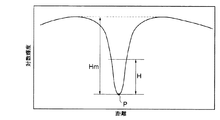
解析部では、先ず、撮像された画像について血管を横切って分布する画像輝度分布を求める。血管を横切って分布する画像輝度プロファイルは、光が血管部分で吸収されるため図6に示すように血管の中心で極小となる谷状の輝度プロファイルとなり、その輝度を自然対数で変換すると、吸光度が求まり、プロファイルが得られる。この輝度プロファイルは、測定対象や部位が変わると組織表面から血管までの深さ,血管径などによって谷の深さ(ピーク)や谷間の広がりなどが変化するため、測定対象や部位が変化しても輝度プロファイルから血管又は血液情報を正しく抽出できる部分を特定する必要がある。
【0014】
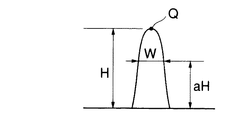
そこで、解析部は、谷状の輝度プロファイルについて、図6に示すように谷底(極小値)Pからの深さがHまでの部分を切り出し、切り出した輝度プロファイルを吸収プロファイルに変換する。それによって図7に示すように高さHの頂上Qを有する山状の吸収プロファイルが得られる。
【0015】
そこで、この山状の吸収プロファイルを正規分布関数やローレンズ分布関数のような分布関数と見なし、切り出し高さHを種々に変化させながらその関数における標準偏差aと、吸収プロファイル(図7)の高さaH(0<a<1)における幅Wを算出する。
【0016】
図9は、図6の輝度プロファイルを切り取る谷底からの深さH、つまり、図7の吸収プロファイルの高さHを、最大値Hm(図6)の0〜100%の間で変化させたときの高さ0.5H,0.6H,0.7Hにおける幅Wの変化をそれぞれ曲線W50,W60,W70で表わし、2σの変化を曲線Gで表わしている。
【0017】
図9から、高さHをHmの100%まで変化させると曲線W50,W60,W70は曲線Gとそれぞれ点A,B,Cで交わることが分かる。これは、輝度プロファイルを異なる深さHで切り出し(図6)、それから得られる高さHの吸収プロファイル(図7)を分布関数とみなすと、各高さについて2σに等しい幅Wが1つ存在することを示している。この原理を応用したのがこの発明の特徴である。
【0018】
そこで、この発明では、予め設定したaに対してW=Kσ(Kは定数)となるHを決定し、高さHの吸収プロファイルにおいて高さaHにおける水平線をベースラインとし、ベースラインより上にある吸収プロファイルを血管又は血液情報を正しく抽出できる部分(血管プロファイル)として特定する。そして、特定した部分に基づいて血管又は血液情報を算出するようにしている。
【0019】
この発明において、光源が、少なくとも2種類の波長の光によって血管を含む生体組織の一部を照明する光源である場合には、吸収プロファイルの特徴を定量化する工程において、少なくとも2種類の波長の光によってそれぞれ得られるベースラインより上にある吸収プロファイルの特徴を、吸収プロファイルの高さh1、h2、吸収プロファイルの幅W1、W2、吸収プロファイルとベースラインで囲まれた面積A1、A2として算出するようにしてもよい。
【0020】
血管又は血液情報を算出する場合には、血管の組織表面からの深さtをh1、h2、W1、W2に基づいて算出することができる。
また、血管径φをh1、A1、又はW1、tに基づいて算出することができる。
【0021】
さらに、ヘモグロビン濃度をh1、A1、t、φに基づいて算出することができる。
aが、0.5≦a≦0.9の範囲の値に設定されることが好ましい。
【0022】
また、この発明は、血管を含む生体組織の一部を照明するための光源と、照明された生体組織の光強度分布を検出するための検出部と、検出された光強度分布を解析する解析部を備えた測定装置において、解析部が、
(1)光強度分布を所定の関数によって変換し、
(2)変換された光強度分布から、極小点または極大点を検出し、
(3)検出された極小点または極大点を中心として、変換された光強度分布上の左右の任意の少なくとも2点を決定し、その2点を結んだ直線または曲線を基準線として、吸収プロファイルを求め、
(4)吸収プロファイルの形状特徴を定量化し、
(5)吸収プロファイルの形状特徴を一定の関数の式に適合させ、
(6)極大点または極小点の入る少なくとも2点の位置をしきい値として、2点のしきい値位置を任意に移動させて、(3)〜(5)を繰り返し、
(7)吸収プロファイルの形状特徴を一定の関数の式に適合するしきい値をベースラインと決定し、
(8)決定されたベースラインでの吸収プロファイルの特徴から血管または血液情報を算出する手段から構成されることを特徴とする非侵襲生体計測装置を提供するものである。
【0023】
この場合、光源が少なくとも2種類の波長の光を照明する光源であり、吸収プロファイルの形状特徴を、各波長毎に算出してもよい。
また、上記変換関数が対数関数であってもよい。
吸収プロファイルの形状から面積A、ピーク高hとピーク高に対するn%高における幅Wを算出し、吸収プロファイルの形状を定量してもよい。
吸収プロファイルの形状特徴が、吸収プロファイルを確率密度関数と想定した時の標準偏差σで算出されてもよい。
【0024】
吸収プロファイルを確率密度関数と想定した時の標準偏差σと吸収プロファイルのピーク高に対するn%高における幅Wの定数倍とが一致してもよい。
しきい値位置の移動方法が、極小点または極大点を中心として、左右均等に変化させてもよい。
少なくとも検出部に撮像素子、またはラインセンサー、またはフォトセンサを血管を横切る方向に移動させる方法を用いてもよい。
少なくとも血管情報が血管幅であり、少なくとも血液情報がヘモグロビンまたはヘマトクリットまたは酸素飽和度であってもよい。
【0025】
血管幅φが吸収プロファイルのパラメータ面積A、ピーク高h、ピーク高に対するn%高における幅Wから構成される関数であってもよい。
ヘモグロビンまたはヘマトクリットが吸収プロファイルのパラメータ面積A、ピーク高h、ピーク高に対するn%高におけるWから構成される関数であってもよい。
血管幅または血液情報を算出する手段が、少なくとも2波長の吸光度パラメータから深さt、またはヘマトクリット、酸素飽和度を推定してもよい。
上記深さの推定方法が各波長の吸収プロファイルのパラメータピーク高h、ピーク高に対するn%高における幅Wからなる関数であってもよい。
血管幅は推定された深さt、および吸収プロファイルのパラメータ面積A、ピーク高h、ピーク高に対するn%高における幅Wからなる関数であってもよい。
ヘモグロビンまたはヘマトクリットは推定された深さtを用いて、および吸収プロファイルのパラメータ面積A、ピーク高h、ピーク高に対するn%高における幅Wからなる関数であってもよい。
【0026】
また、別の観点からこの発明は、血管を含む生体組織の一部を照明するための光源と、照明された生体組織の光強度分布を検出するための検出部と、検出された光強度分布を解析する解析部を備えた測定装置において、解析部が、
(1)光強度分布を所定の関数によって変換し、
(2)変換された光強度分布から、極小点または極大点を検出し、
(3)検出された極小点または極大点を中心として、変換された光強度分布上の左右の任意の少なくとも2点を決定し、その2点を結んだ直線または曲線を基準線として、吸収プロファイルを求め、
(4)吸収プロファイルの形状特徴を定量化し、
(5)吸収プロファイルの形状特徴を一定の関数の式に適合させ、
(6)極大点または極小点の入る少なくとも2点の位置をしきい値として、2点のしきい値位置を任意に移動させて、(3)〜(5)を繰り返し、
(7)吸収プロファイルの形状特徴を一定の関数の式に適合するしきい値をベースラインと決定し、
(8)決定されたベースラインでの吸収プロファイルの特徴から血管または血液情報を算出する手段から構成されることを特徴とする非侵襲生体計測方法を提供するものである。
【0027】
実施例
以下、実施例に基づいてこの発明を詳述する。これによってこの発明が限定されるものではない。
まず、この発明の実施例に用いる血液検査装置の構成を説明する。
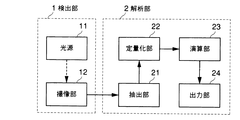
図1は血液検査装置の構成を示すブロック図であり、血管を含む生体組織の一部を照明するための光源11と、照明された血管と組織の透過光像を撮像する撮像部12は、検出部1の内部に設けられる。
【0028】
解析部2は、撮像部12で撮像された画像について血管を直角に直線的に横切って分布する画像輝度分布を対数変換して輝度プロファイルを抽出する抽出部21と、抽出された輝度プロファイルを吸収プロファイルに変換し吸収プロファイルの特徴を定量化する定量化部22と、定量化された特徴に基づいて血管又は血液情報を算出する演算部23と、算出結果を出力する出力部(CRT)24を備える。なお、解析部2はパーソナルコンピュータによって構成される。
また、抽出部21の輝度プロファイルの抽出の時、必ずしも対数変換をしなくとも良い。その場合は定量部22において、吸収プロファイルを対数変換しても良い。
【0029】
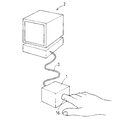
図2は図1に示す装置の斜視図であり、検出部1に内蔵される光源11および撮像部12は解析部2に信号ケーブル3によって接続されている。
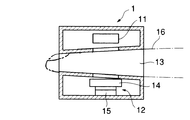
図3は検出部1の断面図であり、検出部1は光源11と、レンズ14および撮像素子15を有する撮像部12とを備え、開口部13に指16が挿入されると、光源11が指16を照明し、その透過光による画像がレンズ14を介して撮像素子15で撮像されるようになっている。ここで、開口部13は、挿入される指16を軽く固定できるように指先に向かって内径が小さくなり、固定部材を構成している。なお、撮像素子15はCCDで構成される。また、図8は光源11の正面図であり、LED11aとLED11bを備える。
【0030】
この実施例では、LED11aとして、中心波長660nm、半値幅40nmのVSF665M1(OPTRANS製)を使用し、LED11bとして、中心波長805nm、半値幅50nmのものを使用している。
【0031】
次に、このように構成された血液検査装置の解析部2の解析手順を図4に示すフローチャートを用いて説明する。
まず、LED11aによる波長(以下、第1波長という)の光で指を照明し、その透過像を撮像する(ステップS1)。それによって、図5のように、CCD15側の皮膚表面に局在する血管(静脈)像Vを得ることができる。
この場合、光源にコヒーレンシーの高いLDを使用しても、組織によって拡散されるためスペックルのない図5に示すような画像が得られる。
【0032】
次に、図5において、画像中血管像の最もコントラストがよい領域を検索し、決定した領域Rを解析領域として4角形で囲むように設定する(ステップS2)。
次に、領域R内で血管に垂直な方向の画像輝度分布を作製し、輝度の値を自然対数で変換して図6に示すような輝度プロファイルを求める(ステップS3,S4)。
【0033】
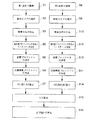
次に、ステップS5において、吸収プロファイルの作成とベースラインの決定を行うが、この処理を図11のフローチャートを用いて詳述する。
まず、ステップS51において、定数aを設定する。この実施例ではa=0.7(70%)としている。
【0034】
次に、ステップS52において、Hを最小値(例えば図6の輝度プロファイルの最大深さHmの10%)に設定する。そして、図6の輝度プロファイルについて谷底Pからの深さHまでの部分を切り出し(ステップS53)、切り出した部分を図7に示すように吸収プロファイルに変換する(ステップS54)。
【0035】
次に、吸収プロファイルを分布関数(確率密度関数)と見なし、その標準偏差σと、吸収プロファイル(図7)の高さaHつまり0.7Hにおける幅Wを算出する(ステップS55)。
【0036】
そして、2σとWとが一致するか否か比較し(ステップS56)、一致しない場合には、Hを若干大きい値に再設定し(ステップS57)、処理ルーチンをステップS53へ戻す。
【0037】
ステップS53〜S56をくり返すと、Hが増大するに従って2σとWとはそれぞれ図10の曲線GとW70に示すように変化し、HがHmの75%つまりH=0.75Hmになると、点Cで両者が一致し、2σ=Wとなる。この時の吸収プロファイルは図12に示すようになり、高さ0.7Hにおける水平線をベースラインBLと決定する(ステップS58)。
【0038】
次に図4のステップS6において、図12の吸収プロファイルのベースラインBLから上の部分を図13に示すように切り出し、これを血管プロファイルと決定する(ステップS6)。そして、図13の血管プロファイルの高さh1,幅W2,面積A1を算出する(ステップS7)。
【0039】
次に、LED11bによる805nmの波長(以下、第2波長という)の光で再び同じ指を照明し、その透過像を撮像する(ステップS8)。以下、ステップS9〜S14においてステップS2〜S7と同様の処理を行い、第2波長に対応する血管プロファイルの高さh2、幅W2,面積A2を算出する。
【0040】
そして、ステップS15において、組織表面から血管までの深さtを次式で算出する。
t=(h2/W2n)/(h1/W1)m……(1)
ここで、m,nは定数
【0041】
次に、ステップS16において血管径φと血管を流れる血液のヘモグロビン濃度Hgbをそれぞれ次式で算出する。
φ=A1α/h1=W1×f1(t) ……(2)
Hgb=(h1/A1β)×f2(t)×g(φ)……(3)
ここで、α,βは定数、関数f1,f2,gは実験的に決定される関数である。
このようにして、血管深さ,血管径およびヘモグロビン濃度が求められる。
【0042】
さらに、次の式を用いてヘマトクリットHct、酸素飽和度Osが求められる。
Hct=k×h1/h2+L…(4)
または、
Hct=k×A1/A2+L…(5)
Os=100×h1/h2+b…(6)
または
Os=100×A1/A2+c…(7)
ここで、k,L,b,cは定数である。
【0043】
図14は血管情報や血液情報を求める他の方法を示すフローチャートであり、図4に示すステップS4,S11の処理(対数輝度プロファイルの作成)をそれぞれステップS6,S13の処理の後で実行するようにしたものである。各ステップの処理内容は図4と同等であり、これによっても図4の方法と同様の算出結果を得ることができる。
【0044】
この実施例によれば、撮像画像から得られる吸収プロファイルを一種の分布関数とみなし、その標準偏差に基づいて、ベースラインを決定して吸収プロファイルの一部を血管の特性を表すプロファイルとして特定するようにしたので、特定したプロファイルから血管情報や血液情報を、測定対象や測定部位が変わっても精度よく測定することができる。
【0045】
【発明の効果】
この発明によれば、生体組織から得られる吸収プロファイルを所定の関数に適合させ、その関数に基づいてベースラインを決定するので、ベースラインによって特定される吸収プロファイルの特徴から血管情報や血液情報を、被検者や被検部位が変化しても精度よく計測することができる。
【図面の簡単な説明】
【図1】この発明の実施例に用いる血液検査装置の構成を示すブロック図である。
【図2】この発明の実施例に用いる血液検査装置の外形を示す斜視図である。
【図3】この発明の実施例に用いる血液検査装置の要部断面図である。
【図4】この発明の実施例の画像処理方法を示すフローチャートである。
【図5】この発明の実施例による撮像画像を示す説明図である。
【図6】この発明の実施例で得られる対数輝度プロファイルの一例を示す説明図である。
【図7】この発明の実施例で得られる吸収プロファイルの一例を示す説明図である。
【図8】この発明の実施例に用いる光源の正面図である。
【図9】この発明の吸収プロファイルの幅と標準偏差の関係を示すグラフである。
【図10】この発明の実施例の吸収プロファイルの幅と標準偏差との関係を示すグラフである。
【図11】図4の要部詳細を示すフローチャートである。
【図12】この発明の実施例で得られる吸収プロファイルの一例を示す説明図である。
【図13】この発明の実施例で得られる吸収プロファイルの一部を示す説明図である。
【図14】図4の変形例を示すフローチャートである。
【符号の説明】
1 検出部
2 解析部
21 抽出部
22 定量化部
23 演算部
24 出力部[0001]
BACKGROUND OF THE INVENTION
The present invention relates to a non-invasive living body measurement method, and more particularly, to a method for measuring blood vessel or blood information, that is, blood vessel diameter, blood vessel depth, hemoglobin concentration, hematocrit and the like, without taking blood from a living body.
[0002]
[Prior art]
Peripheral blood testing is one of the most important and frequently performed tests in clinical testing. In particular, the hemoglobin concentration is an essential test item for diagnosing anemia. Although these tests are currently performed by blood sampling, frequent blood sampling is not only a burden on the patient, but there is also a fear of the occurrence of infection accidents due to misfiring of the injection needle.
[0003]
Against the background as described above, a device has been devised that non-invasively (percutaneously) measures this inspection item. In other words, a biological tissue including blood vessels is imaged by illuminating with a light source, and an image density distribution that is distributed across the blood vessels is extracted as a captured image, and a portion corresponding to the blood vessel is extracted from the extracted density profile. An apparatus is known in which a blood component is inspected based on a profile cut out at a baseline (see, for example, International Patent Publication No. WO 97/24066).
[0004]
[Problems to be solved by the invention]
However, in such a conventional apparatus, since the baseline for cutting out the portion corresponding to the blood vessel from the concentration profile is set uniformly, the measurement results vary when the thickness of the blood vessel or the depth from the skin changes. Therefore, there is a problem that it is difficult to obtain a correct test result when the subject or the test site is changed.
The present invention was made in consideration of such circumstances, and by appropriately setting the baseline in consideration of the thickness and depth of the blood vessel based on the form of the image density profile (light intensity distribution), The present invention provides a noninvasive human body measuring apparatus and method capable of obtaining a highly accurate measurement result even when a subject or a test site changes.
[0005]
[Means for Solving the Problems]
The present invention includes a light source for illuminating a part of a biological tissue including a blood vessel, an imaging unit that images the illuminated blood vessel and tissue, and an analysis unit that analyzes the captured image. ) Logarithmically transform the image luminance distribution distributed across the blood vessel with respect to the captured image, and extract a valley-shaped luminance profile that becomes a minimum corresponding to the center of the blood vessel from the converted image luminance distribution. The brightness profile is converted into a mountain-shaped absorption profile having a peak of height H, and (3) the absorption profile is regarded as a distribution function, and the standard deviation б of the function is changed while changing H, and the height of the absorption profile. Width W at aH (0 <a <1) is calculated, H at which W = 2б is determined, the horizontal line at height aH is taken as the baseline, and (4) the characteristics of the absorption profile above the baseline Quantitative And it is intended to provide a noninvasive living body measuring device comprising means for calculating a blood vessel or blood information based on the (5) its features.
[0006]
DETAILED DESCRIPTION OF THE INVENTION
When light is transmitted through a tissue having blood vessels and the transmitted light image is captured, the blood vessel portion absorbs light, so that the image becomes dark, and the other portions transmit light, so the image becomes bright. Therefore, the present invention seeks to quantify blood vessel information and the concentration of blood components (for example, hemoglobin) by detecting a luminance distribution across the blood vessel.
[0007]
Therefore, the present invention includes a light source for illuminating a part of a biological tissue including a blood vessel, an imaging unit that images the illuminated blood vessel and tissue, and an analysis unit that analyzes the captured image. Analyzing the captured image or luminance distribution.
[0008]
The living body in the present invention is a mammal including a human, and a part of the living tissue is not a tissue separated from the living body but a part of the living body as it is, for example, a finger or an earlobe. Moreover, it is preferable to provide a fixing mechanism that fixes a part of the living body relative to the light source and the imaging unit so that the imaging unit can capture a desired portion of the living tissue.
[0009]
In the present invention, the image to be captured may be a transmitted light image or a reflected light image.
As the light source of the present invention, a semiconductor laser (hereinafter referred to as LD), an LED, a halogen light source or the like can be used. The wavelength is preferably in the range of 400 to 950 nm that penetrates biological tissue and does not absorb water. The wavelength (band) of the light source is, for example, 600 to 950 nm in the case of a transmitted light image, and 400 to 950 nm, for example, in the case of a reflected light image.
[0010]
Moreover, it is preferable that a light source consists of a light emitting element which selectively irradiates at least two wavelengths or more, and it is desirable that at least one wavelength is a substantially equivalent absorption wavelength of oxyhemoglobin and reduced hemoglobin, respectively.
The imaging unit can be composed of an optical system such as a lens and an imaging device such as a CCD.
[0011]
In the imaging unit, it is only necessary to obtain an image luminance profile in a direction across the blood vessel. Therefore, a line sensor or a photodiode array can be used in addition to the CCD as the imaging device. The image luminance profile is preferably in the direction perpendicular to the blood vessel. Alternatively, a luminance profile can be obtained by driving one photodiode in a direction crossing the blood vessel.
[0012]
The analysis unit consists of an extraction unit, a quantification unit, a calculation unit, and an output unit, and calculates and outputs the amount of blood components such as hemoglobin concentration from the obtained image density profile. May be.
[0013]
The analysis unit first obtains an image luminance distribution that is distributed across the blood vessel for the captured image. The image luminance profile distributed across the blood vessel is a valley-like luminance profile that is minimal at the center of the blood vessel as shown in FIG. 6 because light is absorbed by the blood vessel portion. Is obtained and a profile is obtained. In this luminance profile, the depth of the valley (peak) and the extent of the valley change depending on the depth from the tissue surface to the blood vessel, the diameter of the blood vessel, etc. In addition, it is necessary to specify a portion where blood vessel or blood information can be correctly extracted from the luminance profile.
[0014]
Therefore, the analysis unit cuts out a portion from the valley bottom (minimum value) P to the depth H as shown in FIG. 6 for the valley-like luminance profile, and converts the cut-out luminance profile into an absorption profile. As a result, a mountain-shaped absorption profile having a top Q having a height H as shown in FIG. 7 is obtained.
[0015]
Therefore, this mountain-shaped absorption profile is regarded as a distribution function such as a normal distribution function or a low-lens distribution function, and the standard deviation a in the function and the absorption profile (FIG. 7) are high while varying the cutout height H. The width W at aH (0 <a <1) is calculated.
[0016]
FIG. 9 shows a case where the depth H from the valley bottom where the luminance profile of FIG. 6 is cut, that is, the height H of the absorption profile of FIG. 7 is changed between 0 to 100% of the maximum value Hm (FIG. 6). Changes in width W at heights of 0.5H, 0.6H, and 0.7H are represented by curves W50, W60, and W70, respectively, and changes in 2σ are represented by curve G.
[0017]
As can be seen from FIG. 9, when the height H is changed to 100% of Hm, the curves W50, W60, and W70 intersect the curve G at points A, B, and C, respectively. This is because the brightness profile is cut out at different depths H (FIG. 6), and the absorption profile (FIG. 7) obtained from the height H is regarded as a distribution function, there is one width W equal to 2σ for each height. It shows that The application of this principle is a feature of the present invention.
[0018]
Therefore, in the present invention, H is determined such that W = Kσ (K is a constant) with respect to a set in advance, and in the absorption profile of height H, the horizontal line at the height aH is taken as the base line, and above the base line. A certain absorption profile is specified as a portion (blood vessel profile) from which blood vessel or blood information can be correctly extracted. Then, blood vessel or blood information is calculated based on the specified portion.
[0019]
In the present invention, when the light source is a light source that illuminates a part of a living tissue including a blood vessel with light of at least two types of wavelengths, in the step of quantifying the characteristics of the absorption profile, at least two types of wavelengths are used. The characteristics of the absorption profile above the baseline obtained by light are calculated as absorption profile heights h1 and h2, absorption profile widths W1 and W2, and areas A1 and A2 surrounded by the absorption profile and the baseline. You may do it.
[0020]
When calculating blood vessel or blood information, the depth t from the tissue surface of the blood vessel can be calculated based on h1, h2, W1, and W2.
Further, the blood vessel diameter φ can be calculated based on h1, A1, or W1, t.
[0021]
Furthermore, the hemoglobin concentration can be calculated based on h1, A1, t, and φ.
It is preferable that a is set to a value in the range of 0.5 ≦ a ≦ 0.9.
[0022]
The present invention also provides a light source for illuminating a part of a biological tissue including blood vessels, a detection unit for detecting the light intensity distribution of the illuminated biological tissue, and an analysis for analyzing the detected light intensity distribution. In the measuring apparatus provided with a section, the analysis section
(1) The light intensity distribution is converted by a predetermined function,
(2) The minimum or maximum point is detected from the converted light intensity distribution,
(3) Determine at least two points on the left and right of the converted light intensity distribution around the detected minimum or maximum point, and use the straight line or curve connecting the two points as a reference line to obtain an absorption profile Seeking
(4) Quantify the shape characteristics of the absorption profile,
(5) Adapt the shape characteristics of the absorption profile to a constant function equation,
(6) The position of at least two points where the maximum point or the minimum point enters is set as a threshold value, the threshold value positions of the two points are arbitrarily moved, and (3) to (5) are repeated.
(7) A threshold value that matches the shape characteristic of the absorption profile with a constant function formula is determined as a baseline,
(8) Provided is a noninvasive living body measurement device comprising means for calculating blood vessel or blood information from the characteristics of the determined absorption profile at the baseline.
[0023]
In this case, the light source may be a light source that illuminates light of at least two types of wavelengths, and the shape characteristics of the absorption profile may be calculated for each wavelength.
Further, the conversion function may be a logarithmic function.
The shape of the absorption profile may be quantified by calculating the area A, the peak height h and the width W at the n% height relative to the peak height from the shape of the absorption profile.
The shape characteristic of the absorption profile may be calculated by the standard deviation σ when the absorption profile is assumed to be a probability density function.
[0024]
The standard deviation σ when the absorption profile is assumed to be a probability density function may coincide with a constant multiple of the width W at n% height relative to the peak height of the absorption profile.
The moving method of the threshold value position may be changed equally left and right around the minimum point or the maximum point.
You may use the method of moving an image pick-up element, a line sensor, or a photo sensor to the direction which crosses a blood vessel at least to a detection part.
At least blood vessel information may be blood vessel width, and at least blood information may be hemoglobin or hematocrit or oxygen saturation.
[0025]
The blood vessel width φ may be a function composed of the parameter area A of the absorption profile, the peak height h, and the width W at n% height relative to the peak height.
Hemoglobin or hematocrit may be a function composed of the parameter area A of the absorption profile, the peak height h, and W at n% height relative to the peak height.
The means for calculating the blood vessel width or blood information may estimate the depth t, hematocrit, or oxygen saturation from the absorbance parameter of at least two wavelengths.
The depth estimation method may be a function including a parameter peak height h of the absorption profile of each wavelength, and a width W at n% height with respect to the peak height.
The blood vessel width may be a function of the estimated depth t, the absorption profile parameter area A, the peak height h, and the width W at n% height relative to the peak height.
Hemoglobin or hematocrit may be a function consisting of the estimated depth t and the parameter area A of the absorption profile, the peak height h, and the width W at n% height relative to the peak height.
[0026]
In another aspect, the present invention provides a light source for illuminating a part of a biological tissue including blood vessels, a detection unit for detecting a light intensity distribution of the illuminated biological tissue, and a detected light intensity distribution. In the measuring device provided with the analysis unit for analyzing the analysis unit,
(1) The light intensity distribution is converted by a predetermined function,
(2) The minimum or maximum point is detected from the converted light intensity distribution,
(3) Determine at least two points on the left and right of the converted light intensity distribution around the detected minimum or maximum point, and use the straight line or curve connecting the two points as a reference line to obtain an absorption profile Seeking
(4) Quantify the shape characteristics of the absorption profile,
(5) Adapt the shape characteristics of the absorption profile to a constant function equation,
(6) The position of at least two points where the maximum point or the minimum point enters is set as a threshold value, the threshold value positions of the two points are arbitrarily moved, and (3) to (5) are repeated.
(7) A threshold value that matches the shape characteristic of the absorption profile with a constant function formula is determined as a baseline,
(8) Provided is a noninvasive living body measuring method characterized by comprising means for calculating blood vessel or blood information from the characteristics of the determined absorption profile at the baseline.
[0027]
EXAMPLES Hereinafter, the present invention will be described in detail based on examples. This does not limit the invention.
First, the configuration of the blood test apparatus used in the embodiment of the present invention will be described.
FIG. 1 is a block diagram showing a configuration of a blood test apparatus. A
[0028]
The
Further, when the luminance profile is extracted by the
[0029]
FIG. 2 is a perspective view of the apparatus shown in FIG. 1, and a
FIG. 3 is a cross-sectional view of the detection unit 1. The detection unit 1 includes a
[0030]
In this embodiment, VSF665M1 (manufactured by OPTRANS) having a center wavelength of 660 nm and a half width of 40 nm is used as the
[0031]
Next, the analysis procedure of the
First, a finger is illuminated with light of a wavelength (hereinafter referred to as a first wavelength) by the
In this case, even if an LD with high coherency is used as the light source, an image as shown in FIG. 5 without speckles is obtained because it is diffused by the tissue.
[0032]
Next, in FIG. 5, a region having the highest contrast of the blood vessel image in the image is searched, and the determined region R is set to be surrounded by a rectangle as an analysis region (step S2).
Next, an image luminance distribution in a direction perpendicular to the blood vessel is created in the region R, and the luminance value is converted by a natural logarithm to obtain a luminance profile as shown in FIG. 6 (steps S3 and S4).
[0033]
Next, in step S5, an absorption profile is created and a baseline is determined. This process will be described in detail with reference to the flowchart of FIG.
First, in step S51, a constant a is set. In this embodiment, a = 0.7 (70%).
[0034]
Next, in step S52, H is set to a minimum value (for example, 10% of the maximum depth Hm of the luminance profile in FIG. 6). Then, a part from the valley bottom P to the depth H is cut out from the luminance profile in FIG. 6 (step S53), and the cut out part is converted into an absorption profile as shown in FIG. 7 (step S54).
[0035]
Next, the absorption profile is regarded as a distribution function (probability density function), and the standard deviation σ and the height aH of the absorption profile (FIG. 7), that is, the width W at 0.7H are calculated (step S55).
[0036]
Then, it is compared whether 2σ and W match (step S56). If they do not match, H is reset to a slightly larger value (step S57), and the processing routine returns to step S53.
[0037]
When steps S53 to S56 are repeated, 2σ and W change as shown by curves G and W70 in FIG. 10 as H increases, respectively, and when H becomes 75% of Hm, that is, H = 0.75Hm, point C Both agree and 2σ = W. The absorption profile at this time is as shown in FIG. 12, and the horizontal line at the height of 0.7H is determined as the baseline BL (step S58).
[0038]
Next, in step S6 of FIG. 4, the upper part from the baseline BL of the absorption profile of FIG. 12 is cut out as shown in FIG. 13, and this is determined as a blood vessel profile (step S6). Then, the height h1, width W2, and area A1 of the blood vessel profile in FIG. 13 are calculated (step S7).
[0039]
Next, the same finger is illuminated again with light having a wavelength of 805 nm (hereinafter referred to as the second wavelength) by the
[0040]
In step S15, the depth t from the tissue surface to the blood vessel is calculated by the following equation.
t = (h2 / W2 n) / (h1 / W1) m ...... (1)
Here, m and n are constants.
Next, in step S16, the blood vessel diameter φ and the hemoglobin concentration Hgb of the blood flowing through the blood vessel are calculated by the following equations, respectively.
φ = A1α / h1 = W1 × f1 (t) (2)
Hgb = (h1 / A1β) × f2 (t) × g (φ) (3)
Here, α and β are constants, and the functions f1, f2, and g are functions determined experimentally.
In this way, the blood vessel depth, the blood vessel diameter, and the hemoglobin concentration are obtained.
[0042]
Furthermore, hematocrit Hct and oxygen saturation Os are obtained using the following equations.
Hct = k × h1 / h2 + L (4)
Or
Hct = k × A1 / A2 + L (5)
Os = 100 × h1 / h2 + b (6)
Or Os = 100 × A1 / A2 + c (7)
Here, k, L, b, and c are constants.
[0043]
FIG. 14 is a flowchart showing another method for obtaining blood vessel information and blood information, and the processing of steps S4 and S11 (creation of a logarithmic luminance profile) shown in FIG. 4 is executed after the processing of steps S6 and S13, respectively. It is a thing. The processing content of each step is the same as in FIG. 4, and the calculation result similar to the method of FIG. 4 can be obtained also by this.
[0044]
According to this embodiment, the absorption profile obtained from the captured image is regarded as a kind of distribution function, and based on the standard deviation, a baseline is determined and a part of the absorption profile is specified as a profile representing the characteristics of the blood vessel. Since it did in this way, blood vessel information and blood information can be accurately measured from the specified profile even if the measurement object or measurement site changes.
[0045]
【The invention's effect】
According to the present invention, the absorption profile obtained from the biological tissue is adapted to a predetermined function, and the baseline is determined based on the function. Therefore, blood vessel information and blood information are obtained from the characteristics of the absorption profile specified by the baseline. Even if the subject or the test site changes, the measurement can be performed with high accuracy.
[Brief description of the drawings]
FIG. 1 is a block diagram showing a configuration of a blood test apparatus used in an embodiment of the present invention.
FIG. 2 is a perspective view showing an outer shape of a blood test apparatus used in an embodiment of the present invention.
FIG. 3 is a cross-sectional view of an essential part of a blood test apparatus used in an embodiment of the present invention.
FIG. 4 is a flowchart illustrating an image processing method according to an embodiment of the present invention.
FIG. 5 is an explanatory diagram showing a captured image according to an embodiment of the present invention.
FIG. 6 is an explanatory diagram showing an example of a log luminance profile obtained in the embodiment of the present invention.
FIG. 7 is an explanatory diagram showing an example of an absorption profile obtained in an embodiment of the present invention.
FIG. 8 is a front view of a light source used in an embodiment of the present invention.
FIG. 9 is a graph showing the relationship between the width of the absorption profile and the standard deviation according to the present invention.
FIG. 10 is a graph showing the relationship between the width of the absorption profile and the standard deviation according to an embodiment of the present invention.
11 is a flowchart showing details of main parts of FIG. 4;
FIG. 12 is an explanatory diagram showing an example of an absorption profile obtained in an embodiment of the present invention.
FIG. 13 is an explanatory diagram showing a part of an absorption profile obtained in an example of the present invention.
FIG. 14 is a flowchart showing a modification of FIG.
[Explanation of symbols]
DESCRIPTION OF SYMBOLS 1
Claims (15)
解析部が、
(1)光強度分布を所定の関数によって変換し、
(2)変換された光強度分布の極小点または極大点を検出し、
(3)検出された極小点または極大点を中心として、変換された光強度分布上の左右の任意の2点を結んだ直線を基準線として吸収プロファイルを求め、
(4)吸収プロファイルの形状特徴を定量化し、
(5)前記左右の任意の2点の位置を変更させて(3)及び(4)を繰り返すことにより、定量化された形状特徴が所定の関係式に適合するときの吸収プロファイルを血管プロファイルとして決定し、
(6)決定された血管プロファイルの特徴に基づいて血管情報又は血液情報を算出する
ことを特徴とする非侵襲生体計測装置。Non-invasively equipped with a light source for illuminating a part of biological tissue including blood vessels, a detection unit for detecting the light intensity distribution of the illuminated biological tissue, and an analysis unit for analyzing the detected light intensity distribution In a biological measurement device,
The analysis department
(1) The light intensity distribution is converted by a predetermined function,
(2) Detecting the minimum or maximum point of the converted light intensity distribution,
(3) about the detected minimum point or maximum point, determine the absorption profile of the straight line connecting any two points of the left and right on the converted light intensity distribution as a reference line,
(4) Quantify the shape characteristics of the absorption profile,
(5) By changing the positions of the left and right arbitrary two points and repeating (3) and (4), the absorption profile when the quantified shape feature conforms to a predetermined relational expression is used as the blood vessel profile. Decide
(6) A non-invasive living body measurement apparatus that calculates blood vessel information or blood information based on the determined characteristics of a blood vessel profile .
解析部は、各波長毎に得られる光強度分布に対して(1)〜(5)を実行することにより、各波長毎に血管プロファイルを決定し、(6)において、各波長毎に決定された各血管プロファイルの特徴に基づいて血管情報又は血液情報を算出することを特徴とする請求項1の非侵襲生体計測装置。A light source that illuminates light of at least two wavelengths;
The analysis unit determines the blood vessel profile for each wavelength by executing (1) to (5) on the light intensity distribution obtained for each wavelength, and is determined for each wavelength in (6). 2. The noninvasive living body measurement apparatus according to claim 1, wherein blood vessel information or blood information is calculated based on the characteristics of each blood vessel profile .
(1)光強度分布を所定の関数によって変換し、
(2)変換された光強度分布の極小点または極大点を検出し、
(3)検出された極小点または極大点を基準線として、変換された光強度分布上の左右の任意の2点を結んだ直線をしきい値として吸収プロファイルを求め、
(4)吸収プロファイルの形状特徴を定量化し、
(5)前記左右の任意の2点の位置を変更させて(3)及び(4)を繰り返すことにより、定量化された形状特徴が所定の関係式に適合するときの吸収プロファイルを血管プロファイルとして決定し、
(6)決定された血管プロファイルの特徴に基づいて血管情報又は血液情報を算出する
ことを特徴とする非侵襲生体計測方法。A light source for illuminating a part of a living body tissue including a blood vessel, a detector for detecting the light intensity distribution of the illuminated living tissue in a noninvasive living body measurement method using a noninvasive living body measuring device having a There,
(1) The light intensity distribution is converted by a predetermined function,
(2) Detecting the minimum or maximum point of the converted light intensity distribution,
(3) as a reference line detected minimum point or maximum point, determine the absorption profile of the straight line connecting any two points of the left and right on the converted light intensity distribution as the threshold value,
(4) Quantify the shape characteristics of the absorption profile,
(5) By changing the positions of the left and right arbitrary two points and repeating (3) and (4), the absorption profile when the quantified shape feature conforms to a predetermined relational expression is used as the blood vessel profile. Decide
(6) A noninvasive living body measurement method characterized by calculating blood vessel information or blood information based on the determined characteristics of the blood vessel profile .
Priority Applications (1)
| Application Number | Priority Date | Filing Date | Title |
|---|---|---|---|
| JP2000303901A JP4607308B2 (en) | 2000-10-03 | 2000-10-03 | Noninvasive living body measurement apparatus and method |
Applications Claiming Priority (1)
| Application Number | Priority Date | Filing Date | Title |
|---|---|---|---|
| JP2000303901A JP4607308B2 (en) | 2000-10-03 | 2000-10-03 | Noninvasive living body measurement apparatus and method |
Publications (3)
| Publication Number | Publication Date |
|---|---|
| JP2002107291A JP2002107291A (en) | 2002-04-10 |
| JP2002107291A5 JP2002107291A5 (en) | 2007-11-08 |
| JP4607308B2 true JP4607308B2 (en) | 2011-01-05 |
Family
ID=18785030
Family Applications (1)
| Application Number | Title | Priority Date | Filing Date |
|---|---|---|---|
| JP2000303901A Expired - Fee Related JP4607308B2 (en) | 2000-10-03 | 2000-10-03 | Noninvasive living body measurement apparatus and method |
Country Status (1)
| Country | Link |
|---|---|
| JP (1) | JP4607308B2 (en) |
Families Citing this family (7)
| Publication number | Priority date | Publication date | Assignee | Title |
|---|---|---|---|---|
| JP2005198788A (en) | 2004-01-14 | 2005-07-28 | National Institute Of Information & Communication Technology | Biological activity measuring device |
| DE102004017130B4 (en) * | 2004-04-02 | 2006-01-19 | Imedos Gmbh | Method for measuring the vessel diameter of optically accessible blood vessels |
| JP5010368B2 (en) * | 2007-06-29 | 2012-08-29 | シスメックス株式会社 | Non-invasive blood component measurement method and non-invasive blood component measurement device |
| JP5435532B2 (en) * | 2007-07-17 | 2014-03-05 | 富士フイルム株式会社 | Image processing system |
| CA2722662A1 (en) * | 2008-05-12 | 2009-11-19 | Cardio Art Technologies, Ltd. | Integrated heart monitoring device and method of using same |
| TWI762466B (en) * | 2016-02-12 | 2022-05-01 | 美商摩杜雷特影像公司 | Method and apparatus for assessing tissue vascular health |
| WO2021145375A1 (en) * | 2020-01-17 | 2021-07-22 | メディカルフォトニクス株式会社 | Device and method for measuring blood lipid level |
Citations (11)
| Publication number | Priority date | Publication date | Assignee | Title |
|---|---|---|---|---|
| JPH0363029A (en) * | 1989-07-31 | 1991-03-19 | Canon Inc | Image processor for ophthalmic use |
| JPH05123296A (en) * | 1991-11-08 | 1993-05-21 | Canon Inc | Image processor |
| JPH0731596A (en) * | 1993-07-20 | 1995-02-03 | Canon Inc | Eyeground blood flow meter |
| WO1997024066A1 (en) * | 1995-12-27 | 1997-07-10 | Toa Medical Electronics Co., Ltd. | Noninvasive blood examination apparatus |
| JPH10276986A (en) * | 1997-04-02 | 1998-10-20 | Canon Inc | Fundus blood vessel observation system |
| JPH11323A (en) * | 1997-04-15 | 1999-01-06 | Toa Medical Electronics Co Ltd | Noninvasive blood analyzing device |
| JP2000083931A (en) * | 1998-09-14 | 2000-03-28 | Sysmex Corp | Apparatus for noninvasive vital inspection |
| JP2000083932A (en) * | 1998-09-14 | 2000-03-28 | Sysmex Corp | Noninvasive vital component measuring instrument |
| JP2001145603A (en) * | 1999-09-09 | 2001-05-29 | Konan Medical Inc | Oxygen concentration detector of fundus oculi blood vessel |
| US6337993B1 (en) * | 1997-02-27 | 2002-01-08 | Canon Kabushiki Kaisha | Blood flow measuring apparatus |
| US6535757B2 (en) * | 2000-07-19 | 2003-03-18 | Canon Kabushiki Kaisha | Ocular examination system |
-
2000
- 2000-10-03 JP JP2000303901A patent/JP4607308B2/en not_active Expired - Fee Related
Patent Citations (11)
| Publication number | Priority date | Publication date | Assignee | Title |
|---|---|---|---|---|
| JPH0363029A (en) * | 1989-07-31 | 1991-03-19 | Canon Inc | Image processor for ophthalmic use |
| JPH05123296A (en) * | 1991-11-08 | 1993-05-21 | Canon Inc | Image processor |
| JPH0731596A (en) * | 1993-07-20 | 1995-02-03 | Canon Inc | Eyeground blood flow meter |
| WO1997024066A1 (en) * | 1995-12-27 | 1997-07-10 | Toa Medical Electronics Co., Ltd. | Noninvasive blood examination apparatus |
| US6337993B1 (en) * | 1997-02-27 | 2002-01-08 | Canon Kabushiki Kaisha | Blood flow measuring apparatus |
| JPH10276986A (en) * | 1997-04-02 | 1998-10-20 | Canon Inc | Fundus blood vessel observation system |
| JPH11323A (en) * | 1997-04-15 | 1999-01-06 | Toa Medical Electronics Co Ltd | Noninvasive blood analyzing device |
| JP2000083931A (en) * | 1998-09-14 | 2000-03-28 | Sysmex Corp | Apparatus for noninvasive vital inspection |
| JP2000083932A (en) * | 1998-09-14 | 2000-03-28 | Sysmex Corp | Noninvasive vital component measuring instrument |
| JP2001145603A (en) * | 1999-09-09 | 2001-05-29 | Konan Medical Inc | Oxygen concentration detector of fundus oculi blood vessel |
| US6535757B2 (en) * | 2000-07-19 | 2003-03-18 | Canon Kabushiki Kaisha | Ocular examination system |
Also Published As
| Publication number | Publication date |
|---|---|
| JP2002107291A (en) | 2002-04-10 |
Similar Documents
| Publication | Publication Date | Title |
|---|---|---|
| JP3701031B2 (en) | Noninvasive blood test equipment | |
| US10869623B2 (en) | Non-invasive optical measurement of blood analyte | |
| EP2050385B1 (en) | Method and apparatus for measuring collagen thickness | |
| JP2010508056A (en) | System and method for in vivo measurement of biological parameters | |
| JP2004242859A (en) | Noninvasive organism measuring apparatus | |
| JP2015062716A (en) | Method and system for non-invasive blood glucose detection utilizing spectral data of one or more components other than glucose | |
| JP2007020735A (en) | Biological light measuring device | |
| JP4607308B2 (en) | Noninvasive living body measurement apparatus and method | |
| US5246004A (en) | Infrared cholesterol sensor | |
| JP2002541892A (en) | Method of improved calibration of blood monitoring devices | |
| US20200093409A1 (en) | Method and device for detecting concentration of total hemoglobin in blood | |
| KR20190133107A (en) | Apparatus and method for detecting blood vessel | |
| Hasan et al. | Analyzing the existing noninvasive hemoglobin measurement techniques | |
| US10548520B2 (en) | Non-invasive optical measurement of blood analyte | |
| JPH11323A (en) | Noninvasive blood analyzing device | |
| US20120093389A1 (en) | Temporal oximeter | |
| JP2019198547A (en) | Blood component measurement method, device and program | |
| JP2003532461A (en) | Non-invasive measurement method using retinal image | |
| JP5311418B2 (en) | Absorbance spectrum measurement method independent of concentration | |
| KR101135067B1 (en) | Apparatus for assessment of raynaud's phenomenon and method for the same | |
| CN111491561A (en) | Lipid measuring device and method thereof | |
| KR100438839B1 (en) | Apparatus and measuring method of PPG | |
| KR101961147B1 (en) | Apparatus for measurements non-invasive blood sugar, method for measurements non-invasive blood glucose using the apparatus | |
| JP2641575B2 (en) | Glucose non-invasive measuring device | |
| JPH0415046A (en) | Measuring method for blood circulating movement |
Legal Events
| Date | Code | Title | Description |
|---|---|---|---|
| A521 | Written amendment |
Free format text: JAPANESE INTERMEDIATE CODE: A523 Effective date: 20070920 |
|
| A621 | Written request for application examination |
Free format text: JAPANESE INTERMEDIATE CODE: A621 Effective date: 20070920 |
|
| A977 | Report on retrieval |
Free format text: JAPANESE INTERMEDIATE CODE: A971007 Effective date: 20100119 |
|
| A131 | Notification of reasons for refusal |
Free format text: JAPANESE INTERMEDIATE CODE: A131 Effective date: 20100629 |
|
| A521 | Written amendment |
Free format text: JAPANESE INTERMEDIATE CODE: A523 Effective date: 20100823 |
|
| TRDD | Decision of grant or rejection written | ||
| A01 | Written decision to grant a patent or to grant a registration (utility model) |
Free format text: JAPANESE INTERMEDIATE CODE: A01 Effective date: 20100914 |
|
| A01 | Written decision to grant a patent or to grant a registration (utility model) |
Free format text: JAPANESE INTERMEDIATE CODE: A01 |
|
| A61 | First payment of annual fees (during grant procedure) |
Free format text: JAPANESE INTERMEDIATE CODE: A61 Effective date: 20101007 |
|
| R150 | Certificate of patent or registration of utility model |
Free format text: JAPANESE INTERMEDIATE CODE: R150 |
|
| FPAY | Renewal fee payment (event date is renewal date of database) |
Free format text: PAYMENT UNTIL: 20131015 Year of fee payment: 3 |
|
| R250 | Receipt of annual fees |
Free format text: JAPANESE INTERMEDIATE CODE: R250 |
|
| LAPS | Cancellation because of no payment of annual fees |