JP4182444B2 - Signal processing apparatus, signal processing method, and program - Google Patents
Signal processing apparatus, signal processing method, and program Download PDFInfo
- Publication number
- JP4182444B2 JP4182444B2 JP2006160578A JP2006160578A JP4182444B2 JP 4182444 B2 JP4182444 B2 JP 4182444B2 JP 2006160578 A JP2006160578 A JP 2006160578A JP 2006160578 A JP2006160578 A JP 2006160578A JP 4182444 B2 JP4182444 B2 JP 4182444B2
- Authority
- JP
- Japan
- Prior art keywords
- noise
- input signal
- max
- signal
- frame
- Prior art date
- Legal status (The legal status is an assumption and is not a legal conclusion. Google has not performed a legal analysis and makes no representation as to the accuracy of the status listed.)
- Expired - Fee Related
Links
- 238000012545 processing Methods 0.000 title claims abstract description 125
- 238000003672 processing method Methods 0.000 title claims description 5
- 238000004364 calculation method Methods 0.000 claims description 163
- 230000005236 sound signal Effects 0.000 claims description 74
- 238000000034 method Methods 0.000 claims description 52
- 238000001514 detection method Methods 0.000 claims description 23
- 238000004458 analytical method Methods 0.000 claims description 14
- 230000000737 periodic effect Effects 0.000 claims description 11
- 230000006870 function Effects 0.000 description 125
- 239000000203 mixture Substances 0.000 description 31
- 238000010606 normalization Methods 0.000 description 30
- 238000010586 diagram Methods 0.000 description 23
- 238000002474 experimental method Methods 0.000 description 17
- 238000006243 chemical reaction Methods 0.000 description 16
- 238000004891 communication Methods 0.000 description 7
- 238000005070 sampling Methods 0.000 description 6
- 230000001174 ascending effect Effects 0.000 description 4
- 238000001228 spectrum Methods 0.000 description 4
- 238000011156 evaluation Methods 0.000 description 3
- 238000009432 framing Methods 0.000 description 3
- 230000003247 decreasing effect Effects 0.000 description 2
- 230000005540 biological transmission Effects 0.000 description 1
- 238000010276 construction Methods 0.000 description 1
- 230000000694 effects Effects 0.000 description 1
- 239000000284 extract Substances 0.000 description 1
- 238000000605 extraction Methods 0.000 description 1
- 230000037433 frameshift Effects 0.000 description 1
- 230000010354 integration Effects 0.000 description 1
- 239000004973 liquid crystal related substance Substances 0.000 description 1
- 238000012986 modification Methods 0.000 description 1
- 230000004048 modification Effects 0.000 description 1
- 230000003287 optical effect Effects 0.000 description 1
- 238000011160 research Methods 0.000 description 1
- 239000004065 semiconductor Substances 0.000 description 1
Images
Classifications
-
- G—PHYSICS
- G10—MUSICAL INSTRUMENTS; ACOUSTICS
- G10L—SPEECH ANALYSIS TECHNIQUES OR SPEECH SYNTHESIS; SPEECH RECOGNITION; SPEECH OR VOICE PROCESSING TECHNIQUES; SPEECH OR AUDIO CODING OR DECODING
- G10L25/00—Speech or voice analysis techniques not restricted to a single one of groups G10L15/00 - G10L21/00
- G10L25/78—Detection of presence or absence of voice signals
-
- G—PHYSICS
- G10—MUSICAL INSTRUMENTS; ACOUSTICS
- G10L—SPEECH ANALYSIS TECHNIQUES OR SPEECH SYNTHESIS; SPEECH RECOGNITION; SPEECH OR VOICE PROCESSING TECHNIQUES; SPEECH OR AUDIO CODING OR DECODING
- G10L25/00—Speech or voice analysis techniques not restricted to a single one of groups G10L15/00 - G10L21/00
- G10L25/90—Pitch determination of speech signals
Landscapes
- Engineering & Computer Science (AREA)
- Computational Linguistics (AREA)
- Signal Processing (AREA)
- Health & Medical Sciences (AREA)
- Audiology, Speech & Language Pathology (AREA)
- Human Computer Interaction (AREA)
- Physics & Mathematics (AREA)
- Acoustics & Sound (AREA)
- Multimedia (AREA)
- Compression, Expansion, Code Conversion, And Decoders (AREA)
- Circuit For Audible Band Transducer (AREA)
- Complex Calculations (AREA)
Abstract
Description
本発明は、信号処理装置、信号処理方法、及びプログラムに関し、特に、例えば、入力信号の周期性がある区間を精度良く検出すること等ができる特徴量、例えば自己相関やYINを求めることができるようにする信号処理装置、信号処理方法、及びプログラムに関する。 The present invention relates to a signal processing device, a signal processing method, and a program, and in particular, for example, it is possible to obtain a feature amount such as autocorrelation or YIN that can accurately detect a period with a periodicity of an input signal. The present invention relates to a signal processing device, a signal processing method, and a program.
音声信号の周期性を表す周期性情報としては、例えば、自己相関がある。自己相関は、音声認識や音声区間の検出等において、音声の有声音を捉えるための特徴量として利用されている(例えば、特許文献1及び非特許文献1ないし6を参照)。また、音声信号の自己相関は、例えば、音声の基本周波数(ピッチ周波数)の検出にも利用されている(例えば、非特許文献7を参照)。
As periodicity information representing the periodicity of an audio signal, for example, there is autocorrelation. Autocorrelation is used as a feature amount for capturing voiced sound in speech recognition, speech section detection, and the like (see, for example,
また、周期性情報としては、自己相関の他に、例えば、近年提案されたYINがある(例えば、非特許文献8を参照)。YINは、音声の基本周波数の検出に利用されている。 In addition to autocorrelation, for example, there is YIN recently proposed as periodicity information (see, for example, Non-Patent Document 8). YIN is used to detect the fundamental frequency of speech.
ここで、自己相関は、周期性が高い場合に値が大となり、周期性がない場合に値が0になる。これに対して、YINは、自己相関とは逆に、周期性が高い場合に値が0となり、周期性がない場合に値が大(1)になる。以降では、周期性情報として、自己相関を採用した場合について説明するが、周期性情報として、YINを採用する場合には、後述する正規化自己相関に代えて1-YINを使用するか、又は、正規化自己相関の最大値をYINの最小値に、正規化自己相関の最小値をYINの最大値に、それぞれ読み替えればよい。 Here, the value of the autocorrelation becomes large when the periodicity is high, and becomes 0 when there is no periodicity. On the other hand, YIN has a value of 0 when the periodicity is high and a large value (1) when there is no periodicity, contrary to autocorrelation. Hereinafter, the case where autocorrelation is employed as the periodicity information will be described, but when adopting YIN as the periodicity information, 1-YIN is used instead of the normalized autocorrelation described later, or The maximum value of normalized autocorrelation may be read as the minimum value of YIN, and the minimum value of normalized autocorrelation may be read as the maximum value of YIN.
自己相関の計算方法にはいくつかの種類があるが、そのうちの1つについて、以下説明する。 There are several types of autocorrelation calculation methods, one of which will be described below.
いま、所定のサンプリング周波数でサンプリングされた時系列の入力信号の時刻tにおけるサンプル値を、X(t)と表す。また、一定の時間T、つまり、ある時刻tから時刻t+T-1の間のT個のサンプルの範囲を、フレームといい、入力信号の先頭からn番目のフレーム(第nフレーム)のT個のサンプル値の時系列を、フレーム(またはフレームデータ)x(n)と表す。 Now, a sample value at time t of a time-series input signal sampled at a predetermined sampling frequency is represented as X (t). A range of T samples from a certain time T, that is, from a certain time t to a time t + T−1 is called a frame, and the T of the nth frame (nth frame) from the head of the input signal. A time series of the sample values is represented as a frame (or frame data) x (n).
入力信号X(t)のフレームx(n)の自己相関R'(x(n),τ)は、例えば、式(1)で計算することができる。 The autocorrelation R ′ (x (n), τ) of the frame x (n) of the input signal X (t) can be calculated by, for example, Expression (1).

ここで、信号の自己相関とは、その信号と、その信号と同一の信号を時間τだけずらした信号との相関を表す値であり、時間τは、ラグと呼ばれる。 Here, the autocorrelation of a signal is a value representing the correlation between the signal and a signal obtained by shifting the same signal as the signal by the time τ, and the time τ is called a lag.
また、フレームx(n)の自己相関R'(x(n),τ)は、フレームx(n)のT個のサンプル値X(t),X(t+1),・・・,X(t+T-1)から、そのT個の平均値を減算し、その結果得られる、T個の平均値が0になる減算結果を用いて求められることがある。 Further, the autocorrelation R ′ (x (n), τ) of the frame x (n) is expressed by T sample values X (t), X (t + 1),. The T average value may be subtracted from (t + T-1) and may be obtained using a subtraction result obtained by subtracting the T average value from 0.
式(1)で求められる自己相関R’(x(n),τ)を、正規化した自己相関は、正規化自己相関と呼ばれる。 The autocorrelation obtained by normalizing the autocorrelation R ′ (x (n), τ) obtained by the equation (1) is called a normalized autocorrelation.
いま、式(1)で求められる自己相関R’(x(n),τ)を正規化して得られる自己相関を、R(x(n),τ)と表すと、正規化自己相関R(x(n),τ)は、例えば、式(1)の自己相関R’(x(n),τ)を、ラグτが0の自己相関R’(x(n),0)で正規化することにより、すなわち、式R(x(n),τ)=R’(x(n),τ)/R’(x(n),0)を演算することにより求められる。 Now, if the autocorrelation obtained by normalizing the autocorrelation R ′ (x (n), τ) obtained by the equation (1) is expressed as R (x (n), τ), the normalized autocorrelation R ( x (n), τ) is, for example, normalized autocorrelation R ′ (x (n), τ) in equation (1) with autocorrelation R ′ (x (n), 0) with lag τ = 0 That is, it is obtained by calculating the formula R (x (n), τ) = R ′ (x (n), τ) / R ′ (x (n), 0).
正規化自己相関R(x(n),τ)の、ラグτを変化させたときの大きさの最大値は、入力信号X(t)が、完全な周期性を有し、つまり、ある周期T0の時系列であり、かつ、その周期T0が、フレームの時間長(フレーム長)T以下であれば、1になる。 The maximum value of the normalized autocorrelation R (x (n), τ) when the lag τ is changed is that the input signal X (t) has complete periodicity, that is, a certain period. It is 1 if it is a time series of T 0 and its period T 0 is equal to or less than the time length (frame length) T of the frame.
また、正規化自己相関R(x(n),τ)は、入力信号X(t)が、周期性を有しなければ、ラグτの大きさが0より十分大きくなると、0に近い値になる。なお、正規化自己相関R(x(n),τ)は、ラグτが0のときには、1となる。 Also, the normalized autocorrelation R (x (n), τ) is close to 0 when the magnitude of the lag τ is sufficiently larger than 0 unless the input signal X (t) has periodicity. Become. Note that the normalized autocorrelation R (x (n), τ) is 1 when the lag τ is 0.
以上から、正規化自己相関R(x(n),τ)は、-1から+1までの値をとり得る。 From the above, the normalized autocorrelation R (x (n), τ) can take values from −1 to +1.
ところで、人間の有声音は、完全ではないにしろ高い周期性を有する。 By the way, human voiced sound has high periodicity if not perfect.
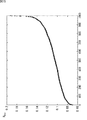
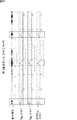
すなわち、図1は、人間の有声音の音声信号の波形図である。図1において、横軸は、時刻を表し、縦軸は、音声信号の振幅(レベル)を表す。 That is, FIG. 1 is a waveform diagram of an audio signal of a human voiced sound. In FIG. 1, the horizontal axis represents time, and the vertical axis represents the amplitude (level) of the audio signal.
図1から、人間の有声音の音声信号が周期性を有することが分かる。なお、図1の音声信号は、16kHzのサンプリング周波数でサンプリングされている。また、図1の音声信号の基本周波数は、約260Hz(約60サンプル(≒16kHz/260Hz))である。 It can be seen from FIG. 1 that the voice signal of a human voiced sound has periodicity. The audio signal in FIG. 1 is sampled at a sampling frequency of 16 kHz. The basic frequency of the audio signal in FIG. 1 is about 260 Hz (about 60 samples (≈16 kHz / 260 Hz)).
人間の有声音の周期(の逆数)は、基本周波数(ピッチ周波数)と呼ばれ、基本周波数は、おおよそ60Hzから400Hz程度の範囲に存在することが一般に知られている。 The period (reciprocal number) of a human voiced sound is called a fundamental frequency (pitch frequency), and it is generally known that the fundamental frequency exists in a range of approximately 60 Hz to 400 Hz.
いま、この、人間の有声音の基本周波数が存在する範囲を、基本周波数範囲ということとし、入力信号X(t)として、人間の音声信号(人間の音声の音声信号)を採用して、正規化自己相関R(x(n),τ)を求めた場合、基本周波数範囲に相当するラグτの範囲での正規化自己相関R(x(n),τ)の最大値Rmax(x(n))は、周期性を有する有声音の音声信号の区間では、1に近い値となる。 Now, let us say that the range where the fundamental frequency of human voiced sound exists is the fundamental frequency range, and adopt the human voice signal (human voice signal) as the input signal X (t). Autocorrelation R (x (n), τ) is calculated, the maximum value R max (x (x (n), τ) of normalized autocorrelation R (x (n), τ) in the range of lag τ corresponding to the fundamental frequency range n)) is a value close to 1 in a section of a voiced sound signal having periodicity.
ここで、入力信号X(t)のサンプリング周波数が、例えば、16kHzであり、基本周波数範囲を、例えば、上述した60Hzから400Hzまでの範囲とすると、60Hzは、約266サンプル(=16kHz/60Hz)に相当し、400Hzは、40サンプル(=16kHz/400Hz)に相当する。 Here, if the sampling frequency of the input signal X (t) is, for example, 16 kHz, and the basic frequency range is, for example, the range from 60 Hz to 400 Hz described above, 60 Hz is approximately 266 samples (= 16 kHz / 60 Hz). 400Hz corresponds to 40 samples (= 16kHz / 400Hz).
したがって、基本周波数範囲に相当するラグτの範囲は0より十分大きいから、基本周波数範囲に相当するラグτの範囲での正規化自己相関R(x(n),τ)の最大値Rmax(x(n))は、周期性がない区間では、0に近い値となる。 Accordingly, since the range of lag τ corresponding to the fundamental frequency range is sufficiently larger than 0, the maximum value R max (of normalized autocorrelation R (x (n), τ) in the range of lag τ corresponding to the fundamental frequency range ( x (n)) is a value close to 0 in a section having no periodicity.
以上のように、基本周波数範囲に相当するラグτの範囲での正規化自己相関R(x(n),τ)の最大値Rmax(x(n))は、理論的には、周期性がある区間とない区間とで、値が顕著にことなるから、入力信号X(t)としての音声信号の特徴量として、音声区間の検出や音声認識等の音声処理に用いることができる。 As described above, the maximum value R max (x (n)) of the normalized autocorrelation R (x (n), τ) in the range of lag τ corresponding to the fundamental frequency range is theoretically periodic. Since the value becomes significant between a certain section and a certain section, it can be used as a feature value of the speech signal as the input signal X (t) for speech processing such as speech section detection and speech recognition.
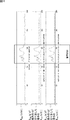
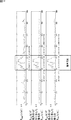
ここで、図2は、入力信号X(t)としての音声信号と、その音声信号を処理して得られる各種の信号(情報)とを示している。 Here, FIG. 2 shows an audio signal as the input signal X (t) and various signals (information) obtained by processing the audio signal.
図2上から1番目は、入力信号X(t)としての音声信号の波形図である。図2上から1番目において、横軸は時刻(サンプル点)を表し、縦軸は振幅を表す。 The first from the top in FIG. 2 is a waveform diagram of an audio signal as the input signal X (t). 2, the horizontal axis represents time (sample point), and the vertical axis represents amplitude.
なお、図2上から1番目の音声信号X(t)は、16kHzのサンプリング周波数でサンプリングされている。 Note that the first audio signal X (t) from the top of FIG. 2 is sampled at a sampling frequency of 16 kHz.
図2上から2番目は、1番目の音声信号X(t)をFFT(Fast Fourier Transform)することにより求められた周波数スペクトルを示している。図2上から2番目において、横軸は時刻(フレーム)を表し、縦軸はFFTの、いわゆるビン(bin)(周波数成分)を特定する番号を表す。 The second from the top in FIG. 2 shows a frequency spectrum obtained by performing FFT (Fast Fourier Transform) on the first audio signal X (t). In the second from the top in FIG. 2, the horizontal axis represents time (frame), and the vertical axis represents a number for identifying a so-called bin (frequency component) of the FFT.
なお、FFTとしては、512点(サンプル)のFFTを行ったので、1つのビンは、おおよそ32Hzに相当する。また、図2上から2番目では、各周波数成分の大小が、濃淡で表されている。 As the FFT, since 512 points (samples) were performed, one bin corresponds to approximately 32 Hz. Also, in the second from the top in FIG. 2, the magnitude of each frequency component is represented by shading.
図2上から3番目は、1番目の音声信号X(t)(から得られたフレームx(n))の、基本周波数範囲に相当するラグτの範囲での正規化自己相関R(x(n),τ)の最大値Rmax(x(n))を示している。 図2上から3番目において、横軸は時刻(フレーム)を表し、縦軸は、最大値Rmax(x(n))を表す。 The third from the top in FIG. 2 shows the normalized autocorrelation R (x (x (n)) in the range of the lag τ corresponding to the fundamental frequency range of the first audio signal X (t) (the frame x (n) obtained from the same). The maximum value R max (x (n)) of n), τ) is shown. In the third from the top in FIG. 2, the horizontal axis represents time (frame), and the vertical axis represents the maximum value R max (x (n)).
ここで、基本周波数範囲に相当するラグτの範囲での正規化自己相関R(x(n),τ)の最大値Rmax(x(n))を、以下、適宜、ラグ範囲最大相関Rmax(x(n))という。 Here, the maximum value R max (x (n)) of the normalized autocorrelation R (x (n), τ) in the lag τ range corresponding to the fundamental frequency range is referred to as lag range maximum correlation R It is called max (x (n)).
図2上から4番目は、1番目の音声信号X(t)(から得られたフレームx(n))のパワー、つまり、フレームx(n)のT個のサンプル値それぞれの自乗の総和のlog(対数)をとった値(以下、適宜、フレームログパワーという)を示している。図2上から4番目において、横軸は時刻(フレーム)を表し、縦軸はフレームログパワーを表す。 The fourth from the top in FIG. 2 is the power of the first audio signal X (t) (the frame x (n) obtained from), that is, the sum of the squares of the T sample values of the frame x (n). A value obtained by taking log (logarithm) (hereinafter referred to as frame log power as appropriate) is shown. In the fourth from the top in FIG. 2, the horizontal axis represents time (frame), and the vertical axis represents frame log power.
図2において、矩形で囲んである部分は、音声区間を表している。すなわち、図2において、左から1番目、2番目、3番目の矩形で囲んである部分は、それぞれ、「停止」、「緊急停止」、「フリーズ」の発話がされた区間を表す。 In FIG. 2, the part enclosed by the rectangle represents the audio | voice area. That is, in FIG. 2, the portions surrounded by the first, second, and third rectangles from the left represent sections where “stop”, “emergency stop”, and “freeze” are spoken, respectively.
図2上から1番目の音声信号X(t)や、2番目の周波数スペクトル、4番目のフレームログパワーには、音声区間と、そうでない区間とで、顕著な相違が見られないため、音声信号X(t)や、周波数スペクトル、フレームログパワーを用いることによっては、音声区間を検出することが難しいことが分かる。 In the first audio signal X (t), the second frequency spectrum, and the fourth frame log power from the top of FIG. 2, there is no significant difference between the audio section and the other sections. It can be seen that it is difficult to detect the speech section by using the signal X (t), the frequency spectrum, and the frame log power.
一方、図2上から3番目のラグ範囲最大相関Rmax(x(n))は、音声区間では、1に近い値になっており、そうでない区間では、比較的1より十分小さい、0に近い値になっている。 On the other hand, the third maximum lag range correlation R max (x (n)) from the top of FIG. 2 is close to 1 in the speech interval, and is relatively smaller than 1 in the other intervals, to 0. It is close.
したがって、ラグ範囲最大相関Rmax(x(n))は、音声区間の検出に有効な特徴量であることが分かる。 Therefore, it can be seen that the lag range maximum correlation R max (x (n)) is an effective feature amount for detection of a speech section.
ところで、入力信号X(t)のラグ範囲最大相関Rmax(x(n))は、人間の有声音以外の音、すなわち、例えば、周期性を持つ音(周期ノイズ)に対しても1に近い値となることがある。 By the way, the maximum lag range correlation R max (x (n)) of the input signal X (t) is set to 1 even for sounds other than human voiced sounds, for example, sounds having periodicity (periodic noise). It may be close.
したがって、入力信号X(t)のラグ範囲最大相関Rmax(x(n))によっては、入力信号X(t)における周期ノイズの部分と、有声音の部分とを区別することが難しいことがある。 Therefore, depending on the maximum lag range correlation R max (x (n)) of the input signal X (t), it may be difficult to distinguish the periodic noise portion and the voiced sound portion in the input signal X (t). is there.
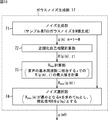
そこで、非特許文献6には、入力信号にガウスノイズを付加し、そのガウスノイズを付加した入力信号であるノイズ付加信号のラグ範囲最大相関を用いて、音声区間を検出する方法が記載されている。 Therefore, Non-Patent Document 6 describes a method of detecting a speech section by adding Gaussian noise to an input signal and using the lag range maximum correlation of the noise-added signal that is the input signal to which the Gaussian noise is added. Yes.
すなわち、ガウスノイズのラグ範囲最大相関は、0に近いため、入力信号が周期ノイズを含んでいても、その周期ノイズよりも十分大きなレベルのガウスノイズを、入力信号に付加することで、その結果得られるノイズ付加信号のうちの、周期ノイズのみの部分のラグ範囲最大相関は、ガウスノイズの影響により0に近い値となる。 In other words, since the maximum correlation of the lag range of Gaussian noise is close to 0, even if the input signal contains periodic noise, the result is obtained by adding Gaussian noise with a level sufficiently larger than the periodic noise to the input signal. Of the obtained noise-added signal, the maximum lag range correlation of only the periodic noise becomes a value close to 0 due to the influence of Gaussian noise.
したがって、理想的には、入力信号の周期ノイズのみの部分(音声が存在しない部分)に、レベルの大きなガウスノイズを付加することにより、そのガウスノイズが付加された入力信号であるノイズ付加信号については、音声が存在しない部分(周期ノイズのみの部分)では0に近い値になり、音声が存在する部分では1に近い値になるラグ範囲最大相関を得ることができる。 Therefore, ideally, a noise-added signal that is an input signal to which Gaussian noise is added by adding Gaussian noise having a large level to the part of the input signal that contains only periodic noise (the part where no sound exists). Is a value close to 0 in a portion where no speech is present (portion containing only periodic noise), and a maximum lag range correlation that is close to 1 in a portion where speech is present.
ところで、入力信号の、音声が存在しない部分のみならず、音声が存在する部分にも、レベルの大きなガウスノイズを付加すると、そのガウスノイズが付加されたノイズ付加信号のラグ範囲最大相関は、音声が存在しない部分だけでなく、音声が存在する部分でも、0に近い値になり、周期ノイズの部分と、音声の部分(音声区間)とを区別することが困難となる。 By the way, if a large level of Gaussian noise is added not only to the part where the voice does not exist, but also to the part where the voice exists, the maximum lag range correlation of the noise-added signal with the Gaussian noise added is the voice. In a portion where voice is present as well as a portion where no voice is present, the value is close to 0, and it becomes difficult to distinguish a periodic noise portion from a voice portion (speech interval).
したがって、入力信号にガウスノイズを付加したノイズ付加信号のラグ範囲最大相関を求め、そのラグ範囲最大相関を用いて、音声区間の検出等を行う場合には、入力信号に付加するガウスノイズのレベルを、適切に調整すること、すなわち、入力信号の音声が存在しない部分に付加するガウスノイズのレベルは大きくし、入力信号の音声が存在する部分に付加するガウスノイズのレベルは小さくすることが重要である。 Therefore, when obtaining the maximum lag range correlation of a noise-added signal with Gaussian noise added to the input signal and using this maximum lag range correlation to detect a voice interval, the level of the Gaussian noise added to the input signal Therefore, it is important that the level of Gaussian noise added to the part where the voice of the input signal does not exist is increased and the level of Gaussian noise added to the part where the voice of the input signal exists is reduced. It is.
そこで、非特許文献6では、第1段階の処理として、入力信号の自己相関を用いた特徴量を求め、その特徴量に基づき入力信号全体に対して、大まかに、音声区間と、そうでない区間である非音声区間の判定を行い、非音声区間と判定された区間の入力信号の分散を利用して、入力信号に付加するガウスノイズのレベルの決定を行い、第2段階の処理として、入力信号に、第1段階の処理で決定したレベルのガウスノイズを付加したノイズ付加信号の自己相関を用いた特徴量を、入力信号の特徴量として求め、その特徴量に基づき、最終的な音声区間と非音声区間の判定を行う方法が記載されている。 Therefore, in Non-Patent Document 6, as a first-stage process, a feature amount using autocorrelation of an input signal is obtained, and a speech section and a section that is not so are roughly determined for the entire input signal based on the feature amount. Is determined, and the level of Gaussian noise added to the input signal is determined using the variance of the input signal in the section determined to be a non-speech section. The feature amount using the autocorrelation of the noise-added signal obtained by adding the Gaussian noise of the level determined in the first stage processing to the signal is obtained as the feature amount of the input signal, and the final speech section is based on the feature amount. And a method for determining a non-voice segment.
しかしながら、第1の段階の処理において、入力信号の自己相関を用いた特徴量によっては、入力信号全体に対しての、音声区間と非音声区間の判定を、高精度に行うことができないことがある。 However, in the first stage processing, depending on the feature amount using the autocorrelation of the input signal, it may not be possible to accurately determine the speech section and the non-speech section for the entire input signal. is there.
そして、非特許文献6に記載の方法では、第1段階の処理において、入力信号の自己相関を用いた特徴量に基づいて行われる、音声区間と非音声区間の判定を誤った場合には、入力信号に付加するガウスノイズのレベルとして、不適切なレベルが決定され、その結果、第2段階の処理において、ノイズ付加信号の自己相関を用いた特徴量に基づいて行われる、最終的な音声区間と非音声区間の判定も不正確になって、音声区間、特に、有声音の部分などの周期性がある区間を精度良く検出することが困難となる。 Then, in the method described in Non-Patent Document 6, when the determination of the speech section and the non-speech section, which is performed based on the feature amount using the autocorrelation of the input signal in the first stage process, is incorrect, An inappropriate level is determined as the level of Gaussian noise to be added to the input signal, and as a result, the final speech is performed based on the feature amount using the autocorrelation of the noise added signal in the second stage processing. The determination of the section and the non-speech section is also inaccurate, and it becomes difficult to accurately detect the voice section, particularly a section having periodicity such as a voiced sound part.
本発明は、このような状況に鑑みてなされたものであり、入力信号の周期性がある区間を精度良く検出すること等ができる自己相関を求めることができるようにするものである。 The present invention has been made in view of such a situation, and makes it possible to obtain an autocorrelation that can accurately detect a section having a periodicity of an input signal.
本発明の一側面の信号処理装置は、入力信号の正規化された自己相関の特定の周波数の範囲に相当するラグの範囲内での最大値と、前記入力信号のパワーの積の、一定時間内での最小値、メディアン、又は平均値を、前記入力信号に付加する、自己相関の特定の周波数の範囲に相当するラグの範囲内での最大値が0または0に近い値となるノイズの大きさを表すゲイン情報として求めるゲイン計算手段と、前記入力信号に、前記ゲイン情報に応じた大きさの前記ノイズを付加したノイズ付加信号の周期性情報を、前記入力信号の特徴量として求める特徴量計算手段とを備える。 The signal processing device according to one aspect of the present invention is a fixed time of a product of a maximum value within a lag corresponding to a specific frequency range of normalized autocorrelation of an input signal and the power of the input signal. The minimum value, median, or average value is added to the input signal, and the maximum value within a lag corresponding to a specific frequency range of autocorrelation is 0 or a value close to 0 . a gain calculation means for obtaining a gain information indicating the size, characteristics for determining the input signal, the periodicity information of the noise addition signal obtained by adding the magnitude of the noise in accordance with the gain information, a feature quantity of the input signal A quantity calculating means.
本発明の一側面の信号処理方法、又はプログラムは、入力信号の正規化された自己相関の特定の周波数の範囲に相当するラグの範囲内での最大値と、前記入力信号のパワーの積の、一定時間内での最小値、メディアン、又は平均値を、前記入力信号に付加する、自己相関の特定の周波数の範囲に相当するラグの範囲内での最大値が0または0に近い値となるノイズの大きさを表すゲイン情報として求め、前記入力信号に、前記ゲイン情報に応じた大きさの前記ノイズを付加したノイズ付加信号の周期性情報を、前記入力信号の特徴量として求めるステップを含む。 One aspect signal processing method of the present invention, or program, and a maximum value within the range of lug corresponding to a specific range of frequencies of the autocorrelation normalized input signal, the product of the power of the input signal A minimum value, median, or average value within a certain time is added to the input signal, and a maximum value within a lag corresponding to a specific frequency range of autocorrelation is 0 or a value close to 0 consisting determined as the gain information indicating the amount of noise, the input signal, the periodicity information of the noise addition signal obtained by adding the magnitude of the noise in accordance with the gain information, a step of determining a characteristic quantity of said input signal Including.
本発明の一側面においては、入力信号の正規化された自己相関の特定の周波数の範囲に相当するラグの範囲内での最大値と、前記入力信号のパワーの積の、一定時間内での最小値、メディアン、又は平均値が、前記入力信号に付加する、自己相関の特定の周波数の範囲に相当するラグの範囲内での最大値が0または0に近い値となるノイズの大きさを表すゲイン情報として求められ、前記入力信号に、前記ゲイン情報に応じた大きさの前記ノイズを付加したノイズ付加信号の周期性情報が、前記入力信号の特徴量として求められる。 In one aspect of the present invention, a product of a maximum value within a lag corresponding to a specific frequency range of normalized autocorrelation of an input signal and the power of the input signal within a certain time. A noise value such that a minimum value, a median, or an average value is added to the input signal, and a maximum value within a lag range corresponding to a specific frequency range of autocorrelation is 0 or a value close to 0. obtained as gain information indicating, to the input signal, periodicity information for noise addition signal obtained by adding the magnitude of the noise in accordance with the gain information is obtained as the feature quantity of the input signal.
本発明の一側面によれば、例えば、入力信号の周期性がある区間を精度良く検出すること等ができる周期性情報を求めることができる。 According to one aspect of the present invention, for example, periodicity information that can accurately detect an interval in which an input signal has periodicity can be obtained.
以下、図面を参照して、本発明の実施の形態について説明する。 Embodiments of the present invention will be described below with reference to the drawings.
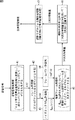
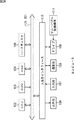
図3は、本発明を適用した信号処理装置の一実施の形態の構成例を示すブロック図である。 FIG. 3 is a block diagram showing a configuration example of an embodiment of a signal processing device to which the present invention is applied.
図3の信号処理装置では、入力信号から、その入力信号に付加するノイズの大きさを表すゲイン情報が求められ、入力信号に、ゲイン情報に応じた大きさ(レベル)のノイズを付加したノイズ付加信号の自己相関が、入力信号の特徴量として求められる。 In the signal processing apparatus of FIG. 3, gain information indicating the magnitude of noise added to the input signal is obtained from the input signal, and noise having a magnitude (level) corresponding to the gain information is added to the input signal. The autocorrelation of the additional signal is obtained as a feature quantity of the input signal.
すなわち、図3において、信号処理装置は、音響信号変換部11、フレーム処理部12、正規化自己相関計算部13,Rmax計算部14、フレームパワー計算部15、ゲイン計算部16、ガウスノイズ生成部17、ノイズミックス部18、正規化自己相関計算部19、及びRmax計算部20から構成される。
That is, in FIG. 3, the signal processing apparatus includes an acoustic
音響信号変換部11は、例えば、マイク(マイクロフォン)とA/D(Analog/Digital)コンバータ等で構成され、音声を、ディジタルの音声信号に変換し、フレーム処理部12に供給する。
The acoustic
すなわち、音響信号変換部11は、そこに入力される空気振動としての音(人間の音声や、信号処理装置が設置されている環境に存在する音)を、マイクによってアナログの音声信号に変換する。さらに、音響信号変換部11は、マイクで得られたアナログの音声信号を、A/Dコンバータによってディジタルの音声信号に変換し、その音声信号を、入力信号として、フレーム処理部12に、時系列に供給する。ここで、時刻tにおける入力信号のサンプル値を、X(t)と表す。
That is, the acoustic
フレーム処理部12は、音響信号変換部11から供給される入力信号X(t)を、Tサンプルのサンプル値で構成されるフレームにフレーム化するフレーム処理を行い、すなわち、例えば、時刻t-T+1から時刻tまでの入力信号のT個のサンプル値X(t-T+1),X(t-T+2),・・・,X(t)を1フレームとし、時刻t-T+1から所定のフレームシフト時間だけ後の時刻を先頭とする時刻からT個の入力信号のサンプル値を1フレームとし、以下、同様にして、音響信号変換部11から供給される入力信号X(t)からフレームを構成して、正規化自己相関計算部13、フレームパワー計算部15、及びノイズミックス部18に供給する。
The
ここで、以下、適宜、入力信号(t)の先頭からn番目のフレーム(フレーム番号がnのフレーム)を、フレームx(n)という。 Here, hereinafter, the n-th frame from the top of the input signal (t) (the frame having the frame number n) will be referred to as a frame x (n) as appropriate.
正規化自己相関計算部13は、フレーム処理部12から供給されるフレームx(n)の自己相関R’(x(n),τ)を、例えば、前述の式(1)にしたがって求め、さらに、その自己相関R’(x(n),τ)を正規化することにより、正規化自己相関R(x(n),τ)を求める。
The normalized
ここで、正規化自己相関R(x(n),τ)も、その正規化自己相関R(x(n),τ)に正規化される前の自己相関R’(x(n),τ)も、「自己相関」である。なお、正規化される前の自己相関R’(x(n),τ)を、以下、適宜、正規化前自己相関という。 Here, normalized autocorrelation R (x (n), τ) is also autocorrelation R ′ (x (n), τ) before being normalized to the normalized autocorrelation R (x (n), τ). ) Is also “autocorrelation”. The autocorrelation R ′ (x (n), τ) before normalization is hereinafter referred to as pre-normalization autocorrelation as appropriate.
正規化自己相関R(x(n),τ)は、前述したように、正規化前自己相関R’(x(n),τ)を、ラグτが0の正規化前自己相関R’(x(n),0)で正規化することにより、すなわち、式R(x(n),τ)=R’(x(n),τ)/R’(x(n),0)を演算することにより求めることができる。 As described above, the normalized autocorrelation R (x (n), τ) is the autocorrelation R ′ (x (n), τ) before normalization, the autocorrelation R ′ ( By normalizing with x (n), 0), that is, calculate the formula R (x (n), τ) = R '(x (n), τ) / R' (x (n), 0) Can be obtained.
正規化自己相関計算部13は、フレームx(n)の正規化自己相関R(x(n),τ)を求めると、その正規化自己相関R(x(n),τ)を、Rmax計算部14に供給する。
When the normalized
Rmax計算部14は、例えば、80Hzから400Hzまでの周波数の範囲を、基本周波数範囲とし、正規化自己相関計算部13から供給される正規化自己相関R(x(n),τ)について、基本周波数範囲に相当するラグτの範囲での正規化自己相関R(x(n),τ)の最大値であるラグ範囲最大相関Rmax(x(n))を求めて、ゲイン計算部16に供給する。
R max calculation unit 14, for example, a range of frequencies from 80Hz to 400 Hz, a fundamental frequency range, the normalized autocorrelation R supplied from the normalized autocorrelation calculating unit 13 (x (n), τ ), A lag range maximum correlation R max (x (n)), which is the maximum value of the normalized autocorrelation R (x (n), τ) in the lag τ range corresponding to the fundamental frequency range, is obtained, and the
ここで、上述したように、基本周波数範囲が、80Hzから400Hzまでの周波数の範囲である場合、音響信号変換部11での入力信号X(t)のサンプリング周波数が、例えば16kHzであれば、基本周波数範囲に相当するラグτの範囲は、40サンプル(=16kHz/400Hz)から200サンプル(=16kHz/80Hz)までの範囲となる。この場合、Rmax計算部14は、ラグτが40から200までの範囲で、最大の正規化自己相関R(x(n),τ)を求め、ラグ範囲最大相関Rmax(x(n))とする。
Here, as described above, when the basic frequency range is a frequency range from 80 Hz to 400 Hz, if the sampling frequency of the input signal X (t) in the
フレームパワー計算部15は、フレーム処理部12から供給されるフレームx(n)のパワー(以下、適宜、フレームパワーという)p(n)を求め、ゲイン計算部16に供給する。
The frame
ここで、フレームパワー計算部15は、例えば、フレームx(n)のT個のサンプル値それぞれの自乗の総和や、その総和の平方根を計算し、その計算結果を、フレームパワーp(n)とする。
Here, the frame
ゲイン計算部16は、Rmax計算部14から供給される、入力信号X(t)の自己相関としての、フレームx(n)のラグ範囲最大相関Rmax(x(n))と、フレームパワー計算部15から供給される、入力信号X(t)のパワーとしての、フレームx(n)のフレームパワーp(n)とに基づき、入力信号X(t)のフレームx(n)(の各サンプル値)に付加するノイズの大きさを表すゲイン情報であるゲインgain(n)を求め、ノイズミックス部18に供給する。
The
すなわち、ゲイン計算部16は、例えば、Rmax計算部14からのフレームx(n)のラグ範囲最大相関Rmax(x(n))と、フレームパワー計算部15からのフレームx(n)のフレームパワーp(n)とを引数とする所定の関数F(p(n),Rmax(x(n)))を演算し、その演算結果を、ゲインgain(n)として、ノイズミックス部18に供給する。
That is, for example, the
ここで、ゲインgain(n)を求める関数F(p(n),Rmax(x(n)))としては、例えば、フレームx(n)を含む連続するNフレーム(Nは2以上の整数)のそれぞれについての、フレームパワーp(n)とラグ範囲最大相関Rmax(x(n))との積p(n)×Rmax(x(n))の最小値(Nフレームそれぞれについての積p(n)×Rmax(x(n))の中で、最小の値の積p(n)×Rmax(x(n)))を求める関数などを採用することができる。 Here, as the function F (p (n), R max (x (n))) for obtaining the gain gain (n), for example, consecutive N frames including the frame x (n) (N is an integer of 2 or more) ), The minimum value of the product p (n) × R max (x (n)) of the frame power p (n) and the maximum lag range correlation R max (x (n)) (for each N frame) in the product p (n) × R max ( x (n)), the minimum value of the product p (n) × R max ( x (n))) may be employed such as a function for obtaining the.
ガウスノイズ生成部17は、入力信号X(t)のフレームx(n)に付加するノイズgとして、1フレームのサンプル数と同一のTサンプルのガウスノイズを生成し、ノイズミックス部18に供給する。
The Gaussian
なお、ガウスノイズ生成部17において生成するノイズgは、ガウスノイズに限定されるものではなく、ノイズgのラグ範囲最大相関Rmax(g)が、0又は0に近い値となるノイズであれば、どのようなノイズであっても良い。
Note that the noise g generated in the Gaussian
ノイズミックス部18は、フレーム処理部12からの入力信号X(t)のフレームx(n)に、ゲイン計算部16からのゲインgain(n)に応じた大きさのノイズを付加したノイズ付加信号を求め、正規化自己相関計算部19に供給する。
The
すなわち、ノイズミックス部18は、ガウスノイズ生成部17からのノイズgを、ゲイン計算部16からのゲインgain(n)に応じた大きさのノイズ(以下、適宜、レベル変換ノイズという)に変換し、フレーム処理部12からの入力信号X(t)のフレームx(n)に、レベル変換ノイズを付加したノイズ付加信号Y(t)のフレームy(n)を求め、正規化自己相関計算部19に供給する。
That is, the
ここで、時刻tのレベル変換ノイズをB(t)と表すとともに、時刻tのノイズ付加信号をY(t)と表すと、入力信号X(t)に、レベル変換ノイズB(t)を付加(加算)した信号X(t)+B(t)が、ノイズ付加信号Y(t)となる。 Here, when the level conversion noise at time t is represented as B (t) and the noise addition signal at time t is represented as Y (t), the level conversion noise B (t) is added to the input signal X (t). The (added) signal X (t) + B (t) becomes the noise added signal Y (t).
また、ノイズ付加信号Y(t)の先頭からn番目のフレーム(のT個のサンプル値の時系列)を、y(n)と表すこととすると、ノイズミックス部18は、Cを所定の適切な定数として、例えば、式y(n)=x(n)+C×gain(n)×gにしたがって、ノイズ付加信号Y(t)のフレームy(n)を求める。
Further, assuming that the nth frame (the time series of T sample values) from the head of the noise addition signal Y (t) is expressed as y (n), the
正規化自己相関計算部19は、上述した正規化自己相関計算部13と同様にして、ノイズミックス部18からのノイズ付加信号Y(t)のフレームy(n)の正規化前自己相関R’(y(n),τ)を求め、さらに、その正規化前自己相関R’(y(n),τ)を正規化することにより、正規化自己相関R(y(n),τ)を求めて、Rmax計算部20に供給する。
The normalized
Rmax計算部20は、上述したRmax計算部14と同様にして、例えば、80Hzから400Hzまでの周波数の範囲を、基本周波数範囲とし、正規化自己相関計算部19から供給されるノイズ付加信号Y(t)の正規化自己相関R(y(n),τ)について、基本周波数範囲に相当するラグτの範囲での正規化自己相関R(y(n),τ)の最大値であるラグ範囲最大相関Rmax(y(n))を求めて、入力信号X(t)のフレームx(n)から抽出された特徴量として出力する。
In the same manner as the R max calculation unit 14 described above, the R max calculation unit 20 sets, for example, a frequency range from 80 Hz to 400 Hz as a fundamental frequency range, and a noise addition signal supplied from the normalized
なお、図3の信号処理装置において、正規化自己相関計算部13,Rmax計算部14、フレームパワー計算部15、ゲイン計算部16、ガウスノイズ生成部17、ノイズミックス部18、正規化自己相関計算部19、及びRmax計算部20は、フレームx(n)から、そのフレームx(n)の特徴量として、ノイズ付加信号Y(t)のラグ範囲最大相関Rmax(y(n))を求めるノイズミックスRmax計算部を構成する。ノイズミックスRmax計算部において行われる、ノイズ付加信号Y(t)のラグ範囲最大相関Rmax(y(n))を求める処理を、以下、適宜、ノイズミックスRmax計算処理という。
3, the normalized
ここで、前述したように、入力信号X(t)にガウスノイズを付加したノイズ付加信号Y(t)のラグ範囲最大相関Rmax(y(n))を求め、そのラグ範囲最大相関Rmax(y(n))を用いて、音声区間の検出等を行う場合には、入力信号X(t)に付加するガウスノイズのレベルを、適切に調整すること、すなわち、入力信号X(t)の音声が存在しない部分に付加するガウスノイズのレベルは大きくし、入力信号X(t)の音声が存在する部分に付加するガウスノイズのレベルは小さくすることが重要である。 Here, as described above, the lag range maximum correlation R max (y (n)) of the noise added signal Y (t) obtained by adding Gaussian noise to the input signal X (t) is obtained, and the lag range maximum correlation R max (y (n)) is used to detect the voice interval, etc., the level of Gaussian noise added to the input signal X (t) is appropriately adjusted, that is, the input signal X (t) It is important to increase the level of Gaussian noise added to the part where no voice exists, and to reduce the level of Gaussian noise added to the part where the voice of the input signal X (t) exists.
一方、図3の信号処理装置では、上述したように、ノイズミックス部18において、式y(n)=x(n)+C×gain(n)×gにしたがって、ノイズ付加信号Y(t)のフレームy(n)が求められる。すなわち、ノイズミックス部18では、入力信号X(t)のフレームに、ゲインgain(n)に比例する大きさのノイズC×gain(n)×gを加算することにより、ノイズ付加信号Y(t)のフレームy(n)が求められる。
On the other hand, in the signal processing device of FIG. 3, as described above, in the
したがって、入力信号X(t)のフレームx(n)が音声区間のフレームでない場合には、ゲインgain(n)を大きくし、入力信号X(t)のフレームx(n)が音声区間のフレームである場合には、ゲインgain(n)を小さくする必要があり、ゲイン計算部16において、ゲインgain(n)を求める関数F(p(n),Rmax(x(n)))としては、以上のようなゲインgain(n)が得られる関数が採用される。
Therefore, if the frame x (n) of the input signal X (t) is not a frame in the voice section, the gain gain (n) is increased and the frame x (n) of the input signal X (t) is a frame in the voice section. , The gain gain (n) needs to be reduced. In the
ここで、例えば、文献CONSTRUCTION AND EVALUATION OF A ROBUST MULTIFEATURE SPEECH/MUSICDISCRIMINATOR Eric Scheirer Malcolm Slaneyy ICASSP'97, pp. 1331-1334に記載されているように、人間の音声については、例えば、音楽(楽曲)に比較して、フレームパワーが、1秒程度の区間のフレームパワーの平均値(平均フレームパワー)より小さいフレームの比率が高いこと、つまり、多くのフレームが、平均フレームパワーよりも小さいフレームパワーのフレームであることが知られている。 Here, as described in, for example, the document CONSTRUCTION AND EVALUATION OF A ROBUST MULTIFEATURE SPEECH / MUSICDISCRIMINATOR Eric Scheirer Malcolm Slaneyy ICASSP '97, pp. 1331-1334, for example, human (voice) In comparison, the ratio of frames whose frame power is smaller than the average value (average frame power) of the frame power in the section of about 1 second is high, that is, many frames have a frame power smaller than the average frame power. It is known that
さらに、上記の文献に記載されているように、人間の音声のスペクトルは4Hz(0.25秒)程度で変化することが知られている。 Furthermore, as described in the above document, it is known that the spectrum of human speech changes at about 4 Hz (0.25 seconds).
以上から、音声については、数百ミリ秒(0.数秒)から1秒程度の時間内において、パワーや正規化自己相関に変化があることを期待することができる。 From the above, for speech, it can be expected that power and normalized autocorrelation will change within a time of several hundred milliseconds (0. several seconds) to 1 second.
すなわち、音声については、数百ミリ秒から1秒程度の時間に、パワーが大きく変動する部分と、自己相関が大きく変動する部分とが存在することを期待することができる。したがって、音声については、パワーと自己相関とから計算される値である、例えば、フレームパワーp(n)と正規化自己相関Rmax(x(n))との積p(n)×Rmax(x(n))が、数百ミリ秒から1秒程度の時間に大きく変動し、小さい値が存在することを期待することができる。 That is, it can be expected that the voice has a portion where the power greatly fluctuates and a portion where the autocorrelation greatly fluctuates in a time of several hundred milliseconds to one second. Therefore, for speech, it is a value calculated from power and autocorrelation, for example, product p (n) × R max of frame power p (n) and normalized autocorrelation R max (x (n)) It can be expected that (x (n)) fluctuates greatly in a time of several hundred milliseconds to about 1 second, and a small value exists.
一方、音楽その他の定常的なノイズについては、数百ミリ秒から1秒程度の時間に、パワーが大きく変動する部分が存在することは期待できない。さらに、定常的なノイズの自己相関は、一律に大きい。したがって、定常的なノイズについては、例えば、上述したフレームパワーp(n)と正規化自己相関Rmax(x(n))との積p(n)×Rmax(x(n))が、数百ミリ秒から1秒程度の時間に大きく変動することは期待できないし、さらに、特に、正規化自己相関Rmax(x(n))の影響によって、比較的大きな値となることを期待することができる。 On the other hand, for stationary noise such as music, it cannot be expected that there will be a portion where the power fluctuates greatly in the time of several hundred milliseconds to one second. Furthermore, the autocorrelation of stationary noise is uniformly large. Therefore, for stationary noise, for example, the product p (n) × R max (x (n)) of the frame power p (n) and the normalized autocorrelation R max (x (n)) described above is It cannot be expected that the time will vary greatly from several hundred milliseconds to about 1 second, and in particular, it is expected to become a relatively large value due to the effect of normalized autocorrelation R max (x (n)). be able to.
そこで、ゲインgain(n)を求める関数F(p(n),Rmax(x(n)))としては、例えば、フレームパワーp(n)と正規化自己相関Rmax(x(n))との積p(n)×Rmax(x(n))の、数百ミリ秒から1秒程度の時間内での最小値を採用することにより、音声(のフレームx(n))については、値の小さいゲインgain(n)が求められ、定常的なノイズ(のフレームx(n))については、値の大きなゲインgain(n)が求められることを期待することができる。 Therefore, as the function F (p (n), R max (x (n))) for obtaining the gain gain (n), for example, the frame power p (n) and the normalized autocorrelation R max (x (n)) P (n) × R max (x (n)) is the minimum value within a time of several hundred milliseconds to 1 second, so that the voice (frame x (n)) is It can be expected that a gain gain (n) having a small value is obtained, and that a gain gain (n) having a large value is obtained for stationary noise (frame x (n)).
なお、ゲインgain(n)を求める関数F()は、上述した関数に限定されるものではない。すなわち、ゲインgain(n)を求める関数F()は、Rmax計算部20において、音声区間のフレームに対して求められるラグ範囲最大相関Rmax(y(n))を大にし、非音声区間のフレームに対して求められるラグ範囲最大相関Rmax(y(n))を小にする関数であれば、どのような関数であっても良い。 Note that the function F () for obtaining the gain gain (n) is not limited to the above-described function. That is, the function F () for obtaining the gain gain (n) increases the maximum lag range correlation R max (y (n)) obtained for the frame of the speech section in the R max calculation unit 20, and increases the non-speech section. Any function that reduces the maximum lag range correlation R max (y (n)) required for a given frame may be used.
また、ノイズミックス部18において、式y(n)=x(n)+C×gain(n)×gにしたがって、ノイズ付加信号Y(t)のフレームy(n)を求めるときに用いられる定数Cとしては、例えば、その定数Cの値を変えて、ノイズ付加信号Y(t)のラグ範囲最大相関Rmax(y(n))を求め、そのラグ範囲最大相関Rmax(y(n))を用いて、音声区間を検出する実験を行い、より正確に音声区間を検出することができたときの定数Cの値を採用することができる。
In the
また、ノイズミックス部18でにおいて用いられる定数Cとしては、その定数Cの値を変えて、ノイズ付加信号Y(t)のラグ範囲最大相関Rmax(y(n))を求め、そのラグ範囲最大相関Rmax(y(n))をプロットして目視で確認し、音声区間において値が大きく、かつ、非音声区間において値が小さいラグ範囲最大相関Rmax(y(n))を得られたときの定数Cの値を採用することができる。
Further, as the constant C used in the
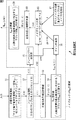
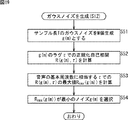
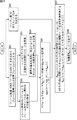
次に、図4のフローチャートを参照して、図3の信号処理装置の動作について説明する。 Next, the operation of the signal processing apparatus of FIG. 3 will be described with reference to the flowchart of FIG.
図3の信号処理装置では、音響信号変換部11からフレーム処理部12に対して、入力信号X(t)としての音声信号が供給される。
In the signal processing apparatus of FIG. 3, an audio signal as an input signal X (t) is supplied from the acoustic
フレーム処理部12は、ステップS11において、音響信号変換部11から供給される入力信号X(t)を、Tサンプルのサンプル値で構成されるフレームにフレーム化するフレーム処理を行い、その結果得られるフレームx(n)を、正規化自己相関計算部13、フレームパワー計算部15、及びノイズミックス部18に供給する。
In step S11, the
正規化自己相関計算部13は、ステップS13において、フレーム処理部12からのフレームx(n)の正規化自己相関R(x(n),τ)を求め、Rmax計算部14に供給する。
In step S <b> 13, the normalized
Rmax計算部14は、ステップS14において、正規化自己相関計算部13からの正規化自己相関R(x(n),τ)について、基本周波数範囲に相当するラグτの範囲での正規化自己相関R(x(n),τ)の最大値であるラグ範囲最大相関Rmax(x(n))を求めて、ゲイン計算部16に供給する。
In step S14, the R max calculator 14 calculates the normalized self-correlation R (x (n), τ) from the normalized
また、フレームパワー計算部15は、ステップS15において、フレーム処理部12からのフレームx(n)のフレームパワーp(n)を求め、ゲイン計算部16に供給する。
In step S15, the frame
ゲイン計算部16は、ステップS16において、Rmax計算部14からのフレームx(n)のラグ範囲最大相関Rmax(x(n))と、フレームパワー計算部15からのフレームx(n)のフレームパワーp(n)とに基づき、ゲインgain(n)を求め、ノイズミックス部18に供給する。
In step S <b> 16, the
すなわち、ゲイン計算部16は、例えば、フレームx(n)を中心として、数百ミリ秒から1秒程度の時間内に存在するNフレームについての、フレームパワーp(n)とラグ範囲最大相関Rmax(x(n))との積p(n)×Rmax(x(n))のうちの最小値を、ゲインgain(n)として求め、ノイズミックス部18に供給する。
That is, for example, the
一方、ガウスノイズ生成部17は、ステップS12において、1フレームのサンプル数と同一のTサンプルのガウスノイズgを生成し、ノイズミックス部18に供給する。
On the other hand, the Gaussian
ノイズミックス部18は、ステップS17において、式y(n)=x(n)+C×gain(n)×gにしたがい、定数Cと、ゲイン計算部16からのゲインgain(n)との積C×gain(n)を求め、ガウスノイズ生成部17からのガウスノイズgを、積C×gain(n)倍したノイズC×gain(n)×gを求める。さらに、ステップS17では、ノイズミックス部18は、式y(n)=x(n)+C×gain(n)×gにしたがい、フレーム処理部12からのフレームx(n)に、ノイズC×gain(n)×gを付加することにより、ノイズ付加信号Y(t)のフレームy(n)を求め、正規化自己相関計算部19に供給する。
In step S17, the
正規化自己相関計算部19は、ステップS18において、ノイズミックス部18からのノイズ付加信号Y(t)のフレームy(n)の正規化自己相関R(y(n),τ)を求めて、Rmax計算部20に供給する。
In step S18, the normalized
Rmax計算部20は、ステップS19において、正規化自己相関計算部19からの正規化自己相関R(y(n),τ)について、基本周波数範囲に相当するラグτの範囲での正規化自己相関R(y(n),τ)の最大値であるラグ範囲最大相関Rmax(y(n))を求める。そして、Rmax計算部20は、ステップS20において、そのラグ範囲最大相関Rmax(y(n))を、入力信号X(t)のフレームx(n)から抽出された特徴量として出力する。
In step S19, the R max calculator 20 calculates the normalized autocorrelation R (y (n), τ) from the normalized
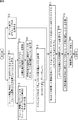
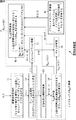
次に、図5は、図3の信号処理装置を応用した音声区間検出装置の一実施の形態の構成例を示している。 Next, FIG. 5 shows a configuration example of an embodiment of a speech segment detection device to which the signal processing device of FIG. 3 is applied.
図5の音声区間検出装置では、入力信号X(t)としての音声信号の特徴量として、その入力信号X(t)にノイズを付加したノイズ付加信号Y(t)のラグ範囲最大相関Rmax(y(n))を用いて、入力信号X(t)の音声区間が検出される。 In the speech segment detection apparatus of FIG. 5, the lag range maximum correlation R max of the noise added signal Y (t) obtained by adding noise to the input signal X (t) as the feature quantity of the speech signal as the input signal X (t). Using (y (n)), the speech section of the input signal X (t) is detected.
すなわち、図5の音声区間検出装置では、音響信号変換部41が、図3の音響信号変換部11と同様に、そこに入力される空気振動としての音を、アナログの音声信号に変換し、さらに、そのアナログの音声信号を、ディジタルの音声信号に変換して、入力信号X(t)として、フレーム処理部42に供給する。
That is, in the speech section detection device of FIG. 5, the acoustic
フレーム処理部42では、図3のフレーム処理部12と同様に、音響信号変換部41からの入力信号X(t)を、Tサンプルのサンプル値で構成されるフレームにフレーム化するフレーム処理が行われ、その結果得られるフレームx(n)が、ノイズミックスRmax計算部43、及びフレームパワー計算部44に供給される。
The frame processing unit 42 performs frame processing for framing the input signal X (t) from the acoustic
ノイズミックスRmax計算部43は、図3のノイズミックスRmax計算部、すなわち、正規化自己相関計算部13,Rmax計算部14、フレームパワー計算部15、ゲイン計算部16、ガウスノイズ生成部17、ノイズミックス部18、正規化自己相関計算部19、及びRmax計算部20と同様に構成され、ノイズミックスRmax計算処理を行うことによって、フレーム処理部42から供給されるフレームx(n)から、ノイズ付加信号Y(t)のラグ範囲最大相関Rmax(y(n))を求め、複数フレーム処理部45に供給する。
Noise Mix R max calculation unit 43, noise mixes R max calculator of FIG. 3, i.e., the normalized
一方、フレームパワー計算部44では、フレーム処理部42からのフレームx(n)から、そのフレームx(n)のフレームログパワーが求められ、さらに、そのフレームログパワーを正規化した正規化ログパワーlogp(n)が求められて、複数フレーム処理部45に供給される。
On the other hand, the frame
すなわち、フレームパワー計算部44は、フレームx(n)のT個のサンプル値それぞれの自乗の総和のlogをとることで、フレームログパワーFP(n)を求める。
That is, the frame
さらに、フレームパワー計算部44は、例えば、忘却係数ffを用いた式FPave(n)=ff×FPave(n-1)+(1-ff)×FP(n)を演算することにより、FPave(n)を、フレームログパワーFP(n)の平均値として求める。
Further, the frame
そして、フレームパワー計算部44は、フレームログパワーFP(n)から、平均値FPave(n)を減算し、その減算値FP(n)-FPave(n)を、正規化ログパワーlogp(n)として、複数フレーム処理部45に供給する。
Then, the frame
ここで、フレームログパワーFP(n)を、そのフレームログパワーFP(n)から平均値FPave(n)を減算して、正規化ログパワーlogp(n)とすることにより、その正規化ログパワーlogp(n)の平均は、ほぼ0となる。すなわち、フレームパワー計算部44において、フレームログパワーFP(n)の正規化は、その平均を0とするために行われる。
Here, the normalized log power is obtained by subtracting the average value FPave (n) from the frame log power FP (n) and obtaining the normalized log power logp (n). The average of logp (n) is almost zero. That is, the frame
複数フレーム処理部45は、ノイズミックスRmax計算部43からのラグ範囲最大相関Rmax(y(n))と、フレームパワー計算部44からの正規化ログパワーlogp(n)とをまとめて(統合して)、入力信号X(t)の注目フレームの特徴量(統合特徴量)を求める。
The multiple
すなわち、いま、入力信号X(t)の先頭からn番目のフレームx(n)を、注目フレームということとすると、複数フレーム処理部45は、注目フレームと、その前後の幾つかのフレームのラグ範囲最大相関Rmax(y(n))、及び正規化ログパワーlogp(n)をコンポーネントとするベクトルを、注目フレームの特徴量として求める。
That is, when the n-th frame x (n) from the head of the input signal X (t) is now referred to as the frame of interest, the multiple
具体的には、複数フレーム処理部45は、例えば、注目フレームのラグ範囲最大相関Rmax(y(n))と、その前後の8フレームそれぞれのラグ範囲最大相関Rmax(y(n))との、合計で17個のラグ範囲最大相関Rmax(y(n))を昇順にソートするとともに、注目フレームの正規化ログパワーlogp(n)と、その前後の8フレームそれぞれの正規化ログパワーlogp(n)との、合計で17個の正規化ログパワーlogp(n)を昇順にソートし、ソート後の17個のラグ範囲最大相関Rmax(y(n))と、ソート後の17個の正規化ログパワーlogp(n)とをコンポーネントとする34次元のベクトルを、注目フレームの特徴量として求める。
Specifically, a plurality
そして、複数フレーム処理部45は、注目フレームの特徴量としての34次元のベクトルを、線形判別分析部46に供給する。
Then, the multiple
線形判別分析部46は、複数フレーム処理部45からのフレームx(n)の特徴量としてのベクトルの次元を圧縮し、識別処理部47に供給する。
The linear discriminant analysis unit 46 compresses the dimension of the vector as the feature quantity of the frame x (n) from the multiple
すなわち、線形判別分析部46は、複数フレーム処理部45からのフレームx(n)の特徴量としての34次元のベクトルを、例えば、線形判別分析(LDA(Linear Discriminant Analysis))によって、2次元のベクトルに圧縮し、フレームx(n)の特徴量として、識別処理部47に供給する。
That is, the linear discriminant analysis unit 46 converts the 34-dimensional vector as the feature quantity of the frame x (n) from the multiple
識別処理部47は、線形判別分析部46からの特徴量としての2次元のベクトルに基づき、フレームx(n)が、音声区間のフレームであるか、または非音声区間のフレームであるかの識別を行い、その識別結果を、音声区間情報として出力する。
Based on the two-dimensional vector as the feature quantity from the linear discriminant analysis unit 46, the
すなわち、識別処理部47は、例えば、音声区間の検出用に学習がされたHMM(Hidden Markov Model)を記憶しており、そのHMMにおいて、線形判別分析部46からの特徴量が観測される尤度に基づき、フレームx(n)が、音声区間のフレームであるか、または非音声区間のフレームであるかの識別を行い、その識別結果を、音声区間情報として出力する。
That is, the
なお、非特許文献2には、入力信号X(t)にノイズを付加したノイズ付加信号Y(t)のラグ範囲最大相関Rmax(y(n))ではなく、入力信号X(t)のラグ範囲最大相関Rmax(x(n))と、正規化ログパワーlogP(n)を特徴量とし、5状態のtied-state HMMを用いて、音声区間の検出を行う方法が記載されている。ここでのtied-state HMMとは、音声HMMと非音声HMMとのそれぞれが5状態(state)を持つが、音声HMMと非音声とのそれぞれの5状態が同じ混合ガウス分布(GMM:Gaussian Mixture Model)を共有(tied)するものである。 In Non-Patent Document 2, the lag range maximum correlation R max (y (n)) of the noise added signal Y (t) obtained by adding noise to the input signal X (t) is not the input signal X (t). Describes a method for detecting speech intervals using a five-state tied-state HMM with lag range maximum correlation R max (x (n)) and normalized log power logP (n) as features . The tied-state HMM here is a mixed Gaussian distribution (GMM: Gaussian Mixture) where each of the voice HMM and the non-voice HMM has five states, but the voice HMM and the non-voice HMM have the same five states. Model).
図5の音声区間検出装置で行われる音声区間の検出は、特徴量として、入力信号X(t)のラグ範囲最大相関Rmax(x(n))に代えて、入力信号X(t)にノイズを付加したノイズ付加信号Y(t)のラグ範囲最大相関Rmax(y(n))が用いられる点と、音声区間の識別に、5状態のtied-state HMMに代えて、tied-stateではない通常の5状態のHMMが用いられる点において、非特許文献2に記載の方法と異なる。 Detection of the speech segment to be performed by the speech segment detection device of FIG. 5, as the feature quantity, instead of the lag range maximum correlation R max of the input signal X (t) (x (n )), to the input signal X (t) in The point where the maximum lag range correlation R max (y (n)) of the noise-added signal Y (t) with noise added is used, and the tied-state HMM instead of the five-state tied-state HMM for voice segment identification This is different from the method described in Non-Patent Document 2 in that a normal five-state HMM is used.
次に、図6ないし図14を参照して、図5の音声区間検出装置を用いて行った音声区間の検出の実験の結果について説明する。 Next, with reference to FIG. 6 to FIG. 14, the result of the speech segment detection experiment performed using the speech segment detection apparatus of FIG. 5 will be described.
実験では、ソニー株式会社が開発した二足歩行ロボットであるQRIO(R)に採用されているマイクによって得られたアナログの音声信号を、16kHzのサンプリング周波数でサンプリングすることにより、ディジタルの音声信号に変換し、入力信号X(t)として用いた。 In the experiment, the analog audio signal obtained by the microphone used in QRIO (R), a biped robot developed by Sony Corporation, was sampled at a sampling frequency of 16 kHz to produce a digital audio signal. Converted and used as input signal X (t).
さらに、実験では、フレームの長さ(サンプル数)Tを、1024サンプルとして、160サンプルずつシフトしながら、入力信号X(t)から、フレームx(n)を抽出した。 Further, in the experiment, the frame length (number of samples) T was set to 1024 samples, and the frame x (n) was extracted from the input signal X (t) while shifting by 160 samples.
また、実験では、正規化ログパワーlogp(n)を求めるのに用いる平均値FPave(n)を、式FPave(n)=ff×FPave(n-1)+(1-ff)×FP(n)にしたがって求めるのにあたり、忘却係数ffとして、0.99を採用した。 In the experiment, the average value FPave (n) used to obtain the normalized log power logp (n) is expressed by the formula FPave (n) = ff × FPave (n-1) + (1-ff) × FP (n ) Is used as the forgetting factor ff.
さらに、音声区間の識別に用いるHMMの確率密度関数としては、混合ガウス分布を採用した。また、音声区間用のHMMと、非音声区間用のHMMとを用意するとともに、HMMの学習用の入力信号X(t)を用意し、その学習用の入力信号X(t)から、線形判別分析部46で得られるのと同様の2次元ベクトルを、特徴量として得て、学習用の入力信号X(t)の音声区間から得られた特徴量を、音声区間用のHMMに与えるとともに、学習用の入力信号X(t)の非音声区間から得られた特徴量を、非音声区間用のHMMに与えることによって、音声区間用のHMMと、非音声区間用のHMMとの学習を行った。 Furthermore, a mixed Gaussian distribution was adopted as the probability density function of the HMM used for speech segment identification. In addition to preparing an HMM for speech segments and an HMM for non-speech segments, an HMM learning input signal X (t) is prepared, and linear discrimination is performed from the learning input signal X (t). A two-dimensional vector similar to that obtained by the analysis unit 46 is obtained as a feature quantity, and the feature quantity obtained from the speech section of the learning input signal X (t) is given to the speech section HMM, Learning from the HMM for the non-speech section and the HMM for the non-speech section by giving the feature quantity obtained from the non-speech section of the learning input signal X (t) to the non-speech section HMM It was.
また、実験では、実験用の入力信号X(t)に対して、人が、音声区間の開始と終了のフレームをラベリングし、識別処理部47が出力した音声区間情報が表す音声区間と、人が開始と終了のフレームをラベリングした音声区間とを比較することにより、識別処理部47が出力した音声区間情報が表す音声区間の正否を判断した。
Further, in the experiment, a person labels the start and end frames of the speech section with respect to the experimental input signal X (t), and the speech section represented by the speech section information output from the
具体的には、人がラベリングした音声区間の開始と終了のフレームを、それぞれ、第Tsフレームと、第Teフレームとするとともに、識別処理部47が出力した音声区間情報が表す音声区間の開始と終了のフレームを、それぞれ、第Ssフレームと、第Seフレームとすると、Ssが、式Ts-40<=Ss<=Tsを満たし、かつ、Seが、式Te<=Se<=Te+40を満たす場合に、識別処理部47が出力した音声区間情報が表す音声区間が、正解であるとした。
Specifically, the start and end frames of the speech section labeled by the person are the Ts frame and the Te frame, respectively, and the start of the speech section represented by the speech section information output by the
なお、その他、実験では、ゲインgain(n)を求める関数F(p(n),Rmax(x(n)))として、フレームx(n)を含む連続するNフレームのそれぞれについての、フレームパワーp(n)とラグ範囲最大相関Rmax(x(n))との積p(n)×Rmax(x(n))の最小値を求める関数(以下、適宜、積最小値関数という)の他に、フレームx(n)を含む連続するNフレームのそれぞれについての、フレームパワーp(n)とラグ範囲最大相関Rmax(x(n))との積p(n)×Rmax(x(n))の平均値を求める関数(以下、適宜、積平均値関数という)と、フレームx(n)を含む連続するNフレームのそれぞれについてのフレームパワーp(n)の最小値を求める関数(以下、適宜、パワー最小値関数という)とを用いた。 In addition, in the experiment, as the function F (p (n), R max (x (n))) for obtaining the gain gain (n), the frame for each of the consecutive N frames including the frame x (n) A function for obtaining the minimum value of the product p (n) × R max (x (n)) of the power p (n) and the maximum lag range correlation R max (x (n)) (hereinafter referred to as the product minimum value function as appropriate) ), And the product of frame power p (n) and maximum lag range correlation R max (x (n)) for each of consecutive N frames including frame x (n) p (n) × R max The minimum value of the frame power p (n) for each of N consecutive frames including a function (hereinafter referred to as a product average value function) for obtaining an average value of (x (n)) and a frame x (n) as appropriate. A function to be obtained (hereinafter referred to as a power minimum value function as appropriate) was used.
また、関数F(p(n),Rmax(x(n)))を定義するNフレームとしては、40フレームを採用した。 Further, 40 frames were adopted as N frames for defining the function F (p (n), R max (x (n))).
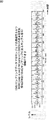
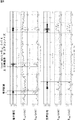
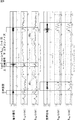
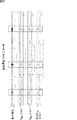
図6は、実験において、関数F(p(n),Rmax(x(n)))として、積最小値関数を採用した場合の、ノイズ付加信号Y(t)のラグ範囲最大相関Rmax(y(n))を示している。 FIG. 6 shows the lag range maximum correlation R max of the noise added signal Y (t) when the product minimum value function is adopted as the function F (p (n), R max (x (n))) in the experiment. (y (n)) is shown.
すなわち、図6上半分側は、音楽が流れている環境(音楽環境)で集音した音声信号を入力信号X(t)として得られたノイズ付加信号Y(t)のラグ範囲最大相関Rmax(y(n))を示しており、図6下半分側は、エアコン(エアコンディショナ)が稼働している環境(エアコン環境)で集音した音声信号を入力信号X(t)として得られたノイズ付加信号Y(t)のラグ範囲最大相関Rmax(y(n))を示している。 That is, the upper half side in FIG. 6 shows the lag range maximum correlation R max of the noise added signal Y (t) obtained as an input signal X (t), which is an audio signal collected in an environment (music environment) in which music is flowing. (y (n)) is shown, and in the lower half of FIG. 6, the audio signal collected in the environment (air conditioner environment) where the air conditioner (air conditioner) is operating is obtained as the input signal X (t). The lag range maximum correlation R max (y (n)) of the noise added signal Y (t) is shown.
図6上半分側の上から1番目は、音楽環境で集音した音声信号、つまり、入力信号X(t)を示しており、その上から2番目は、その入力信号X(t)のラグ範囲最大相関Rmax(x(n))を示している。そして、図6上半分側の上から3番目は、入力信号X(t)にノイズを付加したノイズ付加信号Y(t)のラグ範囲最大相関Rmax(y(n))を示している。 The first from the upper half of FIG. 6 shows the audio signal collected in the music environment, that is, the input signal X (t), and the second from the top shows the lag of the input signal X (t). The range maximum correlation R max (x (n)) is shown. The third from the upper half of FIG. 6 shows the lag range maximum correlation R max (y (n)) of the noise added signal Y (t) obtained by adding noise to the input signal X (t).
図6下半分側も、その上から1番目は、エアコン環境で集音した音声信号、つまり、入力信号X(t)を示しており、その上から2番目は、1番目の入力信号X(t)のラグ範囲最大相関Rmax(x(n))を示している。そして、図6上半分側の上から3番目は、1番目の入力信号X(t)にノイズを付加したノイズ付加信号Y(t)のラグ範囲最大相関Rmax(y(n))を示している。 The lower half of FIG. 6 also shows the audio signal collected in the air conditioner environment, that is, the input signal X (t), and the second from the top shows the first input signal X ( The maximum correlation R max (x (n)) of t) is shown. The third from the top in the upper half of FIG. 6 shows the lag range maximum correlation R max (y (n)) of the noise added signal Y (t) obtained by adding noise to the first input signal X (t). ing.
なお、図6において、縦長の長方形で囲んである部分が、音声区間を表す。後述する図7においても同様である。 In FIG. 6, a portion surrounded by a vertically long rectangle represents a voice section. The same applies to FIG. 7 described later.
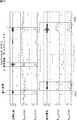
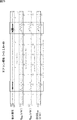
図7は、実験において、図6と同様に、関数F(p(n),Rmax(x(n)))として、積最小値関数を採用した場合の、ノイズ付加信号Y(t)のラグ範囲最大相関Rmax(y(n))を示している。 FIG. 7 shows the noise addition signal Y (t) when the product minimum value function is adopted as the function F (p (n), R max (x (n))) in the experiment, as in FIG. The lag range maximum correlation R max (y (n)) is shown.
但し、図6では、ノイズ付加信号Y(t)を求めるのに用いられる式y(n)=x(n)+C×gain(n)×gを定義する定数Cとして、0.4が採用されているのに対して、図7では、定数Cとして、0.2が採用されている。図7のその他の点は、図6と同様である。 However, in FIG. 6, 0.4 is adopted as the constant C that defines the equation y (n) = x (n) + C × gain (n) × g used to obtain the noise addition signal Y (t). On the other hand, in FIG. 7, 0.2 is adopted as the constant C. The other points of FIG. 7 are the same as those of FIG.
図6及び図7の入力信号X(t)のラグ範囲最大相関Rmax(x(n))と、ノイズ付加信号Y(t)のラグ範囲最大相関Rmax(y(n))とを比較すると、ノイズ付加信号Y(t)のラグ範囲最大相関Rmax(y(n))は、音声区間では、入力信号X(t)のラグ範囲最大相関Rmax(x(n))の値を維持し、非音声区間では、入力信号X(t)のラグ範囲最大相関Rmax(x(n))よりも小さい値になっている。 Compared to lag range maximum correlation R max of the input signal X of FIG. 6 and FIG. 7 (t) (x (n )), the lag range maximum correlation R max of the noise addition signal Y (t) and a (y (n)) Then, the lag range maximum correlation R max of the noise addition signal Y (t) (y (n )) , in the speech interval, the value of the lag range maximum correlation R max of the input signal X (t) (x (n )) In the non-voice section, the value is smaller than the lag range maximum correlation R max (x (n)) of the input signal X (t).
したがって、図3のゲイン計算部16において、入力信号X(t)に付加されるノイズのレベルが、適切に調整され、その結果、ノイズミックス部18において、入力信号X(t)の音声が存在しない部分には、大きなレベルのノイズが付加され、入力信号X(t)の音声が存在する部分には、小さなレベルのノイズが付加されていることが分かる。
Therefore, the level of noise added to the input signal X (t) is appropriately adjusted in the
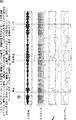
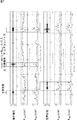
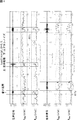
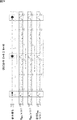
図8は、実験において、関数F(p(n),Rmax(x(n)))として、積平均値関数を採用した場合の、ノイズ付加信号Y(t)のラグ範囲最大相関Rmax(y(n))を示している。 FIG. 8 shows the lag range maximum correlation R max of the noise-added signal Y (t) when the product average function is adopted as the function F (p (n), R max (x (n))) in the experiment. (y (n)) is shown.
すなわち、図8上半分側は、上述の図6上半分と同様に、音楽環境で集音した音声信号を入力信号X(t)として得られたノイズ付加信号Y(t)のラグ範囲最大相関Rmax(y(n))を示しており、図8下半分側は、上述の図6下半分と同様に、エアコン環境で集音した音声信号を入力信号X(t)として得られたノイズ付加信号Y(t)のラグ範囲最大相関Rmax(y(n))を示している。 That is, the upper half side of FIG. 8 shows the maximum correlation in the lag range of the noise added signal Y (t) obtained by using the audio signal collected in the music environment as the input signal X (t), as in the upper half of FIG. R max (y (n)) is shown, and the lower half of FIG. 8 shows the noise obtained as an input signal X (t), as in the case of the lower half of FIG. The lag range maximum correlation R max (y (n)) of the additional signal Y (t) is shown.
但し、図8では、上述したように、関数F(p(n),Rmax(x(n)))として、積最小値関数ではなく、積平均値関数が採用されている。 However, in FIG. 8, as described above, the product average value function is adopted as the function F (p (n), R max (x (n))) instead of the product minimum value function.
図8上半分側の上から1番目は、音楽環境で集音した音声信号、つまり、入力信号X(t)を示しており、その上から2番目は、その入力信号X(t)のラグ範囲最大相関Rmax(x(n))を示している。そして、図8上半分側の上から3番目は、入力信号X(t)にノイズを付加したノイズ付加信号Y(t)のラグ範囲最大相関Rmax(y(n))を示している。 8 shows the audio signal collected in the music environment, that is, the input signal X (t), and the second from the top shows the lag of the input signal X (t). The range maximum correlation R max (x (n)) is shown. The third from the top in the upper half of FIG. 8 shows the lag range maximum correlation R max (y (n)) of the noise added signal Y (t) obtained by adding noise to the input signal X (t).
図8下半分側も、その上から1番目は、エアコン環境で集音した音声信号、つまり、入力信号X(t)を示しており、その上から2番目は、1番目の入力信号X(t)のラグ範囲最大相関Rmax(x(n))を示している。そして、図8上半分側の上から3番目は、1番目の入力信号X(t)にノイズを付加したノイズ付加信号Y(t)のラグ範囲最大相関Rmax(y(n))を示している。 The lower half of FIG. 8 also shows the audio signal collected in the air conditioner environment, that is, the input signal X (t) from the top, and the second from the top shows the first input signal X ( The maximum correlation R max (x (n)) of t) is shown. The third from the top in the upper half of FIG. 8 shows the maximum lag range correlation R max (y (n)) of the noise added signal Y (t) obtained by adding noise to the first input signal X (t). ing.
なお、図8において、縦長の長方形で囲んである部分が、音声区間を表す。後述する図9においても同様である。 In FIG. 8, a portion surrounded by a vertically long rectangle represents a voice section. The same applies to FIG. 9 described later.
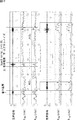
図9は、実験において、図8と同様に、関数F(p(n),Rmax(x(n)))として、積平均値関数を採用した場合の、ノイズ付加信号Y(t)のラグ範囲最大相関Rmax(y(n))を示している。 FIG. 9 shows the noise addition signal Y (t) when the product average value function is adopted as the function F (p (n), R max (x (n))) in the experiment, as in FIG. The lag range maximum correlation R max (y (n)) is shown.
但し、図8では、ノイズ付加信号Y(t)を求めるのに用いられる式y(n)=x(n)+C×gain(n)×gを定義する定数Cとして、0.1が採用されているのに対して、図9では、定数Cとして、0.05が採用されている。図9のその他の点は、図8と同様である。 However, in FIG. 8, 0.1 is adopted as a constant C that defines the equation y (n) = x (n) + C × gain (n) × g used to obtain the noise addition signal Y (t). In contrast, in FIG. 9, 0.05 is adopted as the constant C. The other points of FIG. 9 are the same as those of FIG.
図8において、A81で示す部分では、ノイズ付加信号Y(t)のラグ範囲最大相関Rmax(y(n))が、非音声区間であるにもかかわらず、音声区間と同程度の値になっており、これは、入力信号X(t)に、十分な大きさのノイズが付加されていないことを表す。 8, the portion indicated by A8 1, lag range maximum correlation R max of the noise addition signal Y (t) (y (n )) is, despite the non-speech section, the speech section and comparable values This indicates that a sufficiently large noise is not added to the input signal X (t).
また、図8において、A82で示す部分では、ノイズ付加信号Y(t)のラグ範囲最大相関Rmax(y(n))が、音声区間であるにもかかわらず、入力信号X(t)のラグ範囲最大相関Rmax(x(n))の値よりも小さくなっており、これは、入力信号X(t)に付加されたノイズのレベルが大きすぎることを表す。 Further, in FIG. 8, the portion indicated by A8 2, lag range maximum correlation R max of the noise addition signal Y (t) (y (n )) is, despite the speech section, the input signal X (t) in of which is smaller than the value of the lag range maximum correlation R max (x (n)) , which indicates that the level of added noise in the input signal X (t) in too large.
定数Cを大きくすれば、ノイズ付加信号Y(t)のラグ範囲最大相関Rmax(y(n))の非音声区間での値、すなわち、例えば、図8のA81で示す部分の値を小さくすることができる。しかしながら、定数Cを大きくすると、ノイズ付加信号Y(t)のラグ範囲最大相関Rmax(y(n))の音声区間での値、すなわち、例えば、図8のA82で示す部分の値は、さらに小さくなる。 A larger constant C, the value of the non-speech interval of the lag range maximum correlation R max of the noise addition signal Y (t) (y (n )), i.e., for example, the value of the portion indicated by A8 1 in FIG. 8 Can be small. However, increasing the constant C, the value of the speech segment of the lag range maximum correlation R max of the noise addition signal Y (t) (y (n )), i.e., for example, the value of the portion indicated by A8 2 in FIG. 8 , Even smaller.
一方、定数Cを小さくすることにより、ノイズ付加信号Y(t)のラグ範囲最大相関Rmax(y(n))の音声区間での値、すなわち、例えば、図8のA82で示す部分の値を大きくして、入力信号X(t)のラグ範囲最大相関Rmax(x(n))の値と同程度にすることができる。 On the other hand, by decreasing the constant C, the value of the speech segment of the lag range maximum correlation R max of the noise addition signal Y (t) (y (n )), i.e., for example, a portion indicated by A8 2 in FIG. 8 by increasing the value, it can be set to a value about the same lag range maximum correlation R max of the input signal X (t) (x (n )).
しかしながら、定数Cを小さくすると、定数Cが0.1の図8と、定数Cが0.1より小さい0.05の図9とを比較して分かるように、ノイズ付加信号Y(t)のラグ範囲最大相関Rmax(y(n))の非音声区間での値を小さくすることができなくなる。 However, when the constant C is reduced, as shown in FIG. 8 where the constant C is 0.1 and FIG. 9 where the constant C is less than 0.1, the maximum lag range correlation R max of the noise added signal Y (t) is understood. The value of (y (n)) in the non-speech interval cannot be reduced.
すなわち、定数Cを小さくすると、図9において、A91やA92で示すように、ノイズ付加信号Y(t)のラグ範囲最大相関Rmax(y(n))が、非音声区間であるにもかかわらず、音声区間と同程度の値に大きくなる。 That is, when decreasing the constant C, and 9, as indicated by A9 1 and A9 2, lag range maximum correlation R max of the noise addition signal Y (t) (y (n )) is, in a non-speech section Regardless, the value is increased to the same level as that of the voice interval.
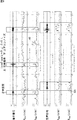
図10は、実験において、関数F(p(n),Rmax(x(n)))として、パワー最小値関数を採用した場合の、ノイズ付加信号Y(t)のラグ範囲最大相関Rmax(y(n))を示している。 FIG. 10 shows the lag range maximum correlation R max of the noise added signal Y (t) when the power minimum value function is adopted as the function F (p (n), R max (x (n))) in the experiment. (y (n)) is shown.
すなわち、図10上半分側は、上述の図6上半分と同様に、音楽環境で集音した音声信号を入力信号X(t)として得られたノイズ付加信号Y(t)のラグ範囲最大相関Rmax(y(n))を示しており、図10下半分側は、上述の図6下半分と同様に、エアコン環境で集音した音声信号を入力信号X(t)として得られたノイズ付加信号Y(t)のラグ範囲最大相関Rmax(y(n))を示している。 That is, the upper half side of FIG. 10 shows the maximum correlation of the lag range of the noise added signal Y (t) obtained by using the audio signal collected in the music environment as the input signal X (t), as in the upper half of FIG. R max (y (n)) is shown, and the lower half of FIG. 10 shows the noise obtained as an input signal X (t), as in the case of the lower half of FIG. The lag range maximum correlation R max (y (n)) of the additional signal Y (t) is shown.
但し、図10では、上述したように、関数F(p(n),Rmax(x(n)))として、積最小値関数ではなく、パワー最小値関数が採用されている。 However, in FIG. 10, as described above, the function F (p (n), R max (x (n))) is not the product minimum value function but the power minimum value function.
図10上半分側の上から1番目は、音楽環境で集音した音声信号、つまり、入力信号X(t)を示しており、その上から2番目は、1番目の入力信号X(t)のラグ範囲最大相関Rmax(x(n))を示している。そして、図10上半分側の上から3番目は、1番目の入力信号X(t)にノイズを付加したノイズ付加信号Y(t)のラグ範囲最大相関Rmax(y(n))を示している。 The first from the upper half of FIG. 10 shows the audio signal collected in the music environment, that is, the input signal X (t), and the second from the top shows the first input signal X (t). Lag range maximum correlation R max (x (n)). The third from the top of the upper half of FIG. 10 shows the maximum lag range correlation R max (y (n)) of the noise added signal Y (t) obtained by adding noise to the first input signal X (t). ing.
図10下半分側も、その上から1番目は、エアコン環境で集音した音声信号、つまり、入力信号X(t)を示しており、その上から2番目は、1番目の入力信号X(t)のラグ範囲最大相関Rmax(x(n))を示している。そして、図10上半分側の上から3番目は、1番目の入力信号X(t)にノイズを付加したノイズ付加信号Y(t)のラグ範囲最大相関Rmax(y(n))を示している。 The lower half of FIG. 10 also shows the audio signal collected in the air conditioner environment, that is, the input signal X (t), and the second from the top shows the first input signal X ( The maximum correlation R max (x (n)) of t) is shown. The third from the top of the upper half of FIG. 10 shows the maximum lag range correlation R max (y (n)) of the noise added signal Y (t) obtained by adding noise to the first input signal X (t). ing.
なお、図10において、縦長の長方形で囲んである部分が、音声区間を表す。後述する図11及び図12においても同様である。 In FIG. 10, a portion surrounded by a vertically long rectangle represents a voice section. The same applies to FIGS. 11 and 12 described later.
図11及び図12は、実験において、図10と同様に、関数F(p(n),Rmax(x(n)))として、パワー最小値関数を採用した場合の、ノイズ付加信号Y(t)のラグ範囲最大相関Rmax(y(n))を示している。 11 and 12 show the noise addition signal Y () when the power minimum value function is adopted as the function F (p (n), R max (x (n))) in the experiment, as in FIG. The lag range maximum correlation R max (y (n)) of t) is shown.
但し、図10では、ノイズ付加信号Y(t)を求めるのに用いられる式y(n)=x(n)+C×gain(n)×gを定義する定数Cとして、0.2が採用されているのに対して、図11では、定数Cとして、0.1が採用されており、図12では、定数Cとして、0.05が採用されている。 However, in FIG. 10, 0.2 is adopted as the constant C that defines the equation y (n) = x (n) + C × gain (n) × g used to obtain the noise addition signal Y (t). In contrast, in FIG. 11, 0.1 is adopted as the constant C, and in FIG. 12, 0.05 is adopted as the constant C.
定数Cの大小に関しては、関数F(p(n),Rmax(x(n)))として、パワー最小値関数を採用した図10ないし図12においても、関数F(p(n),Rmax(x(n)))として、積平均値関数を採用した図8及び図9の場合と基本的に同様の傾向がある。 Regarding the magnitude of the constant C, the function F (p (n), R is also used in FIGS. 10 to 12 in which the power minimum value function is adopted as the function F (p (n), R max (x (n))). As max (x (n))), there is basically the same tendency as in the case of FIGS.
例えば、定数Cが0.2の図10において、A101とA102で示す部分では、ノイズ付加信号Y(t)のラグ範囲最大相関Rmax(y(n))が、音声区間であるにもかかわらず、入力信号X(t)のラグ範囲最大相関Rmax(x(n))の値よりも小さくなっており、これは、A101とA102で示す部分については、入力信号X(t)に付加されたノイズのレベルが大きすぎることを表す。 For example, in FIG. 10 of the constant C is 0.2, the portion indicated by A10 1 and A10 2, lag range maximum correlation R max of the noise addition signal Y (t) (y (n )) is, though it is a voice section The lag range maximum correlation R max (x (n)) of the input signal X (t) is smaller than the value of the input signal X (t) for the portions indicated by A10 1 and A10 2 This indicates that the level of noise added to is too large.
また、定数Cが0.1の図11において、A111で示す部分では、ノイズ付加信号Y(t)のラグ範囲最大相関Rmax(y(n))が、非音声区間であるにもかかわらず、音声区間と同程度の値になっており、これは、A111で示す部分については、入力信号X(t)に、十分な大きさのノイズが付加されていないことを表す。 Further, in FIG. 11 where the constant C is 0.1, in the portion indicated by A11 1 , the lag range maximum correlation R max (y (n)) of the noise added signal Y (t) is a non-speech interval. It has become a value comparable to the voice section, which, for the portion indicated by A11 1, indicating that the input signal X (t), not enough of the noise is added.
さらに、図11において、A112で示す部分では、ノイズ付加信号Y(t)のラグ範囲最大相関Rmax(y(n))が、音声区間であるにもかかわらず、入力信号X(t)のラグ範囲最大相関Rmax(x(n))の値よりも小さくなっており、これは、A112で示す部分については、入力信号X(t)に付加されたノイズのレベルが大きすぎることを表す。 Further, in FIG. 11, the portion indicated by A11 2, lag range maximum correlation R max of the noise addition signal Y (t) (y (n )) is, despite the speech section, the input signal X (t) in The lag range maximum correlation R max (x (n)) is smaller than the value of the noise level added to the input signal X (t) for the part indicated by A11 2 Represents.
また、定数Cが0.05の図12において、A121とA122で示す部分では、ノイズ付加信号Y(t)のラグ範囲最大相関Rmax(y(n))が、非音声区間であるにもかかわらず、音声区間と同程度の値になっており、これは、A121とA122で示す部分については、入力信号X(t)に、十分な大きさのノイズが付加されていないことを表す。 Further, in FIG. 12 where the constant C is 0.05, in the portion indicated by A12 1 and A12 2 , the lag range maximum correlation R max (y (n)) of the noise added signal Y (t) is a non-speech interval. Regardless, the value is about the same as that of the voice section. This means that the noise indicated by A12 1 and A12 2 is not added with sufficient noise to the input signal X (t). To express.
次に、図13及び図14は、図5の音声区間検出装置を用いた実験において得られた音声区間の正解率を示している。 Next, FIG. 13 and FIG. 14 show the correct answer rate of the speech segment obtained in the experiment using the speech segment detection apparatus of FIG.
実験では、音楽環境で集音した音声信号、エアコン環境で集音した音声信号、及びソニー株式会社が開発した二足歩行ロボットであるQRIO(R)が動作している環境(ロボット環境)で集音した音声信号のそれぞれを入力信号X(t)として、定数Cを変えながら、音声区間を検出した。 In the experiment, audio signals collected in a music environment, audio signals collected in an air conditioner environment, and an environment (robot environment) in which QRIO (R), a biped robot developed by Sony Corporation, is operating. Each of the sound signals that were sounded was used as the input signal X (t), and the sound section was detected while changing the constant C.
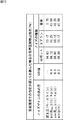
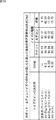
図13は、音楽環境で集音した音声信号を入力信号X(t)として音声区間を検出した場合に、高い正解率が得られる定数Cを採用したときの正解率を示しており、図14は、エアコン環境で集音した音声信号と、ロボット環境で集音した音声信号とを、それぞれ入力信号X(t)として音声区間を検出した場合に、高い正解率が得られる定数Cを採用したときの正解率を示している。 FIG. 13 shows the accuracy rate when a constant C is used, which obtains a high accuracy rate when a speech section is detected using an audio signal collected in a music environment as an input signal X (t). Employs a constant C that provides a high accuracy rate when the voice signal collected in the air conditioner environment and the voice signal collected in the robot environment are detected as the input signal X (t) respectively. The correct answer rate is shown.
図13及び図14の1行目は、入力信号X(t)にノイズを付加したノイズ付加信号Y(t)のラグ範囲最大相関Rmax(y(n))を用いずに、入力信号X(t)のラグ範囲最大相関Rmax(x(n))と正規化ログパワーlogp(n)とのセットを特徴量として、その特徴量を、図5の線形判別分析部46を介して、識別処理部47に与えた場合(以下、適宜、ベースラインの場合という)の、音楽環境、エアコン環境、及びロボット環境で集音した音声信号それぞれについての正解率を示している。 The first row of FIG. 13 and FIG. 14 shows the input signal X without using the lag range maximum correlation R max (y (n)) of the noise added signal Y (t) obtained by adding noise to the input signal X (t). The set of the lag range maximum correlation R max (x (n)) and the normalized log power logp (n) of (t) is used as a feature amount, and the feature amount is passed through the linear discriminant analysis unit 46 in FIG. The correct answer rate is shown for each of the audio signals collected in the music environment, the air conditioner environment, and the robot environment when given to the identification processing unit 47 (hereinafter referred to as the case of the baseline as appropriate).
また、図13及び図14の2行目ないし4行目は、入力信号X(t)にノイズを付加したノイズ付加信号Y(t)のラグ範囲最大相関Rmax(y(n))と、入力信号X(t)の正規化ログパワーlogp(n)とのセットを特徴量として、その特徴量を、図5の線形判別分析部46を介して、識別処理部47に与えた場合(以下、適宜、ノイズレベル調整方式の場合という)の、音楽環境、エアコン環境、及びロボット環境で集音した音声信号それぞれについての正解率を示している。
Further, the second to fourth lines in FIGS. 13 and 14 show the lag range maximum correlation R max (y (n)) of the noise added signal Y (t) obtained by adding noise to the input signal X (t), and When the set of the input signal X (t) and the normalized log power logp (n) is used as a feature amount, and the feature amount is given to the
但し、図13及び図14の2行目ないし4行目のうちの2行目では、関数F(p(n),Rmax(x(n)))として、積最小値関数が採用されており、3行目では、関数F(p(n),Rmax(x(n)))として、積平均値関数が採用されている。また、図13及び図14の2行目ないし4行目のうちの4行目では、関数F(p(n),Rmax(x(n)))として、パワー最小値関数が採用されている。 However, the product minimum value function is adopted as the function F (p (n), R max (x (n))) in the second line out of the second to fourth lines in FIGS. 13 and 14. In the third line, a product average function is employed as the function F (p (n), R max (x (n))). Further, in the fourth of the second to fourth lines in FIGS. 13 and 14, the power minimum value function is adopted as the function F (p (n), R max (x (n))). Yes.
なお、定数Cを、音楽環境で集音した音声信号に対する正解率が高くなるように調整した図13では、その2行目の、関数F(p(n),Rmax(x(n)))が、積最小値関数である場合の定数Cとして、0.4が採用されている。 In FIG. 13, in which the constant C is adjusted so that the accuracy rate for the audio signal collected in the music environment is high, the function F (p (n), R max (x (n))) in the second row is used. ) Is a constant C when the product minimum value function is 0.4.
また、図13の3行目の、関数F(p(n),Rmax(x(n)))が、積平均値関数である場合の定数Cとして、0.1が採用されており、その4行目の、関数F(p(n),Rmax(x(n)))が、パワー最小値関数である場合の定数Cとして、0.2が採用されている。 Further, 0.1 is adopted as the constant C when the function F (p (n), R max (x (n))) in the third line in FIG. As a constant C when the function F (p (n), R max (x (n))) on the line is a power minimum value function, 0.2 is adopted.
一方、定数Cを、エアコン環境やロボット環境で集音した音声信号に対する正解率が高くなるように調整した図14では、その2行目の、関数F(p(n),Rmax(x(n)))が、積最小値関数である場合の定数Cとして、0.2が採用されている。 On the other hand, in FIG. 14 where the constant C is adjusted so that the accuracy rate for the sound signal collected in the air conditioner environment or the robot environment is increased, the function F (p (n), R max (x ( As a constant C when n))) is a product minimum value function, 0.2 is adopted.
また、図14の3行目の、関数F(p(n),Rmax(x(n)))が、積平均値関数である場合の定数Cとして、0.025が採用されており、その4行目の、関数F(p(n),Rmax(x(n)))が、パワー最小値関数である場合の定数Cとして、0.05が採用されている。 Further, 0.025 is adopted as the constant C when the function F (p (n), R max (x (n))) on the third line in FIG. 14 is a product average value function. 0.05 is adopted as a constant C when the function F (p (n), R max (x (n))) on the line is a power minimum value function.
音楽環境、エアコン環境、及びロボット環境の中では、特に、音楽環境に、周期性の高いノイズ(音楽)が存在する。 In a music environment, an air conditioner environment, and a robot environment, noise (music) with high periodicity exists particularly in the music environment.
このため、ベースラインの場合には、入力信号X(t)のラグ範囲最大相関Rmax(x(n))が、音声区間のみならず、非音声区間でも大きな値となり、その結果、図13及び図14の1行目に示すように、音楽環境で集音した音声信号に対する正解率が、他のエアコン環境やロボット環境で集音した音声信号に対する正解率よりも著しく低くなっている。 For this reason, in the case of the baseline, the lag range maximum correlation R max (x (n)) of the input signal X (t) becomes a large value not only in the speech period but also in the non-speech period. As a result, FIG. As shown in the first line of FIG. 14, the correct answer rate for the sound signal collected in the music environment is significantly lower than the correct answer rate for the sound signal collected in the other air conditioner environment or the robot environment.
すなわち、ベースラインの場合では、図13及び図14の1行目に示すように、ロボット環境で集音した音声信号に対する正解率が94.63%で、エアコン環境で集音した音声信号に対する正解率が93.12%であり、高い正解率であるのに対して、音楽環境で集音した音声信号に対する正解率は、8.75%と著しく低い正解率になっている。 That is, in the case of the baseline, as shown in the first line of FIGS. 13 and 14, the correct answer rate for the voice signal collected in the robot environment is 94.63%, and the correct answer rate for the voice signal collected in the air conditioner environment is While it is 93.12%, which is a high accuracy rate, the accuracy rate for audio signals collected in a music environment is 8.75%, which is a remarkably low accuracy rate.
また、定数Cを、音楽環境で集音した音声信号に対する正解率が高くなるように調整した図13のノイズレベル調整方式の場合においては、図13の2行目ないし4行目に示すように、音楽環境で集音した音声信号に対する正解率は、関数F(p(n),Rmax(x(n)))として、積最小値関数、積平均値関数、又はパワー最小値関数が採用されたときに、それぞれ、45.00%,46.25%、又は45.00%であり、いずれも、ベースラインの場合の正解率である8.75%から飛躍的に向上している。 Further, in the case of the noise level adjustment method of FIG. 13 in which the constant C is adjusted so that the accuracy rate for the sound signal collected in the music environment is high, as shown in the second to fourth lines of FIG. The correct answer rate for audio signals collected in a music environment is the function F (p (n), R max (x (n))), which is the product minimum value function, product average value function, or power minimum value function. Are 45.00%, 46.25%, and 45.00%, respectively, which are dramatically improved from the 8.75% accuracy rate in the case of the baseline.
また、図13の2行目ないし4行目のノイズレベル調整方式の場合では、関数F(p(n),Rmax(x(n)))として、積最小値関数を採用したときの、ロボット環境で集音した音声信号に対する正解率は、図13の2行目に示すように94.12%であり、ベースラインの場合のロボット環境で集音した音声信号に対する正解率(94.63%)と同程度になっている。 Further, in the case of the noise level adjustment method in the second to fourth lines in FIG. 13, when the product minimum value function is adopted as the function F (p (n), R max (x (n))), The correct answer rate for the voice signal collected in the robot environment is 94.12% as shown in the second line of FIG. 13, which is the same as the correct answer rate (94.63%) for the voice signal collected in the robot environment in the case of the baseline. It is about.
さらに、図13のノイズレベル調整方式の場合において、関数F(p(n),Rmax(x(n)))として、積最小値関数を採用したときの、エアコン環境で集音した音声信号に対する正解率は、図13の2行目に示すように96.25%であり、ベースラインの場合のエアコン環境で集音した音声信号に対する正解率(93.12%)よりも向上している。 Furthermore, in the case of the noise level adjustment method of FIG. 13, the sound signal collected in the air conditioner environment when the product minimum value function is adopted as the function F (p (n), R max (x (n))). As shown in the second line of FIG. 13, the correct answer rate is 96.25%, which is higher than the correct answer rate (93.12%) for the sound signal collected in the air conditioner environment in the case of the baseline.
但し、図13のノイズレベル調整方式の場合において、関数F(p(n),Rmax(x(n)))として、積平均値関数、又はパワー最小値関数を採用したときの、ロボット環境で集音した音声信号に対する正解率は、それぞれ、図13の3行目と4行目に示すように84.94%と89.80%であり、2行目に示した、関数F(p(n),Rmax(x(n)))として、積最小値関数を採用したときの正解率(94.12%)と比較して、多少低下している。 However, in the case of a noise level adjustment method in Figure 13, the function F as (p (n), R max (x (n))), when the product average value function, or a power minimum value function is adopted, a robot environment As shown in the third and fourth lines of FIG. 13, the correct answer ratios for the sound signals collected in the above are 84.94% and 89.80%, respectively, and the function F (p (n), R max (x (n))) is slightly lower than the correct answer rate (94.12%) when the product minimum value function is adopted.
さらに、図13のノイズレベル調整方式の場合において、関数F(p(n),Rmax(x(n)))として、積平均値関数、又はパワー最小値関数を採用したときの、エアコン環境で集音した音声信号に対する正解率も、それぞれ、図13の3行目と4行目に示すように88.12%と93.12%であり、2行目に示した、関数F(p(n),Rmax(x(n)))として、積最小値関数を採用したときの正解率(96.25%)と比較して、多少低下している。 Further, in the case of the noise level adjustment method of FIG. 13, the air conditioner environment when the product average value function or the power minimum value function is adopted as the function F (p (n), R max (x (n))). As shown in the third and fourth lines of FIG. 13, the correct answer rates for the voice signals collected in the above are 88.12% and 93.12%, respectively, and the function F (p (n), R max (x (n))) is slightly lower than the correct answer rate (96.25%) when the product minimum value function is adopted.
一方、定数Cを、ロボット環境やエアコン環境で集音した音声信号に対する正解率が高くなるように調整した図14のノイズレベル調整方式の場合においては、図14の2行目ないし4行目に示すように、音楽環境で集音した音声信号に対する正解率は、関数F(p(n),Rmax(x(n)))として、積最小値関数、積平均値関数、又はパワー最小値関数が採用されたときに、それぞれ、42.50%,17.50%、又は13.75%であり、いずれも、ベースラインの場合の正解率である8.75%から向上している。 On the other hand, in the case of the noise level adjustment method of FIG. 14 in which the constant C is adjusted so that the accuracy rate with respect to the voice signal collected in the robot environment or the air conditioner environment is increased, the second to fourth lines of FIG. As shown, the correct answer rate for the audio signal collected in the music environment is the function F (p (n), R max (x (n))) as the product minimum value function, the product average value function, or the power minimum value. When the function was adopted, they were 42.50%, 17.50%, or 13.75%, respectively, and all improved from 8.75%, which is the correct answer rate in the case of the baseline.
但し、図14のノイズレベル調整方式の場合において、音楽環境で集音した音声信号に対する正解率は、関数F(p(n),Rmax(x(n)))として、積最小値関数が採用されたときには、42.50%であり、関数F(p(n),Rmax(x(n)))として、積平均値関数が採用されたとき(17.50%)や、パワー最小値関数が採用されたとき(13.75%)と比較して、著しく向上している。 However, in the case of the noise level adjustment method of FIG. 14, the correct answer rate for the sound signal collected in the music environment is the function F (p (n), R max (x (n))), and the product minimum value function is When adopted, it is 42.50%, and when the product mean function is adopted (17.50%) as the function F (p (n), R max (x (n))), the power minimum value function is adopted. Compared to when it was done (13.75%).
また、図14の2行目ないし4行目のノイズレベル調整方式の場合では、関数F(p(n),Rmax(x(n)))として、積最小値関数を採用したときの、ロボット環境で集音した音声信号に対する正解率は、図14の2行目に示すように94.78%であり、ベースラインの場合のロボット環境で集音した音声信号に対する正解率(94.63%)と同程度になっている。 Further, in the case of the noise level adjustment method in the second to fourth lines in FIG. 14, when the product minimum value function is adopted as the function F (p (n), R max (x (n))), The correct answer rate for the voice signal collected in the robot environment is 94.78% as shown in the second line of FIG. 14, which is the same as the correct answer rate (94.63%) for the voice signal collected in the robot environment in the case of the baseline. It is about.
さらに、図14のノイズレベル調整方式の場合において、関数F(p(n),Rmax(x(n)))として、積最小値関数を採用したときの、エアコン環境で集音した音声信号に対する正解率は、、図14の2行目に示すように96.25%であり、ベースラインの場合のエアコン環境で集音した音声信号に対する正解率(93.12%)よりも向上している。 Furthermore, in the case of the noise level adjustment method of FIG. 14, the sound signal collected in the air conditioner environment when the product minimum value function is adopted as the function F (p (n), R max (x (n))). As shown in the second line of FIG. 14, the correct answer rate is 96.25%, which is higher than the correct answer rate (93.12%) for the sound signal collected in the air conditioner environment in the case of the baseline.
また、図14のノイズレベル調整方式の場合において、関数F(p(n),Rmax(x(n)))として、積平均値関数、又はパワー最小値関数を採用したときの、ロボット環境で集音した音声信号に対する正解率は、それぞれ、図14の3行目と4行目に示すように94.84%と93.98%であり、2行目に示した、関数F(p(n),Rmax(x(n)))として、積最小値関数を採用したときの正解率(94.78%)と同程度になっている。
In the case of the noise level adjustment method of FIG. 14, the robot environment when the product average value function or the power minimum value function is adopted as the function F (p (n), R max (x (n))). As shown in the third and fourth lines in FIG. 14, the correct answer rates for the voice signals collected in
さらに、図14のノイズレベル調整方式の場合において、関数F(p(n),Rmax(x(n)))として、積平均値関数、又はパワー最小値関数を採用したときの、エアコン環境で集音した音声信号に対する正解率も、それぞれ、図14の3行目と4行目に示すように93.12%と96.25%であり、2行目に示した、関数F(p(n),Rmax(x(n)))として、積最小値関数を採用したときの正解率(96.25%)と同程度になっている。 Furthermore, in the case of the noise level adjustment method of FIG. 14, the air conditioner environment when the product average value function or the power minimum value function is adopted as the function F (p (n), R max (x (n))). As shown in the third and fourth lines of FIG. 14, the correct answer rates for the sound signals collected in the above are 93.12% and 96.25%, respectively, and the function F (p (n), R max (x (n))) is about the same as the correct answer rate (96.25%) when the product minimum value function is adopted.
以上のように、ノイズレベル調整方式の場合において、関数F(p(n),Rmax(x(n)))として、積平均値関数、又はパワー最小値関数を採用したときには、定数Cを、例えば、音楽環境といった特定の環境に適した値に固定すると、その特定の環境(例えば、音楽環境)で集音した音声信号に対する正解率は高くなるが、例えば、ロボット環境やエアコン環境などの別の環境で集音した音声信号に対する正解率は低くなる。したがって、関数F(p(n),Rmax(x(n)))として、積平均値関数、又はパワー最小値関数を採用したときには、入力信号X(t)としての音声信号に含まれるノイズの種類によって、正解率が比較的変動するので、ノイズロバストネス(noise robustness)が低いということができる。 As described above, in the case of the noise level adjustment method, when the product average value function or the power minimum value function is adopted as the function F (p (n), R max (x (n))), the constant C is set to For example, if the value is fixed to a value suitable for a specific environment such as a music environment, the correct answer rate for a sound signal collected in the specific environment (for example, a music environment) is increased. The accuracy rate for an audio signal collected in another environment is low. Therefore, when the product average value function or the power minimum value function is adopted as the function F (p (n), R max (x (n))), the noise included in the audio signal as the input signal X (t) Since the accuracy rate varies relatively depending on the type, it can be said that the noise robustness is low.
一方、ノイズレベル調整方式の場合において、関数F(p(n),Rmax(x(n)))として、積最小値関数を採用したときには、定数Cを、特定の環境に適した値に固定しても、音楽環境、ロボット環境、又はエアコン環境のうちのいずれの環境で集音した音声信号に対する正解率も、高い値を維持することができる。したがって、関数F(p(n),Rmax(x(n)))として、積最小値関数を採用したときには、入力信号X(t)としての音声信号に含まれているノイズの種類によらず、高い正解率を得ることができる。 On the other hand, in the case of the noise level adjustment method, when the product minimum value function is adopted as the function F (p (n), R max (x (n))), the constant C is set to a value suitable for a specific environment. Even if it is fixed, the correct answer rate for the sound signal collected in any of the music environment, the robot environment, and the air conditioner environment can be maintained at a high value. Therefore, when the product minimum value function is adopted as the function F (p (n), R max (x (n))), it depends on the type of noise included in the audio signal as the input signal X (t). Therefore, a high accuracy rate can be obtained.
ここで、積最小値関数は、連続するNフレームのそれぞれについての、フレームパワーp(n)とラグ範囲最大相関Rmax(x(n))との積p(n)×Rmax(x(n))のうちの最小値を求める関数であり、積平均値関数は、連続するNフレームのそれぞれについての積p(n)×Rmax(x(n))の平均値を求める関数であるから、積p(n)×Rmax(x(n))の最小値を用いる場合には、その積p(n)×Rmax(x(n))の平均値を用いる場合に比較して、例えば、音声区間の検出において高い正解率が得られるといったように、効果的であるいうことができる。 Here, the product minimum value function is the product p (n) × R max (x () of the frame power p (n) and the maximum lag range correlation R max (x (n)) for each of consecutive N frames. n)) is a function for obtaining a minimum value, and a product average value function is a function for obtaining an average value of products p (n) × R max (x (n)) for each of consecutive N frames. from, in the case of using the minimum value of the product p (n) × R max ( x (n)) , compared to the case of using the average value of the product p (n) × R max ( x (n)) For example, it can be said that it is effective so that a high accuracy rate can be obtained in the detection of the speech section.
また、積最小値関数は、連続するNフレームのそれぞれについての、フレームパワーp(n)とラグ範囲最大相関Rmax(x(n))との積p(n)×Rmax(x(n))の最小値を求める関数であり、パワー最小値関数は、連続するNフレームのそれぞれについてのフレームパワーp(n)の最小値を求める関数であるから、フレームパワーp(n)のみならず、ラグ範囲最大相関Rmax(x(n))を用いる場合には、フレームパワーp(n)だけを用いる場合に比較して、やはり、例えば、音声区間の検出において高い正解率が得られるといったように、効果的であるいうことができる。 The product minimum value function is the product p (n) × R max (x (n) of the frame power p (n) and the maximum lag range correlation R max (x (n)) for each of consecutive N frames. )) Is a function for determining the minimum value, and the power minimum value function is a function for determining the minimum value of the frame power p (n) for each of the consecutive N frames. When using the lag range maximum correlation R max (x (n)), compared to using only the frame power p (n), for example, it is possible to obtain a higher accuracy rate in the detection of the speech section. It can be said that it is effective.
なお、入力信号X(t)としての音声信号にノイズを付加したノイズ付加信号Y(t)のラグ範囲最大相関Rmax(y(n))を、音声信号の特徴量として用いて行う音声処理は、音声区間の検出に限られるものではない。すなわち、ノイズ付加信号Y(t)のラグ範囲最大相関Rmax(y(n))は、例えば、音声認識や、韻律認識、さらには、非特許文献7に記載されているような基本周波数の検出(ピッチの検出)等の音声処理において、音声信号の特徴量として用いることができる。 Note that audio processing is performed using the lag range maximum correlation R max (y (n)) of the noise-added signal Y (t) obtained by adding noise to the audio signal as the input signal X (t) as the feature quantity of the audio signal. Is not limited to the detection of speech segments. In other words, the lag range maximum correlation R max (y (n)) of the noise added signal Y (t) is, for example, that of the fundamental frequency as described in speech recognition, prosody recognition, or non-patent document 7. In voice processing such as detection (pitch detection), it can be used as a feature amount of a voice signal.
以上のように、入力信号X(t)の自己相関としてのラグ範囲自己相関Rmax(x(n))と、パワーとしてのフレームパワーp(n)とに基づき、入力信号X(t)に付加するノイズgの大きさを表すゲイン情報としてのゲインgain(n)を求め、入力信号X(t)に、ゲインgain(n)に応じた大きさのノイズC×gain(n)×gを付加したノイズ付加信号Y(t)の自己相関としてのラグ範囲自己相関Rmax(y(n))を、入力信号X(t)の特徴量として求めるノイズミックスRmax計算処理によれば、入力信号X(t)の周期性がある区間、すなわち、例えば、特に、有声音等の音声区間を精度良く検出すること等ができる自己相関としてのラグ範囲自己相関Rmax(y(n))を求めることができる。 As described above, based on the lag range autocorrelation R max (x (n)) as the autocorrelation of the input signal X (t) and the frame power p (n) as the power, the input signal X (t) Gain gain (n) as gain information indicating the magnitude of noise g to be added is obtained, and noise C × gain (n) × g having a magnitude corresponding to gain gain (n) is input signal X (t). According to the noise mix R max calculation processing for obtaining the lag range autocorrelation R max (y (n)) as the autocorrelation of the added noise added signal Y (t) as the feature quantity of the input signal X (t), the input Lag range autocorrelation R max (y (n)) as an autocorrelation that can accurately detect an interval where the signal X (t) has periodicity, for example, a voice interval such as voiced sound, in particular. Can be sought.
また、例えば、前述した非特許文献6に記載の方法では、第1段階の処理として、入力信号の自己相関を用いた特徴量を求め、その特徴量に基づき入力信号全体に対して、大まかに、音声区間と非音声区間の判定を行い、非音声区間と判定された区間の入力信号の分散を利用して、入力信号に付加するガウスノイズのレベルの決定を行い、第2段階の処理として、入力信号に、第1段階の処理で決定したレベルのガウスノイズを付加したノイズ付加信号の自己相関を用いた特徴量として、ラグ範囲最大相関を求める。 Further, for example, in the method described in Non-Patent Document 6 described above, as a first stage process, a feature amount using autocorrelation of the input signal is obtained, and the entire input signal is roughly determined based on the feature amount. As a second stage process, the speech segment and the non-speech segment are determined, the level of the Gaussian noise added to the input signal is determined using the variance of the input signal determined as the non-speech segment. The maximum correlation of the lag range is obtained as a feature amount using the autocorrelation of the noise-added signal obtained by adding the Gaussian noise of the level determined in the first stage processing to the input signal.
すなわち、非特許文献6に記載の方法では、第1段階の処理において、入力信号全体を処理して入力信号の自己相関を求め、入力信号に付加するガウスノイズのレベルを決定する。 That is, in the method described in Non-Patent Document 6, in the first stage processing, the entire input signal is processed to obtain the autocorrelation of the input signal, and the level of Gaussian noise added to the input signal is determined.
したがって、非特許文献6に記載の方法では、入力信号全体を処理してその自己相関を求めるまでは、第2段階の処理によって特徴量を求めることができないため、特徴量を求めるまでに、大きな時間遅れが生じる。そして、特徴量を用いて行われる、例えば、音声認識や音声区間の検出等の音声処理には、一般に、実時間性が要求されるため、大きな時間遅れが生じることは、好ましくない。 Therefore, in the method described in Non-Patent Document 6, the feature amount cannot be obtained by the second stage processing until the entire input signal is processed and its autocorrelation is obtained. A time delay occurs. For example, speech processing such as speech recognition and speech section detection performed using feature amounts generally requires real-time characteristics, and it is not preferable that a large time delay occurs.
一方、ノイズミックスRmax計算処理では、ゲインgain(n)を求める関数F(p(n),Rmax(x(n)))によって、連続するNフレームのそれぞれについての、フレームパワーp(n)とラグ範囲最大相関Rmax(x(n))との積p(n)×Rmax(x(n))のうちの最小値を求めるときに、そのNフレーム分の遅延が生じるが、入力信号X(t)全体を処理するような大きな時間遅れは生じないので、音声認識や音声区間の検出等の実時間性が要求される音声処理に用いられる特徴量を求める処理として、ノイズミックスRmax計算処理を採用しても、実時間性にほとんど影響しない。 On the other hand, in the noise mix R max calculation processing, the frame power p (n for each of the consecutive N frames is calculated by the function F (p (n), R max (x (n))) for obtaining the gain gain (n). ) And the lag range maximum correlation R max (x (n)), when obtaining the minimum value of the product p (n) × R max (x (n)), a delay of N frames occurs. Since there is no large time delay that processes the entire input signal X (t), noise mixing is used as a process for obtaining features used in speech processing that requires real-time performance such as speech recognition and speech section detection. Even if R max calculation processing is adopted, real-time property is hardly affected.
また、非特許文献6に記載の方法は、第1段階の処理において、入力信号全体から、入力信号に付加するガウスノイズのレベルを決定するので、入力信号に含まれる音声成分や周期ノイズのレベルが時間とともに変化する入力信号の処理には不向きである。 In the method described in Non-Patent Document 6, the level of Gaussian noise added to the input signal is determined from the entire input signal in the first stage processing. Is not suitable for processing an input signal that changes with time.
これに対して、ノイズミックスRmax計算処理によれば、ゲインgain(n)を求める関数F(p(n),Rmax(x(n)))によって、連続するNフレームのそれぞれについての、フレームパワーp(n)とラグ範囲最大相関Rmax(x(n))との積p(n)×Rmax(x(n))のうちの最小値を求めるときに、そのNフレームの区間が参照されるだけなので、入力信号に含まれる音声成分や周期ノイズのレベルが時間とともに変化する入力信号についても、入力信号X(t)の周期性がある区間を精度良く検出すること等ができるラグ範囲自己相関Rmax(y(n))を求めることができる。 In contrast, according to the noise mixes R max calculation processing function obtains the gain gain (n) F by (p (n), R max (x (n))), for each of N consecutive frames, When obtaining the minimum value of the product p (n) x R max (x (n)) of the frame power p (n) and the lag range maximum correlation R max (x (n)), the interval of the N frame Therefore, it is possible to accurately detect a period where the input signal X (t) has a periodicity even for an input signal in which the level of the sound component or periodic noise included in the input signal changes with time. The lag range autocorrelation R max (y (n)) can be determined.
以上、周期性を表す周期性情報として自己相関を用いた場合について説明したが、YIN等を用いても同様の処理が可能である。 The case where autocorrelation is used as periodicity information representing periodicity has been described above, but the same processing can be performed using YIN or the like.
次に、上述したように、ノイズミックスRmax計算処理では、入力信号X(t)に、ゲインgain(n)に応じた大きさのノイズC×gain(n)×gを付加したノイズ付加信号Y(t)のラグ範囲自己相関Rmax(y(n))が求められるが、入力信号X(t)に付加するノイズとしての、例えば、ガウスノイズには、その特性にばらつきがある。 Next, as described above, in the noise mix R max calculation process, a noise addition signal obtained by adding noise C × gain (n) × g having a magnitude corresponding to the gain gain (n) to the input signal X (t). The lag range autocorrelation R max (y (n)) of Y (t) is obtained. For example, Gaussian noise as noise added to the input signal X (t) has variations in its characteristics.
そして、入力信号X(t)の周期性がある区間を精度良く検出すること等ができるラグ範囲自己相関Rmax(y(n))を求めるには、入力信号X(t)に付加するガウスノイズとして、適切な特性のガウスノイズを採用することが重要である。 Then, in order to obtain the lag range autocorrelation R max (y (n)) that can accurately detect an interval with periodicity of the input signal X (t), the Gaussian added to the input signal X (t) It is important to adopt Gaussian noise with appropriate characteristics as noise.
すなわち、図3のガウスノイズ生成部17では、入力信号X(t)に付加するガウスノイズとして、入力信号X(t)のフレーム長Tと同一のサンプル数Tのガウスノイズgが生成されるが、いま、サンプル数Tのガウスノイズgの正規化自己相関R(g,τ)の、基本周波数範囲に相当するラグτの範囲での最大値Rmax(g)である、ガウスノイズgのラグ範囲最大相関Rmax(g)は、0に近い値であることが望ましい。
That is, the
つまり、ラグ範囲自己相関Rmax(y(n))が、入力信号X(t)の周期性がある区間を精度良く検出すること等ができるラグ範囲自己相関Rmax(y(n))であるためには、ラグ範囲自己相関Rmax(y(n))が、非音声区間において、0に近い値(理想的には、0)となる必要がある。 That is, the lag range autocorrelation R max (y (n)) is the lag range periodicity certain section can or the like for accurately detecting of the input signal X (t) autocorrelation R max (y (n)) In order to exist, the lag range autocorrelation R max (y (n)) needs to be a value close to 0 (ideally 0) in the non-voice interval.
ラグ範囲自己相関Rmax(y(n))が、非音声区間において、0に近い値となるには、入力信号X(t)に付加するガウスノイズgのラグ範囲最大相関Rmax(g)が、0に近い値でなければならない。 In order for the lag range autocorrelation R max (y (n)) to be close to 0 in the non-voice interval, the lag range maximum correlation R max (g) of the Gaussian noise g added to the input signal X (t) is Must be close to zero.
しかしながら、ガウスノイズgのサンプル数Tが十分大である場合には、ガウスノイズgのラグ範囲最大相関Rmax(g)は0に近い値となるが、ガウスノイズgのサンプル数Tが十分大でない場合には、ガウスノイズgのラグ範囲最大相関Rmax(g)は、その値にばらつきが生じ、0に近い値にならないことがある。 However, when the sample number T of the Gaussian noise g is sufficiently large, the maximum lag range correlation R max (g) of the Gaussian noise g is close to 0, but the sample number T of the Gaussian noise g is sufficiently large. Otherwise, the lag range maximum correlation R max (g) of the Gaussian noise g may vary in value and may not be close to 0.
ここで、図15は、ガウスノイズgのラグ範囲最大相関Rmax(g)を示している。 Here, FIG. 15 shows the lag range maximum correlation R max (g) of the Gaussian noise g.
すなわち、図15は、サンプル数Tが1024の、異なる時系列のガウスノイズgを1000回生成し、その結果得られた1000個のガウスノイズgのラグ範囲最大相関Rmax(g)を昇順に並べたものを示している。 That is, FIG. 15 shows that 1000 different Gaussian noises g having a number of samples T of 1024 are generated 1000 times, and the resulting lag range maximum correlation R max (g) of 1000 Gaussian noises g is ascending order. Shows what was arranged.
なお、図15において、横軸は、1000個のガウスノイズgのラグ範囲最大相関Rmax(g)を昇順に並べたときの順位を表し、縦軸は、ガウスノイズgのラグ範囲最大相関Rmax(g)を表す。 In FIG. 15, the horizontal axis represents the rank when 1000 gauss noise g lag range maximum correlations R max (g) are arranged in ascending order, and the vertical axis represents the lag range maximum correlation R of Gaussian noise g. Represents max (g).
1000個のガウスノイズgそれぞれのラグ範囲最大相関Rmax(g)は、0.07ないし0.2程度の範囲に分布しており、ばらつきがあることが分かる。 The lag range maximum correlation R max (g) of each of the 1000 Gaussian noises g is distributed in a range of about 0.07 to 0.2, and it can be seen that there is variation.
図16及び図17は、1000個のガウスノイズgのうちの、ラグ範囲最大相関Rmax(g)が最大のガウスノイズgmaxを入力信号X(t)に付加して得られるノイズ付加信号Y(t)のラグ範囲最大相関Rmax(y(n))と、ラグ範囲最大相関Rmax(g)が最小のガウスノイズgminを入力信号X(t)に付加して得られるノイズ付加信号Y(t)のラグ範囲最大相関Rmax(y(n))とを示している。 FIGS. 16 and 17 show the noise added signal Y obtained by adding the Gaussian noise g max having the maximum lag range correlation R max (g) to the input signal X (t) out of 1000 pieces of Gaussian noise g. Noise added signal obtained by adding maximum lag range correlation R max (y (n)) of (t) and Gaussian noise g min with minimum lag range maximum correlation R max (g) to input signal X (t) The lag range maximum correlation R max (y (n)) of Y (t) is shown.
なお、図16及び図17において、横軸は、時間(横軸の1単位は0.01秒に相当する)を表す。また、図16及び図17において、縦長の長方形で囲んである部分が、音声区間を表す。 16 and 17, the horizontal axis represents time (one unit on the horizontal axis corresponds to 0.01 second). Further, in FIGS. 16 and 17, a portion surrounded by a vertically long rectangle represents a voice section.
図16上から1番目は、入力信号X(t)のラグ範囲最大相関Rmax(x(n))を示している。 1 position from the top FIG. 16 shows the lag range maximum correlation R max of the input signal X (t) (x (n )).
図16上から2番目は、上述の1000個のガウスノイズgのうちの、ラグ範囲最大相関Rmax(g)が最大(ここでは、図15で説明した0.2)のガウスノイズgmaxを、1番目に示した入力信号X(t)に付加して得られるノイズ付加信号Y(t)のラグ範囲最大相関Rmax(y(n))を示しており、図16上から3番目は、ラグ範囲最大相関Rmax(g)が最小(ここでは、図15で説明した0.07)のガウスノイズgminを、1番目に示した入力信号X(t)に付加して得られるノイズ付加信号Y(t)のラグ範囲最大相関Rmax(y(n))を示している。 The second from the top 16, of the 1000 Gaussian noise g above, lugs range maximum correlation R max (g) up to (in this case, described in FIG. 15 0.2) Gaussian noise g max of 1 16 shows the lag range maximum correlation R max (y (n)) of the noise added signal Y (t) obtained by adding to the input signal X (t) shown in FIG. The noise addition signal Y () obtained by adding the Gaussian noise g min having the minimum range maximum correlation R max (g) (here, 0.07 described in FIG. 15) to the input signal X (t) shown first. The lag range maximum correlation R max (y (n)) of t) is shown.
図17上から1番目は、図16とは異なる入力信号X(t)のラグ範囲最大相関Rmax(x(n))を示している。 17 shows the lag range maximum correlation R max (x (n)) of the input signal X (t) different from that in FIG.
図17上から2番目は、図16上から2番目と同様に、ラグ範囲最大相関Rmax(g)が最大のガウスノイズgmaxを、1番目に示した入力信号X(t)に付加して得られるノイズ付加信号Y(t)のラグ範囲最大相関Rmax(y(n))を示しており、図17上から3番目は、図16上から3番目と同様に、ラグ範囲最大相関Rmax(g)が最小のガウスノイズgminを、1番目に示した入力信号X(t)に付加して得られるノイズ付加信号Y(t)のラグ範囲最大相関Rmax(y(n))を示している。 The second from the top in FIG. 17 adds the Gaussian noise g max having the maximum lag range maximum correlation R max (g) to the input signal X (t) shown first, as in the second from the top in FIG. The maximum lag range correlation R max (y (n)) of the noise-added signal Y (t) obtained in this way is shown, and the third from the top in FIG. 17 is the same as the third from the top in FIG. Maximum correlation R max (y (n)) of the lag range of the noise added signal Y (t) obtained by adding the Gaussian noise g min having the smallest R max (g) to the input signal X (t) shown first ).
図16及び図17から、入力信号X(t)に付加するガウスノイズgのラグ範囲最大相関Rmax(g)が、入力信号x(t)にガウスノイズgを付加したノイズ付加信号Y(t)のラグ範囲最大相関Rmax(y(n))に大きく影響することが分かる。 16 and 17, the lag range maximum correlation R max (g) of the Gaussian noise g added to the input signal X (t) is the noise added signal Y (t) in which the Gaussian noise g is added to the input signal x (t). It can be seen that the lag range maximum correlation R max (y (n)) of FIG.
すなわち、入力信号X(t)に、ラグ範囲最大相関Rmax(g)が最大のガウスノイズgmaxを付加したノイズ付加信号Y(t)のラグ範囲最大相関Rmax(y(n))は、図16及び図17の上から2番目に示すように、非音声区間で、0.2程度と大になる。 That is, the lag range maximum correlation R max (y (n)) of the noise added signal Y (t) obtained by adding the Gaussian noise g max with the maximum lag range maximum correlation R max (g) to the input signal X (t) is As shown second from the top in FIGS. 16 and 17, in the non-speech section, it becomes as large as about 0.2.
これに対して、入力信号X(t)に、ラグ範囲最大相関Rmax(g)が最小のガウスノイズgminを付加したノイズ付加信号Y(t)のラグ範囲最大相関Rmax(y(n))は、図16及び図17の上から3番目に示すように、非音声区間で、0.07程度と小になる。 In contrast, the input signal X (t), the lag range maximum correlation R max (g) minimal Gaussian noise g lag range maximum correlation min by adding noise added signal Y (t) R max (y (n )) Is as small as about 0.07 in the non-voice interval, as shown in the third from the top in FIGS.
したがって、入力信号X(t)に対しては、ラグ範囲最大相関Rmax(g)がより小さいガウスノイズgを付加することにより、非音声区間で値が小さくなる、ノイズ付加信号Y(t)のラグ範囲最大相関Rmax(y(n))、すなわち、入力信号X(t)の周期性がある区間を精度良く検出すること等ができるラグ範囲自己相関Rmax(y(n))を求めることができる。 Therefore, for the input signal X (t), by lugs range maximum correlation R max (g) is added a smaller Gaussian noise g, the value in the non-speech interval is reduced, the noise addition signal Y (t) lag range maximum correlation R max (y (n)) , i.e., the lag range autocorrelation R max of the periodicity is the interval can or the like for accurately detecting of the input signal X (t) and (y (n)) Can be sought.
そこで、図3のガウスノイズ生成部17では、ラグ範囲最大相関Rmax(g)がより小さいガウスノイズgを、ノイズミックス部18に供給させるようにすることができる。
Therefore, in the Gaussian
すなわち、図18は、ラグ範囲最大相関Rmax(g)がより小さいガウスノイズgを、ノイズミックス部18に供給するガウスノイズ生成部17の構成例を示している。
That is, FIG. 18 illustrates a configuration example of the Gaussian
ノイズ生成部71は、サンプル数がフレーム長Tに等しく、複数であるM個の、異なる時系列のガウスノイズg(1),g(2),・・・,g(M)を生成し、正規化自己相関計算部72とノイズ選択部74に供給する。
The
正規化自己相関計算部72は、ノイズ生成部71から供給されるM個のガウスノイズg(m)それぞれについて(m=1,2,・・・,M)、正規化自己相関R(g(m),τ)を求め、Rmax計算部73に供給する。
The normalized
Rmax計算部73は、正規化自己相関計算部72から供給される、M個のガウスノイズg(m)の正規化自己相関R(g(m),τ)それぞれについて、基本周波数範囲に相当するラグτの範囲での最大値であるラグ範囲最大相関Rmax(g(m))を求め、ノイズ選択部74に供給する。
The R max calculation unit 73 corresponds to the fundamental frequency range for each of the normalized autocorrelations R (g (m), τ) of the M Gaussian noises g (m) supplied from the normalized
ノイズ選択部74は、ノイズ生成部71から供給されるM個のガウスノイズg(m)の中から、その自己相関としての、Rmax計算部73から供給されるラグ範囲最大相関Rmax(g(m))が最小のガウスノイズを選択し、入力信号X(t)に付加するガウスノイズgとして、ノイズミックス部18(図3)に供給する。
The
次に、図19のフローチャートを参照して、図18に示した構成の図3のガウスノイズ生成部17が、図4のステップS12で行う処理について説明する。
Next, with reference to the flowchart of FIG. 19, the process performed by the Gaussian
ステップS51において、ノイズ生成部71は、M個のガウスノイズg(m)を生成し、正規化自己相関計算部72とノイズ選択部74に供給して、ステップS52に進む。
In step S51, the
ステップS52では、正規化自己相関計算部72は、ノイズ生成部71からのM個のガウスノイズg(m)それぞれについて、正規化自己相関R(g(m),τ)を求め、Rmax計算部73に供給して、ステップS53に進む。
In step S52, the normalized
ステップS53では、Rmax計算部73は、正規化自己相関計算部72からのM個のガウスノイズg(m)の正規化自己相関R(g(m),τ)それぞれのラグ範囲最大相関Rmax(g(m))を求め、ノイズ選択部74に供給して、ステップS54に進む。
In step S <b> 53, the R max calculation unit 73 calculates the lag range maximum correlation R of each of the normalized autocorrelation R (g (m), τ) of the M Gaussian noises g (m) from the normalized
ステップS54では、ノイズ選択部74は、ノイズ生成部71からのM個のガウスノイズg(m)の中から、Rmax計算部73からのラグ範囲最大相関Rmax(g(m))が最小のガウスノイズを選択し、入力信号X(t)に付加するガウスノイズgとして、ノイズミックス部18(図3)に供給してリターンする。
In step S <b> 54, the
なお、ガウスノイズ生成部17では、ステップS51ないしS54の処理を一度行えば良く、その後は、ステップS54で選択したガウスノイズgを、ノイズミックス部18に供給するようにすれば良い。
Note that the Gaussian
また、図18及び図19では、ガウスノイズg(m)のラグ範囲最大相関Rmax(g(m))に基づいて、M個のガウスノイズg(m)の中から、ノイズミックス部18に供給するガウスノイズgを選択するようにしたが、M個のガウスノイズg(m)の中からの、ノイズミックス部18に供給するガウスノイズgの選択は、その他、例えば、入力信号X(t)にM個のガウスノイズg(m)それぞれを付加したM個のノイズ付加信号Y(t)のラグ範囲最大相関Rmax(y(n))に基づいて行うことが可能である。
Further, in FIGS. 18 and 19, the
すなわち、例えば、ノイズミックス部18に供給するガウスノイズgを選択するのに用いる選択用の入力信号X(t)を、あらかじめ用意しておき、その選択用の入力信号X(t)に、M個のガウスノイズg(m)をそれぞれ付加したM個のノイズ付加信号Ym(t)それぞれについて、M個のラグ範囲最大相関Rmax(ym(n))を求める。
That is, for example, a selection input signal X (t) used to select the Gaussian noise g to be supplied to the
そして、そのM個のノイズ付加信号Ym(t)のラグ範囲最大相関Rmax(ym(n))それぞれに基づき、選択用の入力信号X(t)について、音声区間の検出を行い、M個のガウスノイズg(m)の中から、正解率が最も高いラグ範囲最大相関Rmax(ym(n))が求められたノイズ付加信号Ym(t)に付加されたガウスノイズg(m)を、ノイズミックス部18に供給するガウスノイズgとして選択することができる。
Then, based on each of the lag range maximum correlation R max (y m (n)) of the M noise addition signals Y m (t), the speech section is detected for the input signal X (t) for selection, Gaussian noise g added to noise-added signal Y m (t) for which the maximum correlation ratio R max (y m (n)) with the highest accuracy is obtained from M Gaussian noises g (m) (m) can be selected as the Gaussian noise g supplied to the
次に、図3の信号処理装置で行われるノイズミックスRmax計算処理では、ゲインgain(n)を求める関数F(p(n),Rmax(x(n)))として、連続するNフレームのそれぞれについての、フレームパワーp(n)とラグ範囲最大相関Rmax(x(n))との積p(n)×Rmax(x(n))のうちの最小値を求める積最小値関数や、その積p(n)×Rmax(x(n))の平均値を求める積平均値関数を採用した場合には、正規化自己相関計算部13において、入力信号X(t)の正規化自己相関R(x(n),τ)を求め、さらに、正規化自己相関計算部19において、ノイズ付加信号Y(t)の正規化自己相関R(y(n),τ)を求める必要があるから、自己相関の計算を2回行う必要がある。
Next, in the noise mix R max calculation process performed in the signal processing device of FIG. 3, as a function F (p (n), R max (x (n))) for obtaining the gain gain (n), consecutive N frames Product minimum value for obtaining the minimum value of the products p (n) × R max (x (n)) of the frame power p (n) and the maximum lag range correlation R max (x (n)) When a product average function that obtains an average value of a function or its product p (n) × R max (x (n)) is employed, the normalized
このように、ノイズミックスRmax計算処理では、処理を、いわば忠実に行う場合には、自己相関の計算を2回行う必要があるが、近似を行うことにより、自己相関の計算を1回で済まし、これにより、計算量を低減することができる。 As described above, in the noise mix R max calculation processing, when processing is performed so to speak, it is necessary to calculate the autocorrelation twice. However, by performing approximation, the autocorrelation calculation can be performed once. As a result, the amount of calculation can be reduced.
すなわち、入力信号X(t)のn番目のフレームx(n)のラグ範囲最大相関Rmax(x(n))は、次式で求められる。 That is, the lag range maximum correlation R max (x (n)) of the nth frame x (n) of the input signal X (t) is obtained by the following equation.
![]()
![]()
ここで、式(2)において、R'(x(n),τ)は、フレームx(n)の正規化前自己相関であり、R'(x(n),0)は、ラグτが0のときの正規化前自己相関であるから、R'(x(n),τ)/R'(x(n),0)は、フレームx(n)の正規化自己相関である。 Here, in Equation (2), R ′ (x (n), τ) is an autocorrelation before normalization of frame x (n), and R ′ (x (n), 0) Since the autocorrelation before normalization is 0, R ′ (x (n), τ) / R ′ (x (n), 0) is the normalized autocorrelation of the frame x (n).
さらに、式(2)において、ラグτが下にあるargmax{}は、基本周波数範囲に相当するラグτの範囲での、かっこ{}内の最大値を表す。 Furthermore, in equation (2), argmax {} with the lag τ below represents the maximum value in parentheses {} within the lag τ range corresponding to the fundamental frequency range.
また、ノイズ付加信号Y(t)のn番目のフレームy(n)のラグ範囲最大相関Rmax(y(n))は、フレームy(n)の正規化前自己相関R'(y(n),τ)と、ラグτが0のときの正規化前自己相関R'(y(n),0)とを用いて、上述の式(2)と同様の次式で求められる。 Also, the lag range maximum correlation R max (y (n)) of the nth frame y (n) of the noise added signal Y (t) is the autocorrelation R ′ (y (n (n)) before normalization of the frame y (n). ), τ) and the auto-correlation R ′ (y (n), 0) before normalization when the lag τ is 0, the following equation similar to the above equation (2) is obtained.
![]()
![]()
ところで、図3のノイズミックス部18において、ノイズ付加信号Y(t)のフレームy(n)を得るために、入力信号X(t)のフレームx(n)に付加される、フレーム長Tと同一のサンプル数Tのノイズを、g(n)と表すと、ノイズ付加信号Y(t)のフレームy(n)は、式y(n)=x(n)+g(n)で表される。
Incidentally, in the
さらに、フレーム長がTのフレームx(n)の先頭のサンプル値を、x[t]と表すと、フレームx(n)の、例えば、最後のサンプル値は、x[t+T-1]と表すことができる。同様に、サンプル数がTのノイズg(n)の先頭のサンプル値を、g[t]と表すと、ノイズg(n)の、例えば、最後のサンプル値は、g[t+T-1]と表すことができる。 Furthermore, if the first sample value of the frame x (n) with the frame length T is expressed as x [t], for example, the last sample value of the frame x (n) is x [t + T-1] It can be expressed as. Similarly, when the first sample value of the noise g (n) having the number of samples T is expressed as g [t], for example, the last sample value of the noise g (n) is g [t + T-1 ]It can be expressed as.
この場合、式(3)右辺における正規化前自己相関R'(y(n),τ)は、式(4)で表される。 In this case, the autocorrelation R ′ (y (n), τ) before normalization on the right side of Expression (3) is expressed by Expression (4).
ここで、式(2)及び式(3)のargmax{}を求めるにあたって用いられる基本周波数範囲に相当するラグτの範囲は大きいので、式(4)右辺の2行目の第2項である、ノイズg(n)の正規化前自己相関R'(g(n),τ)は、0に近似することができる。 Here, since the range of the lag τ corresponding to the fundamental frequency range used for obtaining argmax {} in the equations (2) and (3) is large, it is the second term in the second row on the right side of the equation (4). The autocorrelation R ′ (g (n), τ) before normalization of the noise g (n) can be approximated to zero.
また、ノイズg(n)と入力信号X(t)のフレームx(n)との間に、相関はない(と仮定することができる)ので、式(4)右辺の2行目の第3項の、ノイズg(n)とフレームx(n)との相互相関(1/T)Σ{x[i]g[i+τ]+x[i+τ]g(i)}は、0に近似することができる。 In addition, since there is no correlation between the noise g (n) and the frame x (n) of the input signal X (t) (it can be assumed), the third line in the second row on the right side of Equation (4) The cross-correlation (1 / T) Σ {x [i] g [i + τ] + x [i + τ] g (i)} between the noise g (n) and the frame x (n) is 0 Can be approximated.
したがって、式(4)左辺の正規化前自己相関R'(y(n),τ)は、式R'(y(n),τ)=R'(x(n),τ)で近似することができる。すなわち、ノイズ付加信号Y(t)のフレームy(n)の正規化前自己相関R'(y(n),τ)は、入力信号X(t)のフレームx(n)の正規化前自己相関R'(x(n),τ)で近似することができる。 Therefore, the autocorrelation R ′ (y (n), τ) before normalization on the left side of the equation (4) is approximated by the equation R ′ (y (n), τ) = R ′ (x (n), τ). be able to. That is, the pre-normalization autocorrelation R ′ (y (n), τ) of the frame y (n) of the noise added signal Y (t) is the self-normalization of the frame x (n) of the input signal X (t). It can be approximated by the correlation R ′ (x (n), τ).
以上のように、ノイズ付加信号Y(t)のフレームy(n)の正規化前自己相関R'(y(n),τ)を、入力信号X(t)のフレームx(n)の正規化前自己相関R'(x(n),τ)で近似することにより、ノイズ付加信号Y(t)のフレームy(n)の正規化自己相関R(y(n),τ)、つまり、式(3)右辺のargmax{}内の正規化自己相関R'(y(n),τ)/R'(y(n),0)(=R'(y(n),τ)/R'(x(n)+g(n),0))は、次式で表される。 As described above, the autocorrelation R ′ (y (n), τ) before normalization of the frame y (n) of the noise added signal Y (t) is converted into the normality of the frame x (n) of the input signal X (t). By approximating with autocorrelation R ′ (x (n), τ) before normalization, normalized autocorrelation R (y (n), τ) of frame y (n) of noise added signal Y (t), that is, Expression (3) Normalized autocorrelation R ′ (y (n), τ) / R ′ (y (n), 0) (= R ′ (y (n), τ) / R in argmax {} on the right side '(x (n) + g (n), 0)) is expressed by the following equation.
上述したように、ノイズg(n)と入力信号X(t)のフレームx(n)との間に、相関はないので、式(5)右辺の2行目の分母における第3項の、ノイズg(n)とフレームx(n)との相互相関(1/T)Σ{x[i]g[i+τ]+x[i+τ]g(i)}は、0に近似することができる。 As described above, since there is no correlation between the noise g (n) and the frame x (n) of the input signal X (t), the third term in the denominator of the second row on the right side of Equation (5) Cross correlation (1 / T) Σ {x [i] g [i + τ] + x [i + τ] g (i)} between noise g (n) and frame x (n) approximates 0 be able to.
この場合、式(5)のノイズ付加信号Y(t)のフレームy(n)の正規化自己相関R(y(n),τ)は、式R(y(n),τ)=R'(x(n),τ)/{R'(x(n),0)+R'(g(n),0)}で近似することができる。 In this case, the normalized autocorrelation R (y (n), τ) of the frame y (n) of the noise-added signal Y (t) in Expression (5) is expressed by the following expression: R (y (n), τ) = R ′ It can be approximated by (x (n), τ) / {R ′ (x (n), 0) + R ′ (g (n), 0)}.
この式R(y(n),τ)=R'(x(n),τ)/{R'(x(n),0)+R'(g(n),0)}における分母にあるR'(g(n),0)は、ラグτが0のときのノイズg(n)の正規化前自己相関であるが、このラグτが0のときの正規化前自己相関R'(g(n),0)は、ノイズg(n)の各サンプル値の自乗の総和(自乗パワー)に等しいので、ノイズg(n)の正規化前自己相関R'(g(n),τ)を計算しなくても求めることができる。 In this expression R (y (n), τ) = R '(x (n), τ) / {R' (x (n), 0) + R '(g (n), 0)} R ′ (g (n), 0) is a pre-normalization autocorrelation of noise g (n) when lag τ is 0, but before normalization R ′ ( Since g (n), 0) is equal to the sum of squares (square power) of each sample value of noise g (n), auto-correlation R ′ (g (n), τ before noise g (n) is normalized. ) Can be obtained without calculating.
以上のように、ノイズ付加信号Y(t)の正規化自己相関R(y(n),τ)は、式R(y(n),τ)=R'(x(n),τ)/{R'(x(n),0)+R'(g(n),0)}で近似することができ、この式R(y(n),τ)=R'(x(n),τ)/{R'(x(n),0)+R'(g(n),0)}を、式(3)のargmax{}のかっこ{}内のR'(y(n),τ)/R'(y(n),0)、つまり、正規化自己相関R(y(n),τ)に代入することにより、式(3)のノイズ付加信号Y(t)のフレームy(n)のラグ範囲最大相関Rmax(y(n))は、式Rmax(y(n))=Rmax(x(n))/{R'(x(n),0)+R'(g(n),0)}にしたがい、入力信号X(t)のフレームx(n)のラグ範囲最大相関Rmax(x(n))、フレームx(n)の自乗パワーに等しいラグτが0のときの正規化前自己相関R'(x(n),0)、及びノイズg(n)の自乗パワーに等しいラグτが0のときの正規化前自己相関R'(g(n),0)から求めることができる。 As described above, the normalized autocorrelation R (y (n), τ) of the noise added signal Y (t) is expressed by the equation R (y (n), τ) = R ′ (x (n), τ) / It can be approximated by {R '(x (n), 0) + R' (g (n), 0)}, and this equation R (y (n), τ) = R '(x (n), τ) / {R ′ (x (n), 0) + R ′ (g (n), 0)} is replaced with R ′ (y (n), τ) / R ′ (y (n), 0), that is, by substituting into the normalized autocorrelation R (y (n), τ), the frame y of the noise added signal Y (t) in equation (3) The lag range maximum correlation R max (y (n)) of (n) is given by the formula R max (y (n)) = R max (x (n)) / (R ′ (x (n), 0) + R '(g (n), 0)}, lag range maximum correlation R max (x (n)) of frame x (n) of input signal X (t), lag equal to square power of frame x (n) Auto-correlation R ′ (x (n), 0) before normalization when τ is 0, and auto-correlation R ′ (g (g (n)) when the lag τ equal to the square power of noise g (n) is 0 n), 0).
すなわち、ノイズ付加信号Y(t)のラグ範囲最大相関Rmax(y(n))は、ノイズg(n)の自己相関、及び入力信号X(t)とノイズg(n)との相互相関が0であると近似することにより、入力信号X(t)の自己相関としてのラグ範囲最大相関Rmax(x(n))、及びラグτが0のときの正規化前自己相関R'(x(n),0)、並びにラグが0のノイズg(n)の自己相関としてのラグτが0のときの正規化前自己相関R'(g(n),0)とを用い、ノイズ付加信号Y(t)の正規化自己相関R(y(n),τ)を計算せずに求めることができる。 That is, the lag range maximum correlation R max (y (n)) of the noise added signal Y (t) is the autocorrelation of the noise g (n) and the cross correlation of the input signal X (t) and the noise g (n). Is approximated as 0, the lag range maximum correlation R max (x (n)) as the autocorrelation of the input signal X (t), and the pre-normalization autocorrelation R ′ ( x (n), 0) and the autocorrelation R ′ (g (n), 0) before normalization when the lag τ is 0 as the autocorrelation of noise g (n) with zero lag. The normalized autocorrelation R (y (n), τ) of the additional signal Y (t) can be obtained without calculating.
いま、上述のように、近似によって、ノイズ付加信号Y(t)のラグ範囲最大相関Rmax(y(n))を求めるノイズミックスRmax計算処理を、近似ノイズミックスRmax計算処理ということとすると、近似ノイズミックスRmax計算処理では、自己相関の計算としては、ノイズ付加信号Y(t)の正規化自己相関R(y(n),τ)の計算を行う必要がなく、入力信号X(t)の正規化自己相関R(x(n),τ)の計算だけを行えば良いので、計算量を低減することができる。 Now, as described above, the noise mix R max calculation processing for obtaining the lag range maximum correlation R max (y (n)) of the noise addition signal Y (t) by approximation is referred to as approximate noise mix R max calculation processing. Then, in the approximate noise mix R max calculation process, it is not necessary to calculate the normalized autocorrelation R (y (n), τ) of the noise added signal Y (t) as the autocorrelation calculation, and the input signal X Since only the calculation of the normalized autocorrelation R (x (n), τ) of (t) has to be performed, the amount of calculation can be reduced.
ここで、図3の信号処理装置によって行われるノイズミックスRmax計算処理を、近似ノイズミックスRmax計算処理と区別するために、以下、適宜、通常ノイズミックスRmax計算処理という。 Here, in order to distinguish the noise mix R max calculation process performed by the signal processing apparatus of FIG. 3 from the approximate noise mix R max calculation process, hereinafter, it is appropriately referred to as a normal noise mix R max calculation process.
図20は、近似ノイズミックスRmax計算処理によって、入力信号X(t)の特徴量としての、ノイズ付加信号Y(t)のラグ範囲最大相関Rmax(y(n))を求める信号処理装置の一実施の形態の構成例を示している。 FIG. 20 shows a signal processing device that obtains the lag range maximum correlation R max (y (n)) of the noise added signal Y (t) as the feature quantity of the input signal X (t) by the approximate noise mix R max calculation process. 2 shows a configuration example of an embodiment.
なお、図中、図3の信号処理装置と対応する部分については、同一の符号を付してあり、以下では、その説明は、適宜省略する。すなわち、図20の信号処理装置は、ガウスノイズ生成部17に代えて、ガウスノイズパワー計算部91が設けられているとともに、Rmax計算部20に代えて、Rmax近似計算部92が設けられ、ノイズミックス部18及び正規化自己相関計算部19が設けられていない他は、図3の信号処理装置と同様に構成されている。
In the figure, portions corresponding to those of the signal processing apparatus of FIG. 3 are denoted by the same reference numerals, and description thereof will be omitted below as appropriate. That is, the signal processing apparatus of FIG. 20 includes a Gaussian noise
また、図20の信号処理装置では、正規化自己相関計算部13、Rmax計算部14、フレームパワー計算部15、ゲイン計算部16、ガウスノイズパワー計算部91、及びRmax近似計算部92が、ノイズミックスRmax計算処理としての近似ノイズミックスRmax計算処理を行うノイズミックスRmax計算部を構成する。
20, the normalized
ガウスノイズパワー計算部91は、例えば、図3のガウスノイズ生成部17と同様にして、入力信号X(t)に付加する、サンプル数がTのノイズgを生成し、そのノイズgについて、ラグτが0のときの正規化前自己相関R'(g,0)、つまり、ノイズgの各サンプル値の自乗の総和である自乗パワーを求め、Rmax近似計算部92に供給する。
For example, the Gaussian noise
Rmax近似計算部92には、上述したように、ガウスノイズパワー計算部91から、ノイズgについての、ラグτが0のときの正規化前自己相関R'(g,0)に等しい自乗パワーが供給される他、Rmax計算部14から、入力信号X(t)のフレームx(n)のラグ範囲最大自己相関Rmax(x(n))が供給されるとともに、ゲイン計算部16から、ゲインgain(n)が供給される。
As described above, the R max
さらに、Rmax近似計算部92には、フレームパワー計算部15から、入力信号X(t)のフレームx(n)のフレームパワーp(n)、すなわち、入力信号X(t)のフレームx(n)についての、ラグτが0のときの正規化前自己相関R'(x(n),0)に等しい自乗パワーが供給される。
Further, the R max
Rmax近似計算部92は、Rmax計算部14からの入力信号X(t)のフレームx(n)のラグ範囲最大自己相関Rmax(x(n))、フレームパワー計算部15からの入力信号X(t)のフレームx(n)についてのラグτが0のときの正規化前自己相関R'(x(n),0)、ゲイン計算部16からのゲインgain(n)、及びガウスノイズパワー計算部91からの、ノイズgについてのラグτが0のときの正規化前自己相関R'(g,0)を用い、上述の式Rmax(y(n))=Rmax(x(n))/{R'(x(n),0)+R'(g(n),0)}に相当する式Rmax(x(n))/{R'(x(n),0)+{C×gain(n)}2×R'(g,0)}にしたがい、入力信号X(t)に、ゲインgain(n)に応じた大きさのノイズC×gain(n)×gを付加したノイズ付加信号Y(t)のラグ範囲自己相関Rmax(y(n))を求める。
The R max
次に、図21のフローチャートを参照して、図20の信号処理装置の動作について説明する。 Next, the operation of the signal processing apparatus of FIG. 20 will be described with reference to the flowchart of FIG.
図20の信号処理装置では、ステップS91,S93ないしS96において、図4のステップS11,S13ないしS16とそれぞれ同様の処理が行われる。 In the signal processing apparatus of FIG. 20, the same processes as steps S11, S13 to S16 of FIG. 4 are performed in steps S91, S93 to S96, respectively.
これにより、Rmax計算部14では、入力信号X(t)のフレームx(n)のラグ範囲最大相関Rmax(x(n))が求められ、フレームパワー計算部15では、入力信号X(t)のフレームパワーp(n)が求められる。また、ゲイン計算部16では、ゲインgain(n)が求められる。
Thereby, the R max calculation unit 14 obtains the lag range maximum correlation R max (x (n)) of the frame x (n) of the input signal X (t), and the frame
そして、Rmax計算部14において求められた入力信号X(t)のフレームx(n)のラグ範囲最大相関Rmax(x(n))、フレームパワー計算部15において求められた入力信号X(t)のフレームx(n)のフレームパワーp(n)、及び、ゲイン計算部16で求められたゲインgain(n)が、Rmax近似計算部92に供給される。
Then, the lag range maximum correlation R max (x (n)) of the frame x (n) of the input signal X (t) obtained by the R max calculation unit 14, the input signal X ( The frame power p (n) of the frame x (n) of t) and the gain gain (n) obtained by the
一方、ステップS92において、ガウスノイズパワー計算部91は、1フレームのサンプル数と同一のTサンプルのノイズgとして、例えばガウスノイズを生成し、そのノイズgについて、ラグτが0のときの正規化前自己相関R'(g,0)、つまり、ノイズgの自乗パワーを求め、Rmax近似計算部92に供給する。
On the other hand, in step S92, the Gaussian noise
そして、ステップS97において、Rmax近似計算部92は、Rmax計算部14からの入力信号X(t)のフレームx(n)のラグ範囲最大自己相関Rmax(x(n))、フレームパワー計算部15からの入力信号X(t)のフレームx(n)についてのラグτが0のときの正規化前自己相関R'(x(n),0)に等しいフレームパワーp(n)、ゲイン計算部16からのゲインgain(n)、及びガウスノイズパワー計算部91からの、ノイズgについてのラグτが0のときの正規化前自己相関R'(g,0)に等しい自乗パワーを用い、式Rmax(y(n))=Rmax(x(n))/{R'(x(n),0)+{C×gain(n)}2×R'(g,0)}にしたがい、入力信号X(t)に、ゲインgain(n)に応じた大きさのノイズC×gain(n)×gを付加したノイズ付加信号Y(t)のラグ範囲自己相関Rmax(y(n))を求める。
In step S97, the R max
さらに、Rmax近似計算部92は、ステップS98において、ステップS97で求めたラグ範囲最大相関Rmax(y(n))を、入力信号X(t)のフレームx(n)から抽出された特徴量として出力する。
Further, in step S98, the R max
次に、図22ないし図25は、近似ノイズミックスRmax計算処理によって求められたノイズ付加信号Y(t)のラグ範囲最大相関Rmax(y(n))を示している。 Next, FIGS. 22 to 25 show the lag range maximum correlation R max (y (n)) of the noise added signal Y (t) obtained by the approximate noise mix R max calculation process.
なお、図22ないし図25において、ゲインgain(n)を求める関数F(p(n),Rmax(x(n)))を定義するNフレームとしては、40フレームを採用し、ノイズ付加信号Y(t)のラグ範囲最大相関Rmax(y(n))を求めるのに用いる定数Cとしては、0.2を採用した。 In FIGS. 22 to 25, 40 frames are used as N frames for defining the function F (p (n), R max (x (n))) for obtaining the gain gain (n), and the noise added signal is used. As a constant C used for obtaining the maximum lag range correlation R max (y (n)) of Y (t), 0.2 was adopted.
また、図22ないし図25において、矩形で囲んである部分は、音声区間を表している。 In FIG. 22 to FIG. 25, a portion surrounded by a rectangle represents a voice section.
図22ないし図25それぞれの上から1番目は、入力信号X(t)としての音声信号を示している。 The first from the top in each of FIGS. 22 to 25 shows an audio signal as the input signal X (t).
なお、図22の入力信号X(t)としての音声信号は、音楽環境で集音した音声信号であり、図23の入力信号X(t)としての音声信号は、エアコン環境で集音した音声信号である。また、図24の入力信号X(t)としての音声信号は、ソニー株式会社が開発した二足歩行ロボットであるQRIO(R)が歩行動作をしている環境で集音した音声信号であり、図25の入力信号X(t)としての音声信号は、QRIO(R)が高速でダンスをしている環境で集音した音声信号である。 Note that the audio signal as the input signal X (t) in FIG. 22 is an audio signal collected in a music environment, and the audio signal as the input signal X (t) in FIG. 23 is an audio signal collected in an air conditioner environment. Signal. In addition, the audio signal as the input signal X (t) in FIG. 24 is an audio signal collected in an environment where QRIO (R), a biped robot developed by Sony Corporation, is walking, The audio signal as the input signal X (t) in FIG. 25 is an audio signal collected in an environment where QRIO (R) is dancing at high speed.
図22ないし図25それぞれの上から2番目は、1番目に示した入力信号X(t)のラグ範囲最大相関Rmax(x(n))を示しており、上から3番目は、1番目に示した入力信号X(t)から、通常ノイズミックスRmax計算処理によって求められたノイズ付加信号Y(t)のラグ範囲最大相関Rmax(y(n))を示している。 The second from the top of each of FIGS. 22 to 25 shows the lag range maximum correlation R max (x (n)) of the first input signal X (t), and the third from the top is the first. The lag range maximum correlation R max (y (n)) of the noise added signal Y (t) obtained by the normal noise mix R max calculation process from the input signal X (t) shown in FIG.
さらに、図22ないし図25それぞれの上から4番目は、1番目に示した入力信号X(t)から、近似ノイズミックスRmax計算処理によって求められたノイズ付加信号Y(t)のラグ範囲最大相関Rmax(y(n))を示している。 Further, the fourth from the top of each of FIGS. 22 to 25 shows the maximum lag range of the noise added signal Y (t) obtained by the approximate noise mix R max calculation process from the input signal X (t) shown first. Correlation R max (y (n)) is shown.
図22ないし図25それぞれの上から4番目の、近似ノイズミックスRmax計算処理によって求められたノイズ付加信号Y(t)のラグ範囲最大相関Rmax(y(n))は、上から3番目の、通常ノイズミックスRmax計算処理によって求められたノイズ付加信号Y(t)のラグ範囲最大相関Rmax(y(n))とほぼ一致しており、したがって、近似ノイズミックスRmax計算処理が有効であることが分かる。 The fourth lag range maximum correlation R max (y (n)) of the noise addition signal Y (t) obtained by the approximate noise mix R max calculation processing from the top in each of FIGS. 22 to 25 is the third from the top. of normal noise mixes R max lag range maximum correlation R max of the noise obtained by computing the additional signal Y (t) and (y (n)) are almost the same, therefore, the approximate noise mixes R max calculation process It turns out that it is effective.
なお、ゲインgain(n)を求める関数F(p(n),Rmax(x(n)))としては、フレームx(n)を含む連続するNフレームのそれぞれについての、フレームパワーp(n)とラグ範囲最大相関Rmax(x(n))との積p(n)×Rmax(x(n))の最小値や、平均値を求める関数の他、その積p(n)×Rmax(x(n))の、例えばメディアン等を求める関数を採用することが可能である。 The function F (p (n), R max (x (n))) for obtaining the gain gain (n) is the frame power p (n for each of the consecutive N frames including the frame x (n). ) And lag range maximum correlation R max (x (n)) product p (n) x R max (x (n)) minimum and average functions, as well as the product p (n) x For example, a function of R max (x (n)) for obtaining a median or the like can be employed.
次に、上述したノイズミックスRmax計算処理等の一連の処理は、ハードウェアにより行うこともできるし、ソフトウェアにより行うこともできる。一連の処理をソフトウェアによって行う場合には、そのソフトウェアを構成するプログラムが、汎用のコンピュータ等にインストールされる。 Next, a series of processing such as the above-described noise mix R max calculation processing can be performed by hardware or can be performed by software. When a series of processing is performed by software, a program constituting the software is installed in a general-purpose computer or the like.
そこで、図26は、上述した一連の処理を実行するプログラムがインストールされるコンピュータの一実施の形態の構成例を示している。 Therefore, FIG. 26 shows a configuration example of an embodiment of a computer in which a program for executing the series of processes described above is installed.
プログラムは、コンピュータに内蔵されている記録媒体としてのハードディスク105やROM103に予め記録しておくことができる。
The program can be recorded in advance in a
あるいはまた、プログラムは、フレキシブルディスク、CD-ROM(Compact Disc Read Only Memory),MO(Magneto Optical)ディスク,DVD(Digital Versatile Disc)、磁気ディスク、半導体メモリなどのリムーバブル記録媒体111に、一時的あるいは永続的に格納(記録)しておくことができる。このようなリムーバブル記録媒体111は、いわゆるパッケージソフトウエアとして提供することができる。
Alternatively, the program is stored temporarily on a
なお、プログラムは、上述したようなリムーバブル記録媒体111からコンピュータにインストールする他、ダウンロードサイトから、ディジタル衛星放送用の人工衛星を介して、コンピュータに無線で転送したり、LAN(Local Area Network)、インターネットといったネットワークを介して、コンピュータに有線で転送し、コンピュータでは、そのようにして転送されてくるプログラムを、通信部108で受信し、内蔵するハードディスク105にインストールすることができる。
The program is installed in the computer from the
コンピュータは、CPU(Central Processing Unit)102を内蔵している。CPU102には、バス101を介して、入出力インタフェース110が接続されており、CPU102は、入出力インタフェース110を介して、ユーザによって、キーボードや、マウス、マイク等で構成される入力部107が操作等されることにより指令が入力されると、それにしたがって、ROM(Read Only Memory)103に格納されているプログラムを実行する。あるいは、また、CPU102は、ハードディスク105に格納されているプログラム、衛星若しくはネットワークから転送され、通信部108で受信されてハードディスク105にインストールされたプログラム、またはドライブ109に装着されたリムーバブル記録媒体111から読み出されてハードディスク105にインストールされたプログラムを、RAM(Random Access Memory)104にロードして実行する。これにより、CPU102は、上述したフローチャートにしたがった処理、あるいは上述したブロック図の構成により行われる処理を行う。そして、CPU102は、その処理結果を、必要に応じて、例えば、入出力インタフェース110を介して、LCD(Liquid Crystal Display)やスピーカ等で構成される出力部106から出力、あるいは、通信部108から送信、さらには、ハードディスク105に記録等させる。
The computer includes a CPU (Central Processing Unit) 102. An input /
ここで、本明細書において、コンピュータに各種の処理を行わせるためのプログラムを記述する処理ステップは、必ずしもフローチャートとして記載された順序に沿って時系列に処理する必要はなく、並列的あるいは個別に実行される処理(例えば、並列処理あるいはオブジェクトによる処理)も含むものである。 Here, in the present specification, the processing steps for describing a program for causing the computer to perform various processes do not necessarily have to be processed in time series in the order described in the flowcharts, but in parallel or individually. This includes processing to be executed (for example, parallel processing or processing by an object).
また、プログラムは、1のコンピュータにより処理されるものであっても良いし、複数のコンピュータによって分散処理されるものであっても良い。さらに、プログラムは、遠方のコンピュータに転送されて実行されるものであっても良い。 Further, the program may be processed by a single computer, or may be processed in a distributed manner by a plurality of computers. Furthermore, the program may be transferred to a remote computer and executed.
なお、本発明の実施の形態は、上述した実施の形態に限定されるものではなく、本発明の要旨を逸脱しない範囲において種々の変更が可能である。 The embodiment of the present invention is not limited to the above-described embodiment, and various modifications can be made without departing from the gist of the present invention.
すなわち、本実施の形態では、周期性を表す周期性情報として、自己相関を採用した場合について説明したが、周期性情報としては、その他、例えば、YINを採用することができる。そして、周期性情報として、YINを採用する場合には、上述の正規化自己相関に代えて1-YINを使用するか、又は、正規化自己相関の最大値をYINの最小値に、正規化自己相関の最小値をYINの最大値に、それぞれ読み替えればよい。 That is, in the present embodiment, the case where autocorrelation is employed as periodicity information representing periodicity has been described. However, for example, YIN can be employed as the periodicity information. If YIN is used as the periodicity information, use 1-YIN instead of the above-mentioned normalized autocorrelation, or normalize the maximum value of normalized autocorrelation to the minimum value of YIN. The minimum value of autocorrelation may be read as the maximum value of YIN.
11 音響信号変換部, 12 フレーム処理部, 13 正規化自己相関計算部, 14 Rmax計算部, 15 フレームパワー計算部, 16 ゲイン計算部, 17 ガウスノイズ生成部, 18 ノイズミックス部, 19 正規化自己相関計算部, 20 Rmax計算部, 41 音響信号変換部, 42 フレーム処理部, 43 ノイズミックスRmax計算部, 44 フレームパワー計算部, 45 複数フレーム処理部, 46 線形判別分析部, 47 識別処理部, 71 ノイズ生成部, 72 正規化自己相関計算部, 73 Rmax計算部, 74 ノイズ選択部, 91 ガウスノイズパワー計算部, 92 Rmax近似計算部, 101 バス, 102 CPU, 103 ROM, 104 RAM, 105 ハードディスク, 106 出力部, 107 入力部, 108 通信部, 109 ドライブ, 110 入出力インタフェース, 111 リムーバブル記録媒体 11 acoustic signal conversion unit, 12 frame processing unit, 13 normalized autocorrelation calculation unit, 14 R max calculation unit, 15 frame power calculation unit, 16 gain calculation unit, 17 Gaussian noise generation unit, 18 noise mix unit, 19 normalization Autocorrelation calculation unit, 20 R max calculation unit, 41 acoustic signal conversion unit, 42 frame processing unit, 43 noise mix R max calculation unit, 44 frame power calculation unit, 45 multiple frame processing unit, 46 linear discriminant analysis unit, 47 identification Processing unit, 71 noise generation unit, 72 normalized autocorrelation calculation unit, 73 R max calculation unit, 74 noise selection unit, 91 Gaussian noise power calculation unit, 92 R max approximate calculation unit, 101 bus, 102 CPU, 103 ROM, 104 RAM, 105 hard disk, 106 output unit, 107 input unit, 108 communication unit, 109 drive, 110 Output interface, 111 removable recording medium
Claims (12)
前記入力信号に、前記ゲイン情報に応じた大きさの前記ノイズを付加したノイズ付加信号の周期性情報を、前記入力信号の特徴量として求める特徴量計算手段と
を備える信号処理装置。 The minimum value, median, or average value within a certain time of the product of the maximum value within the lag corresponding to the specific frequency range of the normalized autocorrelation of the input signal and the power of the input signal and added to the input signal, the gain calculation means for obtaining a gain information indicating the size of the noise maximum value within the range of lug corresponding to a specific frequency range of the autocorrelation becomes a value close to 0 or 0 When,
To the input signal, the signal processing apparatus including the periodic information of the noise added signal obtained by adding the noise of a magnitude corresponding to the gain information, a feature quantity calculating means for calculating a feature quantity of the input signal.
請求項1に記載の信号処理装置。 The signal processing apparatus according to claim 1, wherein the noise is Gaussian noise.
請求項1に記載の信号処理装置。 The specific frequency range is a range of a fundamental frequency of human voice.
The signal processing apparatus according to claim 1 .
前記ノイズの周期性情報に基づいて、前記複数のノイズの中から、前記入力信号に付加する前記ノイズを選択するノイズ選択手段と
をさらに備える
請求項1に記載の信号処理装置。 Noise generating means for generating a plurality of noises;
The signal processing apparatus according to claim 1, further comprising: a noise selection unit that selects the noise to be added to the input signal from the plurality of noises based on the periodicity information of the noise.
請求項4に記載の信号処理装置。 The noise selecting means adds the noise normalized autocorrelation to the input signal from the plurality of noises based on a maximum value within a lag range corresponding to a specific frequency range. selecting the noise
The signal processing apparatus according to claim 4 .
請求項1に記載の信号処理装置。 The feature amount calculation means approximates that the noise autocorrelation and the cross correlation between the input signal and the noise are 0, and the input signal autocorrelation and the noise autocorrelation with a lag of 0 The signal processing apparatus according to claim 1, wherein an approximated value of the normalized autocorrelation of the noise-added signal is obtained as a feature amount of the input signal using.
請求項1に記載の信号処理装置。 The signal processing apparatus according to claim 1, further comprising a processing unit that performs predetermined processing based on a feature amount of the input signal.
複数のフレームの前記特徴量をまとめた複数次元の統合特徴量を求める複数フレーム処理手段をさらに備え、
前記処理手段は、前記統合特徴量に基づき、所定の処理を行う
請求項7に記載の信号処理装置。 The feature amount calculation means obtains the feature amount of the input signal for each frame of a certain time length,
A plurality of frame processing means for obtaining a multi-dimensional integrated feature amount that summarizes the feature amounts of a plurality of frames;
The processing means performs predetermined processing based on the integrated feature amount.
The signal processing apparatus according to claim 7 .
前記処理手段は、次元が圧縮された前記統合特徴量に基づき、所定の処理を行う
請求項8に記載の信号処理装置。 Linear discriminant analysis means for compressing the dimension of the integrated feature quantity by linear discriminant analysis;
The processing means performs a predetermined process based on the integrated feature value whose dimension is compressed.
The signal processing apparatus according to claim 8 .
前記処理手段は、前記音声信号の特徴量に基づき、音声区間の検出、音声認識、韻律認識、又は基本周波数の検出を行う
請求項7に記載の信号処理装置。 The input signal is an audio signal;
The processing means performs speech section detection, speech recognition, prosody recognition, or fundamental frequency detection based on the feature amount of the speech signal.
The signal processing apparatus according to claim 7 .
前記入力信号に、前記ゲイン情報に応じた大きさの前記ノイズを付加したノイズ付加信号の周期性情報を、前記入力信号の特徴量として求める
ステップを含む信号処理方法。 The minimum value, median, or average value within a certain time of the product of the maximum value within the lag corresponding to the specific frequency range of the normalized autocorrelation of the input signal and the power of the input signal and added to the input signal, determined as the gain information indicating the size of the noise maximum value within the range of lug corresponding to a specific frequency range of the autocorrelation becomes a value close to 0 or 0,
To the input signal, the signal processing method comprising the periodicity information of the noise addition signal obtained by adding the noise of a magnitude corresponding to the gain information obtained as the feature quantity of the input signal.
前記入力信号に、前記ゲイン情報に応じた大きさの前記ノイズを付加したノイズ付加信号の周期性情報を、前記入力信号の特徴量として求める
ステップを含む信号処理を、コンピュータに実行させるプログラム。 The minimum value, median, or average value within a certain time of the product of the maximum value within the lag corresponding to the specific frequency range of the normalized autocorrelation of the input signal and the power of the input signal and added to the input signal, determined as the gain information indicating the size of the noise maximum value within the range of lug corresponding to a specific frequency range of the autocorrelation becomes a value close to 0 or 0,
To the input signal, the program for executing the periodicity information of the noise addition signal obtained by adding the magnitude of the noise in accordance with the gain information, a signal processing including a step of determining a characteristic quantity of said input signal, to the computer.
Priority Applications (2)
| Application Number | Priority Date | Filing Date | Title |
|---|---|---|---|
| JP2006160578A JP4182444B2 (en) | 2006-06-09 | 2006-06-09 | Signal processing apparatus, signal processing method, and program |
| US11/760,095 US7908137B2 (en) | 2006-06-09 | 2007-06-08 | Signal processing device, signal processing method, and program |
Applications Claiming Priority (1)
| Application Number | Priority Date | Filing Date | Title |
|---|---|---|---|
| JP2006160578A JP4182444B2 (en) | 2006-06-09 | 2006-06-09 | Signal processing apparatus, signal processing method, and program |
Publications (2)
| Publication Number | Publication Date |
|---|---|
| JP2007328228A JP2007328228A (en) | 2007-12-20 |
| JP4182444B2 true JP4182444B2 (en) | 2008-11-19 |
Family
ID=38928725
Family Applications (1)
| Application Number | Title | Priority Date | Filing Date |
|---|---|---|---|
| JP2006160578A Expired - Fee Related JP4182444B2 (en) | 2006-06-09 | 2006-06-09 | Signal processing apparatus, signal processing method, and program |
Country Status (2)
| Country | Link |
|---|---|
| US (1) | US7908137B2 (en) |
| JP (1) | JP4182444B2 (en) |
Cited By (3)
| Publication number | Priority date | Publication date | Assignee | Title |
|---|---|---|---|---|
| US9361907B2 (en) | 2011-01-18 | 2016-06-07 | Sony Corporation | Sound signal processing apparatus, sound signal processing method, and program |
| US10475440B2 (en) | 2013-02-14 | 2019-11-12 | Sony Corporation | Voice segment detection for extraction of sound source |
| WO2020208926A1 (en) | 2019-04-08 | 2020-10-15 | ソニー株式会社 | Signal processing device, signal processing method, and program |
Families Citing this family (8)
| Publication number | Priority date | Publication date | Assignee | Title |
|---|---|---|---|---|
| JP4182444B2 (en) * | 2006-06-09 | 2008-11-19 | ソニー株式会社 | Signal processing apparatus, signal processing method, and program |
| JP5459220B2 (en) * | 2008-11-27 | 2014-04-02 | 日本電気株式会社 | Speech detection device |
| JP6160519B2 (en) * | 2014-03-07 | 2017-07-12 | 株式会社Jvcケンウッド | Noise reduction device |
| JP6206271B2 (en) * | 2014-03-17 | 2017-10-04 | 株式会社Jvcケンウッド | Noise reduction apparatus, noise reduction method, and noise reduction program |
| JP6477295B2 (en) * | 2015-06-29 | 2019-03-06 | 株式会社Jvcケンウッド | Noise detection apparatus, noise detection method, and noise detection program |
| JP6597062B2 (en) * | 2015-08-31 | 2019-10-30 | 株式会社Jvcケンウッド | Noise reduction device, noise reduction method, noise reduction program |
| US9832007B2 (en) | 2016-04-14 | 2017-11-28 | Ibiquity Digital Corporation | Time-alignment measurement for hybrid HD radio™ technology |
| US10666416B2 (en) * | 2016-04-14 | 2020-05-26 | Ibiquity Digital Corporation | Time-alignment measurement for hybrid HD radio technology |
Family Cites Families (8)
| Publication number | Priority date | Publication date | Assignee | Title |
|---|---|---|---|---|
| JPS5823098A (en) | 1981-08-03 | 1983-02-10 | 日本電信電話株式会社 | Voice recognition apparatus |
| JPH0643892A (en) | 1992-02-18 | 1994-02-18 | Matsushita Electric Ind Co Ltd | Voice recognition method |
| JPH09212196A (en) | 1996-01-31 | 1997-08-15 | Nippon Telegr & Teleph Corp <Ntt> | Noise suppressor |
| US6055499A (en) | 1998-05-01 | 2000-04-25 | Lucent Technologies Inc. | Use of periodicity and jitter for automatic speech recognition |
| US6987591B2 (en) * | 2003-07-17 | 2006-01-17 | Her Majesty The Queen In Right Of Canada, As Represented By The Minister Of Industry Through The Communications Research Centre Canada | Volume hologram |
| US7869980B2 (en) * | 2005-11-03 | 2011-01-11 | International Business Machines Corporation | Using statistics to locate signals in noise |
| JP4182444B2 (en) * | 2006-06-09 | 2008-11-19 | ソニー株式会社 | Signal processing apparatus, signal processing method, and program |
| US8015000B2 (en) * | 2006-08-03 | 2011-09-06 | Broadcom Corporation | Classification-based frame loss concealment for audio signals |
-
2006
- 2006-06-09 JP JP2006160578A patent/JP4182444B2/en not_active Expired - Fee Related
-
2007
- 2007-06-08 US US11/760,095 patent/US7908137B2/en not_active Expired - Fee Related
Cited By (3)
| Publication number | Priority date | Publication date | Assignee | Title |
|---|---|---|---|---|
| US9361907B2 (en) | 2011-01-18 | 2016-06-07 | Sony Corporation | Sound signal processing apparatus, sound signal processing method, and program |
| US10475440B2 (en) | 2013-02-14 | 2019-11-12 | Sony Corporation | Voice segment detection for extraction of sound source |
| WO2020208926A1 (en) | 2019-04-08 | 2020-10-15 | ソニー株式会社 | Signal processing device, signal processing method, and program |
Also Published As
| Publication number | Publication date |
|---|---|
| US20080015853A1 (en) | 2008-01-17 |
| JP2007328228A (en) | 2007-12-20 |
| US7908137B2 (en) | 2011-03-15 |
Similar Documents
| Publication | Publication Date | Title |
|---|---|---|
| JP4182444B2 (en) | Signal processing apparatus, signal processing method, and program | |
| US9830896B2 (en) | Audio processing method and audio processing apparatus, and training method | |
| US7039582B2 (en) | Speech recognition using dual-pass pitch tracking | |
| US7567900B2 (en) | Harmonic structure based acoustic speech interval detection method and device | |
| JP4264841B2 (en) | Speech recognition apparatus, speech recognition method, and program | |
| US20140149117A1 (en) | Method and system for identification of speech segments | |
| US20050143997A1 (en) | Method and apparatus using spectral addition for speaker recognition | |
| JP5961950B2 (en) | Audio processing device | |
| JP4572218B2 (en) | Music segment detection method, music segment detection device, music segment detection program, and recording medium | |
| JPH0990974A (en) | Signal processor | |
| WO2007046267A1 (en) | Voice judging system, voice judging method, and program for voice judgment | |
| JP5081730B2 (en) | Speech segment detection apparatus and speech segment detection method | |
| US7908142B2 (en) | Apparatus and method for identifying prosody and apparatus and method for recognizing speech | |
| US8532986B2 (en) | Speech signal evaluation apparatus, storage medium storing speech signal evaluation program, and speech signal evaluation method | |
| JP4585590B2 (en) | Basic frequency variation extraction device, method and program | |
| US6823304B2 (en) | Speech recognition apparatus and method performing speech recognition with feature parameter preceding lead voiced sound as feature parameter of lead consonant | |
| JP4839970B2 (en) | Prosody identification apparatus and method, and speech recognition apparatus and method | |
| JP6633579B2 (en) | Acoustic signal processing device, method and program | |
| JP6653687B2 (en) | Acoustic signal processing device, method and program | |
| JP6969597B2 (en) | Acoustic signal processing equipment, methods and programs | |
| JP6599408B2 (en) | Acoustic signal processing apparatus, method, and program | |
| Cherif | Pitch and formants extraction algorithm for speech processing | |
| KR20080065775A (en) | Phonation visualization system using lip language education | |
| KR101312967B1 (en) | Karaoke system and Operating method providing gender determination function |
Legal Events
| Date | Code | Title | Description |
|---|---|---|---|
| A977 | Report on retrieval |
Free format text: JAPANESE INTERMEDIATE CODE: A971007 Effective date: 20080425 |
|
| A131 | Notification of reasons for refusal |
Free format text: JAPANESE INTERMEDIATE CODE: A131 Effective date: 20080529 |
|
| A521 | Request for written amendment filed |
Free format text: JAPANESE INTERMEDIATE CODE: A523 Effective date: 20080709 |
|
| TRDD | Decision of grant or rejection written | ||
| A01 | Written decision to grant a patent or to grant a registration (utility model) |
Free format text: JAPANESE INTERMEDIATE CODE: A01 Effective date: 20080807 |
|
| A01 | Written decision to grant a patent or to grant a registration (utility model) |
Free format text: JAPANESE INTERMEDIATE CODE: A01 |
|
| A61 | First payment of annual fees (during grant procedure) |
Free format text: JAPANESE INTERMEDIATE CODE: A61 Effective date: 20080820 |
|
| FPAY | Renewal fee payment (event date is renewal date of database) |
Free format text: PAYMENT UNTIL: 20110912 Year of fee payment: 3 |
|
| FPAY | Renewal fee payment (event date is renewal date of database) |
Free format text: PAYMENT UNTIL: 20110912 Year of fee payment: 3 |
|
| FPAY | Renewal fee payment (event date is renewal date of database) |
Free format text: PAYMENT UNTIL: 20110912 Year of fee payment: 3 |
|
| FPAY | Renewal fee payment (event date is renewal date of database) |
Free format text: PAYMENT UNTIL: 20120912 Year of fee payment: 4 |
|
| FPAY | Renewal fee payment (event date is renewal date of database) |
Free format text: PAYMENT UNTIL: 20120912 Year of fee payment: 4 |
|
| FPAY | Renewal fee payment (event date is renewal date of database) |
Free format text: PAYMENT UNTIL: 20130912 Year of fee payment: 5 |
|
| R250 | Receipt of annual fees |
Free format text: JAPANESE INTERMEDIATE CODE: R250 |
|
| R250 | Receipt of annual fees |
Free format text: JAPANESE INTERMEDIATE CODE: R250 |
|
| LAPS | Cancellation because of no payment of annual fees |