JP4082471B2 - Outside monitoring device - Google Patents
Outside monitoring device Download PDFInfo
- Publication number
- JP4082471B2 JP4082471B2 JP08688197A JP8688197A JP4082471B2 JP 4082471 B2 JP4082471 B2 JP 4082471B2 JP 08688197 A JP08688197 A JP 08688197A JP 8688197 A JP8688197 A JP 8688197A JP 4082471 B2 JP4082471 B2 JP 4082471B2
- Authority
- JP
- Japan
- Prior art keywords
- group
- distance
- vehicle
- dimensional object
- dimensional
- Prior art date
- Legal status (The legal status is an assumption and is not a legal conclusion. Google has not performed a legal analysis and makes no representation as to the accuracy of the status listed.)
- Expired - Lifetime
Links
Images


Description
【0001】
【発明の属する技術分野】
本発明は、車外の物体の距離分布を示す疑似画像に基づいて車外の状況を認識する車外監視装置に関し、特に、狭路通過時の自車両と障害物との間の隙間を検出して安全を確保する車外監視装置に関する。
【0002】
【従来の技術】
従来、自動車等の車両においては、塀、ガードレール、電柱、駐車車両等が多数存在する狭路を通過する際の運転者の操作感覚を補うものとして、例えば、実開平5−68742号公報に開示されているようなコーナーポールや、棒状の部材が障害物に触れるとスイッチがオンする接触式スイッチからなる触覚センサ等を車体に取り付ける場合があり、これにより、車幅や左右障害物との間の隙間を確認することができる。
【0003】
また、最近では、車両の側面や四隅に超音波センサを取り付け、超音波を発射して障害物からの反射波を受信することにより距離を計測し、計測した距離を運転者に知らせて狭路を通過する際の負担を軽減しようとする技術が開発されている。
【0004】
しかしながら、前述のコーナーポールのように車体外部に目印となるようなものを取り付ける場合には、運転者の慣れを必要とするため、運転者の負担軽減効果が少ない。また、触覚センサのような接触式のものでは、物体に接触するまで位置の確認ができず、障害物に接触してからではハンドル操作が間に合わないといった事態が生じる。
【0005】
また、超音波を用いる技術では、空間分解能が劣るため障害物の位置関係を知ることができないばかりでなく、歩行者の衣服や滑らかな壁等からは発射した超音波が戻ってこないという物体依存性があり、道路上に存在する様々な立体物に対処することは困難である。
【0006】
これに対処するに、本出願人は、特開平7−192199号において、車外の対象をステレオ撮像し、撮像したステレオ画像対の対応位置のずれ量から三角測量の原理によって画像全体に渡る距離分布を求め、この距離分布の情報に対応する被写体の各部分の3次元位置を計算し、これらの3次元位置の情報を用いて複数の立体物を検出して、検出した複数の立体物の自車両側の縁と自車両側部の延長線との間の最近接距離を隙間距離として左右それぞれに算出し、この左右の隙間距離に係わる情報を運転者に知らせる技術を提案している。
【0007】
【発明が解決しようとする課題】
先に本出願人が提案した技術では、検出した車両やガードレール等の障害物を輪郭線や直線で近似し、それらとの隙間を算出している。従って、近似処理の過程で無視される虞のある車両やガードレール側面の突起等を考慮し、隙間距離にある程度の余裕度を持たせる必要があった。
【0008】
また、先の技術では、障害物を検出した時点での位置を前提として隙間距離の計算を行っており、例えば、自車両の直前に先行車がいる状態で狭い道路を通過しているような状況では、先行車と自車両との隙間を検出してしまうことになる。従って、前方に先行車が障害物として立ちふさがっているような状況では、左右の障害物との隙間距離を検出することは困難であった。
【0009】
本発明は上記事情に鑑みてなされたもので、検出した障害物の位置の変化や細部形状に関する情報を取り入れ、自車両との接触可能性を正確且つ精密に判断することのできる車外監視装置を提供することを目的としている。
【0010】
【課題を解決するための手段】
請求項1記載の発明は、車外の物体の距離を計測して得られる距離分布の疑似画像を複数の区分に分割し、各区分毎に立体物の有無と距離データとを検出して車外の状況を認識する車外監視装置において、上記距離データが互いに接近し隣接する各区分を1つのグループにまとめ、このグループ毎の立体物の移動速度を算出する手段と、上記グループに属する全ての区分の距離データを、該区分が属するグループの移動速度に応じて移動させ、設定時間後の上記立体物の位置を推定する手段と、上記設定時間後の自車両の輪郭が描く走行軌跡を推定する手段と、上記立体物の推定位置と上記自車両の走行軌跡とを比較し、自車両が立体物に接触するか否かを判定する手段と、上記立体物の推定位置と上記自車両の走行軌跡とに基づいて、自車両と立体物との間の最小隙間を算出する手段とを備えたことを特徴とする。
【0011】
請求項2記載の発明は、請求項1記載の発明において、前回の処理で検出されたグループ内の各距離データと今回の処理で検出されたグループ内の各距離データとを比較してグループ間の対応関係を調べ、対応するグループ間の時間的な移動量から移動速度を算出することを特徴とする。
【0012】
請求項3記載の発明は、請求項1記載の発明において、道路上に静止している立体物の距離データを処理サイクル毎に保持し、当該立体物が検出範囲外に逸脱したとき、前回の距離データと自車両の走行軌跡とに基づいて当該立体物の位置を推定する手段を備えたことを特徴とする。
【0013】
請求項4記載の発明は、請求項1記載の発明において、上記疑似画像は、一組のカメラで撮像した一対の画像の相関を求め、同一物体に対する視差から三角測量の原理によって求めた三次元の距離分布を示すものであることを特徴とする。請求項5記載の発明は、請求項1記載の発明において、上記疑似画像は、一組のカメラで撮像した一対の画像を処理して得られる二次元の距離分布を示すものであることを特徴とする。
【0014】
請求項6記載の発明は、請求項1記載の発明において、上記疑似画像は、レーザ光の投射・受光あるいは電波の発信・受信によって求めた二次元の距離分布を示すものであることを特徴とする。
請求項7記載の発明は、車外の物体の距離を計測して、立体物の有無と立体物に対する距離データとを検出して車外の状況を認識する車外監視装置において、上記距離データが互いに隣接及び接近するものを1つのグループにまとめ、このグループ毎の立体物の移動速度を算出する手段と、上記グループに属する全ての区分の距離データを、該区分が属するグループの移動速度に応じて移動させ、設定時間後の上記立体物の位置を推定する手段と、上記設定時間後の自車両の輪郭が描く走行軌跡を推定する手段と、上記立体物の推定位置と上記自車両の走行軌跡とを比較し、自車両と立体物との間の隙間距離を算出する手段とを備えたことを特徴とする。
【0015】
すなわち、本発明の車外監視装置では、車外の物体までの距離を計測して得られる距離分布の疑似画像を複数の区分に分割し、各区分毎に立体物の有無と距離データとを検出した後、距離データが互いに接近し隣接する各区分を1つのグループにまとめ、このグループ毎の立体物の移動速度を算出すると、グループに属する全ての区分の距離データを、該区分が属するグループの移動速度に応じて移動させ、設定時間後の立体物の位置を推定するとともに、設定時間後の自車両の輪郭が描く走行軌跡を推定する。そして、立体物の推定位置と自車両の走行軌跡とを比較して自車両が立体物に接触するか否かを判定し、また、立体物の推定位置と自車両の走行軌跡とに基づいて自車両と立体物との間の最小隙間を算出する。
【0016】
この場合、立体物の移動速度は、前回の処理で検出されたグループ内の各距離データと今回の処理で検出されたグループ内の各距離データとを比較してグループ間の対応関係を調べ、対応するグループ間の時間的な移動量から算出することが望ましい。また、道路上に静止している立体物に対しては、その距離データを処理サイクル毎に保持しておき、当該立体物が検出範囲外に逸脱したとき、前回の距離データと自車両の走行軌跡とに基づいて当該立体物の位置を推定することが望ましい。
【0017】
また、以上の処理は、一組のカメラで撮像した一対の画像を処理し、互いの撮像画像の相関を求めて同一物体に対する視差から三角測量の原理によって求めた三次元の距離分布を示す疑似画像、一組のカメラで撮像した一対の画像を処理して得られる二次元の距離分布を示す擬似画像、さらには、レーザ光の投射・受光あるいは電波の発信・受信によって二次元の距離分布を求めた疑似画像に基づいて行うことができる。
更に、本発明による他の車外監視装置では、車外の物体までの距離を計測して立体物の有無と立体物に対する距離データとを検出した後、距離データが互いに隣接及び接近するものを1つのグループにまとめ、このグループ毎の立体物の移動速度を算出すると、グループに属する全ての区分の距離データを、該区分が属するグループの移動速度に応じて移動させ、設定時間後の立体物の位置を推定するとともに、設定時間後の自車両の輪郭が描く走行軌跡を推定する。そして、立体物の推定位置と自車両の走行軌跡とを比較し、自車両と立体物との間の隙間距離を算出する。
【0018】
【発明の実施の形態】
以下、図面を参照して本発明の実施の形態を説明する。図1〜図21は本発明の実施の第1形態に係わり、図1は車外監視装置の全体構成図、図2は車外監視装置の回路ブロック図、図3〜図6は立体物検出処理のフローチャート、図7は隙間距離算出処理のフローチャート、図8は車載のカメラで撮像した画像の例を示す説明図、図9は距離画像の例を示す説明図、図10は距離画像の区分を示す説明図、図11は検出対象の状況例を示す説明図、図12は区分毎の立体物の検出距離の例を示す説明図、図13は区分毎の立体物の検出距離をグループ化した例を示す説明図、図14は検出した物体と側壁の結果を示す説明図、図15は自車両輪郭の近似を示す説明図、図16は自車両の通過軌跡を示す説明図、図17は左右判定領域の説明図、図18は設定時間後の立体物の位置の推定結果を示す説明図、図19は視野外距離データの追跡を示す説明図、図20は通過軌跡と距離データとの隙間計測の説明図、図21は自車両と立体物との接触判定の説明図である。
【0019】
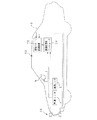
図1において、符号1は自動車等の車両であり、この車両1に、車外の設置範囲内の対象を撮像し、撮像画像から車外の物体を認識して監視する車外監視装置2が搭載されている。この車外監視装置2は、車外の対象物を異なる位置から撮像するためのステレオ光学系10、このステレオ光学系10で撮像した画像を処理して三次元の距離分布情報を算出するイメージプロセッサ20、及び、このイメージプロセッサ20からの距離情報を処理する画像処理用コンピュータ30等から構成されている。また、上記画像処理コンピュータ30には、車速センサ4、舵角センサ5等の現在の車両の走行状態を検出するためのセンサが接続されている。
【0020】
上記ステレオ光学系10は、例えば電荷結合素子(CCD)等の固体撮像素子を用いた左右1組のCCDカメラ10a,10bからなり、上記イメージプロセッサ20では、CCDカメラ10a,10bで撮像した1対の画像の相関を求め、同一物体に対する視差から三角測量の原理により距離を求める、いわゆるステレオ法により画像全体に渡る3次元の距離分布を算出する。
【0021】
上記画像処理用コンピュータ30では、上記イメージプロセッサ20からの距離分布情報を読み込んで道路形状や複数の立体物(車両や障害物等)の3次元位置を高速で検出し、これらの先行車や障害物の移動に伴う位置の変化と自車両の走行軌跡とに基づいて自車両との間の隙間を算出して接触判定を行うとともに、運転者の前方に設置されたディスプレイ9に数値や警告表示等の映像信号を送り、運転者に報知する。
【0022】
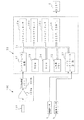
上記イメージプロセッサ20及び上記画像処理用コンピュータ30は、詳細には、図2に示すハードウエア構成となっており、上記イメージプロセッサ20は、上記CCDカメラ10a,10bで撮像した1組みのステレオ画像対に対して所定の小領域毎に同一の物体が写っている部分を探索し、対応する位置のずれ量を求めて物体までの距離を算出し、三次元の距離分布情報として出力する距離検出回路20aと、この距離検出回路20aから出力される距離分布情報を記憶する距離画像メモリ20bとから構成されている。
【0023】
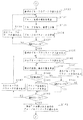
上記距離検出回路20aから出力される距離分布情報は、画像のような形態をした疑似画像(距離画像)であり、左右2台のCCDカメラ11a,11bで撮影した画像、例えば図8に示すような画像(図8は片方のカメラで撮像した画像を模式的に示す)を上記距離検出回路20aで処理すると、図9のような距離画像となる。
【0024】
図9に示す距離画像の例では、画像サイズは横600画素×縦200画素であり、距離データを持っているのは黒点の部分で、これは図8の画像の各画素のうち、左右方向に隣合う画素間で明暗変化が大きい部分である。上記距離検出回路20aでは、この距離画像を、1ブロックを4×4画素の小領域として横150×縦50のブロックからなる画像として扱い、各ブロック毎に距離(画素ズレ数)の算出を行う。
【0025】
一方、上記画像処理用コンピュータ30は、道路形状等の検出処理を主とするマイクロプロセッサ30aと、検出した道路形状に基づいて個々の立体物を検出する処理を主とするマイクロプロセッサ30bと、検出した立体物の位置情報に基づいて先行車や障害物を特定し、自車両との間の隙間を算出して接触危険性を判断する処理を主とするマイクロプロセッサ30cとがシステムバス31を介して並列に接続されたマルチマイクロプロセッサのシステム構成となっている。
【0026】
そして、上記システムバス31には、上記距離画像メモリ20bに接続されるインターフェース回路32と、制御プログラムを格納するROM33と、計算処理途中の各種パラメータを記憶するRAM34と、処理結果のパラメータを記憶する出力用メモリ35と、上記ディスプレイ(DISP)9を制御するためのディスプレイコントローラ(DISP.CONT.)36と、上記車速センサ4、上記舵角センサ5等からの信号を入力するI/Oインターフェース回路37とが接続されている。
【0027】
上記画像処理用コンピュータ30では、画素を単位とする距離画像上の座標系を、図9に示すように、左下隅を原点として横方向をi座標軸,縦方向をj座標軸として扱い、画素ズレ数をdpとする距離画像上の点(i,j,dp)を実空間の座標系に変換し、道路形状の認識や立体物の位置検出等の処理を行う。
【0028】
すなわち、実空間の三次元の座標系を、自車(車両1)固定の座標系とし、X軸を車両1の進行方向右側側方、Y軸を車両1の上方、Z軸を車両1の前方、原点を2台のCCDカメラ10a,10bの中央の真下の道路面とすると、X−Z平面(Y=0)は、道路が平坦な場合、道路面と一致することになり、以下の(1)〜(3)式により、距離画像上の点(i,j,dp)を、実空間上の点(x,y,z)に座標変換することができる。
x=CD/2+z・PW・(i−IV) …(1)
y=CH+Z・PW・(j−JV) …(2)
z=KS/dp …(3)
但し、CD :CCDカメラ10a,10bの間隔
PW :1画素当たりの視野角
CH :CCDカメラ10a,10bの取付け高さ
IV,JV:車両1の真正面の無限遠点の画像上の座標(画素)
KS :距離係数(KS=CD/PW)
尚、実空間上の点(x,y,z)から画像上の点(i,j,dp)を算出する式は、上記(1)〜(3)式を変形し、次のようになる。
【0029】
i =(x−CD/2)/(z・PW)+IV …(4)
j =(y−CH)/(z・PW)+JV …(5)
dp=KS/z …(6)
【0030】
次に、上記画像処理用コンピュータ30における個々の処理について説明する。まず、上記マイクロプロセッサ30aによる道路検出処理では、距離画像メモリ20bに記憶された距離画像からの3次元的な位置情報を利用して実際の道路上の白線だけを分離して抽出し、内蔵した道路モデルのパラメータを実際の道路形状と合致するよう修正・変更して道路形状を認識する。
【0031】
上記道路モデルは、認識対象範囲までの道路の自車線を、設定した距離によって複数個の区間に分け、各区間毎に左右の白線を3次元の直線式で近似して折れ線状に連結したものであり、実空間の座標系における水平方向の直線式のパラメータa,b、及び、垂直方向の直線式のパラメータc,dを求め、以下の(7)式に示す水平方向の直線式、及び、以下の(8)式に示す垂直方向の直線式を得る。
x=a・z+b …(7)
y=c・z+d …(8)
【0032】
また、上記マイクロプロセッサ30bによる立体物検出処理では、距離画像を格子状に所定の間隔で区分し、各区分毎に、上記マイクロプロセッサ30aによって検出された道路形状に基づいて道路表面より上のデータを立体物データとして抽出し、立体物までの距離を算出する。そして、検出された立体物の位置が互いに接近する各区分を1つのグループにまとめ、これらのグループを分類して立体物の後部、側部、及び、ガードレール等の道路に沿った構造物を検出し、その位置や速度等を算出する。
【0033】
さらに、上記マイクロプロセッサ30cによる隙間距離算出処理では、検出された立体物に含まれる区分毎の位置を立体物の速度に応じて移動するとともに、車速センサ4及び舵角センサ5によって検知した自車両の走行状態から自車両の走行軌跡を推定し、移動後の立体物の位置と自車両の走行軌跡とを比較して最小となる隙間距離を算出する。
【0034】
尚、上記距離画像の生成、この距離画像から道路形状を検出する処理については、本出願人によって先に提出された特開平5−265547号公報や特開平6−266828号公報等に詳述されている。
【0035】
以下、上記マイクロプロセッサ30bによる立体物検出処理、及び、上記マイクロプロセッサによる隙間距離算出処理ついて、図3〜図7のフローチャートに従って説明する。
【0036】
まず、上記マイクロプロセッサ30bによる立体物検出処理のプログラムについて説明する。このプログラムでは、最初に、ステップS101〜ステップS114の距離データ検出処理で、距離画像を所定間隔で格子状に区分した各区分毎に、立体物の存在と、その距離の算出を行う。すなわち、ステップS101で道路形状パラメータを読み込むと、ステップS102で、図10に示すように、距離画像を所定間隔(例えば、8〜20画素間隔)で格子状に区分し、ステップS103で、各区分毎に立体物のデータを抽出し、その検出距離を算出するため、最初の区分のデータを読み込む。
【0037】
次に、ステップS104へ進んで区分内の最初のデータをセットすると、ステップS105で被写体の三次元位置(x,y,z)を前述の(1)〜(3)式によって求め、ステップS106で、前述の道路形状の直線式(7),(8)を使って距離zに於ける道路表面の高さyrを算出する。次に、ステップS107へ進み、以下の(9)式によって算出した被写体の道路表面からの高さHに基づいて、道路面より上にあるデータを立体物データとして抽出する。
H=y−yr …(9)
【0038】
この場合、高さHが0.1m程度以下の被写体は、道路上の白線や汚れ、影等と考えられるため、この被写体のデータは棄却する。また、自車両1の高さより上にある被写体も、歩道橋や標識などと考えられるので棄却し、道路上の立体物と推定されるデータのみを選別する。
【0039】
その後、ステップS108へ進んで最終データか否かを調べ、最終データでないときには、ステップS109で区分内の次のデータをセットして前述のステップS105へ戻り、同様の処理を繰り返して道路面より上にあるデータを抽出する。そして、1つの区分内で最終データの処理が完了すると、ステップS108からステップS110へ進み、抽出された立体物データに対し、予め設定された距離Zの区間に含まれるデータの個数を数えて距離zを横軸とするヒストグラムを作成する。
【0040】
続くステップS111では、ヒストグラムの度数が判定値以上で、かつ最大値となる区間を検出し、該当する区間があれば、ステップS112において、その区間に立体物が存在すると判断し、その立体物までの距離を検出する。
【0041】
上記ヒストグラムでは、入力される距離画像中の距離データには誤って検出された値も存在し、実際には物体の存在しない位置にも多少のデータが現れる。しかしながら、ある程度の大きさの物体があると、その位置の度数は大きな値を示し、一方、物体が何も存在しない場合には誤った距離データのみによって発生する度数は小さな値となる。従って、作成されたヒストグラムの度数が、予め設定した判定値以上かつ最大値をとる区間があれば、その区間に物体が存在すると判断し、度数の最大値が判定値以下の場合は物体が存在しないと判断しても差し支えなく、画像のデータに多少のノイズが含まれている場合においても、ノイズの影響を最小限にして物体を検出できる。
【0042】
その後、上記ステップS112からステップS113へ進んで最終区分に達したか否かを調べる。そして、最終区分に達していないときには、上記ステップS112からステップS114へ進んで次の区分のデータを読み込むと、前述のステップS104へ戻り、道路面より上にあるデータの抽出、ヒストグラムの作成、及び、各区分内での立体物の検出と距離の算出を行う。以上の処理を繰り返し、やがて、最終区分に達すると、上記ステップS113からステップS115以降へ進む。
【0043】
図12は、図11に示す検出対象の画像を以上の距離データ検出処理によって検出し、区分毎の距離をX−Z平面上に示した例であり、検出した距離に多少の誤差が含まれるため、黒点で示すように、立体物の自車両に面した部分に多少のバラツキを持ったデータとして検出される。
【0044】
これらの距離データは、ステップS115〜ステップS121の距離グループ検出処理により、距離が接近しているグループに分けられる。この処理では、各区分の立体物の検出距離を調べ、隣接する区分において立体物までの検出距離の差異が判定値以下の場合は同一の立体物と見なし、一方、判定値を超えている場合は別々の立体物と見なしてグループ分けを行う。
【0045】
このため、ステップS115では、まず、最初の区分(例えば左端)を調べ、立体物が検出されている場合には、距離データを読み込んで、この区分R1を、グループS1、距離Z1に分類する。次に、ステップS116へ進んで右隣の区分R2を調べ、立体物が検出されていない場合には、グループS1は区分R1の内部とその近辺に存在し、その距離はZ1と判定し、一方、区分R2で立体物が検出されており、その検出距離がZ2である場合には、区分R1の距離Z1と右隣の区分R2の距離Z2の差を計算する。
【0046】
その後、ステップS117へ進んで右隣の区分との距離の差が判定値以下か否かを調べ、距離の差が判定値以下で互いに接近しているときには、ステップS118で、区分R2で検出された立体物は、先に検出されたグループS1に属すると判定して同一グループにラベル付けを行い、その距離をZ1とZ2との平均値としてステップS120へ進む。
【0047】
一方、右隣の区分との距離の差が判定値を超えているときには、上記ステップS117からステップS119へ進み、区分R2で検出された立体物は、先に検出されたグループS1とは異なると判定して新しいグループ(グループS2、距離Z2)にラベル付けを行い、ステップS120へ進む。
【0048】
ステップS120では、最終区分に達したか否かを調べ、最終区分に達していないときには、ステップS121で次の区分の距離を読み込み、上記ステップS116へ戻っり、さらに右隣の領域を調べてゆく。また、最終区分に達したときには、ステップS120からステップS122以降へ進む。
【0049】
以上の距離グループ検出処理により、例えば、図12に示す区分毎の距離データに対し、互いの距離が接近している距離データがまとめられ、図13に示すようにグループ化される。このとき、各区分には、その区分が所属するグループの番号が割り付けられ、記憶される。図13の例では、進行方向左側の植え込みの距離データを有する区分が所属するグループに、グループ1,2,3の番号が付けられ、先行車両の後部の距離データを有する区分が所属するグループにグループ4の番号が付けられる。また、進行方向右側の自転車の距離データを有する区分が所属するグループにグループ6の番号が付けられ、同じく右側の壁の距離データを有する区分が所属するグループにグループ7の番号が付けられる。
【0050】
この場合、異なる立体物であっても互いに距離が接近している区分は、同一のグループとして処理される虞がある。このため、次のステップS122〜ステップS132におけるグループ分割処理では、距離データのX−Z平面上での並び方向を調べ、並び方向がZ軸に概ね平行な部分とX軸に概ね平行な部分とでグループを分割する。
【0051】
このグループ分割処理では、ステップS122で、最初のグループのデータを読み込み、ステップS123で、このグループ内の各区分の並び方向を算出すると、ステップS124で各区分に“物体”、“側壁”のラベルを付ける。具体的には、グループ内での左端の区分K1の位置をZ1,X1とし、N個だけ右側の区分の位置をZp,Xpとすると、点X1,Z1と点Xp,Zpとの2点を結ぶ直線のZ軸に対する傾きA1を算出し、この直線の傾きA1を設定値(例えば、45°程度)と比較する。そして、直線の傾きA1が設定値以下でデータの並びが略Z軸方向の場合には、区分K1は“側壁”とラベル付けし、上記直線の傾きA1が設定値を超え、データの並びが略X軸方向の場合には、“物体”とラベル付けする。
【0052】
このラベル付けの際の区分の間隔Nは、N=2〜4区分程度とする。これは、N=1すなわち右隣の区分では、検出距離のバラツキのために並び方向が大きくばらついてしまい、分割の判断が難しくなるためであり、少し離れた区分との並び方向を使うことにより、方向の安定化を図る。そして、この“側壁”あるいは“物体”のラベル付けを、グループ内の左端から順に、右端からN個左側の区分まで行い、各区分にラベル付けをする。
【0053】
以上により、各区分のラベル付けが完了すると、上記ステップS124からステップS125へ進んで左端の区分のラベルを読み込み、さらに、ステップS126で右隣の区分のラベルを読み込む。次いで、ステップS127へ進み、左端のラベルと右隣のラベルが異なるか否かを調べる。その結果、上記ステップS127において、ラベルが同じときにはステップS129へジャンプし、ラベルが異なるとき、ステップS128で“側壁”とラベル付けされた区分と“物体”とラベル付けされた区分とを分割して別のグループとし、ステップS129へ進む。分割する区分の位置は、ラベルが“側壁”←→“物体”で変化する位置のN/2区分だけ右側となる。
【0054】
この場合、距離データのバラツキ等により部分的にラベルが変化する状況に対処するため、同じラベルが判定値以上(例えば、3区分以上)連続して並んでいる場合にのみ分割を行い、判定値未満の場合には、分割は行わない。例えば、図13の例では、グループ6(自転車)等の場合のように、形状が複雑なため、“物体”とラベル付けされる区分と“側壁”とラベル付けされる区分とが混在するグループでは、同種のラベルが3区分以上に連続しないため、グループの分割は発生しない。
【0055】
ステップS129では、最終区分か否かを調べ、最終区分でないとき、ステップS130で次の区分のラベルを読み込んで上記ステップS126へ戻り、同様の処理を繰り返す。そして、最終区分に達すると、上記ステップS129からステップS131ヘ進み、最終グループに達したか否かを調べる。その結果、最終グループに達していないときには、ステップS132で次のグループのデータを読み込み、次のグループに対して同様にグループを分割する処理を行う。この処理を繰り返し、やがて、最終グループに達すると、グループ分割処理を完了してステップS131からステップS133以降へ進む。
【0056】
次のステップS133〜ステップS138は、分割された各グループに対し、側壁か物体かの分類を行って各グループのパラメータを算出する処理であり、ステップS133で最初のグループのデータを読み込むと、ステップS135で、グループ内の各区分の位置(Xi,Zi)からハフ変換あるいは最小二乗法によって近似直線を求め、グループ全体の傾きを算出する。
【0057】
次に、ステップS135へ進んで、グループ全体の傾きから、X軸方向の傾きを有するグループを物体、Z軸方向の傾きを有するグループを側壁に分類し、ステップS136で、各グループのパラメータを算出する。このパラメータは、物体と分類されたグループでは、グループ内の距離データから算出される平均距離や、左端、右端のX座標等のパラメータであり、側壁と分類されたグループでは、並びの方向(Z軸との傾き)や前後端の位置(Z,X座標)等のパラメータである。
【0058】
尚、グループの分類は、前述のグループ分割処理で付けられた各区分の“側壁”あるいは“物体”のラベルによって行っても良い。
【0059】
そして、上記ステップS136からステップS137へ進んで最終グループに達したか否かを調べ、最終グループでないときには、ステップS138で次のグループのデータを読み込んで上記ステップS134へ戻り、最終グループに達すると、ステップS139以降の処理へ進む。
【0060】
ここで、立体物の1個の面、例えば連続したガードレール等では、区分毎の距離データのバラツキの影響を強く受けることがあり、先の距離グループ検出処理あるいはグループ分割処理で複数のグループに分割されてしまい、立体物の1つの面を誤って分割して検出する虞がある。
【0061】
この対策として、以下のステップS139〜ステップS147のグループ結合処理において、先のグループパラメータ算出処理で算出されたグループパラメータによって各グループの相互の位置関係を調べ、同種類のグループで端点の位置が接近し、且つ、並び方向がほぼ等しい場合には、同一物体の同一の面であると判断し、それらのグループを1個のグループに統合する。そして、統合したグループとしての各種パラメータをグループパラメータ算出処理と同様にして再計算する。
【0062】
このため、ステップS139で、最初のグループのパラメータを読み込み、ステップS140で、次のグループのパラメータを読み込むと、ステップS141で、各グループの端点の距離の差、及び、各グループの傾きの差を算出する。そして、ステップS142で、各グループの端点の距離の差、及び、各グループの傾きの差が、それぞれの判定値以内か否かを調べ、共に判定値以内のとき、ステップS143へ進んで同一物体のグループとしてグループを結合し、再度、改めてグループのパラメータを算出してステップS146へ進む。
【0063】
一方、上記ステップS142で、各グループの端点の距離の差、あるいは、各グループの傾きの差が判定値以内でないときには、上記ステップS142からステップS144へ進んで最終グループか否かを調べ、最終グループでないときには、ステップS145で次のグループのパラメータを読み込んでステップS141へ戻り、最終グループのとき、ステップS146へ進む。
【0064】
ステップS146では、最終グループか否かを調べ、最終グループでないとき、ステップS147で次のグループのパラメータを読み込んで上記ステップS140へ戻り、最終グループのとき、ステップS148以降へ進む。
【0065】
以上のグループ結合処理の後、同一立体物の後部と側面で別のグループに分離されているものに対し、下のステップS148〜ステップS157の処理により、同一の立体物であることを検出し、1個の立体物を、“物体”と“側壁”との組み合わせ(後部は“物体”、側面は“側壁”とする)として認識する。
【0066】
この処理では、まず、ステップS148で、物体と分類された最初のグループのパラメータを読み込み、ステップS149で、側壁と分類された最初のグループのパラメータを読み込む。次いで、ステップS150へ進み、物体と分類されたグループの端点の位置と、側壁と分類されたグループの端点の位置との差を算出する。この場合、各端点の位置は、“物体”が自動車の正面(Z軸に相当)より右側にある場合には、“物体”の左端の位置と“側壁”の手前側の端点の位置との差を算出し、“物体”が自車両の正面より左側にある場合には、“物体”の右端の位置と“側壁”の手前側の端点の位置との差を算出する。
【0067】
そして、ステップS151で、各グループの端点の位置の差が判定値(例えば、1m程度)以内で、互いに接近しているか否かを調べ、判定値を超えているときには、ステップS152へ分岐して最終側壁か否かを調べ、最終側壁でないときには、ステップS153で側壁と分類された次のグループのパラメータを読み込んで上記ステップS150へ戻り、最終側壁のとき、ステップS156へ進む。
【0068】
一方、上記ステップS151で、各グループの端点の位置の差が判定値以内のときには、上記ステップS151からステップS154へ進んで同一立体物であると判定する。すなわち、1個の立体物の後部と側面とが同時に見える場合、その2つの面が作るコーナーは手前に凸となっているため、“物体”の左端の位置と“側壁”の手前側の端点の位置、あるいは、“物体”の右端の位置と“側壁”の手前側の端点の位置とは、本来、一致している。従って、2つのグループの位置の差が上記判定値以内にあるとき、この2つのグループは1個の立体物を分けて検出した対であると判断することができる。
【0069】
その後、上記ステップS154からステップS155へ進み、同一の立体物と判断された“物体”と“側壁”との対に対し、それぞれの近似直線を延長して交差する点を立体物のコーナー点の位置として算出すると、各端点の位置を、このコーナー点の位置に変更する。そして、ステップS156で、“物体”の最終グループか否かを調べ、“物体”の最終グループでないときには、ステップS157で、“物体”と分類された次のグループのパラメータを読み込み、上記ステップS149へ戻って同様の処理を繰り返す。一方、ステップS156で“物体”の最終のグループのときには、次のステップS158以降の処理へ進む。
【0070】
図14は、図11に示す検出対象例に対し、“物体”及び“側壁”の検出結果を、X−Z平面で示したものであり、この例では、上述のグループの結合や“物体”と“側壁”の組み合わせと判定されるグループはなく、“物体”は太線の実線で示され、“側壁”は太線の破線で示される。
【0071】
次に、ステップS158以降は、所定の時間間隔(例えば、0.1sec)の処理サイクル毎に検出される“物体”や“側壁“の位置の変化から、これらの移動速度を算出する速度算出処理であり、まず、ステップS158で、最初のグループのパラメータを読み込み、ステップS159で同一立体物の対となっているか否かを調べる。
【0072】
そして、同一立体物の対となっていないときには、上記ステップS159からステップS160へ進み、“物体”では左右端の中央、“側壁”では前後端の中央を中心点の位置として、この中心点の位置の時間変化量を算出すると、ステップS161で、前後方向の速度すなわちZ方向の速度Vzを、中心点のZ座標の時間変化量から算出するともに、左右方向の速度すなわちX方向の速度を、中心点のX座標の時間変化量から算出し、ステップS164へジャンプする。
【0073】
ステップS164では、最終グループか否かを調べ、最終グループでないときには、ステップS165で次のグループのパラメータを読み込み、ステップS159へ戻って同一立体物の対か否かを調べる。その結果、同一立体物の対でないときには、前述のステップS160,S161を経て中心点の位置に時間変化から前後・左右方向の速度を算出し、最終グループか否かを調べるステップS164へ戻る。
【0074】
一方、上記ステップS159で同一立体物の対であるときには、上記ステップS159からステップS162へ進んで、対応する“物体”又は“側壁”のパラメータを読み込み、ステップS163で、“物体”から前後方向の速度(Z軸方向の速度Vz)を算出するとともに、“側壁”から左右方向の速度(X軸方向の速度Vx)を算出し、これらの速度Vz,Vxを、同一立体物におけるZ軸方向、X軸方向の速度とする。そして、ステップS164で、最終グループか否かを調べ、最終グループでないときには、以上の処理を繰り返し、最終グループのとき、ステップS164からステップS166へ進んで、各グループのパラメータをメモリに書き込み、立体物検出処理の全体のプログラムを終了する。
【0075】
すなわち、“物体”では、Z軸方向の位置は複数の区分の距離の平均値的な値となり、速度Vzは安定しているが、X方向の位置は左右端のX座標のバラツキの影響を受け、速度Vxはバラツキが大きい傾向にある。一方、“側壁”では、X方向の位置は複数の区分のX座標の平均値的な値となり、速度Vxは安定しているが、Z方向の位置は前後端のZ座標のバラツキの影響を受け、速度Vzはバラツキが大きくなる傾向にある。従って、両方の安定した速度のみを用いて同一立体物の速度とするのである。
【0076】
この場合、前回の処理で検出された距離データと、今回の処理で検出された距離データとでは、同一の立体物の同一部分を検出している距離データの対応関係を求めることは困難であり、個々の距離データから対象物の速度を求めることは困難である。しかしながら、本発明においては、個々の距離データを立体物毎にグループ化し、グループ毎に直線状に近似して、その中心点を求めているため、前回処理時に検出されたグループと今回の処理で検出されたグループとの対応関係を求めることは容易であり、中心点の移動量から対象物の速度を算出することができる。
【0077】
以上の処理によって検出された物体や側壁のデータは、マイクロプロセッサ30cによる隙間距離算出処理のプログラムに渡され、予測時間t後の立体物の位置と自車両の走行領域とに基づいて接触危険性が判断されるとともに、自車両と立体物との隙間距離が算出される。
【0078】
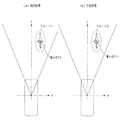
この隙間距離算出処理のプログラムでは、ステップS201で、自車両の通過軌跡を推定する。この自車両の通過軌跡は、自車両の輪郭をn個の頂点からなる多角形で直線近似した内蔵モデルを利用して推定するようにしており、図15(a)に示すような自車両の輪郭を、図15(b)に示すように、後車軸中心を原点とした頂点nの座標Pn=[Pxn,Pzn]Tで近似し、予測時間t(例えば、1、2秒)後の頂点nの座標Pn'=[P'xn,P'zn]Tを求めることで、自車両の通過軌跡を推定する。
【0079】
このため、まず、車速センサ4から得た車速と舵角センサ5から得た操舵角とから、予測時間tにおける後車軸中心を基準とした空走距離L及び旋回半径Rを求める。この空走距離Lは、自車両の速度に比例する距離と最低限走行する距離(例えば、〜1m程度)からなり、また、旋回半径Rの中心は後車軸延長線上に重なるものとする。そして、旋回中心の座標をO=[Ox,Oz]Tとし、旋回角度をθとすると、この旋回角度θは、以下の(10)式によって与えられ、予測時間t後の頂点nの座標は、以下の(11)式で与えられる。
θ=L/R …(10)

また、各頂点の旋回半径rnは、以下の(12)式で求めることができるため、これを用い、旋回半径が最大の(最も外側を通る)頂点番号noと最小の(最も内側を通る)頂点番号niを求める。そして、頂点番号noの現在の座標Pnoと予測時間t後の座標P'noとを、(12)式を適用して求めた最大旋回半径rnoの円弧で繋ぐとともに、頂点番号niの現在の座標Pniと予測時間t後の座標P'niとを、(12)式を適用して求めた最小旋回半径rniの円弧で繋ぎ、残った頂点を、それぞれ隣り合う頂点と直線で繋ぐことにより、図16に示すように、自車両の通過軌跡を得ることができる。
rn=((Pxn−Ox)2+(Pzn−Oz)2)1/2 …(12)
【0081】
この場合、舵角0すなわち旋回半径無限大のときには、計算実行が不可能になるため、予測時間t後の頂点nの座標は、以下の(13)式で求め、左右それぞれに最も張り出した頂点を直線で繋いで推定通過軌跡とする。
そして、自車両の通過軌跡を推定した後、上記ステップS201からステップS202へ進み、後述する接触判定及び隙間計測のため、自車両の輪郭モデル(図15参照)の先端中央Cf=[Cxf,Czf]Tと後端中央Cr=[Cxr,Czr]Tとを、各頂点と同様に予測時間t後の位置C'f,C'rを算出し、図17に示すように、通過軌跡による走行領域を右側の判定領域と左側の判定領域とに分割する。
【0083】
続くステップS203では、先の立体物検出処理で得られた各グループの速度Vx,Vzから、予測時間tにおける立体物のX方向移動量dx、Z方向移動量dzを以下の(14),(15)式によって求め、各距離データをX方向移動量dx、Z方向移動量dzだけ移動させ、予測時間t後の立体物の位置を推定する。
dx=Vx・t …(14)
dz=Vz・t …(15)
【0084】
図13に示す立体物の位置の検出結果をグループ化した例では、植え込みを検出したグループ1,2,3、及び、右の壁を検出したグループ7ではX方向、Z方向ともに速度は略0と検出されるため、予測時間t後の位置は検出位置から変化しない。また、先行車両を検出したグループ4では、例えば、速度Vx=0、Vz=4.0m/secと検出されたものとし、t=1.5secと仮定すると、グループ4の移動量はdx=0.0m、dz=6.0mとなる。また、自転車を検出したグループ6は、例えば、Vx=−0.1m/sec、Vz=−1.0m/secと検出されたとすると、移動量は、dx=−0.15m、dz=−1.5mとなる。図18は、各距離データを、X方向移動量dx、Z方向移動量dzだけ移動させた予測時間t後の推定位置を示している。
【0085】
その後、ステップS204へ進み、ステレオカメラの視野外となった立体物について、距離データの追跡を行う。X方向及びZ方向とも速度略0と検出された距離データのグループは道路上に静止している立体物とし、その距離データが各処理サイクル毎に保持されている。
【0086】
k番目の処理サイクルとk−1番目の処理サイクル間の走行軌跡は、車速センサ4及び舵角センサ5により、走行軌跡L'、旋回半径R'として得ることができる。このとき、走行距離L'は、k番目の処理サイクルでの位置を基準にするため、L'<0となり、旋回中心の座標をO'=[O'x,O'z]Tとし、旋回角度をαとすると、この旋回角度αは、以下の(16)式によって与えられる。
α=L'/R' …(16)
【0087】
従って、k−1番目の処理サイクルでの距離データをD=[Dx,Dz]Tとすると、k番目の処理サイクルでの距離データD'は、以下の(17)式によって求めることができ、これを処理サイクル毎に更新してゆくことにより、図19に示すように、ステレオカメラの視野外に逸脱してしまった距離データを追跡することができる。
その後、上記視野外に逸脱してしまった立体物の追跡データを含め、自車両通過軌跡と立体物の接触判定を行うため、ステップS205で、予測時間t後の位置を推定した距離データの中から最初のデータを読み込むと、ステップS206で、その推定距離データが右側判定領域内にあるか否かを調べる。
【0089】
そして、推定距離データが右側判定領域内にない場合には、上記ステップS206からステップS208へ進み、右側判定領域内にある場合、自車両と接触する可能性があると判断して上記ステップS206からステップS207へ進んで右側の接触を示す右側接触フラグをONし、ステップS208へ進む。
【0090】
ステップS208では、推定距離データが左側判定領域内にあるか否かを調べ、左側判定領域内にない場合、ステップS210へ進み、推定距離データが左側判定領域内にある場合、ステップS211で左側の接触を示す左側接触フラグをONし、ステップS210へ進む。
【0091】
ステップS210では、右側あるいは左側の接触フラグがONされたか否かを調べ、いずれかの側の接触フラグがONされたときには、ステップS211で警報を発生し、ディスプレイ9への警告表示、あるいは、ランプ、ブザー等による警告を行い、運転者に知らせる。
【0092】
一方、上記ステップS210で、左右の接触フラグがONされていないときには、上記ステップS210からステップS212へ進み、接触判定領域外の推定距離データを、通過軌跡前面より前方にあるデータを除いて車体中心線左右にグループに振り分ける。次に、ステップS213で、接触判定領域外の推定距離データと自車両の通過軌跡との間の隙間距離を算出する。この隙間距離は、図20に示すように、左グループの場合は自車両左側面の通過軌跡に対して、右グループの場合は自車両右側面の通過軌跡に対して法線を引き、この長さを“隙間距離”とし、その値を記憶する。
【0093】
その後、ステップS214へ進んで最終の推定距離データか否かを調べ、最終の推定距離データに達していないときには、ステップS215で次の推定距離データを読み込んで上記ステップS206へ戻り、以上の処理を繰り返す。そして全ての推定距離データについて接触判定を完了すると、上記ステップS214からステップS216へ進み、左右各グループ毎に隙間距離の最小値を算出して保持し、ステップS217で、数値表示あるいは算出した隙間距離の最小値に応じて注意を喚起するための表示信号をディスプレイ9に出力し、運転者に報知する。
【0094】
図21は、図18に示す予測時間t後の各距離データの推定位置に対し、自車両の走行領域を記入したものであり、この例では、先行車両の現在の検出位置は自車両の走行領域に入っているが、立体物の速度と自車両の走行軌跡とを考慮し、設定時間後の推定位置に対して接触判定を行うため、先行車両とは接触しないと正しく判定することができる。
【0095】
また、図21における自転車のように複雑な対象物に対しても、グループ内の個々の距離データをグループの速度に応じて移動させるため、検出される対象物の凹凸がそのまま保持され、接触判定を精密に行うことができる。図21の例では、自転車に接触する危険があると正しく判定され、思わぬ事故を未然に回避することができる。図21においては、植え込みのように、静止している立体物に対しても同様である。
【0096】
しかも、この場合、自車両の輪郭が描く走行軌跡を、自車両の速度及び舵角に応じて推定するため、対象物の凹凸を考慮することに合わせ、自車両の凹凸も考慮され、接触判定、隙間計測の精度を向上することができるばかりでなく、運転者の注視する領域と接触判定領域とを近づけることができ、違和感の少ない警報を発することができる。
【0097】
さらに、検出範囲外に逸脱してしまった対象物に対しても距離データの追跡を行うため、自車両のすぐ横の立体物に対しても、接触判定、隙間計測を行うことができ、特に、内輪差の影響による接触事故防止に大きな効果を発揮することができる。
【0098】
図22及び図23は本発明の実施の第2形態に係わり、図22は立体物検出処理の部分フローチャート、図23はグループの対応関係を示す説明図である。
【0099】
前述の第1形態では、立体物の移動速度を検出するため、検出したグループを“物体”又は“側壁”として直線状に近似し、その中心点を求める処理を行っている。これに対し、本形態では、前回処理で検出したグループ内の個々の距離データと今回処理で検出したグループ内の個々の距離データとを比較し、グループとしての移動量を求め、速度を算出するものである。
【0100】
このため、本形態では、画像処理用コンピュータ30のマイクロプロセッサ30bによる立体物検出処理の一部を変更する。本形態の立体物検出処理は、第1形態の図3〜図6のプログラムにおいて、ステップS101〜S114の距離データ検出処理、ステップS115〜S121の距離グループ検出処理、ステップS122〜S132のグループ分割処理までは同じであり、このグループ分割処理以降を変更する。
【0101】
すなわち、本形態では、ステップS122〜S132のグループ分割処理を完了すると、ステップS132から図22のステップS170へ進み、ステップS170〜S174で、前回処理で検出された複数のグループの中から今回の処理で検出されたグループと、同一の立体物を検出しているグループを検索してグループの対応関係を求める処理を行った後、ステップS175以降で、今回処理で検出されたグループと対応関係にある前回検出のグループとの間の移動量からグループの速度を求める。
【0102】
このため、まず、ステップS170で今回検出の最初のグループのデータを読み込むと、ステップS171で、グループ内の距離データの重心点(Xc,Zc)を求める。この重心点(Xc,Zc)は、グループ内のi番目の距離データの位置をxi、ziとし、nをグループに所属する距離データの個数とすると、以下の(18),(19)式によって求めることができる。但し、Σはi=1〜nの総和を求めるものとする。
Xc=(Σxi)/n …(18)
Zc=(Σzi)/n …(19)
【0103】
次に、ステップS172へ進み、前回処理で検出されたグループの重心点を読み出し、この前回検出のグループの重心点と今回検出のグループの重心点との間の距離(重心点の移動量)を算出すると、ステップS173で、各グループの重心点間の距離が判定値以下か否かを調べる。そして、前回処理で検出されたグループの重心点と今回検出のグループの重心点との間の距離が判定値を超えているときには、これらのグループは同一立体物を検出したものではないと判断してステップS174へ進み、前回検出の次のグループの重心点を読み出して上記ステップS172へ戻る。
【0104】
一方、上記ステップS173で、各グループの重心点間の距離が判定値以下のときには、これらのグループは同一立体物を検出した対応関係にあると判断して上記ステップS173からステップS175へ進み、前回検出のグループ内の各距離データを移動させてグループ間のズレ量が最小となる修正量を算出する。
【0105】
例えば、図23に示すように、前回検出のグループFと今回検出のグループGが対応関係にあるとすると、まず、前回検出のグループFの各距離データを、今回検出のグループGの重心点PGと前回検出のグループFの重心点PFとが一致するように移動する。
【0106】
次に、この移動後のグループF1の各距離データiF1について、今回検出のグループG内で最も距離が近い距離データiGを求め、各距離データiF1,iG間の距離diF1を求める。これを移動後のグループF1内の全ての距離データについて行い、距離diF1の二乗和SDK1(ズレ量)を、以下の(20)式によって求める。
SDK1=ΣdiF12 …(20)
【0107】
さらに、グループF1の全体の位置を、Z方向及びX方向に微小量Δz,Δxだけ移動し、この移動後のグループF2と今回検出のグループGとの間のズレ量SDK2を、上記と同様に算出する。そして、この処理を、Δz,Δxを変化させて繰り返し、各ずれ量SDK1,SDK2,SDK3,…の中で最小値が得られる微小量Δz,Δxの値を、グループ間のズレ量が最小となる修正量とする。
【0108】
以上により、グループ間のズレ量が最小となる修正量を求めると、次に、ステップS176へ進み、対応関係にあるグループ間の重心点の移動量に上記修正量を加えた値をグループ間の移動量とし、ステップS177で、この移動量を処理サイクル毎の時間間隔で割り算してグループの速度Vz,Vxを算出する。次いで、ステップS178で最終グループか否かを調べ、最終グループでないときには、ステップS179で次のグループのデータを読み込んでステップS171へ戻り、以上の処理を繰り返す。尚、簡易的には、上記ステップS172で算出した重心点の移動量を処理サイクル毎の時間間隔で割り算し、グループの速度としても良い。
【0109】
そして、上記ステップS178で最終グループとなって最終グループの処理が完了したとき、上記ステップS178からステップS180へ進んで各グループの位置や速度等のパラメータをメモリに書き込み、立体物検出処理の全体のプログラムを終了する。この立体部検出処理のデータを用いる以降の隙間距離算出処理は、前述の第1形態と同じである。
【0110】
本形態では、前述の第1形態に対し、立体物の移動速度を高い精度で検出することができ、接触判定や隙間距離の精度をより一層向上することができる。
【0111】
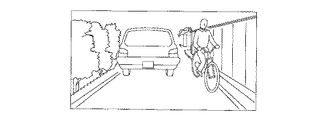
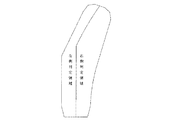
図24〜図27は本発明の第3形態に係り、図24は車外監視装置の全体構成図、図25は車外監視装置の回路ブロック図、図26は画像の例を示す説明図、図27は立体物の二次元分布の例を示す説明図である。
【0112】
本形態の車外監視装置50は、図24に示すように、上下2台のカメラからなるステレオ光学系60からの画像を処理して立体物の二次元的な位置分布を認識する通路パターン認識装置70を採用し、この通路パターン認識装置70に第1形態と同様の画像処理用コンピュータ30を接続したものであり、通路パターン認識装置70によって得られる立体物の二次元分布の位置情報を前述の第1形態と同様の方法で処理するものである。
【0113】
上記通路パターン認識装置70は、周知の装置を適用することができ、例えば、計測自動制御学会論文集Vol.21,No.2(昭和60年2月)「障害物の2次元的な分布の認識手法」に記載されている通路パターン認識装置等を適用することができる。尚、上記通路パターン認識装置70は、前述の第1形態と同様に2台のカメラの画像を処理して被写体までの距離分布を検出するものであるが、装置内部のデータ処理方法が異なるため立体物の情報のみが出力され、第1形態のような白線による道路形状の検出はできない。
【0114】
上記ステレオ光学系60は、車両40の前部に上下一定の間隔をもって取り付けられる2台のCCDカメラ60a,60bで構成されており、また、上記通路パターン認識装置70は、図25に示すように、上記ステレオ光学系60からの上下2枚の画像信号を入力し、立体物の距離及び位置の二次元分布を算出する距離検出回路60a、この距離検出回路60aからの二次元分布情報を記憶する二次元分布メモリ60b等から構成されている。
【0115】
本形態では、ステレオ光学系60で撮像した画像、例えば、図26に示すような画像を通路パターン認識装置70で処理すると、図27に示すような立体物の二次元分布パターンが出力される。これは、前述の第1形態における区分毎の距離データに相当するものであり、この立体物の二次元分布パターンに対し、前述の第1形態と同様の処理を行うことにより、立体物検出、接触判定、隙間距離計測を行うことができる。
【0116】
本形態では、側壁の有無や位置を、直線式のパラメータや前後端の座標といった簡素なデータ形態に変換するため、利用側でのデータの取扱いや処理が容易となる。
【0117】
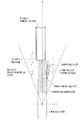
図28〜図32は本発明の実施の第4形態に係わり、図28は車外監視装置の全体構成図、図29は車外監視装置の回路ブロック図、図30はレーザビームの走査方法を側面から示す説明図、図31はレーザビームの走査方法を上面から示す説明図、図32はレーザレーダ測距装置で計測される立体物の二次元分布の例を示す説明図である。
【0118】
前述の各形態ではカメラの撮像画像を処理して車外の物体を検出するようにしているが、これに対し、本形態は、レーザビームの走査によって車外の物体を検出するものである。すなわち、図28に示すように、本形態の車両80に搭載される車外監視装置90は、レーザビームによるレーザレーダ測距装置100を採用し、このレーザレーダ測距装置100に画像処理用コンピュータ30を接続したものである。
【0119】
上記レーザレーダ測距装置100は、レーザビームを投射し、このレーザビームが物体に当たって反射してくる光を受光し、この所要時間から物体までの距離を測定するものであり、本形態の車外監視装置90には周知のレーザレーダ測距装置を適用することができる。
【0120】
本形態の車外監視装置90では、レーザビームの投射・受光と左右方向への走査機能を有するレーザ投光ユニット101が車両の前部に取り付けられており、図29に示すように、レーザレーダ測距装置100には、レーザービームの投光受光の所要時間から物体までの距離を計算し、また、レーザビームを走査する方向から物体の二次元の位置を計算する距離検出回路100a、検出された物体の二次元の位置を書き込む二次元分布メモリ100b等から構成されている。
【0121】
図30に示すように、レーザ投光ユニット101からはレーザビームが水平に投射され、道路表面より高い位置にある立体物のみが検出される。また、図31に示すように、レーザビームは左右方向に走査され、所定の走査範囲で一定の間隔毎にレーザビームが投光・受光されて距離を検出する動作が繰り返され、立体物の二次元分布が計測される。
【0122】
例えば、前方左側にガードレール、右前方に他の車両がある状況を上記レーザレーダ測距装置100で計測すると、図32に示すような立体物の二次元分布の情報が得られる。これは、前述の第1形態における区分毎の立体物の距離データと同様である。
【0123】
従って、レーザレーダ測距装置100の出力である立体物の二次元分布に対し、第1形態と同様の処理を行なうことにより、物体や壁面を検出することができる。本形態では、立体物のデータを処理が容易な形態で得ることができ、計算処理量を低減することが可能である。
【0124】
【発明の効果】
以上説明したように本発明によれば、検出した障害物の位置の変化や細部形状に関する情報を取り入れて自車両との接触可能性を正確且つ精密に判断することができる等優れた効果が得られる。
【図面の簡単な説明】
【図1】本発明の実施の第1形態に係わり、車外監視装置の全体構成図
【図2】同上、車外監視装置の回路ブロック図
【図3】同上、立体物検出処理のフローチャート(その1)
【図4】同上、立体物検出処理のフローチャート(その2)
【図5】同上、立体物検出処理のフローチャート(その3)
【図6】同上、立体物検出処理のフローチャート(その4)
【図7】同上、隙間距離算出処理のフローチャート
【図8】同上、車載のカメラで撮像した画像の例を示す説明図
【図9】同上、距離画像の例を示す説明図
【図10】同上、距離画像の区分を示す説明図
【図11】同上、検出対象の状況例を示す説明図
【図12】同上、区分毎の立体物の検出距離の例を示す説明図
【図13】同上、区分毎の立体物の検出距離をグループ化した例を示す説明図
【図14】同上、検出した物体と側壁の結果を示す説明図
【図15】同上、自車両輪郭の近似を示す説明図
【図16】同上、自車両の通過軌跡を示す説明図
【図17】同上、左右判定領域の説明図
【図18】同上、設定時間後の立体物の位置の推定結果を示す説明図
【図19】同上、視野外距離データの追跡を示す説明図
【図20】同上、通過軌跡と距離データとの隙間計測の説明図
【図21】同上、自車両と立体物との接触判定の説明図
【図22】本発明の実施の第2形態に係わり、立体物検出処理の部分フローチャート
【図23】同上、グループの対応関係を示す説明図
【図24】本発明の第3形態に係り、車外監視装置の全体構成図、
【図25】同上、車外監視装置の回路ブロック図
【図26】同上、画像の例を示す説明図
【図27】同上、立体物の二次元分布の例を示す説明図
【図28】本発明の実施の第4形態に係わり、車外監視装置の全体構成図
【図29】同上、車外監視装置の回路ブロック図
【図30】同上、レーザビームの走査方法を側面から示す説明図
【図31】同上、レーザビームの走査方法を上面から示す説明図
【図32】同上、レーザレーダ測距装置で計測される立体物の二次元分布の例を示す説明図
【符号の説明】
1 …車外監視装置
10a,10b…CCDカメラ
20…イメージプロセッサ
30…画像処理用コンピュータ[0001]
BACKGROUND OF THE INVENTION
The present invention relates to an out-of-vehicle monitoring device that recognizes a situation outside a vehicle based on a pseudo image indicating a distance distribution of an object outside the vehicle, and in particular, detects a gap between the host vehicle and an obstacle when passing through a narrow road. The present invention relates to a vehicle exterior monitoring device that secures
[0002]
[Prior art]
Conventionally, in vehicles such as automobiles, for example, disclosed in Japanese Utility Model Laid-Open No. 5-68742 as a supplement to the driver's operational feeling when passing through narrow roads where a large number of eaves, guardrails, utility poles, parked vehicles, etc. exist. A tactile sensor such as a corner pole or a contact type switch that turns on when a bar-shaped member touches an obstacle may be attached to the vehicle body. Can be confirmed.
[0003]
In addition, recently, ultrasonic sensors are attached to the sides and four corners of a vehicle, the distance is measured by emitting ultrasonic waves and receiving reflected waves from obstacles, and informs the driver of the measured distances to narrow roads. Techniques have been developed to reduce the burden of passing through the road.
[0004]
However, in the case of attaching a mark such as the aforementioned corner pole outside the vehicle body, the driver's habituation is required, so the driver's burden reduction effect is small. Further, in the case of a contact type sensor such as a tactile sensor, the position cannot be confirmed until it comes into contact with an object, and there is a situation in which the handle operation cannot be performed in time after touching an obstacle.
[0005]
In addition, in the technology using ultrasonic waves, the spatial resolution is inferior, so it is not only possible to know the positional relationship of obstacles, but also the object dependence that the emitted ultrasonic waves do not return from pedestrian clothes or smooth walls. It is difficult to deal with various three-dimensional objects existing on the road.
[0006]
In order to deal with this, the present applicant, in Japanese Patent Application Laid-Open No. Hei 7-192199, takes a stereo image of an object outside the vehicle, and a distance distribution over the entire image by the principle of triangulation from the deviation amount of the corresponding position of the captured stereo image pair The three-dimensional position of each part of the subject corresponding to the distance distribution information is calculated, and a plurality of three-dimensional objects are detected using the information of these three-dimensional positions. A technique is proposed in which the closest distance between the vehicle side edge and the extension line of the host vehicle side is calculated as a gap distance to the left and right respectively, and information related to the left and right gap distances is notified to the driver.
[0007]
[Problems to be solved by the invention]
In the technique previously proposed by the present applicant, obstacles such as detected vehicles and guardrails are approximated by contour lines and straight lines, and a gap between them is calculated. Therefore, it is necessary to give a certain degree of margin to the gap distance in consideration of a vehicle that may be ignored in the process of approximation processing, a protrusion on the side surface of the guard rail, and the like.
[0008]
Further, in the previous technology, the gap distance is calculated on the assumption of the position at the time when the obstacle is detected. For example, the vehicle is passing through a narrow road with a preceding vehicle in front of the host vehicle. In the situation, a gap between the preceding vehicle and the host vehicle is detected. Therefore, in a situation where the preceding vehicle is standing in front as an obstacle, it is difficult to detect the gap distance between the left and right obstacles.
[0009]
The present invention has been made in view of the above circumstances, and includes an out-of-vehicle monitoring device capable of accurately and accurately determining the possibility of contact with the host vehicle by taking in information on a change in the position of a detected obstacle and a detailed shape. It is intended to provide.
[0010]
[Means for Solving the Problems]
According to the first aspect of the present invention, the pseudo image of the distance distribution obtained by measuring the distance of the object outside the vehicle is divided into a plurality of sections, and the presence / absence of the three-dimensional object and the distance data are detected for each section to detect the outside of the vehicle. In the out-of-vehicle monitoring device for recognizing the situation, means for collecting the adjacent sections in which the distance data is close to each other into one group and calculating the moving speed of the three-dimensional object for each group; Of all categories belonging to Distance data The category belongs Means for estimating the position of the three-dimensional object after the set time, moving according to the moving speed of the group, means for estimating the traveling locus drawn by the contour of the host vehicle after the set time, and the estimated position of the three-dimensional object Based on the means for determining whether or not the own vehicle is in contact with the three-dimensional object, the estimated position of the three-dimensional object and the running locus of the own vehicle, And a means for calculating a minimum gap between the three-dimensional object.
[0011]
The invention according to
[0012]
The invention according to
[0013]
According to a fourth aspect of the present invention, in the first aspect of the invention, the pseudo image is a three-dimensional image obtained by calculating a correlation between a pair of images taken by a pair of cameras and using a principle of triangulation from parallax with respect to the same object. It is characterized by showing the distance distribution. The invention according to
[0014]
The invention described in claim 6 is the invention described in
According to a seventh aspect of the present invention, in the out-of-vehicle monitoring device that measures the distance of an object outside the vehicle and detects the presence / absence of a three-dimensional object and the distance data for the three-dimensional object to recognize the situation outside the vehicle, the distance data are adjacent to each other. And the approaching objects are grouped into one group, and the moving speed of the three-dimensional object for each group is calculated. Of all categories belonging to Distance data The category belongs Means for estimating the position of the three-dimensional object after the set time, moving according to the moving speed of the group, means for estimating the traveling locus drawn by the contour of the host vehicle after the set time, and the estimated position of the three-dimensional object And means for calculating a clearance distance between the host vehicle and the three-dimensional object.
[0015]
That is, in the vehicle exterior monitoring device of the present invention, the pseudo image of the distance distribution obtained by measuring the distance to the object outside the vehicle is divided into a plurality of sections, and the presence / absence of a three-dimensional object and distance data are detected for each section. Later, when the distance data approaches each other and the adjacent sections are grouped into one group and the movement speed of the three-dimensional object for each group is calculated, Of all categories belonging to Distance data The category belongs It moves according to the moving speed of the group, estimates the position of the three-dimensional object after the set time, and estimates the travel locus drawn by the contour of the host vehicle after the set time. Then, the estimated position of the three-dimensional object is compared with the traveling locus of the own vehicle to determine whether or not the own vehicle is in contact with the three-dimensional object, and based on the estimated position of the three-dimensional object and the traveling locus of the own vehicle. The minimum gap between the host vehicle and the three-dimensional object is calculated.
[0016]
In this case, the moving speed of the three-dimensional object is determined by comparing each distance data in the group detected in the previous process with each distance data in the group detected in the current process, and checking the correspondence between the groups. It is desirable to calculate from the amount of temporal movement between corresponding groups. In addition, for a three-dimensional object that is stationary on the road, the distance data is held for each processing cycle, and when the three-dimensional object deviates outside the detection range, the previous distance data and the travel of the host vehicle are stored. It is desirable to estimate the position of the three-dimensional object based on the locus.
[0017]
In addition, the above processing is a pseudo process showing a three-dimensional distance distribution obtained by processing a pair of images captured by a pair of cameras, obtaining a correlation between the captured images, and calculating a triangulation principle from parallax with respect to the same object. A pseudo image showing a two-dimensional distance distribution obtained by processing an image, a pair of images captured by a pair of cameras, and a two-dimensional distance distribution by projecting / receiving a laser beam or transmitting / receiving a radio wave This can be performed based on the obtained pseudo image.
Furthermore, in another vehicle exterior monitoring device according to the present invention, after measuring the distance to an object outside the vehicle and detecting the presence / absence of a three-dimensional object and the distance data for the three-dimensional object, the distance data adjacent to and approaching one another When grouping and calculating the movement speed of the three-dimensional object for each group, Of all categories belonging to Distance data The category belongs It moves according to the moving speed of the group, estimates the position of the three-dimensional object after the set time, and estimates the travel locus drawn by the contour of the host vehicle after the set time. Then, the estimated position of the three-dimensional object is compared with the travel locus of the host vehicle, and the gap distance between the host vehicle and the three-dimensional object is calculated.
[0018]
DETAILED DESCRIPTION OF THE INVENTION
Embodiments of the present invention will be described below with reference to the drawings. 1 to 21 relate to a first embodiment of the present invention, FIG. 1 is a general configuration diagram of the outside monitoring apparatus, FIG. 2 is a circuit block diagram of the outside monitoring apparatus, and FIGS. 3 to 6 are three-dimensional object detection processes. FIG. 7 is a flowchart of a gap distance calculation process, FIG. 8 is an explanatory diagram showing an example of an image captured by an in-vehicle camera, FIG. 9 is an explanatory diagram showing an example of a distance image, and FIG. FIG. 11 is an explanatory diagram showing an example of the situation of the detection target, FIG. 12 is an explanatory diagram showing an example of the detection distance of the three-dimensional object for each section, and FIG. 13 is an example in which the detection distance of the three-dimensional object for each section is grouped FIG. 14 is an explanatory diagram showing the result of the detected object and side wall, FIG. 15 is an explanatory diagram showing an approximation of the contour of the own vehicle, FIG. 16 is an explanatory diagram showing the passing trajectory of the own vehicle, and FIG. FIG. 18 is an explanatory diagram of the determination area, and FIG. 18 shows the estimation result of the position of the three-dimensional object after the set time. 19 is an explanatory diagram showing tracking of out-of-field distance data, FIG. 20 is an explanatory diagram of measurement of a gap between a passing locus and distance data, and FIG. 21 is an explanatory diagram of contact determination between the host vehicle and a three-dimensional object. .
[0019]
In FIG. 1,
[0020]
The stereo
[0021]
The
[0022]
The
[0023]
The distance distribution information output from the distance detection circuit 20a is a pseudo image (distance image) shaped like an image, and is an image taken by the two left and right CCD cameras 11a and 11b, for example, as shown in FIG. When a long image (FIG. 8 schematically shows an image picked up by one camera) is processed by the distance detection circuit 20a, a distance image as shown in FIG. 9 is obtained.
[0024]
In the example of the distance image shown in FIG. 9, the image size is horizontal 600 pixels × vertical 200 pixels, and the distance data has a black dot portion. This is the horizontal direction among the pixels of the image of FIG. This is a portion where the change in brightness between pixels adjacent to each other is large. In the distance detection circuit 20a, this distance image is handled as an image composed of blocks of horizontal 150 × vertical 50 with a small area of 4 × 4 pixels, and the distance (number of pixel shifts) is calculated for each block. .
[0025]
On the other hand, the
[0026]
The
[0027]
As shown in FIG. 9, the
[0028]
That is, the three-dimensional coordinate system of the real space is a coordinate system fixed to the own vehicle (vehicle 1), the X axis is the right side of the traveling direction of the
x = CD / 2 + z · PW · (i-IV) (1)
y = CH + Z · PW · (j−JV) (2)
z = KS / dp (3)
However, CD: interval between
PW: Viewing angle per pixel
CH: Mounting height of the
IV, JV: Coordinates (pixels) on the image of the infinity point directly in front of the
KS: Distance coefficient (KS = CD / PW)
The equation for calculating the point (i, j, dp) on the image from the point (x, y, z) in the real space is obtained by modifying the above equations (1) to (3) as follows. .
[0029]
i = (x−CD / 2) / (z · PW) + IV (4)
j = (y−CH) / (z · PW) + JV (5)
dp = KS / z (6)
[0030]
Next, individual processing in the
[0031]
In the above road model, the lane of the road up to the recognition target range is divided into a plurality of sections according to the set distance, and the left and right white lines are approximated by a three-dimensional linear equation for each section and connected in a polygonal line shape. The horizontal linear parameters a and b in the real space coordinate system and the vertical linear parameters c and d are obtained, and the horizontal linear equation shown in the following equation (7): Then, the vertical linear equation shown in the following equation (8) is obtained.
x = a · z + b (7)
y = c · z + d (8)
[0032]
In the three-dimensional object detection process by the
[0033]
Further, in the gap distance calculation process by the
[0034]
The generation of the distance image and the process of detecting the road shape from the distance image are described in detail in Japanese Patent Application Laid-Open Nos. 5-265547 and 6-266828 previously filed by the present applicant. ing.
[0035]
Hereinafter, the three-dimensional object detection process by the
[0036]
First, a three-dimensional object detection processing program by the
[0037]
Next, when the process proceeds to step S104 and the first data in the section is set, the three-dimensional position (x, y, z) of the subject is obtained by the above-described equations (1) to (3) in step S105, and in step S106. Then, the height yr of the road surface at the distance z is calculated using the linear equations (7) and (8) of the road shape described above. Next, the process proceeds to step S107, and data above the road surface is extracted as three-dimensional object data based on the height H of the subject from the road surface calculated by the following equation (9).
H = y-yr (9)
[0038]
In this case, a subject whose height H is about 0.1 m or less is considered to be a white line, dirt, shadow, or the like on the road, so the data of this subject is rejected. An object above the height of the
[0039]
Thereafter, the process proceeds to step S108 to check whether it is the final data. If it is not the final data, the next data in the section is set in step S109 and the process returns to the above-mentioned step S105 to repeat the same processing above the road surface. Extract the data in Then, when the processing of the final data is completed within one section, the process proceeds from step S108 to step S110, and the number of data included in the section of the preset distance Z is counted for the extracted three-dimensional object data. Create a histogram with z as the horizontal axis.
[0040]
In subsequent step S111, a section where the frequency of the histogram is equal to or greater than the determination value and the maximum value is detected, and if there is a corresponding section, it is determined in step S112 that a three-dimensional object exists in the section, and the three-dimensional object is reached. Detect the distance.
[0041]
In the above histogram, there are some erroneously detected values in the distance data in the input distance image, and some data actually appears at positions where no object is present. However, when there is an object of a certain size, the frequency at that position shows a large value, whereas when there is no object, the frequency generated only by erroneous distance data becomes a small value. Therefore, if there is a section in which the frequency of the created histogram is greater than or equal to the preset judgment value and takes the maximum value, it is determined that an object exists in that section. If the maximum value of the frequency is less than the judgment value, the object exists. If the image data contains some noise, the object can be detected while minimizing the influence of the noise.
[0042]
Thereafter, the process proceeds from step S112 to step S113 to check whether or not the final section has been reached. When the final section has not been reached, the process proceeds from step S112 to step S114 and the next section of data is read. The solid object is detected and the distance is calculated in each section. The above process is repeated, and when the final section is reached, the process proceeds from step S113 to step S115.
[0043]
FIG. 12 is an example in which the image to be detected shown in FIG. 11 is detected by the above distance data detection process, and the distance for each section is shown on the XZ plane, and the detected distance includes some errors. Therefore, as indicated by black dots, the data is detected as data having some variation in the portion of the three-dimensional object facing the vehicle.
[0044]
These distance data are divided into groups that are close to each other by the distance group detection process in steps S115 to S121. In this process, the detection distance of the three-dimensional object in each section is examined, and if the difference in the detection distance to the three-dimensional object in the adjacent section is equal to or less than the determination value, it is regarded as the same three-dimensional object, while the determination value is exceeded Are grouped as if they were separate solid objects.
[0045]
For this reason, in step S115, first, the first section (for example, the left end) is examined. If a three-dimensional object is detected, the distance data is read and this section R1 is classified into group S1 and distance Z1. Next, proceeding to step S116, the right-side section R2 is examined, and if a three-dimensional object is not detected, the group S1 exists in and near the section R1, and the distance is determined to be Z1, If a three-dimensional object is detected in the section R2, and the detected distance is Z2, the difference between the distance Z1 in the section R1 and the distance Z2 in the right adjacent section R2 is calculated.
[0046]
Thereafter, the process proceeds to step S117 to check whether or not the difference in distance from the right adjacent section is equal to or less than the determination value. When the distance difference is equal to or less than the determination value and is approaching each other, in step S118, the difference is detected in section R2. The determined three-dimensional object is determined to belong to the previously detected group S1, and the same group is labeled. The distance is set as an average value of Z1 and Z2, and the process proceeds to step S120.
[0047]
On the other hand, when the difference in distance from the right adjacent section exceeds the determination value, the process proceeds from step S117 to step S119, and the three-dimensional object detected in section R2 is different from the previously detected group S1. Determination is made to label the new group (group S2, distance Z2), and the process proceeds to step S120.
[0048]
In step S120, it is checked whether or not the final section has been reached. If the final section has not been reached, the distance of the next section is read in step S121, the process returns to step S116, and the area on the right is checked. . When the final section is reached, the process proceeds from step S120 to step S122 and subsequent steps.
[0049]
By the distance group detection process described above, for example, distance data that are close to each other are collected from the distance data for each section shown in FIG. 12, and are grouped as shown in FIG. At this time, the number of the group to which the category belongs is assigned and stored in each category. In the example of FIG. 13,
[0050]
In this case, even if they are different three-dimensional objects, sections that are close to each other may be processed as the same group. For this reason, in the group division processing in the next step S122 to step S132, the arrangement direction of the distance data on the XZ plane is examined, and the arrangement direction is substantially parallel to the Z axis and the substantially parallel part to the X axis. Divide the group with.
[0051]
In this group division process, in step S122, the first group of data is read, and in step S123, the alignment direction of each section in the group is calculated. In step S124, the labels of “object” and “side wall” are assigned to each section. Add. Specifically, assuming that the position of the leftmost section K1 in the group is Z1 and X1 and the positions of the rightmost sections K are Zp and Xp, two points of points X1 and Z1 and points Xp and Zp are obtained. An inclination A1 of the connecting straight line with respect to the Z axis is calculated, and the inclination A1 of the straight line is compared with a set value (for example, about 45 °). If the slope A1 of the straight line is equal to or less than the set value and the data sequence is substantially in the Z-axis direction, the section K1 is labeled “side wall”, the slope A1 of the straight line exceeds the set value, and the data sequence is In the case of a substantially X-axis direction, it is labeled “object”.
[0052]
The interval N of the division at the time of labeling is about N = 2 to 4 divisions. This is because in N = 1, that is, in the right adjacent section, the arrangement direction greatly varies due to variations in the detection distance, and it is difficult to determine the division. By using the arrangement direction with a slightly separated section, , To stabilize the direction. Then, the labeling of the “side wall” or “object” is performed in order from the left end in the group from the right end to the left N sections, and each section is labeled.
[0053]
As described above, when labeling of each section is completed, the process proceeds from step S124 to step S125, the label of the leftmost section is read, and further, the label of the next right section is read in step S126. Next, the process proceeds to step S127, and it is checked whether the leftmost label is different from the label on the right. As a result, in step S127, when the labels are the same, the process jumps to step S129, and when the labels are different, the section labeled “side wall” and the section labeled “object” are divided in step S128. As another group, the process proceeds to step S129. The position of the segment to be divided is on the right side by N / 2 segments where the label changes from “side wall” ← → “object”.
[0054]
In this case, in order to deal with a situation where the label partially changes due to variations in distance data, etc., the division is performed only when the same label is continuously arranged more than the judgment value (for example, three or more categories). If it is less than 1, no division is performed. For example, in the example of FIG. 13, as in the case of group 6 (bicycle) or the like, a group in which the section labeled “object” and the section labeled “side wall” are mixed because the shape is complicated. Then, since the same type of labels do not continue in three or more sections, group division does not occur.
[0055]
In step S129, it is checked whether or not it is the final division. If it is not the final division, the label of the next division is read in step S130, the flow returns to step S126, and the same processing is repeated. When the final section is reached, the process proceeds from step S129 to step S131 to check whether the final group has been reached. As a result, when the final group has not been reached, the data of the next group is read in step S132, and the group is similarly divided into the next group. This process is repeated, and when the final group is reached, the group division process is completed and the process proceeds from step S131 to step S133.
[0056]
The next step S133 to step S138 are processing for calculating the parameters of each group by classifying each divided group as a side wall or an object. When the first group data is read in step S133, In S135, an approximate straight line is obtained from the position (Xi, Zi) of each section in the group by the Hough transform or the least square method, and the inclination of the entire group is calculated.
[0057]
Next, proceeding to step S135, the group having the inclination in the X-axis direction is classified as an object and the group having the inclination in the Z-axis direction is classified as a side wall from the inclination of the entire group, and the parameters of each group are calculated in step S136. To do. This parameter is a parameter such as an average distance calculated from the distance data in the group and the X coordinate of the left end and the right end in a group classified as an object. In a group classified as a side wall, the alignment direction (Z Parameters such as the inclination with respect to the axis and the positions of the front and rear ends (Z, X coordinates).
[0058]
The group classification may be performed based on the label of “side wall” or “object” of each section attached in the group division process described above.
[0059]
Then, the process proceeds from step S136 to step S137 to check whether or not the final group has been reached.When the final group is not reached, the next group data is read in step S138 and the process returns to step S134. It progresses to the process after step S139.
[0060]
Here, one surface of a three-dimensional object, such as a continuous guard rail, may be strongly affected by the variation in distance data for each section, and is divided into a plurality of groups by the previous distance group detection process or group division process. Therefore, there is a possibility that one surface of the three-dimensional object is erroneously divided and detected.
[0061]
As a countermeasure against this, in the group joining process in the following steps S139 to S147, the mutual positional relationship of each group is examined based on the group parameter calculated in the previous group parameter calculation process, and the position of the end point approaches in the same type of group. If the arrangement directions are substantially equal, it is determined that they are the same surface of the same object, and these groups are integrated into one group. Then, various parameters as an integrated group are recalculated in the same manner as the group parameter calculation process.
[0062]
Therefore, in step S139, the parameters of the first group are read, and in step S140, the parameters of the next group are read.In step S141, the difference in the distance between the end points of each group and the difference in the inclination of each group are obtained. calculate. In step S142, it is checked whether the difference in the distance between the end points of each group and the difference in the inclination of each group are within the respective determination values. If both are within the determination values, the process proceeds to step S143 and the same object The groups are joined as a group, the group parameters are calculated again, and the process proceeds to step S146.
[0063]
On the other hand, if it is determined in step S142 that the distance difference between the end points of each group or the difference in slope of each group is not within the determination value, the process proceeds from step S142 to step S144 to check whether the group is the final group. If not, the parameter of the next group is read in step S145, and the process returns to step S141. If it is the final group, the process proceeds to step S146.
[0064]
In step S146, it is checked whether or not it is the final group. If it is not the final group, the parameters of the next group are read in step S147 and the process returns to step S140. If it is the final group, the process proceeds to step S148 and subsequent steps.
[0065]
After the above group combining process, the same three-dimensional object is detected by the processes of steps S148 to S157 below for those separated into different groups at the rear and side surfaces of the same three-dimensional object, One solid object is recognized as a combination of an “object” and a “side wall” (the rear part is “object” and the side surface is “side wall”).
[0066]
In this process, first, in step S148, parameters of the first group classified as an object are read, and in step S149, parameters of the first group classified as a side wall are read. Next, the process proceeds to step S150, and the difference between the position of the end point of the group classified as an object and the position of the end point of the group classified as a side wall is calculated. In this case, when the “object” is on the right side of the front of the automobile (corresponding to the Z axis), the position of each end point is the position of the left end of the “object” and the position of the end point on the near side of the “side wall”. The difference is calculated, and if the “object” is on the left side of the front of the host vehicle, the difference between the right end position of the “object” and the end point position on the near side of the “side wall” is calculated.
[0067]
Then, in step S151, it is checked whether or not the difference between the positions of the end points of each group is within a determination value (for example, about 1 m), and whether or not they are close to each other. If it is not the final side wall, the parameter of the next group classified as the side wall in step S153 is read and the process returns to step S150. If it is the final side wall, the process proceeds to step S156.
[0068]
On the other hand, when the difference between the positions of the end points of each group is within the determination value in step S151, the process proceeds from step S151 to step S154 and is determined to be the same three-dimensional object. In other words, when the rear and side surfaces of a solid object are visible at the same time, the corner created by the two surfaces is convex forward, so the left end position of the “object” and the end point of the front side of the “side wall” Or the position of the right end of the “object” and the position of the end point on the near side of the “side wall” are essentially the same. Therefore, when the difference between the positions of the two groups is within the determination value, it can be determined that the two groups are pairs detected by dividing one solid object.
[0069]
Thereafter, the process proceeds from step S154 to step S155, and a point that intersects the pair of “object” and “side wall” determined to be the same three-dimensional object by extending each approximate straight line is determined as the corner point of the three-dimensional object. When calculated as a position, the position of each end point is changed to the position of this corner point. Then, in step S156, it is checked whether or not it is the final group of “object”. If it is not the final group of “object”, the parameter of the next group classified as “object” is read in step S157, and the process proceeds to step S149. Return and repeat the same process. On the other hand, if it is the last group of “objects” in step S156, the process proceeds to the next step S158 and subsequent steps.
[0070]
FIG. 14 shows the detection results of “object” and “side wall” in the XZ plane with respect to the detection target example shown in FIG. 11. In this example, the above-described group combination and “object” are shown. There is no group that is determined to be a combination of “side wall”, “object” is indicated by a bold solid line, and “side wall” is indicated by a thick dashed line.
[0071]
Next, in step S158 and subsequent steps, a speed calculation process for calculating the moving speed based on a change in the position of the “object” or “side wall” detected every processing cycle at a predetermined time interval (for example, 0.1 sec). First, in step S158, the parameters of the first group are read, and in step S159, it is checked whether or not they are a pair of the same three-dimensional object.
[0072]
When the same solid object is not paired, the process proceeds from step S159 to step S160. The center of the object is the center of the left and right ends of the “object”, and the center of the front and rear ends of the “side wall”. When the time change amount of the position is calculated, in step S161, the speed in the front-rear direction, that is, the speed Vz in the Z direction is calculated from the time change amount of the Z coordinate of the center point, and the speed in the left-right direction, that is, the speed in the X direction is Calculation is made from the amount of time change of the X coordinate of the center point, and the process jumps to step S164.
[0073]
In step S164, it is checked whether or not it is the final group. If it is not the final group, the parameters of the next group are read in step S165, and the process returns to step S159 to check whether or not it is a pair of the same three-dimensional object. As a result, when the pair is not a pair of the same three-dimensional object, the speed in the front / rear / left / right directions is calculated from the time change at the center point through the above-described steps S160 and S161, and the process returns to step S164 to check whether it is the final group.
[0074]
On the other hand, when the same three-dimensional object is a pair in step S159, the process proceeds from step S159 to step S162, and the corresponding “object” or “side wall” parameter is read. While calculating the velocity (velocity Vz in the Z-axis direction), the velocity in the left-right direction (velocity Vx in the X-axis direction) is calculated from the “side wall”, and these velocity Vz, Vx are expressed in the Z-axis direction in the same three-dimensional object, The speed is in the X-axis direction. Then, in step S164, it is checked whether or not it is the final group. If it is not the final group, the above processing is repeated. If it is the final group, the process proceeds from step S164 to step S166, and the parameters of each group are written in the memory. The entire detection process program is terminated.
[0075]
That is, in the “object”, the position in the Z-axis direction is an average value of the distances of the plurality of sections, and the velocity Vz is stable, but the position in the X-direction is affected by the variation of the X coordinate at the left and right ends. The speed Vx tends to vary greatly. On the other hand, in the “side wall”, the position in the X direction is an average value of the X coordinates of a plurality of sections, and the velocity Vx is stable, but the position in the Z direction is affected by variations in the Z coordinates at the front and rear ends. As a result, the speed Vz tends to vary greatly. Therefore, the speed of the same three-dimensional object is set by using only both stable speeds.
[0076]
In this case, it is difficult to obtain the correspondence relationship between the distance data detected in the previous process and the distance data detected in the current process and the distance data detecting the same part of the same three-dimensional object. It is difficult to obtain the speed of an object from individual distance data. However, in the present invention, individual distance data is grouped for each three-dimensional object, approximated linearly for each group, and the center point is obtained, so the group detected at the previous processing and the current processing are It is easy to obtain the correspondence relationship with the detected group, and the speed of the object can be calculated from the movement amount of the center point.
[0077]
The object and side wall data detected by the above processing is passed to the clearance distance calculation processing program by the
[0078]
In this clearance distance calculation processing program, the trajectory of the host vehicle is estimated in step S201. The passing trajectory of the host vehicle is estimated using a built-in model in which the contour of the host vehicle is linearly approximated by a polygon composed of n vertices. As shown in FIG. 15 (b), the contour is the coordinates Pn = [Pxn, Pzn] of the vertex n with the rear axle center as the origin. T And the coordinates Pn ′ = [P′xn, P′zn] of the vertex n after the prediction time t (for example, 1 or 2 seconds) T Is obtained to estimate the passing trajectory of the host vehicle.
[0079]
For this reason, first, the idle running distance L and the turning radius R based on the rear axle center at the predicted time t are obtained from the vehicle speed obtained from the
θ = L / R (10)
Moreover, since the turning radius rn of each vertex can be obtained by the following equation (12), using this, the vertex number no having the largest turning radius (passing through the outermost side) and the smallest (passing through the innermost side) are used. The vertex number ni is obtained. The current coordinate Pno of the vertex number no and the coordinate P′no after the prediction time t are connected by an arc having the maximum turning radius rno obtained by applying the equation (12), and the current coordinate of the vertex number ni. By connecting Pni and the coordinates P′ni after the predicted time t by an arc having the minimum turning radius rni obtained by applying the equation (12), the remaining vertices are connected by a straight line to each adjacent vertex. As shown in FIG. 16, the passing trajectory of the host vehicle can be obtained.
rn = ((Pxn-Ox) 2 + (Pzn-Oz) 2 ) 1/2 … (12)
[0081]
In this case, when the steering angle is 0, that is, when the turning radius is infinite, the calculation cannot be performed. Therefore, the coordinates of the vertex n after the prediction time t are obtained by the following equation (13) and Are connected by a straight line to obtain an estimated trajectory.
Then, after estimating the passing trajectory of the host vehicle, the process proceeds from step S201 to step S202, and the center of the tip of the contour model of the host vehicle (see FIG. 15) Cf = [Cxf, Czf for contact determination and gap measurement described later. ] T And rear center Cr = [Cxr, Czr] T As in the case of each vertex, the positions C′f and C′r after the prediction time t are calculated, and as shown in FIG. 17, the travel area based on the passage trajectory is divided into a right determination area and a left determination area. To do.
[0083]
In the subsequent step S203, the X-direction movement amount dx and the Z-direction movement amount dz of the three-dimensional object at the prediction time t are calculated from the velocities Vx and Vz of each group obtained in the previous three-dimensional object detection process by the following (14), ( The distance data is obtained by the equation (15), and each distance data is moved by the X-direction movement amount dx and the Z-direction movement amount dz to estimate the position of the three-dimensional object after the prediction time t.
dx = Vx · t (14)
dz = Vz · t (15)
[0084]
In the example in which the detection results of the positions of the three-dimensional objects shown in FIG. 13 are grouped, the velocity is substantially 0 in both the X direction and the Z direction in the
[0085]
Thereafter, the process proceeds to step S204, and distance data is tracked for a three-dimensional object outside the field of view of the stereo camera. The group of distance data detected as having a velocity of approximately 0 in both the X direction and the Z direction is a three-dimensional object stationary on the road, and the distance data is held for each processing cycle.
[0086]
A travel locus between the k-th process cycle and the (k−1) -th process cycle can be obtained as a travel locus L ′ and a turning radius R ′ by the
α = L '/ R' (16)
[0087]
Therefore, the distance data in the (k-1) th processing cycle is represented by D = [Dx, Dz]. T Then, the distance data D ′ in the k-th processing cycle can be obtained by the following equation (17), and by updating this every processing cycle, as shown in FIG. It is possible to track distance data that has deviated outside the field of view.
After that, in order to determine contact between the vehicle passing trajectory and the three-dimensional object, including the tracking data of the three-dimensional object that has deviated from the field of view, in step S205, the distance data in which the position after the prediction time t is estimated In step S206, it is checked whether or not the estimated distance data is within the right determination area.
[0089]
Then, if the estimated distance data is not within the right determination area, the process proceeds from step S206 to step S208. If the estimated distance data is within the right determination area, it is determined that there is a possibility of contact with the own vehicle, and from step S206. Proceeding to step S207, the right contact flag indicating right contact is turned ON, and the process proceeds to step S208.
[0090]
In step S208, it is checked whether the estimated distance data is in the left determination area. If the estimated distance data is not in the left determination area, the process proceeds to step S210. If the estimated distance data is in the left determination area, the left distance is determined in step S211. The left contact flag indicating contact is turned ON, and the process proceeds to step S210.
[0091]
In step S210, it is checked whether the right or left contact flag is turned on. If the contact flag on either side is turned on, an alarm is generated in step S211 and a warning is displayed on the display 9 or a lamp is displayed. Warning by buzzer etc. and inform the driver.
[0092]
On the other hand, when the left and right contact flags are not turned on in step S210, the process proceeds from step S210 to step S212, and the estimated distance data outside the contact determination area is determined based on the vehicle center except for the data in front of the front of the passage locus. Divide the line left and right into groups. Next, in step S213, the gap distance between the estimated distance data outside the contact determination area and the passing trajectory of the host vehicle is calculated. As shown in FIG. 20, this gap distance draws a normal line with respect to the passing trajectory on the left side surface of the host vehicle in the case of the left group and the passing trajectory on the right side surface of the host vehicle in the case of the right group. The value is stored as the “gap distance”.
[0093]
Thereafter, the process proceeds to step S214 to check whether or not the final estimated distance data is reached. When the final estimated distance data is not reached, the next estimated distance data is read in step S215, and the process returns to step S206. repeat. When the contact determination is completed for all estimated distance data, the process proceeds from step S214 to step S216, and the minimum value of the gap distance is calculated and held for each of the left and right groups, and the numerical value displayed or calculated gap distance in step S217 A display signal for calling attention according to the minimum value is output to the display 9 to notify the driver.
[0094]
FIG. 21 shows the travel region of the host vehicle for the estimated position of each distance data after the predicted time t shown in FIG. 18, and in this example, the current detected position of the preceding vehicle is the travel of the host vehicle. Although it is in the area, the contact determination is performed for the estimated position after the set time in consideration of the speed of the three-dimensional object and the traveling locus of the host vehicle, so that it can be correctly determined that the vehicle does not contact the preceding vehicle. .
[0095]
In addition, even for a complex object such as a bicycle in FIG. 21, since the individual distance data in the group is moved according to the speed of the group, the unevenness of the detected object is maintained as it is, and contact determination is performed. Can be performed precisely. In the example of FIG. 21, it is correctly determined that there is a risk of contact with the bicycle, and an unexpected accident can be avoided in advance. In FIG. 21, the same applies to a three-dimensional object that is stationary, such as implantation.
[0096]
In addition, in this case, in order to estimate the travel locus drawn by the contour of the host vehicle according to the speed and the steering angle of the host vehicle, in addition to considering the unevenness of the object, the unevenness of the host vehicle is also considered, and the contact determination In addition to improving the accuracy of gap measurement, the driver's gaze area can be brought closer to the contact determination area, and an alarm with less discomfort can be issued.
[0097]
Furthermore, since distance data is tracked even for an object that has deviated outside the detection range, contact determination and gap measurement can be performed on a solid object immediately next to the host vehicle. It can exert a great effect in preventing contact accidents due to the influence of the inner ring difference.
[0098]
FIGS. 22 and 23 relate to the second embodiment of the present invention, FIG. 22 is a partial flowchart of the three-dimensional object detection process, and FIG. 23 is an explanatory diagram showing the correspondence between groups.
[0099]
In the first embodiment described above, in order to detect the moving speed of the three-dimensional object, the detected group is approximated in a straight line as an “object” or “side wall”, and the center point is obtained. On the other hand, in this embodiment, the individual distance data in the group detected in the previous process is compared with the individual distance data in the group detected in the current process, the movement amount as a group is obtained, and the speed is calculated. Is.
[0100]
For this reason, in this embodiment, a part of the three-dimensional object detection process by the
[0101]
In other words, in this embodiment, when the group division process of steps S122 to S132 is completed, the process proceeds from step S132 to step S170 of FIG. 22, and in steps S170 to S174, the current process is selected from the plurality of groups detected in the previous process. After searching for a group that detects the same three-dimensional object with the group detected in
[0102]
Therefore, first, when the data of the first group detected this time is read in step S170, the center point (Xc, Zc) of the distance data in the group is obtained in step S171. The barycentric point (Xc, Zc) is expressed by the following equations (18) and (19), where xi and zi are the positions of the i-th distance data in the group and n is the number of distance data belonging to the group. Can be sought. Here, Σ is the sum of i = 1 to n.
Xc = (Σxi) / n (18)
Zc = (Σzi) / n (19)
[0103]
Next, proceeding to step S172, the barycentric point of the group detected in the previous process is read, and the distance (the amount of movement of the barycentric point) between the barycentric point of the previously detected group and the barycentric point of the currently detected group is calculated. After the calculation, in step S173, it is checked whether or not the distance between the centroid points of each group is equal to or less than the determination value. When the distance between the center of gravity of the group detected in the previous process and the center of gravity of the group detected this time exceeds the determination value, it is determined that these groups do not detect the same three-dimensional object. Then, the process proceeds to step S174, the barycentric point of the next group detected last time is read, and the process returns to step S172.
[0104]
On the other hand, when the distance between the centroids of each group is equal to or smaller than the determination value in step S173, it is determined that these groups are in a correspondence relationship in which the same solid object is detected, and the process proceeds from step S173 to step S175. Each distance data in the detection group is moved to calculate a correction amount that minimizes the shift amount between the groups.
[0105]
For example, as shown in FIG. 23, if the previously detected group F and the currently detected group G are in a correspondence relationship, first, each distance data of the previously detected group F is obtained from the center point PG of the currently detected group G. And the center-of-gravity point PF of the previously detected group F move.
[0106]
Next, for each distance data iF1 of the group F1 after the movement, distance data iG that is closest in the group G detected this time is obtained, and a distance diF1 between the distance data iF1 and iG is obtained. This is performed for all the distance data in the group F1 after movement, and the square sum SDK1 (deviation amount) of the distance diF1 is obtained by the following equation (20).
SDK1 = ΣdiF1 2 … (20)
[0107]
Further, the entire position of the group F1 is moved in the Z direction and the X direction by minute amounts Δz and Δx, and the deviation amount SDK2 between the group F2 after this movement and the group G detected this time is set in the same manner as described above. calculate. Then, this process is repeated while changing Δz and Δx, and the values of the minute amounts Δz and Δx from which the minimum value is obtained among the deviation amounts SDK1, SDK2, SDK3,. The amount of correction becomes.
[0108]
As described above, when the correction amount that minimizes the amount of deviation between the groups is obtained, the process proceeds to step S176, and the value obtained by adding the correction amount to the movement amount of the center of gravity between the groups in the correspondence relationship is obtained. In step S177, the movement speed is divided by the time interval for each processing cycle to calculate the group speeds Vz and Vx. Next, in step S178, it is checked whether or not it is the final group. If it is not the final group, the data of the next group is read in step S179, the process returns to step S171, and the above processing is repeated. For simplicity, the moving speed of the center of gravity calculated in step S172 may be divided by the time interval for each processing cycle to obtain the group speed.
[0109]
Then, when the final group processing is completed in step S178, the process proceeds from step S178 to step S180, and parameters such as the position and speed of each group are written in the memory, and the entire three-dimensional object detection processing is performed. Exit the program. The subsequent gap distance calculation process using the data of the three-dimensional part detection process is the same as that in the first embodiment.
[0110]
In this embodiment, the moving speed of the three-dimensional object can be detected with high accuracy compared to the first embodiment described above, and the accuracy of contact determination and gap distance can be further improved.
[0111]
FIGS. 24 to 27 relate to a third embodiment of the present invention, FIG. 24 is an overall configuration diagram of the outside monitoring apparatus, FIG. 25 is a circuit block diagram of the outside monitoring apparatus, and FIG. 26 is an explanatory view showing an example of an image. These are explanatory drawings showing an example of a two-dimensional distribution of a three-dimensional object.
[0112]
As shown in FIG. 24, the vehicle
[0113]
As the passage
[0114]
The stereo
[0115]
In this embodiment, when an image captured by the stereo
[0116]
In this embodiment, since the presence / absence and position of the side wall are converted into a simple data form such as a linear parameter and front / rear end coordinates, data handling and processing on the use side is facilitated.
[0117]
FIGS. 28 to 32 relate to a fourth embodiment of the present invention, FIG. 28 is an overall configuration diagram of the outside monitoring apparatus, FIG. 29 is a circuit block diagram of the outside monitoring apparatus, and FIG. 30 is a side view of a laser beam scanning method. FIG. 31 is an explanatory view showing a laser beam scanning method from above, and FIG. 32 is an explanatory view showing an example of a two-dimensional distribution of a three-dimensional object measured by a laser radar distance measuring device.
[0118]
In each of the above-described embodiments, an image outside the vehicle is detected by processing an image captured by the camera. On the other hand, this embodiment detects an object outside the vehicle by scanning a laser beam. That is, as shown in FIG. 28, the vehicle outside
[0119]
The laser radar
[0120]
In the
[0121]
As shown in FIG. 30, a laser beam is projected horizontally from the
[0122]
For example, when the laser radar
[0123]
Therefore, an object or a wall surface can be detected by performing the same processing as the first embodiment on the two-dimensional distribution of the three-dimensional object that is the output of the laser radar
[0124]
【The invention's effect】
As explained above, according to the present invention, , Inspection It is possible to obtain an excellent effect such that the possibility of contact with the host vehicle can be accurately and precisely determined by taking in information on the position change of the obstacle and the detailed shape.
[Brief description of the drawings]
FIG. 1 relates to a first embodiment of the present invention and is an overall configuration diagram of a vehicle outside monitoring device.
FIG. 2 is a circuit block diagram of the vehicle exterior monitoring device.
FIG. 3 is a flowchart of a three-dimensional object detection process (No. 1).
FIG. 4 is a flowchart of a three-dimensional object detection process (No. 2).
FIG. 5 is a flowchart of a three-dimensional object detection process (No. 3).
FIG. 6 is a flowchart of a three-dimensional object detection process (No. 4).
FIG. 7 is a flowchart of a gap distance calculation process as described above.
FIG. 8 is an explanatory diagram showing an example of an image captured by the in-vehicle camera.
FIG. 9 is an explanatory diagram showing an example of a distance image
FIG. 10 is an explanatory diagram showing divisions of distance images as above.
FIG. 11 is an explanatory diagram showing an example of the situation of the detection target
FIG. 12 is an explanatory diagram showing an example of the detection distance of a three-dimensional object for each section.
FIG. 13 is an explanatory diagram showing an example in which detection distances of three-dimensional objects for each section are grouped as above.
FIG. 14 is an explanatory diagram showing the result of the detected object and the side wall, same as above.
FIG. 15 is an explanatory diagram showing approximation of the contour of the own vehicle
FIG. 16 is an explanatory diagram showing the passing trajectory of the own vehicle
FIG. 17 is an explanatory diagram of the left / right determination area.
FIG. 18 is an explanatory diagram showing the estimation result of the position of the three-dimensional object after the set time;
FIG. 19 is an explanatory diagram showing tracking of distance-of-view distance data as above.
FIG. 20 is an explanatory diagram of the measurement of the gap between the passage locus and the distance data.
FIG. 21 is a diagram for explaining the contact determination between the host vehicle and the three-dimensional object.
FIG. 22 is a partial flowchart of a three-dimensional object detection process according to the second embodiment of the present invention.
FIG. 23 is an explanatory diagram showing the correspondence of groups as in the above.
FIG. 24 relates to a third embodiment of the present invention, and is an overall configuration diagram of a vehicle exterior monitoring device;
FIG. 25 is a circuit block diagram of the vehicle outside monitoring device.
FIG. 26 is an explanatory diagram showing an example of an image as above;
FIG. 27 is an explanatory diagram showing an example of a two-dimensional distribution of a three-dimensional object.
FIG. 28 relates to a fourth embodiment of the present invention and is an overall configuration diagram of a vehicle outside monitoring device.
FIG. 29 is a circuit block diagram of the vehicle exterior monitoring device as above.
FIG. 30 is an explanatory diagram showing the laser beam scanning method from the side, same as above.
FIG. 31 is an explanatory view showing the laser beam scanning method from above,
FIG. 32 is an explanatory diagram showing an example of a two-dimensional distribution of a three-dimensional object measured by the laser radar range finder;
[Explanation of symbols]
1 ... Outside monitoring device
10a, 10b ... CCD camera
20 Image processor
30. Image processing computer
Claims (7)
上記距離データが互いに接近し隣接する各区分を1つのグループにまとめ、このグループ毎の立体物の移動速度を算出する手段と、
上記グループに属する全ての区分の距離データを、該区分が属するグループの移動速度に応じて移動させ、設定時間後の上記立体物の位置を推定する手段と、
上記設定時間後の自車両の輪郭が描く走行軌跡を推定する手段と、
上記立体物の推定位置と上記自車両の走行軌跡とを比較し、自車両が立体物に接触するか否かを判定する手段と、
上記立体物の推定位置と上記自車両の走行軌跡とに基づいて、自車両と立体物との間の最小隙間を算出する手段とを備えたことを特徴とする車外監視装置。In the outside monitoring device that recognizes the situation outside the vehicle by dividing the pseudo image of the distance distribution obtained by measuring the distance of the object outside the vehicle into a plurality of sections and detecting the presence or absence of a three-dimensional object and distance data for each section ,
Means for calculating the moving speed of a three-dimensional object for each group by grouping the adjacent sections in which the distance data is close to each other into one group;
Means for moving the distance data of all sections belonging to the group according to the moving speed of the group to which the section belongs, and estimating the position of the three-dimensional object after a set time;
Means for estimating a travel locus drawn by the contour of the vehicle after the set time;
Means for comparing the estimated position of the three-dimensional object with the traveling locus of the host vehicle and determining whether the host vehicle is in contact with the three-dimensional object;
A vehicle exterior monitoring device comprising: means for calculating a minimum clearance between the host vehicle and the three-dimensional object based on the estimated position of the three-dimensional object and the travel locus of the host vehicle.
上記距離データが互いに隣接及び接近するものを1つのグループにまとめ、このグループ毎の立体物の移動速度を算出する手段と、
上記グループに属する全ての区分の距離データを、該区分が属するグループの移動速度に応じて移動させ、設定時間後の上記立体物の位置を推定する手段と、
上記設定時間後の自車両の輪郭が描く走行軌跡を推定する手段と、
上記立体物の推定位置と上記自車両の走行軌跡とを比較し、自車両と立体物との間の隙間距離を算出する手段とを備えたことを特徴とする車外監視装置。In the outside monitoring device that measures the distance of an object outside the vehicle, detects the presence or absence of a three-dimensional object and distance data for the three-dimensional object, and recognizes the situation outside the vehicle,
Means for gathering the distance data adjacent to and close to each other into one group and calculating the moving speed of the three-dimensional object for each group;
Means for moving the distance data of all sections belonging to the group according to the moving speed of the group to which the section belongs, and estimating the position of the three-dimensional object after a set time;
Means for estimating a travel locus drawn by the contour of the vehicle after the set time;
A vehicle exterior monitoring apparatus comprising: means for comparing the estimated position of the three-dimensional object and the traveling locus of the own vehicle and calculating a gap distance between the own vehicle and the three-dimensional object.
Priority Applications (1)
| Application Number | Priority Date | Filing Date | Title |
|---|---|---|---|
| JP08688197A JP4082471B2 (en) | 1997-04-04 | 1997-04-04 | Outside monitoring device |
Applications Claiming Priority (1)
| Application Number | Priority Date | Filing Date | Title |
|---|---|---|---|
| JP08688197A JP4082471B2 (en) | 1997-04-04 | 1997-04-04 | Outside monitoring device |
Publications (2)
| Publication Number | Publication Date |
|---|---|
| JPH10283462A JPH10283462A (en) | 1998-10-23 |
| JP4082471B2 true JP4082471B2 (en) | 2008-04-30 |
Family
ID=13899186
Family Applications (1)
| Application Number | Title | Priority Date | Filing Date |
|---|---|---|---|
| JP08688197A Expired - Lifetime JP4082471B2 (en) | 1997-04-04 | 1997-04-04 | Outside monitoring device |
Country Status (1)
| Country | Link |
|---|---|
| JP (1) | JP4082471B2 (en) |
Families Citing this family (25)
| Publication number | Priority date | Publication date | Assignee | Title |
|---|---|---|---|---|
| JP3349060B2 (en) * | 1997-04-04 | 2002-11-20 | 富士重工業株式会社 | Outside monitoring device |
| JP3450189B2 (en) * | 1998-06-16 | 2003-09-22 | ダイハツ工業株式会社 | Pedestrian detection system and control method thereof |
| JP4100823B2 (en) * | 1999-05-27 | 2008-06-11 | 本田技研工業株式会社 | Object judgment device |
| JP3792437B2 (en) * | 1999-06-08 | 2006-07-05 | 三菱電機株式会社 | Car information system |
| JP3515926B2 (en) * | 1999-06-23 | 2004-04-05 | 本田技研工業株式会社 | Vehicle periphery monitoring device |
| JP4115638B2 (en) | 1999-10-19 | 2008-07-09 | 本田技研工業株式会社 | Object recognition device |
| JP4487672B2 (en) * | 2004-07-23 | 2010-06-23 | 株式会社デンソー | Hazardous area setting device |
| JP4327062B2 (en) * | 2004-10-25 | 2009-09-09 | 三菱電機株式会社 | Navigation device |
| JP2006178696A (en) * | 2004-12-22 | 2006-07-06 | Nippon Telegr & Teleph Corp <Ntt> | Plane detection apparatus and method, and plane detection program |
| WO2006121087A1 (en) * | 2005-05-10 | 2006-11-16 | Olympus Corporation | Image processing device, image processing method, and image processing program |
| EP1901225A1 (en) * | 2005-05-10 | 2008-03-19 | Olympus Corporation | Image processing device, image processing method, and image processing program |
| JP2007087203A (en) * | 2005-09-22 | 2007-04-05 | Sumitomo Electric Ind Ltd | Collision determination system, collision determination method, and computer program |
| JP2008117073A (en) * | 2006-11-01 | 2008-05-22 | Fuji Heavy Ind Ltd | Interruption vehicle detection device |
| JP5171723B2 (en) * | 2009-04-27 | 2013-03-27 | アルプス電気株式会社 | Obstacle detection device and vehicle equipped with the device |
| JP6194610B2 (en) | 2013-03-28 | 2017-09-13 | 富士通株式会社 | Moving distance estimation apparatus, moving distance estimation method, and program |
| JP5959073B2 (en) | 2014-09-30 | 2016-08-02 | インターナショナル・ビジネス・マシーンズ・コーポレーションInternational Business Machines Corporation | Detection device, detection method, and program |
| JP6408860B2 (en) * | 2014-10-22 | 2018-10-17 | 株式会社デンソー | Object detection device |
| JP6430907B2 (en) * | 2015-07-17 | 2018-11-28 | 株式会社Soken | Driving support system |
| JP6657934B2 (en) * | 2015-12-25 | 2020-03-04 | トヨタ自動車株式会社 | Object detection device |
| EP3327696B1 (en) | 2016-11-22 | 2021-03-17 | Ricoh Company, Ltd. | Information processing apparatus, imaging device, device control system, mobile body, information processing method, and program |
| JP6658674B2 (en) | 2017-06-08 | 2020-03-04 | トヨタ自動車株式会社 | Driving support system |
| JP7192771B2 (en) | 2017-08-22 | 2022-12-20 | ソニーグループ株式会社 | Information processing device, information processing method, program, and vehicle |
| JP6844508B2 (en) * | 2017-11-15 | 2021-03-17 | 株式会社豊田自動織機 | Safety device |
| US10754341B2 (en) * | 2018-02-07 | 2020-08-25 | Baidu Usa Llc | Systems and methods for accelerated curve projection |
| JP6969425B2 (en) * | 2018-02-20 | 2021-11-24 | 株式会社デンソー | Optical range measuring device |
Family Cites Families (6)
| Publication number | Priority date | Publication date | Assignee | Title |
|---|---|---|---|---|
| JP2799375B2 (en) * | 1993-09-30 | 1998-09-17 | 本田技研工業株式会社 | Anti-collision device |
| JP3186401B2 (en) * | 1994-02-10 | 2001-07-11 | 三菱電機株式会社 | Vehicle distance data processing device |
| JP3212218B2 (en) * | 1994-05-26 | 2001-09-25 | 三菱電機株式会社 | Obstacle detection device for vehicles |
| JP3586938B2 (en) * | 1995-09-12 | 2004-11-10 | スズキ株式会社 | In-vehicle distance measuring device |
| JPH0979821A (en) * | 1995-09-12 | 1997-03-28 | Suzuki Motor Corp | Obstacle recognizing device |
| JP3336825B2 (en) * | 1995-09-25 | 2002-10-21 | 三菱自動車工業株式会社 | Obstacle recognition device |
-
1997
- 1997-04-04 JP JP08688197A patent/JP4082471B2/en not_active Expired - Lifetime
Also Published As
| Publication number | Publication date |
|---|---|
| JPH10283462A (en) | 1998-10-23 |
Similar Documents
| Publication | Publication Date | Title |
|---|---|---|
| JP4082471B2 (en) | Outside monitoring device | |
| JP3349060B2 (en) | Outside monitoring device | |
| EP0933725B1 (en) | Vehicle surroundings monitoring apparatus | |
| JP3315054B2 (en) | Outside monitoring device | |
| US7046822B1 (en) | Method of detecting objects within a wide range of a road vehicle | |
| JP5145585B2 (en) | Target detection device | |
| JP5804180B2 (en) | Three-dimensional object detection device | |
| US20030210807A1 (en) | Monitoring device, monitoring method and program for monitoring | |
| US20130028473A1 (en) | System and method for periodic lane marker identification and tracking | |
| JP5077017B2 (en) | Driving support device and pedestrian detection device | |
| JP5943077B2 (en) | Three-dimensional object detection apparatus and three-dimensional object detection method | |
| JP5682735B2 (en) | Three-dimensional object detection device | |
| JP5743020B2 (en) | Three-dimensional object detection device | |
| KR102536037B1 (en) | Method and processing unit for determining information related to an object in the surrounding environment of a vehicle | |
| CN109827516B (en) | Method for measuring distance through wheel | |
| JP5682734B2 (en) | Three-dimensional object detection device | |
| JP2006160116A (en) | Vehicle motion estimation device and moving body detection device | |
| JP2006072495A (en) | Three-dimensional object monitoring device | |
| JPH09106500A (en) | Driving supporting device for vehicle | |
| KR101478072B1 (en) | Method for Detecting Vehicle | |
| JP2003230134A (en) | Night vision system | |
| JP6972798B2 (en) | Information processing device, image pickup device, device control system, mobile body, information processing method, and program | |
| JP4106163B2 (en) | Obstacle detection apparatus and method | |
| JPH05113482A (en) | Rear end collision prevention device mounted on car | |
| JP3697435B2 (en) | Outside monitoring device |
Legal Events
| Date | Code | Title | Description |
|---|---|---|---|
| A521 | Written amendment |
Free format text: JAPANESE INTERMEDIATE CODE: A523 Effective date: 20040401 |
|
| A621 | Written request for application examination |
Free format text: JAPANESE INTERMEDIATE CODE: A621 Effective date: 20040401 |
|
| A977 | Report on retrieval |
Free format text: JAPANESE INTERMEDIATE CODE: A971007 Effective date: 20070413 |
|
| A131 | Notification of reasons for refusal |
Free format text: JAPANESE INTERMEDIATE CODE: A131 Effective date: 20070508 |
|
| A521 | Written amendment |
Free format text: JAPANESE INTERMEDIATE CODE: A523 Effective date: 20070704 |
|
| A131 | Notification of reasons for refusal |
Free format text: JAPANESE INTERMEDIATE CODE: A131 Effective date: 20071204 |
|
| A521 | Written amendment |
Free format text: JAPANESE INTERMEDIATE CODE: A523 Effective date: 20071220 |
|
| TRDD | Decision of grant or rejection written | ||
| A01 | Written decision to grant a patent or to grant a registration (utility model) |
Free format text: JAPANESE INTERMEDIATE CODE: A01 Effective date: 20080122 |
|
| A61 | First payment of annual fees (during grant procedure) |
Free format text: JAPANESE INTERMEDIATE CODE: A61 Effective date: 20080206 |
|
| R150 | Certificate of patent or registration of utility model |
Free format text: JAPANESE INTERMEDIATE CODE: R150 |
|
| FPAY | Renewal fee payment (event date is renewal date of database) |
Free format text: PAYMENT UNTIL: 20110222 Year of fee payment: 3 |
|
| FPAY | Renewal fee payment (event date is renewal date of database) |
Free format text: PAYMENT UNTIL: 20120222 Year of fee payment: 4 |
|
| FPAY | Renewal fee payment (event date is renewal date of database) |
Free format text: PAYMENT UNTIL: 20120222 Year of fee payment: 4 |
|
| FPAY | Renewal fee payment (event date is renewal date of database) |
Free format text: PAYMENT UNTIL: 20130222 Year of fee payment: 5 |
|
| FPAY | Renewal fee payment (event date is renewal date of database) |
Free format text: PAYMENT UNTIL: 20140222 Year of fee payment: 6 |
|
| R250 | Receipt of annual fees |
Free format text: JAPANESE INTERMEDIATE CODE: R250 |
|
| S531 | Written request for registration of change of domicile |
Free format text: JAPANESE INTERMEDIATE CODE: R313531 |
|
| R350 | Written notification of registration of transfer |
Free format text: JAPANESE INTERMEDIATE CODE: R350 |
|
| R250 | Receipt of annual fees |
Free format text: JAPANESE INTERMEDIATE CODE: R250 |
|
| R250 | Receipt of annual fees |
Free format text: JAPANESE INTERMEDIATE CODE: R250 |
|
| R250 | Receipt of annual fees |
Free format text: JAPANESE INTERMEDIATE CODE: R250 |
|
| EXPY | Cancellation because of completion of term |