JP3712349B2 - Surviving myocardial diagnostic apparatus and operating method thereof - Google Patents
Surviving myocardial diagnostic apparatus and operating method thereof Download PDFInfo
- Publication number
- JP3712349B2 JP3712349B2 JP2000217834A JP2000217834A JP3712349B2 JP 3712349 B2 JP3712349 B2 JP 3712349B2 JP 2000217834 A JP2000217834 A JP 2000217834A JP 2000217834 A JP2000217834 A JP 2000217834A JP 3712349 B2 JP3712349 B2 JP 3712349B2
- Authority
- JP
- Japan
- Prior art keywords
- magnetic field
- myocardial
- current density
- data
- myocardium
- Prior art date
- Legal status (The legal status is an assumption and is not a legal conclusion. Google has not performed a legal analysis and makes no representation as to the accuracy of the status listed.)
- Expired - Fee Related
Links
Images


Classifications
-
- A—HUMAN NECESSITIES
- A61—MEDICAL OR VETERINARY SCIENCE; HYGIENE
- A61B—DIAGNOSIS; SURGERY; IDENTIFICATION
- A61B6/00—Apparatus for radiation diagnosis, e.g. combined with radiation therapy equipment
- A61B6/02—Devices for diagnosis sequentially in different planes; Stereoscopic radiation diagnosis
- A61B6/03—Computerised tomographs
- A61B6/037—Emission tomography
-
- A—HUMAN NECESSITIES
- A61—MEDICAL OR VETERINARY SCIENCE; HYGIENE
- A61B—DIAGNOSIS; SURGERY; IDENTIFICATION
- A61B5/00—Measuring for diagnostic purposes; Identification of persons
- A61B5/05—Detecting, measuring or recording for diagnosis by means of electric currents or magnetic fields; Measuring using microwaves or radio waves
-
- A—HUMAN NECESSITIES
- A61—MEDICAL OR VETERINARY SCIENCE; HYGIENE
- A61B—DIAGNOSIS; SURGERY; IDENTIFICATION
- A61B5/00—Measuring for diagnostic purposes; Identification of persons
- A61B5/24—Detecting, measuring or recording bioelectric or biomagnetic signals of the body or parts thereof
- A61B5/242—Detecting biomagnetic fields, e.g. magnetic fields produced by bioelectric currents
- A61B5/243—Detecting biomagnetic fields, e.g. magnetic fields produced by bioelectric currents specially adapted for magnetocardiographic [MCG] signals
-
- A—HUMAN NECESSITIES
- A61—MEDICAL OR VETERINARY SCIENCE; HYGIENE
- A61B—DIAGNOSIS; SURGERY; IDENTIFICATION
- A61B5/00—Measuring for diagnostic purposes; Identification of persons
- A61B5/24—Detecting, measuring or recording bioelectric or biomagnetic signals of the body or parts thereof
- A61B5/316—Modalities, i.e. specific diagnostic methods
- A61B5/318—Heart-related electrical modalities, e.g. electrocardiography [ECG]
- A61B5/346—Analysis of electrocardiograms
- A61B5/349—Detecting specific parameters of the electrocardiograph cycle
- A61B5/352—Detecting R peaks, e.g. for synchronising diagnostic apparatus; Estimating R-R interval
-
- A—HUMAN NECESSITIES
- A61—MEDICAL OR VETERINARY SCIENCE; HYGIENE
- A61B—DIAGNOSIS; SURGERY; IDENTIFICATION
- A61B6/00—Apparatus for radiation diagnosis, e.g. combined with radiation therapy equipment
- A61B6/02—Devices for diagnosis sequentially in different planes; Stereoscopic radiation diagnosis
- A61B6/03—Computerised tomographs
- A61B6/032—Transmission computed tomography [CT]
-
- A—HUMAN NECESSITIES
- A61—MEDICAL OR VETERINARY SCIENCE; HYGIENE
- A61B—DIAGNOSIS; SURGERY; IDENTIFICATION
- A61B6/00—Apparatus for radiation diagnosis, e.g. combined with radiation therapy equipment
- A61B6/50—Clinical applications
- A61B6/503—Clinical applications involving diagnosis of heart
-
- A—HUMAN NECESSITIES
- A61—MEDICAL OR VETERINARY SCIENCE; HYGIENE
- A61B—DIAGNOSIS; SURGERY; IDENTIFICATION
- A61B6/00—Apparatus for radiation diagnosis, e.g. combined with radiation therapy equipment
- A61B6/52—Devices using data or image processing specially adapted for radiation diagnosis
- A61B6/5211—Devices using data or image processing specially adapted for radiation diagnosis involving processing of medical diagnostic data
- A61B6/5229—Devices using data or image processing specially adapted for radiation diagnosis involving processing of medical diagnostic data combining image data of a patient, e.g. combining a functional image with an anatomical image
- A61B6/5235—Devices using data or image processing specially adapted for radiation diagnosis involving processing of medical diagnostic data combining image data of a patient, e.g. combining a functional image with an anatomical image combining images from the same or different ionising radiation imaging techniques, e.g. PET and CT
-
- A—HUMAN NECESSITIES
- A61—MEDICAL OR VETERINARY SCIENCE; HYGIENE
- A61B—DIAGNOSIS; SURGERY; IDENTIFICATION
- A61B6/00—Apparatus for radiation diagnosis, e.g. combined with radiation therapy equipment
- A61B6/52—Devices using data or image processing specially adapted for radiation diagnosis
- A61B6/5211—Devices using data or image processing specially adapted for radiation diagnosis involving processing of medical diagnostic data
- A61B6/5229—Devices using data or image processing specially adapted for radiation diagnosis involving processing of medical diagnostic data combining image data of a patient, e.g. combining a functional image with an anatomical image
- A61B6/5247—Devices using data or image processing specially adapted for radiation diagnosis involving processing of medical diagnostic data combining image data of a patient, e.g. combining a functional image with an anatomical image combining images from an ionising-radiation diagnostic technique and a non-ionising radiation diagnostic technique, e.g. X-ray and ultrasound
-
- A—HUMAN NECESSITIES
- A61—MEDICAL OR VETERINARY SCIENCE; HYGIENE
- A61B—DIAGNOSIS; SURGERY; IDENTIFICATION
- A61B8/00—Diagnosis using ultrasonic, sonic or infrasonic waves
- A61B8/52—Devices using data or image processing specially adapted for diagnosis using ultrasonic, sonic or infrasonic waves
- A61B8/5215—Devices using data or image processing specially adapted for diagnosis using ultrasonic, sonic or infrasonic waves involving processing of medical diagnostic data
- A61B8/5238—Devices using data or image processing specially adapted for diagnosis using ultrasonic, sonic or infrasonic waves involving processing of medical diagnostic data for combining image data of patient, e.g. merging several images from different acquisition modes into one image
-
- G—PHYSICS
- G16—INFORMATION AND COMMUNICATION TECHNOLOGY [ICT] SPECIALLY ADAPTED FOR SPECIFIC APPLICATION FIELDS
- G16H—HEALTHCARE INFORMATICS, i.e. INFORMATION AND COMMUNICATION TECHNOLOGY [ICT] SPECIALLY ADAPTED FOR THE HANDLING OR PROCESSING OF MEDICAL OR HEALTHCARE DATA
- G16H50/00—ICT specially adapted for medical diagnosis, medical simulation or medical data mining; ICT specially adapted for detecting, monitoring or modelling epidemics or pandemics
- G16H50/50—ICT specially adapted for medical diagnosis, medical simulation or medical data mining; ICT specially adapted for detecting, monitoring or modelling epidemics or pandemics for simulation or modelling of medical disorders
-
- A—HUMAN NECESSITIES
- A61—MEDICAL OR VETERINARY SCIENCE; HYGIENE
- A61B—DIAGNOSIS; SURGERY; IDENTIFICATION
- A61B5/00—Measuring for diagnostic purposes; Identification of persons
- A61B5/05—Detecting, measuring or recording for diagnosis by means of electric currents or magnetic fields; Measuring using microwaves or radio waves
- A61B5/055—Detecting, measuring or recording for diagnosis by means of electric currents or magnetic fields; Measuring using microwaves or radio waves involving electronic [EMR] or nuclear [NMR] magnetic resonance, e.g. magnetic resonance imaging
-
- A—HUMAN NECESSITIES
- A61—MEDICAL OR VETERINARY SCIENCE; HYGIENE
- A61B—DIAGNOSIS; SURGERY; IDENTIFICATION
- A61B5/00—Measuring for diagnostic purposes; Identification of persons
- A61B5/41—Detecting, measuring or recording for evaluating the immune or lymphatic systems
- A61B5/413—Monitoring transplanted tissue or organ, e.g. for possible rejection reactions after a transplant
-
- A—HUMAN NECESSITIES
- A61—MEDICAL OR VETERINARY SCIENCE; HYGIENE
- A61B—DIAGNOSIS; SURGERY; IDENTIFICATION
- A61B5/00—Measuring for diagnostic purposes; Identification of persons
- A61B5/74—Details of notification to user or communication with user or patient ; user input means
- A61B5/742—Details of notification to user or communication with user or patient ; user input means using visual displays
- A61B5/743—Displaying an image simultaneously with additional graphical information, e.g. symbols, charts, function plots
Landscapes
- Health & Medical Sciences (AREA)
- Life Sciences & Earth Sciences (AREA)
- Engineering & Computer Science (AREA)
- Medical Informatics (AREA)
- Public Health (AREA)
- General Health & Medical Sciences (AREA)
- Pathology (AREA)
- Biomedical Technology (AREA)
- Molecular Biology (AREA)
- Heart & Thoracic Surgery (AREA)
- Surgery (AREA)
- Animal Behavior & Ethology (AREA)
- Biophysics (AREA)
- Physics & Mathematics (AREA)
- Veterinary Medicine (AREA)
- Radiology & Medical Imaging (AREA)
- Nuclear Medicine, Radiotherapy & Molecular Imaging (AREA)
- Cardiology (AREA)
- High Energy & Nuclear Physics (AREA)
- Optics & Photonics (AREA)
- Computer Vision & Pattern Recognition (AREA)
- Dentistry (AREA)
- Oral & Maxillofacial Surgery (AREA)
- Pulmonology (AREA)
- Theoretical Computer Science (AREA)
- Data Mining & Analysis (AREA)
- Databases & Information Systems (AREA)
- Epidemiology (AREA)
- Primary Health Care (AREA)
- Measurement And Recording Of Electrical Phenomena And Electrical Characteristics Of The Living Body (AREA)
- Measuring Magnetic Variables (AREA)
- Image Processing (AREA)
- Image Analysis (AREA)
Description
【0001】
【発明の属する技術分野】
この発明は、磁界計測による生存心筋診断装置および生存心筋分析方法に関し、より特定的には、左右の心室における異常電流の発振ループ(旋回路)形成の原因となる心筋内の障害部位または生存部位を非接触磁気計測により非侵襲的に同定するための磁界計測による生存心筋診断装置および生存心筋分析方法に関する。
【0002】
【従来の技術】
従来、心疾患の診断を行なうために、心電図法が一般的に採用されている。
【0003】
しかしながら、従来の心電図法では、たとえば心臓手術前に心筋障害部位や生存心筋部位の位置、大きさ、形状を推定するためには不十分であった。
【0004】
これは、心電図法が間接的な計測方法であることによる。すなわち、心臓から体表面までに存在する組織、心臓と他の臓器や骨との位置的関係、心臓の大きさ、人体の各組織ごとの電気伝導率などが被験者ごとに大きく異なるため、心電図法で得られる情報では患部位置を正確に特定することは極めて困難であった。
【0005】
一方、虚血による心筋障害部位と、生理学的に生存している心筋(以下、生存心筋と称する)部位とが、心室内に混在する場合、電気的異常旋回路が心筋内に形成され、心室頻拍などの原因となる場合がある。したがって、このような心筋障害部位または生存心筋部位を3次元的に正確に同定することが強く要望されている。
【0006】
しかしながら、上述のように、心電図法では、虚血による心筋障害部位が存在するか否かの診断は下すことができても、心臓における心筋障害部位の位置、大きさ、形状を認識することは到底できなかった。
【0007】
また、近年急速に普及している核磁気共鳴(MRI)法、X線CT法などの医用断層像撮影装置では、心血管系の解剖学的構造を高精度に調べることができるが、心筋障害部位や生存心筋部位の位置、大きさ、形状を認識することには到底利用できなかった。
【0008】
そこで、医療現場で現在利用されている生存心筋の評価方法としては、心筋SPECT法またはPET法のような放射性同位元素を用いる検査方法がある。また、心筋組織性状の評価には、カテーテルを利用した、または外科手術による心筋組織のサンプリング(心筋生検)といった直接組織を採取する侵襲的検査法が必要となる。
【0009】
これらの方法のうち、上述の放射性同位元素を用いる心筋SPECT法またはPET法のような検査方法は、心筋梗塞後狭心症や冠状動脈バイパス手術前後の心筋の生存状態を正確に評価する方法として利用されている。しかしながら、これらの検査方法では、放射性同位元素を用いるため管理区域内での使用が義務づけられ、また費用も高価である。
【0010】
さらに、心臓移植後、拒絶反応の程度に応じて治療が必要かどうかを判断するためにも拒絶心筋の評価が必要であり、しかも比較的短い間隔で経時的に何回も拒絶反応の有無の検査を行なう必要がある。心電図法や心エコー図法を用いた検査方法でも心筋拒絶反応の変化を捉えることはできるが、診断に必要な精度、すなわち拒絶反応の程度を推定するのに必要なだけの精度を有してはいない。このため、心臓移植後には、カテーテルを用いた心筋生検を定期的に行なう方法が採用されており、患者に大きな負担を強いている。したがって、非侵襲的計測手段により心臓移植後の拒絶心筋の位置、大きさ、程度を3次元的に診断することができる装置の実現が強く望まれている。
【0011】
一方、地磁気の10億分の1程度の磁束を高感度に検出することができる超電導量子干渉素子(Superconducting Quantum Interference Device:以下、SQUIDと略する)を用いたSQUID磁束計がさまざまな分野で応用されている。特に、前述のように非侵襲性の計測が強く要望されている生体計測の分野では、SQUID磁束計を用いた人体の非接触磁気計測が試みられている。
【0012】
特に、近年の薄膜素子製造技術の進歩によりDC−SQUIDが開発されたことにより、SQUID磁束計を用いて心臓の磁界分布である心磁図を計測することが試みられつつある。
【0013】
【発明が解決しようとする課題】
しかしながら、心磁図だけでは、人体内における心筋障害部位または生存心筋部位の位置、大きさ、形状、程度を直接表示することはできず、心臓内における患部の相対的な位置関係を医師に的確に知らせることが困難であった。
【0014】
このため、心磁図が示す心磁界分布から心筋内の電流活動を可視化する方法が提案されてきた。そして、そのような方法として、1つまたは複数個の電流ダイポールで磁場源を模倣して可視化する方法が採用されてきた。しかしながら、心筋全体はある広がりを持って電気的活性状態にあるため、心筋全体を1個の電流ベクトルに置き換えてしまう方法では、心筋の電気生理学的活性度を示す電流密度情報を得ることはできず、したがって心筋障害部位または生存心筋部位の大きさ、形状も到底同定することはできなかった。
【0015】
それゆえに、この発明の目的は、非侵襲的な磁気計測により得られた心筋内の電流密度分布を示すデータに基づいて、心筋障害部位または生存心筋部位を安全、迅速かつ高精度に3次元的に同定することができる磁界計測による生存心筋診断装置および生存心筋分析方法を提供することである。
【0016】
【課題を解決するための手段】
この発明による磁界計測による生存心筋診断装置は、磁界分布計測手段と、第1の演算手段と、第2の演算手段と、表示手段とを備える。磁界分布計測手段は、被験者の胸部上の複数の座標における非接触磁気計測により複数の座標に対応する複数の磁界時系列データを取得し、かつ複数の磁界時系列データに基づいて胸部上の磁界分布時系列データを生成する。第1の演算手段は、生成された磁界分布時系列データに基づいて被験者の心筋内の電流密度分布の時系列データを生成する。第2の演算手段は、別途供給された被験者の胸部断層画像データを加工して解剖学的画像を示すデータを生成する。表示手段は、第1の演算手段により生成されたデータが示す心筋内の電流密度分布の画像を、第2の演算手段により生成されたデータが示す解剖学的画像に重ね合わせて表示する表示処理を行なう。これにより、異常な電流密度分布を示す心筋障害部位、または生存心筋部位を3次元的に同定することができる。
【0017】
好ましくは、第1の演算手段は、解剖学的要因または機能的要因に基づいて、左心室および右心室を任意の複数の領域に分割して各領域ごとの心筋内の電流密度分布の時系列データを生成し、これにより左心室および右心室における心筋障害部位を3次元的に同定することができる。
【0018】
さらに好ましくは、磁界計測による生存心筋診断装置は、第1の演算手段により生成されたデータが示す心筋内の電流密度と、心筋障害電流との関係を判断するための情報を含むデータベースをさらに備える。
【0019】
この発明の他の局面に従うと、磁界計測による生存心筋診断装置は、磁界分布計測手段と、演算手段と、表示手段とを備える。磁界分布計測手段は、被験者の胸部上の複数の座標における非接触磁気計測により複数の座標に対応する複数の磁界時系列データを取得し、かつ複数の磁界時系列データに基づいて胸部上の磁界分布時系列データを生成する。演算手段は、生成された磁界分布時系列データに基づいて被験者の心筋内の電流密度分布の時系列データを生成する。表示手段は、演算手段により生成されたデータに基づいて、被験者の心臓の洞房結節からヒス束−プルキンエ繊維系への刺激伝播経路を示す画像と、心筋内の電流密度分布を示す画像とを重ね合わせて表示する表示処理を行なう。これにより、異常な電流密度分布を示す心筋障害部位、または生存心筋部位を3次元的に同定することができる。
【0020】
好ましくは、演算手段は、解剖学的要因または機能的要因に基づいて、左心室および右心室を任意の複数の領域に分割して各領域ごとの心筋内の電流密度分布の時系列データを生成し、これにより左心室および右心室における心筋障害部位を3次元的に同定することができる。
【0021】
さらに好ましくは、磁界計測による生存心筋診断装置は、演算手段により生成されたデータが示す心筋内の電流密度と、心筋障害電流との関係を判断するための情報を含むデータベースをさらに備える。
【0022】
この発明の他の局面に従うと、磁界計測による生存心筋分析方法は、被験者の胸部上の複数の座標における非接触磁気計測により取得された複数の座標に対応する複数の磁界時系列データに基づいて生成された胸部上の磁界分布時系列データに基づいて、被験者の心筋内の電流密度分布の時系列データである第1のデータを生成するステップと、別途供給された被験者の胸部断層画像データを加工して解剖学的画像を示す第2のデータを生成するステップと、第1のデータが示す心筋内の電流密度分布の画像を、第2のデータが示す解剖学的画像に重ね合わせて表示することにより、異常な電流密度分布を示す心筋障害部位、または生存心筋部位を3次元的に同定することを可能にするステップとを備える。
【0023】
好ましくは、第1のデータを生成するステップは、解剖学的要因または機能的要因に基づいて、左心室および右心室を任意の複数の領域に分割して各領域ごとの心筋内の電流密度分布の時系列データを生成し、これにより左心室および右心室における心筋障害部位を3次元的に同定することができる。
【0024】
さらに好ましくは、磁界計測による生存心筋分析方法は、第1のデータが示す心筋内の電流密度と、心筋障害電流との関係を示す情報に基づいて、3次元的に同定された部位が心筋障害部位か生存心筋部位かを判断するステップをさらに備える。
【0025】
この発明のさらに他の局面に従うと、磁界計測による生存心筋分析方法は、被験者の胸部上の複数の座標における非接触磁気計測により取得された複数の座標に対応する複数の磁界時系列データに基づいて生成された胸部上の磁界分布時系列データに基づいて、被験者の心筋内の電流密度分布の時系列データを生成するステップと、生成されたデータに基づいて、被験者の心臓の洞房結節からヒス束−プルキンエ繊維系への刺激伝播経路を示す画像と、心筋内の電流密度分布を示す画像とを重ね合わせて表示することにより、異常な電流密度分布を示す心筋障害部位、または生存心筋部位を3次元的に同定することを可能にするステップとを備える。
【0026】
好ましくは、データを生成するステップは、解剖学的要因または機能的要因に基づいて、左心室および右心室を任意の複数の領域に分割して各領域ごとの心筋内の電流密度分布の時系列データを生成し、これにより左心室および右心室における心筋障害部位を3次元的に同定することができる。
【0027】
さらに好ましくは、磁界計測による生存心筋分析方法は、データが示す心筋内の電流密度と、心筋障害電流との関係を示す情報に基づいて、3次元的に同定された部位が心筋障害部位か生存心筋部位かを判断するステップをさらに備える。
【0028】
したがって、この発明によれば、非侵襲的な磁気計測により得た心筋内の電流密度分布を示す画像を、他の医用診断装置で撮影された同一被験者の胸部断層画像データを加工して得られた解剖学的画像上に重ね合わせて表示することにより、異常な電流密度分布を示す心筋障害部位、または生存心筋部位を、医師が安全、迅速かつ高精度に3次元的に同定することが可能となる。
【0029】
さらに、この発明によれば、非侵襲的な磁気計測により得た心筋内の電流密度分布を示す画像を、同一被験者の心臓の洞房結節からヒス束−プルキンエ繊維系への刺激伝播経路を示す画像上に重ね合わせて表示することにより、異常な電流密度分布を示す心筋障害部位、または生存心筋部位を、医師が安全、迅速かつ高精度に3次元的に同定することが可能となる。
【0030】
【発明の実施の形態】
以下、この発明の実施の形態を図面を参照して詳しく説明する。なお、図中同一または相当部分には同一符号を付してその説明は繰返さない。
【0031】
[実施の形態1]
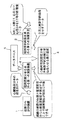
図1は、この発明の実施の形態1による、磁界計測による生存心筋診断装置の構成を概略的に示す機能ブロック図である。
【0032】
図1を参照して、磁界分布計測装置1は、たとえば、後で詳述するSQUID磁束計のような計測手段を用いて、被験者の胸部上の複数の座標における非接触磁気計測を行ない、複数の座標に対応する複数の磁界時系列データを取得する。そして、取得した複数の磁界時系列データに基づいて、胸部上の、すなわち心臓磁場の磁界分布時系列データを生成して出力する。
【0033】
磁界分布計測装置1によって計測された心臓の磁界分布時系列データに基づいて、第1の演算装置2は、たとえば、後述する種々の公知の計算手法を用いて、心筋内の電流密度分布の時系列データである第1のデータを生成して出力する。
【0034】
一方、核磁気共鳴(MRI)法、X線CT法、心エコー図法、心筋SPECT法などの断層診断装置によって別途得られた同一被験者の胸部の断層画像データ(複数枚の断層画像のデータを含む)が、第2の演算装置3に与えられ、第2の演算装置3は、これらの断層画像データを加工して3次元的な解剖学的画像を示す第2のデータを生成して出力する。
【0035】
ここで、上述の第1のデータを画像で表現する。電流密度分布を表わす画像の濃淡に着目することによって、異常な電流密度を示す心筋障害部位、または生存心筋部位の3次元的な同定が可能となる。
【0036】
表示装置4は、第1の演算装置によって生成された第1のデータが示す心筋内の電流密度分布を示す画像を、第2の演算装置3によって生成された第2のデータが示す被験者の胸部の3次元的解剖学的画像に重ね合わせて表示する。この結果、解剖学的画像上において心筋内の心筋障害部位または生存心筋部位を3次元的に同定することができる。
【0037】
なお、表示装置4上には心筋内の電流密度分布そのものが表示されるだけである。そこで、心筋内の電流密度分布と心筋障害電流との関係に関する判断情報を含むデータベース5を設け、第1の演算装置2によって実際に算出された電流密度分布をデータベース5の判断情報と対比してその結果を表示装置4に表示することにより、当該電流密度の部位が障害心筋(たとえば虚血心筋部位、拒絶心筋など)であるのか、あるいは生存心筋であるのかをより正確に判断することが可能になる。
【0038】
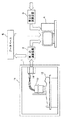
次に、図2は、図1に示したこの発明の実施の形態1による磁界計測による生存心筋診断装置の構成をより具体化して示したブロック図である。
【0039】
図2を参照して、磁界分布計測装置1は、磁気シールドルーム(Magnetic Shield Room:以下、MSR)11内において、被験者12の胸部上において非接触の磁気計測を行なうように設置された、SQUID磁束計を内蔵するデュワー13と、磁界分布データの演算部14とを備えている。
【0040】
デュワー13内には液体ヘリウムが満たされて超電導が生じる低温系の環境が形成されており、その中に、超電導体からなる検出コイルで構成されたSQUID磁束計が収納されている。
【0041】
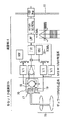
図3は、図2に示したMSR11内のデュワー13内の超低温系に設置されるSQUID磁束計15、および常温系のMSR11内に設置される演算部14をより詳細に示すブロック図である。
【0042】
なお、図3に示した構成は、被験者の胸部上の1点の磁界データを計測するための1チャネル分の構成であり、後述するように、この発明では、被験者の胸部上において複数の座標における磁場の多点同時計測を行なう。したがって、図2のMSR11内には、図3に示す1チャネル分の構成が、計測に必要な複数チャネル分設けられていることになる。
【0043】
以下に、図3を参照して、1チャネル分のSQUID磁束計による磁界データの生成について説明する。
【0044】
まず、SQUID磁束計15は、被験者の胸部表面から発生する磁場を検出するための、超電導体からなるピックアップコイル16を備える。ピックアップコイル16が磁場を捉えると電流が流れ、この電流はコイル17に引き込まれてNbシールド20内に磁場を生じさせる。
【0045】
この結果、この磁場に対して線形に変化する磁場が超電導ループ18内に形成され、この超電導ループ18の両端の電圧を、常温系のMSR11内に設置された演算部14の増幅器によって検出し、演算部14は、検出電圧に変化が生じないよう、Nbシールド20内のモジュレーションコイル19に流れる電流を調整する。
【0046】
すなわち、このSQUIDによる生体の磁場の検出は、発生する磁場を直接計測するものではなく、いわゆるゼロ位法を用いて、超電導リング18内の磁場が常に一定値となるようにフィードバックをかける(具体的にはモジュレーションコイル19に流れる電流を調整してモジュレーションコイル19に発生する磁場を制御することにより、超電導ループ18内に常に一定の磁場が生じるようにする)ことにより、ピックアップコイル16で検出される磁場を、演算部14が電気信号に変換して出力するものである。このようなフィードバックの手法は通常、フラックスロックトループ(flux locked loop:以下、FLL)と呼ばれる周知の技術である。
【0047】
このようなSQUID磁束計15およびその演算部14は周知の技術であるため、これ以上の説明を省略する。
【0048】
前述のように、図3に示した構成は、1チャネル分の磁界データの計測に必要な構成であり、被験者の胸部前面上における1点で計測された磁場の磁界時系列データを示す電気信号を出力するものである。
【0049】
この発明では、前述のように被験者の胸部前面に多くのセンサ(SQUID磁束計)を配列し、胸部前面上の磁場を多点測定しようとするものである。磁場は時間的に変化するものであり、たとえば1心拍に相当する期間中においても、測定場所が異なれば磁場は場所に応じた異なる変化をする。
【0050】
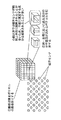
図4は、被験者の胸部前面上における複数のセンサ(各々が1チャネルのSQUID磁束計)の配置の一例を示す図である。また、図5は、図4の複数のセンサのそれぞれの位置に対応してそれぞれのセンサから得られた、1心拍期間における磁場の変化を示す1群の磁界時系列データを示している。
【0051】
図2に示す磁界分布計測装置1から出力されるデータは、図5に示すような複数の測定位置(座標)に対応する1群の磁界時系列データである。ある特定の時刻に着目してこれらの1群の磁界時系列データを捉えると、測定対象である胸部前面上におけるある時刻の磁場の強さの分布状態を示す実際の山谷の様子をグラフ(図)で表現するのは困難なので、天気図の気圧のように等高線図で表現している磁界分布データが得られる。この意味からも、磁界分布計測装置1から出力されるデータは、胸部前面上の磁界分布時系列データとして捉えることができる。
【0052】
磁界分布計測装置1から出力されるこのような1群の磁界時系列データ、すなわち磁界分布時系列データは、図2の第1の演算装置2に与えられ、この第1の演算装置2は、ある時刻の磁界分布データに基づいてその瞬間に流れる胸部内の電流密度を求めるように機能する。
【0053】
磁界分布計測装置1によって生成された磁界分布時系列データから、測定対象となる人体内の部位(この発明では心臓)を流れる電流密度分布を第1の演算装置2で求める手法について説明する。
【0054】
図6は、このような電流密度を求める方法を模式的に説明する図である。以下に説明する方法では、解析しようとする人体内の特定の1つの部位に仮に電流センサ(仮想センサ)が設けられていたとすれば、あたかもそこに流れるはずの電流を間接的に算出しようとするものである。このため、人体胸部前面に設置されたすべてのセンサ(SQUID磁束計)から得られる磁界時系列データにある係数をかけてその総和を取ることによって、当該仮想センサの電流出力を得ることができる。そして、この係数をどのように求めるかがこの演算における中心的な課題となる。
【0055】
以下に、図6を参照して、電流密度を求める手法についてより詳細に説明する。まず、人体表面(胸部前面)上に、総数がN個の磁界センサが配列されているものとする。一方、解析対象である人体(胸部、特に心臓)を、各々が小さなブロックであるボクセルの集合体とみなす。ここで、ボクセルの総数をM個とする。
【0056】
各センサjから得られる磁界時系列データをBj(t)とし、各センサ出力(Bj(t)に対応するボクセルiの空間フィルタ係数をβijとする。
【0057】
ここで、ボクセルiに仮想電流センサがあるものと考えた場合、当該仮想電流センサから得られる電流密度に対応する仮想センサ出力をSi(t)とすると、Si(t)は次式で定義される。
【0058】
【数1】
したがって、空間フィルタ係数βijが決まれば、各ボクセルiにおける電流密度を得ることができ、解析対象全体における3次元的電流密度分布を得ることができる。
【0060】
上述の空間フィルタ係数βijを、対応するボクセルiの分布電流に対してのみ鋭敏な感度を有するように設定する手法としては、SAM(Synthetic Aperture Magnetometry)、MUSIC(Multiple Signal Classification)などの種々の手法を用いることができる。SAMやMUSICは、これまで、レーダやソナーなどの分野で研究開発が行なわれてきたものであり、それぞれの手法は周知であるが、未だ心臓磁界の診断に応用されたことはない。
【0061】
SAMやMUSICの手法によって空間フィルタ係数を用いて求められた各ボクセルのリアルタイムに算出された仮想センサ出力は、非常に高いリアルタイム性を有するという利点を有している。
【0062】
SAMやMUSICの技術そのものは周知であり、またこれらの手法を用いて空間フィルタ係数を求めるアルゴリズムは極めて複雑なため、ここではその詳細な説明を省略するが、SAMについては、1999年発行のProceedings of the 11th International Conference on Biomagnetismの“Reent Advances in Biomagnetism”(Tohoku University Press発行)の第302頁から第305頁のRobinson SE および Vrba J による“Functional Neuroimaging by Synthetic Aperture Magnetometry (SAM)”に詳細に説明されている。MUSICについては、平成9年1月25日発行の原宏および栗城真也による「脳磁気科学−SQUID計測と医学応用−」(オーム社)の第117頁から第119頁に詳細に説明されている。
【0063】
このようにして、第1の演算装置2は、磁界分布計測装置1によって生成された磁界分布データから解析対象である心臓内の3次元的電流密度分布を示す時系列データを生成し、表示装置4の一方入力に与える。
【0064】
一方、図2に示す第2の演算装置3には、図示しない他の断層診断装置、たとえばMRI法、X線CT法、心エコー図法、心筋SPECT法などを用いて予め、心電図同期トリガをかけて撮影された同一被験者の胸部の複数のスライス画像(たとえば5ミリピッチで十数枚程度)の画像データが入力される。
【0065】
第2の演算装置3は、これらの複数のスライス画像のデータを加工(補間)して所定視点から3次元透視変換を施し、解剖学的画像を示す第2のデータを生成する。このように複数のスライス画像から3次元的な解剖学的画像を形成する技術は周知であり、たとえば特開平11−128224号公報、国際公開WO98/15226号公報などに詳細に開示されている。したがって、その詳細はここでは説明しない。
【0066】
このようにして、第2の演算装置3は、同一被験者の心臓付近の胸部の3次元的な解剖学的画像を示す第2のデータを生成し、表示装置4の他方入力に与える。
【0067】
図2の表示装置4は、第2の演算装置3からの第2のデータに基づいて形成した被験者の胸部の3次元的な解剖学的画像上に、第1の演算装置2からの第1のデータに基づいて形成した心筋内の3次元的電流密度分布を示す画像を重ね合わせて表示する。
【0068】
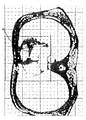
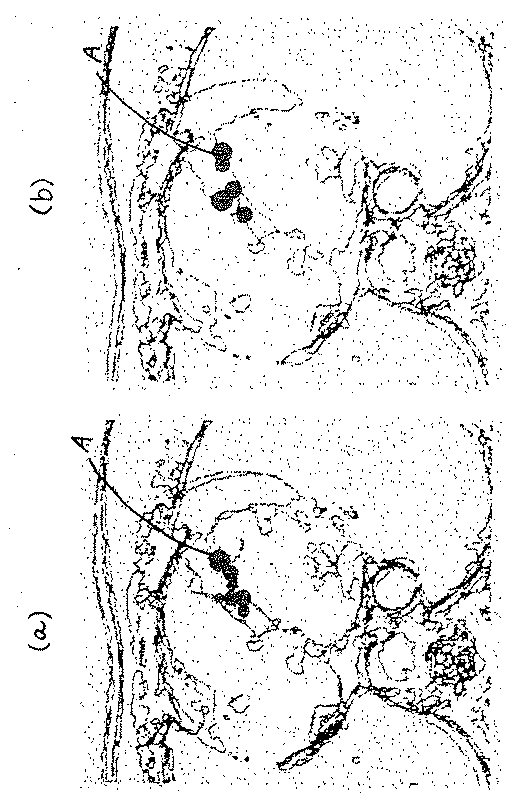
図7の(a),(b)は各々、表示装置4によって表示される3次元的な解剖学的画像に重ね合わされた3次元的電流密度分布のリアルタイム表示の態様を示す図であり、(a)と(b)とでは、時間の推移により電流密度分布が経時的に変化している。
【0069】
図7の(a),(b)の各々は、たとえば被験者の胸部を5ミリピッチでスライスして得た5枚程度の断層画像を補間処理した3次元的画像であり、実際の表示画像の奥行き感を図面上で表現することは困難である。図7(a),(b)の各図では、各画像を構成する線図が重複した複数の線図によって表現されていることから、複数のスライス画像の合成により形成された奥行き感のある立体的な解剖学的画像であることを推測することができる。
【0070】
なお、図7の(a),(b)の各々において、断層像の上側が人体の前面であり、下側が背面である。また(a),(b)の各断層像は、下側(足側)から見た断層像である。
【0071】
図7の(a),(b)の各々において、Aで示す円の集合は、3次元的解剖学的画像に重ね合わされた3次元的電流密度分布を表示するものであり、各円の径の大きさが電流密度の大きさを表わしている。また、電流密度の大小は、画面上の特定の色の濃淡で表示することもできる。
【0072】
また、図8は、図7の(a),(b)のような深さのある立体的解剖学的画像のある深さにおける断層画像を抽出して表示するものであり、同様にAで示す円の集合が当該断層画像上における電流密度分布を表わしている。
【0073】
このように、深さのある3次元的な解剖学的画像上に心筋内の3次元的電流密度分布を表示することにより、医師は解剖学的画像上における心筋内の電流密度分布の相対的な位置関係を的確に把握することができる。特に、表示された電流密度分布が異常を示しているときには、心筋障害部位または生存心筋部位の位置、大きさ、および形状を的確に診断することができる。
【0074】
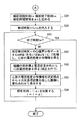
図9は、以上の実施の形態1による心臓磁界診断装置によって実行される心筋内の電流密度分布の同定方法を示すフロー図である。
【0075】
図9を参照すると、まずステップS1において、磁界分布計測装置1により、人体胸部上の複数の座標において非接触磁気計測を行ない、複数の時系列データを生成し、必要であれば記録する。なお、第1の演算装置2における前述のSAMまたはMUSICによる演算は、リアルタイムで供給される時系列データに対して実行可能である。
【0076】
次に、ステップS2において、予め心電図同期トリガをかけて撮影した複数のMRI画像に対して、第2の演算装置3により補間演算(所定視点からの3次元透視変換)を施し、3次元の解剖学的画像を得る。
【0077】
次に、ステップS3において、解析の初期時刻をts、解析の終了時刻をte、解析の時間間隔をΔtと定める。
【0078】
次に、ステップS4において、解析時刻tに初期時刻tsを代入して解析を開始する。そして、ステップS5において、解析時刻tが終了時刻teに達するまで、以下の処理を行なう。
【0079】
すなわち、ステップS6において、第1の演算装置2により指定解析時刻tにおける心臓磁界分布データをSAM法またはMUSIC法で処理して心筋内電流密度分布データを得る。
【0080】
次に、ステップS7において、心筋の組織の実体積と、算出された電流密度分布とから、実際の心筋電流密度を得る。すなわち、ステップS6で算出された心筋内電流密度分布データをより実際の心筋電流密度に近い値に補正する。
【0081】
次に、ステップS8において、表示装置4により、心筋内電流密度を、所定視点から3次元透視変換を施した解剖学的画像に重ね合わせて表示する。
【0082】
次に、ステップS9において解析時刻tにΔtを加算する。
これらのステップS6〜S9の処理が、解析時刻tが終了時刻teに達したことがステップS5で判断されるまで繰返され、終了時刻teに達すると、解剖学的画像に重ね合わされた心筋内電流密度分布の表示を終了する。
【0083】
なお、図1に関して先に説明したように、第1の演算装置2によって算出された心筋内の電流密度分布に基づいて、データベース5から、当該心筋部位における障害に関する情報を得ることができる。
【0084】
図10は、このような実施の形態1の変形例による処理を示すフロー図であり、以下の点を除いて、図9に示したフロー図と同じである。
【0085】
すなわち、ステップS10において、ステップS7で得られた補正後の心筋電流密度に基づくデータベース5に含まれる心筋障害電流に関する情報から、当該部位における心筋の障害の有無と障害の程度に関する情報を引出し、表示装置4に同時に表示させる。
【0086】
次に、実施の形態1のさらなる変形例について、図11および図12を参照して説明する。上述の実施の形態1では、心臓の解剖学的画像上に電流密度分布を3次元的に可視表示していたが、この変形例ではさらに、左右の心室の心筋を、心臓の解剖学的要因または機能的要因に基づいて複数の任意の領域に分割し、各領域ごとの電流密度分布を算出しようとするものである。
【0087】
すなわち、分割したそれぞれの領域ごとに心筋内電流密度の平均を求めて互いに対比すれば、領域ごとに電流の流れの善し悪しを判断することができ、医師にとっては障害心筋部位または生存心筋部位の好適な判断材料となる。
【0088】
領域の分割の仕方としては、心臓の解剖学的特徴に着目して左右の心室を任意の複数の領域に分割する方法、冠状動脈の解剖学的特徴に着目して左心室を任意の複数の領域に分割する方法などがある。この他にも、たとえば心室中隔から放射状に6度毎に密度分布を求めてプロファイルカーブを作成し、さらに電圧と電導時間との機能図を作成する方法なども考えられる。
【0089】
図11は、領域分割の一態様として、解剖学的特徴である冠状動脈の位置に着目した領域分割の様子を模式的に示す図である。図11の例では、心筋の領域分割は、左冠状動脈の前下行枝の支配領域と、左回旋枝の支配領域と、右冠状動脈の支配領域とに分割するような形で、行なわれている。そしてこれらの領域のそれぞれにおいて、心筋電流密度が算出される。
【0090】
図12は、このような、実施の形態1のさらなる変形例による処理を示すフロー図であり、以下の点を除いて、図9に示したフロー図と同じである。
【0091】
すなわち、ステップS11において、ステップS2で得られた3次元解剖学的画像において、図11に示したように冠状動脈の各枝に支配される領域に心筋を分割する。そして、ステップS12において、ステップS7で算出された心筋電流密度から、上記ステップS11で分割された各領域ごとの心筋電流密度が求められる。したがって、実施の形態1による電流密度分布の3次元的表示に加えて、左右心室の心筋障害部位を含む領域を3次元的に容易に同定することが可能となる。
【0092】
以上のように、この発明の実施の形態1によれば、SQUID磁束計を用いた被験者の胸部上の非侵襲的な磁気計測によって得られた心筋内の電流密度分布を示す画像を3次元的解剖学的画像に重ねて表示することにより、異常な電流密度分布を示す障害心筋部位、または生存心筋部位の位置、大きさ、形状、障害の程度を医師が、安全、迅速かつ高精度に3次元的に同定することが可能となり、患者の負担を軽減することが可能となる。また、検査に放射性同位元素を用いないので、日をおかずに検査を連続的に実施することが可能となる。
【0093】
また、左右の心室を、解剖学的要因または機能的要因に基づいて複数の領域に分割し、それぞれの領域の心筋電流密度を算出することによって、左右の心室における障害心筋部位を3次元的に診断でき、治療方法の検討を行なうことが容易になる。特に、高周波によるカテーテル焼灼法による治療を行なう場合には、カテーテルを用いて行なう電気生理学的検査の対象領域を事前に著しく絞り込むことが可能となり、X線透視を実施しながら行なう検査時間を著しく短縮することができる。この結果、医師および放射線技師の年間X線被爆線量を著しく軽減することができる。
【0094】
さらに、電流密度と心筋障害電流との関係を判断するための情報を含むデータベースを準備することにより、算出された電流密度分布から、当該部位の心筋の電気生理学的組織性状の診断(生存心筋の評価、心臓移植後の拒絶反応の有無およびその程度、心筋症など)を正確に行なうことができる。
【0095】
[実施の形態2]
上述の実施の形態1では、解剖学的画像を形成するために、被験者の多数の断層像を得る必要があり、MRI法、X線CT法等による検査を事前に行なっていた。このため、検査回数が多くなり、患者の負担となるとともに、検査と直結した治療を行なうことができなかった。
【0096】
この発明の実施の形態2は、解剖学的画像の形成を不要とすることにより、検査回数を減らし、診断と検査とを直結して実施することができる磁界計測による生存心筋診断装置および生存心筋分析方法を提供するものである。
【0097】
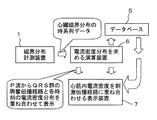
図13は、この発明の実施の形態2による、磁界計測による生存心筋診断装置の構成を概略的に示す機能ブロック図である。
【0098】
図13を参照して、磁界分布計測装置1については、実施の形態1に関連して既に説明したので、ここでは繰返して説明しない。
【0099】
磁界分布計測装置1によって生成された磁界分布時系列データは、演算装置6に与えられ、演算装置6は、与えられた磁界分布時系列データに基づいて、先に述べたSAM法あるいはMUSIC法等の計算手法を用いて心筋内の3次元的電流密度分布を示すデータを生成する。そして、演算装置6は、生成した3次元的電流密度分布データに基づいて、心電図のP波からQRS群に相当する期間の心筋内の興奮(刺激)伝播経路を示すデータと、電流密度分布を示すデータとを、重ね合わせて発生し、表示装置7に与える。
【0100】
表示装置7は、演算装置6によって生成されたデータが示す心筋内の電流密度分布を示す画像を、同じく演算装置6によって求められた心電図のP波からQRS群の期間に相当する興奮伝播経路の3次元的画像に重ね合わせて表示する。この結果、実施の形態1のような解剖学的画像を用いなくても、心室の心筋内の異常電流密度分布を3次元的に同定することが可能となる。
【0101】
なお、実施の形態1と同様に、心筋内の電流密度分布と、心筋障害電流との関係に関する判断情報を含むデータベース5が設けられる。
【0102】
次に、図14は、図13に示したこの発明の実施の形態2による磁界計測による生存心筋診断装置の構成をより具体化して示したブロック図である。
【0103】
図14を参照して、磁界分布計測装置1は、図2および図3に関連して説明した磁界分布計測装置1と同じなので、ここでは説明を省略する。
【0104】
磁界分布計測装置1から出力された磁界分布時系列データは、図14の演算装置6に与えられ、この演算装置6は、図6に関連して説明したSAM法あるいはMUSIC法などにより、磁界分布時系列データを電流密度分布時系列データに変換する。
【0105】
ここで、被験者12の心電図を記録する心電計21が設けられており、これにより測定された被験者12の心電図波形データは演算装置6に与えられる。
【0106】
ここで、心電図の波形と、生成された電流密度分布とを対応づければ、心電図と、心臓において発生している事象との対応づけも可能となる。
【0107】
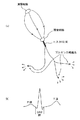
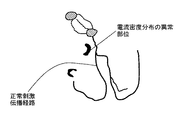
ここで、図15の(a)は、心臓における正常な刺激伝播経路を模式的に示す図であり、(b)は1拍分の心電図波形を示している。
【0108】
図15を参照して、心臓の洞房結節は心拍を決定するペースメーカとしての機能を有し、一定間隔(心電図のP波のタイミング)で発火してパルスを発生する。このパルスは、決められた刺激伝播経路を介して房室結節に伝わり、ここで一定時間遅延後、ヒス(HIS)束からプルキンエ繊維系を介して下方の心室にパルスを伝達し、一気に心筋の収縮が生じる。このヒス束からプルキンエ繊維系の刺激の伝播は、心電図のQRS群の期間である等容収縮期に相当する。
【0109】
したがって、このP波からQRS群の期間に関連付けた心臓磁界、すなわち心筋内電流密度分布の解析により、演算装置6は、図15(a)に示すような正常ルートとしての刺激伝播経路を示す画像データを生成する。
【0110】
このような図15(a)に示す刺激伝播経路の画像は、実施の形態1の解剖学的画像の代わりにテンプレート表示として使用することができる。すなわち、実施の形態1のような3次元の解剖学的画像がなくても、この図15(a)に示す正常ルートの刺激伝播経路が表示されれば、その周辺の心室に生じた、異常な電流密度分布を示す障害心筋部位、または生存心筋部位は、医師であれば容易に解剖学的な対応づけが可能であり、その位置、大きさ、形状、程度を同定することができる。
【0111】
図14の演算装置6は、このようなテンプレートとしての刺激伝播経路の表示に重ね合わせて、生成された電流密度分布を示すデータを生成する。前述のように、電流密度分布を表わす画像に着目することによって、心室における障害心筋部位または生存心筋部位を見出すことが可能であり、そのような画像データが上述のテンプレートの画像データに合成されて、表示装置7に与えられる。
【0112】
図14に示す表示装置7は、演算装置6からのデータに基づいて、テンプレートとしての正常な刺激伝播経路に重ね合わせて、電流密度分布を示す画像を表示する。これにより、医師は、障害心筋部位または生存心筋部位の解剖学的な対応付けが可能となる。
【0113】
図16は、表示装置7によって実際に表示される画面の一例であり、テンプレートとしての正常刺激伝播経路に重ね合わせて、異常な電流密度分布を示す部位の画像が表示されている。
【0114】
医師であれば、図16に示すテンプレートとしての正常刺激伝播経路に対する電流密度分布の相対的位置関係に基づいて、容易に解剖学的な対応付けが可能であり、左右の心室における障害心筋部位または生存心筋部位の位置、大きさ、形状、程度を同定することができる。
【0115】
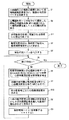
図17および図18は、以上の実施の形態2による電気生理学的生存心筋診断装置によって実行された心筋内の電気生理学的生存心筋分析方法を示すフロー図である。
【0116】
まず、図17を参照して、ステップS21において、磁界分布計測装置1を用いて人体胸部上の複数の座標において非接触磁気計測を行ない、複数の磁界時系列データを生成し記録する。
【0117】
次に、ステップS22において、解析の初期時刻を、心電図のP波開始時刻tsPと定め、解析終了時刻を心電図のQRS群終了時刻teQRSと定め、解析の時間間隔をΔtと定める。
【0118】
次に、ステップS23において、解析時刻tに、P波の開始時刻であるtsPを代入する。
【0119】
そして、ステップS24において解析時間が終了時刻teQRSに到達するまで、以下のステップS25〜S27の処理が繰返される。
【0120】
すなわち、ステップS25において、演算装置6により指定解析時刻tにおける心磁界分布データをSAM法またはMUSIC法で処理して心筋内電流密度分布データを生成する。
【0121】
次に、ステップS26において、心筋内電流密度分布データに所定地点から3次元透視変換を施した画像を表示する。
【0122】
次に、ステップS27において、解析時刻tにΔtを加算し、ステップS24に戻って終了時刻teQRSに達したか否かを判定する。ここで終了時刻teQRSに達したことが判定されると、心電図の波形のうちP波からQRS群に相当する期間に対応付けて図15(a)に示す正常ルートである刺激伝播経路を示す画像データが得られたことになる。
【0123】
次に、図18のステップS28に進み、解析の初期時刻をtsと定め、解析の終了時刻をteと定め、解析時間間隔をΔtと定める。
【0124】
次に、ステップS29において、解析時刻tに初期時刻tsを代入する。
次に、ステップS30において、解析時刻tが終了時刻teに到達したことが判断されるまで、以下のステップS31〜S34が実行される。
【0125】
すなわち、ステップS31において、演算装置6により、指定解析時刻tにおける心磁界分布データをSAM法またはMUSIC法で処理して心筋内電流密度分布データを生成する。
【0126】
次に、ステップS32において、心筋の組織の実体積と、算出された電流密度分布とから、実際の心筋電流密度を得る。すなわち、ステップS31で算出された電流密度分布データをより実際の心筋電流密度に近い値に補正する。
【0127】
次に、ステップS33において、心筋内電流密度データを、所定視点から3次元透視変換を施した正常刺激伝播経路の画像に重ね合わせて表示する。
【0128】
さらに、ステップS34において、解析時刻tにΔtを加算し、ステップS30に戻って終了時刻teに達したか否かを判定する。これにより、心筋内の電流密度分布を示すデータが、図17のフロー図で得られた正常刺激伝播経路(図15(a))の画像に重ね合わせて表示されることになる。
【0129】
なお、前述の実施の形態1と同様に、図13のデータベース5から、障害心筋部位における障害に関する情報を得ることができる。
【0130】
図19は、このような実施の形態2の変形例による処理を示すフロー図であり、以下の点を除いて、図18に示したフロー図と同じである。
【0131】
すなわち、ステップS35において、ステップS32で得られた補正後の心筋電流密度に基づいて、データベース5に含まれる心筋障害電流に関する情報から、当該部位における心筋の障害の有無と障害の程度に関する情報を引出し、表示装置7に同時に表示させる。
【0132】
次に、前述の実施の形態1と同様に、この実施の形態2においても、左右の心室の心筋を、心臓の解剖学的要因または機能的要因に基づいて任意の複数の領域に分割し、各領域ごとの電流密度分布を算出するように構成することもできる。領域分割の態様などについては実施の形態1において既に説明したのでここでは繰返さない。
【0133】
図20は、このような実施の形態2の変形例による処理を示すフロー図であり、以下の点を除いて、図18に示したフロー図と同じである。
【0134】
すなわち、ステップS36において、演算装置6によって求められたヒス束からプルキンエ繊維系直前までの刺激伝播経路に関する情報から心室中隔の位置が判明するので、予め定められた角度に基づいて、房室結節を基準として心室を複数の領域に分割する処理を行なう。そしてステップS37において、上述のように領域分割された組織の各領域ごとの実体積と電流密度分布とから、各領域ごとに算出された心筋電流密度を得ることができる。
【0135】
以上のように、この発明の実施の形態2によれば、SQUID磁束計を用いた被験者の胸部上の非侵襲的な磁気計測によって得られた心筋内の電流密度分布を示す画像を、テンプレートとしての正常刺激伝播経路に重ねて表示することにより、他の解剖学的画像と重ね合わせることなく、異常な電流密度分布を示す心筋障害部位、または生存心筋部位の位置、大きさ、形状、程度を医師が安全、迅速かつ高精度に3次元的に同定することが可能となる。このように心筋の電気生理学機能を非侵襲で迅速かつ安全に検査することができるので、患者の負担を著しく軽減することができる。また解剖学的画像を得るための事前の検査を省略することができる。
【0136】
さらに、検査に放射性同位元素を用いないので、費用の軽減が可能で、検査を日をおかずに連続的に実施することができる。
【0137】
さらに、解剖学的要因または機能的要因に基づいて、左心室および右心室を領域分割して各領域ごとの心筋電流密度を算出することにより、左右心室の心筋障害部位を3次元的に診断することが可能となり、治療法の検討が行ないやすくなる。特に、カテーテル焼灼法による治療を行なう場合には、カテーテルを用いて行なう電気生理学検査の対象領域を事前に著しく絞り込むことができるので、X線透視を実施しながら行なう検査時間を著しく短縮することができる。この結果、医師および放射線技師の年間X線被爆線量を著しく低減することができる。
【0138】
さらに、電流密度と心筋障害電流との関係を判断するためのデータベースを準備することにより、心筋の電気生理学的機能の診断(生存心筋、心臓移植後の拒絶反応の有無および程度、心筋症などの評価など)を正確に行なうことができる。
【0139】
今回開示された実施の形態はすべての点で例示であって制限的なものではないと考えられるべきである。本発明の範囲は上記した説明ではなくて特許請求の範囲によって示され、特許請求の範囲と均等の意味および範囲内でのすべての変更が含まれることが意図される。
【0140】
【発明の効果】
以上のように、この発明によれば、患者の胸部上における非侵襲磁気計測によって得られた心筋内電流密度分布を、3次元的な解剖学的画像上で可視表示することができるので、異常な電流密度分布を示す心筋障害部位、または生存心筋部位の位置、大きさ、形状、程度を3次元的に同定することができる。したがって、障害心筋部位または生存心筋部位を非侵襲で診断できるので、患者に負担を強いることなく、迅速かつ安全な検査を行なうことができる。また、放射性同位元素を用いないので、連続的に検査を実施でき、費用軽減効果を奏する。
【0141】
さらに、解剖学的要因または機能的要因に基づいて左右の心室を領域分割して各領域の心筋電流密度を算出することにより、心筋障害部位または生存心筋部位を3次元的に診断できる。特に高周波によるカテーテル焼灼法による治療を行なう場合には、電気生理学的検査の対象領域を事前に著しく絞り込むことができ、医師および放射線技師のX線被爆量を著しく低減することができるという効果を奏する。
【0142】
さらに、電流密度と心筋障害電流との関係を判断するための情報を含むデータベースを準備することによって、心筋の電気生理学的組織性状の診断を正確に行なうことができるという特有の効果を奏する。
【0143】
この発明のさらに他の局面によると、同一被験者の洞房結節からヒス束−プルキンエ繊維系への正常刺激伝播回路に、電流密度分布を重ね合わせて3次元表示することにより、解剖学的画像を得ることなく、心室における障害心筋部位または生存心筋部位の位置、大きさ、形状、程度を3次元的に同定することができる。すなわち、解剖学的画像を得るための検査を省略でき、より費用効果に優れた診断を行なうことができるという効果を奏する。
【図面の簡単な説明】
【図1】 この発明の実施の形態1による磁界計測による生存心筋診断装置の構成を概略的に示す機能ブロック図である。
【図2】 図1に示した磁界計測による生存心筋診断装置の構成をより具体化して示したブロック図である。
【図3】 図2に示した磁界分布計測装置の詳細な構成を示すブロック図である。
【図4】 被験者の胸部前面上における複数磁界センサの配列例を示す図である。
【図5】 図4の複数のセンサのそれぞれから得られた磁界時系列データを示す図である。
【図6】 磁界時系列データから電流密度データを算出する方法を模式的に説明する図である。
【図7】 表示装置4に表示される3次元的解剖学的画像の例を示す図である。
【図8】 図7に示した3次元的解剖学的画像の一断面を示す断層図である。
【図9】 この発明の実施の形態1による磁界計測による生存心筋診断装置の動作を説明するフロー図である。
【図10】 この発明の実施の形態1の変形例による磁界計測による生存心筋診断装置の動作を説明するフロー図である。
【図11】 心室の領域分割の一態様を模式的に示す図である。
【図12】 この発明の実施の形態1のさらなる変形例による磁界計測による生存心筋診断装置の動作を説明するフロー図である。
【図13】 この発明の実施の形態2による磁界計測による生存心筋診断装置の構成を概略的に示す機能ブロック図である。
【図14】 図13に示したこの発明の実施の形態2による磁界計測による生存心筋診断装置の構成をより具体化して示したブロック図である。
【図15】 心臓における正常刺激伝播経路および心電図波形を模式的に示す図である。
【図16】 表示装置7によって実際に表示された正常刺激伝播経路および異常な電流密度分布の画像を示す図である。
【図17】 実施の形態2による磁界計測による生存心筋診断装置の動作の前半を説明するフロー図である。
【図18】 実施の形態2による磁界計測による生存心筋診断装置の動作の後半を説明するフロー図である。
【図19】 実施の形態2の変形例による磁界計測による生存心筋診断装置の動作の後半を説明するフロー図である。
【図20】 実施の形態2のさらなる変形例による磁界計測による生存心筋診断装置の動作の後半を説明するフロー図である。
【符号の説明】
1 磁界分布計測装置、2 第1の演算装置、3 第2の演算装置、4,7 表示装置、5 データベース、6 演算装置、11 MSR、12 被験者、13 デュワー、14 演算部、15 SQUID磁束計、16 検出コイル、17 コイル、18 超電導ループ、19 モジュレーションコイル、20 Nbシールド、21 心電計。[0001]
BACKGROUND OF THE INVENTION
The present invention relates to a viable myocardial diagnostic apparatus and a surviving myocardial analysis method by magnetic field measurement, and more specifically, a faulty site or a surviving site in the myocardium that causes formation of an oscillation loop (rotation circuit) of abnormal current in the left and right ventricles. The present invention relates to a viable myocardial diagnostic apparatus and a surviving myocardial analysis method by magnetic field measurement for non-invasively identifying non-contact magnetic measurements.
[0002]
[Prior art]
Conventionally, an electrocardiogram is generally employed to diagnose a heart disease.
[0003]
However, the conventional electrocardiogram is insufficient to estimate the position, size, and shape of a myocardial injury site or a surviving myocardial site, for example, before cardiac surgery.
[0004]
This is because the electrocardiogram is an indirect measurement method. In other words, the electrocardiogram method is different because the tissues existing from the heart to the body surface, the positional relationship between the heart and other organs and bones, the size of the heart, the electrical conductivity of each tissue of the human body, etc. vary greatly from subject to subject. It was extremely difficult to accurately identify the position of the affected area from the information obtained in (1).
[0005]
On the other hand, when a myocardial injury site due to ischemia and a physiologically surviving myocardium (hereinafter referred to as a surviving myocardium) are mixed in the ventricle, an electrical abnormal rotation circuit is formed in the myocardium. May cause tachycardia. Accordingly, there is a strong demand to accurately identify such a myocardial injury site or a surviving myocardial site three-dimensionally.
[0006]
However, as described above, the electrocardiogram can recognize whether the myocardial injury site due to ischemia exists or not, but can recognize the position, size, and shape of the myocardial injury site in the heart. I couldn't.
[0007]
In addition, medical tomography apparatuses such as the nuclear magnetic resonance (MRI) method and the X-ray CT method, which are rapidly spreading in recent years, can examine the anatomical structure of the cardiovascular system with high accuracy. It cannot be used for recognizing the position, size, and shape of the region and the surviving myocardial region.
[0008]
Therefore, as an evaluation method of a living myocardium currently used in the medical field, there is an inspection method using a radioisotope such as a myocardial SPECT method or a PET method. In addition, evaluation of myocardial tissue properties requires an invasive examination method that directly collects tissue such as sampling of myocardial tissue (myocardial biopsy) using a catheter or surgical operation.
[0009]
Among these methods, examination methods such as the above-mentioned myocardial SPECT method or PET method using radioisotopes are methods for accurately evaluating the survival state of the myocardium before and after post-myocardial infarction or coronary artery bypass surgery. It's being used. However, since these inspection methods use radioisotopes, they are required to be used in controlled areas and are expensive.
[0010]
In addition, after heart transplantation, it is necessary to evaluate the rejection myocardium to determine whether treatment is necessary depending on the degree of rejection, and whether or not rejection has occurred over time at relatively short intervals. Inspection is necessary. Changes in myocardial rejection can be captured even by examination methods using electrocardiography or echocardiography, but the accuracy necessary for diagnosis, that is, the accuracy necessary to estimate the degree of rejection Not in. For this reason, after cardiac transplantation, a method of periodically performing myocardial biopsy using a catheter is employed, which imposes a heavy burden on the patient. Therefore, realization of an apparatus capable of three-dimensionally diagnosing the position, size, and extent of rejected myocardium after heart transplantation by a noninvasive measurement means is strongly desired.
[0011]
On the other hand, SQUID magnetometers using superconducting quantum interference devices (hereinafter abbreviated as SQUIDs) that can detect magnetic fluxes of about one billionth of geomagnetism with high sensitivity are applied in various fields. Has been. In particular, in the field of biological measurement where non-invasive measurement is strongly desired as described above, non-contact magnetic measurement of a human body using a SQUID magnetometer has been attempted.
[0012]
In particular, due to the development of DC-SQUID due to recent advances in thin film element manufacturing technology, attempts are being made to measure the magnetocardiogram, which is the magnetic field distribution of the heart, using a SQUID magnetometer.
[0013]
[Problems to be solved by the invention]
However, the magnetocardiogram alone cannot directly display the location, size, shape, and extent of the myocardial injury site or the surviving myocardial site in the human body, and the doctor can accurately determine the relative positional relationship of the affected area in the heart. It was difficult to inform.
[0014]
For this reason, a method has been proposed for visualizing the current activity in the myocardium from the magnetocardiogram distribution indicated by the magnetocardiogram. As such a method, a method of visualizing a magnetic field source by imitating one or a plurality of current dipoles has been adopted. However, since the entire myocardium is in an electrically active state with a certain spread, the current density information indicating the electrophysiological activity of the myocardium cannot be obtained by the method of replacing the entire myocardium with one current vector. Therefore, the size and shape of the myocardial injury site or the surviving myocardial site could not be identified.
[0015]
Therefore, an object of the present invention is to provide a safe, quick and highly accurate three-dimensional view of a myocardial injury site or a surviving myocardial site based on data indicating the current density distribution in the myocardium obtained by noninvasive magnetic measurement. It is intended to provide a viable myocardial diagnostic apparatus and a viable myocardial analysis method by magnetic field measurement that can be identified.
[0016]
[Means for Solving the Problems]
The viable myocardial diagnostic apparatus by magnetic field measurement according to the present invention includes magnetic field distribution measurement means, first calculation means, second calculation means, and display means. The magnetic field distribution measuring means acquires a plurality of magnetic field time-series data corresponding to a plurality of coordinates by non-contact magnetic measurement at a plurality of coordinates on the chest of the subject, and a magnetic field on the chest based on the plurality of magnetic field time-series data Generate distributed time series data. The first computing means generates time series data of current density distribution in the subject's myocardium based on the generated magnetic field distribution time series data. The second computing means processes the tomographic image data of the subject supplied separately to generate data indicating an anatomical image. The display means displays the current density distribution image in the myocardium indicated by the data generated by the first calculation means so as to be superimposed on the anatomical image indicated by the data generated by the second calculation means. To do. As a result, a myocardial injury site or a surviving myocardial site exhibiting an abnormal current density distribution can be identified three-dimensionally.
[0017]
Preferably, the first calculation means divides the left ventricle and the right ventricle into a plurality of arbitrary regions based on an anatomical factor or a functional factor, and a time series of current density distribution in the myocardium for each region. Data can be generated to identify the myocardial injury site in the left and right ventricles three-dimensionally.
[0018]
More preferably, the surviving myocardial diagnostic apparatus using magnetic field measurement further includes a database including information for determining the relationship between the current density in the myocardium indicated by the data generated by the first calculation means and the myocardial injury current. .
[0019]
According to another aspect of the present invention, a living myocardial diagnostic apparatus using magnetic field measurement includes magnetic field distribution measurement means, calculation means, and display means. The magnetic field distribution measuring means acquires a plurality of magnetic field time-series data corresponding to a plurality of coordinates by non-contact magnetic measurement at a plurality of coordinates on the chest of the subject, and a magnetic field on the chest based on the plurality of magnetic field time-series data Generate distributed time series data. The computing means generates time series data of current density distribution in the subject's myocardium based on the generated magnetic field distribution time series data. The display means superimposes an image showing the stimulus propagation path from the sinoatrial node of the subject's heart to the His bundle-Purkinje fiber system and an image showing the current density distribution in the myocardium based on the data generated by the computing means. Display processing is also performed to display together. As a result, a myocardial injury site or a surviving myocardial site exhibiting an abnormal current density distribution can be identified three-dimensionally.
[0020]
Preferably, the arithmetic means divides the left ventricle and the right ventricle into arbitrary regions based on anatomical factors or functional factors, and generates time series data of current density distribution in the myocardium for each region. Thus, the myocardial injury site in the left ventricle and the right ventricle can be identified three-dimensionally.
[0021]
More preferably, the surviving myocardial diagnostic apparatus using magnetic field measurement further includes a database including information for determining the relationship between the current density in the myocardium indicated by the data generated by the calculation means and the myocardial injury current.
[0022]
According to another aspect of the present invention, a survival myocardial analysis method using magnetic field measurement is based on a plurality of magnetic field time-series data corresponding to a plurality of coordinates acquired by non-contact magnetic measurement at a plurality of coordinates on a subject's chest. Based on the generated magnetic field distribution time series data on the chest, a step of generating first data which is time series data of current density distribution in the myocardium of the subject, and separately supplied subject's chest tomographic image data Processing to generate second data indicating an anatomical image, and displaying an image of current density distribution in the myocardium indicated by the first data superimposed on the anatomical image indicated by the second data Thereby making it possible to three-dimensionally identify a myocardial injury site or a surviving myocardial site exhibiting an abnormal current density distribution.
[0023]
Preferably, the step of generating the first data includes dividing the left ventricle and the right ventricle into a plurality of arbitrary regions based on anatomical factors or functional factors, and current density distribution in the myocardium for each region Thus, the myocardial injury site in the left ventricle and the right ventricle can be identified three-dimensionally.
[0024]
More preferably, in the survival myocardial analysis method using magnetic field measurement, the region identified three-dimensionally based on the information indicating the relationship between the current density in the myocardium indicated by the first data and the myocardial injury current is myocardial injury. The method further includes the step of determining whether the region is a living myocardial region.
[0025]
According to still another aspect of the present invention, the survival myocardial analysis method by magnetic field measurement is based on a plurality of magnetic field time-series data corresponding to a plurality of coordinates acquired by non-contact magnetic measurement at a plurality of coordinates on the subject's chest. Generating time-series data of current density distribution in the subject's myocardium based on the magnetic field distribution time-series data generated on the chest and generating hysteresis from the sinoatrial node of the subject's heart based on the generated data. By displaying the image showing the stimulus propagation path to the bundle-Purkinje fiber system and the image showing the current density distribution in the myocardium, the myocardial injury site or the surviving myocardial site showing an abnormal current density distribution is displayed. Enabling three-dimensional identification.
[0026]
Preferably, the data generation step divides the left ventricle and the right ventricle into an arbitrary plurality of regions based on anatomical factors or functional factors, and a time series of current density distribution in the myocardium for each region. Data can be generated to identify the myocardial injury site in the left and right ventricles three-dimensionally.
[0027]
More preferably, the survival myocardial analysis method using magnetic field measurement is based on information indicating the relationship between the current density in the myocardium indicated by the data and the myocardial injury current. The method further includes the step of determining whether the site is a myocardial region.
[0028]
Therefore, according to the present invention, an image showing a current density distribution in the myocardium obtained by noninvasive magnetic measurement can be obtained by processing chest tomographic image data of the same subject taken by another medical diagnostic apparatus. By superimposing and displaying on an anatomical image, a myocardial injury site or a surviving myocardial site showing an abnormal current density distribution can be identified three-dimensionally, safely, quickly and with high accuracy. It becomes.
[0029]
Further, according to the present invention, an image showing a current density distribution in the myocardium obtained by noninvasive magnetic measurement is an image showing a stimulus propagation path from the sinoatrial node of the heart of the same subject to the His bundle-Purkinje fiber system. By superimposing and displaying it on the top, it is possible for a doctor to three-dimensionally identify a myocardial injury site or a surviving myocardial site showing an abnormal current density distribution in a safe, rapid and highly accurate manner.
[0030]
DETAILED DESCRIPTION OF THE INVENTION
Hereinafter, embodiments of the present invention will be described in detail with reference to the drawings. In the drawings, the same or corresponding parts are denoted by the same reference numerals and description thereof will not be repeated.
[0031]
[Embodiment 1]
FIG. 1 is a functional block diagram schematically showing the configuration of a living myocardial diagnostic apparatus using magnetic field measurement according to
[0032]
Referring to FIG. 1, magnetic field
[0033]
Based on the magnetic field distribution time-series data of the heart measured by the magnetic field
[0034]
On the other hand, the tomographic image data of the chest of the same subject obtained separately by a tomographic diagnosis apparatus such as a nuclear magnetic resonance (MRI) method, an X-ray CT method, an echocardiographic method, or a myocardial SPECT method (including data of a plurality of tomographic images) ) Is provided to the second
[0035]
Here, the first data is expressed as an image. By paying attention to the density of the image representing the current density distribution, it is possible to identify the myocardial injury site or the surviving myocardial site exhibiting an abnormal current density in a three-dimensional manner.
[0036]
The
[0037]
Note that the current density distribution in the myocardium itself is only displayed on the
[0038]
Next, FIG. 2 is a block diagram showing a more specific configuration of the living myocardial diagnostic apparatus by magnetic field measurement according to
[0039]
Referring to FIG. 2, a magnetic field
[0040]
The
[0041]
FIG. 3 is a block diagram showing in more detail the
[0042]
The configuration shown in FIG. 3 is a configuration for one channel for measuring one point of magnetic field data on the subject's chest. As will be described later, in the present invention, a plurality of coordinates are provided on the subject's chest. Multipoint measurement of magnetic field at Therefore, the configuration for one channel shown in FIG. 3 is provided in the
[0043]
Hereinafter, generation of magnetic field data by the SQUID magnetometer for one channel will be described with reference to FIG.
[0044]
First, the
[0045]
As a result, a magnetic field that changes linearly with respect to this magnetic field is formed in the
[0046]
That is, the detection of the magnetic field of the living body by this SQUID does not directly measure the generated magnetic field, but feedback is performed using the so-called zero position method so that the magnetic field in the
[0047]
Since such a
[0048]
As described above, the configuration shown in FIG. 3 is a configuration necessary for measuring the magnetic field data for one channel, and is an electric signal indicating the magnetic field time-series data of the magnetic field measured at one point on the front of the subject's chest. Is output.
[0049]
In the present invention, as described above, many sensors (SQUID magnetometers) are arranged on the front side of the subject's chest, and the magnetic field on the front side of the chest is to be measured at multiple points. The magnetic field changes with time. For example, even during a period corresponding to one heartbeat, the magnetic field changes differently depending on the location if the measurement location is different.
[0050]
FIG. 4 is a diagram showing an example of an arrangement of a plurality of sensors (each of which is a one-channel SQUID magnetometer) on the front of the subject's chest. FIG. 5 shows a group of magnetic field time-series data indicating changes in the magnetic field in one heartbeat period, obtained from each sensor corresponding to each position of the plurality of sensors in FIG.
[0051]
The data output from the magnetic field
[0052]
Such a group of magnetic field time-series data output from the magnetic field
[0053]
A method for obtaining the current density distribution flowing through the part of the human body to be measured (in this invention, the heart) from the magnetic field distribution time series data generated by the magnetic field
[0054]
FIG. 6 is a diagram schematically illustrating a method for obtaining such a current density. In the method described below, if a current sensor (virtual sensor) is provided in one specific part of the human body to be analyzed, the current as it should flow there is indirectly calculated. Is. For this reason, the current output of the virtual sensor can be obtained by multiplying the magnetic field time-series data obtained from all the sensors (SQUID magnetometers) installed on the front surface of the human chest and summing the coefficients. Then, how to obtain this coefficient is a central issue in this calculation.
[0055]
Hereinafter, the method for obtaining the current density will be described in more detail with reference to FIG. First, it is assumed that a total of N magnetic field sensors are arranged on the human body surface (front surface of the chest). On the other hand, a human body (chest, particularly heart) to be analyzed is regarded as a collection of voxels each of which is a small block. Here, the total number of voxels is M.
[0056]
The magnetic field time series data obtained from each sensor j is Bj (t), and each sensor output (B j The spatial filter coefficient of voxel i corresponding to (t) is denoted by β ij And
[0057]
Here, when it is considered that there is a virtual current sensor in the voxel i, the virtual sensor output corresponding to the current density obtained from the virtual current sensor is S i If (t), then S i (T) is defined by the following equation.
[0058]
[Expression 1]
Therefore, the spatial filter coefficient β ij Is determined, the current density in each voxel i can be obtained, and a three-dimensional current density distribution in the entire analysis target can be obtained.
[0060]
Spatial filter coefficient β ij Can be set to have a sensitive sensitivity only to the distribution current of the corresponding voxel i, various methods such as SAM (Synthetic Aperture Magnetometry) and MUSIC (Multiple Signal Classification) can be used. SAM and MUSIC have been researched and developed in fields such as radar and sonar, and each method is well known, but has not yet been applied to diagnosis of cardiac magnetic fields.
[0061]
The virtual sensor output calculated in real time for each voxel obtained using the spatial filter coefficient by the SAM or MUSIC technique has an advantage of having a very high real-time property.
[0062]
The SAM and MUSIC technologies are well known, and the algorithm for obtaining the spatial filter coefficients using these methods is extremely complicated. Therefore, detailed description thereof is omitted here, but the SAM is Proceedings published in 1999. Explain in detail in “Functional Neuroimaging by Synthetic Aperture Magnetometry (SAM)” by Robinson SE and Vrba J from page 302 to page 305 of “Reent Advances in Biomagnetism” (published by Tohoku University Press) of the 11th International Conference on Biomagnetism Has been. MUSIC is described in detail on pages 117 to 119 of “Neuromagnetic Science: SQUID Measurement and Medical Application” (Ohm Co., Ltd.) by Hiroshi Hara and Shinya Kuriki, published on January 25, 1997. .
[0063]
In this way, the first
[0064]
On the other hand, an electrocardiogram synchronization trigger is previously applied to the second
[0065]
The second
[0066]
In this way, the
[0067]
The
[0068]
(A), (b) of FIG. 7 is a figure which shows the aspect of the real-time display of the three-dimensional current density distribution superimposed on the three-dimensional anatomical image displayed by the
[0069]
Each of (a) and (b) of FIG. 7 is a three-dimensional image obtained by interpolating, for example, about five tomographic images obtained by slicing the chest of a subject at a pitch of 5 mm, and the depth of an actual display image It is difficult to express the feeling on the drawing. In each of FIGS. 7A and 7B, since the diagrams constituting each image are represented by a plurality of overlapping diagrams, there is a sense of depth formed by combining a plurality of slice images. It can be estimated that the image is a three-dimensional anatomical image.
[0070]
In each of FIGS. 7A and 7B, the upper side of the tomographic image is the front surface of the human body, and the lower side is the back surface. Each of the tomograms (a) and (b) is a tomogram viewed from the lower side (foot side).
[0071]
In each of (a) and (b) of FIG. 7, a set of circles indicated by A displays a three-dimensional current density distribution superimposed on a three-dimensional anatomical image. Represents the magnitude of the current density. In addition, the magnitude of the current density can be displayed by shading of a specific color on the screen.
[0072]
8 extracts and displays a tomographic image at a certain depth of a three-dimensional anatomical image having a depth as shown in FIGS. 7 (a) and 7 (b). The set of circles shown represents the current density distribution on the tomographic image.
[0073]
In this manner, by displaying the three-dimensional current density distribution in the myocardium on the three-dimensional anatomical image having a depth, the doctor can relatively compare the current density distribution in the myocardium on the anatomical image. Accurate positional relationship can be grasped accurately. In particular, when the displayed current density distribution shows an abnormality, the position, size, and shape of the myocardial injury site or the surviving myocardial site can be accurately diagnosed.
[0074]
FIG. 9 is a flowchart showing a method for identifying a current density distribution in the myocardium, which is executed by the cardiac magnetic field diagnostic apparatus according to the first embodiment.
[0075]
Referring to FIG. 9, first, in step S1, the magnetic field
[0076]
Next, in step S2, interpolation calculation (three-dimensional perspective transformation from a predetermined viewpoint) is performed by the
[0077]
Next, in step S3, the initial analysis time is set to t. s , The end time of analysis is t e The time interval for analysis is defined as Δt.
[0078]
Next, in step S4, the initial time t is added to the analysis time t. s Substitute and start the analysis. In step S5, the analysis time t is the end time t. e The following processing is performed until reaching.
[0079]
That is, in step S6, the first
[0080]
Next, in step S7, an actual myocardial current density is obtained from the actual volume of the myocardial tissue and the calculated current density distribution. That is, the intramyocardial current density distribution data calculated in step S6 is corrected to a value closer to the actual myocardial current density.
[0081]
Next, in step S8, the
[0082]
Next, Δt is added to the analysis time t in step S9.
The processing of these steps S6 to S9 is the analysis time t is the end time t e Is repeated until it is determined in step S5 that the end time t e Is reached, the display of the intramyocardial current density distribution superimposed on the anatomical image is terminated.
[0083]
Note that, as described above with reference to FIG. 1, based on the current density distribution in the myocardium calculated by the first
[0084]
FIG. 10 is a flowchart showing processing according to such a modification of the first embodiment, and is the same as the flowchart shown in FIG. 9 except for the following points.
[0085]
That is, in step S10, information on the presence or absence of the myocardial failure and the degree of failure in the relevant part is extracted from the information on the myocardial injury current included in the
[0086]
Next, a further modification of the first embodiment will be described with reference to FIG. 11 and FIG. In the first embodiment described above, the current density distribution is three-dimensionally displayed on the anatomical image of the heart. However, in this modified example, the left and right ventricular myocardium is further represented by the anatomical factors of the heart. Alternatively, the current density distribution is divided into a plurality of arbitrary regions based on functional factors, and the current density distribution for each region is calculated.
[0087]
That is, if the average of intramyocardial current density is obtained for each divided region and compared with each other, it is possible to determine whether the current flow is good or bad for each region. Will be a good judgment.
[0088]
As a method of dividing the region, a method of dividing the left and right ventricles into an arbitrary plurality of regions by paying attention to the anatomical characteristics of the heart, an arbitrary plural of the left ventricle by paying attention to the anatomical features of the coronary artery There are methods such as dividing into regions. In addition, for example, a method of creating a profile curve by obtaining a density distribution every 6 degrees radially from the ventricular septum, and further creating a functional diagram of voltage and conduction time can be considered.
[0089]
FIG. 11 is a diagram schematically illustrating a state of region division focusing on the position of the coronary artery, which is an anatomical feature, as one mode of region division. In the example of FIG. 11, the myocardial region is divided into a dominant region of the anterior descending branch of the left coronary artery, a dominant region of the left circumflex branch, and a dominant region of the right coronary artery. Yes. In each of these areas, the myocardial current density is calculated.
[0090]
FIG. 12 is a flowchart showing the processing according to the further modification of the first embodiment, and is the same as the flowchart shown in FIG. 9 except for the following points.
[0091]
That is, in step S11, in the three-dimensional anatomical image obtained in step S2, the myocardium is divided into regions dominated by each branch of the coronary artery as shown in FIG. In step S12, the myocardial current density for each region divided in step S11 is obtained from the myocardial current density calculated in step S7. Therefore, in addition to the three-dimensional display of the current density distribution according to the first embodiment, it is possible to easily identify a region including the myocardial injury site in the left and right ventricles three-dimensionally.
[0092]
As described above, according to the first embodiment of the present invention, an image showing the current density distribution in the myocardium obtained by noninvasive magnetic measurement on the chest of the subject using the SQUID magnetometer is three-dimensionally displayed. By displaying the anatomical image superimposed on the anatomical image, the doctor can safely, quickly and highly accurately determine the position, size, shape, and degree of failure of the damaged myocardial site showing abnormal current density distribution or the surviving myocardial site. It becomes possible to identify in a dimension and to reduce the burden on the patient. In addition, since no radioisotope is used for the inspection, the inspection can be continuously performed without taking a day.
[0093]
In addition, the right and left ventricles are divided into a plurality of regions based on anatomical factors or functional factors, and the myocardial current density of each region is calculated, so that the damaged myocardial region in the left and right ventricles can be three-dimensionally determined. Diagnosis can be made, and it becomes easy to examine treatment methods. In particular, when performing treatment using high-frequency catheter ablation, it is possible to narrow down the target area for electrophysiological examination using a catheter in advance, and to significantly reduce examination time while performing fluoroscopy. can do. As a result, the annual X-ray exposure dose of doctors and radiologist can be significantly reduced.
[0094]
Furthermore, by preparing a database containing information for determining the relationship between the current density and the myocardial injury current, the diagnosis of the electrophysiological tissue characteristics of the myocardium of the relevant region (the survival myocardium) Evaluation, presence / absence and degree of rejection after heart transplantation, cardiomyopathy, etc.).
[0095]
[Embodiment 2]
In the first embodiment described above, in order to form an anatomical image, it is necessary to obtain a large number of tomographic images of the subject, and examinations using the MRI method, the X-ray CT method, and the like have been performed in advance. For this reason, the number of examinations increases, which is a burden on the patient and treatment that is directly connected to the examination cannot be performed.
[0096]
The second embodiment of the present invention eliminates the need for forming an anatomical image, thereby reducing the number of examinations and directly diagnosing and examining the living myocardium diagnostic apparatus and living myocardium by magnetic field measurement. An analysis method is provided.
[0097]
FIG. 13 is a functional block diagram schematically showing a configuration of a living myocardial diagnostic apparatus by magnetic field measurement according to
[0098]
Referring to FIG. 13, magnetic field
[0099]
The magnetic field distribution time series data generated by the magnetic field
[0100]
The
[0101]
As in the first embodiment, a
[0102]
Next, FIG. 14 is a block diagram showing a more specific configuration of the living myocardial diagnostic apparatus by magnetic field measurement according to the second embodiment of the present invention shown in FIG.
[0103]
Referring to FIG. 14, magnetic field
[0104]
The magnetic field distribution time-series data output from the magnetic field
[0105]
Here, an
[0106]
Here, if the waveform of the electrocardiogram is associated with the generated current density distribution, it is possible to associate the electrocardiogram with an event occurring in the heart.
[0107]
Here, (a) of FIG. 15 is a diagram schematically showing a normal stimulus propagation path in the heart, and (b) shows an electrocardiogram waveform for one beat.
[0108]
Referring to FIG. 15, the sinoatrial node of the heart has a function as a pacemaker that determines a heartbeat, and ignites at a constant interval (timing of P wave of electrocardiogram) to generate a pulse. This pulse is transmitted to the atrioventricular node through a predetermined stimulation propagation path, and after a certain time delay, the pulse is transmitted from the His (HIS) bundle to the lower ventricle through the Purkinje fiber system, Shrinkage occurs. The propagation of the Purkinje fiber-based stimulus from this His bundle corresponds to the isobaric systole, which is the period of the QRS group of the electrocardiogram.
[0109]
Therefore, by analyzing the cardiac magnetic field associated with the period of the QRS group from this P wave, that is, the intramyocardial current density distribution, the
[0110]
Such an image of the stimulus propagation path shown in FIG. 15A can be used as a template display instead of the anatomical image of the first embodiment. That is, even if there is no three-dimensional anatomical image as in the first embodiment, if the normal route of stimulus propagation shown in FIG. 15 (a) is displayed, abnormalities occurring in the surrounding ventricles A faulty myocardial site or a surviving myocardial site exhibiting a stable current density distribution can be easily anatomically matched by a doctor, and its position, size, shape, and degree can be identified.
[0111]
The
[0112]
The
[0113]
FIG. 16 is an example of a screen that is actually displayed by the
[0114]
A doctor can easily perform anatomical association based on the relative positional relationship of the current density distribution with respect to the normal stimulus propagation path as a template shown in FIG. It is possible to identify the position, size, shape, and extent of the surviving myocardial site.
[0115]
FIGS. 17 and 18 are flowcharts showing the electrophysiological survival myocardial analysis method in the myocardium executed by the electrophysiological survival myocardial diagnostic apparatus according to the second embodiment.
[0116]
First, referring to FIG. 17, in step S21, the magnetic field
[0117]
Next, in step S22, the initial analysis time is set as the P wave start time t of the electrocardiogram. sP The analysis end time is defined as the QRS group end time t of the electrocardiogram. eQRS And the analysis time interval is defined as Δt.
[0118]
Next, in step S23, at the analysis time t, the start time of the P wave t sP Is assigned.
[0119]
In step S24, the analysis time is the end time t. eQRS The process of the following steps S25 to S27 is repeated until reaching.
[0120]
That is, in step S25, the cardiac magnetic field distribution data at the designated analysis time t is processed by the
[0121]
Next, in step S26, an image obtained by performing three-dimensional perspective transformation from a predetermined point on the intramyocardial current density distribution data is displayed.
[0122]
Next, in step S27, Δt is added to the analysis time t, and the process returns to step S24 and the end time t eQRS It is determined whether or not it has been reached. End time t eQRS When it is determined that the signal has reached the value, image data indicating the stimulus propagation path, which is the normal route shown in FIG. 15A, is obtained in association with the period corresponding to the QRS group from the P wave in the ECG waveform. It will be.
[0123]
Next, the process proceeds to step S28 in FIG. s And the analysis end time is t e And the analysis time interval is defined as Δt.
[0124]
Next, in step S29, the initial time t is added to the analysis time t. s Is assigned.
Next, in step S30, the analysis time t is the end time t. e The following steps S31 to S34 are executed until it is determined that the value has been reached.
[0125]
That is, in step S31, the cardiac magnetic field distribution data at the designated analysis time t is processed by the
[0126]
Next, in step S32, an actual myocardial current density is obtained from the actual volume of the myocardial tissue and the calculated current density distribution. That is, the current density distribution data calculated in step S31 is corrected to a value closer to the actual myocardial current density.
[0127]
Next, in step S33, the intramyocardial current density data is displayed superimposed on the image of the normal stimulus propagation path that has been subjected to three-dimensional perspective transformation from a predetermined viewpoint.
[0128]
Further, in step S34, Δt is added to the analysis time t, and the process returns to step S30 to return to the end time t. e It is determined whether or not it has been reached. As a result, the data indicating the current density distribution in the myocardium is displayed superimposed on the image of the normal stimulus propagation path (FIG. 15A) obtained in the flowchart of FIG.
[0129]
Note that, as in the first embodiment described above, information relating to a disorder in a disordered myocardial region can be obtained from the
[0130]
FIG. 19 is a flowchart showing the processing according to the modification of the second embodiment, and is the same as the flowchart shown in FIG. 18 except for the following points.
[0131]
That is, in step S35, based on the corrected myocardial current density obtained in step S32, information on the presence / absence of the myocardial failure and the degree of failure in the relevant part is extracted from the information on the myocardial injury current included in the
[0132]
Next, as in the first embodiment, also in this second embodiment, the left and right ventricular myocardium is divided into arbitrary regions based on the anatomical or functional factors of the heart, It can also be configured to calculate a current density distribution for each region. Since the mode of area division and the like has already been described in the first embodiment, it will not be repeated here.
[0133]
FIG. 20 is a flowchart showing the processing according to the modification of the second embodiment, and is the same as the flowchart shown in FIG. 18 except for the following points.
[0134]
That is, in step S36, since the position of the ventricular septum is determined from the information regarding the stimulus propagation path from the His bundle to immediately before the Purkinje fiber system obtained by the
[0135]
As described above, according to the second embodiment of the present invention, an image showing a current density distribution in the myocardium obtained by noninvasive magnetic measurement on the chest of a subject using a SQUID magnetometer is used as a template. The position, size, shape, and extent of myocardial lesions or surviving myocardial sites that show abnormal current density distribution without being superimposed on other anatomical images It is possible for a doctor to identify three-dimensionally safely, quickly and with high accuracy. In this way, the electrophysiological function of the myocardium can be examined quickly and safely in a non-invasive manner, so that the burden on the patient can be remarkably reduced. In addition, a prior examination for obtaining an anatomical image can be omitted.
[0136]
Furthermore, since no radioisotope is used for the inspection, the cost can be reduced, and the inspection can be carried out continuously without taking a day.
[0137]
Further, the left ventricle and the right ventricle are divided into regions based on anatomical factors or functional factors, and the myocardial current density for each region is calculated, thereby diagnosing the myocardial injury site in the left and right ventricles three-dimensionally. This makes it easier to study treatments. In particular, in the case of performing treatment using a catheter ablation method, the target region of electrophysiological examination performed using a catheter can be remarkably narrowed in advance, so that the examination time while performing X-ray fluoroscopy can be significantly shortened. it can. As a result, the annual X-ray exposure dose of doctors and radiographers can be significantly reduced.
[0138]
In addition, by preparing a database to determine the relationship between current density and myocardial injury current, diagnosis of myocardial electrophysiological function (survival myocardium, presence and extent of rejection after heart transplantation, cardiomyopathy, etc.) Evaluation etc.) can be performed accurately.
[0139]
The embodiment disclosed this time should be considered as illustrative in all points and not restrictive. The scope of the present invention is defined by the terms of the claims, rather than the description above, and is intended to include any modifications within the scope and meaning equivalent to the terms of the claims.
[0140]
【The invention's effect】
As described above, according to the present invention, the intramyocardial current density distribution obtained by noninvasive magnetic measurement on the chest of a patient can be visually displayed on a three-dimensional anatomical image. It is possible to three-dimensionally identify the position, size, shape, and extent of a myocardial injury site or a surviving myocardial site that exhibits a good current density distribution. Therefore, since the damaged myocardial site or the surviving myocardial site can be diagnosed non-invasively, a quick and safe examination can be performed without imposing a burden on the patient. Moreover, since no radioisotope is used, the inspection can be carried out continuously and the cost can be reduced.
[0141]
Furthermore, by calculating the myocardial current density of each region by dividing the left and right ventricles based on anatomical factors or functional factors, it is possible to three-dimensionally diagnose a myocardial injury site or a surviving myocardial site. In particular, when treatment is performed by high-frequency catheter ablation, the target area for electrophysiological examination can be remarkably narrowed in advance, and the X-ray exposure dose of doctors and radiographers can be significantly reduced. .
[0142]
Furthermore, by preparing a database containing information for determining the relationship between the current density and the myocardial injury current, there is a specific effect that the diagnosis of the electrophysiological tissue characteristics of the myocardium can be performed accurately.
[0143]
According to still another aspect of the present invention, an anatomical image is obtained by superimposing the current density distribution on a normal stimulus propagation circuit from the sinoatrial node of the same subject to the His bundle-Purkinje fiber system and displaying it three-dimensionally. Without any problem, the position, size, shape, and extent of the damaged or surviving myocardial site in the ventricle can be identified three-dimensionally. That is, it is possible to omit an examination for obtaining an anatomical image and to perform a more cost-effective diagnosis.
[Brief description of the drawings]
FIG. 1 is a functional block diagram schematically showing a configuration of a living myocardial diagnostic apparatus by magnetic field measurement according to
FIG. 2 is a block diagram showing a more specific configuration of a living myocardial diagnostic apparatus using magnetic field measurement shown in FIG. 1;
3 is a block diagram showing a detailed configuration of the magnetic field distribution measuring apparatus shown in FIG. 2. FIG.
FIG. 4 is a diagram showing an arrangement example of a plurality of magnetic field sensors on the front surface of a subject's chest.
5 is a diagram showing magnetic field time-series data obtained from each of the plurality of sensors in FIG. 4. FIG.
FIG. 6 is a diagram schematically illustrating a method for calculating current density data from magnetic field time-series data.
7 is a diagram showing an example of a three-dimensional anatomical image displayed on the
FIG. 8 is a tomogram showing a cross section of the three-dimensional anatomical image shown in FIG. 7;
FIG. 9 is a flowchart for explaining the operation of the living myocardial diagnostic apparatus by magnetic field measurement according to
FIG. 10 is a flowchart for explaining the operation of the living myocardial diagnostic apparatus by magnetic field measurement according to a modification of the first embodiment of the present invention.
FIG. 11 is a diagram schematically showing one aspect of ventricular region division.
FIG. 12 is a flowchart for explaining the operation of the living myocardial diagnostic apparatus by magnetic field measurement according to a further modification of the first embodiment of the present invention.
FIG. 13 is a functional block diagram schematically showing a configuration of a living myocardial diagnostic apparatus by magnetic field measurement according to
FIG. 14 is a block diagram showing a more specific configuration of a living myocardial diagnostic apparatus using magnetic field measurement according to
FIG. 15 is a diagram schematically showing a normal stimulus propagation path and an electrocardiogram waveform in the heart.
16 is a diagram showing an image of a normal stimulus propagation path and an abnormal current density distribution actually displayed by the
FIG. 17 is a flowchart for explaining the first half of the operation of the living myocardial diagnostic apparatus by magnetic field measurement according to the second embodiment.
FIG. 18 is a flowchart for explaining the second half of the operation of the living myocardial diagnostic apparatus by magnetic field measurement according to the second embodiment.
FIG. 19 is a flowchart for explaining the second half of the operation of the living myocardial diagnostic apparatus by magnetic field measurement according to a modification of the second embodiment.
FIG. 20 is a flowchart for explaining the second half of the operation of the living myocardial diagnostic apparatus by magnetic field measurement according to a further modification of the second embodiment.
[Explanation of symbols]
DESCRIPTION OF
Claims (11)
被験者の胸部上の複数の座標における非接触磁気計測により前記複数の座標に対応する複数の磁界時系列データを取得し、かつ前記複数の磁界時系列データに基づいて前記胸部上の磁界分布時系列データを生成する磁界分布計測手段と、
前記生成された磁界分布時系列データに基づいて前記被験者の心筋内の電流密度分布の時系列データを生成する第1の演算手段と、
別途供給された前記被験者の胸部断層画像データを加工して3次元的解剖学的画像を示すデータを生成する第2の演算手段と、
前記第1の演算手段により生成されたデータが示す前記心筋内の電流密度分布の画像を、前記第2の演算手段により生成されたデータが示す前記3次元的解剖学的画像に重ね合わせて表示する表示処理を行なう表示手段とを備え、これにより、異常な電流密度分布を示す心筋障害部位または生理学的に生存している心筋部位を3次元的に同定することができ、
前記第1の演算手段により生成されたデータが示す心筋内の電流密度と、心筋障害電流との関係を判断するための情報を含むデータベースをさらに備える、磁界計測による生存心筋診断装置。A living myocardial diagnostic device by magnetic field measurement,
A plurality of magnetic field time series data corresponding to the plurality of coordinates is obtained by non-contact magnetic measurement at a plurality of coordinates on the chest of the subject, and a magnetic field distribution time series on the chest is obtained based on the plurality of magnetic field time series data Magnetic field distribution measuring means for generating data;
First calculation means for generating time series data of current density distribution in the subject's myocardium based on the generated magnetic field distribution time series data;
Second arithmetic means for processing the tomographic image data of the subject separately supplied to generate data indicating a three-dimensional anatomical image;
The image of the current density distribution in the myocardium indicated by the data generated by the first calculation means is displayed superimposed on the three-dimensional anatomical image indicated by the data generated by the second calculation means. Display means for performing the display processing, and thereby, it is possible to three-dimensionally identify a myocardial injury site or a physiologically alive myocardial site exhibiting an abnormal current density distribution,
A surviving myocardial diagnostic apparatus using magnetic field measurement, further comprising a database including information for determining a relationship between a current density in the myocardium indicated by data generated by the first calculation means and a myocardial injury current.
被験者の胸部上の複数の座標における非接触磁気計測により前記複数の座標に対応する複数の磁界時系列データを取得し、かつ前記複数の磁界時系列データに基づいて前記胸部上の磁界分布時系列データを生成する磁界分布計測手段と、
前記生成された磁界分布時系列データに基づいて前記被験者の心筋内の電流密度分布の時系列データを生成する演算手段と、
前記演算手段により生成されたデータに基づいて、前記被験者の心臓の洞房結節からヒス束−プルキンエ繊維系への刺激伝播経路を示す画像と、心筋内の電流密度分布を示す画像とを重ね合わせて表示する表示処理を行なう表示手段とを備え、これにより、異常な電流密度分布を示す心筋障害部位または生理学的に生存している心筋部位を3次元的に同定することができる、磁界計測による生存心筋診断装置。A living myocardial diagnostic device by magnetic field measurement,
A plurality of magnetic field time series data corresponding to the plurality of coordinates is obtained by non-contact magnetic measurement at a plurality of coordinates on the chest of the subject, and a magnetic field distribution time series on the chest is obtained based on the plurality of magnetic field time series data Magnetic field distribution measuring means for generating data;
Calculating means for generating time series data of current density distribution in the subject's myocardium based on the generated magnetic field distribution time series data;
Based on the data generated by the computing means, an image showing the stimulus propagation path from the sinoatrial node of the subject's heart to the His bundle-Purkinje fiber system and an image showing the current density distribution in the myocardium are superimposed. Display means for performing a display process for display, whereby a myocardial injury site exhibiting an abnormal current density distribution or a physiologically surviving myocardial site can be identified three-dimensionally, and survival by magnetic field measurement Myocardial diagnostic device.
被験者の胸部上の複数の座標における非接触磁気計測により取得された前記複数の座標に対応する複数の磁界時系列データに基づいて生成された前記胸部上の磁界分布時系列データに基づいて、前記被験者の心筋内の電流密度分布の時系列データである第1のデータを生成するステップと、
別途供給された前記被験者の胸部断層画像データを加工して3次元的解剖学的画像を示す第2のデータを生成するステップと、
前記第1のデータが示す前記心筋内の電流密度分布の画像を、前記第2のデータが示す前記3次元的解剖学的画像に重ね合わせて、異常な電流密度分布を示す心筋障害部位または生理学的に生存している心筋部位を3次元的に同定するための画像を表示するステップとを備える、磁界計測による生存心筋診断装置の作動方法。A method for operating a living myocardial diagnostic apparatus by magnetic field measurement,
Based on magnetic field distribution time series data on the chest generated based on a plurality of magnetic field time series data corresponding to the plurality of coordinates acquired by non-contact magnetic measurement at a plurality of coordinates on the subject's chest, Generating first data which is time-series data of current density distribution in the subject's myocardium;
Processing the tomographic image data of the subject separately supplied to generate second data indicating a three-dimensional anatomical image;
An image of current density distribution in the myocardium indicated by the first data is superimposed on the three-dimensional anatomical image indicated by the second data to show a myocardial injury site or physiology showing an abnormal current density distribution. A method for operating a surviving myocardial diagnostic apparatus using magnetic field measurement, comprising: displaying an image for three-dimensionally identifying a myocardial region that is surviving in a three-dimensional manner.
被験者の胸部上の複数の座標における非接触磁気計測により取得された前記複数の座標に対応する複数の磁界時系列データに基づいて生成された前記胸部上の磁界分布時系列データに基づいて、前記被験者の心筋内の電流密度分布の時系列データである第1のデータを生成するステップと、
別途供給された前記被験者の胸部断層画像データを加工して3次元的解剖学的画像を示す第2のデータを生成するステップと、
前記第1のデータが示す前記心筋内の電流密度分布の画像を、前記第2のデータが示す前記3次元的解剖学的画像に重ね合わせて、異常な電流密度分布を示す心筋障害部位または生理学的に生存している心筋部位を3次元的に同定するための画像を表示するステップと、
前記3次元的に同定された部位が心筋障害部位か生存心筋部位かを判断するための前記第1のデータが示す心筋内の電流密度と心筋障害電流との関係を示す情報を表示するステップとを備える、磁界計測による生存心筋診断装置の作動方法。A method for operating a living myocardial diagnostic apparatus by magnetic field measurement,
Based on magnetic field distribution time series data on the chest generated based on a plurality of magnetic field time series data corresponding to the plurality of coordinates acquired by non-contact magnetic measurement at a plurality of coordinates on the subject's chest, Generating first data which is time-series data of current density distribution in the subject's myocardium;
Processing the tomographic image data of the subject separately supplied to generate second data indicating a three-dimensional anatomical image;
An image of current density distribution in the myocardium indicated by the first data is superimposed on the three-dimensional anatomical image indicated by the second data to show a myocardial injury site or physiology showing an abnormal current density distribution. Displaying an image for three-dimensionally identifying a surviving myocardial region;
The step of displaying information wherein the three-dimensionally identified sites showing the relationship between the first current density data in the myocardium showing a myocardial fault current to determine myocardial injury site or viable myocardium site A method for operating a living myocardial diagnostic device by magnetic field measurement.
被験者の胸部上の複数の座標における非接触磁気計測により取得された前記複数の座標に対応する複数の磁界時系列データに基づいて生成された前記胸部上の磁界分布時系列データに基づいて、前記被験者の心筋内の電流密度分布の時系列データを生成するステップと、
前記生成されたデータに基づいて、前記被験者の心臓の洞房結節からヒス束−プルキンエ繊維系への刺激伝播経路を示す画像と、心筋内の電流密度分布を示す画像とを重ね合わせて、異常な電流密度分布を示す心筋障害部位または生理学的に生存している心筋部位を3次元的に同定するための画像を表示するステップとを備える、磁界計測による生存心筋診断装置の作動方法。A method for operating a living myocardial diagnostic apparatus by magnetic field measurement,
Based on magnetic field distribution time series data on the chest generated based on a plurality of magnetic field time series data corresponding to the plurality of coordinates obtained by non-contact magnetic measurement at a plurality of coordinates on the subject's chest, Generating time-series data of current density distribution in the subject's myocardium;
Based on the generated data, an image showing a stimulus propagation path from the sinoatrial node of the subject's heart to the His bundle-Purkinje fiber system and an image showing the current density distribution in the myocardium are superimposed , and abnormal and a step of displaying the image to identify myocardial site surviving myocardial damage site or a physiologically shows a current density distribution in three dimensions, operating method of viable myocardium diagnostic apparatus according to the magnetic field measurement.
Priority Applications (5)
| Application Number | Priority Date | Filing Date | Title |
|---|---|---|---|
| JP2000217834A JP3712349B2 (en) | 2000-07-18 | 2000-07-18 | Surviving myocardial diagnostic apparatus and operating method thereof |
| US10/333,070 US7144376B2 (en) | 2000-07-18 | 2001-07-17 | Liable cardiac muscle diagnosing apparatus and liable cardiac muscle analyzing method by magnetic field measurements |
| AU2001269539A AU2001269539A1 (en) | 2000-07-18 | 2001-07-17 | Liable cardiac muscle diagnosing apparatus and liable cardiac muscle analyzing method by magnetic field measurements |
| PCT/JP2001/006193 WO2002005714A1 (en) | 2000-07-18 | 2001-07-17 | Liable cardiac muscle diagnosing apparatus and liable cardiac muscle analyzing method by magnetic field measurements |
| EP01948055A EP1302160A4 (en) | 2000-07-18 | 2001-07-17 | Liable cardiac muscle diagnosing apparatus and liable cardiac muscle analyzing method by magnetic field measurements |
Applications Claiming Priority (1)
| Application Number | Priority Date | Filing Date | Title |
|---|---|---|---|
| JP2000217834A JP3712349B2 (en) | 2000-07-18 | 2000-07-18 | Surviving myocardial diagnostic apparatus and operating method thereof |
Publications (3)
| Publication Number | Publication Date |
|---|---|
| JP2002028144A JP2002028144A (en) | 2002-01-29 |
| JP2002028144A5 JP2002028144A5 (en) | 2005-08-25 |
| JP3712349B2 true JP3712349B2 (en) | 2005-11-02 |
Family
ID=18712889
Family Applications (1)
| Application Number | Title | Priority Date | Filing Date |
|---|---|---|---|
| JP2000217834A Expired - Fee Related JP3712349B2 (en) | 2000-07-18 | 2000-07-18 | Surviving myocardial diagnostic apparatus and operating method thereof |
Country Status (5)
| Country | Link |
|---|---|
| US (1) | US7144376B2 (en) |
| EP (1) | EP1302160A4 (en) |
| JP (1) | JP3712349B2 (en) |
| AU (1) | AU2001269539A1 (en) |
| WO (1) | WO2002005714A1 (en) |
Families Citing this family (13)
| Publication number | Priority date | Publication date | Assignee | Title |
|---|---|---|---|---|
| EP1349494B1 (en) * | 2000-08-29 | 2011-07-06 | Cardiomag Imaging, Inc. | Ischemia identification, quantification and partial localization in mcg |
| JP4045769B2 (en) * | 2001-10-10 | 2008-02-13 | 株式会社日立製作所 | Magnetic field generator and MRI apparatus using the same |
| FI115737B (en) | 2003-09-26 | 2005-06-30 | Elekta Neuromag Oy | A method for using a multichannel measurement signal in source modeling |
| EP1769741B1 (en) * | 2004-06-01 | 2013-05-29 | National University Corporation Iwate University | Cardiac magnetic field diagnostic apparatus and damaged cardiac muscle three-dimensional localization evaluating method |
| WO2006111965A2 (en) * | 2005-04-20 | 2006-10-26 | Visionsense Ltd. | System and method for producing an augmented image of an organ of a patient |
| JP4791797B2 (en) * | 2005-11-04 | 2011-10-12 | 株式会社日立ハイテクノロジーズ | Biomagnetic field measurement device |
| KR100746274B1 (en) | 2006-02-20 | 2007-08-06 | 경희대학교 산학협력단 | Apparatus and method for visualizing a inside of object |
| US8970217B1 (en) | 2010-04-14 | 2015-03-03 | Hypres, Inc. | System and method for noise reduction in magnetic resonance imaging |
| KR101156634B1 (en) | 2010-11-23 | 2012-06-14 | 한국표준과학연구원 | Method for direct measurement of myocardial electric abnormality based on ultra-low-field nuclear magnetic resonance and apparatus of ultra-low-field nuclear magnetic resonance |
| US9433363B1 (en) | 2015-06-18 | 2016-09-06 | Genetesis Llc | Method and system for high throughput evaluation of functional cardiac electrophysiology |
| WO2018025829A1 (en) * | 2016-08-02 | 2018-02-08 | 国立大学法人東京医科歯科大学 | Biomagnetism measuring device |
| WO2021181648A1 (en) * | 2020-03-13 | 2021-09-16 | 朝日インテック株式会社 | Medical device and image generation method |
| CN116348041A (en) * | 2020-10-26 | 2023-06-27 | 朝日英达科株式会社 | Medical device and image generation method |
Family Cites Families (11)
| Publication number | Priority date | Publication date | Assignee | Title |
|---|---|---|---|---|
| US5594849A (en) * | 1991-08-09 | 1997-01-14 | Yale University | Biomedical magnetism imaging apparatus and method |
| JPH08289877A (en) * | 1995-04-24 | 1996-11-05 | Toshiba Corp | Simulation method for excitation propagation process of tissue and intra-tissue electromagnetic phenomenon diagnostic device |
| JP4065327B2 (en) | 1996-10-08 | 2008-03-26 | 株式会社日立メディコ | Projected image display method and apparatus |
| JPH10276998A (en) | 1997-04-10 | 1998-10-20 | Toshiba Corp | Simulation system for excitation propagation process |
| JP3660781B2 (en) | 1997-05-26 | 2005-06-15 | 株式会社東芝 | Diagnostic device for intracardiac electrical phenomena |
| JPH11128224A (en) | 1997-10-28 | 1999-05-18 | Mitsubishi Heavy Ind Ltd | Ultrasonic 3-dimensional image reorganizing device |
| JP4208275B2 (en) * | 1997-10-30 | 2009-01-14 | 株式会社東芝 | Diagnostic device for intracardiac electrical phenomenon and method for displaying the phenomenon |
| JP3712348B2 (en) * | 2000-07-18 | 2005-11-02 | 独立行政法人科学技術振興機構 | Cardiac magnetic field diagnostic apparatus for atrial flutter and atrial fibrillation and method for operating the same |
| JP3712350B2 (en) * | 2000-07-18 | 2005-11-02 | 独立行政法人科学技術振興機構 | Cardiac magnetic field diagnostic apparatus for ventricular delayed potential and method for operating the same |
| US20030149354A1 (en) * | 2001-08-23 | 2003-08-07 | Bakharev Alexander A. | Ischemia identification, quantification and partial localization MCG |
| US7158839B2 (en) * | 2003-11-07 | 2007-01-02 | Paracor Medical, Inc. | Cardiac harness for treating heart disease |
-
2000
- 2000-07-18 JP JP2000217834A patent/JP3712349B2/en not_active Expired - Fee Related
-
2001
- 2001-07-17 AU AU2001269539A patent/AU2001269539A1/en not_active Abandoned
- 2001-07-17 US US10/333,070 patent/US7144376B2/en not_active Expired - Fee Related
- 2001-07-17 WO PCT/JP2001/006193 patent/WO2002005714A1/en not_active Application Discontinuation
- 2001-07-17 EP EP01948055A patent/EP1302160A4/en not_active Withdrawn
Also Published As
| Publication number | Publication date |
|---|---|
| AU2001269539A1 (en) | 2002-01-30 |
| US7144376B2 (en) | 2006-12-05 |
| EP1302160A1 (en) | 2003-04-16 |
| JP2002028144A (en) | 2002-01-29 |
| WO2002005714A1 (en) | 2002-01-24 |
| EP1302160A4 (en) | 2007-05-30 |
| US20040039291A1 (en) | 2004-02-26 |
Similar Documents
| Publication | Publication Date | Title |
|---|---|---|
| US20210219899A1 (en) | Systems And Methods For Noninvasive Spectral-Spatiotemporal Imaging of Cardiac Electrical Activity | |
| US20080033312A1 (en) | Cardiac Magnetic Field Diagnostic Apparatus and Evaluating Method of Three-Dimensional Localization of Myocardial Injury | |
| Tavarozzi et al. | Current perspective Magnetocardiography: current status and perspectives. Part II: Clinical applications | |
| JP3712348B2 (en) | Cardiac magnetic field diagnostic apparatus for atrial flutter and atrial fibrillation and method for operating the same | |
| JP2002500909A (en) | Apparatus and method for measuring, estimating, and displaying RMS current density maps | |
| JP2018525041A (en) | Methods and systems for functional cardiac electrophysiology assessment | |
| JP3712349B2 (en) | Surviving myocardial diagnostic apparatus and operating method thereof | |
| US7363070B2 (en) | Biomagnetic measurement apparatus | |
| Leder et al. | Noninvasive biomagnetic imaging in coronary artery disease based on individual current density maps of the heart | |
| JP3835805B2 (en) | Cardiac magnetic field diagnostic apparatus and operating method thereof | |
| JP3712350B2 (en) | Cardiac magnetic field diagnostic apparatus for ventricular delayed potential and method for operating the same | |
| US7805179B2 (en) | Method of examining dynamic cardiac electromagnetic activity and detection of cardiac functions using results thereof | |
| Brisinda et al. | First 36-channel magnetocardiographic study of CAD patients in an unshielded laboratory for interventional and intensive cardiac care | |
| JP3809454B2 (en) | Cardiac magnetic field diagnostic apparatus and operating method thereof | |
| JP2002355229A (en) | Method to analyze magnetic field and instrument to visualize current distribution | |
| US7957787B2 (en) | Method of examining dynamic cardiac electromagnetic activity and detection of cardiac functions using results thereof | |
| Ding et al. | Dynamic three-dimensional visualization of the left ventricle by intracardiac echocardiography | |
| Mäkijärvi et al. | New trends in clinical magnetocardiography | |
| Agren et al. | Magnetocardiographic localization of arrhythmia substrates: a methodology study with accessory pathway ablation as reference | |
| Boudlali | Analysis of Electroanatomic Mapping System Accuracy Using X-ray Reconstruction of Electrode Locations in a Porcine Animal Model | |
| Fenici et al. | Magnetocardiography provides non-invasive three-dimensional electroanatomical imaging of cardiac electrophysiology. | |
| Baron-Palucka | Magnetocardiography-measurement conduction, data formats and diagnostic applications. | |
| JP4972443B2 (en) | Biomagnetic field measurement device |
Legal Events
| Date | Code | Title | Description |
|---|---|---|---|
| A711 | Notification of change in applicant |
Free format text: JAPANESE INTERMEDIATE CODE: A712 Effective date: 20031031 |
|
| RD03 | Notification of appointment of power of attorney |
Free format text: JAPANESE INTERMEDIATE CODE: A7423 Effective date: 20040129 |
|
| A711 | Notification of change in applicant |
Free format text: JAPANESE INTERMEDIATE CODE: A711 Effective date: 20040723 |
|
| RD03 | Notification of appointment of power of attorney |
Free format text: JAPANESE INTERMEDIATE CODE: A7423 Effective date: 20040723 |
|
| A521 | Request for written amendment filed |
Free format text: JAPANESE INTERMEDIATE CODE: A821 Effective date: 20040723 |
|
| A521 | Request for written amendment filed |
Free format text: JAPANESE INTERMEDIATE CODE: A523 Effective date: 20050221 |
|
| A621 | Written request for application examination |
Free format text: JAPANESE INTERMEDIATE CODE: A621 Effective date: 20050221 |
|
| A871 | Explanation of circumstances concerning accelerated examination |
Free format text: JAPANESE INTERMEDIATE CODE: A871 Effective date: 20050221 |
|
| A975 | Report on accelerated examination |
Free format text: JAPANESE INTERMEDIATE CODE: A971005 Effective date: 20050317 |
|
| A521 | Request for written amendment filed |
Free format text: JAPANESE INTERMEDIATE CODE: A821 Effective date: 20050221 |
|
| A131 | Notification of reasons for refusal |
Free format text: JAPANESE INTERMEDIATE CODE: A131 Effective date: 20050426 |
|
| A521 | Request for written amendment filed |
Free format text: JAPANESE INTERMEDIATE CODE: A523 Effective date: 20050621 |
|
| TRDD | Decision of grant or rejection written | ||
| A01 | Written decision to grant a patent or to grant a registration (utility model) |
Free format text: JAPANESE INTERMEDIATE CODE: A01 Effective date: 20050726 |
|
| A61 | First payment of annual fees (during grant procedure) |
Free format text: JAPANESE INTERMEDIATE CODE: A61 Effective date: 20050816 |
|
| R150 | Certificate of patent or registration of utility model |
Free format text: JAPANESE INTERMEDIATE CODE: R150 |
|
| FPAY | Renewal fee payment (event date is renewal date of database) |
Free format text: PAYMENT UNTIL: 20080826 Year of fee payment: 3 |
|
| FPAY | Renewal fee payment (event date is renewal date of database) |
Free format text: PAYMENT UNTIL: 20090826 Year of fee payment: 4 |
|
| FPAY | Renewal fee payment (event date is renewal date of database) |
Free format text: PAYMENT UNTIL: 20100826 Year of fee payment: 5 |
|
| S111 | Request for change of ownership or part of ownership |
Free format text: JAPANESE INTERMEDIATE CODE: R313117 |
|
| FPAY | Renewal fee payment (event date is renewal date of database) |
Free format text: PAYMENT UNTIL: 20100826 Year of fee payment: 5 |
|
| R350 | Written notification of registration of transfer |
Free format text: JAPANESE INTERMEDIATE CODE: R350 |
|
| FPAY | Renewal fee payment (event date is renewal date of database) |
Free format text: PAYMENT UNTIL: 20110826 Year of fee payment: 6 |
|
| FPAY | Renewal fee payment (event date is renewal date of database) |
Free format text: PAYMENT UNTIL: 20110826 Year of fee payment: 6 |
|
| FPAY | Renewal fee payment (event date is renewal date of database) |
Free format text: PAYMENT UNTIL: 20120826 Year of fee payment: 7 |
|
| FPAY | Renewal fee payment (event date is renewal date of database) |
Free format text: PAYMENT UNTIL: 20130826 Year of fee payment: 8 |
|
| LAPS | Cancellation because of no payment of annual fees |