JP2023541663A - Diagnostic test kit and its analysis method - Google Patents
Diagnostic test kit and its analysis method Download PDFInfo
- Publication number
- JP2023541663A JP2023541663A JP2023517379A JP2023517379A JP2023541663A JP 2023541663 A JP2023541663 A JP 2023541663A JP 2023517379 A JP2023517379 A JP 2023517379A JP 2023517379 A JP2023517379 A JP 2023517379A JP 2023541663 A JP2023541663 A JP 2023541663A
- Authority
- JP
- Japan
- Prior art keywords
- test
- diagnostic test
- image
- diagnostic
- control markings
- Prior art date
- Legal status (The legal status is an assumption and is not a legal conclusion. Google has not performed a legal analysis and makes no representation as to the accuracy of the status listed.)
- Pending
Links
- 238000002405 diagnostic procedure Methods 0.000 title claims abstract description 463
- 238000004458 analytical method Methods 0.000 title claims abstract description 62
- 238000012360 testing method Methods 0.000 claims abstract description 329
- 238000000034 method Methods 0.000 claims abstract description 198
- 230000004438 eyesight Effects 0.000 claims abstract description 45
- 238000001514 detection method Methods 0.000 claims abstract description 25
- 238000003018 immunoassay Methods 0.000 claims description 37
- 238000010438 heat treatment Methods 0.000 claims description 28
- 230000004313 glare Effects 0.000 claims description 23
- 238000003384 imaging method Methods 0.000 claims description 18
- 239000003086 colorant Substances 0.000 claims description 15
- 238000005286 illumination Methods 0.000 claims description 9
- 238000011901 isothermal amplification Methods 0.000 claims description 8
- 239000013642 negative control Substances 0.000 claims description 6
- 230000004044 response Effects 0.000 claims description 6
- 229910052693 Europium Inorganic materials 0.000 claims description 5
- OGPBJKLSAFTDLK-UHFFFAOYSA-N europium atom Chemical compound [Eu] OGPBJKLSAFTDLK-UHFFFAOYSA-N 0.000 claims description 5
- GNBHRKFJIUUOQI-UHFFFAOYSA-N fluorescein Chemical compound O1C(=O)C2=CC=CC=C2C21C1=CC=C(O)C=C1OC1=CC(O)=CC=C21 GNBHRKFJIUUOQI-UHFFFAOYSA-N 0.000 claims description 5
- 239000002105 nanoparticle Substances 0.000 claims description 5
- 239000002096 quantum dot Substances 0.000 claims description 5
- PYWVYCXTNDRMGF-UHFFFAOYSA-N rhodamine B Chemical compound [Cl-].C=12C=CC(=[N+](CC)CC)C=C2OC2=CC(N(CC)CC)=CC=C2C=1C1=CC=CC=C1C(O)=O PYWVYCXTNDRMGF-UHFFFAOYSA-N 0.000 claims description 5
- 238000010586 diagram Methods 0.000 abstract description 34
- 239000000523 sample Substances 0.000 description 49
- 238000003556 assay Methods 0.000 description 30
- 239000000976 ink Substances 0.000 description 15
- 230000008569 process Effects 0.000 description 14
- 238000010801 machine learning Methods 0.000 description 13
- 230000006870 function Effects 0.000 description 10
- 230000000007 visual effect Effects 0.000 description 10
- 239000003153 chemical reaction reagent Substances 0.000 description 9
- 239000003550 marker Substances 0.000 description 9
- 238000012795 verification Methods 0.000 description 9
- 238000010191 image analysis Methods 0.000 description 8
- 239000000463 material Substances 0.000 description 8
- 239000000975 dye Substances 0.000 description 7
- 238000005516 engineering process Methods 0.000 description 6
- 230000003628 erosive effect Effects 0.000 description 6
- 238000012937 correction Methods 0.000 description 5
- 230000010339 dilation Effects 0.000 description 5
- 238000004519 manufacturing process Methods 0.000 description 5
- 239000000123 paper Substances 0.000 description 5
- 238000012549 training Methods 0.000 description 5
- 238000013135 deep learning Methods 0.000 description 4
- 230000007613 environmental effect Effects 0.000 description 4
- 238000007639 printing Methods 0.000 description 4
- 210000003296 saliva Anatomy 0.000 description 4
- 230000009466 transformation Effects 0.000 description 4
- 239000012491 analyte Substances 0.000 description 3
- 239000008280 blood Substances 0.000 description 3
- 210000004369 blood Anatomy 0.000 description 3
- 238000013461 design Methods 0.000 description 3
- 238000003708 edge detection Methods 0.000 description 3
- 230000000694 effects Effects 0.000 description 3
- 230000036541 health Effects 0.000 description 3
- 238000005259 measurement Methods 0.000 description 3
- 230000007246 mechanism Effects 0.000 description 3
- 239000002245 particle Substances 0.000 description 3
- 239000013641 positive control Substances 0.000 description 3
- 238000012124 rapid diagnostic test Methods 0.000 description 3
- 238000003860 storage Methods 0.000 description 3
- 239000000126 substance Substances 0.000 description 3
- 210000002700 urine Anatomy 0.000 description 3
- OKTJSMMVPCPJKN-UHFFFAOYSA-N Carbon Chemical compound [C] OKTJSMMVPCPJKN-UHFFFAOYSA-N 0.000 description 2
- 241000711573 Coronaviridae Species 0.000 description 2
- XEEYBQQBJWHFJM-UHFFFAOYSA-N Iron Chemical compound [Fe] XEEYBQQBJWHFJM-UHFFFAOYSA-N 0.000 description 2
- 239000000853 adhesive Substances 0.000 description 2
- 230000001070 adhesive effect Effects 0.000 description 2
- 238000013528 artificial neural network Methods 0.000 description 2
- 230000008859 change Effects 0.000 description 2
- 238000006243 chemical reaction Methods 0.000 description 2
- 238000004737 colorimetric analysis Methods 0.000 description 2
- 238000004891 communication Methods 0.000 description 2
- 239000004020 conductor Substances 0.000 description 2
- 238000012790 confirmation Methods 0.000 description 2
- 239000003814 drug Substances 0.000 description 2
- 229940079593 drug Drugs 0.000 description 2
- 238000013213 extrapolation Methods 0.000 description 2
- 238000003306 harvesting Methods 0.000 description 2
- 206010022000 influenza Diseases 0.000 description 2
- 238000003780 insertion Methods 0.000 description 2
- 230000037431 insertion Effects 0.000 description 2
- 239000011159 matrix material Substances 0.000 description 2
- 238000012986 modification Methods 0.000 description 2
- 230000004048 modification Effects 0.000 description 2
- 238000012545 processing Methods 0.000 description 2
- 238000001228 spectrum Methods 0.000 description 2
- 238000010792 warming Methods 0.000 description 2
- PXFBZOLANLWPMH-UHFFFAOYSA-N 16-Epiaffinine Natural products C1C(C2=CC=CC=C2N2)=C2C(=O)CC2C(=CC)CN(C)C1C2CO PXFBZOLANLWPMH-UHFFFAOYSA-N 0.000 description 1
- 238000010146 3D printing Methods 0.000 description 1
- 208000023275 Autoimmune disease Diseases 0.000 description 1
- 238000012935 Averaging Methods 0.000 description 1
- 208000035143 Bacterial infection Diseases 0.000 description 1
- 208000025721 COVID-19 Diseases 0.000 description 1
- ODINCKMPIJJUCX-UHFFFAOYSA-N Calcium oxide Chemical class [Ca]=O ODINCKMPIJJUCX-UHFFFAOYSA-N 0.000 description 1
- 208000005156 Dehydration Diseases 0.000 description 1
- 208000001490 Dengue Diseases 0.000 description 1
- 206010012310 Dengue fever Diseases 0.000 description 1
- 206010013654 Drug abuse Diseases 0.000 description 1
- LFQSCWFLJHTTHZ-UHFFFAOYSA-N Ethanol Chemical compound CCO LFQSCWFLJHTTHZ-UHFFFAOYSA-N 0.000 description 1
- 241000941423 Grom virus Species 0.000 description 1
- 208000035150 Hypercholesterolemia Diseases 0.000 description 1
- 208000008852 Hyperoxaluria Diseases 0.000 description 1
- 206010020751 Hypersensitivity Diseases 0.000 description 1
- 241000712431 Influenza A virus Species 0.000 description 1
- 241001263478 Norovirus Species 0.000 description 1
- 241000097929 Porphyria Species 0.000 description 1
- 208000010642 Porphyrias Diseases 0.000 description 1
- 208000007536 Thrombosis Diseases 0.000 description 1
- 239000004904 UV filter Substances 0.000 description 1
- 208000036142 Viral infection Diseases 0.000 description 1
- 238000001792 White test Methods 0.000 description 1
- 241000907316 Zika virus Species 0.000 description 1
- 208000030961 allergic reaction Diseases 0.000 description 1
- 229910052782 aluminium Inorganic materials 0.000 description 1
- XAGFODPZIPBFFR-UHFFFAOYSA-N aluminium Chemical compound [Al] XAGFODPZIPBFFR-UHFFFAOYSA-N 0.000 description 1
- 230000003321 amplification Effects 0.000 description 1
- 238000013459 approach Methods 0.000 description 1
- 238000003491 array Methods 0.000 description 1
- 238000013096 assay test Methods 0.000 description 1
- 208000022362 bacterial infectious disease Diseases 0.000 description 1
- 235000013361 beverage Nutrition 0.000 description 1
- 239000000090 biomarker Substances 0.000 description 1
- 238000004364 calculation method Methods 0.000 description 1
- 230000006037 cell lysis Effects 0.000 description 1
- 230000001413 cellular effect Effects 0.000 description 1
- 229920002678 cellulose Polymers 0.000 description 1
- 239000001913 cellulose Substances 0.000 description 1
- 208000020832 chronic kidney disease Diseases 0.000 description 1
- 239000011248 coating agent Substances 0.000 description 1
- 238000000576 coating method Methods 0.000 description 1
- 230000000295 complement effect Effects 0.000 description 1
- 239000002872 contrast media Substances 0.000 description 1
- 238000013136 deep learning model Methods 0.000 description 1
- 230000018044 dehydration Effects 0.000 description 1
- 238000006297 dehydration reaction Methods 0.000 description 1
- 208000025729 dengue disease Diseases 0.000 description 1
- 201000010099 disease Diseases 0.000 description 1
- 208000037265 diseases, disorders, signs and symptoms Diseases 0.000 description 1
- -1 etc.) Substances 0.000 description 1
- 230000005284 excitation Effects 0.000 description 1
- 230000001815 facial effect Effects 0.000 description 1
- 235000013305 food Nutrition 0.000 description 1
- 208000006454 hepatitis Diseases 0.000 description 1
- 231100000283 hepatitis Toxicity 0.000 description 1
- 238000003709 image segmentation Methods 0.000 description 1
- 208000027866 inflammatory disease Diseases 0.000 description 1
- 238000002347 injection Methods 0.000 description 1
- 239000007924 injection Substances 0.000 description 1
- 238000001746 injection moulding Methods 0.000 description 1
- 229910052742 iron Inorganic materials 0.000 description 1
- 239000007788 liquid Substances 0.000 description 1
- 201000004792 malaria Diseases 0.000 description 1
- 238000013507 mapping Methods 0.000 description 1
- 238000002483 medication Methods 0.000 description 1
- 239000012528 membrane Substances 0.000 description 1
- 230000005055 memory storage Effects 0.000 description 1
- 229910052751 metal Inorganic materials 0.000 description 1
- 239000002184 metal Substances 0.000 description 1
- 238000003801 milling Methods 0.000 description 1
- 230000000877 morphologic effect Effects 0.000 description 1
- 210000000214 mouth Anatomy 0.000 description 1
- 210000003928 nasal cavity Anatomy 0.000 description 1
- NJPPVKZQTLUDBO-UHFFFAOYSA-N novaluron Chemical compound C1=C(Cl)C(OC(F)(F)C(OC(F)(F)F)F)=CC=C1NC(=O)NC(=O)C1=C(F)C=CC=C1F NJPPVKZQTLUDBO-UHFFFAOYSA-N 0.000 description 1
- 238000003199 nucleic acid amplification method Methods 0.000 description 1
- 238000012015 optical character recognition Methods 0.000 description 1
- 230000003287 optical effect Effects 0.000 description 1
- 239000003973 paint Substances 0.000 description 1
- 244000045947 parasite Species 0.000 description 1
- 244000052769 pathogen Species 0.000 description 1
- 239000013610 patient sample Substances 0.000 description 1
- 239000000049 pigment Substances 0.000 description 1
- 210000002381 plasma Anatomy 0.000 description 1
- 238000007781 pre-processing Methods 0.000 description 1
- 230000035935 pregnancy Effects 0.000 description 1
- 238000013442 quality metrics Methods 0.000 description 1
- 239000011541 reaction mixture Substances 0.000 description 1
- 238000002310 reflectometry Methods 0.000 description 1
- 238000012552 review Methods 0.000 description 1
- 238000005096 rolling process Methods 0.000 description 1
- 230000011218 segmentation Effects 0.000 description 1
- 238000000926 separation method Methods 0.000 description 1
- 210000002966 serum Anatomy 0.000 description 1
- 239000007787 solid Substances 0.000 description 1
- 230000003068 static effect Effects 0.000 description 1
- 208000011117 substance-related disease Diseases 0.000 description 1
- 238000012546 transfer Methods 0.000 description 1
- 238000000844 transformation Methods 0.000 description 1
- 150000003626 triacylglycerols Chemical class 0.000 description 1
- 238000010200 validation analysis Methods 0.000 description 1
- 230000009385 viral infection Effects 0.000 description 1
- 239000002699 waste material Substances 0.000 description 1
- XLYOFNOQVPJJNP-UHFFFAOYSA-N water Substances O XLYOFNOQVPJJNP-UHFFFAOYSA-N 0.000 description 1
Images


Classifications
-
- G—PHYSICS
- G06—COMPUTING; CALCULATING OR COUNTING
- G06T—IMAGE DATA PROCESSING OR GENERATION, IN GENERAL
- G06T7/00—Image analysis
- G06T7/0002—Inspection of images, e.g. flaw detection
- G06T7/0012—Biomedical image inspection
- G06T7/0014—Biomedical image inspection using an image reference approach
-
- G—PHYSICS
- G16—INFORMATION AND COMMUNICATION TECHNOLOGY [ICT] SPECIALLY ADAPTED FOR SPECIFIC APPLICATION FIELDS
- G16H—HEALTHCARE INFORMATICS, i.e. INFORMATION AND COMMUNICATION TECHNOLOGY [ICT] SPECIALLY ADAPTED FOR THE HANDLING OR PROCESSING OF MEDICAL OR HEALTHCARE DATA
- G16H30/00—ICT specially adapted for the handling or processing of medical images
- G16H30/40—ICT specially adapted for the handling or processing of medical images for processing medical images, e.g. editing
-
- G—PHYSICS
- G01—MEASURING; TESTING
- G01N—INVESTIGATING OR ANALYSING MATERIALS BY DETERMINING THEIR CHEMICAL OR PHYSICAL PROPERTIES
- G01N21/00—Investigating or analysing materials by the use of optical means, i.e. using sub-millimetre waves, infrared, visible or ultraviolet light
- G01N21/84—Systems specially adapted for particular applications
- G01N21/8483—Investigating reagent band
-
- G—PHYSICS
- G01—MEASURING; TESTING
- G01N—INVESTIGATING OR ANALYSING MATERIALS BY DETERMINING THEIR CHEMICAL OR PHYSICAL PROPERTIES
- G01N33/00—Investigating or analysing materials by specific methods not covered by groups G01N1/00 - G01N31/00
- G01N33/48—Biological material, e.g. blood, urine; Haemocytometers
- G01N33/483—Physical analysis of biological material
- G01N33/487—Physical analysis of biological material of liquid biological material
- G01N33/48785—Electrical and electronic details of measuring devices for physical analysis of liquid biological material not specific to a particular test method, e.g. user interface or power supply
-
- G—PHYSICS
- G01—MEASURING; TESTING
- G01N—INVESTIGATING OR ANALYSING MATERIALS BY DETERMINING THEIR CHEMICAL OR PHYSICAL PROPERTIES
- G01N33/00—Investigating or analysing materials by specific methods not covered by groups G01N1/00 - G01N31/00
- G01N33/48—Biological material, e.g. blood, urine; Haemocytometers
- G01N33/50—Chemical analysis of biological material, e.g. blood, urine; Testing involving biospecific ligand binding methods; Immunological testing
- G01N33/53—Immunoassay; Biospecific binding assay; Materials therefor
- G01N33/5302—Apparatus specially adapted for immunological test procedures
-
- G—PHYSICS
- G01—MEASURING; TESTING
- G01N—INVESTIGATING OR ANALYSING MATERIALS BY DETERMINING THEIR CHEMICAL OR PHYSICAL PROPERTIES
- G01N33/00—Investigating or analysing materials by specific methods not covered by groups G01N1/00 - G01N31/00
- G01N33/48—Biological material, e.g. blood, urine; Haemocytometers
- G01N33/50—Chemical analysis of biological material, e.g. blood, urine; Testing involving biospecific ligand binding methods; Immunological testing
- G01N33/53—Immunoassay; Biospecific binding assay; Materials therefor
- G01N33/543—Immunoassay; Biospecific binding assay; Materials therefor with an insoluble carrier for immobilising immunochemicals
- G01N33/54366—Apparatus specially adapted for solid-phase testing
- G01N33/54386—Analytical elements
- G01N33/54387—Immunochromatographic test strips
- G01N33/54388—Immunochromatographic test strips based on lateral flow
-
- G—PHYSICS
- G06—COMPUTING; CALCULATING OR COUNTING
- G06T—IMAGE DATA PROCESSING OR GENERATION, IN GENERAL
- G06T7/00—Image analysis
- G06T7/90—Determination of colour characteristics
-
- G—PHYSICS
- G06—COMPUTING; CALCULATING OR COUNTING
- G06V—IMAGE OR VIDEO RECOGNITION OR UNDERSTANDING
- G06V10/00—Arrangements for image or video recognition or understanding
- G06V10/20—Image preprocessing
- G06V10/25—Determination of region of interest [ROI] or a volume of interest [VOI]
-
- G—PHYSICS
- G06—COMPUTING; CALCULATING OR COUNTING
- G06V—IMAGE OR VIDEO RECOGNITION OR UNDERSTANDING
- G06V10/00—Arrangements for image or video recognition or understanding
- G06V10/40—Extraction of image or video features
- G06V10/56—Extraction of image or video features relating to colour
-
- G—PHYSICS
- G06—COMPUTING; CALCULATING OR COUNTING
- G06V—IMAGE OR VIDEO RECOGNITION OR UNDERSTANDING
- G06V10/00—Arrangements for image or video recognition or understanding
- G06V10/98—Detection or correction of errors, e.g. by rescanning the pattern or by human intervention; Evaluation of the quality of the acquired patterns
- G06V10/993—Evaluation of the quality of the acquired pattern
-
- G—PHYSICS
- G06—COMPUTING; CALCULATING OR COUNTING
- G06V—IMAGE OR VIDEO RECOGNITION OR UNDERSTANDING
- G06V40/00—Recognition of biometric, human-related or animal-related patterns in image or video data
- G06V40/60—Static or dynamic means for assisting the user to position a body part for biometric acquisition
- G06V40/63—Static or dynamic means for assisting the user to position a body part for biometric acquisition by static guides
-
- G—PHYSICS
- G01—MEASURING; TESTING
- G01N—INVESTIGATING OR ANALYSING MATERIALS BY DETERMINING THEIR CHEMICAL OR PHYSICAL PROPERTIES
- G01N21/00—Investigating or analysing materials by the use of optical means, i.e. using sub-millimetre waves, infrared, visible or ultraviolet light
- G01N21/84—Systems specially adapted for particular applications
- G01N21/8483—Investigating reagent band
- G01N2021/8488—Investigating reagent band the band presenting reference patches
-
- G—PHYSICS
- G01—MEASURING; TESTING
- G01N—INVESTIGATING OR ANALYSING MATERIALS BY DETERMINING THEIR CHEMICAL OR PHYSICAL PROPERTIES
- G01N21/00—Investigating or analysing materials by the use of optical means, i.e. using sub-millimetre waves, infrared, visible or ultraviolet light
- G01N21/75—Systems in which material is subjected to a chemical reaction, the progress or the result of the reaction being investigated
- G01N21/77—Systems in which material is subjected to a chemical reaction, the progress or the result of the reaction being investigated by observing the effect on a chemical indicator
- G01N21/78—Systems in which material is subjected to a chemical reaction, the progress or the result of the reaction being investigated by observing the effect on a chemical indicator producing a change of colour
-
- G—PHYSICS
- G01—MEASURING; TESTING
- G01N—INVESTIGATING OR ANALYSING MATERIALS BY DETERMINING THEIR CHEMICAL OR PHYSICAL PROPERTIES
- G01N2201/00—Features of devices classified in G01N21/00
- G01N2201/02—Mechanical
- G01N2201/022—Casings
- G01N2201/0221—Portable; cableless; compact; hand-held
-
- G—PHYSICS
- G01—MEASURING; TESTING
- G01N—INVESTIGATING OR ANALYSING MATERIALS BY DETERMINING THEIR CHEMICAL OR PHYSICAL PROPERTIES
- G01N2458/00—Labels used in chemical analysis of biological material
-
- G—PHYSICS
- G06—COMPUTING; CALCULATING OR COUNTING
- G06T—IMAGE DATA PROCESSING OR GENERATION, IN GENERAL
- G06T2207/00—Indexing scheme for image analysis or image enhancement
- G06T2207/10—Image acquisition modality
- G06T2207/10024—Color image
-
- G—PHYSICS
- G06—COMPUTING; CALCULATING OR COUNTING
- G06T—IMAGE DATA PROCESSING OR GENERATION, IN GENERAL
- G06T2207/00—Indexing scheme for image analysis or image enhancement
- G06T2207/30—Subject of image; Context of image processing
- G06T2207/30004—Biomedical image processing
-
- G—PHYSICS
- G06—COMPUTING; CALCULATING OR COUNTING
- G06V—IMAGE OR VIDEO RECOGNITION OR UNDERSTANDING
- G06V2201/00—Indexing scheme relating to image or video recognition or understanding
- G06V2201/03—Recognition of patterns in medical or anatomical images
- G06V2201/034—Recognition of patterns in medical or anatomical images of medical instruments
Landscapes
- Engineering & Computer Science (AREA)
- Health & Medical Sciences (AREA)
- Life Sciences & Earth Sciences (AREA)
- Physics & Mathematics (AREA)
- General Physics & Mathematics (AREA)
- Immunology (AREA)
- Chemical & Material Sciences (AREA)
- Theoretical Computer Science (AREA)
- General Health & Medical Sciences (AREA)
- Biomedical Technology (AREA)
- Molecular Biology (AREA)
- Multimedia (AREA)
- Urology & Nephrology (AREA)
- Hematology (AREA)
- Analytical Chemistry (AREA)
- Biochemistry (AREA)
- Pathology (AREA)
- Quality & Reliability (AREA)
- Medicinal Chemistry (AREA)
- Food Science & Technology (AREA)
- Radiology & Medical Imaging (AREA)
- Nuclear Medicine, Radiotherapy & Molecular Imaging (AREA)
- Medical Informatics (AREA)
- Computer Vision & Pattern Recognition (AREA)
- Cell Biology (AREA)
- Biotechnology (AREA)
- Microbiology (AREA)
- Human Computer Interaction (AREA)
- Public Health (AREA)
- Primary Health Care (AREA)
- Epidemiology (AREA)
- Biophysics (AREA)
- Chemical Kinetics & Catalysis (AREA)
- Plasma & Fusion (AREA)
- Investigating Or Analysing Materials By The Use Of Chemical Reactions (AREA)
- Investigating Or Analysing Biological Materials (AREA)
- Investigating Or Analyzing Non-Biological Materials By The Use Of Chemical Means (AREA)
Abstract
診断試験を分析するための方法は、診断試験を描写する画像を受信するステップであって、診断試験が試験結果を示す試験領域を含む、ステップと、画像の品質を確認するステップと、診断試験の試験領域を描写している画像の試験領域画像部分を位置特定するステップと、試験領域画像部分に基づいて試験結果を予測するステップと、を含み得る。更に、診断試験の分析を容易にする方法は、スキャン面上の1又は2以上のコントロールマーキングを描写する1又は2以上の画像を受信するステップであって、1又は2以上のコントロールマーキングは、診断試験に関する1又は2以上の所定の試験結果を表す、ステップと、少なくとも1つのコンピュータビジョン技術を使用して1又は2以上の画像における1又は2以上のコントロールマーキングの検出を検証するステップと、を含み得る。【選択図】 図2AA method for analyzing a diagnostic test includes the steps of: receiving an image depicting a diagnostic test, the diagnostic test including a test area indicative of a test result; verifying quality of the image; locating a test area image portion of the image depicting the test area of the image; and predicting a test result based on the test area image portion. Further, the method of facilitating analysis of a diagnostic test includes receiving one or more images depicting one or more control markings on a scan surface, the one or more control markings comprising: representing one or more predetermined test results for a diagnostic test; and verifying detection of the one or more control markings in the one or more images using at least one computer vision technique; may include. [Selection diagram] Figure 2A
Description
(関連出願との相互参照)
本出願は、2020年9月17日に出願された米国特許出願第63/079,975号に対する優先権を主張し、その全体がこの引用により本明細書に組み込まれる。
(Cross reference with related applications)
This application claims priority to U.S. Patent Application No. 63/079,975, filed September 17, 2020, which is incorporated herein by reference in its entirety.
(技術分野)
本発明は、一般に、コンピュータビジョン支援分析を使用した診断試験の分野に関する。
(Technical field)
The present invention relates generally to the field of diagnostic testing using computer vision assisted analysis.
医療診断試験は、医療ケアの重要な要素である。多くの診断試験は、患者サンプル(例えば、尿、血液、唾液、鼻腔スワブからのサンプルなど)中のバイオマーカ又は病原体のような標的分析物の有無を確認するイムノアッセイ試験を組み込んでいる。例えば、診断試験の1つのタイプは、ラテラルフローイムノアッセイ試験であり、サンプルをコンジュゲートパッド上に又はカセットのウェル内に載置し、液体をラテラルフローイムノアッセイに通過させ、その結果、標的分析物の存在に対する正の化学的応答を鑑みてフィデューシャルを生じさせることができる。別の例として、比色診断試験は、標的分析物の存在下で見かけ上の色変化を起こす試薬を使用する。しかしながら、肉眼を用いた試験結果の判読は、困難及び/又は主観的な場合があり(例えば、極めて弱い陽性試験結果の場合)、これは不正確な試験結果につながる可能性がある。 Medical diagnostic tests are an important component of medical care. Many diagnostic tests incorporate immunoassay tests that confirm the presence of target analytes, such as biomarkers or pathogens, in patient samples (eg, urine, blood, saliva, samples from nasal swabs, etc.). For example, one type of diagnostic test is a lateral flow immunoassay test in which the sample is placed on a conjugate pad or into a well of a cassette and the liquid is passed through the lateral flow immunoassay so that the target analyte is Fiducials can be generated in view of the positive chemical response to their presence. As another example, colorimetric diagnostic tests use reagents that produce an apparent color change in the presence of a target analyte. However, interpreting test results using the naked eye can be difficult and/or subjective (eg, in the case of very weak positive test results), which can lead to inaccurate test results.
現在の診断試験読取デバイス及び他の臨床分析装置は存在するが、試験読取環境を標準化するためには、カスタマイズされた読取機器を必要とする。また、多くのアッセイ読取機器では、操作には専門的な訓練が必要である。従って、現在の診断試験読取デバイスでは、正確な読み取りを行うことができるように、クリニック、病院又は他の制御環境内での動作が必要である。このような制限は、患者の不都合さ、医療ケアコストの増加、及び広範な診断試験の制限を含めた欠点につながる。従って、診断試験のための新規で改良されたシステム及び方法が必要とされている。 Although current diagnostic test reading devices and other clinical analyzers exist, standardized reading environments require customized reading equipment. Additionally, many assay reading devices require specialized training to operate. Accordingly, current diagnostic test reading devices require operation within a clinic, hospital, or other controlled environment so that accurate readings can be taken. Such limitations lead to disadvantages, including patient inconvenience, increased medical care costs, and limited diagnostic testing. Accordingly, new and improved systems and methods for diagnostic testing are needed.
幾つかのバリエーションにおいて、診断試験を分析するための方法は、1又は2以上のプロセッサにおいて、診断試験を描写する画像を受信するステップであって、診断試験が試験結果を示す試験領域を含む、ステップと、画像の品質を確認するステップと、診断試験の試験領域を描写している画像の試験領域画像部分を位置特定するステップと、試験領域画像部分に基づいて試験結果を予測するステップと、を含むことができる。 In some variations, a method for analyzing a diagnostic test includes receiving, at one or more processors, an image depicting a diagnostic test, the diagnostic test including a test area indicative of a test result. verifying the quality of the image; locating a test region image portion of the image depicting the test region of the diagnostic test; and predicting a test result based on the test region image portion. can include.
更に、幾つかのバリエーションにおいて、診断試験の分析を容易にする方法は、1又は2以上のプロセッサにおいて、スキャン面上の1又は2以上のコントロールマーキングを描写する1又は2以上の画像を受信するステップであって、1又は2以上のコントロールマーキングが診断試験に関する1又は2以上の所定の試験結果を表す、ステップと、少なくとも1つのコンピュータビジョン技術を使用して1又は2以上の画像における1又は2以上のコントロールマーキングの検出を検証するステップと、を含むことができる。 Further, in some variations, the method of facilitating analysis of a diagnostic test includes receiving at one or more processors one or more images depicting one or more control markings on a scan surface. the one or more control markings representing one or more predetermined test results for a diagnostic test; verifying detection of two or more control markings.
幾つかのバリエーションにおいて、診断試験の分析を容易にするためのシステムは、1又は2以上のコントロールマーキングを含むスキャン面を含むことができ、1又は2以上のコントロールマーキングは、診断試験に関する1又は2以上の所定の試験結果を表す。スキャン面は更に、幾つかのバリエーションにおいて、診断試験の配置を示す試験配置ガイドを含むことができる。スキャン面は、例えば、1又は2以上のコンピュータビジョン技術を使用して診断試験結果を分析するために、診断試験を画像化することができる背景として使用することができる。 In some variations, a system for facilitating analysis of a diagnostic test can include a scanning surface that includes one or more control markings, where the one or more control markings are associated with one or more diagnostic tests. Represents two or more predetermined test results. The scan plane may further include, in some variations, a test placement guide that indicates the placement of a diagnostic test. The scan plane can be used as a background against which the diagnostic test can be imaged, for example, to analyze the diagnostic test results using one or more computer vision techniques.
一般に、幾つかのバリエーションにおいて、診断試験キットは、試験結果を示すための試験領域を含む診断試験と、1又は2以上のコントロールマーキングを含むスキャン面と、を含むことができ、1又は2以上のコントロールマーキングは、診断試験に関する1又は2以上の所定の試験結果を表す。 Generally, in some variations, a diagnostic test kit can include a diagnostic test that includes a test area for indicating a test result, and a scanning surface that includes one or more control markings, the one or more The control markings represent one or more predetermined test results for the diagnostic test.
本発明の様々な態様及びバリエーションの非限定的な例が本明細書に記載され、添付図面に示されている。 Non-limiting examples of various aspects and variations of the invention are described herein and illustrated in the accompanying drawings.
本明細書では、コンピュータビジョン技術を使用して診断試験を分析するためのシステム及び方法が記載される。システム及び方法は、例えば、医学的状態に関連する特定の化学的応答の存在に起因する試験結果の視覚的表示(例えば、ライン、色変化など)を提供する迅速診断試験の結果を分析するために使用することができる。本明細書に記載されるシステム及び方法は、家庭内又は従来のヘルスケア環境外を含む、様々な環境からの診断試験の容易に正確且つ信頼性のある実行を可能にするコンピュータビジョン技術を使用して、診断試験の結果を自動的に解釈するためにコンピュータビジョンベースの技術を利用する。 Systems and methods for analyzing diagnostic tests using computer vision techniques are described herein. Systems and methods for analyzing the results of rapid diagnostic tests that provide visual indications (e.g., lines, color changes, etc.) of test results due to the presence of a particular chemical response associated with a medical condition, for example. It can be used for. The systems and methods described herein use computer vision technology to enable easily accurate and reliable performance of diagnostic tests from a variety of environments, including within the home or outside of traditional healthcare settings. and utilizes computer vision-based technology to automatically interpret diagnostic test results.
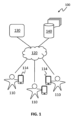
一般に、図1に示すように、診断プラットフォーム100は、1又は2以上のユーザ110に関連する診断試験を分析するのに使用することができる。各ユーザ110は、(例えば、尿、唾液及び緩衝液、鼻腔スワブ及び緩衝液、又は血液及び緩衝液などのサンプルを診断試験に適用することによって)診断試験を開始及び実行し、次に、少なくとも1つの画像センサを有するモバイルコンピュータデバイス114(例えば、スマートフォン、タブレットなど)などで診断試験の少なくとも1つの画像を取得することができる。モバイルコンピュータデバイス114は、ネットワーク120(例えば、セルラーネットワーク、インターネットなど)を介して、診断試験の画像を予測分析システム130に通信することができ、予測分析システム130は、コンピュータビジョン技術を利用して診断試験の画像から試験結果を解釈するように構成された1又は2以上のプロセッサを含むことができる。加えて又は代替的に、予測分析システム130の少なくとも一部は、モバイルコンピュータデバイス114上でローカルにホストすることができる。幾つかのバリエーションにおいて、モバイルコンピュータデバイス114は、診断試験へのサンプルの取得及び/又は適用を通じてユーザをガイドし、及び/又は分析のための診断試験の適切な画像の取得を通じてユーザをガイドするようグラフィカルユーザインタフェース(GUI)を提供することができるモバイルアプリケーションを実行することができる。
Generally, as shown in FIG. 1,
診断試験の画像を分析するための例示的な技術は、以下で更に詳細に説明される。例えば、予測分析システム130は、以下で更に説明するように、診断試験のコンピュータビジョンに基づく判読をサポートする診断試験キットにおける1又は2以上の特徴を利用することができる。次いで、予測された試験結果は、ユーザに(例えば、関連するモバイルアプリケーション上のGUIを介するなど、モバイルコンピュータデバイス114を介して)、別の適切なユーザ(例えば、医療従事者)に、ユーザに関連する電子健康記録140に、他の記憶装置に、及び/又は他の適切なエンティティに伝達することができる。
Exemplary techniques for analyzing images of diagnostic tests are described in further detail below. For example,
従って、本明細書に記載されるシステム及び方法は、診断情報を迅速且つ容易に取得及び伝達して、ユーザの医学的状態に関する洞察を提供することを可能にし、これにより、投薬の処方、医療指導又は治療の提供等の医療に関する適切なフォローアップアクションを促すことができる。更に、信頼性が低く照明及び画像センサのタイプなどの環境要因に過度に敏感なテンプレートマッチングなどの他の現在の自動化技術と比較して、診断試験分析にコンピュータビジョンベースの技術を使用すると試験判読の精度が高くなる。更に、以下で更に説明するように、本明細書に記載のシステム及び方法を有利に用いて、分析のための高価で特殊なハードウェアデバイスも、及び診断試験自体のいかなるフィデューシャル又はランドマークも必要とせずに、多種多様な診断試験を分析することができる。 Accordingly, the systems and methods described herein enable diagnostic information to be quickly and easily obtained and communicated to provide insight into a user's medical condition, thereby allowing for the prescription of medications, Appropriate medical follow-up actions, such as providing guidance or treatment, can be encouraged. Additionally, using computer vision-based techniques for diagnostic test analysis improves test interpretation compared to other current automated techniques such as template matching, which are unreliable and overly sensitive to environmental factors such as lighting and image sensor type. becomes more accurate. Additionally, as discussed further below, the systems and methods described herein may be advantageously used to eliminate expensive and specialized hardware devices for analysis and any fiducials or landmarks of the diagnostic test itself. A wide variety of diagnostic tests can be analyzed without the need for
本システム及び方法は、主に医療診断試験の分析に関して本明細書に記載されているが、幾つかのバリエーションにおいて、システム及び方法は、食品、飲料、環境条件、その他の診断試験の分析など、ヘルスケア以外の他の用途で使用できることは、理解されたい。 Although the systems and methods are described herein primarily with respect to the analysis of medical diagnostic tests, in some variations, the systems and methods can be used to analyze foods, beverages, environmental conditions, other diagnostic tests, etc. It should be understood that it can be used for other applications outside of healthcare.
(診断試験キット)
以下に更に詳細に説明するように、診断試験キットは、コンピュータビジョン技術を使用して診断試験の分析を支援するための1又は2以上の構成要素を含むことができる。幾つかのバリエーションにおいて、診断試験キットは、別個の(例えば、サードパーティ又は既製の)診断試験と共に使用するように構成することができる。例えば、診断試験キットは、特定のタイプ又はカテゴリの診断試験(例えば、イムノアッセイ試験、比色ディップスティック試験、比色等温増幅試験、又はラテラルフロー等温増幅試験など)を支援するように構成された構成要素を含むことができるが、このような診断試験を省略するか、又はこの診断試験とは別個にパッケージングすることができる。しかしながら、幾つかのバリエーションにおいて、診断試験キットは、画像分析支援と1又は2以上の診断試験の両方を含むことができる。言い換えれば、診断試験キットは、1又は2以上の適切な診断試験と共にパッケージング又は他の方法で供給される、診断試験の分析を支援するための構成要素を含むことができる。
(Diagnostic test kit)
As described in more detail below, a diagnostic test kit can include one or more components to assist in analyzing the diagnostic test using computer vision techniques. In some variations, a diagnostic test kit can be configured for use with a separate (eg, third party or off-the-shelf) diagnostic test. For example, a diagnostic test kit may be configured to support a particular type or category of diagnostic tests (e.g., immunoassay tests, colorimetric dipstick tests, colorimetric isothermal amplification tests, or lateral flow isothermal amplification tests). elements may be included, but such diagnostic tests may be omitted or packaged separately from the diagnostic tests. However, in some variations, a diagnostic test kit can include both an image analysis aid and one or more diagnostic tests. In other words, a diagnostic test kit can include components packaged or otherwise supplied with one or more appropriate diagnostic tests to support analysis of the diagnostic tests.
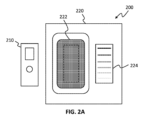
図2Aは、診断試験のコンピュータビジョン支援分析を容易にするための診断試験キット200のバリエーションの概略図を示している。図2に示すように、キット200は、画像化のための診断試験の配置を示す試験配置ガイド222、及び/又は診断試験に関する1又は2以上の実施可能な(例えば、所定の)試験結果を表す1又は2以上のコントロールマーキング224など、1又は2以上の種々の特徴を含む少なくとも1つのスキャン面220を含むことができる。試験配置ガイド222及びコントロールマーキング224は、以下に更に説明するように、同じ表面上にあってもよいし、又は別々の表面上にあってもよい。幾つかのバリエーションにおいて、スキャン面220は、空間参照、色較正などのためのフィデューシャルとして機能する他のマーキングを追加的又は代替的に含むことができる。更に、診断試験キット200は、スキャン面220と共に使用するための1又は2以上の診断試験210を含むことができ、診断試験210及びスキャン面220がパッケージ化されるか又は他の方法で共に提供されるようになる。或いは、診断試験キット200は、診断試験210を省略することができ、断試験キット200は、そのコンピュータビジョン支援分析のためのサポートを提供するために、別個の診断試験210の相補的支援として提供できるようになる。
FIG. 2A shows a schematic diagram of a variation of a
(診断試験)
診断試験キット200は、1又は2以上の適切な診断試験210(例えば、迅速診断試験)を含むことができる(又は、その分析をサポートするように構成することができる)。好適な診断試験は、ライン、色変化、又は他のフィデューシャルのような、試験結果の視覚的表示を描写する迅速診断試験を含む。例示的なタイプの診断試験は、ラテラルフローイムノアッセイ試験及び比色診断試験(例えば、ダイレクトフローイムノアッセイ試験、紙の読み出し情報を有する等温増幅試験、比色読み出し情報を有する等温増幅試験、等)を含む。例えば、ラテラルフローイムノアッセイ試験は、試験ストリップの試験領域を縁取るウィンドウを有するカセットに収容された試験ストリップを含むことができ、陽性試験結果の場合、試験結果ライン(コントロールラインとの組み合わせ)がカセットのウィンドウ内で見ることができる。
(Diagnostic test)
幾つかのバリエーションにおいて、診断試験は、試験結果を含む試験領域の周囲に高コントラスト材料を含むことができる。高コントラストは、コンピュータビジョン技術を使用して、試験領域の外形又は境界をより正確に識別することを可能にするのを助けることができる。例えば、従来の診断試験は、白色のカセット筐体及び白色の試験ストリップを含むが、カセット筐体が暗色(例えば、灰色又は黒色)であり、試験ストリップが白色である場合、本明細書に記載するようなコンピュータビジョン技術の性能を強化することができる。従って、幾つかのバリエーションにおいて、診断試験のカセット筐体は、試験ストリップよりも暗色にすることができる(例えば、カセット筐体は、灰色又は黒色であってもよく、試験ストリップは白色であってもよい)。しかしながら、試験ストリップの色(及び/又は以下に説明するようなスキャン面)と対照的な他の高コントラストカセットの色(例えば、明るい緑、明るい紫)もまた好適な場合がある。加えて又は代替的に、幾つかのバリエーションにおいて、カセット材料は、試験ストリップよりも低反射性とすることができる。例えば、試験ストリップ材料よりも僅かに反射率の低いプラスチックカセット材料であっても、試験ストリップの正確な境界を容易に位置付けることができるように、画像セグメンテーションの容易さを大きく向上させることができる。幾つかのバリエーションにおいて、診断試験のカセットは、プラスチックで、明るい灰色とすることができ、これにより、広範囲の照明条件において画像の高精度セグメンテーションのために試験ストリップとの十分なコントラストを提供することができる。 In some variations, the diagnostic test can include high contrast material around the test area containing the test results. High contrast can help enable more accurate identification of the contours or boundaries of the test area using computer vision techniques. For example, conventional diagnostic tests include a white cassette housing and a white test strip, but if the cassette housing is dark (e.g., gray or black) and the test strip is white, It can enhance the performance of computer vision technologies such as Thus, in some variations, the cassette housing of the diagnostic test can be darker than the test strip (e.g., the cassette housing can be gray or black, and the test strip can be white). good). However, other high contrast cassette colors (eg, bright green, bright purple) that contrast with the test strip color (and/or the scanning surface as described below) may also be suitable. Additionally or alternatively, in some variations, the cassette material can be less reflective than the test strip. For example, even a plastic cassette material that is slightly less reflective than the test strip material can greatly improve the ease of image segmentation so that the exact boundaries of the test strip can be easily located. In some variations, the diagnostic test cassette can be plastic and light gray to provide sufficient contrast with the test strip for accurate segmentation of images in a wide range of lighting conditions. Can be done.
加えて又は代替的に、診断試験は、本明細書に記載されるコンピュータビジョン技術の性能を高めるために、1又は2以上の幾何学的特徴を含むことができる。例えば、幾つかのバリエーションにおいて、診断試験におけるアッセイウィンドウは、勾配付き又は丸みのある縁部を有することができ、これにより試験ストリップに落ちる影の影響を低減することができる。 Additionally or alternatively, the diagnostic test can include one or more geometric features to enhance the performance of the computer vision techniques described herein. For example, in some variations, assay windows in diagnostic tests can have beveled or rounded edges, which can reduce the effect of shadows falling on the test strip.
診断試験210は、例えば、血液、血漿、血清、尿、唾液、可溶化固体、及び/又は鼻腔スワブからの物質など、ユーザからのサンプルを受け入れるように構成され、ユーザの病状を評価するために分析することができる。診断試験210は、ウイルス感染(例えば、インフルエンザ、肝炎、ジカウイルス、デング熱、チキングンヤ、ノロウイルス、コロナウイルス(例えば、COVID-19))、細菌感染、パラサイトが引き起こす疾患(例えば、マラリア)、妊娠、及び/又は任意の適切な医学的状態(例えば、慢性腎臓病、ポルフィリン症、高シュウ酸尿症、脱水症、自己免疫疾患、炎症性疾患、薬物乱用、アレルギー反応、高コレステロール血症、又は高トリグリセリド血症、等)などの医学的状態について試験するように構成することができる。幾つかのバリエーションにおいて、診断試験210は、複数の医学的状態(例えば、インフルエンザとコロナウイルス)に対する同時試験を可能にするために、複数の試験領域(例えば、複数のアッセイウィンドウ)を含むことができる。診断試験210は、例えば、2、3、4、又は5以上の試験領域を含むことができる。
(サンプル採取ツール)
幾つかのバリエーションにおいて、診断試験キット200は、ユーザからのサンプルの採取を容易にするために、1又は2以上のサンプル採取ツールを更に含むことができる。適切なサンプル採取ツールは、例えば、鼻腔スワブ、口腔採取スワブ、唾液採取容器、カップ、チューブ等を含む。サンプル採取ツールは、ユーザがサンプル採取ツールの1又は2以上を用いてサンプルを採取しているビデオにおいて、サンプルが正しく採取されたかどうかを検証するために、1又は2以上のコンピュータビジョン技術がサンプル採取ツールの位置及び動きを追跡できるよう構成することができる。
(sample collection tool)
In some variations,
例えば、1又は2以上のサンプル採取ツールは、高コントラスト色(例えば、明るい緑色、明るい紫色)を有する高コントラストインジケータを含むことができる。加えて、又は代替的に、高コントラストインジケータは、蛍光又は高反射率などの別の視覚的に印象的な特性を含むことができる。更に、幾つかのバリエーションにおいて、高コントラストインジケータは、ArUcoマーカ、WRコードマーカなどのコンピュータ読み取り可能なフィデューシャルを含むことができる。高コントラストインジケータは、サンプル採取ツールに統合されてもよく(例えば、サンプル採取ツールの一部又は全てに色素又はコーティングとして)、及び/又はサンプル採取ツールに結合された別個の構成要素を含むことができる。 For example, one or more of the sample collection tools can include a high contrast indicator having a high contrast color (eg, bright green, bright purple). Additionally or alternatively, the high contrast indicator can include another visually striking property, such as fluorescence or high reflectance. Additionally, in some variations, the high contrast indicator can include a computer readable fiducial such as an ArUco marker, a WR code marker, or the like. The high contrast indicator may be integrated into the sample collection tool (e.g., as a dye or coating on part or all of the sample collection tool) and/or may include a separate component coupled to the sample collection tool. can.
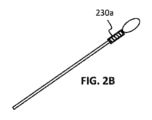
図2B~2Dは、高コントラストインジケータの変形例の概略図である。図2Bに示すように、高コントラストインジケータ230aは、スワブ(図2Bに示すように)のシャフト又はカップもしくはチューブの本体などのサンプル採取ツールの部材部分に伸縮自在に係合するリング又はスリーブを含むことができる。代替的に、高コントラストインジケータ230aは、サンプル採取ツールの表面の周りに取り付けられるテープを含むことができる。高コントラストインジケータ230aは、1又は2以上のファスナー(例えば、接着剤)で、又は機械的嵌合(例えば、締まり嵌め)を介してサンプル採取ツールに結合されてもよく、又はツール全体の色素又はツールの特定の領域もしくは構成要素のための色素として採取ツールの製造に含めることができる。インジケータは、可視光/カラー、赤外線、紫外線などを含む電磁スペクトルの任意の1又は2以上の領域に沿って高コントラストとすることができる。例示的な使用例として、高コントラストインジケータ230aは、ユーザの鼻腔に挿入される遠位フロッキングの近位の鼻スワブのシャフト上に係合することができる。高コントラストインジケータ230aは、ビデオにおいて極めて見やすく、スワブが正しい深さまでユーザの鼻孔又は口腔に挿入されたかどうかを決定できるように追跡することができる。幾つかのバリエーションにおいて、同じ又は異なる高コントラスト特徴の複数の高コントラストインジケータは、採取スワブ又は他のサンプル採取ツールの長さに沿って配置することができる。複数のこのような高コントラストインジケータは、例えば、それを採取するユーザのビデオにおけるスワブ挿入の深さを決定するために使用され、及び/又はサンプル採取技術を改善するためにユーザにガイダンスを提供してもよい(例えば、スワブをより深く挿入するようにユーザに指示する)。
2B-2D are schematic diagrams of variations of high contrast indicators. As shown in FIG. 2B, the
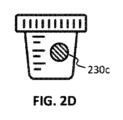
幾つかのバリエーションにおいて、サンプル採取ツールの機能的構成要素は、高コントラストインジケータを含むことができる。例えば、図2Cに示すように、サンプル採取容器(例えば、カップ、チューブ)は、容器キャップの形態で(又は容器に結合されて)高コントラストインジケータ230bを含むことができる。加えて又は代替的に、幾つかのバリエーションにおいて、高コントラストインジケータは、サンプル採取ツールの表面に結合されるステッカーを含むか、又は採取ツールの製造においてツール全体に対する色素又はツールの特定の領域もしくは構成要素に対する色素等として含まれる場合がある。インジケータは、可視光/カラー、赤外線、紫外線などを含む電磁スペクトルの任意の1又は2以上の領域に沿って高コントラストであってもよい。例えば、図2Dに示すように、サンプル採取容器(例えば、カップ、チューブ)は、サンプル採取容器の表面に貼られる高コントラストインジケータ230cのステッカーを含むことができる。このような高コントラストインジケータは、上述したものと同様に追跡されてもよく、ユーザが正しい手順でサンプルを取得したかどうかを判断するために、これらの位置及び/又は向きを分析することができる。
In some variations, the functional component of the sample collection tool can include a high contrast indicator. For example, as shown in FIG. 2C, a sample collection container (eg, cup, tube) can include a
幾つかのバリエーションにおいて、サンプル採取ツールの動きは、ユーザがサンプル採取手順を適切に行ったかどうかを判断するために、ユーザの顔(適切な顔認識アプローチを使用して検出されてもよい)及び/又はユーザの別の身体部分(例えば、指、手、腕など)に関して追跡することができる。加えて又は代替的に、形状認識及び/又は追跡は、深度カメラ(例えば、3D深度マッピングを有する赤外線カメラ)及び/又は他の適切なセンサ(例えば、近接センサ)を用いて行われ、サンプル採取ツールを識別及び/又は追跡し、同様に、ユーザがサンプル採取手順を適切に行ったかどうかを判定することができる。 In some variations, the movement of the sample collection tool is detected by the user's face (which may be detected using a suitable facial recognition approach) to determine whether the user has properly performed the sample collection procedure. /or may be tracked with respect to another body part of the user (eg, fingers, hands, arms, etc.). Additionally or alternatively, shape recognition and/or tracking may be performed using a depth camera (e.g. an infrared camera with 3D depth mapping) and/or other suitable sensors (e.g. a proximity sensor) and sample collection. Tools can be identified and/or tracked, as well as determining whether a user has properly performed a sample collection procedure.
(スキャン面)
上述したように、診断試験キット200は、コンピュータビジョンベースの分析のための支援として任意の適切な診断試験の背後に配置することができる1又は2以上のスキャン面220を含むことができる。スキャン面は、例えば、カード、トレイ、マット、台座、ハウジング、取扱説明書、又は診断試験を受け入れるように構成された任意の適切な物理的構造上に配置することができる。スキャン面は、紙、プラスチック、厚紙、又は他の適切な材料上に形成することができる。
(scan surface)
As mentioned above, the
図2Aに示すように、1又は2以上のスキャン面220は、画像化のためのスキャン面に対する診断試験の配置を示す試験配置ガイド222、及び/又は診断試験に関する1又は2以上の所定の試験結果を表す1又は2以上のコントロールマーキング224を含むことができる。以下に更に説明するように、コンピュータビジョン技術を支援するために、様々な他のフィデューシャルを追加的又は代替的に1又は2以上のスキャン面に含むことができる。
As shown in FIG. 2A, one or
スキャン面上の視覚的特徴(例えば、試験配置ガイド、空間マーカ、較正マーカ、コントロールマーキング、他のフィデューシャルなど)の何れも、スキャン面上又はスキャン面に適用されるデカール上に直接印刷又はその他の方法で適用することができる。例えば、視覚的特徴は、インク(例えば、カラーインク、黒色インク、蛍光インクなど)、塗料、及び/又はレーザージェットトナーなどで印刷することができる。一部又は全ての視覚的特徴が蛍光インクで印刷されるバリエーションにおいて、蛍光インクは、例えば、ユーロピウム、ローダミン、フルオレセイン、アレキサフルオロ、量子ドット、及び/又は蛍光性ナノ粒子を含むインクを含むことができる。蛍光インクでスキャン面に視覚的特徴を印刷することは、例えば、診断試験キットが、蛍光読み出し機構を使用する診断アッセイ(例えば、専用のリーダー機器を必要とする、蛍光粒子又は色素を有する製品)と互換性があることを可能にすることができる。幾つかのバリエーションにおいて、視覚的特徴は、デジタル印刷プロセス、版印刷プロセス、及び/又は他の適切な印刷プロセスで印刷することができる。 Any visual features on the scan surface (e.g., test placement guides, spatial markers, calibration markers, control markings, other fiducials, etc.) may be printed or printed directly on the scan surface or on decals applied to the scan surface. It can be applied in other ways. For example, the visual features can be printed with inks (eg, colored inks, black inks, fluorescent inks, etc.), paints, laser jet toners, and the like. In variations where some or all of the visual features are printed with fluorescent ink, the fluorescent ink may include, for example, ink containing europium, rhodamine, fluorescein, alexafluoro, quantum dots, and/or fluorescent nanoparticles. Can be done. Printing visual features on the scanning surface with fluorescent ink can be used, for example, in diagnostic test kits, diagnostic assays that use a fluorescent readout mechanism (e.g. products with fluorescent particles or dyes that require dedicated reader equipment) can be made compatible with In some variations, the visual features can be printed with a digital printing process, a plate printing process, and/or other suitable printing process.
(試験配置ガイド)
幾つかのバリエーションにおいて、スキャン面は、画像化及び分析のためにユーザが診断試験をどこに置くべきかという指示を提供する試験配置ガイドを含むことができる。試験配置ガイドは、診断試験の自動分析を支援するための1又は2以上の特徴部を含むことができる。
(Examination placement guide)
In some variations, the scan plane can include a test placement guide that provides instructions for where the user should place the diagnostic test for imaging and analysis. The test placement guide can include one or more features to support automated analysis of diagnostic tests.
図2Aの概略図に示すように、試験配置ガイド222は、画像化される診断試験に対して高コントラストである背景色を含むことができる。高コントラストの背景は、診断試験の外形がコンピュータビジョン技術によって確実に検出することを保証するのを助けることができる。例えば、多くの診断試験は白色である(例えば、白色のカセットハウジングの中にある)。従って、これら及び/又は他の明るい色の診断試験に対して、試験配置ガイド222は、診断試験と強く対比する暗い領域(例えば、黒又は暗い灰色)又は明るい色の領域(例えば、明るい緑又は明るい紫等)を含むことができる。
As shown in the schematic diagram of FIG. 2A,
対照的な背景の境界領域は、画像化することを意図した診断試験の境界領域よりも大きくてもよい(例えば、少なくとも0.1cm、約0.1cmと約5cmの間、約0.1cmと約1cmの間、約1cmと約2cmの間、約2cmと約5cmの間、又は任意の他の適切なマージン、或いは10%、20%、50%、又は任意の他の適切なマージンなどの試験長又は幅の任意の高い方の一定の割合である対照的背景のマージンを提供する)。しかしながら、背景領域は、イメージセンサのISO/露光時間調整に影響を与えないように制限されてもよい(例えば、背景に黒が多すぎると、イメージセンサによっては、ISOを高く調整することによって過補正を起こし、その結果、イメージングされた診断試験の幾つかのセクションで白色が飽和してしまうことがある)。画像化された診断試験が高コントラストの背景上に配置されると、輪郭検出などの技術によって診断試験の外形を画像内で特定することができる。このようにして、試験配置ガイド222内に適合する任意の診断試験の外形を決定することができる。言い換えれば、診断試験判定は、診断試験自体上の任意のカスタムマーキング又は他のフィデューシャルとは無関係に実行することができる。従って、スキャン面の高コントラストの背景は、有利には、より多様な診断試験をサポートするように、診断試験キットをより多用途にすることを可能にすることができる。
The border area of the contrasting background may be larger than the border area of the diagnostic test intended to be imaged (e.g., at least 0.1 cm, between about 0.1 cm and about 5 cm, between about 0.1 cm and between about 1 cm, between about 1 cm and about 2 cm, between about 2 cm and about 5 cm, or any other suitable margin, such as 10%, 20%, 50%, or any other suitable margin. (Providing a contrasting background margin that is a fixed percentage of the test length or width, whichever is higher). However, the background area may be limited so as not to affect the image sensor's ISO/exposure time adjustment (e.g., too much black in the background may be correction, which may result in white saturation in some sections of the imaged diagnostic test). When an imaged diagnostic test is placed on a high contrast background, techniques such as contour detection can identify the outline of the diagnostic test in the image. In this manner, any diagnostic test geometry that fits within
更に、幾つかのバリエーションにおいて、試験配置ガイド222は、ガイド222上への診断試験の配置を指示するための他のマーキング及び/又は他の特徴を含むことができる。例えば、幾つかのバリエーションにおいて、試験配置ガイド222は、テキスト(例えば、「ここに診断試験を置いて下さい」)、診断試験のグラフィック表現(例えば、線画)又はその境界、並びにスキャン面に対する診断試験の適切な位置及び/又は方向を示唆するための適切な記号(例えば、矢印)などを含むことができる。このような追加のガイダンスは、例えば、視覚的(例えば、スキャン面に直接印刷される、スキャン面に貼られたデカールに印刷されるなど)及び/又は質感的(例えば、くぼみ、隆起した特徴など)であってもよい。
Additionally, in some variations,
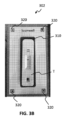
スキャン面300(例えば、スキャンカード)のバリエーションを図3Aに示す。図3Aに示すように、スキャン面300は、試験配置ガイド310上に配置される明るい色の診断試験に対して高コントラストとなるように構成された暗い色の背景を含む試験配置ガイド310を含む。試験配置ガイド310はまた、スキャン面に対するカセットの適切な向きを示唆するための指示テキスト(「カセットをここに置いて下さい」)及びラテラルフローアッセイ試験カセットのグラフ表示を含む。例えば、図3Aに示されるグラフ表現は、そのサンプル取入口(短いラインとして描かれている)がスキャン面300の下縁に向けられ、その試験領域(長いラインとして描かれている)がスキャン面300の上縁に向けられたカセットの外形を含む。従って、試験配置ガイド310は、図3Bに示される診断試験(T)と同様の方法で診断試験カセットを方向付ける示唆を含んでいる。
A variation of a scan surface 300 (eg, a scan card) is shown in FIG. 3A. As shown in FIG. 3A, the
(空間マーカ)
幾つかのバリエーションにおいて、スキャン面は、画像における診断試験及び/又は試験領域(試験結果を表示する診断試験の領域)の空間的な位置決め及び/又は識別を容易にするように機能する1又は2以上の空間マーカを含むことができる。幾つかのバリエーションにおいて、空間マーカは、画像における診断試験の境界を定める配置で、試験配置ガイド(すなわち、診断試験を受けると予想されるスキャン面の領域)内及び/又はその周辺に配置することができる。空間マーカを識別することによって、診断試験の周りのこの境界を識別することができ、これにより、画像の背景からの干渉なしに更なる分析のために診断試験を分離するための画像のクロッピングを可能にすることができる。例えば、スキャン面は、境界領域の頂点を形成する少なくとも3つの空間マーカを含むことができる。一般に、空間マーカは、ArUcoマーカ、QRコード(登録商標)マーカ、他のコンピュータ可読マーカ、又は十分に対照的な視覚特性を有するカスタムマーカなど、任意の適切なフィデューシャルを含むことができる。画像分析中の空間マーカの使用に関する追加の詳細は、以下で更に詳細に説明される。
(spatial marker)
In some variations, the scan plane functions to facilitate spatial positioning and/or identification of the diagnostic test and/or test area (the area of the diagnostic test that displays the test results) in the image. The above spatial markers can be included. In some variations, the spatial marker is placed within and/or around the test placement guide (i.e., the area of the scan plane expected to receive the diagnostic test) in a location that delimits the diagnostic test in the image. I can do it. By identifying spatial markers, this boundary around the diagnostic test can be identified, which allows cropping of the image to separate the diagnostic test for further analysis without interference from the image background. can be made possible. For example, the scan plane can include at least three spatial markers that form the vertices of the bounding region. In general, spatial markers may include any suitable fiducials, such as ArUco markers, QR code markers, other computer readable markers, or custom markers with sufficiently contrasting visual characteristics. Additional details regarding the use of spatial markers during image analysis are discussed in further detail below.
図3Aに描かれた例に示すように、スキャン面300は、試験配置ガイド310の周りの境界のある矩形領域のコーナーに配置された4つの空間マーカ320を含むことができる。幾つかのバリエーションにおいて、このような空間マーカのうちの3つは、矩形領域の幅及び長さを定義することによって、境界を定められた矩形領域を定義するのに十分とすることができる。スキャン面300は、図3Aにおいて、画像のラフクロップ(切り抜き)のためのガイダンスを提供する矩形境界を形成する4つの空間マーカを含むものとして描かれているが、他のバリエーションにおいて、スキャン面は、任意の適切な形状(例えば、3つのマーカ、5つのマーカ、6つのマーカ等)を形成する任意の適切な数の空間マーカを含むことができることは理解される。更に、図3Aに示すスキャン面300は、空間マーカとして機能するArUcoマーカを含むが、他のバリエーションにおいて、空間マーカは任意の適切な形状を有することができることを理解されたい。例えば、図3Bでは、スキャン面302の空間マーカがArUcoマーカの代わりにQRマーカであることを除いて、図3Aに描かれたスキャン面300と同様であるスキャン面302のバリエーションが描かれている。
As shown in the example depicted in FIG. 3A, the
(較正マーカ)
幾つかのバリエーションにおいて、スキャン面は、較正又は他の参照用の他の適切なマーカを含むことができる。例えば、スキャン面は、正確な試験結果の判読を妨げる可能性のある照明条件の影響を低減するように、画像センサによる自動色補正(例えば、ホワイトバランス)のための基準として機能することができる標準色及び/又はグレースケールマークを含むことができる。加えて又は代替的に、かかる色較正マーカは、診断試験を受けるためのスキャン面とは別の面など、任意の適切な面に現れてもよい。例えば、色較正マーカは、スキャン面上で診断試験を画像化する前に、別個に参照することができる別個の較正カード上に存在することができる。
(calibration marker)
In some variations, the scan plane can include other suitable markers for calibration or other reference. For example, the scan plane can serve as a reference for automatic color correction (e.g., white balance) by the image sensor to reduce the effects of lighting conditions that can interfere with accurate interpretation of test results. Standard color and/or gray scale markings may be included. Additionally or alternatively, such color calibration markers may appear on any suitable surface, such as a surface other than the scan surface for undergoing diagnostic tests. For example, color calibration markers can be present on a separate calibration card that can be referenced separately before imaging the diagnostic test on the scan plane.
加えて又は代替的に、スキャン面は、アッセイ上の診断試験の所定の幾何学的形状及び向きを示すように機能することができるアライメントマーカを含むことができる。このようなアライメントマーカは、例えば、上述したように、及び/又は上述した図3Aに示すように、試験配置ガイド222上のマーキングと同様であってよい。
Additionally or alternatively, the scan plane can include alignment markers that can function to indicate the predetermined geometry and orientation of the diagnostic test on the assay. Such alignment markers may be similar to the markings on
(コントロールマーキング)
図2Aに示すように、幾つかのバリエーションにおいて、スキャン面220は、診断試験に関する1又は2以上の所定の試験結果を表す1又は2以上のコントロールマーキング224を含むことができる。例えば、コントロールマーキングは、診断試験における試験結果及び/又は診断試験コントロールマーキングの予想される形状、色、太さ、及び/又は強度に対応する特定の色、太さ、及び/又は強度を有する形状を含むことができる。幾つかのバリエーションにおいて、コントロールマーキング224は、診断試験の検出又は定量の下限(又は下限付近)に対応する少なくとも1つのマーキングを含むことができる。
(control marking)
As shown in FIG. 2A, in some variations, scan
コントロールマーキング224は、カメラが、かすかに見えるフィデューシャルを含む試験結果を示すフィデューシャルの検出を可能にする適切な品質の画像を生成することができることを保証するために機能することができる。例えば、コントロールマーキング224は、カメラが十分な解像度、十分なイメージセンサ品質、及び/又は十分なオートフォーカス、自動露出、及び/又は色/ホワイトバランス設定及び/又は能力を有することを保証するのを助けるのに使用することができる。1又は2以上のコントロールマーキング224の各々が、診断試験プラットフォームのコンピュータビジョン技術によってコントロールマーキングの画像で検出される場合、プラットフォームは、陽性及び微陽性結果を含む診断試験の試験結果を正しく判読する能力がある。
The
コントロールマーキングの外観は、コントロールマーキングが関連する診断試験のタイプに応じて変化することができる。例えば、ラテラルフローイムノアッセイ試験などの診断試験の場合、コントロールマーキング224は、一組のラインを含むことができる。図2Aの概略図に示すように、ラインは、太さ、色、反射率、及び/又は色相(例えば、暗さ)が異なってもよく、ラインの少なくとも幾つかは、ラテラルフローイムノアッセイ試験上に現れる予想されるコントロールライン及び/又は試験結果ラインとサイズ、形状、及び/又は色が類似していてもよい。例えば、幾つかのバリエーションにおいて、印刷されたコントロールは、黒又はグレーのライン(例えば、グレースケールで強度が変化する)を含むことができる。別の例として、幾つかのバリエーションにおいて、印刷されたコントロールは、様々な色(例えば、赤、青、緑など)のラインを含むことができる。ラインの各々がコンピュータビジョン技術によって検出される場合、コンピュータビジョン技術は、診断試験の画像における試験結果を正しく判読することができる。 The appearance of control markings can vary depending on the type of diagnostic test to which they are associated. For example, for a diagnostic test such as a lateral flow immunoassay test, control marking 224 may include a set of lines. As shown in the schematic diagram of FIG. 2A, the lines may differ in thickness, color, reflectance, and/or hue (e.g., darkness), and at least some of the lines are visible on the lateral flow immunoassay test. It may be similar in size, shape, and/or color to the expected control line and/or test result line that appears. For example, in some variations, a printed control can include a black or gray line (eg, varying in intensity in a gray scale). As another example, in some variations, a printed control can include lines of different colors (eg, red, blue, green, etc.). If each of the lines is detected by the computer vision technique, the computer vision technique can correctly interpret the test results in the image of the diagnostic test.
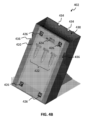
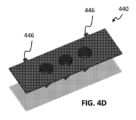
別の例として、比色イムノアッセイ試験などの診断試験の場合、1又は2以上のコントロールマーキングは、着色されたマーキングのセットを含むことができる。図4Bに示すように、例えば、スキャン面420は、着色されたボックスを含む一連のコントロールマーキング424を含むことができる。上述したのと同様に、各ボックスの色は、診断試験に関する所定の試験結果(例えば、陽性又は陰性診断試験、ポジティブコントロール、ネガティブコントロールなど)を表すものであってもよい。加えて又は代替的に、コントロールマーキングは、黒又はグレーのボックス(例えば、グレースケールで強度が変化する)を含むことができる。着色されたボックス、黒色のボックス、及び/又は灰色のボックスのそれぞれがコンピュータビジョン技術によって検出される場合、コンピュータビジョン技術は、診断試験の画像における試験結果を正しく判読することができる。
As another example, for diagnostic tests such as colorimetric immunoassay tests, the one or more control markings can include a set of colored markings. As shown in FIG. 4B, for example, scan
図2A及び図4Bに示すように、幾つかのバリエーションにおいて、コントロールマーキングは、アレイ(例えば、1Dアレイ、2Dアレイ)に配置された幾何学的形状を含むことができるが、コントロールマーキングは、任意の適切なデザインの一部として適切なコントロールマーキングを組み込んでよいことが理解される。例えば、コントロールマーキングは、適切なグラフィックデザイン(例えば、波、家、木、単純なラインなどのグラフィックアイコン)において芸術的に配置されてもよく、これは、診断試験キットのより審美的に好ましいデザインに寄与することができる。 As shown in FIGS. 2A and 4B, in some variations, the control markings can include geometric shapes arranged in an array (e.g., 1D array, 2D array); however, the control markings can include any It is understood that appropriate control markings may be incorporated as part of the appropriate design of the device. For example, the control markings may be placed artistically in a suitable graphic design (e.g. graphic icons such as waves, houses, trees, simple lines, etc.), which makes the design of the diagnostic test kit more aesthetically pleasing. can contribute to
上述したようなスキャン面の他の視覚的特徴と同様に、コントロールマーキングは、カード、紙、マット、トレイ、ハウジング(例えば、箱)、及び/又は他の適切な表面上に印刷することができる。幾つかのバリエーションにおいて、コントロールマーキングは、診断試験及びコントロールマーキングが診断試験を画像化するカメラ(共に画像化される)の同じ視野内にあるように、スキャン面上の試験配置ガイドに近接して(例えば、隣接して)配置することができる。幾つかのバリエーションにおいて、コントロールマーキングは診断試験を画像化するのとは別に(例えば、その前に)画像化されることがあるので、コントロールマーキングの一部又は全部は診断試験を受ける構成要素とは別の構成要素に配置することができる。診断試験を画像化する前にコントロールマーキングを分析することは、例えば、ユーザが診断試験を消費する前に特定のカメラ装置が適切であるかどうかを判断することを可能にし、それにより、ユーザの意図するカメラ装置が分析のために適切な品質の画像を得ることができない場合に診断試験の無駄を回避することを可能にすることができる。カメラの品質を確認するためのコントロールマーキングの使用に関するその他の詳細については、以下で更に説明する。 As well as other visual features of the scanning surface as described above, control markings can be printed on cards, paper, mats, trays, housings (e.g. boxes), and/or other suitable surfaces. . In some variations, the control markings are placed in close proximity to the test placement guide on the scan plane such that the diagnostic test and control markings are within the same field of view of the camera that images the diagnostic test (both are imaged). (e.g., adjacent). In some variations, the control markings may be imaged separately from (e.g., prior to) imaging the diagnostic test so that some or all of the control markings may be associated with the component undergoing the diagnostic test. can be placed in another component. Analyzing control markings before imaging a diagnostic test can, for example, allow a user to determine whether a particular camera device is suitable before consuming the diagnostic test, thereby allowing the user to It may be possible to avoid waste of diagnostic tests if the intended camera device is unable to obtain images of suitable quality for analysis. Additional details regarding the use of control markings to verify camera quality are discussed further below.
(符号化された情報)
幾つかのバリエーションにおいて、診断試験キットは、診断試験キット及び/又はその構成要素の容易且つ信頼できる識別及び/又はトレーサビリティのための1又は2以上のコンピュータ可読コードを含むことができる。例えば、診断試験キットは、有効期限、製品SKU、ロット番号、及び/又は同様のものなど、診断試験キットに関連する情報をコード化するQRコード、バーコード、及び/又は他の適切なマーキングを含むことができる。加えて又は代替的に、コンピュータ可読コードは、通信ソフトウェア(例えば、モバイルコンピュータデバイス上で実行されるモバイルアプリケーション内)に、試験結果及び/又は任意の関連メタデータ(例えば、名前、診断試験の日付/時間、校正又は画像品質管理に関する情報等)を、特定のサーバ、クラウドサービス、電子メールアドレス、携帯番号等、特定の指定宛先に送信するように指示するルーティング情報を符号化することができる。
(encoded information)
In some variations, a diagnostic test kit can include one or more computer readable codes for easy and reliable identification and/or traceability of the diagnostic test kit and/or its components. For example, a diagnostic test kit may include a QR code, bar code, and/or other suitable markings that encode information related to the diagnostic test kit, such as expiration date, product SKU, lot number, and/or the like. can be included. Additionally or alternatively, the computer readable code may be configured to communicate test results and/or any associated metadata (e.g., name, date of diagnostic test) to communication software (e.g., within a mobile application running on a mobile computing device). Routing information can be encoded that directs the information to be sent to a particular designated destination, such as a particular server, cloud service, email address, mobile number, etc.).
幾つかのバリエーションにおいて、1又は2以上のこのようなコンピュータ可読コードは、スキャン面上に印刷されるか又は他の方法で配置されてもよく、スキャン面上の診断試験及び/又は他のマーキングと同じ視野にあるように、試験配置ガイドに近接することができる。或いは、1又は2以上のコンピュータ読み取り可能なコードは、別のスキャン面(例えば、後述のハウジング、別の取扱説明書など)上にあってもよい。 In some variations, one or more such computer readable codes may be printed or otherwise placed on the scan surface, and may be used for diagnostic tests and/or other markings on the scan surface. can be close to the test placement guide so that it is in the same field of view as the patient. Alternatively, the one or more computer readable codes may be on another scanning surface (eg, a housing, another instruction manual, etc., as described below).
(色基準)
加えて又は代替的に、幾つかのバリエーションにおいて、スキャン面は、比色診断試験の試験結果を分析する際に使用するための例示的な色を含む色基準アレイ又は他のパターンを含むことができる。例えば、色基準アレイは、それぞれが特定の試験結果に対応し、特定の試験結果(例えば、分析物濃度)を有するアッセイの色を評価するためのものであってもよい色ブロック又は他のアイコンの群を含むことができる。色基準配列は、グリッド、芸術的な配列、又は任意の適切なパターンで配置された色付きアイコンを含むことができる。幾つかのバリエーションにおいて、上記のようなコントロールマーキングは、試験分析の目的のために色基準アレイとして追加的に機能することができる。追加的又は代替的に、色基準アレイは、米国特許第8,655,009号及び第8,911,679号に記載されているものと同様であってよく、この各々は、引用により本明細書に組み込まれる。
(color standard)
Additionally or alternatively, in some variations, the scanning surface may include a color reference array or other pattern containing exemplary colors for use in analyzing test results of a colorimetric diagnostic test. can. For example, the color reference array may include color blocks or other icons, each corresponding to a particular test result, and which may be for evaluating the color of an assay with a particular test result (e.g., analyte concentration). can include a group of The color reference array may include colored icons arranged in a grid, an artistic arrangement, or any suitable pattern. In some variations, control markings as described above can additionally serve as a color reference array for test analysis purposes. Additionally or alternatively, the color reference array may be similar to that described in U.S. Patent Nos. 8,655,009 and 8,911,679, each of which is incorporated herein by reference. incorporated into the book.
(ハウジング)
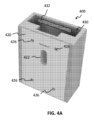
幾つかのバリエーションにおいて、診断試験キットは、ハウジングを含むことができる。例えば、図4Aに示すように、幾つかのバリエーションにおいて、診断試験キットは、1又は2以上の診断試験キット構成要素を受け入れることができる少なくとも1つのコンパートメント430を含むハウジング400を含むことができる。幾つかのバリエーションにおいて、ハウジングは、プラスチック製の筐体又はカセットを欠いている診断試験に有用である場合がある。コンパートメント430は、例えば、サンプル採取及び/又はサンプル操作のための1又は2以上のツール(例えば、スワブ、カップ、チューブ、遠心分離管、毛細管、使い捨てピペット、他のサンプル容器、試験ストリップ、注射器、針、注射器フィルタ、アルコールワイプ、試薬など)などの構成要素を格納するように構成することができる。幾つかのバリエーションにおいて、構成要素は、トレイ(例えば、構成要素に対応する形状の空洞を有する射出成形トレイ)、箱、及び/又は区画430内の任意の適切な方法で整理することができる。構成要素は、試験プロセス中に使用するために取り出することができる。
(housing)
In some variations, the diagnostic test kit can include a housing. For example, as shown in FIG. 4A, in some variations, a diagnostic test kit can include a
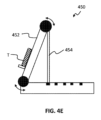
加えて又は代替的に、幾つかのバリエーションにおいて、ハウジングは、上述したスキャン面と同様のスキャン面420を含んでもよく、ハウジングは、アッセイスタンドとして機能することができる。例えば、図4A及び図4Bに示すように、スキャン面420は、コンピュータビジョン技術がスキャン面420に対して配置される診断試験を見つけるのを助ける高コントラスト背景、空間マーカ426、及び/又は他の適切な校正マーカを含むことができる。更に、図4Bに示すように、スキャン面420は、上述したように、1又は2以上のコントロールマーカ424を含むことができる。幾つかのバリエーションにおいて、図4Bに示すように、スキャン面420は、(例えば、ハウジングの幾何学的形状、図4Eに示すようなアッセイスタンドのためのキックスタンドを備えたハウジングの向きなどに起因して)上方に傾斜しているか又は角度を付けられてもよく、これは、スキャン面420上の診断試験の照明を改善し、影を回避することができる。幾つかのバリエーションにおいて、角度は固定されてもよく、幾つかのバリエーションにおいて、角度は、調整可能なキックスタンドのように、調整可能であってもよい。
Additionally or alternatively, in some variations, the housing may include a
しかしながら、図4A及び図4Bに示すスキャン面420は、分析のための診断試験を受け入れるように構成された少なくとも1つのレセプタクル(例えば、カットアウト又はくぼみ)を含む試験配置ガイド422を含むことができる。例えば、レセプタクルは、診断試験(例えば、カセット、サンプル容器など)を収容する形状及び大きさであってもよい。更に、あるバリエーションにおいて、レセプタクルは、(以下で更に詳細に説明するように)加熱デバイスが区画430内に配置されるバリエーションにおいて、熱が加熱デバイスから共有壁を越えて試験配置ガイド422内に配置された診断試験に伝達することができるように区画430と壁(又は膜等)を共有することができる。診断試験は、スキャン面420の所定位置に保持されるように、スナップフィット、接着剤などの機械的インターフィットを介してレセプタクル内に固定することができる。試験配置ガイド422は、図4Aに示すような単一のレセプタクルを含んでもよく、又は図4Bに示すような複数のレセプタクルを含むことができる。例えば、図4Bに示される試験配置ガイド422は、ポジティブコントロール、ネガティブコントロール、及び試験結果を提供する容器を受け入れるための3つのレセプタクルを含むことができる。しかしながら、他のバリエーションにおいて、試験配置ガイド422は、任意の適切な形状の任意の適切な数のレセプタクル(例えば、円錐サンプル管、ピペット、キャピラリー管、キュベットなどを受けるための)を含むことができることを理解されたい。加えて又は代替的に、キュベットホルダー等の構成要素のためのマウントポイントを提供するように、ハウジングの側面又は他の適切な表面に他の切り込み(例えば、ノッチ436)又は他の適切なマウント特徴を形成することができる。
However, the
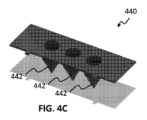
ハウジングは、幾つかのバリエーションにおいて、コンパートメントを覆うための、及び/又はハウジングを囲むためのカバーを含むことができる。例えば、図4C及び4Dは、図4Bに描かれたハウジング402のようなハウジングに結合することができるハウジングカバー440の例示的な変形を描いている。ハウジングカバー440は、ハウジング402上のアライメント特徴434と係合するように構成される1又は2以上のアライメント特徴446を含んでもよく、これはハウジング402上にハウジングカバー440を方向付け及び/又は固定するのを助けることができる。幾つかのバリエーションにおいて、ハウジングカバー440は、診断試験構成要素(例えば、反応混合物用のコニカルチューブなど)を受けるための1又は2以上のレセプタクル442を含むことができる。これらのレセプタクル442の位置は、例えば、コンパートメント430内の加熱デバイス(以下に更に詳細に説明する)からの熱がレセプタクル442内の物品を温めるために使用されるバリエーションにおいて有利であり得る。幾つかのバリエーションにおいて、レセプタクル442は、サンプル容器(例えば、ポジティブコントロール、ネガティブコントロール、試験結果)を所定時間(例えば、30秒)温めるために使用されてもよく、その後、温められた容器がスキャン面420などの画像化領域に移すことができる。
The housing can, in some variations, include a cover to cover the compartment and/or to surround the housing. For example, FIGS. 4C and 4D depict exemplary variations of a
ハウジングは、任意の様々な好適な態様で作られてもよい。例えば、ハウジングは、射出成形、3Dプリント、フライス加工、折り畳み、及び/又は任意の適切なプロセスで形成することができる。ハウジングは、プラスチック、紙(例えば、ワックスペーパー)、厚紙、金属などの任意の適切な材料を含むことができる。 The housing may be made in any of a variety of suitable manners. For example, the housing can be formed by injection molding, 3D printing, milling, folding, and/or any suitable process. The housing can include any suitable material, such as plastic, paper (eg, wax paper), cardboard, metal, etc.
(加熱デバイス)
幾つかのバリエーションにおいて、診断試験キットは、加熱デバイスを含むことができる。多くの診断試験は等温増幅ステップを利用し、そのために加熱デバイスは熱を提供することができる。図4Aに概略的に示すように、加熱デバイス432は、ハウジング内及び/又はハウジングの周囲の1又は2以上のレセプタクルに置かれたアイテムを温めるように、ハウジングの区画430に配置することができる。例えば、区画430に配置された場合、加熱デバイスは、スキャン面420及び/又はハウジングカバー440上の診断試験(診断試験サンプル、コントロールなどを含む)を温めるように構成することができる。しかしながら、1又は2以上の加熱デバイスは、任意の適切な場所(例えば、前面、背面、底面、側面などのハウジングの外面)に配置することができる。更に、幾つかのバリエーションにおいて、加熱デバイスは、試験サンプルを温めるために構成されたスタンドアロン構造など、ハウジングから分離されていてもよい。
(heating device)
In some variations, the diagnostic test kit can include a heating device. Many diagnostic tests utilize isothermal amplification steps, for which heating devices can provide heat. As shown schematically in FIG. 4A, a
加熱デバイス432がハウジングの区画430内にある幾つかのバリエーションにおいて、ハウジングは、加熱デバイス432と診断デバイス及び/又は加温用の他の容器との間の熱伝達を強化するための特徴を含むことができる。例えば、ハウジングは、加熱デバイスと診断デバイスとの間の表面積の接触を最大化するように構成されたチャンネル又は空洞を含むことができる。別の例として、ハウジングは、加熱デバイスと暖めるための所望の場所との間の熱の導管として機能するように、熱伝導性材料(例えば、アルミニウム又は他の伝導性材料)を追加的又は代替的に含むことができる。
In some variations in which
加熱デバイスは、任意の適切な種類の加熱機構を含むことができる。例えば、加熱デバイスは、水活性化生石灰ヒーター、空気活性化ヒーター(例えば、セルロース、鉄、活性炭、又は空気への曝露時に発熱反応から熱を生成する他の適切な物質を有する)、電気ヒーター、又は他の化学ヒーターを含むことができる。幾つかのバリエーションにおいて、加熱デバイスは、LAMP、ローリングサークル増幅、NEAR、オタマジャクシ及び他の等温増幅反応と共に使用するために、約65℃を超える温度に達することができる。この加熱デバイスは、追加的又は代替的に、幾つかの診断試験に不可欠な細胞溶解及び/又は他の加熱ステップを実行するのに使用することができる。 The heating device may include any suitable type of heating mechanism. For example, the heating device may include a water-activated quicklime heater, an air-activated heater (e.g., having cellulose, iron, activated carbon, or other suitable material that produces heat from an exothermic reaction upon exposure to air), an electric heater, or other chemical heaters. In some variations, the heating device can reach temperatures above about 65° C. for use with LAMP, rolling circle amplification, NEAR, tadpole, and other isothermal amplification reactions. This heating device can additionally or alternatively be used to perform cell lysis and/or other heating steps essential for some diagnostic tests.
(その他のイメージング支援)
(アッセイスタンド)
幾つかのバリエーションにおいて、診断試験キットは、診断試験の照明を改善し、診断試験のより良い画像を達成するために、スキャン面及び診断試験を適切な角度で方向付けるように構成されたスタンドを追加的又は代替的に含むことができる。アッセイスタンドは、アッセイスタンドがハウジング区画を省略してもよいことを除いて、図4Bに関して上述した角度付きハウジング402と同様であってよい。幾つかのバリエーションにおいて、スタンドは、プラスチック製の筐体又はカセットを欠いている診断試験に有用である場合がある。図4Eの例示的な概略図に示すように、アッセイスタンド450は、例えば、診断試験(T)を受け入れるための、上述したものと同様のスキャン面(例えば、アライメントマーカを有する)を含むことができるトレイ又は他のホルダー352を含むことができる。スタンドは、診断試験上の照明の均質性を向上させるために、診断試験を上向きに角度を付け、及び/又はアッセイに向かって周囲光を上向きに反射するように構成することができる。例えば、スタンドは、約10°と約80°の間、約25°と約65°の間、約35°と約55°の間、又は約45°等の角度で診断試験を傾斜させるように構成することができる。スキャン面は、スタンドの角度の付いた面、及び/又は水平面に対するスタンドの角度に起因して角度を付けられてもよい。角度は、静的な角度の付いたブラケットや他の構造などで固定することができる。或いは、角度は、角度の付いたキックスタンド(例えば、図4Eに示されるキックスタンド454として)のように、調整可能であってもよい。
(Other imaging support)
(assay stand)
In some variations, the diagnostic test kit includes a stand configured to orient the scanning surface and the diagnostic test at an appropriate angle to improve illumination of the diagnostic test and achieve better imaging of the diagnostic test. may additionally or alternatively be included. The assay stand may be similar to the
(蛍光関連アクセサリ)
幾つかのバリエーションにおいて、診断試験キットは、イメージングをサポートするための蛍光関連アクセサリを含むことができる。例えば、診断試験キットは、蛍光読み出し機構(例えば、蛍光粒子又は色素を有する製品)を使用する診断試験に適合するためのアクセサリを含むことができる。幾つかのバリエーションにおいて、診断試験キットは、診断試験において蛍光粒子又は色素を励起するための1又は2以上の励起光源(例えば、紫外線(UV)光源)を含むことができる。加えて又は代替的に、診断試験キットは、診断試験分析目的のために、診断試験キットから放出される蛍光光の画像化を容易にするために、画像化中に診断試験とカメラとの間に配置するための、1又は2以上の適切なUVフィルタを含むことができる。
(Fluorescence related accessories)
In some variations, the diagnostic test kit can include fluorescence-related accessories to support imaging. For example, a diagnostic test kit can include accessories for adapting diagnostic tests that use fluorescent readout mechanisms (eg, products with fluorescent particles or dyes). In some variations, a diagnostic test kit can include one or more excitation light sources (eg, ultraviolet (UV) light sources) for exciting fluorescent particles or dyes in a diagnostic test. Additionally or alternatively, the diagnostic test kit may be configured to include a sensor between the diagnostic test and the camera during imaging to facilitate imaging of fluorescent light emitted from the diagnostic test kit for diagnostic test analysis purposes. may include one or more suitable UV filters for placement.
診断試験キットのバリエーションは、本明細書に記載された構成要素の任意の適切な組み合わせを含むことができることを理解されたい。更に、幾つかのバリエーションにおいて、診断試験キットの特定の構成要素は再使用可能であり(例えば、アッセイスタンド、蛍光関連アクセサリ)、複数の使い捨て構成要素(例えば、複数の診断試験)と共に繰り返し使用することができる。或いは、幾つかのバリエーションにおいて、診断試験キットの全ての構成要素は、単回使用用に指定することができる。 It is to be understood that variations of diagnostic test kits can include any suitable combination of components described herein. Additionally, in some variations, certain components of the diagnostic test kit are reusable (e.g., assay stands, fluorescence-related accessories) and used repeatedly with multiple disposable components (e.g., multiple diagnostic tests). be able to. Alternatively, in some variations, all components of the diagnostic test kit can be designated for single use.
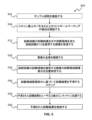
(診断試験の分析方法)
図5に示すように、診断試験を分析する方法500は、1又は2以上のプロセッサにおいて、診断試験が試験結果を示す試験領域を含む診断試験510を描写する画像を受信するステップ510と、画像の品質を確認するステップ520と、診断試験の試験領域を描写する画像の試験領域画像部分を位置特定するステップ530と、試験領域画像部分に基づいて試験結果を予測するステップ540と、を含むことができる。更に、幾つかのバリエーションにおいて、方法500は、予測された試験結果をユーザ又は他のエンティティに伝達するステップ550、及び/又は予測された試験結果を(例えば、ユーザの電子健康記録、診断プラットフォームと関連付けられたユーザアカウント等)格納するステップ560を更に含むことができる。幾つかのバリエーションにおいて、方法は、図2B~2Dを参照して上述したような技術を使用して、サンプル採取を(試験結果を決定するための画像分析の前、間、又は後に)検証するステップ502を含むことができる。更に、幾つかのバリエーションにおいて、方法は、スキャン面上の1又は2以上のコントロールマーキングの検出を検証するステップ504を含んでもよく、これは、例えば、診断試験分析のための画像を得るために使用されるカメラ品質を評価するために使用することができる。
(Analysis method of diagnostic test)
As shown in FIG. 5, a
幾つかのバリエーションにおいて、方法500は、上述したような診断試験キット(又はその構成要素)と共に使用することができる。方法500は、モバイルコンピュータデバイス(例えば、コンピュータデバイス上で実行され、診断プラットフォームと関連付けられるモバイルアプリケーション)上などのローカルで、及び/又はサーバ(例えば、クラウドサーバ)上などのリモートで実行することができる。
In some variations,
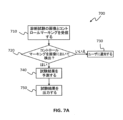
(コントロールマーキングの検出の検証)
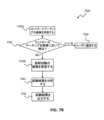
幾つかのバリエーションにおいて、本方法は、分析のため診断試験の画像を取得するのに使用されるカメラ及び/又は画像センサ(及び/又は画像化条件)の品質を評価するステップを含むことができる。例えば、図7Aに示すように、診断試験の分析を容易にするための方法700は、診断試験の画像と1又は2以上のコントロールマーキングを受信するステップを含むことができる(710)。コントロールマーキングは、上記で更に詳細に説明したように、診断試験に関する1又は2以上の所定の試験結果を表す適切なマーキングを含むことができる。コンピュータビジョン技術は、コントロールマーキングの全て(又は十分な部分)が画像において検出することができるか否か(720)を評価することができる。コントロールマーキングの全てが画像内で検出されない場合、ユーザにエラーを通知することができる(730)。例えば、異なるカメラを試すこと、1又は2以上のカメラ設定を変更すること、1又は2以上の環境要因を調整すること、又はこれらの任意の組み合わせ等の提案をユーザに提供することができる。コントロールマーキングが画像内で検出された場合、画像を更に分析して試験結果を予測することができ(740)、試験結果は、以下に説明するような出力又は他の方法で通信することができる(750)。
(Verification of control marking detection)
In some variations, the method can include evaluating the quality of the camera and/or image sensor (and/or imaging conditions) used to obtain images of the diagnostic test for analysis. . For example, as shown in FIG. 7A, a
図7Aに描かれた方法700は、診断試験及びコントロールマーキングの両方を含む画像を利用するが、幾つかのバリエーションにおいて、別々の画像がこの情報を提供することができる。例えば、図7Bに示すように、診断試験の分析を容易にするための方法700’は、1又は2以上のコントロールマーキングの第1の画像を受信すること(710a)を含んでもよく、コンピュータビジョン技術は、コントロールマーキングの全て又は十分な部分が第1の画像において検出することができるかどうかを評価することができる(720)。コントロールマーキングの全てが画像内で検出されない場合、上述したように、ユーザにエラーが通知されてもよい(730)。コントロールマーキングが画像内で検出される場合、ユーザは、診断試験を描写する第2の画像を撮影するように促されてもよい(710b)。そして、第2の画像を更に分析して試験結果を予測し(740)、出力等して伝達してもよい(750)。
Although the
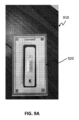
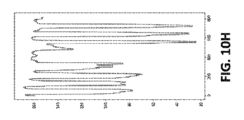
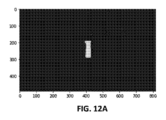
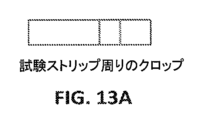
図8Aは、複数の印刷されたコントロールマーキング810を含むスキャン面上の1又は2以上のコントロールマーキングの検出を検証するバリエーションを示す。具体的には、図8Aは、反射率の異なる9本のラインのセットを含むコントロールマーキング810を有するスキャンカードの画像を描写している。この9本のラインは、微弱な陽性から強い陽性までのラテラルフローイムノアッセイにおける試験結果を表すものと考えることができる。画像を分析する際に、例えば、適切な画像領域820の何れかの側にあることが知られているフィデューシャル(例えば、ArUcoマーカ)を識別することに基づいて、境界のある画像領域820が印刷されたコントロールマーキング810を含むものとして識別することができる。フィデューシャルは、OpenCV及び/又は類似のコンピュータビジョンソフトウェアパッケージの組み込み機能などの適切なコンピュータビジョン技術で識別することができる。画像領域820はクロッピングすることができ、その画素は画素値の1次元配列に凝縮されてもよく、1次元配列の各要素は、画像領域820内の画像セグメント(例えば、画素の行又は列)の代表指標(例えば、平均、中央値、他の統計指標など)を含むことができる。この1次元配列の要素の相対値は、一連のピークを決定するために分析されてもよく、その各々は、それぞれのコントロールマーキングに潜在的に対応すると考えられてもよい。幾つかのバリエーションにおいて、コントロールマーキングの領域内の白色空間は、システムが白色空間においてピークが検出されないことを期待すべきであるという点で、ネガティブコントロールとして使用することができる。識別されたピークの結果のカウントは、受け入れられた所定の値(例えば、コントロールラインの既知の数)と比較することができる。ピークカウントが、受け入れられた所定値に十分に類似している(例えば、少なくとも受け入れられた閾値である、又は閾値のある範囲内に入る)場合、コントロールマーキングの画像を撮影するために使用されるカメラ及び/又は撮影条件は、十分な品質であり得る。図8Aの例では、画像領域820に対する1Dアレイの分析は、9つのピークのカウントをもたらし、これは、スキャンカード上のコントロールライン810の予め定められた既知の数と一致する。従って、図8Aは、画像領域820で特定されたピークに基づいてコントロールチェックが合格し、その後の画像分析が進められる状況を表している。 FIG. 8A shows a variation that verifies the detection of one or more control markings on a scan surface that includes a plurality of printed control markings 810. Specifically, FIG. 8A depicts an image of a scan card having a control marking 810 that includes a set of nine lines of varying reflectivity. These nine lines can be considered to represent test results in the lateral flow immunoassay ranging from weakly positive to strongly positive. When analyzing the image, a bounded image region 820 is created, e.g., based on identifying fiducials (e.g., ArUco markers) that are known to be on either side of the relevant image region 820. It can be identified as including a control marking 810 printed with . Fiducials may be identified with suitable computer vision techniques, such as the built-in functionality of OpenCV and/or similar computer vision software packages. Image region 820 may be cropped and its pixels may be condensed into a one-dimensional array of pixel values, where each element of the one-dimensional array represents an image segment (e.g., a row or column of pixels) within image region 820. may include representative metrics (e.g., mean, median, other statistical metrics, etc.). The relative values of the elements of this one-dimensional array may be analyzed to determine a series of peaks, each of which may be considered to potentially correspond to a respective control marking. In some variations, the white space within the area of the control marking can be used as a negative control, in that the system should expect no peaks to be detected in the white space. The resulting count of identified peaks can be compared to an accepted predetermined value (eg, a known number of control lines). If the peak count is sufficiently similar to an accepted predetermined value (e.g., is at least an accepted threshold, or falls within a certain range of thresholds), it is used to take an image of the control marking. The camera and/or shooting conditions may be of sufficient quality. In the example of FIG. 8A, analysis of the 1D array over image area 820 results in a count of nine peaks, which matches the predetermined known number of control lines 810 on the scan card. Accordingly, FIG. 8A represents a situation in which the control check passes based on the peaks identified in image region 820 and subsequent image analysis proceeds.
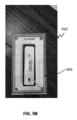
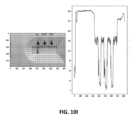
図8Bは、スキャン面上の1又は2以上のコントロールマーキングの検出を検証する他のバリエーションを示す。図8Bのバリエーションは、方法が更に各識別されたピークのプロミネンス(突出部)を考慮することを除いて、図8Aのバリエーションと同様であり、これはピークが他のピークに対してその固有の高さ及び/又は位置によりどの程度目立つかを表す。結果として生じるピーク及び/又はこれらのプロミネンスのカウントは、受け入れられた所定の値(例えば、少なくとも受け入れられた閾値であるか、又は閾値のある範囲内に入る)と比較することができる。ピーク及び/又はそのプロミネンスの数が所定の条件を満たす場合、コントロールマーキングの画像を撮影するために使用されるカメラ及び/又は撮影条件は、十分な品質であると考えられてもよい。図8Bの例では、画像領域820に対する1次元アレイの分析の結果、9つのピークがカウントされ、各ピークのプロミネンスの測定値も所定の条件を満たしている。従って、図8Bは、画像領域820で特定されたピークとプロミネンスに基づいてコントロールチェックが合格し、その後の画像分析が進められる状況を表している。 FIG. 8B shows another variation to verify the detection of one or more control markings on the scan plane. The variation in FIG. 8B is similar to the variation in FIG. 8A, except that the method also considers the prominence of each identified peak, which indicates that a peak has its unique Indicates how conspicuous it is depending on height and/or position. The resulting counts of peaks and/or these prominences may be compared to an accepted predetermined value (eg, at least an accepted threshold or within a range of thresholds). If the number of peaks and/or their prominences fulfills predetermined conditions, the camera and/or the imaging conditions used to capture the image of the control marking may be considered to be of sufficient quality. In the example of FIG. 8B, nine peaks are counted as a result of the one-dimensional array analysis for image region 820, and the measured prominence of each peak also satisfies predetermined conditions. Accordingly, FIG. 8B represents a situation in which the control check passes based on the peaks and prominences identified in the image region 820 and subsequent image analysis proceeds.
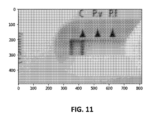
更に、幾つかのバリエーションにおいて、印刷されたコントロールマーキングは、各診断試験バンドの輪郭の検出及びその輪郭内の値の測定、予め定められた空間領域における値の測定、及び/又は訓練された機械学習モデルによる分析に基づいてなど、他の方法で追加的又は代替的に評価することができる。 Furthermore, in some variations, the printed control markings can be detected by detecting the contour of each diagnostic test band and measuring values within that contour, measuring values in a predetermined spatial region, and/or by a trained machine. It may additionally or alternatively be evaluated in other ways, such as based on analysis by a learning model.
(画像の受信)
図6は、診断試験の画像を分析するためのコンピュータビジョン技術の様々な態様を詳細に示している。上述したように、背景に対して診断試験を描写する画像が受信することができる(610)。背景は、フィデューシャルを有する指定されたスキャン面を含むことができるし、含まなくてもよい。幾つかのバリエーションにおいて、画像は、モバイルコンピュータデバイス上で実行されるアプリケーションの支援により、又は、コンピュータデバイス及びディスプレイを有する試験装置に接続されたカメラにより、ユーザによって取得することができる。アプリケーションは、例えば、ユーザが適切な画像を取得するための画面上の指示及び/又はガイダンス(例えば、表示されたレチクル)を表示することができる。幾つかのバリエーションにおいて、アプリケーションは、追加的又は代替的に、光センサなどのコンピュータデバイス又は試験装置内のセンサを利用して、カメラ設定(例えば、ホワイト/カラーバランスなど)を最適な条件に自動的に調整し、且つ/又はユーザへの提案(例えば、「もっと光のあるところに移動して下さい」)、及び/又はフィードバックループを閉じて試験の照度を自動的に上昇させてもよい。画像は、jpeg、png、RAWなど、任意の適切なフォーマットであってもよい。
(Receiving images)
FIG. 6 details various aspects of computer vision techniques for analyzing images of diagnostic tests. As described above, an image depicting a diagnostic test against a background may be received (610). The background may or may not include a designated scan plane with fiducials. In some variations, images may be acquired by a user with the aid of an application running on a mobile computing device or by a camera connected to a computing device and a test equipment with a display. The application may, for example, display on-screen instructions and/or guidance (eg, a displayed reticle) for the user to obtain the appropriate image. In some variations, the application additionally or alternatively utilizes sensors in the computing device or test equipment, such as optical sensors, to automatically optimize camera settings (e.g., white/color balance, etc.). The illuminance of the test may be automatically increased by automatically adjusting and/or making suggestions to the user (e.g., "move to a place with more light"), and/or closing the feedback loop. The image may be in any suitable format, such as jpeg, png, RAW, etc.
コントロールチェック(例えば、図7A及び図7Bに関して説明したような)が合格したと仮定すると、診断試験を背景から分離するために、画像化された診断試験の周りに画像の大まかにクロッピングされたバージョンを生成する(612)ことなどにより、画像の分析を進めることができる。コントロールチェックが実行されないバリエーションにおいて、受信された画像の分析は、以下に更に説明するように自動的に進めることができる。 Assuming control checks (e.g., as described with respect to FIGS. 7A and 7B) pass, a roughly cropped version of the image is created around the imaged diagnostic test to separate the diagnostic test from the background. Analysis of the image can proceed, such as by generating (612) a . In variations where no control check is performed, the analysis of the received images can proceed automatically, as described further below.
幾つかのバリエーションにおいて、ラフクロップ(612)は、スキャン面の支援を用いたコンピュータビジョン技術を使用して自動的に実行することができる。例えば、図9Aは、空間マーカ(ArUcoマーカ又は任意の適切なフィデューシャルを含むことができるが、QRコードマーカ)を有するスキャンカード上の診断試験の画像910を描写している。画像910は、診断試験を取り囲む関心領域920に大まかにクロッピングすることができる。この関心領域920は、例えば、OpenCV又は他の適切なコンピュータビジョンソフトウェアパッケージの組み込み機能を用いるなどして、3以上の空間マーカのセットを特定することによって、位置特定することができる。これらの空間マーカによって囲まれた領域は、更なる分析の対象とすることができる。
In some variations, rough cropping (612) can be performed automatically using computer vision techniques with the aid of scan planes. For example, FIG. 9A depicts an
幾つかのバリエーションにおいて、ラフクロップ(612)は、スキャン面の支援を用いた他の画像分析を伴う追加のコンピュータビジョン技術を使用して自動的に実行することができる。例えば、図9Bは、空間マーカ(QRコードマーカ)を有するスキャンカード上の診断試験の画像910を示しており、画像910は、診断試験を囲む関心領域920にクロップされることができる。図9Aに関して上述した方法と同様に、3以上の空間マーカ(例えば、ArUcoマーカ又は任意の適切なフィデューシャルを含むことができるが、QRコードマーカ)が識別されてもよいが、ここでは、画像910を異なる色空間に変換して、各空間マーカの位置を示す輪郭を識別することによって空間マーカが識別され得る。例えば、分析を色にとらわれないようにするために画像をグレースケールに変換し、その後、関心領域と背景とを区別するのに役立つように閾値カットオフを適用することができる。閾値は、例えば、標的領域と「背景」領域の平均光強度の関数であるヒューリスティックに決定された閾値と、空間マーカの候補位置を特定するための輪郭検出とに基づいてもよい。空間マーカが画像におけるどこに位置するかを識別するために、領域サイズ及び/又は領域アスペクト比の診断試験を空間マーカの候補位置に適用することができる。図9Bに示すバリエーションにおいて、空間マーカの1つは、空間マーカのうちの所定の既知の位置(右下コーナー)に赤い四角を含む。空間マーカのセットが位置決めされた後、赤色四角が特定され、赤色四角の角又は赤色四角に対する他の適切な点を乗算座標の原点として、関心領域920が、その赤色四角の倍数である画像910の領域(例えば、(赤色四角の縦M倍)×(赤色四角の横N倍))であると特定される。
In some variations, rough cropping (612) can be performed automatically using additional computer vision techniques along with other image analysis with the aid of scan planes. For example, FIG. 9B shows an
追加的又は代替的に、画像のラフクロップは、最初に画像をグレースケールに変換し、図9Bに関して上述したように閾値カットオフを適用することによって自動的に実行することができる。その後、1又は2以上のフィルタ(例えば、メディアンフィルタ)を使用して、画像から影を除去することができる。オープン、クローズド、及び/又は勾配モルフォロジー操作が画像上で実行されてもよく、分析は、画面上のレチクルによって外形が描かれた画像の領域に集中することができる。最小面積アルゴリズムを、画像の粗いクロッピングのための関心領域として診断試験の周りの最適なボックスを決定するのに使用することができる。 Additionally or alternatively, rough cropping of the image can be performed automatically by first converting the image to grayscale and applying a threshold cutoff as described above with respect to FIG. 9B. One or more filters (eg, a median filter) can then be used to remove shadows from the image. Open, closed, and/or gradient morphological operations may be performed on the image, and analysis may be focused on areas of the image outlined by the on-screen reticle. A minimum area algorithm can be used to determine the optimal box around the diagnostic test as the region of interest for coarse cropping of the image.
更に、幾つかのバリエーションにおいて、診断試験の画像のラフクロップ(612)は、追加的又は代替的に、診断試験の境界を指定するための手動入力を含むことができる。例えば、モバイルアプリケーションを実行するモバイルコンピュータデバイス(例えば、スマートフォン)を用いて、ユーザが背景に対して診断試験の画像を撮影した後、モバイルアプリケーションは、画像化された診断試験の周囲の関心領域を示すようにユーザを促すことができる。ユーザは、例えば、適切なグラフィックユーザインタフェースを用いて表示された画像上で関心領域を手動でトレースし、及び/又は幾何学的関心領域の頂点(例えば、長方形の角)を示すことによって関心領域を示すことができる。或いは、ユーザは、コンピュータデバイス上の任意の適切な写真編集アプリケーションを使用して、診断試験のオリジナル画像をクロッピング、マーク、又はその他の方法で編集し、その編集された写真を更なる分析のために指定することができる。更に別の例として、診断試験の画像のラフクロップは、追加的又は代替的に、画像処理装置の表示画面上に表示される画面レチクル及び/又は他の適切なガイドに基づくことができる。例えば、画像化装置(例えば、スマートフォン)のGUIは、標的(例えば、診断試験、診断試験の試験領域など)と同じアスペクト比を有するレチクルを表示してもよく、ユーザは、画像をキャプチャする前に標的をレチクルと整列させることができる。その結果、幾つかのバリエーションにおいて、ラフクロップは、表示されたレチクルに対応する受信画像におけるピクセルのクロップされた領域に基づいてもよい。 Furthermore, in some variations, the rough crop (612) of the image of the diagnostic test may additionally or alternatively include manual input to specify the boundaries of the diagnostic test. For example, after a user captures an image of a diagnostic test against a background using a mobile computing device (e.g., a smartphone) running a mobile application, the mobile application captures a region of interest surrounding the imaged diagnostic test. The user can be prompted as shown. The user may define the region of interest by, for example, manually tracing the region of interest on the displayed image using a suitable graphical user interface and/or by indicating the vertices of the geometric region of interest (e.g. corners of a rectangle). can be shown. Alternatively, the user may crop, mark, or otherwise edit the original image of the diagnostic test using any suitable photo editing application on the computing device and use the edited photo for further analysis. can be specified. As yet another example, the rough crop of the image of the diagnostic test may additionally or alternatively be based on a screen reticle and/or other suitable guide displayed on the display screen of the imaging device. For example, the GUI of the imaging device (e.g., smartphone) may display a reticle with the same aspect ratio as the target (e.g., diagnostic test, test area of the diagnostic test, etc.), and the user The target can be aligned with the reticle. As a result, in some variations, the rough crop may be based on a cropped region of pixels in the received image that corresponds to the displayed reticle.
幾つかのバリエーションにおいて、ラフクロップ(612)は、診断試験の画像における関心領域に関連する自動決定及び手動入力の両方を組み込んでもよい。例えば、上述した自動化技術の何れかが、画像化された診断試験の周囲のラフクロップを定義する関心領域の提案を決定してもよく、関心領域の提案は、ユーザによる確認及び/又は手動調整のためにコンピュータデバイス(例えば、スマートフォン)の画面上に表示することができる。 In some variations, rough cropping (612) may incorporate both automatic determination and manual input related to regions of interest in images of a diagnostic test. For example, any of the automated techniques described above may determine a region of interest proposal that defines a rough crop around an imaged diagnostic test, and the region of interest proposal is subject to review and/or manual adjustment by the user. can be displayed on the screen of a computing device (eg, a smartphone).
加えて又は代替的に、画像のラフクロップ(612)は、画像化されている診断試験の既知の特性を組み込んでよい。例えば、診断試験のタイプ(例えば、ブランドなど)が決定されてもよく、診断試験の全体形状又は縦横比などの1又は2以上の特性が、そのタイプの診断試験について(例えば、保存された構成ファイルにおいて)知られていてもよい。その診断試験用の構成ファイルからの情報は、例えば、画像における関心領域の適切なサイズ及び/又は形状を検証する際に利用することができる。診断試験のタイプは、自動的に(例えば、画像化された診断試験上のブランドの光学的文字認識、他の特徴的な特徴、機械学習、テンプレートマッチングなど)、及び/又はコンピュータデバイス上の手動入力(例えば、既知の特徴を有する診断試験の表示済みの入力済みリストからユーザによって選択)を介して決定することができる。幾つかのバリエーションにおいて、自動化された方法を通じて決定された提案された診断試験タイプは、その後、ユーザによって手動で確認又は修正することができる。更に、幾つかのバリエーションにおいて、このような確認又は訂正は、機械学習モデルを更に訓練する(又はそうでなければ、上述の自動化方法を改良する)ために用いられ、その精度を向上させることができる。 Additionally or alternatively, the rough crop (612) of the image may incorporate known characteristics of the diagnostic test being imaged. For example, the type of diagnostic test (e.g., brand, etc.) may be determined, and one or more characteristics such as the overall shape or aspect ratio of the diagnostic test may be determined for that type of diagnostic test (e.g., the saved configuration). may be known (in the file). Information from the configuration file for the diagnostic test can be utilized, for example, in verifying the appropriate size and/or shape of the region of interest in the image. The type of diagnostic test can be performed automatically (e.g., optical character recognition of the brand on an imaged diagnostic test, other distinguishing features, machine learning, template matching, etc.) and/or manually on a computing device. The determination can be made via input (eg, selection by the user from a displayed, populated list of diagnostic tests with known characteristics). In some variations, suggested diagnostic test types determined through automated methods can then be manually reviewed or modified by a user. Furthermore, in some variations, such confirmations or corrections may be used to further train the machine learning model (or otherwise improve the automated methods described above) to improve its accuracy. can.
画像(例えば、画像のラフクロップされたバージョン)は、幾つかのバリエーションにおいて、以下に説明するような画像検証の前(又は間)に、更に前処理することができる。例えば、前処理は、画像から影を除去することを含むことができる。例えば、画像をグレースケールに変換して色にとらわれないようにし、画像の各軸にわたる平均光レベルを測定して各軸にわたる光レベルの1D配列を生成し、これらの1D配列を画像の各軸に沿って、明るい領域を暗くし、暗い領域を明るくする方法(例えば、分割)で適用することによって影を除去することができる。 The image (eg, a rough cropped version of the image) can, in some variations, be further preprocessed before (or during) image verification as described below. For example, pre-processing can include removing shadows from the image. For example, convert an image to grayscale to make it color agnostic, measure the average light level across each axis of the image to generate a 1D array of light levels across each axis, and add these 1D arrays to each axis of the image. Shadows can be removed by applying them in a manner (e.g. splitting) that darkens bright areas and brightens dark areas along the lines.
(画像の検証)
画像のラフクロップされたバージョンは、画像の品質を確保するために、一連の1又は2以上の検証プロセスを通じて分析されてもよい(620)。画像の1又は2以上の様々な側面は、受信した画像における照明レベル、カラーバランス、露出レベル、ノイズレベル、画像ボケレベル、影の存在、及び/又はグレアの存在を含むがこれらに限定されない品質について検証することができる。以下に詳細に説明するように、これらの態様は、コンピュータビジョン技術などの様々な技術を使用して、画像品質を確認するために特徴付けることができる。幾つかのバリエーションにおいて、これらの側面のうちの1つ又は複数は、1又は2以上の適切な訓練された機械学習モデル(例えば、深層学習技術)を使用して画像品質を確認するために特徴付けられてもよい。例えば、機械学習モデルは、特定の特性に関して適切な品質の画像を識別するためにニューラルネットワーク又は他の適切なタイプの機械学習技術を訓練するために使用することができるラベル付けされた特徴(例えば、診断試験の許容できる又はできない向き、画像における許容できる又はできないボケ及び/又はノイズレベル、露出、照明又はカラーバランスの許容できる又はできないレベル、画像のクロップの識別された空間座標、背景に対する孤立した診断試験又は試験領域、診断試験の識別された向き、等)の画像を含む訓練データを使用して教師あり方式で訓練することができる。教師なし又は半教師ありの様式で訓練された機械学習モデルは、画像の1又は2以上の側面に関して画質を検証するために追加的又は代替的に使用することができる。
(Image verification)
The rough cropped version of the image may be analyzed (620) through a series of one or more verification processes to ensure image quality. One or more various aspects of the image may be related to the quality of the received image, including, but not limited to, illumination level, color balance, exposure level, noise level, image blur level, presence of shadows, and/or presence of glare. It can be verified. As described in detail below, these aspects can be characterized using various techniques, such as computer vision techniques, to confirm image quality. In some variations, one or more of these aspects are characterized using one or more appropriately trained machine learning models (e.g., deep learning techniques) to verify image quality. May be attached. For example, a machine learning model can be created using labeled features (e.g. , acceptable or unacceptable orientation of the diagnostic test, acceptable or unacceptable blur and/or noise levels in the image, acceptable or unacceptable levels of exposure, illumination or color balance, identified spatial coordinates of cropping of the image, isolated relative to background. The diagnostic test or test region, identified orientation of the diagnostic test, etc.) can be trained in a supervised manner using training data that includes images of the diagnostic test or test region, identified orientations of the diagnostic test, etc.). Machine learning models trained in an unsupervised or semi-supervised manner may additionally or alternatively be used to verify image quality with respect to one or more aspects of an image.
幾つかのバリエーションにおいて、図6に示すように、画像の品質を確認すること(620)は、診断試験の十分な(又は過剰な)照明があることを確実にするために、照明、彩度、カラーバランス、又は照明チェック(622)の何れか1つ又は複数を実行することを含むことができる。例えば、照明チェックは、画像の平均(例えば、平均)赤緑青(RGB)を計算し、次に、画像の平均RGB値を閾値又は値の範囲などの所定の閾値条件と比較するステップによって実行することができる。適切な閾値又は範囲は、例えば、ヒューリスティックに決定することができる。平均RGB値が所定の閾値条件を満たさない場合、画像は品質が不十分であるとみなされ、画像が検証処理に失敗したことを示すエラーがユーザに伝達される場合がある。他のバリエーションにおいて、上述の照明チェックを行う際に、他の色空間(例えば、YUV、CYMKなど)のチャンネルの平均値を代替的に使用してもよいことを理解されたい。他のバリエーションにおいて、HSV色空間のVチャンネルが使用することができる。更に、カメラ又は他のツールによって提供される情報(例えば、BV、ルクス、ISO、ET、焦点距離)を、適切な照明を決定するために、単独で、又は、互いに及び/又は計算された測定値と組み合わせて、使用することができる。 In some variations, as shown in FIG. 6, checking the image quality (620) includes adjusting the illumination, saturation, , color balance, or lighting check (622). For example, the lighting check is performed by calculating the average (e.g., average) red, green, and blue (RGB) of the image and then comparing the average RGB values of the image to a predetermined threshold condition, such as a threshold or range of values. be able to. Appropriate thresholds or ranges can be determined heuristically, for example. If the average RGB values do not meet a predetermined threshold condition, the image is considered to be of insufficient quality and an error may be communicated to the user indicating that the image has failed the verification process. It should be appreciated that in other variations, channel averages of other color spaces (eg, YUV, CYMK, etc.) may alternatively be used in performing the lighting checks described above. In other variations, the V channel of the HSV color space can be used. Additionally, information provided by the camera or other tools (e.g. BV, Lux, ISO, ET, focal length) can be used alone or with each other and/or calculated measurements to determine appropriate illumination. Can be used in combination with values.
加えて又は代替的に、画像の品質を確認することは、画像が適切に露光されていることを確認するために露光チェックを実行することを含むことができる。幾つかのバリエーションにおいて、これは、カメラ又は他のツールによって提供される情報(例えば、BV、ルクス、ISO、ET、焦点距離)を確認することによって実行することができる。幾つかのバリエーションにおいて、これは、画像の予想される領域を識別し、これらを互いに比較して、これらの相対値が、既知の発見的に決定された範囲又は値の内又は外、又は画像ごと又は領域ごとに計算された範囲又は値の内又は外であることを確認することによって実行することができる。幾つかのバリエーションにおいて、これは、上記の項目を個別に又は組み合わせて含むことができる。 Additionally or alternatively, verifying the quality of the image may include performing an exposure check to ensure that the image is properly exposed. In some variations, this can be done by checking information provided by the camera or other tools (eg, BV, Lux, ISO, ET, focal length). In some variations, this involves identifying expected regions of the image and comparing them to each other to determine if their relative values are within or outside known heuristically determined ranges or values, or This can be done by verifying that each region or region is within or outside a calculated range or value. In some variations, this may include the above items individually or in combination.
更に又は代替的に、画像の品質を確認すること(620)は、方向チェックを行うことを含むことができる(624)。方向チェックでは、画像における診断試験の回転量が測定され、画像フレーム内の診断試験の向きがそれに応じて修正することができる。幾つかのバリエーションにおいて、診断試験上の既知のマークは、向きを決定するための「指紋」又は情報的な基準として機能することができる。例えば、図10Aは、画像フレーム内で回転される診断試験カセットの画像を示している。カセット上の黒い印刷の矢印(例えば、アッセイウィンドウに隣接する矢印)は、画像における診断試験の向きを決定するための有益な基準となり得る。画像は、別の色空間又は別の色空間のチャンネル(例えば、グレースケール又はLAB Lチャンネル等)に変換することができる。1次元配列が作成されてもよく、1次元配列の各要素は、画像の領域(例えば、列又は行)についての画素値の代表的なメトリック(例えば、平均値)を含む。1次元アレイは、ノイズ及び/又は他のアーチファクトを除去するためにフィルタリング(例えば、中央値フィルタ又は他の適切なフィルタで)することができる。1Dアレイ(図10H)におけるピークの位置は、カセット上の黒印刷マークに対応すると考えてよく、画像におけるアッセイの向きの角度(又はアッセイの180度反転した向き、ただし黒印刷矢印間の非規則間隔又はマークの他の非対称特性は、実際の向きと180度反転した向きとを区別するのに役立つ)を示し得る。白色/淡色のカセット材料とカセット上の黒色印刷マークとの間の高いコントラストのため、これらのピークのプロミネンスも高くなると予想され、これはアッセイの向きの識別に更に役立つ可能性がある。決定された向きに基づいて、診断試験を画像フレームに合わせるために、画像に回転変換が適用されてもよい(図10E~10G)。その結果、診断試験のカーディナル方向が補正された画像は、既知のタイプの診断試験に対して予想される数のピーク及びプロミネンスを有するように見え得る(図10I)。 Additionally or alternatively, verifying the quality of the image (620) may include performing an orientation check (624). In the orientation check, the amount of rotation of the diagnostic test in the image is measured and the orientation of the diagnostic test within the image frame can be modified accordingly. In some variations, known marks on the diagnostic test can serve as a "fingerprint" or informative reference for determining orientation. For example, FIG. 10A shows an image of a diagnostic test cassette being rotated within an image frame. A black printed arrow on the cassette (eg, an arrow adjacent to the assay window) can be a useful reference for determining the orientation of the diagnostic test in the image. The image may be converted to another color space or a channel of another color space (eg, grayscale or LABL channel, etc.). A one-dimensional array may be created, with each element of the one-dimensional array containing a representative metric (eg, average value) of pixel values for a region (eg, column or row) of the image. The one-dimensional array can be filtered (eg, with a median filter or other suitable filter) to remove noise and/or other artifacts. The position of the peak in the 1D array (Fig. 10H) may be considered to correspond to the black printed mark on the cassette and the angle of the orientation of the assay in the image (or the 180-degree inverted orientation of the assay, but irregularly between the black printed arrows). Spacing or other asymmetrical characteristics of the marks may be indicative (helping to distinguish between the actual orientation and the 180 degree reversed orientation). Due to the high contrast between the white/light colored cassette material and the black printed marks on the cassette, the prominence of these peaks is also expected to be high, which may further aid in identifying the orientation of the assay. Based on the determined orientation, a rotational transformation may be applied to the image to align the diagnostic test to the image frame (FIGS. 10E-10G). As a result, the cardinal direction corrected image of the diagnostic test may appear to have the expected number of peaks and prominences for a known type of diagnostic test (FIG. 10I).
方位チェックを実行する方法のバリエーションを図10B及び図10Cに示す。例えば、図10B及び10Cに示すように、画像は、アライメントを表す特徴又は特徴のセットを増強する異なる色空間に変換することができる。アライメントを表す特徴を分離し、その方向を特定するために、1又は2以上のコンピュータビジョン方法又はコンピュータビジョン方法の組み合わせが使用することができる。例えば、このような特徴を分離し向きを特定するための好適なコンピュータビジョン方法は、1又は2以上のminAreaバウンディングボックス、輪郭アルゴリズムなどの使用を含む。別の例として、受信した画像はクロッピングされてもよく(例えば、上述したように画像のラフクロップを実行するためのバリエーション)、輪郭演算は、結果として得られる画像に対して実行することができる。期待される領域内に輪郭を有する画像は受け入れられ、一方、期待される領域外に輪郭を有する画像は、不十分な方向付けとして拒否することができる。加えて又は代替的に、1又は2以上の適切なコンピュータビジョン技術を使用して、診断試験又は診断試験の特徴(例えば、試験領域)、又は画像もしくは診断試験の他の標的所定領域などの標的画像領域の外形を識別することができる。例えば、エッジ検出(例えば、Canny、Diriche、Differential、Sobel、Prewitt、Roberts crossなど)、リッジ検出(例えば、Hough変換など)、ブロブ検出(例えば、LoG、DoG、DoH、MSER、PCBRなど)、特徴検出(アフィン、SIFT、SURF、GLOH、HOGなど)、及び/又は深層学習技術の1又は2以上を使用して、標的領域の外形を決定することができる。その後、領域が位置不良である程度を測定するために計算又は決定することができる、縦横比、面積、又は透視変換等を用いて特定された領域に基づいて、任意の面内回転又は面外回転を特定することができる。 A variation on how to perform an orientation check is shown in FIGS. 10B and 10C. For example, as shown in FIGS. 10B and 10C, the image can be transformed to a different color space that enhances the feature or set of features representing alignment. One or more computer vision methods, or a combination of computer vision methods, can be used to isolate features representative of alignment and determine their orientation. For example, suitable computer vision methods for isolating and orienting such features include the use of one or more minArea bounding boxes, contour algorithms, and the like. As another example, the received image may be cropped (e.g., a variation to perform a rough crop of the image as described above) and contour operations may be performed on the resulting image. Images with contours within the expected region are accepted, while images with contours outside the expected region can be rejected as insufficiently oriented. Additionally or alternatively, one or more suitable computer vision techniques can be used to visualize a target, such as a diagnostic test or features of a diagnostic test (e.g., a test region), or an image or other target predetermined region of a diagnostic test. The outline of the image area can be identified. For example, edge detection (e.g., Canny, Driche, Differential, Sobel, Prewitt, Roberts cross, etc.), ridge detection (e.g., Hough transform, etc.), blob detection (e.g., LoG, DoG, DoH, MSER, PCBR, etc.), features One or more of detection (affine, SIFT, SURF, GLOH, HOG, etc.) and/or deep learning techniques can be used to determine the contour of the target region. Any in-plane or out-of-plane rotation based on the identified region using aspect ratio, area, or perspective transformation, etc. can then be calculated or determined to measure the extent to which the region is malaligned. can be identified.
幾つかのバリエーションにおいて、上述の技術の何れかによって決定されるような過度に回転した又は位置不良の画像(例えば、少なくとも所定の閾値の度の回転)は、画像の拒絶につながる可能性がある。その後、ユーザは、より適切に位置合わせされた画像を採取するように促され得る。更に又は代替的に、更なる分析及び/又は画像が正しく配向されているように見えるという更なる手動確認のために、画像を期待される状態に復元するために変換を実行することができる。 In some variations, an excessively rotated or misaligned image (e.g., rotation by at least a predetermined threshold degree) as determined by any of the techniques described above may lead to rejection of the image. . The user may then be prompted to take a more properly aligned image. Additionally or alternatively, a transformation may be performed to restore the image to an expected state for further analysis and/or further manual confirmation that the image appears correctly oriented.
幾つかのバリエーションにおいて、画像の品質を確認するステップ(620)は、追加的又は代替的に、画像のボケ又はノイズの量が許容可能であるかどうかを判定するためにボケ又はノイズチェックを実行するステップ(626)を含むことができる。例えば、このようなチェックは、任意選択で、画像を様々な色空間のうちの何れかの1又は2以上に変換するステップと、様々な好適な組み合わせで1又は2以上のコンピュータビジョン技術を適用するステップとを含むことができる。ボケを低減するための好適なコンピュータビジョン技術の例としては、ラプラシアン分散、ラプラシアン平均、NIQE、Tenengrad、Sobel関数、高速フーリエ変換FFT)等が挙げられる。幾つかのバリエーションにおいて、画像全体又は関心領域について画質メトリックを生成するステップによって、ボケ又はノイズの量を特徴付けることができる。このメトリックが所定の閾値、又は動的に設定された閾値を超える場合、又はこれらの値の幾つかの組み合わせが閾値を超える場合、画像はその後の分析のためにボケ及び/又はノイズが多すぎるものとして扱われる。他の方法は、プロミネンスマップ又は訓練された深層学習モデルを使用することを含むことができる。更に、又は代替的に、画像又は領域の鮮鋭化されたバージョンを基準と比較するステップ、又は画像又は領域の平滑化されたバージョンを基準と比較するステップ、及び/又は画像又は領域に対して意図的なボケを実行し基準と比較するステップなどにより、基準を使用することができる。基準は、例えば、原画像、原画像の領域、予め定められた基準画像、又は処理された画像もしくは画像の領域を含むことができる。この比較の結果、次に、画像におけるボケ又はノイズの量の測定値として使用することができる指標が得られる。 In some variations, verifying the quality of the image (620) additionally or alternatively includes performing a blur or noise check to determine whether the amount of blur or noise in the image is acceptable. (626). For example, such a check may optionally include converting the image into any one or more of various color spaces and applying one or more computer vision techniques in various suitable combinations. The method may include the steps of: Examples of suitable computer vision techniques for reducing blur include Laplacian variance, Laplacian averaging, NIQE, Tenengrad, Sobel functions, fast Fourier transform (FFT), and the like. In some variations, the amount of blur or noise can be characterized by generating an image quality metric for the entire image or region of interest. If this metric exceeds a predetermined threshold, or a dynamically set threshold, or if some combination of these values exceeds the threshold, the image is too blurry and/or noisy for further analysis. be treated as such. Other methods may include using prominence maps or trained deep learning models. Additionally or alternatively, comparing the sharpened version of the image or region to a reference, or comparing the smoothed version of the image or region to a reference, and/or The reference can be used, such as by performing a standard blur and comparing it to the reference. The reference may include, for example, an original image, a region of the original image, a predetermined reference image, or a processed image or region of the image. This comparison results in an index that can then be used as a measure of the amount of blur or noise in the image.
加えて又は代替的に、幾つかのバリエーションにおいて、画像の品質を確認すること(620)は、画像におけるグレアの量が許容可能であるかどうかを判断するためにグレアチェックを実行すること(628)を含むことができる。幾つかのバリエーションにおいて、グレアチェックは、画像を様々な色空間のうちの何れか1つに変換し、次に、パーセント最大値及びプロミネンスマップを使用するなど、様々な適切な組み合わせで様々なコンピュータビジョン技法を適用することを含むことができる。幾つかの例では、グレアはカメラセンサの飽和を引き起こすことがあるので、センサによって報告された最大値又はその付近の値はグレアとして扱われることがある。例えば、0から255のスケールで、240以上の強度を持つ画素はグレアとして扱われる可能性がある。更に、閾値(動的に設定された値又は事前に設定された値)を満たす強度を有する画素は、グレアとして扱われてもよい。この値は、絶対値であってもよいし、画像における最大強度から相対的に定義されてもよく、例えば、関心領域内の最大値から3カウント以内とすることができる。更に、グレアは、場合によっては、周囲よりもはるかに明るい画素として現れる。画素をグレアとして扱うかどうかを決定するために、画素強度の中央値に2つの標準偏差を加えたような第2の動的閾値を追加的又は代替的に使用することができる。幾つかのバリエーションにおいて、画像の全体的なグレアレベルは、これらの画素強度試験のうちの1又は2以上に基づいて決定することができる。例えば、上述の基準の一方又は両方を満たす画素を合計し、関心領域内の画素の総数で割って、グレアの基準を満たす画素の割合又は画素数を決定することができる。グレアの基準を満たす画素の割合を画素の総数で割ると、関心領域内のグレアレベルが反映される。グレアチェックを行うための他の方法は、追加的又は代替的に、スライディングウィンドウを使用して変換された又は変換されていない画像を処理するステップと、グレア領域を分離するために画像の残りの部分と比較したウィンドウの特徴に基づいてウィンドウ内の変換を実行するステップとを含むことができる。 Additionally or alternatively, in some variations, verifying the quality of the image (620) includes performing a glare check (628) to determine whether the amount of glare in the image is acceptable. ) can be included. In some variations, glare checking is performed by converting the image into any one of various color spaces and then using various computer methods in various appropriate combinations, such as using percent maximum and prominence maps. It can include applying vision techniques. In some examples, glare can cause saturation of the camera sensor, so values at or near the maximum value reported by the sensor may be treated as glare. For example, on a scale of 0 to 255, pixels with an intensity of 240 or higher may be treated as glare. Additionally, pixels with an intensity that meets a threshold (a dynamically set value or a preset value) may be treated as glare. This value may be an absolute value or may be defined relative to the maximum intensity in the image, eg, within 3 counts of the maximum value within the region of interest. Furthermore, glare sometimes appears as pixels that are much brighter than their surroundings. A second dynamic threshold, such as the median pixel intensity plus two standard deviations, may additionally or alternatively be used to determine whether a pixel is treated as glare. In some variations, the overall glare level of the image can be determined based on one or more of these pixel intensity tests. For example, the pixels that meet one or both of the above criteria can be summed and divided by the total number of pixels in the region of interest to determine the percentage or number of pixels that meet the glare criteria. The percentage of pixels that meet the glare criteria divided by the total number of pixels reflects the glare level within the region of interest. Other methods for performing glare checking additionally or alternatively include processing the transformed or untransformed image using a sliding window and processing the rest of the image to isolate glare areas. and performing transformations within the window based on characteristics of the window compared to the portion.
グレアは、例えば、診断試験カセットの試験領域(例えば、アッセイ)のプラスチックで覆われたウィンドウ上に存在する場合がある。従って、グレアチェックを支援するための幾つかのバリエーションにおいて、診断試験の残りの部分から試験領域を分離するための画像のクロップが、手動(例えば、背景から診断試験を分離するためのラフクロップについて上述したものと同様)及び/又は自動化の何れかの方法で実行することができる。ラフクロップは、診断試験のサンプルポート、及びカセット上のマーキング(例えば、手書きのインクマークなど)をクロッピングすることができる。試験領域を分離するために画像のラフクロップを実行する自動化された態様の一例として、図11は、カセット内の試験ストリップを含む診断試験を描写する画像のラフクロップを実行するバリエーションを示す。幾つかのバリエーションにおいて、試験ストリップがカメラ装置(例えば、モバイルコンピュータデバイス)に表示される画面上のレチクル内である程度中央にあると仮定すると、ラフクロップは、画像周囲の所定部分(例えば、割合)を除去することができる。例えば、ラフクロップは、画像周囲の外側30%を除去することができるが、クロップされるパーセンテージは任意の適切な値であってもよい。 Glare may be present, for example, on the plastic-covered window of the test area (eg, assay) of a diagnostic test cassette. Therefore, in some variations to aid in glare checking, cropping of the image to separate the test area from the rest of the diagnostic test may be performed manually (e.g., as described above for rough cropping to separate the diagnostic test from the background). (similar to that described above) and/or in an automated manner. The rough crop can crop the sample port of the diagnostic test and markings on the cassette (eg, handwritten ink marks, etc.). As an example of an automated embodiment of performing a rough crop of an image to isolate test regions, FIG. 11 shows a variation of performing a rough crop of an image depicting a diagnostic test including a test strip in a cassette. In some variations, rough crops crop a predetermined portion (e.g., a percentage) of the image perimeter, assuming that the test strip is somewhat centered within the reticle on the screen displayed on the camera device (e.g., a mobile computing device). Can be removed. For example, a rough crop may remove the outer 30% of the image perimeter, but the cropped percentage may be any suitable value.
追加的又は代替的に、試験領域は、外形ベースの技法を用いて位置特定することができる。例えば、試験領域は、診断試験の識別された外形と、診断試験の外形に対する試験領域の位置の推定とに少なくとも部分的に基づいて位置特定することができる。例えば、コンピュータビジョン技術は、閾値処理、エッジ検出、ブロブ検出、輪郭検出等を用いて診断試験(例えば、カセット)の外形を特定することができる。試験領域の位置は、診断試験の外形及び/又は他のマーカに対する所定の座標に基づいて決定されてもよく、これによって、画像におけるこのような既知のマーカを空間ランドマークとして使用する。所定の座標は、例えば、診断試験のタイプを決定した後に知られてもよい(これは、上述のように自動的に及び/又は手動で決定されてもよい)。 Additionally or alternatively, the test area can be located using contour-based techniques. For example, the test area can be located based at least in part on an identified contour of the diagnostic test and an estimate of the position of the test area relative to the contour of the diagnostic test. For example, computer vision techniques can identify the contours of a diagnostic test (eg, a cassette) using thresholding, edge detection, blob detection, contour detection, and the like. The location of the test area may be determined based on the diagnostic test outline and/or predetermined coordinates relative to other markers, thereby using such known markers in the image as spatial landmarks. The predetermined coordinates may be known, for example, after determining the type of diagnostic test (which may be determined automatically and/or manually as described above).
幾つかのバリエーションにおいて、画像の残りの部分から試験領域を分離するための画像のクロップは、画像検証診断試験の何れかに先立って実行することができる。更に、図6は、ある順序で実行される画像検証プロセスを示しているが、照明チェック(622)、方向チェック(624)、ボケ/ノイズチェック(626)、及びグレアチェック(628)などのプロセスは、診断試験の決定されたニーズに基づいて調整されるように、任意のチェックが省かれるか、追加のチェックが挿入されて、任意の適切な順序で実行され得ることを理解されたい。 In some variations, cropping the image to separate the test area from the rest of the image can be performed prior to any image verification diagnostic test. Further, although FIG. 6 shows image verification processes performed in some order, processes such as lighting check (622), orientation check (624), blur/noise check (626), and glare check (628) It is to be understood that any checks may be omitted or additional checks may be inserted and performed in any suitable order, as adjusted based on the determined needs of the diagnostic test.
更に、幾つかのバリエーションにおいて、画像の検証(620)は、画像化されている診断試験のタイプに関連付けられた構成ファイルからの情報を利用することができる。診断試験のタイプは、自動的及び/又は手動的に(例えば、上述のように)決定されてもよく、関連する構成ファイルにアクセスすることができる。診断試験のサイズ又はアスペクト比、試験領域内のラインの数、試験領域内のライン間の距離、診断試験内の他のランドマークと比較した試験領域の位置(例えば左上コーナー)、試験領域のサイズ(例えばアッセイウィンドウ)等の情報は、診断試験が適切に画像化されているかどうかを検証するのに役立つことができる。また、設定ファイルには、どのような品質技術をどのように採用するか、また、このような技術をどのように採用するかに関する閾値、又はアルゴリズム制御などの情報が含まれていてもよい。 Further, in some variations, image validation (620) may utilize information from a configuration file associated with the type of diagnostic test being imaged. The type of diagnostic test may be determined automatically and/or manually (eg, as described above) and the associated configuration file may be accessed. The size or aspect ratio of the diagnostic test, the number of lines within the test area, the distance between lines within the test area, the location of the test area relative to other landmarks within the diagnostic test (e.g. top left corner), the size of the test area Information such as the assay window (e.g. assay window) can help verify whether the diagnostic test is being properly imaged. The configuration file may also include information such as what quality techniques are to be employed and how, and thresholds or algorithm controls regarding how such techniques are to be employed.
更に、上記の検証プロセスの何れか1又は2以上は、このようなプロセスを実行する装置に対してカスタマイズされ、及び/又は他の方法で調整することができる。イメージングデバイス(例えば、スマートフォン)のメーカー、モデル、カメラ焦点距離、及び/又は他の識別特性などのデバイス記述子の知識は、オペレーティングシステムから、又は特定のデバイスのためのカスタムソフトウェアビルドに対して予め定められた値などから取得することができる。1又は2以上の検証プロセスのカスタマイズは、少なくとも部分的にこのようなデバイス固有の記述子に基づいてもよく、所定の命令として格納される。所定の命令は、アルゴリズムのコードに含まれてもよいし、遠隔地(例えば、サーバ、遠隔メモリ装置、クラウドストレージなど)からダウンロードされる可能性もある。 Additionally, any one or more of the verification processes described above may be customized and/or otherwise tailored to the device performing such processes. Knowledge of device descriptors such as make, model, camera focal length, and/or other identifying characteristics of an imaging device (e.g., a smartphone) can be acquired in advance from the operating system or for a custom software build for a particular device. It can be obtained from a predetermined value. Customization of one or more verification processes may be based at least in part on such device-specific descriptors and stored as predetermined instructions. The predetermined instructions may be included in the algorithm's code or may be downloaded from a remote location (eg, a server, remote memory device, cloud storage, etc.).
(試験領域の位置決め)
診断試験分析を進めるために、試験領域(例えば、アッセイウィンドウ)が位置特定され得る。試験領域は、様々な好適な態様で位置特定され得る。例えば、上述した大まかな試験領域分離技術(例えば、図11を参照して、及び/又は外形ベースの技術)は、分析を進めるために幾つかの実施例において十分に正確であってよい。或いは、幾つかのバリエーションにおいて、図6に示すように、画像が十分な品質であることが検証された後、診断試験の試験領域(例えば、アッセイウィンドウ)をより正確に分離するために、画像のより精密又は正確なクロッピングを実行することができる(630)。幾つかのバリエーションにおいて、以下で詳細に説明するように、適切なコンピュータビジョン技術を使用して、画像における試験領域を位置決め及び/又は分離することができる。加えて又は代替的に、試験領域は、1又は2以上の適切な訓練された機械学習モデル(例えば、深層学習技術)を使用して、分離及び/又は位置特定することができる。例えば、機械学習モデルは、画像における試験領域を識別及び/又は分離するためにニューラルネットワーク又は他の好適なタイプの機械学習技術を訓練するために使用することができるラベル付けされた試験領域部分(例えば、アッセイウィンドウ、試薬パッドなど)を有する画像を含む訓練データを用いて教師あり方式で訓練することができる。教師なし又は半教師ありの方法で訓練された機械学習モデルを用いて、追加的又は代替的に、画像における試験領域を特定及び/又は分離することができる。
(Positioning of test area)
To proceed with diagnostic test analysis, a test area (eg, an assay window) can be located. The test area may be located in a variety of suitable manners. For example, the coarse test area separation techniques described above (eg, with reference to FIG. 11 and/or contour-based techniques) may be accurate enough in some embodiments to proceed with the analysis. Alternatively, in some variations, after the images have been verified to be of sufficient quality, the images can be modified to more accurately isolate the test area (e.g., assay window) of a diagnostic test, as shown in Figure 6. A more precise or precise cropping of the image may be performed (630). In some variations, appropriate computer vision techniques can be used to locate and/or isolate the test area in the image, as described in detail below. Additionally or alternatively, test areas can be isolated and/or localized using one or more appropriately trained machine learning models (eg, deep learning techniques). For example, a machine learning model can be used to train a neural network or other suitable type of machine learning technique to identify and/or isolate test regions in an image. For example, the assay window, reagent pad, etc.) can be trained in a supervised manner using training data that includes images with a reagent pad, etc.). Additionally or alternatively, a machine learning model trained in an unsupervised or semi-supervised manner can be used to identify and/or isolate test regions in an image.
例えば、幾つかのバリエーションにおいて、試験領域は、色に基づく方法に少なくとも部分的に基づいて位置特定することができる。例示すると、図12Aに示すように、クロップされた画像(例えば、試験領域のラフクロップ)は、LAB色空間又は他の適切な色空間に変換することができる。画像アレイをL、A、Bチャンネルの2次元アレイに分割し、2次元アレイのうち診断試験用の最高コントラストチャンネルのハイパーセンタイル値(例えば、99、98、97パーセンタイル等)を算出することができる。最高コントラストチャンネルは、診断試験の色に基づいて選択することができる。例えば、Aチャンネルアレイの高パーセンタイル値は、赤/ピンクのラインを有するイムノアッセイ試験に対して決定することができる。予め定められたパーセンタイルAチャンネル値でない画像の部分は、二値化フィルタ又はOtsuフィルタ等を介して除去することができる。すなわち、バイナリフィルタ又は大津フィルタは、画像から最も明るいAチャンネル値(例えば、Aチャンネルにおける最も明るい1%、2%、3%等)以外を効果的に閾値除去することができる。残りの画像において最大の輪郭が特定されてもよく、この輪郭は、試験領域におけるコントロールラインとみなすことができる。図12Bに示すように、試験領域の位置(例えば、境界)は、コントロールラインの推定位置、及び/又は試験領域の推定アスペクト比(公称値又は診断試験に関連する構成ファイルから知られる等の何れか)等の他の任意の情報に基づいて外挿することができる。診断試験の色に応じて、他の高コントラストチャンネルを使用してもよい(例えば、青色ラインを生成する診断試験用のBチャンネル)。 For example, in some variations, the test area can be located based at least in part on a color-based method. To illustrate, as shown in FIG. 12A, a cropped image (eg, a rough crop of the test area) can be converted to LAB color space or other suitable color space. The image array can be divided into a two-dimensional array of L, A, and B channels, and the hypercentile value (e.g., 99th, 98th, 97th percentile, etc.) of the highest contrast channel of the two-dimensional array for a diagnostic test can be calculated. . The highest contrast channel can be selected based on the color of the diagnostic test. For example, a high percentile value for an A channel array can be determined for an immunoassay test with a red/pink line. Portions of the image that are not at a predetermined percentile A channel value can be removed via a binarization filter, an Otsu filter, or the like. That is, the binary filter or Otsu filter can effectively threshold out all but the brightest A channel values (eg, the brightest 1%, 2%, 3%, etc. in the A channel) from the image. The largest contour may be identified in the remaining images, and this contour can be considered as the control line in the test area. As shown in FIG. 12B, the location (e.g., boundaries) of the test area may be determined by the estimated location of the control line and/or the estimated aspect ratio of the test area (such as a nominal value or known from a configuration file associated with the diagnostic test). It can be extrapolated based on any other information such as Other high contrast channels may be used depending on the color of the diagnostic test (eg, the B channel for diagnostic tests that produces a blue line).
更に、試験領域を位置決めする色に基づく方法は、任意の適切な色空間を利用することができる。幾つかのバリエーションにおいて、クロッピングされた画像は、YUV、XYZ、HSV、CYMK、又は他の適切な色空間に変換されてもよく、選択された色空間における最高コントラストのカラーチャンネルは、試験領域外挿のためのコントロールラインを識別するために上述のように使用することができる。例えば、クロッピングされた画像は、YUV色空間に変換されてもよく、赤/ピンクのラインを有する診断試験の場合、Vチャンネルは、画像の一部を閾値除去し、試験領域外挿のためのコントロールラインを特定するのに使用することができる。 Furthermore, the color-based method of locating the test area can utilize any suitable color space. In some variations, the cropped image may be converted to YUV, XYZ, HSV, CYMK, or other suitable color space, and the highest contrast color channel in the selected color space is Can be used as described above to identify control lines for insertion. For example, a cropped image may be converted to YUV color space, and for a diagnostic test with red/pink lines, the V channel may be used to threshold a portion of the image and for test area extrapolation. Can be used to identify control lines.
別の例として、クロップされた画像は、グレースケール画像に変換されてもよく、グレースケール画像は、1Dアレイに変換されてもよく、アレイの要素は、グレースケール画像の行又は列などの部分の代表メトリック(例えば、平均値)である。1Dアレイでピークを識別し、最も目立つピークを試験領域全体に対する外挿の基礎となるコントロールラインとみなすことができる。複数の高輝度ライン又はピークが試験ストリップ上に存在する場合、空間ランドマークコントロールラインの予想位置に最も近いピークを空間ランドマークと決定してよい。幾つかの実施態様では、複数のコントロールラインが存在してもよく、各コントロールラインを空間的ランドマークとして使用して、試験領域の位置を絞り込むことができる。 As another example, a cropped image may be converted to a grayscale image, and the grayscale image may be converted to a 1D array, where the elements of the array are portions of the grayscale image, such as rows or columns. is a representative metric (for example, an average value) of Peaks can be identified in the 1D array and the most prominent peak can be considered as a control line on which to base extrapolation to the entire test area. If multiple bright lines or peaks are present on the test strip, the peak closest to the expected location of the spatial landmark control line may be determined to be the spatial landmark. In some implementations, there may be multiple control lines, and each control line may be used as a spatial landmark to localize the test area.
幾つかの実施態様では、正確な試験領域(例えば、アッセイウィンドウ)は、環境条件(例えば、照明条件)に起因する影によって部分的に隠されてもよく、これによって試験領域を正確に位置特定することがより困難になる可能性がある。例えば、ある実施例では、低い角度から(例えば、床から天井までのウィンドウを通して)診断試験を照らす光によって、診断試験カセットは試験領域の少なくとも一部に影を落とすことがある。このような場合、試験領域の第1の部分に濃い影ができる一方、試験領域の第2の部分(例えば、残りの部分)は十分に照らされることができる。従って、試験領域の大部分は、最も明るい領域のみを示す閾値処理(例えば、上述のような二値閾値処理)により見出され得るが、試験領域の暗くなった部分又は影がかかった部分は、もっぱら二値閾値処理により見出すことがより困難である。従って、幾つかのバリエーションにおいて、ラプラシアン値を分析する技術は、高いラプラシアン値を有する画像領域が試験領域の暗い領域のエッジを示すという理解を活用することによって、画像における試験領域を特定する改良されたより正確な方法を提供することができる。従って、試験ストリップの「明るい」領域及び「暗い」領域を加算することは、試験領域全体を含む可能性が高い結合画像をもたらすことができる。 In some embodiments, the precise test area (e.g., assay window) may be partially obscured by shadows due to environmental conditions (e.g., lighting conditions), thereby making it difficult to precisely locate the test area. It may become more difficult to do so. For example, in some embodiments, light illuminating the diagnostic test from a low angle (eg, through a floor-to-ceiling window) may cause the diagnostic test cassette to cast a shadow on at least a portion of the test area. In such a case, a first portion of the test area may be heavily shadowed, while a second portion (eg, the remaining portion) of the test area may be fully illuminated. Thus, while most of the test area can be found by thresholding (e.g., binary thresholding as described above) which only shows the brightest areas, darkened or shadowed parts of the test area can be found. , is more difficult to find by exclusively binary thresholding. Therefore, in some variations, techniques for analyzing Laplacian values have been improved to identify test regions in images by leveraging the understanding that image regions with high Laplacian values indicate the edges of dark regions of the test region. A more accurate method can be provided. Therefore, adding the "bright" and "dark" areas of the test strip can result in a combined image that is likely to include the entire test area.
例えば、幾つかのバリエーションにおいて、画像における試験領域を識別する方法は、所定のラプラシアン閾値以上のラプラシアン値を有する画像の1又は2以上の高ラプラシアン領域を決定するステップと、所定の輝度閾値以上の輝度を有する画像の1又は2以上の明るい領域を決定するステップと、ビット単位の「OR」演算によって画像の1又は2以上の高ラプラシアン領域及び1又は2以上の明るい領域を組み合わせるステップと、画像の組み合わせた高ラプラシアン及び明るい領域の輪郭に基づいて試験領域を定義するステップとを含むことができる。 For example, in some variations, a method for identifying test regions in an image includes the steps of determining one or more high Laplacian regions of an image that have Laplacian values greater than or equal to a predetermined luminance threshold; determining one or more bright regions of the image having a luminance; combining the one or more high Laplacian regions and the one or more bright regions of the image by a bitwise "OR" operation; defining a test area based on the combined high Laplacian and bright area contours.
この方法のバリエーションにおいて、画像は、最初にグレースケールに変換することができる。グレースケール画像のラプラシアンが計算されてもよく、適切な二値ラプラシアン閾値がラプラシアンに適用されて、ラプラシアン閾値を超えるラプラシアン値を有する画像部分を含む閾値ラプラシアン画像を形成することができる。ラプラシアン閾値は、例えば、ラプラシアン画像の平均(例えば、平均)ラプラシアン値に、ラプラシアン画像のラプラシアン画像における標準偏差を加えた値であってもよい。その後、試験領域の輪郭を滑らかにするために、一組の更なる侵食及び拡張が、閾値設定されたラプラシアン画像に適用することができる。更に、適切な二値グレースケール閾値がグレースケール画像に適用され、グレースケール閾値よりも明るいグレースケール値を有する画像部分を含む閾値化グレースケール画像を形成することができる。例えば、グレースケール閾値は、グレースケール画像の平均(例えば、平均)グレースケール値にグレースケール画像の標準グレースケール偏差を加えたものであってよい。次いで、試験ストリップの輪郭を滑らかにするために、別のセットの更なる侵食及び拡張が、閾値化されたグレースケール画像に適用することができる。閾値化されたラプラシアン画像と閾値化されたグレースケール画像は、次にビット単位の「OR」操作で結合することができる。その後、試験領域の輪郭を滑らかにするために、更なる侵食及び拡張の追加のセットが、マージされた画像に適用することができる。この結合された画像は、次に輪郭検出関数に渡すことができる。期待される(例えば、正しい)サイズ、アスペクト比、及び位置を有する輪郭が見つかった場合、この輪郭は次に試験領域輪郭としてマークされ、試験領域の更なる分析は、本明細書の他の場所で説明されるように進めることができる。 In a variation of this method, the image can first be converted to grayscale. A Laplacian of a grayscale image may be calculated, and an appropriate binary Laplacian threshold may be applied to the Laplacian to form a threshold Laplacian image that includes portions of the image having Laplacian values greater than the Laplacian threshold. The Laplacian threshold may be, for example, a value obtained by adding the standard deviation of the Laplacian image to the average (eg, average) Laplacian value of the Laplacian image. A set of further erosions and dilations can then be applied to the thresholded Laplacian image to smooth the contours of the test area. Additionally, a suitable binary grayscale threshold can be applied to the grayscale image to form a thresholded grayscale image that includes portions of the image having grayscale values lighter than the grayscale threshold. For example, the grayscale threshold may be the average (eg, average) grayscale value of the grayscale image plus the standard grayscale deviation of the grayscale image. Another set of further erosions and dilations can then be applied to the thresholded grayscale image to smooth the test strip contour. The thresholded Laplacian image and the thresholded grayscale image can then be combined with a bitwise "OR" operation. An additional set of further erosions and dilations can then be applied to the merged images to smooth the contours of the test area. This combined image can then be passed to a contour detection function. If a contour with the expected (e.g. correct) size, aspect ratio and position is found, this contour is then marked as a test area contour and further analysis of the test area is described elsewhere herein. You can proceed as described in .
別のバリエーションにおいて、受信された画像は、画像のグレースケールバージョンと、HSV色空間のような適切な色空間における画像の別の版とを形成するために、2つの様式で変換することができる。上記の例と同様に、グレースケール画像のラプラシアンが計算されてもよく、適切な二値ラプラシアン閾値がラプラシアンに適用されて、ラプラシアン閾値を超えるラプラシアン値を有する画像部分を含む閾値ラプラシアン画像を形成することができる。ラプラシアン閾値は、例えば、ラプラシアン画像の平均(例えば、平均)ラプラシアン値に、ラプラシアン画像のラプラシアン画像における標準偏差を加えた値であってもよい。その後、試験領域の輪郭を滑らかにするために、一組の更なる侵食及び拡張を、閾値設定されたラプラシアン画像に適用することができる。この例では、画像の明るい領域を識別するために、HSV色空間のV、すなわち値、チャンネルが閾値処理に使用することができる。例えば、「FOR」ループを使用して、閾値処理関数を反復的に呼び出してもよく、このループの各サイクルにおいて、異なるカットオフ値が使用され、カットオフ値で二値閾値が適用されて、閾値処理値(V)画像を形成することができる。その後、試験ストリップの輪郭を滑らかにするために、更なる侵食と拡張のセットを適用することができる。閾値ラプラシアン画像と閾値値(V)画像は、次にビット単位の「OR」操作で結合することができる。その後、試験領域の輪郭を滑らかにするために、更なる浸食と拡張のセットを適用することができる。この結合された画像は、次に輪郭検出関数に渡される。期待される(例えば、正しい)サイズ、アスペクト比、及び位置を有する輪郭が見つかった場合、この輪郭は次に試験領域輪郭としてマークされ、試験領域の更なる分析は、本明細書の他の場所で説明されるように進めることができる。 In another variation, a received image can be transformed in two ways to form a grayscale version of the image and another version of the image in a suitable color space, such as the HSV color space. . Similar to the example above, the Laplacian of a grayscale image may be computed, and an appropriate binary Laplacian threshold is applied to the Laplacian to form a thresholded Laplacian image containing portions of the image with Laplacian values above the Laplacian threshold. be able to. The Laplacian threshold may be, for example, a value obtained by adding the standard deviation of the Laplacian image to the average (eg, average) Laplacian value of the Laplacian image. A set of further erosions and dilations can then be applied to the thresholded Laplacian image to smooth the contours of the test area. In this example, the V, or value, channel of the HSV color space can be used for thresholding to identify bright areas of the image. For example, a "FOR" loop may be used to iteratively call a thresholding function, where each cycle of the loop uses a different cutoff value, applies a binary threshold at the cutoff value, and A thresholded value (V) image can be formed. A further set of erosions and expansions can then be applied to smooth the contour of the test strip. The threshold Laplacian image and the threshold value (V) image can then be combined with a bitwise "OR" operation. A further set of erosions and dilations can then be applied to smooth the contours of the test area. This combined image is then passed to a contour detection function. If a contour with the expected (e.g. correct) size, aspect ratio and position is found, this contour is then marked as a test area contour and further analysis of the test area is described elsewhere herein. You can proceed as described in .
幾つかのバリエーションにおいて、診断試験は、1つの試験領域(例えば、1つのアッセイウィンドウ)だけを含んでもよく、1つのこのような試験領域だけが、分析のために画像内に位置付けられる必要となる場合がある。しかしながら、幾つかのバリエーションにおいて、診断試験は、複数の試験領域(例えば、複数のアッセイウィンドウ、又は単一のアッセイウィンドウに分散した複数の試験領域)を含んでもよく、それに応じてこれらのバリエーションにおいて、複数の試験領域が、適宜、上述のプロセスを繰り返すことによって位置特定されることができる。 In some variations, a diagnostic test may include only one test area (e.g., one assay window), and only one such test area needs to be located within the image for analysis. There are cases. However, in some variations, a diagnostic test may include multiple test areas (e.g., multiple assay windows, or multiple test areas distributed in a single assay window), and in these variations accordingly. , multiple test areas can be located by repeating the process described above, if appropriate.
幾つかのバリエーションにおいて、試験領域は、追加的に又は代替的に、試験領域の外形を分離する適切なコンピュータビジョン技術(例えば、閾値処理、エッジ検出、ブロブ検出、輪郭検出等及び/又は上述の他の技術)の任意の数、順序、又は組み合わせを使用することによって分離することができる。幾つかのバリエーションにおいて、試験領域を分離するための技術は、最初に画像における診断試験を分離して(例えば、先に説明した技術を使用して)診断試験を表すサブセット領域を作成し、次に、診断試験の既知の特徴(例えば、上記のように構成ファイルから決定することができる)を使用して、試験領域を検索するサブセット領域を特定することによって支援することができる。 In some variations, the test region may additionally or alternatively be processed using suitable computer vision techniques (e.g., thresholding, edge detection, blob detection, contour detection, etc. and/or those described above) that isolate the contours of the test region. or other techniques). In some variations, techniques for separating test regions include first isolating diagnostic tests in an image to create a subset region representing the diagnostic tests (e.g., using the techniques described above), and then The test region can be assisted by identifying a subset region in which to search the test region using known characteristics of the diagnostic test (e.g., which can be determined from the configuration file as described above).
(試験結果の予測)
画像における診断試験の試験領域を適切に分離する十分にクロッピングされた画像が与えられると、画像内に描かれた試験領域の分析に基づいて試験結果を予測することができる(640)。図6に示すように、精密又は正確にクロッピングされた画像は、グレースケール(642a)又は適切な高コントラスト色空間(642b)に変換されてもよく、又は更なる分析のためにグレースケール及び色空間バージョンを含む複数のバージョンに変換されるかもしれない。更に、試験領域内の試験ラインは、影からの干渉に強いLAB「A」又はLAB「B」又はYUV「V」チャンネルなどのレシオメトリック色チャンネルにおける影からより容易に区別することができる。従って、幾つかのバリエーションにおいて、試験領域内のラインの位置を決定する場合、輝度と色の尺度を組み合わせたチャンネルを使用するよりも、これらのチャンネルを使用することが好ましい場合がある。
(Prediction of test results)
Given a sufficiently cropped image that adequately separates the test regions of the diagnostic test in the image, test results can be predicted (640) based on an analysis of the test regions depicted in the image. As shown in Figure 6, the precise or precisely cropped image may be converted to grayscale (642a) or a suitable high contrast color space (642b), or grayscale and color space for further analysis. May be converted into multiple versions, including spatial versions. Additionally, test lines within the test area can be more easily distinguished from shadows in ratiometric color channels such as LAB "A" or LAB "B" or YUV "V" channels, which are more resistant to interference from shadows. Therefore, in some variations, it may be preferable to use these channels rather than a combined luminance and color scale channel when determining the position of a line within a test area.
幾つかのバリエーションにおいて、クロップされた試験領域画像は、汚れ、異物、影などに起因して誤解を招くほど暗い可能性のある問題のある領域(例えば、行)を除去するために、更なる分析に先立って処理することができる。例えば、(例えば、画像のグレースケールバージョンで決定されるような)ピクセルの最も暗い行は、画像又はその一部(例えば、行ごと)における最高パーセンタイル値(例えば、99%、98%等)によって決定される閾値カットオフに基づいて、行全体のピクセル強度のピーク値の決定に基づいて、及び/又は任意の適した方法で閾値除去することができる。 In some variations, the cropped test area image is further processed to remove problematic areas (e.g., lines) that may be misleadingly dark due to dirt, foreign objects, shadows, etc. Can be processed prior to analysis. For example, the darkest row of pixels (e.g., as determined in a grayscale version of the image) is determined by the highest percentile value (e.g., 99%, 98%, etc.) in the image or portion thereof (e.g., row by row). Thresholding may be performed based on a determined threshold cutoff, based on determining peak values of pixel intensities across rows, and/or in any suitable manner.
図13A~13Fは、画像化された試験ストリップから試験結果を予測するバリエーションの態様を示す概略図である。例えば、画像における診断試験の試験領域を分離する十分にクロッピングされた画像から出発し(図13A)、画像は、LAB又はYUV等の任意の好適な高コントラスト色空間に変換されてもよい(図13B)。変換された画像は、複数のカラーチャンネルに分割されてもよい(図13C)。例えば、LAB色空間の画像は、L、A、及びBチャンネルに分割することができる。高コントラストチャンネルの各列(例えば、赤/ピンクのラインを有する診断試験のためのA)について代表的又は記述的統計量(例えば、平均)を決定し、1Dアレイに凝縮してもよい(図13D)。試験ストリップ上の全てのラインが1Dアレイ内の1つのピークをもたらすはずなので、この1Dアレイ内のピークを位置決めし(図13E)、診断試験における潜在的ラインとして識別することができる。 13A-13F are schematic diagrams illustrating variations in predicting test results from imaged test strips. For example, starting from a fully cropped image that separates the test area of a diagnostic test in the image (Figure 13A), the image may be converted to any suitable high contrast color space such as LAB or YUV (Figure 13A). 13B). The transformed image may be divided into multiple color channels (FIG. 13C). For example, an image in LAB color space can be split into L, A, and B channels. Representative or descriptive statistics (e.g., means) may be determined for each row of high-contrast channels (e.g., A for a diagnostic test with red/pink lines) and condensed into a 1D array (Fig. 13D). Since every line on the test strip should result in one peak in the 1D array, the peak in this 1D array can be located (FIG. 13E) and identified as a potential line in the diagnostic test.
画像をグレースケールで分析する場合、グレースケール画像は、上記と同様の1Dアレイに凝縮されてもよく、このアレイの要素は、グレースケール画像の行又は列などの部分の代表的メトリック(例えば、平均値)である。同様に、この1次元アレイのピークは、診断試験における潜在的なラインとして位置付けられ、識別することができる。 When analyzing images in grayscale, the grayscale image may be condensed into a 1D array similar to that described above, where the elements of this array are representative metrics of a portion such as a row or column of the grayscale image (e.g. average value). Similarly, peaks in this one-dimensional array can be located and identified as potential lines in diagnostic tests.
一般に、色空間及びグレースケール画像分析の両方において、各ピークの相対位置が決定されてもよく、また各ピークのプロミネンスを決定することができる。幾つかのバリエーションにおいて、ラインの存在の決定は、ピークのプロミネンス、ピークの位置(例えば、他のピーク及び/又は試験領域の境界に対する相対位置)、及びピーク幅の何れか1又は2以上に基づいてもよい。幾つかのバリエーションにおいて、試験結果ラインを表す可能性のある他のピーク/ラインを検索する前に、コントロールラインを最初に(例えば、試験領域の境界線に対するピークの位置に基づく、ラインの最も強い存在として)識別することができる。ピークが見つからない場合、診断試験は無効として扱われる可能性がある。同様に、コントロールラインが見つからない場合、診断試験は無効として扱われてもよい。 In general, the relative position of each peak may be determined, and the prominence of each peak can be determined, both in color space and in grayscale image analysis. In some variations, the determination of the presence of a line is based on one or more of the prominence of the peak, the position of the peak (e.g., relative to other peaks and/or the boundaries of the test area), and the width of the peak. It's okay. In some variations, the control line is searched first (e.g., based on the peak's position relative to the test area border, the line's strongest can be identified (as an entity). If no peak is found, the diagnostic test may be treated as invalid. Similarly, if no control line is found, the diagnostic test may be treated as invalid.
例示的な例として、識別されたピークは、表1に示すような一連のルールの下で、繰り返しループ方式で(例えば、全てのピークに対して「for」ループで)分析することができる。コントロールライン及び/又は試験ラインの予想される位置、及び/又はこれらのラインに対する閾値は、画像化される診断試験のタイプに関連する設定ファイルからの情報に基づいてもよい。或いは、このような位置は、公称位置値など、他の方法で予め決められてもよい。 As an illustrative example, the identified peaks can be analyzed in an iterative loop fashion (eg, in a "for" loop for all peaks) under a set of rules as shown in Table 1. The expected locations of control lines and/or test lines and/or threshold values for these lines may be based on information from a configuration file related to the type of diagnostic test being imaged. Alternatively, such position may be predetermined in other ways, such as by a nominal position value.
以下の表において、表記の閾値変数は、次のように相対的な値を有する。
[極めて低い閾値]<[僅かに低い閾値]<[比較的低い閾値]。
表1.診断試験結果予測のための画像におけるピークの分析
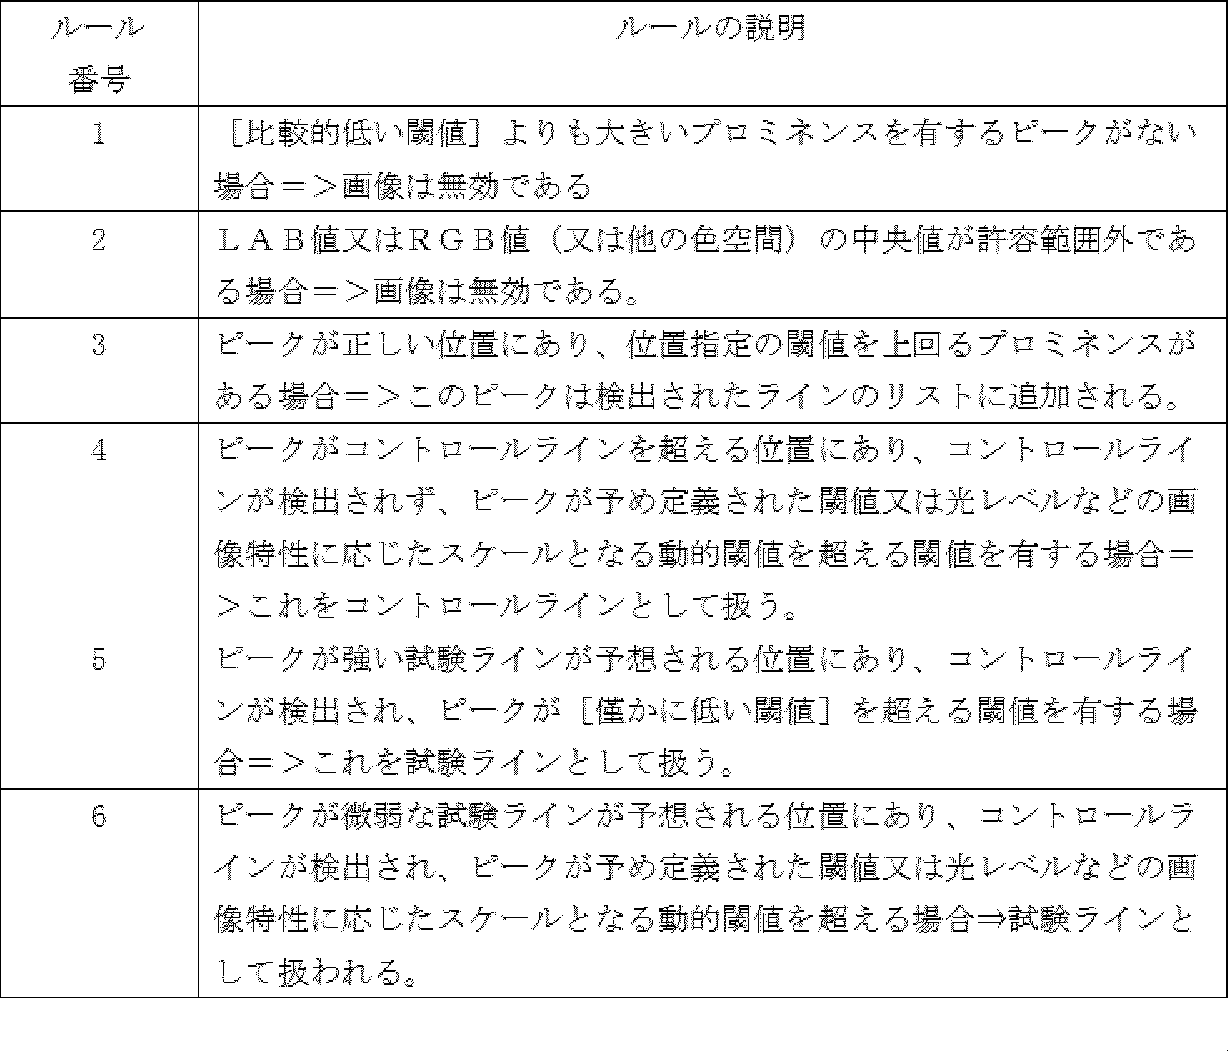
[very low threshold] < [slightly low threshold] < [relatively low threshold].
Table 1. Analysis of peaks in images for predicting diagnostic test results
加えて又は代替的に、試験領域の正確な位置が決定されると(例えば、上述の技術の何れかを介して)、試験領域内のラインの強度が、試験領域内の予想される位置(例えば、その特定の種類の診断試験用のアッセイウィンドウ内の既知のライン位置)で測定され得る。これらのライン強度は、診断試験用の試験ストリップの製造公差に従った位置の範囲で測定することができる。例えば、試験ライン位置に関する既知の製造公差が1mmの範囲(例えば、公称試験ライン位置に対して±0.5mm、又は公称試験ライン位置の左側から0.5mmと公称試験ライン位置の右側の間)を有する場合、その試験ラインに対するライン強度測定は試験領域内のその同じ1mm空間範囲内の画像位置で実行することができる。幾つかのバリエーションにおいて、その1mmの空間範囲領域における最大強度を、試験結果を分析する目的のために代表的なライン強度として使用することができる。しかしながら、他の代表値(例えば、ライン強度値の平均値、ライン強度値の上位四分位値の平均値など)を、試験結果を分析する目的のために使用することができる。更に、1mmの製造公差は例示のための例に過ぎず、具体的な適切な値は、診断試験タイプ、診断試験ブランド等によって異なる可能性があることを理解されたい。 Additionally or alternatively, once the exact location of the test area is determined (e.g., via any of the techniques described above), the intensities of the lines within the test area may be determined from the expected location within the test area ( For example, a known line position within the assay window for that particular type of diagnostic test). These line intensities can be measured at a range of locations subject to manufacturing tolerances of test strips for diagnostic testing. For example, the known manufacturing tolerance for the test line position is within 1 mm (e.g. ±0.5 mm relative to the nominal test line position, or between 0.5 mm from the left side of the nominal test line position and the right side of the nominal test line position) , line intensity measurements for that test line can be performed at image locations within that same 1 mm spatial extent within the test area. In some variations, the maximum intensity in that 1 mm spatial coverage area can be used as a representative line intensity for purposes of analyzing test results. However, other representative values (e.g., the average value of line intensity values, the average value of the upper quartile of line intensity values, etc.) can be used for purposes of analyzing test results. Furthermore, it is to be understood that the manufacturing tolerance of 1 mm is an illustrative example only, and that specific appropriate values may vary depending on the diagnostic test type, diagnostic test brand, etc.
加えて又は代替的に、画像の試験領域部分を、1又は2以上の適切な学習済み機械学習モデル(例えば、深層学習技術)を使用して試験結果を予測するために分析することができる。例えば、機械学習モデルは、様々なタイプの診断試験についてラベル付けされた試験結果(例えば、微弱陽性、中程度の強陽性、強陽性など)を有する画像を含む訓練データを用いて、教師あり方式で訓練することができる。この訓練データは、画像から試験結果を予測するために、ニューラルネットワーク又は他の適切なタイプの機械学習技術を訓練するのに使用することができる。教師なし又は半教師ありの方法で訓練された機械学習モデルは、追加的又は代替的に、画像から試験結果を予測するのに使用することができる。 Additionally or alternatively, the test region portion of the image can be analyzed to predict test results using one or more suitable trained machine learning models (eg, deep learning techniques). For example, a machine learning model can be developed in a supervised manner using training data containing images with labeled test results (e.g., weak positive, moderately strong positive, strong positive, etc.) for different types of diagnostic tests. can be trained with. This training data can be used to train a neural network or other suitable type of machine learning technique to predict test results from images. Machine learning models trained in an unsupervised or semi-supervised manner can additionally or alternatively be used to predict test results from images.
本方法は、主にラテラルフローイムノアッセイ試験の分析を参照して上述されているが、本方法の態様は、他のタイプの診断試験(例えば、比色イムノアッセイ試験)にも適用することができることが理解される。例えば、幾つかのバリエーションにおいて、比色イムノアッセイ試験の分析は、試験領域を特定するステップ(例えば、スキャン面上のフィデューシャルの使用)を含むことができる。しかしながら、コントロールライン及び/又は試験ラインの位置特定を含む代わりに、比色試験の試験結果を予測するステップは、コントロール容器及び/又は診断試験容器を位置特定するステップと、診断試験容器内のサンプルの検出色を1又は2以上の所定の色(例えば、色基準配列)と比較して、試験結果を評価するステップと、を含むことができる。幾つかのバリエーションにおいて、色に基づく画像分析は、米国特許第8,655,009号及び第8,911,679号明細書に記載されているものと同様とすることができ、その各々が上記に組み込まれている。 Although the method is described above primarily with reference to the analysis of lateral flow immunoassay tests, aspects of the method can also be applied to other types of diagnostic tests (e.g., colorimetric immunoassay tests). be understood. For example, in some variations, analysis of a colorimetric immunoassay test can include identifying a test area (eg, using fiducials on the scan plane). However, instead of including locating a control line and/or a test line, predicting the test result of a colorimetric test includes locating a control vessel and/or a diagnostic test vessel, and a sample within the diagnostic test vessel. comparing the detected color to one or more predetermined colors (eg, a color reference array) to evaluate the test results. In some variations, the color-based image analysis can be similar to that described in U.S. Patent Nos. 8,655,009 and 8,911,679, each of which is described above. incorporated into.
更に、比色試験を分析するための幾つかのバリエーションにおいて、試験領域(例えば、試薬パッド)は、適切な輪郭アルゴリズムによるなど、その輪郭を見つけることによって位置特定することができる。試験領域が画像内に位置されると、試験領域を描写する画像の部分は、その色の分析に最適な色空間に変換されることができる。例えば、多くの場合、LAB、YUV又はCIE-XYZ色空間は、試薬パッドの色の分析に最適である。試験領域画像部分が分離され、適切な色空間に変換されると、その色に関する記述的統計量を測定することができる。例えば、試験領域画像部分の記述統計量(例えば、色空間のカラーチャンネルにおける値)の中央値が測定される。幾つかのバリエーションにおいて、この記述的統計量の計算が行われる前に、試験領域上でグレア又は異物が検出される任意の領域を無視することができる。このようなグレア及び/又は異物は、例えば、上述したように検出することができる。 Furthermore, in some variations for analyzing colorimetric tests, the test area (eg, reagent pad) can be located by finding its contour, such as by a suitable contour algorithm. Once the test area is located within the image, the portion of the image depicting the test area can be transformed into a color space that is optimal for analysis of its colors. For example, LAB, YUV or CIE-XYZ color spaces are often best suited for analyzing the color of reagent pads. Once the test area image portion is separated and transformed into the appropriate color space, descriptive statistics regarding its color can be measured. For example, the median value of a descriptive statistic (eg, a value in a color channel of a color space) of a test region image portion is measured. In some variations, any areas where glare or foreign objects are detected on the test area can be ignored before this descriptive statistic calculation is performed. Such glare and/or foreign objects can be detected, for example, as described above.
幾つかのバリエーションにおいて、任意の測色診断試験画像のシーンに存在するのは、基準色ブロック又はスキャン面上に印刷され画像内に描かれた他のアイコンのような基準色であり得る。これらの基準色ブロックは、その輪郭を見つけることによって位置特定することができる。基準色ブロックが位置特定されると、これらの色ブロックの画像は、その色の分析に最適な色空間に変換することができる。カラーブロックを表す記述統計量は、上述したものと同様に計算することができる。この記述統計量を用いて色補正行列を生成し、これを画像全体又は注目領域だけに適用することができる。この色補正マトリックスは、試薬パッドの色の測定に対する異常な照明条件の影響を軽減するのに役立つ。 In some variations, present in the scene of any colorimetric diagnostic test image may be a reference color, such as a reference color block or other icon printed on the scan surface and drawn within the image. These reference color blocks can be located by finding their contours. Once the reference color blocks are located, images of these color blocks can be transformed into a color space that is optimal for analysis of that color. Descriptive statistics representing color blocks can be calculated similarly to those described above. The descriptive statistics can be used to generate a color correction matrix that can be applied to the entire image or just the region of interest. This color correction matrix helps reduce the effects of unusual lighting conditions on the measurement of reagent pad color.
幾つかのバリエーションにおいて、試薬パッドの色値は、次に、ルックアップテーブル又は式などを用いて、試薬濃度及び対応する試験結果に変換されてもよく、これらは、メモリに記憶されて適切な時間にアクセスすることができる。 In some variations, the color values of the reagent pads may then be converted to reagent concentrations and corresponding test results, such as using look-up tables or formulas, which are stored in memory and applied to the appropriate test results. be able to access time.
(試験結果の伝達)
試験結果が予測された後、これらは、適切なエンティティに出力されるか、又は他の方法で伝達することができる。例えば、幾つかのバリエーションにおいて、試験結果は、診断プラットフォームに関連するモバイルアプリケーションを通じて、通知メッセージを通じて、電子メールを通じて、又は任意の適切な方法で、ユーザに伝達することができる。加えて又は代替的に、試験結果は、診断プラットフォームと通信する関連するダッシュボード又は他の適切なシステムを介してなど、ユーザのための医療ケアチームに伝達することができる。更に、幾つかのバリエーションにおいて、試験結果は、ユーザのための適切な電子健康記録又は他のメモリ記憶デバイスに伝達することができる。
(Communication of test results)
After test results are predicted, they can be output to the appropriate entity or otherwise communicated. For example, in some variations, test results may be communicated to the user through a mobile application associated with the diagnostic platform, through a notification message, through email, or in any suitable manner. Additionally or alternatively, test results may be communicated to the user's medical care team, such as via an associated dashboard or other suitable system in communication with the diagnostic platform. Additionally, in some variations, test results may be communicated to an appropriate electronic health record or other memory storage device for the user.
診断プラットフォームは、幾つかのバリエーションにおいて、予測された試験結果に鑑みて、1又は2以上の様々なフォローアップアクションをサポートすることができる。例えば、診断プラットフォームは、ユーザが適切な医療従事者と接続され、医療を進めるための質問又は選択肢を議論することをサポートすることができる。診断プラットフォームは、適切な医療従事者との直接の面会を提案及び/又は促進することができる。加えて又は代替的に、診断プラットフォームは、適切な薬の処方を提供すること、一般的な医療指導及び/又はリソースへのリンクを提供すること、及び/又は試験結果を考慮してユーザの医療を進めるための他の適切な行動をサポートすることができる。 The diagnostic platform may, in some variations, support one or more various follow-up actions in light of predicted test results. For example, a diagnostic platform can support users to connect with appropriate medical professionals and discuss questions or options to proceed with medical care. The diagnostic platform may suggest and/or facilitate a face-to-face meeting with an appropriate medical professional. Additionally or alternatively, the diagnostic platform may provide appropriate medication prescriptions, provide general medical guidance and/or links to resources, and/or update the user's medical care in light of test results. can support other appropriate actions to advance the process.
(例示的な実施形態)
実施形態1.
診断試験を分析するための方法であって、
1又は2以上のプロセッサにおいて、
診断試験を描写する画像を受信するステップであって、診断試験は、試験結果を示す試験領域を含む、ステップと、
画像の品質を確認するステップと、
診断試験の試験領域を描写している画像の試験領域画像部分を位置特定するステップと、
試験領域画像部分に基づいて試験結果を予測するステップと、
を含む、方法。
(Exemplary Embodiment)
Embodiment 1.
A method for analyzing a diagnostic test, the method comprising:
In one or more processors,
receiving an image depicting a diagnostic test, the diagnostic test including a test area showing test results;
a step of checking the quality of the image;
locating a test region image portion of the image depicting the test region of the diagnostic test;
predicting a test result based on the test region image portion;
including methods.
実施形態2.
画像の品質を確認するステップが、受信した画像における照明レベル、カラーバランス、ノイズレベル、画像ボケレベル、影の存在、及びグレアの存在のうちの少なくとも1つを評価するステップを含む、実施形態1に記載の方法。
Embodiment 2.
In embodiment 1, the step of verifying the quality of the image includes evaluating at least one of the following: illumination level, color balance, noise level, image blur level, presence of shadow, and presence of glare in the received image. Method described.
実施形態3.
画像の品質を確認するステップが、受信した画像における診断試験の位置及び方向のうちの少なくとも1つを評価するステップを含む、実施形態1に記載の方法。
Embodiment 3.
2. The method of embodiment 1, wherein verifying image quality comprises evaluating at least one of a position and an orientation of the diagnostic test in the received image.
実施形態4.
画像の品質を確認するステップが、受信した画像における1又は2以上のコントロールマーキングの画像化品質を確認するステップを含む、実施形態1に記載の方法。
Embodiment 4.
2. The method of embodiment 1, wherein verifying the quality of the image comprises verifying the imaging quality of the one or more control markings in the received image.
実施形態5.
1又は2以上のコントロールマーキングが、複数のラインを含む、実施形態1に記載の方法。
Embodiment 5.
2. The method of embodiment 1, wherein the one or more control markings include multiple lines.
実施形態6.
1又は2以上のコントロールマーキングが、複数の色を含む、実施形態4に記載の方法。
Embodiment 6.
5. The method of embodiment 4, wherein the one or more control markings include multiple colors.
実施形態7.
試験領域画像部分を位置特定するステップが、画像における診断試験の境界を特定するステップを含む、実施形態1に記載の方法。
2. The method of embodiment 1, wherein locating the test area image portion includes identifying boundaries of a diagnostic test in the image.
実施形態8.
画像における診断試験の境界を特定するステップが、高コントラストの背景に対して診断試験の境界を特定するステップを含む、実施形態7に記載の方法。
Embodiment 8.
8. The method of
実施形態9.
試験領域画像部分を位置特定するステップが、画像における診断試験の境界に対する1又は2以上の所定の試験領域座標に少なくとも部分的に基づいて、試験領域画像部分を位置特定するステップを含む、実施形態7に記載の方法。
Embodiment 9.
Embodiments wherein locating the test area image portion comprises locating the test area image portion based at least in part on one or more predetermined test area coordinates relative to a boundary of a diagnostic test in the image. The method described in 7.
実施形態10.
1又は2以上の所定の試験領域座標は、診断試験のタイプと関連付けられている、実施形態9に記載の方法。
Embodiment 10.
10. The method of embodiment 9, wherein the one or more predetermined test area coordinates are associated with a type of diagnostic test.
実施形態11.
試験領域画像部分を位置特定するステップが、画像におけるスキャン面上に1又は2以上のフィデューシャルを特定するステップと、1又は2以上のフィデューシャルの位置に基づいて試験領域画像部分を位置特定するステップとを含む、実施形態1記載の方法。
Embodiment 11.
locating the test area image portion includes identifying one or more fiducials on a scan plane in the image; and locating the test area image portion based on the position of the one or more fiducials. The method of embodiment 1, comprising the step of identifying.
実施形態12.
試験領域画像部分を位置特定するステップが、画像における所定のカラーチャンネルのピーク代表値を有する関心画像部分を特定するステップと、関心画像部分における所定のカラーチャンネルの最大輪郭の位置に基づいて試験領域画像部分を位置特定するステップとを含む、実施形態1に記載の方法。
Embodiment 12.
locating the test area image portion includes identifying an image portion of interest having a peak representative value of the predetermined color channel in the image; and locating the image portion.
実施形態13.
所定のカラーチャンネルは、LAB、YUV、HSV、XYZ、及びCYMKからなる群から選択される色空間内にある、実施形態11に記載の方法。
Embodiment 13.
12. The method of embodiment 11, wherein the predetermined color channel is within a color space selected from the group consisting of LAB, YUV, HSV, XYZ, and CYMK.
実施形態14.
試験結果を予測するステップが、試験領域画像部分における所定のカラーチャンネル内の1又は2以上のピークプロミネンスを特定するステップを含む、実施形態1に記載の方法。
Embodiment 14.
2. The method of embodiment 1, wherein predicting a test result includes identifying one or more peak prominences within a predetermined color channel in the test region image portion.
実施形態15.
試験結果を予測するステップが、試験領域画像部分におけるコントロール及び結果インジケータの少なくとも1つについて、1又は2以上のピークプロミネンスを評価するステップを含む、実施形態1に記載の方法。
Embodiment 15.
2. The method of embodiment 1, wherein predicting a test result comprises evaluating one or more peak prominences for at least one of a control and a result indicator in the test region image portion.
実施形態16.
ユーザの1又は2以上の画像を受信するステップと、ユーザの1又は2以上の画像に基づいてユーザによりサンプル採取を検証するステップとを更に含む、実施形態1に記載の方法。
Embodiment 16.
2. The method of embodiment 1, further comprising receiving one or more images of the user and verifying sample collection by the user based on the one or more images of the user.
実施形態17.
受信した画像に描かれた診断試験のタイプを特定するステップを更に含む、実施形態1に記載の方法。
Embodiment 17.
2. The method of embodiment 1, further comprising identifying the type of diagnostic test depicted in the received image.
実施形態18.
予測された試験結果をユーザに伝達するステップを更に含む、実施形態1に記載の方法。
Embodiment 18.
2. The method of embodiment 1, further comprising communicating predicted test results to a user.
実施形態19.
診断試験が、ラテラルフローイムノアッセイ試験を含む、実施形態1に記載の方法。
Embodiment 19.
The method of embodiment 1, wherein the diagnostic test comprises a lateral flow immunoassay test.
実施形態20.
ラテラルフローイムノアッセイ試験が、ダイレクトフローイムノアッセイ試験である、実施形態19に記載の方法。
Embodiment 20.
20. The method of embodiment 19, wherein the lateral flow immunoassay test is a direct flow immunoassay test.
実施形態21.
診断試験が、比色イムノアッセイ試験を含む、実施形態1記載の方法。
Embodiment 21.
The method of embodiment 1, wherein the diagnostic test comprises a colorimetric immunoassay test.
実施形態22.
比色イムノアッセイ試験が、等温増幅試験である、実施形態21記載の方法。
Embodiment 22.
22. The method of embodiment 21, wherein the colorimetric immunoassay test is an isothermal amplification test.
実施形態23.
診断試験の分析を容易にする方法であって、
1又は2以上のプロセッサにおいて、
スキャン面上の1又は2以上のコントロールマーキングを描写する1又は2以上の画像を受信するステップであって、1又は2以上のコントロールマーキングは、診断試験に関する1又は2以上の所定の試験結果を表す、ステップと、
少なくとも1つのコンピュータビジョン技術を使用して、1又は2以上の画像における1又は2以上のコントロールマーキングの検出を検証するステップと、
を含む、方法。
Embodiment 23.
A method of facilitating analysis of a diagnostic test, the method comprising:
In one or more processors,
receiving one or more images depicting one or more control markings on the scan surface, the one or more control markings indicating one or more predetermined test results for the diagnostic test; represents a step and
verifying the detection of the one or more control markings in the one or more images using at least one computer vision technique;
including methods.
実施形態24.
画像の少なくとも1つは、診断試験及び1又は2以上のコントロールマーキングを描写する、実施形態23に記載の方法。
Embodiment 24.
24. The method of embodiment 23, wherein at least one of the images depicts a diagnostic test and one or more control markings.
実施形態25.
診断試験を描写する1又は2以上の画像を別々に受信するステップを更に含む、実施形態23に記載の方法。
Embodiment 25.
24. The method of embodiment 23, further comprising separately receiving one or more images depicting a diagnostic test.
実施形態26.
1又は2以上の画像における1又は2以上のコントロールマーキングの検出を検証するステップが、1又は2以上のコントロールマーキングに関連する一連の画素の代表値のアレイを生成するステップと、アレイにおけるピーク及び/又はプロミネンスを決定するステップと、ピーク及び/又はプロミネンスを1又は2以上の所定の閾値と比較するステップとを含む、実施形態23に記載の方法。
Embodiment 26.
Verifying detection of the one or more control markings in the one or more images includes generating an array of representative values of a series of pixels associated with the one or more control markings; 24. The method of embodiment 23, comprising: determining a prominence; and comparing the peak and/or prominence to one or more predetermined thresholds.
実施形態27.
1又は2以上のコントロールマーキングの検出を検証するステップは、1又は2以上の画像における白色空間をネガティブコントロールとして処理するステップを含む、実施形態26に記載の方法。
Embodiment 27.
27. The method of embodiment 26, wherein verifying detection of the one or more control markings comprises treating white space in the one or more images as a negative control.
実施形態28.
1又は2以上のコントロールマーキングを描写する1又は2以上の画像において1又は2以上のコントロールマーキングを検出することに応答して、診断試験の画像に基づいて診断試験の試験結果を予測するステップを更に含む、実施形態23に記載の方法。
Embodiment 28.
predicting a test result of the diagnostic test based on the image of the diagnostic test in response to detecting the one or more control markings in the one or more images depicting the one or more control markings; 24. The method of embodiment 23, further comprising.
実施形態29.
1又は2以上のコントロールマーキングを描写する1又は2以上の画像において1又は2以上のコントロールマーキングを検出できないことに応答してユーザに通知するステップを更に含む、実施形態23に記載の方法。
Embodiment 29.
24. The method of embodiment 23, further comprising notifying a user in response to not being able to detect one or more control markings in the one or more images depicting the one or more control markings.
実施形態30.
診断試験が、ラテラルフローイムノアッセイ試験を含み、1又は2以上のコントロールマーキングが、1又は2以上のラインを含む、実施形態23に記載の方法。
Embodiment 30.
24. The method of embodiment 23, wherein the diagnostic test comprises a lateral flow immunoassay test and the one or more control markings comprise one or more lines.
実施形態31.
1又は2以上のラインが、太さ、色、色相、及び反射率のうちの少なくとも1つが異なる、実施形態30に記載の方法。
Embodiment 31.
31. The method of embodiment 30, wherein the one or more lines differ in at least one of thickness, color, hue, and reflectance.
実施形態32.
1又は2以上のラインは、黒色及び/又は灰色のラインを含む、実施形態30に記載の方法。
Embodiment 32.
31. The method of embodiment 30, wherein the one or more lines include black and/or gray lines.
実施形態33.
診断試験が、比色イムノアッセイ試験を含み、1又は2以上のコントロールマーキングが、1又は2以上の色を含む、実施形態23に記載の方法。
Embodiment 33.
24. The method of embodiment 23, wherein the diagnostic test comprises a colorimetric immunoassay test and the one or more control markings include one or more colors.
実施形態34.
スキャン面が更に、1又は2以上のコントロールマーキングに近接した試験配置ガイドを備え、試験配置ガイドが、診断試験の配置をガイドするように構成される、実施形態23に記載の方法。
Embodiment 34.
24. The method of embodiment 23, wherein the scanning surface further comprises a test placement guide proximate the one or more control markings, the test placement guide configured to guide placement of the diagnostic test.
実施形態35.
診断試験の分析を容易にするためのシステムであって、
1又は2以上のコントロールマーキングを含むスキャン面を備え、
1又は2以上のコントロールマーキングは、診断試験に関する1又は2以上の所定の試験結果を表す、システム。
Embodiment 35.
A system for facilitating analysis of diagnostic tests, the system comprising:
comprising a scan surface including one or more control markings;
The system wherein the one or more control markings represent one or more predetermined test results for the diagnostic test.
実施形態36.
スキャン面は更に、診断試験の配置を示す試験配置ガイドを備える、実施形態35に記載のシステム。
Embodiment 36.
36. The system of embodiment 35, wherein the scan surface further comprises a test placement guide that indicates placement of a diagnostic test.
実施形態37.
試験配置ガイドが、診断試験と対照的な色を有する、実施形態36に記載のシステム。
Embodiment 37.
37. The system of embodiment 36, wherein the test placement guide has a color that contrasts with the diagnostic test.
実施形態38.
試験配置ガイドが、診断試験の外形を示す、実施形態36に記載のシステム。
Embodiment 38.
37. The system of embodiment 36, wherein the test placement guide indicates the outline of a diagnostic test.
実施形態39.
診断試験が、ラテラルフローイムノアッセイ試験を含み、1又は2以上のコントロールマーキングが、1又は2以上のラインを含む、実施形態35に記載のシステム。
Embodiment 39.
36. The system of embodiment 35, wherein the diagnostic test includes a lateral flow immunoassay test and the one or more control markings include one or more lines.
実施形態40.
1又は2以上のラインが、太さ、色、色相、及び反射率の少なくとも1つが異なる、実施形態39に記載のシステム。
Embodiment 40.
40. The system of embodiment 39, wherein the one or more lines differ in at least one of thickness, color, hue, and reflectance.
実施形態41.
1又は2以上のラインは、黒色及び/又は灰色ラインを含む、実施形態39に記載のシステム。
Embodiment 41.
40. The system of embodiment 39, wherein the one or more lines include black and/or gray lines.
実施形態42.
診断試験が、比色イムノアッセイ試験を含み、1又は2以上のコントロールマーキングが、1又は2以上の色を含む、実施形態35に記載のシステム。
Embodiment 42.
36. The system of embodiment 35, wherein the diagnostic test comprises a colorimetric immunoassay test and the one or more control markings include one or more colors.
実施形態43.
スキャン面が更に、少なくとも1つの空間フィデューシャルを含む、実施形態35に記載のシステム。
Embodiment 43.
36. The system of embodiment 35, wherein the scan plane further includes at least one spatial fiducial.
実施形態44.
スキャン面が、識別情報を有する少なくとも1つのコンピュータ可読コードを含む、実施形態35に記載のシステム。
Embodiment 44.
36. The system of embodiment 35, wherein the scan surface includes at least one computer readable code having identifying information.
実施形態45.
1又は2以上のコントロールマーキングは、スキャン面上に印刷されている、実施形態35に記載のシステム。
Embodiment 45.
36. The system of embodiment 35, wherein the one or more control markings are printed on the scan surface.
実施形態46.
1又は2以上のコントロールマーキングは、インク又はトナーで印刷される、実施形態45に記載のシステム。
Embodiment 46.
46. The system of embodiment 45, wherein the one or more control markings are printed with ink or toner.
実施形態47.
1又は2以上のコントロールマーキングは、蛍光インクで印刷されている、実施形態46に記載のシステム。
Embodiment 47.
47. The system of embodiment 46, wherein the one or more control markings are printed with fluorescent ink.
実施形態48.
蛍光インクが、ユーロピウム、ローダミン、フルオレセイン、アレクサフロ、量子ドット、及び蛍光ナノ粒子からなる群から選択される少なくとも1つを含む、実施形態47に記載のシステム。
Embodiment 48.
48. The system of embodiment 47, wherein the fluorescent ink comprises at least one selected from the group consisting of europium, rhodamine, fluorescein, alexaflo, quantum dots, and fluorescent nanoparticles.
実施形態49.
診断試験キットであって、
試験結果を示すための試験領域を含む診断試験と、
1又は2以上のコントロールマーキングを含むスキャン面と、
を備え、1又は2以上のコントロールマーキングは、診断試験に関する1又は2以上の所定の試験結果を表す、診断試験キット。
Embodiment 49.
A diagnostic test kit,
a diagnostic test including a test area for indicating test results;
a scan surface including one or more control markings;
A diagnostic test kit comprising: the one or more control markings representing one or more predetermined test results regarding the diagnostic test.
実施形態50.
診断試験が、ラテラルフローイムノアッセイ試験を含み、1又は2以上のコントロールマーキングが、1又は2以上のラインを含む、実施形態49に記載の診断試験キット。
Embodiment 50.
50. The diagnostic test kit of embodiment 49, wherein the diagnostic test comprises a lateral flow immunoassay test and the one or more control markings comprise one or more lines.
実施形態51.
1又は2以上のラインは太さが異なる、実施形態50に記載の診断試験キット。
Embodiment 51.
51. The diagnostic test kit of embodiment 50, wherein the one or more lines have different thicknesses.
実施形態52.
1又は2以上のラインは色が異なる、実施形態50に記載の診断試験キット。
Embodiment 52.
51. The diagnostic test kit of embodiment 50, wherein the one or more lines are different colors.
実施形態53.
1又は2以上のラインは色相が異なる、実施形態50に記載の診断試験キット。
Embodiment 53.
51. The diagnostic test kit of embodiment 50, wherein the one or more lines have different hues.
実施形態54.
1又は2以上のラインは反射率が異なる、実施形態50に記載の診断試験キット。
Embodiment 54.
51. The diagnostic test kit of embodiment 50, wherein the one or more lines have different reflectances.
実施形態55.
1又は2以上のラインは、黒色及び/又は灰色である、実施形態50に記載の診断試験キット。
Embodiment 55.
51. The diagnostic test kit of embodiment 50, wherein the one or more lines are black and/or gray.
実施形態56.
1又は2以上のラインは、診断試験における試験結果ラインの予想される色に一致する色である、実施形態50に記載の診断試験キット。
Embodiment 56.
51. The diagnostic test kit of embodiment 50, wherein the one or more lines are of a color that matches the expected color of a test result line in a diagnostic test.
実施形態57.
診断試験が、比色イムノアッセイ試験を含み、1又は2以上のコントロールマーキングが、複数の色を含む、実施形態49に記載の診断試験キット。
Embodiment 57.
50. The diagnostic test kit of embodiment 49, wherein the diagnostic test comprises a colorimetric immunoassay test and the one or more control markings include multiple colors.
実施形態58.
1又は2以上のコントロールマーキングは、スキャン面上に印刷される、実施形態49に記載の診断試験キット。
Embodiment 58.
50. The diagnostic test kit of embodiment 49, wherein the one or more control markings are printed on the scan surface.
実施形態59.
1又は2以上のコントロールマーキングは、インク又はトナーで印刷される、実施形態58に記載の診断試験キット。
Embodiment 59.
59. The diagnostic test kit of embodiment 58, wherein the one or more control markings are printed with ink or toner.
実施形態60.
1又は2以上のコントロールマーキングは、蛍光インクで印刷されている、実施形態59に記載の診断試験キット。
Embodiment 60.
60. The diagnostic test kit of embodiment 59, wherein the one or more control markings are printed with fluorescent ink.
実施形態61.
蛍光インクが、ユーロピウム、ローダミン、フルオレセイン、アレキサフルオロ、量子ドット、及び蛍光ナノ粒子からなる群から選択される少なくとも1つを含む、実施形態60に記載の診断試験キット。
Embodiment 61.
61. The diagnostic test kit of embodiment 60, wherein the fluorescent ink comprises at least one selected from the group consisting of europium, rhodamine, fluorescein, alexafluoro, quantum dots, and fluorescent nanoparticles.
実施形態62.
スキャン面が更に、1又は2以上のコントロールマーキングに近接した試験配置ガイドを備え、試験配置ガイドが、診断試験の配置をガイドするように構成される、実施形態49に記載の診断試験キット。
Embodiment 62.
50. The diagnostic test kit of embodiment 49, wherein the scanning surface further comprises a test placement guide proximate the one or more control markings, the test placement guide configured to guide placement of the diagnostic test.
実施形態63.
スキャン面が第1のスキャン面であり、診断試験キットが更に、第1のスキャン面とは別の第2のスキャン面を備え且つ試験配置ガイドを含む、実施形態49に記載の診断試験キット。
Embodiment 63.
50. The diagnostic test kit of embodiment 49, wherein the scan surface is a first scan surface, and the diagnostic test kit further comprises a second scan surface that is separate from the first scan surface and includes a test placement guide.
実施形態64.
加熱デバイスを更に備える、実施形態49に記載の診断試験キット。
Embodiment 64.
50. The diagnostic test kit of embodiment 49, further comprising a heating device.
実施形態65.
加熱デバイスと加熱デバイスに近接した試験配置ガイドとを含むハウジングを更に備え、試験配置ガイドは、診断試験の配置をガイドするように構成される、実施形態64に記載の診断試験キット。
Embodiment 65.
65. The diagnostic test kit of embodiment 64, further comprising a housing including a heating device and a test placement guide proximate the heating device, the test placement guide configured to guide placement of the diagnostic test.
実施形態66.
スキャン面が、ハウジング上に配置される、実施形態65に記載の診断試験キット。
Embodiment 66.
66. The diagnostic test kit of embodiment 65, wherein the scanning surface is disposed on the housing.
実施形態67.
ハウジングが、診断試験サンプルを受け入れるように構成されている、実施形態66に記載の診断試験キット。
Embodiment 67.
67. The diagnostic test kit of embodiment 66, wherein the housing is configured to receive a diagnostic test sample.
実施形態68.
ハウジングが、試験サンプル容器を受け入れるように構成されたレセプタクルを備える、実施形態67に記載の診断試験キット。
Embodiment 68.
68. The diagnostic test kit of embodiment 67, wherein the housing comprises a receptacle configured to receive a test sample container.
実施形態69.
レセプタクルが、加熱デバイスに近接している、実施形態68に記載の診断試験キット。
Embodiment 69.
69. The diagnostic test kit of embodiment 68, wherein the receptacle is proximate to the heating device.
前述の記載では、説明の目的で、本発明を十分に理解するために特定の標準名称を使用した。しかしながら、当業者には、本発明を実施するために特定の詳細が必要でないことは明らかであろう。従って、本発明の特定の実施形態の上述の説明は、例示及び説明の目的で提示される。これらは、網羅的であること、又は本発明を開示された正確な形態に限定することを意図しておらず、明らかに、多くの修正及び変形が、上記の教示に鑑みて可能である。これらの実施形態は、本発明の原理及びその実用的用途を説明するために選択及び説明されていることにより、これらは、当業者が企図される特定の用途に適するように様々な修正を加えて本発明及び様々な実施形態を利用することを可能にする。添付の特許請求の範囲及びその均等物が本発明の範囲を定めることが意図される。 In the foregoing description, for purposes of explanation, certain standard nomenclature has been used to provide a thorough understanding of the present invention. However, it will be apparent to those skilled in the art that these specific details are not required to practice the invention. Accordingly, the foregoing descriptions of specific embodiments of the invention are presented for purposes of illustration and description. They are not intended to be exhaustive or to limit the invention to the precise form disclosed, and obviously many modifications and variations are possible in light of the above teachings. Although these embodiments have been selected and described to illustrate the principles of the invention and its practical applications, it is understood that those skilled in the art will be able to make various modifications to suit the particular applications contemplated. The present invention and its various embodiments can be utilized in the following manner. It is intended that the following claims and their equivalents define the scope of the invention.
Claims (69)
1又は2以上のプロセッサにおいて、
診断試験を描写する画像を受信するステップであって、前記診断試験は、試験結果を示す試験領域を含む、ステップと、
前記画像の品質を確認するステップと、
前記診断試験の前記試験領域を描写している前記画像の試験領域画像部分を位置特定するステップと、
前記試験領域画像部分に基づいて前記試験結果を予測するステップと、
を含む、方法。 A method for analyzing a diagnostic test, the method comprising:
In one or more processors,
receiving an image depicting a diagnostic test, the diagnostic test including a test area showing test results;
checking the quality of the image;
locating a test area image portion of the image depicting the test area of the diagnostic test;
predicting the test result based on the test region image portion;
including methods.
1又は2以上のプロセッサにおいて、
スキャン面上の1又は2以上のコントロールマーキングを描写する1又は2以上の画像を受信するステップであって、前記1又は2以上のコントロールマーキングは、前記診断試験に関する1又は2以上の所定の試験結果を表す、ステップと、
少なくとも1つのコンピュータビジョン技術を使用して、前記1又は2以上の画像における前記1又は2以上のコントロールマーキングの検出を検証するステップと、
を含む、方法。 A method of facilitating analysis of a diagnostic test, the method comprising:
In one or more processors,
receiving one or more images depicting one or more control markings on a scan surface, the one or more control markings being one or more predetermined tests related to the diagnostic test; Steps representing results;
verifying the detection of the one or more control markings in the one or more images using at least one computer vision technique;
including methods.
1又は2以上のコントロールマーキングを含むスキャン面を備え、
前記1又は2以上のコントロールマーキングは、前記診断試験に関する1又は2以上の所定の試験結果を表す、システム。 A system for facilitating analysis of diagnostic tests, the system comprising:
comprising a scan surface including one or more control markings;
The one or more control markings represent one or more predetermined test results for the diagnostic test.
試験結果を示すための試験領域を含む診断試験と、
1又は2以上のコントロールマーキングを含むスキャン面と、
を備え、前記1又は2以上のコントロールマーキングは、前記診断試験に関する1又は2以上の所定の試験結果を表す、診断試験キット。 A diagnostic test kit,
a diagnostic test including a test area for indicating test results;
a scan surface including one or more control markings;
A diagnostic test kit, wherein the one or more control markings represent one or more predetermined test results regarding the diagnostic test.
Applications Claiming Priority (3)
| Application Number | Priority Date | Filing Date | Title |
|---|---|---|---|
| US202063079975P | 2020-09-17 | 2020-09-17 | |
| US63/079,975 | 2020-09-17 | ||
| PCT/US2021/025789 WO2022060415A1 (en) | 2020-09-17 | 2021-04-05 | Diagnostic test kits and methods of analyzing the same |
Publications (2)
| Publication Number | Publication Date |
|---|---|
| JP2023541663A true JP2023541663A (en) | 2023-10-03 |
| JPWO2022060415A5 JPWO2022060415A5 (en) | 2024-04-16 |
Family
ID=75675000
Family Applications (1)
| Application Number | Title | Priority Date | Filing Date |
|---|---|---|---|
| JP2023517379A Pending JP2023541663A (en) | 2020-09-17 | 2021-04-05 | Diagnostic test kit and its analysis method |
Country Status (8)
| Country | Link |
|---|---|
| US (1) | US20230296600A1 (en) |
| EP (1) | EP4214669A1 (en) |
| JP (1) | JP2023541663A (en) |
| KR (1) | KR20230082616A (en) |
| CN (1) | CN116250004A (en) |
| AU (1) | AU2021345448A1 (en) |
| CA (1) | CA3192942A1 (en) |
| WO (1) | WO2022060415A1 (en) |
Families Citing this family (1)
| Publication number | Priority date | Publication date | Assignee | Title |
|---|---|---|---|---|
| CN117058359A (en) * | 2023-08-11 | 2023-11-14 | 云南省农业科学院质量标准与检测技术研究所 | Quantitative colloidal gold test paper detection method and system based on computer vision |
Family Cites Families (10)
| Publication number | Priority date | Publication date | Assignee | Title |
|---|---|---|---|---|
| US8655009B2 (en) | 2010-09-15 | 2014-02-18 | Stephen L. Chen | Method and apparatus for performing color-based reaction testing of biological materials |
| WO2012061650A2 (en) | 2010-11-03 | 2012-05-10 | Teco Diagnostics | All-in-one specimen cup with optically readable results |
| GB201105474D0 (en) * | 2011-03-31 | 2011-05-18 | Albagaia Ltd | Testing apparatus |
| JP2015509582A (en) * | 2012-02-03 | 2015-03-30 | ユニバーシティ・オブ・シンシナティ | Methods, systems, and apparatus for analyzing colorimetric assays |
| WO2014025415A2 (en) * | 2012-08-08 | 2014-02-13 | Scanadu Incorporated | Method and apparatus for performing and quantifying color changes induced by specific concentrations of biological analytes in an automatically calibrated environment |
| US9972077B2 (en) * | 2014-05-12 | 2018-05-15 | Healthy.Io Ltd. | Method and system for automated visual analysis of a dipstick using standard user equipment |
| BR112019013331B1 (en) * | 2016-12-28 | 2022-04-26 | Neogen Corporation | Fluid retainer cartridge assembly and method of using it |
| EP3791167A1 (en) * | 2018-05-07 | 2021-03-17 | Immundiagnostik AG | System for analysing quantitative lateral flow chromatography |
| US11125749B2 (en) * | 2018-06-06 | 2021-09-21 | Reliant Immune Diagnostics, Inc. | System and method for remote colorimetry and ratiometric comparison and quantification in analysis of medical test results |
| GB201811927D0 (en) * | 2018-07-20 | 2018-09-05 | Experiment X Ltd | Lateral flow test strip immunoassay in vitro diagnostic device |
-
2021
- 2021-04-05 AU AU2021345448A patent/AU2021345448A1/en active Pending
- 2021-04-05 CA CA3192942A patent/CA3192942A1/en active Pending
- 2021-04-05 CN CN202180063419.XA patent/CN116250004A/en active Pending
- 2021-04-05 JP JP2023517379A patent/JP2023541663A/en active Pending
- 2021-04-05 WO PCT/US2021/025789 patent/WO2022060415A1/en unknown
- 2021-04-05 EP EP21721737.1A patent/EP4214669A1/en active Pending
- 2021-04-05 KR KR1020237011335A patent/KR20230082616A/en active Search and Examination
-
2023
- 2023-03-16 US US18/185,243 patent/US20230296600A1/en active Pending
Also Published As
| Publication number | Publication date |
|---|---|
| KR20230082616A (en) | 2023-06-08 |
| EP4214669A1 (en) | 2023-07-26 |
| CA3192942A1 (en) | 2022-03-24 |
| AU2021345448A1 (en) | 2023-04-20 |
| CN116250004A (en) | 2023-06-09 |
| WO2022060415A1 (en) | 2022-03-24 |
| US20230296600A1 (en) | 2023-09-21 |
| US20220084659A1 (en) | 2022-03-17 |
Similar Documents
| Publication | Publication Date | Title |
|---|---|---|
| JP6546605B2 (en) | Method of estimating blood component amount in liquid canister | |
| CN104969068B (en) | For the method and apparatus changed by the color that the biological analyte of certain concentration induces to be executed and quantified in automatic calibration environment | |
| EP3791167A1 (en) | System for analysing quantitative lateral flow chromatography | |
| AU2018356385B2 (en) | Methods and devices for performing an analytical measurement | |
| CN112219109A (en) | Calibration method for calibrating a camera of a mobile device for detecting an analyte in a sample | |
| JP2023517061A (en) | Calibrating a digital camera for use as a scanner | |
| US20230296600A1 (en) | Diagnostic test kits and methods of analyzing the same | |
| JP2014533857A (en) | Image processing | |
| US11996183B2 (en) | Methods of analyzing diagnostic test kits | |
| US20120038820A1 (en) | Rapid Test Quantitative Reader | |
| Svelto et al. | Skin prick test digital imaging system with manual, semiautomatic, and automatic wheal edge detection and area measurement | |
| EP3954990B1 (en) | Test strip fixation device for optical measurements of an analyte | |
| RU2809608C2 (en) | Calibration method for calibrating camera of mobile device for determining analyte in a sample | |
| CN116324406A (en) | Automatic discriminating system, automatic discriminating method, and automatic discriminating program | |
| CN117849043A (en) | Urine test paper analysis device and detection method thereof |
Legal Events
| Date | Code | Title | Description |
|---|---|---|---|
| A521 | Request for written amendment filed |
Free format text: JAPANESE INTERMEDIATE CODE: A523 Effective date: 20240403 |
|
| A621 | Written request for application examination |
Free format text: JAPANESE INTERMEDIATE CODE: A621 Effective date: 20240403 |