JP2017534378A - Method, system, and computer program product for determining hemodynamic parameters using signals obtained by multispectral imaging of blood flow and perfusion - Google Patents
Method, system, and computer program product for determining hemodynamic parameters using signals obtained by multispectral imaging of blood flow and perfusion Download PDFInfo
- Publication number
- JP2017534378A JP2017534378A JP2017519928A JP2017519928A JP2017534378A JP 2017534378 A JP2017534378 A JP 2017534378A JP 2017519928 A JP2017519928 A JP 2017519928A JP 2017519928 A JP2017519928 A JP 2017519928A JP 2017534378 A JP2017534378 A JP 2017534378A
- Authority
- JP
- Japan
- Prior art keywords
- meta
- signal
- interest
- region
- image
- Prior art date
- Legal status (The legal status is an assumption and is not a legal conclusion. Google has not performed a legal analysis and makes no representation as to the accuracy of the status listed.)
- Pending
Links
- 238000000034 method Methods 0.000 title claims abstract description 57
- 238000004590 computer program Methods 0.000 title claims abstract description 22
- 230000017531 blood circulation Effects 0.000 title claims description 85
- 230000008081 blood perfusion Effects 0.000 title claims description 57
- 230000000004 hemodynamic effect Effects 0.000 title claims description 14
- 238000000701 chemical imaging Methods 0.000 title 1
- 238000012545 processing Methods 0.000 claims abstract description 38
- 238000004458 analytical method Methods 0.000 claims description 41
- 230000010412 perfusion Effects 0.000 claims description 33
- 230000033001 locomotion Effects 0.000 claims description 22
- 210000000056 organ Anatomy 0.000 claims description 17
- QVGXLLKOCUKJST-UHFFFAOYSA-N atomic oxygen Chemical compound [O] QVGXLLKOCUKJST-UHFFFAOYSA-N 0.000 claims description 13
- 229910052760 oxygen Inorganic materials 0.000 claims description 13
- 239000001301 oxygen Substances 0.000 claims description 13
- 230000000241 respiratory effect Effects 0.000 claims description 10
- 230000002159 abnormal effect Effects 0.000 claims description 8
- 230000003205 diastolic effect Effects 0.000 claims description 7
- 230000006461 physiological response Effects 0.000 claims description 7
- 230000008569 process Effects 0.000 claims description 7
- 230000005856 abnormality Effects 0.000 claims description 5
- 102000001554 Hemoglobins Human genes 0.000 claims description 3
- 108010054147 Hemoglobins Proteins 0.000 claims description 3
- 230000009977 dual effect Effects 0.000 claims description 3
- 230000035488 systolic blood pressure Effects 0.000 claims description 3
- 238000003384 imaging method Methods 0.000 description 46
- 210000001519 tissue Anatomy 0.000 description 36
- 230000000747 cardiac effect Effects 0.000 description 34
- 238000009826 distribution Methods 0.000 description 20
- 238000010586 diagram Methods 0.000 description 19
- 239000000523 sample Substances 0.000 description 15
- 238000005259 measurement Methods 0.000 description 14
- 230000002093 peripheral effect Effects 0.000 description 12
- 230000000694 effects Effects 0.000 description 10
- 230000003595 spectral effect Effects 0.000 description 10
- 230000029058 respiratory gaseous exchange Effects 0.000 description 7
- 230000008859 change Effects 0.000 description 6
- 230000006870 function Effects 0.000 description 6
- 238000005516 engineering process Methods 0.000 description 5
- 239000012530 fluid Substances 0.000 description 5
- 210000000936 intestine Anatomy 0.000 description 5
- 210000003484 anatomy Anatomy 0.000 description 4
- 238000012544 monitoring process Methods 0.000 description 4
- 230000035479 physiological effects, processes and functions Effects 0.000 description 4
- 238000011002 quantification Methods 0.000 description 4
- 238000001228 spectrum Methods 0.000 description 4
- 230000008901 benefit Effects 0.000 description 3
- 210000004204 blood vessel Anatomy 0.000 description 3
- 230000007423 decrease Effects 0.000 description 3
- 210000004789 organ system Anatomy 0.000 description 3
- 230000035515 penetration Effects 0.000 description 3
- 230000035790 physiological processes and functions Effects 0.000 description 3
- 238000012935 Averaging Methods 0.000 description 2
- 238000013459 approach Methods 0.000 description 2
- 238000002591 computed tomography Methods 0.000 description 2
- 230000008602 contraction Effects 0.000 description 2
- 238000002474 experimental method Methods 0.000 description 2
- 210000003414 extremity Anatomy 0.000 description 2
- 230000001121 heart beat frequency Effects 0.000 description 2
- 210000005003 heart tissue Anatomy 0.000 description 2
- 239000003550 marker Substances 0.000 description 2
- 238000003333 near-infrared imaging Methods 0.000 description 2
- 230000003287 optical effect Effects 0.000 description 2
- 238000005192 partition Methods 0.000 description 2
- 230000001991 pathophysiological effect Effects 0.000 description 2
- 230000000737 periodic effect Effects 0.000 description 2
- 230000004962 physiological condition Effects 0.000 description 2
- 238000012800 visualization Methods 0.000 description 2
- 238000003491 array Methods 0.000 description 1
- 210000002565 arteriole Anatomy 0.000 description 1
- 230000005540 biological transmission Effects 0.000 description 1
- 210000004369 blood Anatomy 0.000 description 1
- 239000008280 blood Substances 0.000 description 1
- 238000004364 calculation method Methods 0.000 description 1
- 210000000748 cardiovascular system Anatomy 0.000 description 1
- 238000012937 correction Methods 0.000 description 1
- 238000007405 data analysis Methods 0.000 description 1
- 230000001419 dependent effect Effects 0.000 description 1
- 238000011161 development Methods 0.000 description 1
- 230000018109 developmental process Effects 0.000 description 1
- 238000003745 diagnosis Methods 0.000 description 1
- 238000002059 diagnostic imaging Methods 0.000 description 1
- 201000010099 disease Diseases 0.000 description 1
- 208000037265 diseases, disorders, signs and symptoms Diseases 0.000 description 1
- 238000011156 evaluation Methods 0.000 description 1
- 238000000605 extraction Methods 0.000 description 1
- 238000001595 flow curve Methods 0.000 description 1
- 238000001727 in vivo Methods 0.000 description 1
- 230000010354 integration Effects 0.000 description 1
- 230000002262 irrigation Effects 0.000 description 1
- 238000003973 irrigation Methods 0.000 description 1
- 238000002595 magnetic resonance imaging Methods 0.000 description 1
- 239000000463 material Substances 0.000 description 1
- 238000012986 modification Methods 0.000 description 1
- 230000004048 modification Effects 0.000 description 1
- 210000004165 myocardium Anatomy 0.000 description 1
- 239000013307 optical fiber Substances 0.000 description 1
- 230000004796 pathophysiological change Effects 0.000 description 1
- 230000035778 pathophysiological process Effects 0.000 description 1
- 230000007310 pathophysiology Effects 0.000 description 1
- 230000007903 penetration ability Effects 0.000 description 1
- 230000001766 physiological effect Effects 0.000 description 1
- 230000000644 propagated effect Effects 0.000 description 1
- 230000000541 pulsatile effect Effects 0.000 description 1
- 230000036391 respiratory frequency Effects 0.000 description 1
- 230000002441 reversible effect Effects 0.000 description 1
- 239000004065 semiconductor Substances 0.000 description 1
- 239000002689 soil Substances 0.000 description 1
- 230000003068 static effect Effects 0.000 description 1
- 230000001360 synchronised effect Effects 0.000 description 1
- 230000002123 temporal effect Effects 0.000 description 1
- 238000012546 transfer Methods 0.000 description 1
- 230000001052 transient effect Effects 0.000 description 1
- 230000002861 ventricular Effects 0.000 description 1
Images


Classifications
-
- A—HUMAN NECESSITIES
- A61—MEDICAL OR VETERINARY SCIENCE; HYGIENE
- A61B—DIAGNOSIS; SURGERY; IDENTIFICATION
- A61B5/00—Measuring for diagnostic purposes; Identification of persons
- A61B5/0059—Measuring for diagnostic purposes; Identification of persons using light, e.g. diagnosis by transillumination, diascopy, fluorescence
- A61B5/0082—Measuring for diagnostic purposes; Identification of persons using light, e.g. diagnosis by transillumination, diascopy, fluorescence adapted for particular medical purposes
-
- A—HUMAN NECESSITIES
- A61—MEDICAL OR VETERINARY SCIENCE; HYGIENE
- A61B—DIAGNOSIS; SURGERY; IDENTIFICATION
- A61B5/00—Measuring for diagnostic purposes; Identification of persons
- A61B5/02—Detecting, measuring or recording pulse, heart rate, blood pressure or blood flow; Combined pulse/heart-rate/blood pressure determination; Evaluating a cardiovascular condition not otherwise provided for, e.g. using combinations of techniques provided for in this group with electrocardiography or electroauscultation; Heart catheters for measuring blood pressure
- A61B5/026—Measuring blood flow
- A61B5/0261—Measuring blood flow using optical means, e.g. infrared light
-
- A—HUMAN NECESSITIES
- A61—MEDICAL OR VETERINARY SCIENCE; HYGIENE
- A61B—DIAGNOSIS; SURGERY; IDENTIFICATION
- A61B5/00—Measuring for diagnostic purposes; Identification of persons
- A61B5/05—Detecting, measuring or recording for diagnosis by means of electric currents or magnetic fields; Measuring using microwaves or radio waves
-
- A—HUMAN NECESSITIES
- A61—MEDICAL OR VETERINARY SCIENCE; HYGIENE
- A61N—ELECTROTHERAPY; MAGNETOTHERAPY; RADIATION THERAPY; ULTRASOUND THERAPY
- A61N1/00—Electrotherapy; Circuits therefor
- A61N1/02—Details
- A61N1/08—Arrangements or circuits for monitoring, protecting, controlling or indicating
-
- G—PHYSICS
- G06—COMPUTING; CALCULATING OR COUNTING
- G06T—IMAGE DATA PROCESSING OR GENERATION, IN GENERAL
- G06T7/00—Image analysis
- G06T7/0002—Inspection of images, e.g. flaw detection
- G06T7/0012—Biomedical image inspection
-
- G—PHYSICS
- G16—INFORMATION AND COMMUNICATION TECHNOLOGY [ICT] SPECIALLY ADAPTED FOR SPECIFIC APPLICATION FIELDS
- G16H—HEALTHCARE INFORMATICS, i.e. INFORMATION AND COMMUNICATION TECHNOLOGY [ICT] SPECIALLY ADAPTED FOR THE HANDLING OR PROCESSING OF MEDICAL OR HEALTHCARE DATA
- G16H20/00—ICT specially adapted for therapies or health-improving plans, e.g. for handling prescriptions, for steering therapy or for monitoring patient compliance
- G16H20/40—ICT specially adapted for therapies or health-improving plans, e.g. for handling prescriptions, for steering therapy or for monitoring patient compliance relating to mechanical, radiation or invasive therapies, e.g. surgery, laser therapy, dialysis or acupuncture
-
- G—PHYSICS
- G16—INFORMATION AND COMMUNICATION TECHNOLOGY [ICT] SPECIALLY ADAPTED FOR SPECIFIC APPLICATION FIELDS
- G16H—HEALTHCARE INFORMATICS, i.e. INFORMATION AND COMMUNICATION TECHNOLOGY [ICT] SPECIALLY ADAPTED FOR THE HANDLING OR PROCESSING OF MEDICAL OR HEALTHCARE DATA
- G16H30/00—ICT specially adapted for the handling or processing of medical images
- G16H30/40—ICT specially adapted for the handling or processing of medical images for processing medical images, e.g. editing
-
- G—PHYSICS
- G16—INFORMATION AND COMMUNICATION TECHNOLOGY [ICT] SPECIALLY ADAPTED FOR SPECIFIC APPLICATION FIELDS
- G16H—HEALTHCARE INFORMATICS, i.e. INFORMATION AND COMMUNICATION TECHNOLOGY [ICT] SPECIALLY ADAPTED FOR THE HANDLING OR PROCESSING OF MEDICAL OR HEALTHCARE DATA
- G16H50/00—ICT specially adapted for medical diagnosis, medical simulation or medical data mining; ICT specially adapted for detecting, monitoring or modelling epidemics or pandemics
- G16H50/70—ICT specially adapted for medical diagnosis, medical simulation or medical data mining; ICT specially adapted for detecting, monitoring or modelling epidemics or pandemics for mining of medical data, e.g. analysing previous cases of other patients
-
- A—HUMAN NECESSITIES
- A61—MEDICAL OR VETERINARY SCIENCE; HYGIENE
- A61B—DIAGNOSIS; SURGERY; IDENTIFICATION
- A61B2576/00—Medical imaging apparatus involving image processing or analysis
- A61B2576/02—Medical imaging apparatus involving image processing or analysis specially adapted for a particular organ or body part
-
- A—HUMAN NECESSITIES
- A61—MEDICAL OR VETERINARY SCIENCE; HYGIENE
- A61B—DIAGNOSIS; SURGERY; IDENTIFICATION
- A61B5/00—Measuring for diagnostic purposes; Identification of persons
- A61B5/02—Detecting, measuring or recording pulse, heart rate, blood pressure or blood flow; Combined pulse/heart-rate/blood pressure determination; Evaluating a cardiovascular condition not otherwise provided for, e.g. using combinations of techniques provided for in this group with electrocardiography or electroauscultation; Heart catheters for measuring blood pressure
- A61B5/024—Detecting, measuring or recording pulse rate or heart rate
- A61B5/02405—Determining heart rate variability
-
- A—HUMAN NECESSITIES
- A61—MEDICAL OR VETERINARY SCIENCE; HYGIENE
- A61B—DIAGNOSIS; SURGERY; IDENTIFICATION
- A61B5/00—Measuring for diagnostic purposes; Identification of persons
- A61B5/72—Signal processing specially adapted for physiological signals or for diagnostic purposes
- A61B5/7203—Signal processing specially adapted for physiological signals or for diagnostic purposes for noise prevention, reduction or removal
- A61B5/7207—Signal processing specially adapted for physiological signals or for diagnostic purposes for noise prevention, reduction or removal of noise induced by motion artifacts
-
- A—HUMAN NECESSITIES
- A61—MEDICAL OR VETERINARY SCIENCE; HYGIENE
- A61B—DIAGNOSIS; SURGERY; IDENTIFICATION
- A61B5/00—Measuring for diagnostic purposes; Identification of persons
- A61B5/72—Signal processing specially adapted for physiological signals or for diagnostic purposes
- A61B5/7235—Details of waveform analysis
- A61B5/7253—Details of waveform analysis characterised by using transforms
-
- A—HUMAN NECESSITIES
- A61—MEDICAL OR VETERINARY SCIENCE; HYGIENE
- A61B—DIAGNOSIS; SURGERY; IDENTIFICATION
- A61B5/00—Measuring for diagnostic purposes; Identification of persons
- A61B5/72—Signal processing specially adapted for physiological signals or for diagnostic purposes
- A61B5/7271—Specific aspects of physiological measurement analysis
- A61B5/7278—Artificial waveform generation or derivation, e.g. synthesising signals from measured signals
-
- G—PHYSICS
- G06—COMPUTING; CALCULATING OR COUNTING
- G06T—IMAGE DATA PROCESSING OR GENERATION, IN GENERAL
- G06T2207/00—Indexing scheme for image analysis or image enhancement
- G06T2207/30—Subject of image; Context of image processing
- G06T2207/30004—Biomedical image processing
- G06T2207/30048—Heart; Cardiac
-
- G—PHYSICS
- G06—COMPUTING; CALCULATING OR COUNTING
- G06T—IMAGE DATA PROCESSING OR GENERATION, IN GENERAL
- G06T5/00—Image enhancement or restoration
-
- G—PHYSICS
- G06—COMPUTING; CALCULATING OR COUNTING
- G06T—IMAGE DATA PROCESSING OR GENERATION, IN GENERAL
- G06T7/00—Image analysis
Abstract
メタKG信号を計算する方法を提供する。本方法は、サンプル中の関心領域を近赤外(NIR)光源及び/又は可視光源で照らすステップと、関心領域の画像を取得するステップと、取得画像を処理して、取得画像に関連付けられたメタデータを取得するステップと、取得画像に関連付けられたメタデータからメタKG信号を計算するステップと、を含む。関連するシステム及びコンピュータプログラム製品も提供する。A method for calculating a meta KG signal is provided. The method includes illuminating a region of interest in a sample with a near infrared (NIR) light source and / or a visible light source, acquiring an image of the region of interest, processing the acquired image, and relating the acquired image to the acquired image. Acquiring metadata and calculating a meta KG signal from the metadata associated with the acquired image. Related systems and computer program products are also provided.
Description
優先権の主張
本出願は、2014年10月14日に出願された米国特許仮出願第62/063,663号、及び2015年3月20日に出願された同第62/136,010号の優先権を主張するものであり、これらの開示は、参照によって、全内容が記載されているかのように本明細書に組み込まれている。
This application is based on US Provisional Application No. 62 / 063,663, filed October 14, 2014, and 62 / 136,010, filed March 20, 2015. Priority is claimed and these disclosures are incorporated herein by reference as if set forth in their entirety.
著作権の確保
この特許文書の開示の一部分は、著作権保護の対象となる題材を含む。著作権保有者であるイーストカロライナ大学(East Carolina University)(ノースカロライナ州グリーンビル)は、米国特許商標局の特許ファイル又は特許記録にある特許文書又は特許開示については誰が複製しようと異議を唱えるものではないが、それ以外の特許文書又は特許開示については、いかなるものであれ、あらゆる著作権を確保するものである。
Securing Copyright A portion of the disclosure of this patent document contains material that is subject to copyright protection. The copyright holder, University of East Carolina University (Greenville, NC), does not challenge anyone to copy any patent document or patent disclosure in the US Patent and Trademark Office patent file or patent record. None, but any other patent documents or patent disclosures are reserved for any copyright.
本発明概念は、全般的には、器官及び/又は組織の可視化に関し、特に、サンプル中の血流量及び灌流量のパラメータを決定することに関する。 The inventive concept generally relates to visualization of organs and / or tissues, and more particularly to determining blood flow and perfusion parameters in a sample.
組織/器官における血流量及び灌流量は、2次元面積又は3次元構造を単位時間に移動する血液の量で定義される。血流量は、一般には、細動脈レベル(大血管レベル)より大きい導管における単位時間当たりの流量に関する。灌流量は、典型的には、細小血管レベルの血流量を意味するが、現時点では、非侵襲的な技術による定量化の為のパラメータは存在しない。血流量及び灌流量をリアルタイムで直接測定及び定量化することは、いまだ開発途上にある。 Blood flow and perfusion in tissues / organs are defined by the amount of blood that travels a 2D area or 3D structure per unit time. Blood flow generally relates to the flow rate per unit time in conduits greater than the arteriole level (macrovascular level). Perfusion typically refers to microvascular blood flow, but at present there are no parameters for quantification by non-invasive techniques. Direct measurement and quantification of blood flow and perfusion in real time is still under development.
現時点では、流体速度の大きさ及び分布を測定する為に使用可能な画像化技術が幾つかあり、例えば、レーザドップラー画像化(LDI)やレーザスペックル画像化(LSI)がある。流体速度は、流れの方向及び大きさを表す直線流量であるが、細小血管レベル又は大血管レベルの流量を直接定量化するものではない。血流量及び灌流量のより臨床的に直観的な概念及び用語と結び付く為には、更なる仮説又は分析が必要であろう。実際、これらの流体速度測定の画像化技術によれば、適正な流体力学的モデリングとの組み合わせで、実験的状況及び患者の臨床状態の両方において、血流量及び灌流量の定量化情報が得られる可能性がある。本文書全体を通して、より技術指向の用語である「流体速度」の代わりに、「血流量」及び「灌流量」という用語を使用する。 At present, there are several imaging techniques that can be used to measure fluid velocity magnitude and distribution, such as laser Doppler imaging (LDI) and laser speckle imaging (LSI). The fluid velocity is a linear flow rate that represents the direction and magnitude of the flow, but does not directly quantify the flow rate at the small or large vessel level. Further hypotheses or analysis may be needed to connect with more clinically intuitive concepts and terms of blood flow and perfusion. In fact, these fluid velocity measurement imaging techniques, in combination with proper hydrodynamic modeling, provide quantification information for blood flow and perfusion in both experimental and patient clinical conditions. there is a possibility. Throughout this document, the terms “blood flow” and “perfusion” are used instead of the more technically oriented term “fluid velocity”.
哺乳類の心臓血管系では、血流量は一定ではない。実験データや臨床データによって、1心周期内で血流速度が変化することが実証されており、これは、1心周期内で心拍出量及び大動脈圧が一定でない為である。一例として冠動脈の血流量を取り上げると、心周期の収縮期には、心室心筋の収縮により、 冠血流量が少なくなり、場合によってはゼロになる。一方、拡張期には、血流量は比較的多くなり、最大レベルに達する。他の組織及び器官における血流量及び灌流量も、特定の解剖学的特性及び生理学的特性に基づいて、心周期の影響で変動する可能性があるが、これらの他の器官系は又、血流量及び灌流量に関して、心周期と関係がなさそうな特定の条件も有している。血流量及び灌流量を評価する為の現行技術では、これらの組織及び器官系においてこの区別を行うことができず、従って、改良された技術が望まれよう。 In the mammalian cardiovascular system, blood flow is not constant. Experimental data and clinical data demonstrate that the blood flow velocity changes within one cardiac cycle because the cardiac output and aortic pressure are not constant within one cardiac cycle. Taking coronary blood flow as an example, during systole of the cardiac cycle, the coronary blood flow decreases due to the contraction of the ventricular myocardium, and in some cases it becomes zero. On the other hand, in the diastole, the blood flow is relatively high and reaches a maximum level. Blood flow and perfusion in other tissues and organs can also vary with the influence of the cardiac cycle based on specific anatomical and physiological characteristics, but these other organ systems also There are also specific conditions regarding flow and perfusion that are not likely to be related to the cardiac cycle. Current techniques for assessing blood flow and perfusion cannot make this distinction in these tissues and organ systems, and therefore improved techniques would be desirable.
本発明は、背景技術の課題を解決するためのものである。 The present invention is for solving the problems of the background art.
本発明概念の幾つかの実施形態は、メタKG信号を計算する方法を提供する。本方法は、サンプル中の関心領域を少なくとも1つの光源で照らすステップであって、光源は近赤外(NIR)光源及び/又は可視光源である、照らすステップと、関心領域の画像を取得するステップと、取得画像を処理して、取得画像に関連付けられたメタデータを取得するステップと、取得画像に関連付けられたメタデータからメタKG信号を計算するステップと、を含む。 Some embodiments of the inventive concept provide a method for calculating a meta KG signal. The method illuminates a region of interest in a sample with at least one light source, the light source being a near infrared (NIR) light source and / or a visible light source, and obtaining an image of the region of interest. And processing the acquired image to acquire metadata associated with the acquired image, and calculating a meta KG signal from the metadata associated with the acquired image.
更なる実施形態では、メタKG信号は、ロー画像又は灌流量画像から導出されてよい。 In further embodiments, the meta KG signal may be derived from a raw image or a perfusion image.
更に別の実施形態では、本方法は更に、計算されたメタKG信号を使用して血流量及び灌流量のデータを取得するステップを含む。メタKG信号を計算するステップは更に、取得画像を処理してコントラスト画像を取得し、関心領域内のコントラスト画像の平均コントラスト強度対時間を計算することによって、取得画像からメタKG信号を生成するステップを含んでよい。本方法は更に、平均強度対時間の周波数成分を分析することにより、関心領域内の平均強度対時間から心拍数及び拍動性情報の少なくとも一方を計算するステップを含んでよい。本方法は更に、平均強度対時間の周波数成分に基づいて、異常な組織と正常な組織とを区別するステップと、基調的な生理学的反応に関連する異常の度合いを示すステップと、を含んでよい。 In yet another embodiment, the method further includes obtaining blood flow and perfusion data using the calculated meta KG signal. The step of calculating the meta KG signal further includes generating the meta KG signal from the acquired image by processing the acquired image to acquire a contrast image and calculating an average contrast intensity versus time of the contrast image in the region of interest. May be included. The method may further include calculating at least one of heart rate and pulsatility information from the average intensity versus time within the region of interest by analyzing the frequency component of average intensity versus time. The method further includes distinguishing between abnormal tissue and normal tissue based on a mean intensity versus time frequency component and indicating a degree of abnormality associated with the underlying physiological response. Good.
実施形態によっては、本方法は更に、関心領域の平均コントラスト強度対時間から計算された心拍数から心拍変動(HRV)情報を抽出するステップを含んでよい。 In some embodiments, the method may further include extracting heart rate variability (HRV) information from the heart rate calculated from the average contrast intensity of the region of interest versus time.
更なる実施形態では、本方法は更に、関心領域の構成を変更するステップと、視野内の関心領域の2次元心拍数マップを生成するステップと、を含んでよい。関心領域の構成を変更するステップは、関心領域のサイズ及び位置の少なくとも一方を変更するステップを含んでよい。 In a further embodiment, the method may further include changing the configuration of the region of interest and generating a two-dimensional heart rate map of the region of interest within the field of view. The step of changing the configuration of the region of interest may include changing at least one of the size and the position of the region of interest.
更に別の実施形態では、サンプルは、組織及び器官の一方であってよい。 In yet another embodiment, the sample can be one of a tissue and an organ.
実施形態によっては、メタKG信号を計算するステップは、スペックルコントラスト画像の平均強度を使用してメタKG信号を計算するステップを含んでよい。 In some embodiments, calculating the meta KG signal may include calculating the meta KG signal using the average intensity of the speckle contrast image.
更なる実施形態では、心拍数(HR)、心拍変動(HRV)、RからRまでの間隔(RRI)、RRI標準偏差(RRISD)、収縮期血圧閾値(SBt)、速度圧力積(RPP)、収縮期及び拡張期の瞬時灌流量、灌流量曲線の周波数分析及び時間−周波数分析、並びに灌流量曲線の勾配を含む収縮性指数を含む少なくとも1つの血行動態パラメータ(HSP)が、計算されたメタKGに基づいて決定されてよい。 In further embodiments, heart rate (HR), heart rate variability (HRV), R to R interval (RRI), RRI standard deviation (RRISD), systolic blood pressure threshold (SBt), velocity pressure product (RPP), At least one hemodynamic parameter (HSP) including systolic and diastolic instantaneous perfusion, frequency and time-frequency analysis of the perfusion curve, and a contractility index including the slope of the perfusion curve is calculated It may be determined based on KG.
更に別の実施形態では、組織酸素含有量、ヘモグロビン含有量、及び温度を含む少なくとも1つの血行動態パラメータが、計算されたメタKG信号に基づいて決定されてよい。 In yet another embodiment, at least one hemodynamic parameter including tissue oxygen content, hemoglobin content, and temperature may be determined based on the calculated meta KG signal.
本発明概念の幾つかの実施形態は、メタKG信号を計算する為のコンピュータシステムを提供する。本システムは、プロセッサと、プロセッサと結合されてコンピュータ可読なプログラムコードを含むメモリと、を含み、このプログラムコードは、プロセッサによって実行されると、サンプル中の関心領域を少なくとも1つの光源で照らすステップであって、光源は近赤外(NIR)光源及び/又は可視光源である、照らすステップと、関心領域の画像を取得するステップと、取得画像を処理して、取得画像に関連付けられたメタデータを取得するステップと、取得画像に関連付けられたメタデータからメタKG信号を計算するステップと、を含む動作をプロセッサに実施させる。 Some embodiments of the inventive concept provide a computer system for computing a meta KG signal. The system includes a processor and a memory coupled to the processor and including computer readable program code that, when executed by the processor, illuminates a region of interest in the sample with at least one light source. The light source is a near-infrared (NIR) light source and / or a visible light source, illuminating, acquiring an image of the region of interest, processing the acquired image, and metadata associated with the acquired image And causing the processor to perform an operation comprising: calculating a meta KG signal from the metadata associated with the acquired image.
本発明概念の更なる実施形態は、メタKG信号を計算する為のコンピュータプログラム製品を提供する。本コンピュータプログラム製品は、コンピュータ可読なプログラムコードが実施された非過渡的コンピュータ可読記憶媒体を含み、このコンピュータ可読なプログラムコードは、サンプル中の関心領域を少なくとも1つの光源で照らすステップであって、光源は近赤外(NIR)光源及び/又は可視光源である、照らすステップを実施する為のコンピュータ可読なプログラムコードと、関心領域の画像を取得するステップを実施する為のコンピュータ可読なプログラムコードと、取得画像を処理して、取得画像に関連付けられたメタデータを取得するステップを実施する為のコンピュータ可読なプログラムコードと、取得画像に関連付けられたメタデータからメタKG信号を計算するステップを実施する為のコンピュータ可読なプログラムコードと、を含む。 A further embodiment of the inventive concept provides a computer program product for computing a meta KG signal. The computer program product includes a non-transient computer readable storage medium implemented with computer readable program code, the computer readable program code illuminating a region of interest in a sample with at least one light source, The light source is a near infrared (NIR) light source and / or a visible light source, computer readable program code for performing the illuminating step, and computer readable program code for performing the step of obtaining an image of the region of interest Performing computer readable program code for performing the steps of processing the acquired image and acquiring metadata associated with the acquired image, and calculating a meta KG signal from the metadata associated with the acquired image Computer-readable program code for Including and soil, the.
本発明概念の更に別の実施形態は、2波長光源を使用してメタKG信号から動き関連アーチファクトを除去する方法を提供する。本方法は、サンプル中の関心領域を、近赤外(NIR)光源及び可視光(VL)源で照らすステップと、それぞれがNIR光源及びVL源の一方に対応する2組の、関心領域の画像を取得するステップと、2組の画像を処理して、NIRメタデータ及びVLメタデータを取得するステップと、NIRメタデータ及びVLメタデータから、NIRメタKG及びVLメタKGを、それぞれ計算するステップと、NIRメタKG及びVLメタKGから動き関連の共通信号成分を抽出するステップと、NIRメタKGの動き関連の共通信号成分を打ち消すことにより、ノイズのないメタKGを計算するステップと、を含む。 Yet another embodiment of the inventive concept provides a method for removing motion related artifacts from a meta KG signal using a dual wavelength light source. The method illuminates a region of interest in a sample with a near infrared (NIR) light source and a visible light (VL) source, and two sets of images of the region of interest, each corresponding to one of the NIR light source and the VL source. , Processing two sets of images to obtain NIR metadata and VL metadata, and calculating NIR meta KG and VL meta KG from NIR metadata and VL metadata, respectively And extracting a motion related common signal component from the NIR meta KG and the VL meta KG, and calculating a noise-free meta KG by canceling the motion related common signal component of the NIR meta KG. .
実施形態によっては、ノイズのないメタKGを計算するステップは、動きアーチファクトに起因するノイズを除去するステップを含んでよく、動きアーチファクトに起因するノイズは呼吸活動を含む。 In some embodiments, calculating the noise-free meta KG may include removing noise due to motion artifacts, where the noise due to motion artifacts includes respiratory activity.
以下では、本発明概念の特定の例示的実施形態を、添付図面を参照しながら説明する。しかしながら、この発明概念は、多様な形態で実施されてよく、本明細書で説明される実施形態に限定されるものとして解釈されるべきではなく、むしろ、これらの実施形態は、本開示が、徹底的且つ完全なものとなり、且つ、本発明概念の範囲を当業者に完全に伝えるものとなるように、提供される。当然のことながら、ある要素が別の要素に「接続」又は「結合」されているように言及された場合、この要素は別の要素に直接接続又は結合されていてよく、或いは、介在要素が存在してよい。「及び/又は」という語句は、本明細書では、関連付けられて列挙されたアイテムのうちの1つ以上のアイテムのあらゆる組み合わせを包含する。 In the following, specific exemplary embodiments of the inventive concept will be described with reference to the accompanying drawings. This inventive concept may, however, be embodied in various forms and should not be construed as limited to the embodiments set forth herein; rather, these embodiments are provided by this disclosure, It is provided to be thorough and complete, and to fully convey the scope of the inventive concept to those skilled in the art. Of course, when an element is referred to as being “connected” or “coupled” to another element, this element may be directly connected or coupled to another element, or an intervening element may be May exist. The phrase “and / or” as used herein encompasses any combination of one or more of the associated listed items.
本明細書で使用される用語は、特定の実施形態を説明することだけを目的としており、本発明概念を限定するものではない。本明細書において使用される単数形「a」、「an」、及び「the」は、特に断らない限り、複数形も同様に包含するものとする。更に、当然のことながら、「含む(includes)」、「含む(comprises)」、「含む(including)」、及び/又は「含む(comprising)」という語は、本明細書で使用された場合には、述べられた特徴、整数、手順、操作、要素、及び/又は構成要素の存在を明記するものであり、1つ以上の他の特徴、整数、手順、操作、要素、構成要素、及び/又はこれらの集まりの存在又は追加を排除するものではない。 The terminology used herein is for the purpose of describing particular embodiments only and is not intended to limit the inventive concepts. As used herein, the singular forms “a”, “an”, and “the” are intended to include the plural forms as well, unless expressly stated otherwise. Further, it should be understood that the terms “includes”, “comprises”, “including”, and / or “comprising” as used herein are used herein. Specifies the presence of a stated feature, integer, procedure, operation, element, and / or component, and includes one or more other features, integers, procedures, operations, elements, components, and / or It does not exclude the presence or addition of these collections.
特に定義されない限り、本明細書で使用されるあらゆる用語(技術用語及び科学用語を含む)の意味は、本発明概念が帰属する当該技術分野の当業者によって一般的に理解される意味と同じである。更に当然のことながら、語句、例えば、一般的に利用されている辞書において定義されている語句は、本明細書及び関連技術分野の文脈におけるそれらの語句の意味と整合性がある意味を有するものとして解釈されるべきであり、本明細書において明示的にそのように定義されない限り、理想化された意味又は過度に形式的な意味として解釈されるべきではない。 Unless defined otherwise, the meanings of all terms (including technical and scientific terms) used herein are the same as commonly understood by one of ordinary skill in the art to which the inventive concept belongs. is there. It will be further appreciated that phrases such as those defined in commonly used dictionaries have meanings that are consistent with the meaning of those phrases in the context of this specification and the related art. Should not be construed as an idealized or overly formal meaning unless explicitly so defined herein.
本出願全体を通して、本発明概念の諸態様を説明する為に、より技術指向の用語である「流体速度」の代わりに、より臨床的に直観的な用語である「血流量」及び「灌流量」を使用する。しかしながら、当然のこととして、これらの用語は区別なく使用されてよい。 Throughout this application, the more clinically intuitive terms “blood flow” and “perfusion” are substituted for the more technically oriented term “fluid velocity” to describe aspects of the inventive concept. Is used. However, it should be understood that these terms may be used interchangeably.
上述のように、現時点では、血流量及び灌流量をリアルタイムで直接測定及び定量化する方法もシステムも存在しない。従って、本発明概念の実施形態は、全般的には、画像メタデータを、生理学的に関連する信号として、任意の血流速度画像化技術、及びその画像化技術製品の分析に使用することに関する。「メタデータ」は、本明細書では、別の形式のデータを表すデータを意味する。例えば、画像は、本明細書で説明されるように、写真の大きさ、色深度、画像分解能、画像作成日時などのデータを表すメタデータを含んでよい。テキスト文書のメタデータは、文書の長さ、文書作成者、文書作成日時、及び文書の要約に関する情報を含んでよい。本発明概念の実施形態は、任意の血流速度画像化技術、及びその画像化技術製品の分析から代理「metaKG」信号を抽出することを対象としており、この抽出は、関心領域(ROI)内の平均強度対時間曲線を計算することにより行われ、本明細書では、これについて詳しく説明する。 As mentioned above, there are currently no methods or systems for directly measuring and quantifying blood flow and perfusion in real time. Accordingly, embodiments of the inventive concept generally relate to using image metadata as a physiologically relevant signal for the analysis of any blood flow velocity imaging technique and its imaging technology products. . As used herein, “metadata” refers to data representing another type of data. For example, an image may include metadata representing data such as photo size, color depth, image resolution, image creation date and time, as described herein. Text document metadata may include information regarding document length, document creator, document creation date and time, and document summary. Embodiments of the present invention are directed to extracting a surrogate “metaKG” signal from an analysis of any blood flow velocity imaging technique and its imaging technology product, which extraction is within a region of interest (ROI). This is done in detail by calculating the mean intensity versus time curve.
本発明概念の実施形態は、1つ以上の適切な波長を使用して、医療実験状況又は臨床状況において使用されるデジタル画像データを収集する画像化技術に適用されてよい。この画像化の用途は、本発明概念の範囲から逸脱しない限り、単純な可視化であってよく、或いは、より複雑な定性的生理学的評価であってよく、或いは、更に複雑な定量的生理学的評価であってよい。 Embodiments of the inventive concept may be applied to imaging techniques that use one or more suitable wavelengths to collect digital image data for use in medical laboratory or clinical situations. This imaging application may be a simple visualization, a more complex qualitative physiological assessment, or a more complex quantitative physiological assessment without departing from the scope of the inventive concept. It may be.
血流量及び灌流量の対時間測定値は、心周期に生理学的に依存することから、心時相が具体的に示されないと、意味のある情報を提供しない。コンピュータ断層撮影(CT)や磁気共鳴画像化(MRI)による心臓の走査では、標準的な外部心電図(EKG)を使用して、信号取得をゲーティングし、画像取得中の時間を追跡することにより、1つ1つの具体的な血流量分布や灌流量分布と、その心時相とがリンクされるという利点が得られる。 Blood flow and perfusion measurements over time are physiologically dependent on the cardiac cycle and therefore do not provide meaningful information unless the cardiac phase is specifically indicated. Scanning the heart with computed tomography (CT) or magnetic resonance imaging (MRI) uses a standard external electrocardiogram (EKG) to gate signal acquisition and track the time during image acquisition. There is an advantage that each specific blood flow distribution or perfusion flow distribution is linked to its cardiac time phase.
本発明概念の実施形態は、心周期の任意の時点での血流量及び灌流量の瞬時分布、並びに幾つかの心時相又は心周期の血流量及び灌流量の平均分布を高信頼度で生成する方法を提供する。更に、本発明概念の実施形態は、血流量分布及び灌流量分布を、異なる心時相の間で、並びに治療前と治療後とで適正に比較することを可能にしてよい。 Embodiments of the inventive concept reliably generate instantaneous distributions of blood flow and perfusion at any point in the cardiac cycle, and average distributions of blood flow and perfusion in several cardiac phases or cycles Provide a way to do it. Furthermore, embodiments of the inventive concept may allow blood flow distribution and perfusion distribution to be properly compared between different cardiac phases and before and after treatment.
特に、本明細書に記載の実施形態によれば、画像化処理時に外部EKG信号がない場合は、画像/画像シーケンス内に含まれるメタデータから「代理EKG信号」(以下「メタKG」信号と称する)を計算することが可能である。例えば、画像シーケンスの特定のROIの平均強度対時間曲線から、周波数成分分析を用いて、「メタKG」信号を計算することが可能であり、「メタKG」信号は、外部EKG信号と同じ心拍数/拍動性を示すことが可能である。又、「メタKG」信号は生理学的動態を反映することも可能であり、例えば、血管が閉塞した場合に、周波数成分が、非閉塞の対照状態の周波数成分に比べて変化する。 In particular, according to the embodiments described herein, when there is no external EKG signal during the imaging process, the “proxy EKG signal” (hereinafter referred to as “meta KG” signal) is extracted from the metadata included in the image / image sequence. Can be calculated). For example, a “meta KG” signal can be calculated from the average intensity versus time curve of a particular ROI of an image sequence using frequency component analysis, where the “meta KG” signal is the same heartbeat as the external EKG signal. Number / pulsatile can be shown. The “meta KG” signal can also reflect physiological dynamics, for example, when a blood vessel is occluded, the frequency component changes compared to the non-occluded control state frequency component.
各画素を視野(FOV)として使用することにより、上述の概念を使用して2次元(2D)レートマップを生成することが可能であり、1つ1つの個別領域の周波数成分を調べることにより、異常な組織を識別することが可能である。 By using each pixel as a field of view (FOV), it is possible to generate a two-dimensional (2D) rate map using the concept described above, and by examining the frequency components of each individual region, It is possible to identify abnormal tissues.
本明細書では心臓組織に関して記載しているが、本発明概念の実施形態に従って計算される「メタKG」信号は心臓組織に限定されない。「メタKG」信号は、皮膚をはじめとする、血流量及び灌流量の画像化及び測定が可能な全ての組織/器官系において計算可能であり、使用可能である。 Although described herein with reference to heart tissue, the “meta KG” signal calculated according to embodiments of the inventive concept is not limited to heart tissue. The “meta KG” signal can be calculated and used in any tissue / organ system capable of imaging and measuring blood flow and perfusion, including skin.
従って、本発明概念の実施形態によるメタKG信号は、NIR画像データシーケンスから導出可能な多チャネル生理学的信号である。チャネル数は、最大で、NIR画像の画素数であってよい。上述のように、この生理学的信号は、代理EKG信号として使用可能であるだけでなく、監視対象の組織/器官の生理学的状態に関する他の情報も含む。 Thus, a meta KG signal according to an embodiment of the inventive concept is a multi-channel physiological signal that can be derived from a NIR image data sequence. The maximum number of channels may be the number of pixels of the NIR image. As noted above, this physiological signal is not only usable as a surrogate EKG signal, but also includes other information regarding the physiological condition of the monitored tissue / organ.
上述のように、幾つかの実施形態によれば、NIR画像データシーケンスの関心領域(ROI)/複数のROI内の平均強度は、各時点において計算されてよい。ノイズ除去、ベースライン補正、及び他の修正など、一連の信号処理の後、各ROI/複数ROIでの平均強度対時間曲線を時間領域、周波数領域、及び時間−周波数領域で分析することにより、組織/器官の生理学的状態が監視される。 As described above, according to some embodiments, the average intensity within a region of interest (ROI) / multiple ROIs of a NIR image data sequence may be calculated at each time point. By analyzing the average intensity versus time curve in each ROI / multiple ROI in the time domain, frequency domain, and time-frequency domain after a series of signal processing, such as denoising, baseline correction, and other modifications, The physiological state of the tissue / organ is monitored.
従って、本発明概念の実施形態は、リアルタイムでの使用が可能な、完全に非接触、非侵襲性の組織/器官の生理学的状態監視技術を提供する。監視領域及びチャネル数は、EKGのような従来型の監視技術ほど制限されてはいない。この技術は、可視光を使用して心拍及び拍動性をカウントする現行製品より格段に多くの情報を取り込んで分析する。これについて、本明細書では、図1から図31に関して詳しく説明する。 Thus, embodiments of the inventive concept provide a completely non-contact, non-invasive tissue / organ physiology monitoring technique that can be used in real time. The monitoring area and the number of channels are not as limited as conventional monitoring techniques such as EKG. This technology captures and analyzes much more information than current products that use visible light to count heart rate and pulsatility. This will be described in detail herein with respect to FIGS.
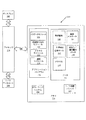
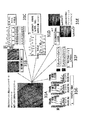
ここで図1を参照して、本発明概念の幾つかの実施形態による、メタKG信号を計算するシステムについて説明する。当然のことながら、本発明概念の実施形態による幾つかのシステムは非侵襲的であってよい。「非侵襲的」は、本明細書では、システム又は方法が、対象に染料を注入したり、対象に物体を貫入させたり、1つ以上の体内プローブを対象に接触させたりすることを必要としないことを意味する。従って、本明細書では、非侵襲的という用語は、システム又は方法が対象に直接接触しないことを意味する。「対象」は、本明細書では、画像化される人又は物を意味する。対象は、獣医学の対象、死体研究の対象、又は人間対象を含む任意の対象であってよい。「灌流量」は、本明細書では、スペックル画像化で検出される組織灌流分布レベルの血流量を意味する。 Referring now to FIG. 1, a system for calculating a meta KG signal according to some embodiments of the inventive concept will be described. Of course, some systems according to embodiments of the inventive concept may be non-invasive. “Non-invasive” as used herein requires a system or method to inject a dye into a subject, penetrate an object into the subject, or contact one or more in-vivo probes to the subject. It means not. Thus, as used herein, the term non-invasive means that the system or method does not contact the subject directly. “Subject” as used herein refers to the person or thing being imaged. The subject may be any subject including a veterinary subject, a cadaver study subject, or a human subject. “Perfusion” as used herein means the blood flow volume at the tissue perfusion distribution level detected by speckle imaging.
図1に示されるように、システム100は、少なくとも1つの光源120、カメラ130、画像処理装置110、及びメタKG装置120を含む。図1のシステムはこれらの要素だけを含むように描かれているが、当然のことながら、本発明概念の範囲から逸脱しない限り、他の要素もシステム内に存在してよい。具体的には、本発明概念の幾つかの実施形態において、複数の光源120が使用されてよい。これらの実施形態では、第1の光源はNIR光源であってよく、第2の光源は可視光(VL)光源であってよい。本明細書では本発明概念の実施形態は1つ又は2つの光源を有するものとして説明されるが、当然のことながら、本発明概念の範囲から逸脱しない限り、3つ以上の光源が使用されてもよい。
As shown in FIG. 1, the
これらの実施形態では、NIR光源の波長は、約780nmから約2500nmであってよく、可視光源の波長は、約400nmから約780nmであってよい。従って、本発明概念の幾つかの実施形態は、LSI及び/又はLDIを適用する為に、サンプルを通り抜ける2つの波長の差動伝送を行うシステムを提供する。例えば、2つの波長のうちの第1の波長は、青色光の450〜495nmのように、浸透がゼロか非常に浅い可視範囲内であってよい。この波長は、組織/器官の表面の解剖学的構造を取り込み、サンプルの位置マーカとして働くが、血流や灌流の表面下の動きの位置マーカとしては働かない。第2の波長は、浸透が格段に深い近赤外(NIR)範囲にあってよい。この波長は、血流の基調的な生理学的状態を明らかにし、両方を、サンプルの動きと相互に関連付け、更に血流及び灌流の動きと相互に関連付ける。可視光の画像化測定値をベースラインとして使用することにより、ターゲットの動きアーチファクトの影響を受けることなく、NIR画像化測定値から血流及び灌流の真の動きを導出することが可能である。更に、可視光によって取り込まれる解剖学的構造情報と、NIR光によって測定される生理学的特性とが結合される。2つの波長を使用するシステムに関する詳細は、2015年3月20日に出願された米国特許仮出願第62/136,010号において詳述されており、その開示内容は上記参照により本明細書に組み込まれている。本明細書ではNIRロー画像及び可視光画像に関して実施形態を説明しているが、本発明概念の実施形態はこの構成に限定されない。本発明概念の範囲から逸脱しない限り、解剖学的構造を適切に表現しうる他の任意の画像形式が使用されてよい。 In these embodiments, the wavelength of the NIR light source may be from about 780 nm to about 2500 nm, and the wavelength of the visible light source may be from about 400 nm to about 780 nm. Accordingly, some embodiments of the inventive concept provide a system for differential transmission of two wavelengths through a sample to apply LSI and / or LDI. For example, the first of the two wavelengths may be in the visible range with zero or very shallow penetration, such as 450-495 nm of blue light. This wavelength captures the anatomy of the tissue / organ surface and acts as a position marker for the sample, but not as a position marker for movement under the surface of blood flow or perfusion. The second wavelength may be in the near infrared (NIR) range where penetration is significantly deeper. This wavelength reveals the underlying physiological state of the blood flow, correlating both with sample movement and also with blood flow and perfusion movement. By using visible light imaging measurements as a baseline, it is possible to derive true blood flow and perfusion movements from NIR imaging measurements without being affected by target motion artifacts. Furthermore, anatomical structure information captured by visible light and physiological properties measured by NIR light are combined. Details regarding systems using two wavelengths are described in detail in US Provisional Application No. 62 / 136,010 filed March 20, 2015, the disclosure of which is hereby incorporated by reference above. It has been incorporated. Although embodiments are described herein with respect to NIR raw images and visible light images, embodiments of the inventive concept are not limited to this configuration. Any other image format that can adequately represent the anatomy may be used without departing from the scope of the inventive concept.
図1を再度参照すると、実施形態によっては、少なくとも1つの光源装置120は、例えば、1つ以上のレーザ又は発光ダイオード(LED)光であってよい。少なくとも1つの光源120は、関心領域140(以下、「組織/器官」)を照らす為に使用されてよい。光源120は、NIR光源である場合には、波長が約780nmから約2500nmであってよい。「関心領域」は、本明細書では、対象のうちの画像化される領域(例えば、主要な血管及び組織、器官など)を意味する。少なくとも1つの光源120からの光(入射光127)が組織/器官のような生体ターゲット(関心領域140)に向けられた場合は、その光の一部が、ターゲット内部での多重散乱を経て、最終的に、図1に示されるように、カメラ130に向けて反射される(反射光)。
Referring back to FIG. 1, in some embodiments, at least one
カメラ130は、反射光を収集して、可視光又はNIR画像(NIR層115)を提供するように構成され、それぞれは、例えば、波長エネルギによって決まる照射光の浸透深度に依存する異なる特性を有する。従って、レーザ照射120及び画像取り込み130は、近赤外(NIR)技術によって処理されてよく(110)、その結果、その後の分析に使用される1つ以上のビデオ画像シーケンス115が得られる。NIR技術に関する詳細は、本出願と同時に出願されていて、その内容が、参照によって、あたかも完全に記載されているかのように本明細書に組み込まれている、本発明の譲受人に譲渡された国際出願第 号、件名「近赤外画像化により解剖学的構造、血流量、及び灌流量を可視化する方法、システム、及びコンピュータプログラム製品(Methods, Systems and Computer Program Products for Visualizing Anatomical Structures, Blood Flow and Perfusion Using Near−Infrared Imaging)」(整理番号5218−228WO)に記載されている。
The
この1つ以上の画像シーケンス115の中には、各画像シーケンスに関連付けられたメタデータ118が含まれている。本発明概念の実施形態によるメタKG装置120は、その画像シーケンスに関連付けられたメタデータ118を処理して「メタKG信号」117を出力し、これは、画像化される、基調的な、生理学的且つ/又は病態生理学的なプロセス121と直接リンクする。本明細書に記載の実施形態によれば、メタKG信号は、画像取得を最適化することが可能であり、血流量及び灌流量の分析を最適化すること130に不可欠である場合がある。メタKG117は、組織に直接接触することなく非侵襲的に取得された画像シーケンスのメタデータ118に埋め込まれている為、メタKGの本発明概念の実施形態は、従来の外部EKG信号を必要とせずに、この新しい画像アプローチが生理学的且つ病態生理学な(121)パラメータ及び特性と直接リンクすることを可能にする。従って、EKGを必要とせずに、非侵襲的な画像化により、血流及び灌流があるサンプル140(例えば、組織又は器官)を調べて、血流量及び灌流量の測定及び定量化130を行うことが可能である。
The one or
上述のように、多波長の実施形態では、関心領域140が、異なる2つの光源、例えば、NIR及びVLで照らされて、2組の画像が取得及び処理され、2種類のメタデータ、例えば、NIRメタデータ及びVLメタデータが得られる。従って、単一波長に関連付けられたメタデータに関して本明細書で説明する計算は、複数波長データに対しても実施可能である。例えば、NIRメタKG及びVLメタKGは、メタデータから計算することが可能であり、NIRメタKG及びVLメタKGから動き関連の共通信号成分を抽出することが可能であり、NIRメタKGの動き関連の共通信号成分を打ち消すことにより、ノイズのないメタKGを計算することが可能である。これについては、単一波長に関して、後で詳述する。言い換えると、本明細書に記載の幾つかの実施形態に従って2つの波長を使用することにより、NIR波長の浸透能力と、VL波長の利点(即ち、VLの表面ノイズを打ち消すことが可能であること)とを組み合わせて、画像の信号対ノイズ比(SNR)を高めることが可能である。
As described above, in a multi-wavelength embodiment, the region of
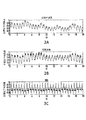
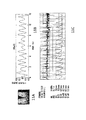
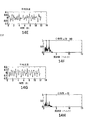
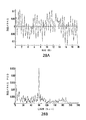
次に図2Aから図2Cを参照して、多波長画像化技術を用いてメタKG信号の存在を実証する、平均強度対時間を示すグラフについて説明する。図2Aは、近赤外波長照射による20秒のメタKGを示し、図2Bは、近可視波長照射による20秒のメタKGを示し、図2Cは、20秒のEKG信号を示す。これらの図に示されるように、メタKGは、心拍周波数(毎分90ピーク)と、更に呼吸周波数(4〜5秒ごとに1つの大きなピーク)とで変動している。又、図2Aから図2Cによれば、近赤外照射によって生成されるメタKGは、可視波長照射によって生成されるメタKGよりノイズが少ない。 Next, with reference to FIGS. 2A to 2C, a graph illustrating average intensity versus time that demonstrates the presence of a meta KG signal using multi-wavelength imaging techniques will be described. 2A shows a 20-second meta KG with near-infrared wavelength irradiation, FIG. 2B shows a 20-second meta KG with near-visible wavelength irradiation, and FIG. 2C shows a 20-second EKG signal. As shown in these figures, the meta KG varies at the heartbeat frequency (90 peaks per minute) and further at the respiratory frequency (one large peak every 4-5 seconds). 2A to 2C, the meta KG generated by near-infrared irradiation has less noise than the meta KG generated by visible wavelength irradiation.
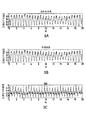
次に図3Aから図3Cを参照して、多波長画像化技術を用いてメタKG信号の存在を実証する平均強度対時間を示す、呼吸の影響が除去されたグラフについて説明する。図3Aは、呼吸の影響がない、近赤外波長照射による20秒のメタKGを示し、図3Bは、呼吸の影響がない、近可視波長照射による20秒のメタKGを示し、図3Cは、20秒のEKG信号を示す。図3Aから図3Cに示されるように、メタKGは、心拍周波数(毎分90ピーク)でのみ変動している。更に図示されているように、近赤外照射によって生成されるメタKGは、可視波長照射によって生成されるメタKGよりノイズが少ない。 Next, with reference to FIGS. 3A to 3C, a graph with respiration effects removed showing the average intensity versus time demonstrating the presence of a meta KG signal using multi-wavelength imaging techniques will be described. FIG. 3A shows a 20-second meta KG with near-infrared wavelength irradiation without respiration effects, FIG. 3B shows a 20-second meta KG with near-visible wavelength irradiation without respiration effects, and FIG. , Shows an EKG signal of 20 seconds. As shown in FIGS. 3A to 3C, the meta KG varies only at the heartbeat frequency (90 peaks per minute). Further, as shown, the meta KG generated by near-infrared irradiation has less noise than the meta KG generated by visible wavelength irradiation.
従って、当然のことながら、本明細書では、特定波長を有する単一光源に関して、本発明概念の様々な実施形態を説明するが、本発明概念の実施形態は、この構成に限定されない。 Thus, it will be appreciated that although various embodiments of the inventive concept are described herein with respect to a single light source having a particular wavelength, embodiments of the inventive concept are not limited to this configuration.
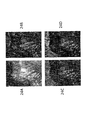
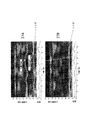
図4Aから図4Cは、ロー画像データシーケンス(4A)、反転空間コントラスト画像(4B)、及び反転時間コントラスト画像(4C)の1つのフレームを示す画像である。図5のグラフは、画像取得期間中の平均強度対時間をメタKG信号として示している(特定の心周期の拡張終期にラベルが付けられている)。従って、図4Aから図4C、及び図5は、心周期の(視覚的に特定された)拡張終期における、レーザスペックル画像化(LSI)による心臓の前壁の瞬時血流速度分布を示している。 4A to 4C are images showing one frame of the raw image data sequence (4A), the inverted spatial contrast image (4B), and the inverted time contrast image (4C). The graph of FIG. 5 shows the mean intensity versus time during the image acquisition period as a meta KG signal (labeled at the end of diastole of a particular cardiac cycle). Thus, FIGS. 4A to 4C and 5 show the instantaneous blood flow velocity distribution of the anterior wall of the heart by laser speckle imaging (LSI) at the (visually specified) end diastole of the cardiac cycle. Yes.
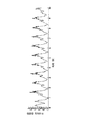
図6Aから図6Cは、ロー画像データシーケンス(6A)、反転空間コントラスト画像(6B)、及び反転時間コントラスト画像(6C)の1つのフレームを示す。図7は、画像取得期間中の平均強度対時間曲線をメタKG信号として示している(9心周期分の拡張終期を使用している)。従って、図6Aから図6C、及び図7は、心周期の拡張終期における、レーザスペックル画像化による心臓の前壁の平均血流速度分布を示している。 6A to 6C show one frame of a raw image data sequence (6A), an inverted spatial contrast image (6B), and an inverted time contrast image (6C). FIG. 7 shows the mean intensity versus time curve during the image acquisition period as a meta KG signal (using end diastole for 9 cardiac cycles). Accordingly, FIGS. 6A to 6C and 7 show the mean blood flow velocity distribution of the anterior wall of the heart by laser speckle imaging at the end of diastole of the cardiac cycle.
図8Aから図8Cは、ロー画像データシーケンス(8A)、反転空間コントラスト画像(8B)、及び反転時間コントラスト画像(8C)の1つのフレームを示す。図8Dは、画像取得期間中の平均強度対時間曲線をメタKG信号として示している(8心周期分の拡張終期を使用している)。従って、図8Aから図8Dは、心周期の(視覚的に特定された)拡張終期における、レーザスペックル画像化による心臓の前壁の平均血流速度分布を示している。 8A to 8C show one frame of the raw image data sequence (8A), the inverted spatial contrast image (8B), and the inverted time contrast image (8C). FIG. 8D shows the mean intensity versus time curve during the image acquisition period as a meta KG signal (using end diastole for 8 cardiac cycles). Accordingly, FIGS. 8A-8D show the mean blood flow velocity distribution of the anterior wall of the heart by laser speckle imaging at the end of diastole (visually specified) of the cardiac cycle.
図9A及び図9Bは、心臓関連の潜在的用途において平均強度対時間曲線をメタKG信号として使用して、血流量及び灌流量を評価する様子を示す。図9Cは、平均強度対時間曲線をメタKG信号として示しており、拡張期及び収縮期にラベルが付けられている。図9Aは、拡張期におけるロー画像データシーケンスの1つのフレームを示しており、図9Bは、収縮期におけるロー画像データシーケンスの1つのフレームを示している。 FIGS. 9A and 9B illustrate the assessment of blood flow and perfusion using an average intensity versus time curve as a meta KG signal in potential cardiac related applications. FIG. 9C shows the mean intensity versus time curve as a meta KG signal, labeled diastolic and systolic. FIG. 9A shows one frame of the raw image data sequence in the diastole, and FIG. 9B shows one frame of the raw image data sequence in the systole.
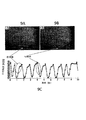
次に図10Aから図10Cを参照して、皮膚/末梢肢部関連の潜在的用途において平均強度対時間曲線をメタKG信号として使用して、血流量及び灌流量を評価することについて説明する。図10A及び図10Bは、指の灌流量測定セットアップを示す。図10Aは、ロー画像データシーケンスの1つのフレームを示しており、左腕に装着された血圧計カフを膨らませることによって、左の2指への血流が70%以上減っている。図10Bは、血流速度分布を示しており、この、左の指の血流量及び灌流量の著しい減少を示している。図10Cは、平均強度対時間曲線をメタKG信号として示すグラフである。 Referring now to FIGS. 10A-10C, the evaluation of blood flow and perfusion using the mean intensity versus time curve as a meta KG signal in potential skin / peripheral limb related applications will be described. 10A and 10B show a finger perfusion measurement setup. FIG. 10A shows one frame of the raw image data sequence. By inflating the sphygmomanometer cuff attached to the left arm, blood flow to the left two fingers is reduced by more than 70%. FIG. 10B shows the blood flow velocity distribution, which shows a significant decrease in blood flow and perfusion of the left finger. FIG. 10C is a graph showing the average intensity versus time curve as a meta KG signal.
図11Aから図18Hを参照して、別の指の灌流量測定実験において平均強度対時間曲線をメタKG信号として使用することについて説明する。これらの図は、血流量及び灌流量を評価する、皮膚/末梢肢部関連の潜在的用途を示している。これらの図は、本明細書に記載の実施形態による、メタKG、外部標準EKG、血流量、血流速度、周波数、並びに、血流量及び灌流量の病態生理学的変化に起因する周波数変化の相互運用性を実証する。 With reference to FIGS. 11A-18H, the use of an average intensity versus time curve as a meta KG signal in another finger perfusion measurement experiment will be described. These figures show potential skin / peripheral limb related applications for assessing blood flow and perfusion. These figures show the mutual relationship between meta KG, external standard EKG, blood flow, blood flow velocity, frequency, and frequency changes due to pathophysiological changes in blood flow and perfusion according to embodiments described herein. Demonstrate operability.
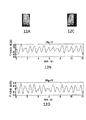
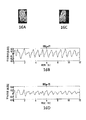
まず、図11Aから図11Cを参照して、閉塞している指がないベースラインの実施形態について説明する。図11Bは、左手の2指及び右手の2指の12秒(60fps)の画像シーケンスの平均強度対時間曲線(全4指の総計)を示す。図11Aは、全4指の灌流量のLSI分析速度マップを示す。図11Cは、標準EKGと、画像シーケンスと同時に取得された末梢酸素飽和度拍動性データと、を示す。メタKG「レート」は73ビート毎分(bpm)であり、一方、記録された標準EKGレートは74bpmである。 First, with reference to FIG. 11A to FIG. 11C, an embodiment of a baseline without a closed finger will be described. FIG. 11B shows the average intensity versus time curve (total of all 4 fingers) for a 12 second (60 fps) image sequence of 2 fingers on the left hand and 2 fingers on the right hand. FIG. 11A shows an LSI analysis speed map of perfusion rates for all four fingers. FIG. 11C shows standard EKG and peripheral oxygen saturation pulsatility data acquired simultaneously with the image sequence. The meta KG “rate” is 73 beats per minute (bpm), while the recorded standard EKG rate is 74 bpm.
次に図12Aから図12Hを参照すると、図11Aから図11Cの場合と同じデータを使用して、このベースラインデータが更に分析されている。図12B及び図12Dは、それぞれ、左2指(12A)及び右2指(12C)の各組の平均強度対時間曲線の波形を示しており、これらがほぼ同じであることを示している(左=73bpm、右=74bpm)。図12E及び図12F、並びに図12G及び図12Hは、平均強度対時間曲線の周波数領域分析であり、これは、両方の指の組の主周波数成分が心拍数(HR)であること、並びに、左の2指(図12E及び図12F)並びに右の2指(図12G及び図12H)の主周波数成分がほぼ同一であることを実証している。 Referring now to FIGS. 12A-12H, this baseline data is further analyzed using the same data as in FIGS. 11A-11C. 12B and 12D show the waveforms of the average intensity versus time curve for each pair of left two fingers (12A) and right two fingers (12C), respectively, indicating that they are approximately the same ( Left = 73 bpm, right = 74 bpm). 12E and 12F, and FIGS. 12G and 12H are frequency domain analyzes of mean intensity versus time curves, which indicate that the main frequency component of both finger pairs is the heart rate (HR), and This demonstrates that the main frequency components of the left two fingers (FIGS. 12E and 12F) and the right two fingers (FIGS. 12G and 12H) are substantially the same.
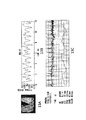
次に図13Aから図13Cを参照して、図11Aから図12Hと同じ実験セットアップであるが、左の2指(図13A)の血流及び灌流が血圧計カフによって閉塞している場合の実験セットアップの結果について説明する。左手の第3指の末梢酸素飽和度が測定されている。図13Bは、左手の2指及び右手の2指(図13A)の12秒(60fps)の画像シーケンスの平均強度対時間曲線を示す。図13Cは、標準外部EKGと、画像シーケンスと同時に取得された末梢酸素飽和度拍動性データと、を示す。指の閉塞により、メタKG信号(全4指の総計)は、標準ECGと若干異なる(72bpmに対して69bpm)。 Referring now to FIGS. 13A-13C, the same experimental setup as FIGS. 11A-12H, but with the blood flow and perfusion of the left two fingers (FIG. 13A) blocked by a sphygmomanometer cuff The setup result will be described. The peripheral oxygen saturation of the third finger of the left hand is measured. FIG. 13B shows the average intensity versus time curve for a 12 second (60 fps) image sequence of two fingers on the left hand and two fingers on the right hand (FIG. 13A). FIG. 13C shows a standard external EKG and peripheral oxygen saturation pulsatility data acquired simultaneously with the image sequence. Due to finger occlusion, the meta KG signal (total of all 4 fingers) is slightly different from the standard ECG (69 bpm versus 72 bpm).
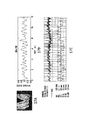
次に図14Aから図14Hを参照すると、分析結果は、図12Aから図12Hに関して上述したものとほぼ同じである。左の指の組(14A)の血流及び灌流は閉塞しており、一方、対照である右の指の組(14C)の灌流は正常である。図14B及び図14Dは、左(14B)及び右(14D)の指の組の平均強度対時間曲線の波形をメタKGとして示しており、これらが同じではないことを示している。図14E及び図14F、並びに図14G及び図14Hは、平均強度対時間曲線の周波数領域分析を示す。図14G及び図14Hは、非閉塞の右の指の組の主周波数成分(14D)がやはりHRであることを示している。これに対し、図14E及び図14Fは、閉塞している左の指の組の周波数成分が、図12E及び図12Fの灌流状況から劣化していて、右の2指(図14G及び図14H)の周波数成分と非常に異なることを示している。従って、図14Aから図14Hによれば、(BとDの)メタデータには違いがあり、これは、Aの指は血流が閉塞しており、Cの指は血流が閉塞していない為である。D及びGにおける強度の変動は、B及びEにおける強度の変動より格段に大きい。言い換えれば、血流が閉塞すると、メタデータ(メタKG)が弱くなる可能性がある。 Referring now to FIGS. 14A-14H, the analysis results are substantially the same as described above with respect to FIGS. 12A-12H. The blood flow and perfusion of the left finger set (14A) is occluded, while the perfusion of the control right finger set (14C) is normal. 14B and 14D show the waveform of the average intensity versus time curve for the left (14B) and right (14D) finger pairs as meta KG, indicating that they are not the same. 14E and 14F and FIGS. 14G and 14H show frequency domain analysis of mean intensity versus time curves. 14G and 14H show that the main frequency component (14D) of the unobstructed right finger set is also HR. In contrast, in FIGS. 14E and 14F, the frequency components of the left finger pair that is blocked are degraded from the perfusion situation of FIGS. 12E and 12F, and the right two fingers (FIGS. 14G and 14H). It is very different from the frequency component of. Therefore, according to FIGS. 14A to 14H, there is a difference in the metadata (B and D), which is that A's finger has occluded blood flow and C's finger has occluded blood flow. This is because there is not. The intensity fluctuations in D and G are much larger than the intensity fluctuations in B and E. In other words, when the blood flow is blocked, the metadata (meta KG) may become weak.
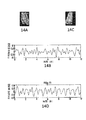
次に図15Aから図15Cを参照して、前の図と同じ実験セットアップであるが、左腕の血圧計カフが緩められて両方の指の組に再び灌流がある場合(標準EKGの表示のタイムスタンプに注目されたい)の実験セットアップの結果について説明する。図15Bは、左手の2指及び右手の2指(図15A)の12秒(60fps)の画像シーケンスの平均強度対時間メタKG曲線を示す。図15Cは、標準外部EKGと、画像シーケンスと同時に取得された末梢酸素飽和度拍動性データと、を示す。メタKGレートは72bpmであり、一方、標準EKGレートは75bpmである。 Referring now to FIGS. 15A-15C, the same experimental setup as in the previous figure, but with the left arm sphygmomanometer cuff loosened and both finger pairs reperfused (standard EKG display time). We will explain the result of the experimental setup (notice the stamp). FIG. 15B shows the average intensity versus time meta KG curve for a 12 second (60 fps) image sequence of two fingers on the left hand and two fingers on the right hand (FIG. 15A). FIG. 15C shows a standard external EKG and peripheral oxygen saturation pulsatility data acquired simultaneously with the image sequence. The meta KG rate is 72 bpm, while the standard EKG rate is 75 bpm.
次に図16Aから図16Hを参照して、上述の図12及び図15とほぼ同じである分析結果について説明する。図16B及び図16Dは、左(16A)及び右(16C)の指の組の平均強度対時間曲線の波形を示しており、これらは、左の2指(16A)の閉塞が緩んだ後にはほぼ同じである。図16E及び図16F、並びに図16G及び図16Hは、平均強度対時間曲線の周波数領域分析であり、この場合も、主周波数成分がHRであること、並びに、左の指の組(図16E及び図16F)並びに右の指の組(図16G及び図16H)の主周波数成分が、左の指の組の閉塞が緩んだ後に再び同一になることが示されている。 Next, with reference to FIG. 16A to FIG. 16H, analysis results that are substantially the same as those in FIG. 12 and FIG. FIGS. 16B and 16D show the waveform of the mean intensity vs. time curve for the left (16A) and right (16C) finger pairs, after the occlusion of the left two fingers (16A) has relaxed. It is almost the same. FIGS. 16E and 16F and FIGS. 16G and 16H are frequency domain analyzes of mean intensity versus time curves, again with the main frequency component being HR and the left finger pair (FIGS. 16E and 16H). 16F) and the main frequency components of the right finger pair (FIGS. 16G and 16H) are shown to be the same again after the left finger pair occlusion has relaxed.
次に図17Aから図17Cを参照すると、図15と同じ実験セットアップを使用して、対象の心拍数がアイソメトリックエクササイズによって一時的に高まった。この指の灌流の実験において心拍数が高まった、メタKG信号としての平均強度対時間曲線を示す。図17Bは、左右の指の組(17A)の12秒(60fps)の画像シーケンスの平均強度対時間曲線である。図17Cは、標準外部EKGと、画像シーケンスと同時に取得された末梢酸素飽和度拍動性データと、を示す。 Referring now to FIGS. 17A-17C, using the same experimental setup as in FIG. 15, the subject's heart rate was temporarily increased by isometric exercise. Figure 6 shows the mean intensity versus time curve as a meta KG signal with an increased heart rate in this finger perfusion experiment. FIG. 17B is an average intensity versus time curve for a 12 second (60 fps) image sequence of the left and right finger pair (17A). FIG. 17C shows a standard external EKG and peripheral oxygen saturation pulsatility data acquired simultaneously with the image sequence.
次に図18Aから図18Hを参照すると、図18B及び図18Dは、左(18A)及び右(18C)の指の組の平均強度対時間曲線の波形がほぼ同じであることを示している。図18E及び図18F、並びに図18G及び図18Hは、メタKGデータの周波数領域分析を示しており、これは、両方の指の組(18A及び18C)の主周波数成分がHRであること、並びに、左の2指(図18E及び図18F)並びに右の2指(図18G及び図18H)の主周波数成分が同一であることを示している。 Referring now to FIGS. 18A-18H, FIGS. 18B and 18D show that the average intensity vs. time curve waveforms for the left (18A) and right (18C) finger pairs are approximately the same. 18E and 18F, and FIGS. 18G and 18H show frequency domain analysis of the meta KG data, indicating that the main frequency component of both finger pairs (18A and 18C) is HR, and , The main frequency components of the left two fingers (FIGS. 18E and 18F) and the right two fingers (FIGS. 18G and 18H) are the same.
上述のように、血流及び灌流は、1心周期内で変化する動的過程である為、画像化測定結果と基準信号とを同期させることが非常に重要である。医用画像化において最も一般的な基準信号は、外部心電図(EKG)信号である。言い換えると、血流量測定値が、心周期中の時点のような特定の生理学的パラメータとリンクしていない場合、それらの結果は、生理学的な前後関係が不明な為、有用ではない。 As described above, blood flow and perfusion are dynamic processes that change within one cardiac cycle, so it is very important to synchronize the imaging measurement results with the reference signal. The most common reference signal in medical imaging is the external electrocardiogram (EKG) signal. In other words, if blood flow measurements are not linked to specific physiological parameters such as time points during the cardiac cycle, the results are not useful because the physiological context is unknown.
更に、進化しつつある画像化技術において血流量及び灌流量の測定値に生理学的参照、例えば、EKGタイミングを付けることの意義として、上述のように、心周期の任意の時点に、血流量及び灌流量の瞬時分布を生成してリンクさせることが可能である。同様に、上掲の各図に関して説明したように、血流量及び灌流量の平均分布を生成して、1つ又は幾つかの心時相又は心周期にリンクさせることも可能である。 Furthermore, as described above, the significance of attaching physiological measurements to blood flow and perfusion measurements in evolving imaging techniques, such as EKG timing, as described above, at any point in the cardiac cycle, It is possible to generate and link the perfusion flow instantaneous distribution. Similarly, an average distribution of blood flow and perfusion can be generated and linked to one or several cardiac phases or cycles as described with respect to the figures above.
進化しつつある画像化技術において血流量及び灌流量の(例えば、介入前後の)比較に生理学的参照、例えば、EKGタイミングを付けることの意義として、(1)比較のための標準化された、非時間的なベースライン(生理学では、時相は医療アプリケーション間で標準化されていない)、並びに(2)固有且つ、しばしば新規な生理学的/病態生理学的情報(他の方法では取得できない)が挙げられる。 In the context of evolving imaging techniques, the significance of attaching a physiological reference, eg, EKG timing, to the comparison of blood flow and perfusion (eg, before and after intervention) is as follows: (1) Standardized, non-standard for comparison Including temporal baselines (in physiology, time phases are not standardized between medical applications), as well as (2) specific and often new physiological / pathophysiological information (not otherwise available) .
更に、血流量及び灌流量に生理学的参照、例えば、EKGタイミングを付けることの意義として、(1)血流量及び灌流量の瞬時分布の定量的比較の為の分析基準が形成される。これは、血流量及び灌流量のパターンが、血流量及び灌流量の生理学/病態生理学に基づいて変動する為である。定量的な比較では、通常、同期比較が可能な、前後の画像化データが必要であり、EKG同期は、定量的な血流量及び灌流量を、独立した客観的なベンチマーク、即ち、特定の心時相にリンクさせる有用な方法である。更に、血流量及び灌流量の平均値マップの定量的な比較を示す場合に、ランダムな開始点を単純に見つけて、数秒分の血流量及び灌流量の測定値を平均化することに比べて、EKGのような正確なベンチマークは、平均化過程の開始点及び終了点を定義する上で有用である。 Further, as a significance of attaching a physiological reference, for example, EKG timing, to the blood flow and perfusion, (1) an analytical standard for quantitative comparison of the instantaneous distribution of blood flow and perfusion is formed. This is because the blood flow and perfusion patterns vary based on the physiology / pathophysiology of the blood flow and perfusion. Quantitative comparisons typically require pre- and post-imaging data that can be synchronized, and EKG synchronization can be used to measure quantitative blood flow and perfusion in an independent objective benchmark, i.e. a specific heart. This is a useful way to link to the time phase. In addition, when showing a quantitative comparison of blood flow and perfusion average maps, compared to simply finding a random starting point and averaging several seconds of blood flow and perfusion measurements. An accurate benchmark, such as EKG, is useful in defining the start and end points of the averaging process.
本発明概念の実施形態は、EKG信号が利用できないか望ましくない状況に対処する。本明細書に記載のように、本発明概念の実施形態は、これらの生理学的プロセス、ベンチマーク、データ取得パラメータ、及びデータ分析パラメータを識別したり標的にしたりする為に標準EKG信号の代わりに使用可能な「代理EKG信号」を提供する。「代理EKG信号」は、本明細書では「メタKG信号」と称してきた。本明細書に記載の実施形態によるメタKGは、可視及び近赤外スペクトル波長全体にわたる、又はそれらの波長内における画像化によって取得される画像ファイルのメタデータに埋め込まれた電気信号、機械信号、及び/又は動き信号で構成される。代理EKG信号は、本明細書では「メタKG」と称される。 Embodiments of the inventive concept address situations where an EKG signal is unavailable or undesirable. As described herein, embodiments of the inventive concept are used in place of standard EKG signals to identify and target these physiological processes, benchmarks, data acquisition parameters, and data analysis parameters. Provide possible “proxy EKG signal”. The “proxy EKG signal” has been referred to herein as a “meta KG signal”. Meta KGs according to embodiments described herein are electrical signals, mechanical signals embedded in metadata of image files that are acquired by imaging across or within the visible and near infrared spectral wavelengths, And / or composed of motion signals. The proxy EKG signal is referred to herein as “meta KG”.
各図、例えば、図2から図8Dに関して上述したように、メタKGは、ロー画像データシーケンスの平均強度対時間曲線に埋め込まれている。具体的には、10秒分の画像シーケンスが100フレーム毎秒で取り込まれると、フレームごとに平均強度が計算されて、0〜10秒の時系列に沿って1000個の強度点からなる曲線が形成される。心臓の収縮に起因して、画像化される組織/器官がカメラに近づいたり、カメラから離れたりして、周期的な強度変動が引き起こされる。この強度変動は、1心周期の間に特定のパターンを示し、このパターンを、別の複数の心周期にわたって繰り返す。 As described above with respect to each figure, eg, FIGS. 2-8D, the meta KG is embedded in the average intensity versus time curve of the raw image data sequence. Specifically, when an image sequence for 10 seconds is captured at 100 frames per second, the average intensity is calculated for each frame, and a curve composed of 1000 intensity points is formed along a time series of 0 to 10 seconds. Is done. Due to the contraction of the heart, the tissue / organ being imaged approaches or moves away from the camera, causing periodic intensity fluctuations. This intensity variation shows a specific pattern during one cardiac cycle, and this pattern repeats over another cardiac cycle.
本発明概念の実施形態は、本明細書では、心臓関連用途に関して説明されているが、この構成に限定されない。例えば、平均強度対時間の周期的変動は、心臓画像化用途でのみ発生するわけではなく、他の組織/器官においても発生する。具体的には、図10Aから図10Cは、心臓からかなり離れて位置しているにもかかわらず、上肢の指から発せられる、本明細書に記載の実施形態によるメタKG信号を示している。 Embodiments of the inventive concept have been described herein with reference to heart related applications, but are not limited to this configuration. For example, periodic variations in mean intensity versus time do not occur only in cardiac imaging applications, but also occur in other tissues / organs. Specifically, FIGS. 10A-10C show a meta KG signal according to the embodiments described herein, emanating from an upper limb finger, despite being located far away from the heart.
図11Aから図11Cで、周波数成分分析により、このメタKG生理学的データの精度を検証すると、メタKG信号は、実際のEKG信号及び末梢酸素飽和度拍動性データと同じ心拍数を示す(73bpmに対して74bpm)。 When the accuracy of this meta-KG physiological data is verified by frequency component analysis in FIGS. 11A to 11C, the meta-KG signal shows the same heart rate as the actual EKG signal and peripheral oxygen saturation pulsatility data (73 bpm). 74 bpm).
図12Aから図12Hに更に示されるように、代表的な、異なる正常な組織(左手の指のペア(12A)に対して右手の指のペア(12C))の平均強度対時間曲線の周波数成分はほぼ同じであって、メタKGの主周波数成分としてHRを示している。 As further shown in FIGS. 12A-12H, the frequency components of the average intensity versus time curve of representative, different normal tissues (left finger pair (12A) versus right hand finger pair (12C)). Are substantially the same, and HR is shown as the main frequency component of the meta KG.
メタKGが生理学的に妥当であることの証拠として、血流量及び灌流量が生理学的又は病態生理学的に減少すると、閉塞している組織の平均強度対時間曲線のメタKGの周波数成分は、閉塞していない対照組織のメタKGの周波数成分と比べて変化する。これは、図13Aから図13Cに示されているとおりである。図14Aから図14Hでは、閉塞していない対照組織のメタKG平均強度対時間曲線の主周波数成分は、やはり、外部EKGの読みと合致するHRであり、一方、閉塞している組織の平均強度対時間曲線の周波数成分はより複雑になる。これは、別の異常な生理学的反応が基調的に存在することを示している。 Evidence that meta-KG is physiologically valid is that when blood flow and perfusion are reduced physiologically or pathophysiologically, the frequency component of meta-KG in the mean intensity versus time curve of the occluded tissue is It changes compared to the frequency component of meta KG of the control tissue that is not. This is as shown in FIGS. 13A to 13C. In FIGS. 14A-14H, the dominant frequency component of the meta-KG mean intensity vs. time curve of the non-occluded control tissue is again the HR consistent with the external EKG reading, while the average intensity of the occluded tissue The frequency component of the time curve becomes more complex. This indicates that another abnormal physiological response is fundamentally present.
メタKGが生理学的に妥当であることの更なる証拠として、血流及び灌流が中断していた組織の特定の部分で血流及び灌流を回復させることができると、閉塞が緩んだ組織と正常な組織の平均強度対時間メタKGの周波数成分はほぼ同じになる。これは、図15Aから図15C、及び図16Aから図16Hに示された主周波数成分としてのHRで示されるとおりである。 As further evidence that meta-KG is physiologically relevant, if the blood flow and perfusion can be restored in certain parts of the tissue where blood flow and perfusion were interrupted, then the occluded tissue and normal The average intensity of a simple tissue versus the frequency component of time meta KG is almost the same. This is as indicated by HR as the main frequency component shown in FIGS. 15A to 15C and FIGS. 16A to 16H.
最後に、メタKGが生理学的に妥当であることの更なる証拠として、図17Aから図17C、及び図18Aから図18Hによれば、心拍数が上昇したときの(HRが103bpm)、異なる正常な組織同士の平均強度対時間メタKG曲線の周波数成分はほぼ同じである。これは、メタKG信号HRが主周波数成分であることを示しており、これはやはり、同時に得られた外部EKG記録と合致する。 Finally, as further evidence that meta-KG is physiologically valid, according to FIGS. 17A to 17C and FIGS. 18A to 18H, different normals when heart rate was elevated (HR was 103 bpm) The frequency components of the average intensity vs. time meta KG curve between different tissues are almost the same. This indicates that the meta KG signal HR is the main frequency component, which is again consistent with the external EKG recording obtained at the same time.
従って、既に簡単に述べたように、EKG信号を使用して画像取得中の時間をたどることは、個々の血流量及び灌流量の分布をその心時相とリンクさせることに有用である。本方法は、どの血流量及び灌流量の画像化技術に対しても、心周期の任意の時点での血流量及び灌流量の瞬時分布、並びに、幾つかの心時相又は心周期にわたる血流量及び灌流量の平均分布を、高い信頼性で生成することが可能である。更に、本方法は、異なる心時相同士や治療の前後での、血流量及び灌流量の分布の適正な比較を可能にする。従って、EKGと、画像取得と、その後の血流量及び灌流量の測定の瞬時値及び平均値とをリンクさせることにより、現行のあらゆる、血流量及び灌流量の画像化技術の、方法論としての実用性、信頼性、正確性、及び臨床的妥当性が高められる。本明細書に記載の実施形態によれば、画像化処理時にEKG信号がない場合は、画像シーケンスの特定の関心領域の平均強度対時間曲線からメタKG信号(代理EKG信号)を計算することが可能である。図2から図18Hに関して上述したように、メタKG信号は、周波数成分分析により、信頼性の高い心拍数/拍動性情報を提供する。血管が閉塞した場合、その周波数成分は、閉塞していない対照組織の周波数成分と比べて変化して、基調的な生理学的反応を示す。 Thus, as already briefly mentioned, using EKG signals to follow the time during image acquisition is useful in linking individual blood flow and perfusion distributions with their cardiac phases. For any blood flow and perfusion imaging technique, the method provides an instantaneous distribution of blood flow and perfusion at any point in the cardiac cycle, and blood flow over several cardiac phases or cycles. And an average distribution of perfusion rates can be generated with high reliability. Furthermore, the method allows for proper comparison of blood flow and perfusion distributions between different cardiac phases and before and after treatment. Therefore, by linking EKG, image acquisition, and instantaneous values and average values of subsequent blood flow and perfusion measurements, all current blood flow and perfusion imaging techniques can be used as a methodology. Increased reliability, reliability, accuracy, and clinical validity. According to embodiments described herein, if there is no EKG signal during the imaging process, a meta KG signal (a surrogate EKG signal) can be calculated from an average intensity versus time curve for a particular region of interest in the image sequence. Is possible. As described above with respect to FIGS. 2-18H, the meta KG signal provides reliable heart rate / pulsatility information through frequency component analysis. When a blood vessel is occluded, its frequency component changes compared to the frequency component of the non-occluded control tissue, indicating an underlying physiological response.
次に図19及び図20を参照して、本発明概念の幾つかの実施形態による、図1に示されたシステム100で使用可能なデータ処理システム200について説明する。データ処理システム200は、本発明概念の範囲から逸脱しない限り、メタKG装置120、カメラ130に内蔵されてよく、或いは、システム100の様々な要素の間で分割されてもよい。図19に示されるように、図1のシステム100での使用に適するデータ処理システム200の一例示的実施形態が、キーボード、キーパッド、タッチパッドなどのユーザインタフェース244と、I/Oデータポート246と、メモリ236と、を含み、これらはプロセッサ238と通信する。I/Oデータポート246は、データ処理システム200と別のコンピュータシステム又はネットワークとの間で情報を転送する為に使用されてよい。これらの構成要素は、本明細書に記載のように動作するように構成可能な従来型の構成要素(例えば、多くの従来型データ処理システムで使用されている構成要素)であってよい。
19 and 20, a
次に図20を参照して、本発明概念の幾つかの実施形態によるデータ処理システム200のより詳細なブロック図を説明する。プロセッサ238は、アドレス/データバス347を介してディスプレイ345と通信し、アドレス/データバス348を介してメモリ236と通信し、アドレス/データバス349を介してI/Oデータポート246と通信する。プロセッサ238は、任意の市販又はカスタムのマイクロプロセッサ又はASICであってよい。メモリ236は、データ処理システム200の機能性を実施する為に使用されるソフトウェア及びデータを収容するメモリ素子の全体階層の代表である。メモリ236は、キャッシュ、ROM、PROM、EPROM、EEPROM、フラッシュメモリ、SRAM、DRAMなどのタイプの素子であってよく、これらに限定されない。
Referring now to FIG. 20, a more detailed block diagram of a
図20に示されるように、メモリ236は、データ処理システム200で使用される、幾つかのカテゴリのソフトウェア及びデータを含んでよく、それらは、オペレーティングシステム352、アプリケーションプログラム354、入出力(I/O)装置ドライバ358、及びデータ356である。当業者であれば理解されるように、オペレーティングシステム352は、データ処理システムとの使用に適する任意のオペレーティングシステムであってよく、例えば、Mac OSX、IBM社(ニューヨーク州アーモンク)のOS/2、AIX、又はzOS、マイクロソフト社(ワシントン州レドモンド)のWindows95、Windows98、Windows2000、WindowsXP、Windows 8、Windows 10、又はVista、Unix、Linux(登録商標)、Lab View、又はリアルタイムオペレーティングシステム(例えば、QNX又はVxWorks)などであってよい。I/O装置ドライバ358は、典型的には、アプリケーションプログラム354が、I/Oデータポート246や、メモリ236の特定の構成要素のような装置と通信する為に、オペレーティングシステム352を通してアクセスするソフトウェアルーチンを含む。アプリケーションプログラム354は、本発明概念の幾つかの実施形態によるシステムに含まれるデータ処理システム200の様々な機能を実施し、好ましくは、本発明概念の幾つかの実施形態による動作をサポートする少なくとも1つのアプリケーションを含むプログラムを示している。最後に、データ356は、アプリケーションプログラム354、オペレーティングシステム352、I/O装置ドライバ358、及び他の、メモリ236に常駐可能なソフトウェアプログラムによって使用される静的データ及び動的データを表している。
As shown in FIG. 20,
図20に示されるように、本発明概念の幾つかの実施形態によるデータ356は、取得画像360、画像メタデータ361、生理学的信号データ363、計算された血流/灌流速度(速度データ)364、及びメタKGデータ365を含んでよい。図20に示されたデータ356は異なる5つのファイル360、361、363、364、及び365を含むが、本発明概念の実施形態はこの構成に限定されない。本発明概念の範囲から逸脱しない限り、2つ以上のファイルを組み合わせて1つのファイルにしてよく、1つのファイルを2つ以上のファイルに分割するなどしてよい。
As shown in FIG. 20, data 356 according to some embodiments of the inventive concept includes acquired
図20に更に示されるように、本発明概念の幾つかの実施形態によれば、アプリケーションプログラム354は、メタデータモジュール351、画像取り込みモジュール352、メタKGモジュール353、及び速度モジュール354を含んでよい。例えば、図20では、メタデータモジュール351、画像取り込みモジュール352、メタKGモジュール353、及び速度モジュール354がアプリケーションプログラムであるとして本発明概念を示しているが、当業者であれば理解されるように、本発明概念の教示の恩恵を同様に受ける別の構成が利用されてもよい。例えば、メタデータモジュール351、画像取り込みモジュール352、メタKGモジュール353、及び速度モジュール354が、オペレーティングシステム352、又は他のそのような、データ処理システム300の論理区画に組み込まれてもよい。従って、本発明概念は、図20の構成に限定されるものとして解釈されるべきではなく、本明細書に記載の動作を実施することが可能なあらゆる構成を包含するものとする。
As further shown in FIG. 20, according to some embodiments of the inventive concept, the
更に、メタデータモジュール351、画像取り込みモジュール352、メタKGモジュール353、及び速度モジュール354が1つのデータ処理システムの中に示されているが、当業者であれば理解されるように、そのような機能性は、1つ以上のデータ処理システムに分散してよい。従って、本発明概念は、図19及び図20に示された構成に限定されるものとして解釈されるべきではなく、複数のデータ処理システムの間で別の機能配置及び/又は機能区画によって実現されてもよい。
In addition, a metadata module 351, an
図1に関して上述したように、少なくとも1つの光源120が組織/器官のサンプルを照らしてよく、その反射光がカメラに入射してよい。カメラ130/画像取り込みモジュール352が反射光を受けて画像処理装置110に渡すことにより、画像360が得られる。これらの画像が処理されて(メタデータモジュール351)、画像に関連付けられたメタデータ361が得られ、メタKGモジュール353が上述のように生理学的信号データ363及びメタデータ361を使用することにより、メタKG信号365(代理EKG信号)が決定されてよい。更に上述のとおり、速度モジュール354が、この代理EKG信号(メタKG信号)を使用して血流量及び灌流量のデータ364を生成することが可能である。具体的には、メタKGモジュール353が、データ356を使用して、代理EKG信号(メタKG信号)と同期した血流量及び灌流量のデータを生成することが可能である。
As described above with respect to FIG. 1, at least one
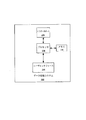
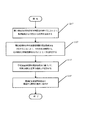
次に、本発明概念の様々な実施形態による動作について、図21から図23のフローチャートに関して説明する。メタKG信号を計算する動作はブロック2116から始まり、ブロック2116では、サンプル中の関心領域を、少なくとも1つの光源、例えば、近赤外(NIR)光源及び/又は可視光源で照らす。ブロック2125では、関心領域の画像を取得する。ブロック2135では、取得画像を処理して、取得画像に関連付けられたメタデータを取得する。ブロック2145では、取得画像に関連付けられたメタデータからメタKG信号を計算する。実施形態によっては、メタKG信号は、ロー(反射画像)画像及び灌流量(分析)画像(処理済み画像)のいずれかから計算又は導出可能である。実施形態によっては、サンプルは、組織及び器官の一方であってよい。
Next, operations according to various embodiments of the inventive concept will be described with respect to the flowcharts of FIGS. The operation of calculating the meta KG signal begins at block 2116, where a region of interest in the sample is illuminated with at least one light source, eg, a near infrared (NIR) light source and / or a visible light source. At
実施形態によっては、ブロック2155において、計算されたメタKG信号を使用して、血流量及び灌流量のデータを取得してよい。点線は、任意選択の対象であることを示している。
In some embodiments, at
次に図22を参照すると、ブロック2217から動作が始まり、ブロック2217では、関心領域内の平均強度対時間を計算することにより、取得画像からメタKG信号を生成する。ブロック2227では、関心領域内の平均強度対時間の周波数成分を分析することにより、平均強度対時間から、心拍数及び拍動性情報の少なくとも一方を計算することが可能である。実施形態によっては、関心領域の平均強度対時間から計算された心拍数から心拍変動(HRV)を抽出することが可能である。「心拍変動」という用語は、本明細書では、時間に対する心拍数の変化の尺度を意味する。この変化は、大きい場合もあれば小さい場合もあり、短期間にわたる場合もあれば長期間にわたる場合もある。通常、心拍数は絶対的に規則正しいわけではなく、特定の期間にわたる心拍数の変化の度合いを定量化することが可能であり、例えば、呼吸に応じて速くなったり遅くなったりする心拍の変化の度合いを定量化することが可能である。あるタイプのHRVは、異常な生理学的状態、及び/又は病気を表す。
Referring now to FIG. 22, operation begins at
ブロック2237では、平均強度対時間の周波数成分に基づいて、異常な組織と正常な組織とを区別することが可能である。ブロック2247では、基調的な生理学的反応に関連する異常の度合いを示すことが可能である。
At
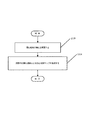
次に図23を参照すると、ブロック2318では、関心領域の構成を変更することが可能である。例えば、関心領域のサイズ及び位置の一方を変更することが可能である。ブロック2328では、視野内の関心領域の2次元心拍数マップを生成することが可能である。
Referring now to FIG. 23, at
上述のように、本発明概念の実施形態によっては、ロー画像の平均強度を使用して代理EKG(メタKG)を計算することが可能である。しかしながら、実施形態によっては、スペックルコントラスト画像の平均強度を使用してメタKGを計算することが可能であり、これについて、以下で図24Aから図29に関して詳述する。図24Aから図29に示された本発明概念の実施形態は、以下で説明するように、時間領域、周波数領域、及び時間−周波数領域での画像の処理についての説明である。従って、図2Aから図3B、図5、図7、図8D、図9C、図10C、図11B、図12B、図12D、図13B、図14B、図14D、図15B、図16B、図16D、図17B、図18B、及び図18Dは、本発明概念の幾つかの実施形態による、ロー画像(反射画像)から計算されたメタKG信号を示している。図25、図26(周波数領域)、図27(時間−周波数領域)、図28A、図28B(周波数領域)、及び図29(時間−周波数領域)は、本発明概念の幾つかの実施形態による、灌流量画像(LSI、LDIなど)から計算されたメタKGを示している。 As described above, in some embodiments of the inventive concept, it is possible to calculate the proxy EKG (meta KG) using the average intensity of the raw image. However, in some embodiments, it is possible to calculate the meta KG using the average intensity of the speckle contrast image, which will be described in detail below with respect to FIGS. 24A-29. The embodiment of the inventive concept shown in FIGS. 24A-29 is a description of image processing in the time domain, frequency domain, and time-frequency domain, as described below. Accordingly, FIGS. 2A to 3B, 5, 7, 8D, 9C, 10C, 11B, 12B, 12D, 13B, 14B, 14D, 15B, 16B, 16D, 17B, 18B, and 18D illustrate a meta KG signal calculated from a raw image (reflection image) according to some embodiments of the inventive concept. FIG. 25, FIG. 26 (frequency domain), FIG. 27 (time-frequency domain), FIG. 28A, FIG. 28B (frequency domain), and FIG. 29 (time-frequency domain) are according to some embodiments of the inventive concept. , Shows meta KG calculated from perfusion images (LSI, LDI, etc.).
まず、図24A及び図24Bを参照して、ブタの腸のレーザスペックル画像化例を説明する。図24A及び図24Bは、それぞれ、ローNIRレーザスペックル画像、及びNIRレーザスペックルコントラスト画像を示す。図24C及び図24Dは、それぞれ、ローVLレーザスペックル画像及びVLレーザスペックルコントラスト画像を示す。図示されるように、ローレーザスペックル画像(図24A及び図24C)とレーザスペックルコントラスト画像(図24B及び図24D)との差は、VL画像(図24C及び図24C)の場合よりNIR画像(図24A及び図24B)の場合に顕著である。これは、ローNIRレーザスペックル画像(図24A)よりもNIRレーザスペックルコントラスト画像(図24B)のほうが、血流及び灌流に関してよりよい知見が得られるという事実を示している。 First, an example of laser speckle imaging of pig intestine will be described with reference to FIGS. 24A and 24B. FIGS. 24A and 24B show a low NIR laser speckle image and a NIR laser speckle contrast image, respectively. 24C and 24D show a low VL laser speckle image and a VL laser speckle contrast image, respectively. As shown in the figure, the difference between the low laser speckle image (FIGS. 24A and 24C) and the laser speckle contrast image (FIGS. 24B and 24D) is larger than that of the VL image (FIGS. 24C and 24C). This is remarkable in the case of (FIG. 24A and FIG. 24B). This illustrates the fact that the NIR laser speckle contrast image (FIG. 24B) provides better insight into blood flow and perfusion than the low NIR laser speckle image (FIG. 24A).
次に図25A及び図25Bを参照して、メタKG信号の時間領域(又はスペクトル)分析を示すグラフを説明する。図25Aは、NIRメタKG(X)対時間を示し、図25Bは、VLメタKG(Y)対時間を示す。両プロットのX線は、呼吸活動に関連する動きによって引き起こされる、メタKGの大振幅のゆっくりしたうねりを表している。NIRメタKG(W)及びVLメタKG(Y)は両方とも、このノイズの影響を同程度受けている。 Next, referring to FIG. 25A and FIG. 25B, a graph showing a time domain (or spectrum) analysis of a meta KG signal will be described. FIG. 25A shows NIR meta KG (X) vs. time, and FIG. 25B shows VL meta KG (Y) vs. time. The x-rays in both plots represent the slow undulations of meta KG caused by movements related to respiratory activity. Both NIR Meta KG (W) and VL Meta KG (Y) are affected to the same extent by this noise.
次に図26A及び図26Bを参照して、メタKG信号の周波数領域(又はスペクトル)分析を示すグラフを説明する。図26Aは、NIRメタKGのパワースペクトル密度(PSD)対周波数を示しており、図26Bは、VLメタKGのPSD対周波数を示しており、両グラフは、周波数領域での呼吸活動及び心臓活動を示している。従って、PSDは、所与の信号の特定の周波数成分の強度の尺度である。 Next, with reference to FIG. 26A and FIG. 26B, a graph showing frequency domain (or spectrum) analysis of a meta KG signal will be described. FIG. 26A shows the power spectral density (PSD) versus frequency of NIR Meta KG, and FIG. 26B shows the PSD versus frequency of VL Meta KG, both graphs showing respiratory and cardiac activity in the frequency domain. Is shown. Thus, PSD is a measure of the strength of a particular frequency component of a given signal.
次に図27A及び図27Bを参照して、メタKG信号の周波数−時間領域(又はスペクトル写真)分析を示すグラフを説明する。図27Aは、NIRメタKGのスペクトル写真を示しており、図27Bは、VLメタKGのスペクトル写真を示しており、両方とも、心臓活動及び呼吸活動を含んでいる。メタKG信号のスペクトル写真は、信号の周波数領域のスペクトル成分対時間を明らかにしている。両メタKG信号は、呼吸活動に関連するノイズの影響が深刻である。NIRメタKGのスペクトル写真(図27A)は、心臓活動のかすかな徴候を示しており(ラベルが付けられた線)、これは、呼吸活動に関連するノイズに比べて格段に弱い。 Next, with reference to FIG. 27A and FIG. 27B, a graph showing frequency-time domain (or spectral photograph) analysis of a meta KG signal will be described. FIG. 27A shows a spectrogram of NIR meta KG, and FIG. 27B shows a spectrogram of VL meta KG, both of which include cardiac activity and respiratory activity. A spectral photograph of a meta KG signal reveals spectral components versus time in the frequency domain of the signal. Both meta KG signals are severely affected by noise associated with respiratory activity. The NIR Meta KG spectrogram (FIG. 27A) shows a faint sign of cardiac activity (labeled line), which is much weaker than noise associated with respiratory activity.
次に図28A及び図28Bを参照して、残差メタKGを示すグラフを説明する。図28Aは、残差メタKG対時間を示しており、図28Bは、残差メタKG対周波数を示している。NIRメタKG及びVLメタKGの両方を利用することにより、残差メタKGを抽出することが可能である。残差メタKGのPSD(図28B)が示すところによれば、明らかに、信号の主要成分は心臓活動(約90bpm)に関連していて、呼吸活動には関連していない。 Next, a graph showing the residual meta KG will be described with reference to FIGS. 28A and 28B. FIG. 28A shows residual meta KG vs. time, and FIG. 28B shows residual meta KG vs. frequency. The residual meta KG can be extracted by using both the NIR meta KG and the VL meta KG. The residual meta KG PSD (FIG. 28B) shows that the major component of the signal is clearly related to cardiac activity (approximately 90 bpm) and not to respiratory activity.
次に図29を参照して、残差メタKGの周波数−時間領域(又はスペクトル写真)分析を示すグラフを説明する。図29に示された残差メタKG信号のスペクトル写真によれば、この信号に呼吸活動関連のノイズの影響がないのは明らかである。このスペクトル写真には、時間に対する心拍数の瞬時変化がマーキングされている。残差メタKGを利用することにより、心拍数の、時間に対するわずかな変化を追跡することが可能であり、心拍変動(既に定義されているHRV)を計算することが可能である。 Next, with reference to FIG. 29, a graph showing frequency-time domain (or spectrum photograph) analysis of the residual meta KG will be described. According to the spectrum photograph of the residual meta KG signal shown in FIG. 29, it is clear that this signal is not affected by noise related to respiratory activity. This spectral photograph is marked with an instantaneous change in heart rate over time. By utilizing the residual meta KG, it is possible to track slight changes in heart rate over time and to calculate heart rate variability (HRV as already defined).
残差メタKGが与えられた場合、様々な方法でHRVを計算することが可能である。しかしながら、それらのほとんどは、長期間、例えば、少なくとも5分間にわたってHRVを計算するように設計されている。本明細書に記載の実施形態によるメタKGは、平均(20秒から1分)より短い傾向があり、HRの最大値と最小値との差を取得することが可能であり、これをHRV指数として使用することが可能である。拡張カルマンフィルタを使用して、任意のメタKGの心拍列を推定することが可能である。そして、HRVは、心拍数の最大値と最小値との差として決定されてよい。 Given the residual meta KG, it is possible to calculate HRV in various ways. However, most of them are designed to calculate HRV over a long period of time, eg, at least 5 minutes. Meta KGs according to embodiments described herein tend to be shorter than the average (20 seconds to 1 minute), and it is possible to obtain the difference between the maximum and minimum values of HR, which is the HRV index. It can be used as An extended Kalman filter can be used to estimate the heart rate string of any meta KG. The HRV may be determined as a difference between the maximum value and the minimum value of the heart rate.
次に図30を参照して、幾つかの実施形態による、2波長実施形態の動作について説明する。図30に示されるように、2波長光源を使用してメタKG信号から動き関連アーチファクトを除去する動作はブック3050から始まり、ブロック3050では、近赤外(NIR)光源及び可視光(VL)源により、サンプル中の関心領域を照らす。ブロック3053では、それぞれがNIR光源及びVL源の一方に対応する2組の、関心領域の画像を取得する。ブロック3055では、この2組の画像を処理して、NIRメタデータ及びVLメタデータを取得する。ブロック3057では、NIRメタデータ及びVLメタデータから、NIRメタKG及びVLメタKGを、それぞれ計算する。ブロック3058では、NIRメタKG及びVLメタKGから動き関連の共通信号成分を抽出する。ブロック3059では、NIRメタKGの動き関連の共通信号成分を打ち消すことにより、ノイズのないメタKGを計算する。
Referring now to FIG. 30, the operation of the two wavelength embodiment according to some embodiments will be described. As shown in FIG. 30, the operation of removing motion related artifacts from a meta KG signal using a dual wavelength light source begins with
上述のように、複数の波長を使用してマルチスペクトル画像を取得する、本発明概念の実施形態は、(例えば、呼吸活動によって引き起こされる)動きアーチファクトに起因するノイズを除去することが可能である(図26から図29)。単波長の技術では、そのようなノイズアーチファクトを効果的に除去することができない場合がある。 As described above, embodiments of the inventive concept that use multiple wavelengths to acquire a multi-spectral image can eliminate noise due to motion artifacts (eg, caused by respiratory activity). (FIGS. 26 to 29). Single-wavelength techniques may not be able to effectively eliminate such noise artifacts.
次に図31Aから図31Gを参照して、本明細書に記載の実施形態による、メタKGから導出可能な血行動態パラメータ(HSP)を示すブロック図を説明する。図31に示されるように、HSPは、図31Cに示されるような心拍数(HR)、心拍変動(HRV)、RからRまでの間隔(RRI)、及びRRI標準偏差(RRISD)と、図31Gに示されるような収縮期血圧閾値(SBt)と、図31Aから図31B、及び図31Dから図31Fに示されるような速度圧力積(RPP)、収縮期及び拡張期の瞬時灌流量、灌流量曲線の周波数分析及び時間−周波数分析、並びに収縮性指数(灌流量曲線の勾配)と、を含んでよい。実施形態によっては、メタKGを使用して、組織酸素含有量、ヘモグロビン含有量、温度などのような更なるHSPが導出されてよい。これらの関連する血行動態パラメータを画像化によって非侵襲的に取り込むことが可能であることは、臨床ポイントオブケア監視技術の革新である。生理学的な血流量及び灌流量のデータとのリアルタイム統合により、時間に対する傾向を示すこれらのデジタルHSPデータの精度、並びに診断及び治療の潜在的な効果が更に高められる。 Referring now to FIGS. 31A through 31G, a block diagram illustrating hemodynamic parameters (HSP) derivable from meta KG according to embodiments described herein is described. As shown in FIG. 31, the HSP has a heart rate (HR), heart rate variability (HRV), R to R interval (RRI), and RRI standard deviation (RRISD) as shown in FIG. The systolic blood pressure threshold (SBt) as shown in FIG. 31G, the velocity pressure product (RPP), the systolic and diastolic instantaneous perfusion, irrigation as shown in FIGS. 31A to 31B and 31D to 31F. Frequency analysis and time-frequency analysis of the flow curve, and contractility index (the slope of the perfusion curve) may be included. In some embodiments, meta KG may be used to derive additional HSPs such as tissue oxygen content, hemoglobin content, temperature, etc. The ability to capture these relevant hemodynamic parameters non-invasively by imaging is an innovation in clinical point-of-care monitoring technology. Real-time integration with physiological blood flow and perfusion data further increases the accuracy of these digital HSP data showing trends over time and the potential effectiveness of diagnosis and treatment.
当然のことながら、本発明概念の実施形態は、任意の形式の臨床画像化に使用されてよく、これは、本発明概念の範囲から逸脱しない限り、外科用画像化(通常は入院患者用途)及び他の外来患者画像化処置(非外科用途)の両方を含む。 Of course, embodiments of the inventive concept may be used for any form of clinical imaging, as long as it does not depart from the scope of the inventive concept, surgical imaging (usually in-patient use) And other outpatient imaging procedures (non-surgical applications).
ここまで、方法、装置、システム、及び/又はコンピュータプログラム製品のブロック図及び/又はフローチャート図を参照して、例示的実施形態を説明した。当然のことながら、ブロック図及び/又はフローチャート図の1つのブロック、並びに、ブロック図及び/又はフローチャート図の複数のブロックの組み合わせは、コンピュータプログラム命令によって実施可能である。これらのコンピュータプログラム命令は、マシンを生成する為に、汎用コンピュータ、専用コンピュータ、及び/又は他のプログラム可能なデータ処理装置のプロセッサに与えられてよく、従って、これらの命令は、コンピュータ及び/又は他のプログラム可能なデータ処理装置のプロセッサによって実行されて、ブロック図及び/又はフローチャートの1つ以上のブロックで指定される機能/動作を実施する為の手段(機能性)及び/又は構造を形成する。 So far, exemplary embodiments have been described with reference to block diagrams and / or flowchart illustrations of methods, apparatus, systems, and / or computer program products. Of course, one block of the block diagrams and / or flowchart diagrams, and combinations of blocks in the block diagrams and / or flowchart diagrams, can be implemented by computer program instructions. These computer program instructions may be provided to the processor of a general purpose computer, special purpose computer, and / or other programmable data processing device to generate a machine, and thus these instructions may be sent to a computer and / or Executed by a processor of another programmable data processing device to form means (functionality) and / or structure for performing the functions / operations specified in one or more blocks of the block diagrams and / or flowcharts To do.
これらのコンピュータプログラム命令は、コンピュータ可読メモリに記憶されてもよく、コンピュータ又は他のプログラム可能なデータ処理装置に対して特定の様式で機能するように指示することが可能であり、従って、コンピュータ可読メモリに記憶されたこれらの命令は、ブロック図及び/又はフローチャートの1つ以上のブロックで指定される機能/動作を実施する命令を含む製造物を形成する。 These computer program instructions may be stored in a computer readable memory and may instruct a computer or other programmable data processing device to function in a particular manner and thus be computer readable. These instructions stored in the memory form a product that includes instructions that perform the functions / operations specified in one or more blocks of the block diagram and / or flowchart.
これらのコンピュータプログラム命令は、コンピュータで実施されるプロセスを形成する一連の動作ステップをコンピュータ又は他のプログラム可能なデータ処理装置で実施させる為に、これらのコンピュータ又は他のプログラム可能な装置にロードされてもよく、従って、これらの命令は、これらのコンピュータ又は他のプログラム可能な装置で実行されて、ブロック図及び/又はフローチャートの1つ以上のブロックで指定される機能/動作を実施する為のステップを形成する。 These computer program instructions are loaded into these computers or other programmable devices to cause the computer or other programmable data processing device to perform a series of operational steps that form a computer-implemented process. Thus, these instructions may be executed on these computers or other programmable devices to perform the functions / operations specified in one or more blocks of the block diagrams and / or flowcharts. Form a step.
従って、例示的実施形態は、ハードウェア、及び/又は(ファームウェア、常駐ソフトウェア、マイクロコードなどを含む)ソフトウェアの形態で実施されてよい。更に、例示的実施形態は、命令を実行するシステムによって、又は命令を実行するシステムと関連して使用される媒体において実施される、コンピュータで使用可能な、又はコンピュータ可読なプログラムコードを有する、コンピュータで使用可能な、又はコンピュータ可読な記憶媒体に収容されたコンピュータプログラム製品の形態であってよい。本文書の文脈では、コンピュータで使用可能な、又はコンピュータ可読な媒体は、命令を実行するシステム、装置、又はデバイスによって、又はそれらのシステム、装置、又はデバイスと関連して使用されるプログラムを収容、記憶、伝達、伝搬、又は輸送することが可能な任意の媒体であってよい。 Thus, the exemplary embodiments may be implemented in the form of hardware and / or software (including firmware, resident software, microcode, etc.). Furthermore, exemplary embodiments have a computer usable or computer readable program code implemented on a medium used by or in connection with a system that executes instructions. Or in the form of a computer program product stored on a computer-readable storage medium. In the context of this document, a computer-usable or computer-readable medium contains a program that is used by or in connection with a system, apparatus, or device that executes instructions. , Any medium capable of being stored, transmitted, propagated, or transported.
コンピュータで使用可能な、又はコンピュータ可読な媒体は、例えば、電子式、磁気式、光学式、電磁式、赤外線式、又は半導体式のシステム、装置、デバイス、又は伝搬媒体であってよく、これらに限定されない。コンピュータ可読な媒体のより具体的な例(非包括的なリスト)には、1つ以上のワイヤを有する電気的接続、可搬型コンピュータディスケット、ランダムアクセスメモリ(RAM)、読み出し専用メモリ(ROM)、消去可能プログラム可能読み出し専用メモリ(EPROM又はフラッシュメモリ)、光ファイバ、可搬型コンパクトディスク読み出し専用メモリ(CD−ROM)などが含まれる。なお、コンピュータで使用可能な、又はコンピュータ可読な媒体は、プログラムが印刷されている紙又は別の適切な媒体であってもよく、このプログラムは、(例えば、紙又は他の媒体の光学式スキャンを行うことにより)電子的に取り込まれて、その後、コンパイル、インタプリト、又は他の適切な様式の処理が行われてよく、必要であれば、その後、コンピュータメモリに記憶されてよい。 The computer usable or computer readable medium may be, for example, an electronic, magnetic, optical, electromagnetic, infrared, or semiconductor system, apparatus, device, or propagation medium such as It is not limited. More specific examples (non-comprehensive list) of computer readable media include electrical connections with one or more wires, portable computer diskettes, random access memory (RAM), read only memory (ROM), These include erasable programmable read only memory (EPROM or flash memory), optical fiber, portable compact disk read only memory (CD-ROM) and the like. Note that the computer usable or computer readable medium may be paper or another suitable medium on which the program is printed, such as an optical scan of paper or other medium (for example, May be electronically captured and then compiled, interpreted, or other suitable manner of processing, and then stored in computer memory if necessary.
本明細書に記載のデータ処理システムの動作を実施する為のコンピュータプログラムコードは、高級プログラミング言語で書かれてよく、例えば、開発の都合に応じて、Java(登録商標)、AJAX(非同期JavaScript(登録商標))、C、及び/又はC++で書かれてよい。更に、例示的実施形態の動作を実施する為のコンピュータプログラムコードは、他のプログラミング言語で書かれてもよく、例えば、インタプリタ言語で書かれてよく、これに限定されない。幾つかのモジュール又はルーチンは、パフォーマンス及び/又はメモリの使い方を向上させる為に、アセンブリ言語、更にはマイクロコードで書かれてもよい。しかしながら、実施形態は、特定のプログラミング言語に限定されない。更に、当然のことながら、いずれか又は全てのプログラムモジュールの機能性が、ディスクリートハードウェアコンポーネント、1つ以上の特定用途向け集積回路(ASIC)、又はフィールドプログラマブルゲートアレイ(FPGA)、或いは、プログラムされたデジタル信号プロセッサ、プログラムドロジックコントローラ(PLC)、又はマイクロコントローラを使用して実施されてもよい。 The computer program code for performing the operations of the data processing system described in this specification may be written in a high-level programming language. For example, Java (registered trademark), AJAX (asynchronous JavaScript ( Registered trademark)), C, and / or C ++. Further, the computer program code for performing the operations of the exemplary embodiments may be written in other programming languages, such as, but not limited to, an interpreted language. Some modules or routines may be written in assembly language or even microcode to improve performance and / or memory usage. However, embodiments are not limited to a particular programming language. Further, it will be appreciated that the functionality of any or all program modules may be programmed with discrete hardware components, one or more application specific integrated circuits (ASICs), or field programmable gate arrays (FPGAs), or programmed. May be implemented using a digital signal processor, a programmed logic controller (PLC), or a microcontroller.
又、幾つかの代替実施形態では、ブロック中に記された機能/動作は、フローチャートに記された順序と異なる順序で実施されてよい。例えば、関係する機能性/動作に応じて、連続して示されている2つのブロックが、実際にはほぼ同時に実行されてよく、或いは、これらのブロックは、場合によっては、逆の順序で実行されてもよい。更に、フローチャート及び/又はブロック図の所与のブロックの機能性は、複数のブロックに分割されてよく、且つ/又は、フローチャート及び/又はブロック図の2つ以上のブロックの機能性が少なくとも部分的に統合されてよい。 Also, in some alternative embodiments, the functions / operations noted in the blocks may be performed in a different order than the order noted in the flowchart. For example, depending on the functionality / operation involved, two blocks shown in succession may actually be executed almost simultaneously, or they may be executed in reverse order in some cases. May be. Further, the functionality of a given block in the flowchart and / or block diagram may be divided into multiple blocks and / or the functionality of two or more blocks in the flowchart and / or block diagram is at least partially May be integrated into.
図面及び明細書において、本発明概念の例示的実施形態を開示してきた。具体的な用語が用いられているが、これらは、限定の為ではなく、一般的且つ説明的にのみ用いられており、本発明概念の範囲は、以下の特許請求の範囲によって定義される。
In the drawings and specification, there have been disclosed exemplary embodiments of the inventive concept. Although specific terms are used, they are used for general and descriptive purposes only, not for purposes of limitation, and the scope of the inventive concept is defined by the following claims.
Claims (34)
サンプル中の関心領域を少なくとも1つの光源で照らすステップであって、前記光源は近赤外(NIR)光源及び/又は可視光源である、前記照らすステップと、
前記関心領域の画像を取得するステップと、
前記取得画像を処理して、前記取得画像に関連付けられたメタデータを取得するステップと、
前記取得画像に関連付けられた前記メタデータから前記メタKG信号を計算するステップと、を含み、
前記照らすステップ、前記取得するステップ、前記処理するステップ、及び前記計算するステップのうちの少なくとも1つが、少なくとも1つのプロセッサによって実施される、
方法。 A method for calculating a meta KG signal, comprising:
Illuminating a region of interest in a sample with at least one light source, wherein the light source is a near infrared (NIR) light source and / or a visible light source;
Obtaining an image of the region of interest;
Processing the acquired image to acquire metadata associated with the acquired image;
Calculating the meta KG signal from the metadata associated with the acquired image;
At least one of the illuminating step, the obtaining step, the processing step, and the calculating step are performed by at least one processor;
Method.
灌流量画像からメタKGを導出するステップと、
のうちの一方を更に含む、請求項1に記載の方法。 Deriving a meta KG signal from the raw image;
Deriving meta KG from the perfusion image;
The method of claim 1, further comprising one of:
基調的な生理学的反応に関連する異常の度合いを示すステップと、
を更に含む、請求項5に記載の方法。 Distinguishing between abnormal and normal tissue based on the mean intensity versus time frequency component;
Indicating the degree of abnormality associated with the underlying physiological response;
The method of claim 5 further comprising:
視野内の関心領域の2次元心拍数マップを生成するステップと、
を更に含む、請求項1に記載の方法。 Changing the configuration of the region of interest;
Generating a two-dimensional heart rate map of a region of interest in the field of view;
The method of claim 1, further comprising:
プロセッサと、
前記プロセッサと結合されてコンピュータ可読なプログラムコードを含むメモリと、を含み、前記プログラムコードは、前記プロセッサによって実行されると、
サンプル中の関心領域を少なくとも1つの光源で照らすステップであって、前記光源は近赤外(NIR)光源及び/又は可視光源である、前記照らすステップと、
前記関心領域の画像を取得するステップと、
前記取得画像を処理して、前記取得画像に関連付けられたメタデータを取得するステップと、
前記取得画像に関連付けられた前記メタデータから前記メタKG信号を計算するステップと、を含む動作を前記プロセッサに実施させる、
システム。 A computer system for calculating a meta KG signal,
A processor;
A memory coupled to the processor and including computer readable program code, the program code being executed by the processor;
Illuminating a region of interest in a sample with at least one light source, wherein the light source is a near infrared (NIR) light source and / or a visible light source;
Obtaining an image of the region of interest;
Processing the acquired image to acquire metadata associated with the acquired image;
Calculating the meta KG signal from the metadata associated with the acquired image, causing the processor to perform an operation comprising:
system.
前記平均強度対時間の周波数成分に基づいて、異常な組織と正常な組織とを区別するステップと、
基調的な生理学的反応に関連する異常の度合いを示すステップと、を含む動作を実施する、
請求項17に記載のシステム。 The processor further includes:
Distinguishing between abnormal and normal tissue based on the mean intensity versus time frequency component;
Performing an operation comprising: indicating a degree of abnormality associated with the underlying physiological response;
The system of claim 17.
前記関心領域の構成を変更するステップと、
視野内の関心領域の2次元心拍数マップを生成するステップと、を含む動作を実施する、
請求項14に記載のシステム。 The processor further includes:
Changing the configuration of the region of interest;
Generating a two-dimensional heart rate map of a region of interest within the field of view.
The system according to claim 14.
コンピュータ可読なプログラムコードが実施された非過渡的コンピュータ可読記憶媒体を含み、前記コンピュータ可読なプログラムコードは、
サンプル中の関心領域を少なくとも1つの光源で照らすステップであって、前記光源は近赤外(NIR)光源及び/又は可視光源である、前記照らすステップを実施する為のコンピュータ可読なプログラムコードと、
前記関心領域の画像を取得するステップを実施する為のコンピュータ可読なプログラムコードと、
前記取得画像を処理して、前記取得画像に関連付けられたメタデータを取得するステップを実施する為のコンピュータ可読なプログラムコードと、
前記取得画像に関連付けられた前記メタデータから前記メタKG信号を計算するステップを実施する為のコンピュータ可読なプログラムコードと、を含む、
コンピュータプログラム製品。 A computer program product for calculating a meta KG signal,
A non-transitory computer readable storage medium having computer readable program code implemented thereon, the computer readable program code comprising:
Illuminating a region of interest in the sample with at least one light source, wherein the light source is a near infrared (NIR) light source and / or a visible light source, computer readable program code for performing the illuminating step;
Computer readable program code for performing the step of obtaining an image of the region of interest;
Computer readable program code for performing the steps of processing the acquired image and acquiring metadata associated with the acquired image;
Computer readable program code for performing the step of calculating the meta KG signal from the metadata associated with the acquired image;
Computer program product.
サンプル中の関心領域を、近赤外(NIR)光源及び可視光(VL)源で照らすステップと、
それぞれが前記NIR光源及び前記VL源の一方に対応する2組の、前記関心領域の画像を取得するステップと、
前記2組の画像を処理して、NIRメタデータ及びVLメタデータを取得するステップと、
前記NIRメタデータ及び前記VLメタデータから、NIRメタKG及びVLメタKGを、それぞれ計算するステップと、
前記NIRメタKG及び前記VLメタKGから動き関連の共通信号成分を抽出するステップと、
前記NIRメタKGの前記動き関連の共通信号成分を打ち消すことにより、ノイズのないメタKGを計算するステップと、を含み、
前記照らすステップ、前記取得するステップ、前記処理するステップ、前記計算するステップ、前記抽出するステップ、及び前記計算するステップのうちの少なくとも1つが、少なくとも1つのプロセッサによって実施される、
方法。 A method for removing motion related artifacts from a meta KG signal using a dual wavelength light source, comprising:
Illuminating a region of interest in the sample with a near infrared (NIR) light source and a visible light (VL) source;
Obtaining two sets of images of the region of interest, each corresponding to one of the NIR light source and the VL source;
Processing the two sets of images to obtain NIR metadata and VL metadata;
Calculating NIR meta KG and VL meta KG from the NIR metadata and the VL metadata, respectively;
Extracting a motion related common signal component from the NIR meta KG and the VL meta KG;
Calculating a noise-free meta KG by canceling the motion related common signal component of the NIR meta KG;
At least one of the illuminating step, the obtaining step, the processing step, the calculating step, the extracting step, and the calculating step are performed by at least one processor;
Method.
34. The method of claim 33, wherein the noise resulting from the motion artifact includes respiratory activity.
Applications Claiming Priority (5)
| Application Number | Priority Date | Filing Date | Title |
|---|---|---|---|
| US201462063663P | 2014-10-14 | 2014-10-14 | |
| US62/063,663 | 2014-10-14 | ||
| US201562136010P | 2015-03-20 | 2015-03-20 | |
| US62/136,010 | 2015-03-20 | ||
| PCT/US2015/055234 WO2016061041A1 (en) | 2014-10-14 | 2015-10-13 | Methods, systems and computer program products for determining hemodynamic status parameters using signals derived from multispectral blood flow and perfusion imaging |
Publications (2)
| Publication Number | Publication Date |
|---|---|
| JP2017534378A true JP2017534378A (en) | 2017-11-24 |
| JP2017534378A5 JP2017534378A5 (en) | 2018-11-01 |
Family
ID=55747196
Family Applications (1)
| Application Number | Title | Priority Date | Filing Date |
|---|---|---|---|
| JP2017519928A Pending JP2017534378A (en) | 2014-10-14 | 2015-10-13 | Method, system, and computer program product for determining hemodynamic parameters using signals obtained by multispectral imaging of blood flow and perfusion |
Country Status (6)
| Country | Link |
|---|---|
| US (1) | US10792492B2 (en) |
| EP (1) | EP3188652A4 (en) |
| JP (1) | JP2017534378A (en) |
| CN (1) | CN107257655B (en) |
| CA (1) | CA2963866C (en) |
| WO (1) | WO2016061041A1 (en) |
Cited By (3)
| Publication number | Priority date | Publication date | Assignee | Title |
|---|---|---|---|---|
| JP2021526907A (en) * | 2018-06-08 | 2021-10-11 | イースト カロライナ ユニバーシティ | Determination of Peripheral Blood Oxygen Saturation (SpO2) and Hemoglobin Concentration Using Multispectral Laser Imaging (MSLI) Methods and Systems |
| WO2022064825A1 (en) * | 2020-09-23 | 2022-03-31 | カシオ計算機株式会社 | Electronic device, control program for electronic device, and control method for electronic device |
| US11647889B2 (en) | 2019-03-26 | 2023-05-16 | East Carolina University | Near-infrared fluorescence imaging for blood flow and perfusion visualization and related systems and computer program products |
Families Citing this family (18)
| Publication number | Priority date | Publication date | Assignee | Title |
|---|---|---|---|---|
| EP3188651A4 (en) | 2014-10-14 | 2018-07-04 | East Carolina University | Methods, systems and computer program products for visualizing anatomical structures and blood flow and perfusion physiology using imaging techniques |
| US11553844B2 (en) | 2014-10-14 | 2023-01-17 | East Carolina University | Methods, systems and computer program products for calculating MetaKG signals for regions having multiple sets of optical characteristics |
| US10058256B2 (en) | 2015-03-20 | 2018-08-28 | East Carolina University | Multi-spectral laser imaging (MSLI) methods and systems for blood flow and perfusion imaging and quantification |
| US10390718B2 (en) | 2015-03-20 | 2019-08-27 | East Carolina University | Multi-spectral physiologic visualization (MSPV) using laser imaging methods and systems for blood flow and perfusion imaging and quantification in an endoscopic design |
| US11330995B2 (en) * | 2016-06-28 | 2022-05-17 | Softcare Co., Ltd. | Apparatus and method for imaging and analyzing hemodynamics |
| JP2018015172A (en) * | 2016-07-27 | 2018-02-01 | 花王株式会社 | Hemodynamics evaluation method |
| JP6846626B2 (en) * | 2016-09-23 | 2021-03-24 | パナソニックIpマネジメント株式会社 | Pulse wave measuring device and pulse wave measuring method |
| US20180085014A1 (en) * | 2016-09-23 | 2018-03-29 | Panasonic Intellectual Property Management Co., Ltd. | Pulse wave measuring apparatus, method for measuring pulse waves, and recording medium |
| KR20210045979A (en) | 2018-07-16 | 2021-04-27 | 비비아이 메디컬 이노베이션스, 엘엘씨 | Perfusion and oxygenation measurements |
| CA3106823A1 (en) | 2018-07-19 | 2020-01-23 | Activ Surgical, Inc. | Systems and methods for multi-modal sensing of depth in vision systems for automated surgical robots |
| EP3847660A2 (en) * | 2018-09-05 | 2021-07-14 | East Carolina University | Systems for detecting vascular and arterial disease in asymptomatic patients and related methods |
| WO2020081651A1 (en) | 2018-10-16 | 2020-04-23 | Activ Surgical, Inc. | Autonomous methods and systems for tying surgical knots |
| NO345328B1 (en) * | 2019-02-01 | 2020-12-14 | Roest Bernt Erik | Method and system for extracting metadata from an observed scene. |
| EP3952720A4 (en) | 2019-04-08 | 2023-04-05 | Activ Surgical, Inc. | Systems and methods for medical imaging |
| CN114599263A (en) | 2019-08-21 | 2022-06-07 | 艾科缇弗外科公司 | System and method for medical imaging |
| CN111012316B (en) * | 2020-01-18 | 2022-10-28 | 中川新迈科技有限公司 | Image reconstruction system of photoacoustic mammary gland |
| WO2022076122A1 (en) * | 2020-10-05 | 2022-04-14 | East Carolina University | Methods, systems and computer program products for calculating metakg signals for regions having multiple sets of optical characteristics |
| WO2022076776A1 (en) * | 2020-10-08 | 2022-04-14 | Fresenius Medical Care Holdings, Inc. | Techniques for determining characteristics of dialysis access sites using image information |
Citations (5)
| Publication number | Priority date | Publication date | Assignee | Title |
|---|---|---|---|---|
| JP2005185834A (en) * | 1991-03-07 | 2005-07-14 | Masimo Corp | Signal processing apparatus |
| WO2010131550A1 (en) * | 2009-05-13 | 2010-11-18 | 国立大学法人九州工業大学 | Blood flow image diagnosing device |
| JP2013118978A (en) * | 2011-12-08 | 2013-06-17 | Sony Corp | Measuring device, measuring method, program and recording medium |
| US20130245456A1 (en) * | 2011-01-10 | 2013-09-19 | East Carolina University | Methods, Systems and Computer Program Products for Non-Invasive Determination of Blood Flow Distribution Using Speckle Imaging Techniques and Hemodynamic Modeling |
| US20140213861A1 (en) * | 2011-09-29 | 2014-07-31 | Koninklijke Philips N.V. | Distortion reduced signal detection |
Family Cites Families (131)
| Publication number | Priority date | Publication date | Assignee | Title |
|---|---|---|---|---|
| US4541433A (en) | 1984-06-01 | 1985-09-17 | Medtronic, Inc. | Cardiac output monitor |
| DE69011158T2 (en) | 1989-03-06 | 1995-01-12 | Kowa Co | Diagnostic device in ophthalmology. |
| JPH02268727A (en) | 1989-04-10 | 1990-11-02 | Kowa Co | Method and apparatus for ophthalmologic measurement |
| EP0392744B1 (en) | 1989-04-10 | 1995-03-01 | Kowa Company Ltd. | Ophthalmological measurement method and apparatus |
| JPH0428348A (en) | 1990-05-24 | 1992-01-30 | Hitoshi Fujii | Blood flow state image formation device |
| US6671540B1 (en) | 1990-08-10 | 2003-12-30 | Daryl W. Hochman | Methods and systems for detecting abnormal tissue using spectroscopic techniques |
| US5161531A (en) | 1990-09-14 | 1992-11-10 | Duke University | Method and apparatus for intravascularly measuring oxidative metabolism in body organs and tissues |
| JP3035336B2 (en) | 1990-11-27 | 2000-04-24 | 興和株式会社 | Blood flow measurement device |
| JP3021628B2 (en) | 1990-11-27 | 2000-03-15 | 興和株式会社 | Blood flow measurement device |
| US5490505A (en) | 1991-03-07 | 1996-02-13 | Masimo Corporation | Signal processing apparatus |
| MX9702434A (en) * | 1991-03-07 | 1998-05-31 | Masimo Corp | Signal processing apparatus. |
| DE19506484C2 (en) | 1995-02-24 | 1999-09-16 | Stiftung Fuer Lasertechnologie | Method and device for selective non-invasive laser myography (LMG) |
| US5860922A (en) | 1995-09-07 | 1999-01-19 | Technion Research And Development Foundation Ltd. | Determining blood flow by measurement of temperature |
| US5692510A (en) | 1995-09-07 | 1997-12-02 | Technion Research And Development Foundation Ltd. | Determining coronary blood flow by cardiac thermography in open chest conditions |
| US5588436A (en) | 1995-10-11 | 1996-12-31 | Cook Pacemaker Corporation | Pulsed doppler probe |
| GB9610700D0 (en) | 1996-05-22 | 1996-07-31 | Moor Instr Ltd | Apparatus for imaging microvascular blood flow |
| JP3417246B2 (en) | 1996-09-25 | 2003-06-16 | 日本電気株式会社 | Gradation display method |
| US6587701B1 (en) * | 1997-04-03 | 2003-07-01 | Miroslaw F. Stranc | Method of assessing tissue viability using near-infrared spectroscopy |
| JPH10290791A (en) | 1997-04-18 | 1998-11-04 | Advance Co Ltd | Laser rheometer |
| WO2001003050A1 (en) | 1999-07-02 | 2001-01-11 | Hypermed Imaging, Inc. | Imaging apparatus with means for fusing thermal and hyperspectral images |
| US20040111031A1 (en) | 1999-07-22 | 2004-06-10 | Alfano Robert R. | Spectral polarizing tomographic dermatoscope |
| US20050182434A1 (en) | 2000-08-11 | 2005-08-18 | National Research Council Of Canada | Method and apparatus for performing intra-operative angiography |
| US6915154B1 (en) | 1999-09-24 | 2005-07-05 | National Research Council Of Canada | Method and apparatus for performing intra-operative angiography |
| US6701171B2 (en) | 2000-03-31 | 2004-03-02 | Københavns Universitet | Method and apparatus for non-invasive detection of angiogenic and anti-angiogenic activity in living tissue |
| US6458086B1 (en) | 2000-04-05 | 2002-10-01 | Kenneth Lawrence Franco | Implantable blood flow monitoring system |
| US6889075B2 (en) | 2000-05-03 | 2005-05-03 | Rocky Mountain Biosystems, Inc. | Optical imaging of subsurface anatomical structures and biomolecules |
| AU2001286424A1 (en) | 2000-08-16 | 2002-02-25 | Cook Vascular Incorporated | Doppler probe with shapeable portion |
| US6537223B1 (en) | 2000-09-05 | 2003-03-25 | Medi-Stim As | Probe head |
| US7031504B1 (en) * | 2000-09-26 | 2006-04-18 | Vital Images, Inc. | Image data based retrospective temporal selection of medical images |
| JP4241038B2 (en) | 2000-10-30 | 2009-03-18 | ザ ジェネラル ホスピタル コーポレーション | Optical method and system for tissue analysis |
| DE10059070C1 (en) | 2000-11-28 | 2002-02-14 | Pulsion Medical Sys Ag | Device for determining tissue perfusion has source and expansion optics arranged in safety housing so only expanded beam of intensity within safety limits for persons near device emanates |
| JP5076203B2 (en) | 2001-06-21 | 2012-11-21 | 学校法人日本大学 | Vascular disease inspection device and bypass vascular diagnosis device |
| US6870684B2 (en) | 2001-09-24 | 2005-03-22 | Kulicke & Soffa Investments, Inc. | Multi-wavelength aperture and vision system and method using same |
| EP1300690B1 (en) | 2001-10-02 | 2009-07-29 | B-K Medical A/S | Apparatus and method for velocity estimation in synthetic aperture imaging |
| US7113817B1 (en) * | 2001-10-04 | 2006-09-26 | Wintec, Llc | Optical imaging of blood circulation velocities |
| WO2003032808A2 (en) | 2001-10-15 | 2003-04-24 | University Of Massachusetts | Tissue oxygen measurement system |
| CA2413483A1 (en) * | 2001-12-26 | 2003-06-26 | Kevin R. Forrester | Motion measuring device |
| EP1332718A1 (en) | 2002-02-01 | 2003-08-06 | Stichting Voor De Technische Wetenschappen | Laser doppler perfusion imaging using a CMOS image sensor |
| US6922580B2 (en) | 2002-06-04 | 2005-07-26 | Koninklijke Philips Electronics N.V. | Blood flow gated MRI |
| CA2390781C (en) | 2002-06-14 | 2009-09-22 | Institut National D'optique | Line generator optical apparatus |
| US7404640B2 (en) | 2002-06-14 | 2008-07-29 | Physical Sciences, Inc. | Monitoring blood flow in the retina using a line-scanning laser ophthalmoscope |
| JP4521155B2 (en) | 2002-11-27 | 2010-08-11 | オリンパス株式会社 | Microscope image processing device |
| JP3490433B1 (en) | 2003-06-02 | 2004-01-26 | 株式会社サイバーファーム | Biological information monitoring system |
| US8473035B2 (en) * | 2003-09-15 | 2013-06-25 | Beth Israel Deaconess Medical Center | Medical imaging systems |
| JP4421259B2 (en) | 2003-10-16 | 2010-02-24 | 株式会社ニデック | Laser therapy device |
| KR100634499B1 (en) | 2004-01-12 | 2006-10-13 | 삼성전자주식회사 | Blood flow measurement device and method by using bio-photon measurement |
| US7447408B2 (en) | 2004-07-02 | 2008-11-04 | The General Hospital Corproation | Imaging system and related techniques |
| US20090036784A1 (en) | 2004-08-23 | 2009-02-05 | Robarts Research Institute | Determination of hemodynamic parameters |
| JP4649147B2 (en) | 2004-08-31 | 2011-03-09 | 株式会社東芝 | Ultrasonic diagnostic equipment |
| GB2420641B (en) | 2004-11-29 | 2008-06-04 | Medicsight Plc | Digital medical image analysis |
| DE602006013606D1 (en) | 2005-02-10 | 2010-05-27 | Koninkl Philips Electronics Nv | OPTICAL BLOOD FLOWMETER USING SELF-MIXED DOPPLEREFFEKT |
| JP4767551B2 (en) | 2005-02-14 | 2011-09-07 | セイコーインスツル株式会社 | Blood rheology measurement device and blood rheology measurement method |
| EP3095379A1 (en) * | 2005-04-15 | 2016-11-23 | Surgisense Corporation | Surgical instruments with sensors for detecting tissue properties, and systems using such instruments |
| WO2006111909A1 (en) * | 2005-04-20 | 2006-10-26 | Cvl Cosmetics S.A. | Instrument and method for high-speed perfusion imaging |
| WO2006116672A2 (en) | 2005-04-27 | 2006-11-02 | The Trustees Of Dartmouth College | Systems and methods for tomographic image reconstruction |
| US7232240B2 (en) | 2005-05-06 | 2007-06-19 | Northrop Grumann Corporation | Extended source laser illuminator |
| JP2007125144A (en) | 2005-11-02 | 2007-05-24 | Omega Wave Kk | Laser blood flow imaging apparatus |
| US20090177098A1 (en) | 2006-01-16 | 2009-07-09 | Kousuke Yakubo | Examination System and Examination Method |
| JP4769952B2 (en) * | 2006-02-22 | 2011-09-07 | 国立大学法人九州工業大学 | Personal authentication method and personal authentication device using fingertip blood flow measurement by laser light |
| EP2023807B1 (en) | 2006-06-02 | 2013-08-14 | Cook Medical Technologies LLC | Adjustable tension cuff assembly |
| AU2006203027B2 (en) | 2006-07-14 | 2009-11-19 | Canon Kabushiki Kaisha | Improved two-dimensional measurement system |
| US7804984B2 (en) * | 2006-07-31 | 2010-09-28 | Lumidigm, Inc. | Spatial-spectral fingerprint spoof detection |
| WO2008053474A2 (en) | 2006-10-30 | 2008-05-08 | Elfi-Tech Ltd. | System and method for in vivo measurement of biological parameters |
| JP5092357B2 (en) * | 2006-11-07 | 2012-12-05 | ソニー株式会社 | Imaging display device and imaging display method |
| JP2008139543A (en) | 2006-12-01 | 2008-06-19 | Osaka Prefecture Univ | Fluorescence microscope |
| US20100056936A1 (en) | 2006-12-01 | 2010-03-04 | Hitoshi Fujii | Blood flow rate imaging device |
| WO2008121844A1 (en) | 2007-03-30 | 2008-10-09 | The General Hospital Corporation | System and method providing intracoronary laser speckle imaging for the detection of vulnerable plaque |
| WO2008130906A1 (en) * | 2007-04-17 | 2008-10-30 | Mikos, Ltd. | System and method for using three dimensional infrared imaging to provide psychological profiles of individuals |
| US7541602B2 (en) | 2007-06-04 | 2009-06-02 | Or-Nim Medical Ltd. | System and method for noninvasively monitoring conditions of a subject |
| WO2009008745A2 (en) | 2007-07-06 | 2009-01-15 | Industrial Research Limited | Laser speckle imaging systems and methods |
| WO2009007973A1 (en) | 2007-07-11 | 2009-01-15 | Technion - Research & Development Foundation Ltd | Enhanced smf passive optical networks using polarization beamforming |
| US20090041201A1 (en) | 2007-08-06 | 2009-02-12 | Carestream Health, Inc. | Alignment apparatus for imaging system |
| US8868161B2 (en) | 2007-09-13 | 2014-10-21 | Jonathan Thierman | Detection and display of measured subsurface data onto a surface |
| DE102007054906B4 (en) | 2007-11-15 | 2011-07-28 | Sirona Dental Systems GmbH, 64625 | Method for optical measurement of the three-dimensional geometry of objects |
| US8406860B2 (en) * | 2008-01-25 | 2013-03-26 | Novadaq Technologies Inc. | Method for evaluating blush in myocardial tissue |
| CA2654625A1 (en) | 2008-02-18 | 2009-08-18 | The Board Of Regents For Oklahoma State University | Dual beam optic with dichroic filter |
| DE102008010006B4 (en) * | 2008-02-19 | 2017-06-08 | Siemens Healthcare Gmbh | Method for the three-dimensional representation of a moving structure by a tomographic method |
| RU2506896C2 (en) | 2008-04-14 | 2014-02-20 | Новадак Текнолоджиз Инк. | Determination of location and analysis of perforated flaps for plastic and rehabilitative surgery |
| WO2010042253A2 (en) * | 2008-04-30 | 2010-04-15 | Board Of Regents, The University Of Texas System | An apparatus and method for noninvasive evalution of a target versus a non- target |
| WO2010004365A1 (en) | 2008-07-10 | 2010-01-14 | Ecole Polytechnique Federale De Lausanne (Epfl) | Functional optical coherent imaging |
| DE102008040804B4 (en) * | 2008-07-28 | 2021-07-29 | Carl Zeiss Meditec Ag | Method, surgical microscope and analysis system for the quantitative representation of blood flow |
| JP5322548B2 (en) | 2008-09-17 | 2013-10-23 | 株式会社東芝 | X-ray CT apparatus, medical image processing apparatus, and medical image processing program |
| WO2010096447A2 (en) | 2009-02-17 | 2010-08-26 | Board Of Regents, The University Of Texas System | Quantitative imaging with multi-exposure speckle imaging (mesi) |
| WO2010096453A1 (en) | 2009-02-17 | 2010-08-26 | Board Of Regents, The University Of Texas System | Methods of producing laser speckle contrast images |
| CN102860827B (en) | 2009-09-18 | 2017-05-17 | 东芝医疗系统株式会社 | MRI involving arterial spin labeling |
| US8357281B2 (en) | 2009-09-21 | 2013-01-22 | Advanced Analytical Technologies, Inc. | Multi-wavelength fluorescence detection system for multiplexed capillary electrophoresis |
| CN101703403B (en) * | 2009-11-16 | 2011-01-12 | 清华大学 | Device and method for measuring energy consumption of human body |
| GB0921477D0 (en) * | 2009-12-08 | 2010-01-20 | Moor Instr Ltd | Apparatus for measuring blood parameters |
| JP5689662B2 (en) | 2009-12-09 | 2015-03-25 | 株式会社東芝 | Ultrasonic diagnostic apparatus, ultrasonic image processing apparatus, ultrasonic image processing program, medical image diagnostic apparatus, medical image processing apparatus, and medical image processing program |
| WO2011084528A1 (en) * | 2009-12-15 | 2011-07-14 | Emory University Office Of Technology Transfer | System and method for providing real-time anatomical guidance in a diagnostic or therapeutic procedure |
| US9189851B2 (en) * | 2010-01-07 | 2015-11-17 | Siemens Aktiengesellschaft | Method of motion compensation for trans-catheter aortic valve implantation |
| JP5564654B2 (en) | 2010-05-31 | 2014-07-30 | 岩崎電気株式会社 | LED irradiation device |
| CN101926642B (en) * | 2010-08-31 | 2011-09-28 | 山东大学 | Physiological signal interval series-based cardiac function noninvasive detection device |
| US20120078113A1 (en) | 2010-09-28 | 2012-03-29 | Point of Contact, LLC | Convergent parameter instrument |
| WO2012058381A2 (en) | 2010-10-27 | 2012-05-03 | The General Hospital Corporation | Apparatus, systems and methods for measuring blood pressure within at least one vessel |
| AU2010257224B2 (en) | 2010-12-15 | 2014-09-18 | Canon Kabushiki Kaisha | Block patterns as two-dimensional ruler |
| JP5371946B2 (en) * | 2010-12-24 | 2013-12-18 | 富士フイルム株式会社 | Endoscopic diagnosis device |
| CA2824134C (en) * | 2011-01-10 | 2019-05-14 | East Carolina University | Methods, systems and computer program products for noninvasive determination of blood flow distribution using speckle imaging techniques and hemodynamic modeling |
| US20120191005A1 (en) | 2011-01-22 | 2012-07-26 | Emil Naumovich Sobol | Diagnostic and Feedback Control for Efficacy and Safety of Laser Application for Tissue Reshaping and Regeneration |
| WO2012110955A1 (en) * | 2011-02-14 | 2012-08-23 | Reuven Gladshtein | Indications of cross-section of small branched blood vessels |
| US8780362B2 (en) | 2011-05-19 | 2014-07-15 | Covidien Lp | Methods utilizing triangulation in metrology systems for in-situ surgical applications |
| JP5776006B2 (en) | 2011-12-09 | 2015-09-09 | パナソニックIpマネジメント株式会社 | Three-plate camera device |
| US9848787B2 (en) * | 2012-02-07 | 2017-12-26 | Laser Associated Sciences, Inc. | Perfusion assessment using transmission laser speckle imaging |
| US9593982B2 (en) * | 2012-05-21 | 2017-03-14 | Digimarc Corporation | Sensor-synchronized spectrally-structured-light imaging |
| JP2014000246A (en) | 2012-06-19 | 2014-01-09 | Mitsubishi Electric Engineering Co Ltd | Blood vessel visualization device and blood vessel visualization method |
| CA2914778A1 (en) * | 2012-06-21 | 2013-12-27 | Novadaq Technologies Inc. | Quantification and analysis of angiography and perfusion |
| US9298730B2 (en) | 2012-07-04 | 2016-03-29 | International Medical Solutions, Inc. | System and method for viewing medical images |
| WO2014009859A2 (en) * | 2012-07-10 | 2014-01-16 | Aïmago S.A. | Perfusion assessment multi-modality optical medical device |
| US9640218B2 (en) * | 2012-12-07 | 2017-05-02 | Intel Corporation | Physiological cue processing |
| US9351643B2 (en) | 2013-03-12 | 2016-05-31 | Covidien Lp | Systems and methods for optical measurement for in-situ surgical applications |
| US9435993B2 (en) | 2013-03-24 | 2016-09-06 | Bruker Nano, Inc. | Three dimensional microscopy imaging |
| JP6062793B2 (en) * | 2013-04-23 | 2017-01-18 | ソフトケア有限会社 | Blood flow diagnostic equipment |
| CN103340601A (en) | 2013-06-27 | 2013-10-09 | 中国科学院自动化研究所 | Multi-spectral imaging system and method based on endoscope |
| CN103417196B (en) | 2013-08-23 | 2015-07-22 | 中山大学 | Venous visualizer and visualizing method |
| US9451223B2 (en) | 2013-09-17 | 2016-09-20 | PhotonEdge Inc. | Simultaneous multiplexed imaging system and method |
| US20150148632A1 (en) * | 2013-11-26 | 2015-05-28 | David Alan Benaron | Calorie Monitoring Sensor And Method For Cell Phones, Smart Watches, Occupancy Sensors, And Wearables |
| US10004410B2 (en) * | 2013-12-19 | 2018-06-26 | The Board Of Trustees Of The University Of Illinois | System and methods for measuring physiological parameters |
| US9918666B2 (en) * | 2014-01-13 | 2018-03-20 | The Board Of Regents, The University Of Texas System | Systems and methods for physiological signal enhancement and biometric extraction using non-invasive optical sensors |
| DE102014002514B4 (en) * | 2014-02-21 | 2015-10-29 | Universität Stuttgart | Device and method for multi- or hyperspectral imaging and / or for distance and / or 2-D or 3-D profile measurement of an object by means of spectrometry |
| US10791982B2 (en) * | 2014-05-02 | 2020-10-06 | Stephanie Littell | Methods of measuring head, neck, and brain function and predicting and diagnosing memory impairment |
| US9980657B2 (en) * | 2014-05-30 | 2018-05-29 | Microsoft Technology Licensing, Llc | Data recovery for optical heart rate sensors |
| JP2015223463A (en) | 2014-05-30 | 2015-12-14 | ソニー株式会社 | Lighting system, lighting method, and endoscope |
| EP3188651A4 (en) | 2014-10-14 | 2018-07-04 | East Carolina University | Methods, systems and computer program products for visualizing anatomical structures and blood flow and perfusion physiology using imaging techniques |
| US9931040B2 (en) * | 2015-01-14 | 2018-04-03 | Verily Life Sciences Llc | Applications of hyperspectral laser speckle imaging |
| US10058256B2 (en) * | 2015-03-20 | 2018-08-28 | East Carolina University | Multi-spectral laser imaging (MSLI) methods and systems for blood flow and perfusion imaging and quantification |
| CN106236060B (en) * | 2015-06-04 | 2021-04-09 | 松下知识产权经营株式会社 | Biological information detection device |
| KR102491850B1 (en) * | 2015-07-15 | 2023-01-26 | 삼성전자주식회사 | Imaging system and mentod of laser speckle contrast and apparatus employing the same |
| JP6273241B2 (en) * | 2015-09-24 | 2018-01-31 | ジーイー・メディカル・システムズ・グローバル・テクノロジー・カンパニー・エルエルシー | Radiation tomography method, apparatus and program |
| CN108289590A (en) * | 2015-11-17 | 2018-07-17 | 奥林巴斯株式会社 | Endoscopic system, image processing apparatus, image processing method and program |
| US10115037B2 (en) * | 2016-03-21 | 2018-10-30 | Konica Minolta Laboratory U.S.A., Inc. | Patient identification using dynamic medical images |
| CN116269261A (en) * | 2016-12-01 | 2023-06-23 | 松下知识产权经营株式会社 | Biological information processing method and biological information processing system |
-
2015
- 2015-10-13 WO PCT/US2015/055234 patent/WO2016061041A1/en active Application Filing
- 2015-10-13 US US15/518,545 patent/US10792492B2/en active Active
- 2015-10-13 CA CA2963866A patent/CA2963866C/en active Active
- 2015-10-13 JP JP2017519928A patent/JP2017534378A/en active Pending
- 2015-10-13 EP EP15850641.0A patent/EP3188652A4/en not_active Ceased
- 2015-10-13 CN CN201580067902.XA patent/CN107257655B/en active Active
Patent Citations (5)
| Publication number | Priority date | Publication date | Assignee | Title |
|---|---|---|---|---|
| JP2005185834A (en) * | 1991-03-07 | 2005-07-14 | Masimo Corp | Signal processing apparatus |
| WO2010131550A1 (en) * | 2009-05-13 | 2010-11-18 | 国立大学法人九州工業大学 | Blood flow image diagnosing device |
| US20130245456A1 (en) * | 2011-01-10 | 2013-09-19 | East Carolina University | Methods, Systems and Computer Program Products for Non-Invasive Determination of Blood Flow Distribution Using Speckle Imaging Techniques and Hemodynamic Modeling |
| US20140213861A1 (en) * | 2011-09-29 | 2014-07-31 | Koninklijke Philips N.V. | Distortion reduced signal detection |
| JP2013118978A (en) * | 2011-12-08 | 2013-06-17 | Sony Corp | Measuring device, measuring method, program and recording medium |
Cited By (5)
| Publication number | Priority date | Publication date | Assignee | Title |
|---|---|---|---|---|
| JP2021526907A (en) * | 2018-06-08 | 2021-10-11 | イースト カロライナ ユニバーシティ | Determination of Peripheral Blood Oxygen Saturation (SpO2) and Hemoglobin Concentration Using Multispectral Laser Imaging (MSLI) Methods and Systems |
| US11647889B2 (en) | 2019-03-26 | 2023-05-16 | East Carolina University | Near-infrared fluorescence imaging for blood flow and perfusion visualization and related systems and computer program products |
| WO2022064825A1 (en) * | 2020-09-23 | 2022-03-31 | カシオ計算機株式会社 | Electronic device, control program for electronic device, and control method for electronic device |
| JP2022052191A (en) * | 2020-09-23 | 2022-04-04 | カシオ計算機株式会社 | Electronic device, control program of electronic device, and control method of electronic device |
| JP7314893B2 (en) | 2020-09-23 | 2023-07-26 | カシオ計算機株式会社 | ELECTRONIC DEVICE, ELECTRONIC DEVICE CONTROL PROGRAM AND ELECTRONIC DEVICE CONTROL METHOD |
Also Published As
| Publication number | Publication date |
|---|---|
| US20170274205A1 (en) | 2017-09-28 |
| WO2016061041A1 (en) | 2016-04-21 |
| EP3188652A1 (en) | 2017-07-12 |
| EP3188652A4 (en) | 2018-05-23 |
| US10792492B2 (en) | 2020-10-06 |
| CA2963866A1 (en) | 2016-04-21 |
| CA2963866C (en) | 2023-11-07 |
| CN107257655A (en) | 2017-10-17 |
| CN107257655B (en) | 2020-06-16 |
Similar Documents
| Publication | Publication Date | Title |
|---|---|---|
| JP2017534378A (en) | Method, system, and computer program product for determining hemodynamic parameters using signals obtained by multispectral imaging of blood flow and perfusion | |
| JP7116077B2 (en) | Devices, systems and methods for measuring and processing physiological signals of a subject | |
| US10058256B2 (en) | Multi-spectral laser imaging (MSLI) methods and systems for blood flow and perfusion imaging and quantification | |
| CN113557576A (en) | Method and system for configuring and using neural networks in characterizing physiological systems | |
| US20180000354A1 (en) | Assessing Cardiovascular Function Using an Optical Sensor | |
| US11553844B2 (en) | Methods, systems and computer program products for calculating MetaKG signals for regions having multiple sets of optical characteristics | |
| US9750575B2 (en) | Evaluation of patency using photo-plethysmography on endoscope images | |
| JP7045999B2 (en) | Methods and Devices for Assessing Tissue Vascular Health | |
| JP7311424B2 (en) | Systems and methods for assessing diabetic circulatory complications | |
| US11514577B2 (en) | Intrinsic contrast optical cross-correlated wavelet angiography | |
| Saiko et al. | Feasibility of specular reflection imaging for extraction of neck vessel pressure waveforms | |
| KR101530352B1 (en) | Cfd modeling and analysis method based on material properties | |
| KR20180008134A (en) | A method for predicting a fractional flow reserve | |
| Wajdan et al. | Automatic detection of valve events by epicardial accelerometer allows estimation of the left ventricular pressure trace and pressure–displacement loop area | |
| Zheng et al. | An off-line gating method for suppressing motion artifacts in ICUSsequence | |
| CN109475314B (en) | High resolution blood perfusion imaging using camera and pulse oximeter | |
| WO2022076122A1 (en) | Methods, systems and computer program products for calculating metakg signals for regions having multiple sets of optical characteristics | |
| Bogatu | Enhanced model-based assessment of the hemodynamic status by noninvasive multi-modal sensing | |
| Amelard | Widefield Computational Biophotonic Imaging for Spatiotemporal Cardiovascular Hemodynamic Monitoring | |
| Hinssen et al. | Functional venous diagnostics: spatial acquisition of hemodynamic behavior during muscle pump tests | |
| Razavi | Statistical analysis and modeling of the agreement between the Intrinsic Frequencies technique and the established cardiovascular monitoring methods |
Legal Events
| Date | Code | Title | Description |
|---|---|---|---|
| A521 | Request for written amendment filed |
Free format text: JAPANESE INTERMEDIATE CODE: A523 Effective date: 20180920 |
|
| A621 | Written request for application examination |
Free format text: JAPANESE INTERMEDIATE CODE: A621 Effective date: 20180920 |
|
| A977 | Report on retrieval |
Free format text: JAPANESE INTERMEDIATE CODE: A971007 Effective date: 20190612 |
|
| A131 | Notification of reasons for refusal |
Free format text: JAPANESE INTERMEDIATE CODE: A131 Effective date: 20190625 |
|
| A521 | Request for written amendment filed |
Free format text: JAPANESE INTERMEDIATE CODE: A523 Effective date: 20190924 |
|
| A02 | Decision of refusal |
Free format text: JAPANESE INTERMEDIATE CODE: A02 Effective date: 20200107 |