JP2017500791A - Performance monitoring that provides real-time or near real-time improvement feedback - Google Patents
Performance monitoring that provides real-time or near real-time improvement feedback Download PDFInfo
- Publication number
- JP2017500791A JP2017500791A JP2016533584A JP2016533584A JP2017500791A JP 2017500791 A JP2017500791 A JP 2017500791A JP 2016533584 A JP2016533584 A JP 2016533584A JP 2016533584 A JP2016533584 A JP 2016533584A JP 2017500791 A JP2017500791 A JP 2017500791A
- Authority
- JP
- Japan
- Prior art keywords
- data
- client
- performance
- level
- isp
- Prior art date
- Legal status (The legal status is an assumption and is not a legal conclusion. Google has not performed a legal analysis and makes no representation as to the accuracy of the status listed.)
- Pending
Links
Images


Classifications
-
- H—ELECTRICITY
- H04—ELECTRIC COMMUNICATION TECHNIQUE
- H04L—TRANSMISSION OF DIGITAL INFORMATION, e.g. TELEGRAPHIC COMMUNICATION
- H04L41/00—Arrangements for maintenance, administration or management of data switching networks, e.g. of packet switching networks
- H04L41/06—Management of faults, events, alarms or notifications
-
- H—ELECTRICITY
- H04—ELECTRIC COMMUNICATION TECHNIQUE
- H04L—TRANSMISSION OF DIGITAL INFORMATION, e.g. TELEGRAPHIC COMMUNICATION
- H04L67/00—Network arrangements or protocols for supporting network services or applications
- H04L67/50—Network services
- H04L67/56—Provisioning of proxy services
- H04L67/566—Grouping or aggregating service requests, e.g. for unified processing
-
- G—PHYSICS
- G06—COMPUTING; CALCULATING OR COUNTING
- G06F—ELECTRIC DIGITAL DATA PROCESSING
- G06F11/00—Error detection; Error correction; Monitoring
- G06F11/30—Monitoring
- G06F11/34—Recording or statistical evaluation of computer activity, e.g. of down time, of input/output operation ; Recording or statistical evaluation of user activity, e.g. usability assessment
- G06F11/3466—Performance evaluation by tracing or monitoring
- G06F11/3495—Performance evaluation by tracing or monitoring for systems
-
- G—PHYSICS
- G06—COMPUTING; CALCULATING OR COUNTING
- G06F—ELECTRIC DIGITAL DATA PROCESSING
- G06F11/00—Error detection; Error correction; Monitoring
- G06F11/30—Monitoring
- G06F11/3065—Monitoring arrangements determined by the means or processing involved in reporting the monitored data
- G06F11/3072—Monitoring arrangements determined by the means or processing involved in reporting the monitored data where the reporting involves data filtering, e.g. pattern matching, time or event triggered, adaptive or policy-based reporting
- G06F11/3082—Monitoring arrangements determined by the means or processing involved in reporting the monitored data where the reporting involves data filtering, e.g. pattern matching, time or event triggered, adaptive or policy-based reporting the data filtering being achieved by aggregating or compressing the monitored data
-
- H—ELECTRICITY
- H04—ELECTRIC COMMUNICATION TECHNIQUE
- H04L—TRANSMISSION OF DIGITAL INFORMATION, e.g. TELEGRAPHIC COMMUNICATION
- H04L41/00—Arrangements for maintenance, administration or management of data switching networks, e.g. of packet switching networks
- H04L41/06—Management of faults, events, alarms or notifications
- H04L41/0631—Management of faults, events, alarms or notifications using root cause analysis; using analysis of correlation between notifications, alarms or events based on decision criteria, e.g. hierarchy, tree or time analysis
- H04L41/065—Management of faults, events, alarms or notifications using root cause analysis; using analysis of correlation between notifications, alarms or events based on decision criteria, e.g. hierarchy, tree or time analysis involving logical or physical relationship, e.g. grouping and hierarchies
-
- H—ELECTRICITY
- H04—ELECTRIC COMMUNICATION TECHNIQUE
- H04L—TRANSMISSION OF DIGITAL INFORMATION, e.g. TELEGRAPHIC COMMUNICATION
- H04L43/00—Arrangements for monitoring or testing data switching networks
- H04L43/08—Monitoring or testing based on specific metrics, e.g. QoS, energy consumption or environmental parameters
-
- G—PHYSICS
- G06—COMPUTING; CALCULATING OR COUNTING
- G06F—ELECTRIC DIGITAL DATA PROCESSING
- G06F11/00—Error detection; Error correction; Monitoring
- G06F11/30—Monitoring
- G06F11/34—Recording or statistical evaluation of computer activity, e.g. of down time, of input/output operation ; Recording or statistical evaluation of user activity, e.g. usability assessment
- G06F11/3409—Recording or statistical evaluation of computer activity, e.g. of down time, of input/output operation ; Recording or statistical evaluation of user activity, e.g. usability assessment for performance assessment
-
- H—ELECTRICITY
- H04—ELECTRIC COMMUNICATION TECHNIQUE
- H04L—TRANSMISSION OF DIGITAL INFORMATION, e.g. TELEGRAPHIC COMMUNICATION
- H04L41/00—Arrangements for maintenance, administration or management of data switching networks, e.g. of packet switching networks
- H04L41/06—Management of faults, events, alarms or notifications
- H04L41/0654—Management of faults, events, alarms or notifications using network fault recovery
-
- H—ELECTRICITY
- H04—ELECTRIC COMMUNICATION TECHNIQUE
- H04L—TRANSMISSION OF DIGITAL INFORMATION, e.g. TELEGRAPHIC COMMUNICATION
- H04L41/00—Arrangements for maintenance, administration or management of data switching networks, e.g. of packet switching networks
- H04L41/34—Signalling channels for network management communication
-
- Y—GENERAL TAGGING OF NEW TECHNOLOGICAL DEVELOPMENTS; GENERAL TAGGING OF CROSS-SECTIONAL TECHNOLOGIES SPANNING OVER SEVERAL SECTIONS OF THE IPC; TECHNICAL SUBJECTS COVERED BY FORMER USPC CROSS-REFERENCE ART COLLECTIONS [XRACs] AND DIGESTS
- Y02—TECHNOLOGIES OR APPLICATIONS FOR MITIGATION OR ADAPTATION AGAINST CLIMATE CHANGE
- Y02D—CLIMATE CHANGE MITIGATION TECHNOLOGIES IN INFORMATION AND COMMUNICATION TECHNOLOGIES [ICT], I.E. INFORMATION AND COMMUNICATION TECHNOLOGIES AIMING AT THE REDUCTION OF THEIR OWN ENERGY USE
- Y02D10/00—Energy efficient computing, e.g. low power processors, power management or thermal management
Landscapes
- Engineering & Computer Science (AREA)
- Theoretical Computer Science (AREA)
- General Engineering & Computer Science (AREA)
- Signal Processing (AREA)
- Computer Networks & Wireless Communication (AREA)
- Quality & Reliability (AREA)
- General Physics & Mathematics (AREA)
- Physics & Mathematics (AREA)
- Computer Hardware Design (AREA)
- Computer Vision & Pattern Recognition (AREA)
- Environmental & Geological Engineering (AREA)
- Debugging And Monitoring (AREA)
- Data Exchanges In Wide-Area Networks (AREA)
- Computer And Data Communications (AREA)
Abstract
実施形態は、これに限定されないが、オンライン・ユーザ・エクスペリエンスのモニタリング、および/またはパフォーマンス・イシューを改善するために提供する。実施形態のコンピュータ実装方法は、エンド・ツー・エンドの診断モニタリングおよび解決サービスを提供することの一部として、クライアントのパフォーマンス・データを受け取り、事前凝集し、そして凝集する。実施形態のシステムは、テナント・レベル、地理的位置レベル、および/またはサービス・プロバイダ・レベルの内1つ以上でのレイテンシ問題を特定することの一部として、複数のクライアント・デバイスまたはシステムのパフォーマンス・データを凝集するように構成される。他の実施形態が含まれる。【選択図】図3Embodiments are provided for, but not limited to, monitoring online user experience and / or improving performance issues. The computer-implemented method of the embodiment receives, preaggregates, and aggregates client performance data as part of providing end-to-end diagnostic monitoring and resolution services. The system of an embodiment may perform the performance of multiple client devices or systems as part of identifying latency issues at one or more of tenant level, geographical location level, and / or service provider level. • Configured to aggregate data. Other embodiments are included. [Selection] Figure 3
Description
[0001] 数多くの大規模および小規模ビジネスは、成功する投機的事業(venture)を運営する一部として、幾らかのタイプのオンライン・サービスに依存する。帯域幅は、ネットワークの速度に影響を及ぼす1つの要因となる。レイテンシは、ネットワークの速度およびレスポンスに影響を及ぼす他の要因となる。レイテンシは、ネットワーク・データの処理に影響を及ぼす遅延として説明されることもある。ネットワーク状況、ハードウェアやソフトウェアの制約、および/または他の要因は、幾らかのオンライン・アプリケーションまたはサービスのユーザのエクスペリエンスに悪影響を与えることがある。クラウド・コンピューティングおよびデータセンター・サービスの出現と共に、何百ものサーバ・コンピュータ、および何百万ものユーザにワールドワイドにサービス提供する付随のネットワーク・インフラストラクチャにわたるボトルネックを最小限にしてサービスをタイムリに提供しなければならない。 [0001] Many large and small businesses rely on some type of online service as part of running a successful venture. Bandwidth is one factor that affects the speed of the network. Latency is another factor that affects network speed and response. Latency is sometimes described as a delay that affects the processing of network data. Network conditions, hardware and software constraints, and / or other factors can adversely affect the user experience of some online applications or services. With the advent of cloud computing and data center services, services can be timed to minimize bottlenecks across hundreds of server computers and the accompanying network infrastructure that serves millions of users worldwide. Must be provided to.
[0002] 1つの困難性は、複数の地理的位置および複数の多様なコンポーネントを通じた1つ以上のサービスの健全性をリアルタイムまたは準リアルタイムにモニタリングすることに伴う煩雑さである。システム・ダウンタイムおよび少しのパフォーマンス低下でさえも、追加のマン・アワー、コスト、およびマシン・オーバーロードに至ることがあり、ビジネス上のボトム・ラインに潜在的に影響を及ぼすことがある。残念なことに、現在の最高水準の技術でも、効率的に問題(issue)を特定し、極力早く強力な解決案またはフィードバックを提供する、パフォーマンスのモニタリングおよび解決システムを提供するのは不十分である。
[0003] 本摘要は、簡略化した形態で概念の選択を導入するために設けられる。概念は、以下の発明の詳細な説明において更に説明される。本摘要は、特許請求する主題の鍵となる特徴または必須の特徴を特定することを意図せず、且つ、特許請求する主題の範囲を決定する際の補助として意図するものでもない。
[0002] One difficulty is the complexity associated with monitoring the health of one or more services through multiple geographic locations and multiple diverse components in real time or near real time. Even system downtime and slight performance degradation can lead to additional man hour, cost, and machine overload, potentially affecting the business bottom line. Unfortunately, even the current state-of-the-art technology is not sufficient to provide performance monitoring and resolution systems that efficiently identify issues and provide powerful solutions or feedback as quickly as possible. is there.
[0003] This summary is provided to introduce a selection of concepts in a simplified form. The concept is further explained in the detailed description of the invention below. This summary is not intended to identify key features or essential features of the claimed subject matter, nor is it intended as an aid in determining the scope of the claimed subject matter.
[0004] 実施形態は、これらに限定されないが、オンライン・ユーザ・エクスペリエンスのモニタリング、および/またはパフォーマンス問題を改善する(remediate)ために設けられる。実施形態のコンピュータ実装方法は、エンド・ツー・エンドの診断モニタリングおよび解決サービスを提供することの一部として、クライアント・パフォーマンス・データを受け取り、事前凝集し、そして凝集するように動作する。実施形態のシステムは、テナント・レベル、地理的位置レベル、および/またはサービス・プロバイダ・レベルの内1つ以上で生じるレイテンシを特定することの一部として、複数のクライアント・デバイスまたはシステムのパフォーマンス・データを凝集するように構成される。他の実施形態が含まれる。 [0004] Embodiments are provided to, but are not limited to, monitoring the online user experience and / or remediating performance issues. The computer-implemented method of the embodiment operates to receive, pre-aggregate, and aggregate client performance data as part of providing end-to-end diagnostic monitoring and resolution services. The system of an embodiment may include performance performance of multiple client devices or systems as part of identifying latency that occurs at one or more of tenant level, geographic location level, and / or service provider level. Configured to aggregate data. Other embodiments are included.
[0005] これらの、そして他の特徴および効果は、以下の詳細な説明を読み込み、関連の図面を検討することから明らかになるであろう。上記の包括的な説明および下記の詳細な説明は例示に過ぎず、特許請求する発明を限定するものではないことが理解されるべきである。 [0005] These and other features and advantages will become apparent from a reading of the following detailed description and a review of the associated drawings. It is to be understood that the above general description and the following detailed description are exemplary only and are not intended to limit the claimed invention.
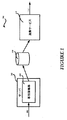
[0013] 図1は、これに限定されないが、リアルタイムまたは準リアルタイムのエンド・ユーザ・パフォーマンス・モニタリング・サービスを提供するように部分的に動作する例示のシステム100を示す。システム100のコンポーネントは、凝集したレイテンシおよび/またはネットワーク・データを用いるように部分的に動作して、ネットワーク・エコシステム問題を緩和させ、および/または解決することができる。一例として、1つ以上のオフィス生産性アプリケーションおよび/またはアプリケーションの組み合わせ(suite)の機構(feature)を提供するといったオンライン・サービスの提供の一部として、システム100のコンポーネントは、パフォーマンス・データの凝集に基づいて障害ゾーン分析および解決の情報をテナントに提供するように動作することができる。システム100のコンポーネントを用いて、オンライン・サービスについてのリアルタイムまたは準リアルタイムのユーザビリティの評価を提供することができる。また、如何なる関連のパフォーマンス若しくはユーザ・エクスペリエンスの問題をもトラブルシュートおよび/または矯正するために、障害ゾーンを特定またはターゲットにすることができる。
[0013] FIG. 1 illustrates an
[0014] 後述するように、システム100はエンド・ユーザのパフォーマンス特性(optics)をオンライン・サービスのコンシューマに供給する機構を有する。パフォーマンス特性は、例えば、如何なる1または複数の地理的位置にもわたるパフォーマンスまたはユーザ・ベースの他の測定基準をビューする機能を有するカスタマにおいて1つ以上の者(person)をイネーブルすることによって、リアルタイムのテナント・レベル特性を定量化することを含む。例えば、システム100のコンポーネントは、規定した関心のある(interest)位置内でレポートまたはアラートするために、トップ・レイテンシ・データまたは他のアウトライアを識別するテナント・レベル・データを収集することによって、部分的に動作する。地理的レベルでフォーカスする機能を具備することにより、例えば、劣悪なCDNパフォーマンス、DNS解決時間、より長いラウンド・トリップ時間等のような位置に特化した問題を発見することができる。加えて、サービス・プロバイダに基づく地理的細かさ(geographic granularity)は、インターネット・サービス・プロバイダ(ISP)レベルでの問題を特定するのを可能にする。
[0014] As described below, the
[0015] これに応じて、コンシューマはリアルタイムまたは準リアルタイムのフィードバックを用いて、劣化さもなければ欠陥のあるサービス・エクスペリエンスを有する、ユーザ、テナントおよび/または位置を特定することができる。簡潔に上述したように、システム100のコンポーネントは、テナントに対し1つ以上の障害ゾーンを確認し、劣化したエクスペリエンスを有する特定のユーザを識別するように動作することができる。例えば、オンライン電子メール・サービスを利用しているエンド・ユーザをモニタリングすることの一部として、凝集サービス110は凝集した出力112を生成するためにルールを使用することができる。その結果、通信レイテンシのスケールによってカラー・コード化された地理的ベースのレイテンシ・マップを生成することができる。凝集サービス110は、地理的パラメータ、ISPパラメータ、および/または後述する他のパラメータに基づいて、問題をデバッグおよび分離することの一部として、構成されたルールを使用して、凝集した出力112を生成することができる。
[0015] In response, consumers can use real-time or near real-time feedback to identify users, tenants and / or locations that have a degraded or otherwise defective service experience. As briefly described above, the components of the
[0016] これに応じて、システム100のコンポーネントは、例えば、DNSリゾルバ、ISPピアリング、ネットワーク・ルーティング、非最適位置ホスティング等に拘束される問題を分離することによって、障害ゾーンを特定するように動作する。例えば、システム100のコンポーネントを使用して、1つ以上の位置(例えば、地域、国、州等)、1つ以上のテナント、地理的位置またはISPにより選択されたテナント、および/またはISPにより選択された地理的位置についてのユーザ・エクスペリエンスの状態を評価または定量化することができる。システム100は、クライアント時間、ネットワーク時間、サーバ時間、CDN時間、接続時間などにより、レイテンシ単位の例えばテナントおよびISPの第1数のようなアウトライア・データを特定することにより、レイテンシおよび他のパフォーマンス測定基準の履歴上の傾向を生成することにより、有効なエッジおよび他のサーバ配備についてのガイダンス・データを提供することにより、地理マッピング機能を有するメールボックス・サーバを構成することによる事前凝集をイネーブルすることにより、リアル・ユーザのCDN相互作用に対する洞察(insight)を得るレポート・データを報告することにより、ロード時間を低減させるためにウェブ・アクセス・ベースでローカルにインストールされたクライアントをサポートすることにより等、レイテンシ、または付加的な故障(breakdown)を有する他のデータのデバッグを提供するように部分的に動作する。クライアントにしたがい、異なる種別の測定基準または他のデータを収集して、ユーザ・エクスペリエンスを定量化する際の使用のためにシステム100に提供することができる。
[0016] In response, components of the
[0017] システム100のコンポーネントは、劣化したエクスペリエンスを有する、特定のユーザまたはユーザ・グループを特定するように率先して動作することにより、オンライン・サービスまたはアプリケーションの使用のサポートの一部として動作することができる。後述するように、オンライン・サービスまたはアプリケーションのパフォーマンス状態を評価することの一部として、特定の位置またはISPについての1つ以上のベースライン・エクスペリエンスに対し、定量的な比較を行うことができる。ロバストで最新版のベースラインを確立することにより、パフォーマンスに関連する呼/電子メールに対し、よりフォーカスした信頼性のある応答を可能にする。また、率先した態様のアウトライアの特定を用いて、サービス・コンシューマと360度ループを有することができる。
[0017] The components of the
[0018] システム100の一実施形態では、サービス・サポートの通信インフラストラクチャを備える。通信インフラストラクチャは、サーバ・コンポーネント、クライアント・コンポーネント、および/またはネットワーク条件に関するパフォーマンスや、他の問題(例えば、ネットワーク・レイテンシの問題、DNSルックアップの問題、コンテンツ・デリバリ・ネットワーク(CDN)の問題等)についてのトラブルシューティングおよび修復を可能にする。一実施形態によれば、データ収集サービスは分散アーキテクチャを備える。当該アーキテクチャは、サーバ・ノード毎に生のクライアント・データを処理することにより、最終的な凝集よりも前に、データセンタの位置に部分的に基づいてクライアント・データを分割する。生のクライアント・データの処理は、事前凝集データを1つ以上のストア(例えば、複数のデータベース・サーバ)にアップロードする前に、生のデータを事前凝集することを含む。
[0018] In one embodiment of the
[0019] 実装態様によれば、凝集サービス110は、別個の、または統合されたサービスとして構成することができる。サービスは、1つ以上の複数の物理マシン上で起動し、共通および/またはカスタマイズされた測定基準に基づいて、複数のデータ・ストアにわたり事前凝集されたデータをグローバルに凝集する。各ノードでのデータの収集の一部として事前凝集を行うことにより、最終的な凝集において使用されるデータ・ポイントの数を制限することに部分的に起因して、処理時間および使用を低減させることができる。つまり、凝集データは、リアルタイムまたは準リアル・タイムに生成されることができる。一実施形態の凝集サービス110は、レイテンシや、ナビゲーションおよび/またはロード・タイミング・データを含む他のパフォーマンス・データを自動的に凝集するように構成される。その結果、如何なる実現したまたは潜在的な問題も効率的に改良することの一部として、異なるレベルまたは粒度(例えばテナント・レベル、地理的若しくは位置レベル、および/またはISPレベル)で問題を特定することができる。 [0019] According to implementations, the aggregation service 110 can be configured as a separate or integrated service. The service runs on one or more multiple physical machines and globally aggregates pre-aggregated data across multiple data stores based on common and / or customized metrics. Pre-aggregation as part of data collection at each node reduces processing time and usage due in part to limiting the number of data points used in the final aggregation be able to. That is, aggregation data can be generated in real time or near real time. The aggregation service 110 of one embodiment is configured to automatically aggregate latency and other performance data including navigation and / or load timing data. As a result, identifying problems at different levels or granularities (eg, tenant level, geographic or location level, and / or ISP level) as part of efficiently improving any realized or potential problem be able to.
[0020] 引き続き図1を参照する。制限された数のコンポーネントが様々な実施形態の態様を説明するために示されるが、実施形態はこれに限定されるのではなく、他の構成も利用可能であることは言うまでもない。例えば、単一サーバ102が示される一方で、システム100は複数のサーバ・コンピュータを含んでもよい。複数のサーバ・コンピュータは、事前凝集サーバ、データベース・サーバ、および/または凝集サーバを、エンド・ツー・エンドのコンピューティング・アーキテクチャの一部として動作するクライアント・デバイス/システムと同様に含む。サーバは、特定の実装態様によっては、1つ以上の物理および/または仮想マシンを備えてもよいことは言うまでもない。
[0020] Continuing to refer to FIG. Although a limited number of components are shown to illustrate aspects of various embodiments, it should be understood that the embodiments are not limited to this, and that other configurations are available. For example, while a
[0021] 更に後述するように、システム100のコンポーネントは、アプリケーションまたはネットワークの状態に関し、リアルタイムまたは準リアルタイムにレポートをクライアントに供給することの一部として、クライアント情報を収集、事前凝集、凝集、および/または分析するように構成される。付加的コンポーネントおよび/または機構は、必要に応じてシステム100に付加することができる。例えば、特定されたレイテンシに基づいて、カスタマはフィードバックを使用して、ネットワーク内の付加的なエッジ・サーバを配備してもよい。後述するように、システム100のコンポーネントを使用して、クライアントまたはコンシューマ・ベースでサービス提供する複数のネットワークおよびネットワーク種別にわたり、異なるユーザ・エクスペリエンスおよび/またはネットワーク条件を確定してもよい。
[0021] As will be described further below, the components of
[0022] 図1に示されるように、サーバ102は、1つ以上のクライアントから情報を受け、入力104として示される。実施形態によれば、オンライン・サービスまたはアプリケーションを使用する間、入力104は、クライアントと関連付けられるフォーマンス・データを含む。例えば、生のパフォーマンス・データは、処理のためにサーバ102にアップロードすることができる。一実施形態では、入力104は、クライアント・エクスペリエンス(例えばロードおよびナビゲートするウェブ・リソース)に関する情報を含み、および/または、サーバ102はサーバ・コンピュータを備え、ログ・ファイルの使用をサポートして、収集したデータを格納する。一実施形態では、ユーザ・デバイス/システム上で起動するブラウザまたは他のアプリケーションは、ナビゲーション・タイミング・パラメータ、ロード・タイミング・パラメータ、および/またはサーバ・ログ・ファイルに書き込まれるカスタム・メーカ・パラメータの内1つ以上に関連する情報を収集するスクリプト・コードを使用することができる。例えば、サーバ102は、MICROSOFT EXCHANGEサーバとして構成することができ、1つ以上の障害テナント、トランザクション・ベースのデータベースを使用して、情報を格納することができる。
As shown in FIG. 1,
[0023] 実施形態によれば、処理およびメモリのリソースに加えて、サーバ102は拡張可能診断機構(extensible diagnostic features)を含み、これに限定されないが、入力104に含まれる生のパフォーマンス・データに対して部分的に動作する事前凝集器106を利用する。実施形態の事前凝集器106は、クライアント・データを抽出し、1つ以上のマッピング・テーブルにマップすることの一部として、ログ・ファイルに格納されるクライアント・データを解析するように動作する。一実施形態では、事前凝集器106は、1つ以上のログ・ファイルに格納されるパフォーマンス・データを解析するように動作する。ここでは、上記マッピングは、クライアントのIPアドレスおよびログ付けしたクライアント情報を、地理的位置(例えば、国/州)、ISPおよび/またはテナントのグローバル・ユーザ識別子(GUID)の1つ以上に変換することによって、部分的に規定される。
[0023] According to embodiments, in addition to processing and memory resources, the
[0024] 事前凝集器106は、IP、位置、ISPおよび/またはテナントGUIDの内1つ以上によってパフォーマンス・データをグループ化した後に、グループ化された情報をストア108に格納するように構成される。例えば、事前凝集器106は、クライアントのレイテンシ測定基準に関連付けられるパフォーマンス・データを、国/州、ISPおよび/またはテナントでグループ化するように構成することができる。ログ付けしたデータがISPレベルに対して解決するできない場合は、事前凝集器106は国および/またはテナントに対して制限したグループを特定できる。国およびISPパラメータは、クライアントのIPアドレスにしたがって決定できることは言うまでもない。
[0024] The pre-aggregator 106 is configured to store the grouped information in the
[0025] 図示されるように、凝集サービス110は、事前凝集器106によって供給された事前凝集出力に対して動作して、凝集出力112を生成する。事前凝集器106によって提供される機能(functionality)は、凝集サービス110での処理およびメモリ・リソースにおける効率的な使用を増長すると共に、電力消費を低減させるようにも部分的に動作する。何故ならば、凝集出力112を生成するには、より少量のデータ・セットが凝集サービス110に入力さればよいからである。実施形態における凝集サービス110は、1つ以上のサーバ・コンピュータ、および凝集した出力112を供給するように動作する複雑な凝集コードを備える。詳細に後述するように、凝集された出力112は更に処理されて、如何なる潜在的な障害ゾーンおよび/またはユーザ・エクスペリエンスに寄与することもある他の問題を特定することができる。一実施形態の凝集サービス110は、全てのデータベースにわたって事前凝集データを凝集し、特定のアプリケーション、サービス、または他のコンポーネントに関連付けられるテナント・レベル、国レベルおよび/またはISPレベルのレイテンシを定量化することができる。
As shown, the agglomeration service 110 operates on the pre-aggregation output provided by the pre-aggregator 106 to generate the
[0026] 後述するように、ルールは、事前凝集出力の処理を制御する凝集サービス110と共に含まれ、凝集出力112を生成することができる。異なるルール種別に基づいて、凝集出力112は、相関、傾向、ベースライン比較、および/または、アプリケーション若しくはオンライン・サービスの実行中に使用エクスペリエンスに拘束される他の定量化された情報を含むフォーカスを供給する。例えば、事前凝集データに対して動作するルールを実装することができ、その結果、例えば北アメリカについての所定の測定基準に対し、75%のパーセンタイル値xおよび標準偏差yを導出するようにして、地域の全体値に基づくパフォーマンスを分析することができる。メキシコについての測定値が(x+y)よりも大きい場合は、技術陣(engineering staffに対し、潜在的な問題の拡大を引き起こす場合がある。付加的な機構について更に後述する。
[0026] As will be described later, the rules can be included with an aggregation service 110 that controls the processing of the pre-aggregation output to generate an
[0027] 複雑な通信アーキテクチャは通例、複数のハードウェアおよび/またはソフトウェア・コンポーネントを採用する。サーバ・コンピュータ、ネットワーク・コンポーネント、並びに有線および/または無線ネットワークによる通信および相互作用を可能にする他のコンポーネントを含むが、これに限定されないことは言うまでもない。幾らかの実施形態について説明してきたが、ハンドヘルド・デバイス、マルチプロセッサ・システム、マイクロプロセッサ・ベース、またはプログラム可能なコンシューマ・エレクトロニクス、ミニコンピュータ、メインフレーム・コンピュータ等を含む様々な実施形態を、数多くのコンピュータ構成と共に使用してもよい。様々な実施形態は、1つ以上の通信ネットワークを通じて通信するリモート処理デバイス/システムを用いて、分散コンピューティング環境で実装されてもよい。分散コンピューティング環境では、プログラム・モジュールまたはコードは、ローカルおよびリモート両方のメモリに配置してもよい。様々な実施形態は、プロセスまたは方法、システム、デバイス、製造物品等として実施することができる。 [0027] Complex communication architectures typically employ multiple hardware and / or software components. Of course, including but not limited to server computers, network components, and other components that allow communication and interaction over wired and / or wireless networks. Although several embodiments have been described, many different embodiments have been described, including handheld devices, multiprocessor systems, microprocessor-based, or programmable consumer electronics, minicomputers, mainframe computers, etc. It may be used together with the computer configuration. Various embodiments may be implemented in a distributed computing environment with remote processing devices / systems communicating through one or more communication networks. In a distributed computing environment, program modules or code may be located in both local and remote memory. Various embodiments can be implemented as a process or method, system, device, article of manufacture, etc.
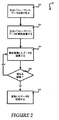
[0028] 図2は、実施形態により、パフォーマンス診断(diagnostics)および/または改善(remediation)サービスを提供することの一部として、パフォーマンスおよび他のデータを事前凝集および凝集する例示のプロセス200を示すフロー図である。プロセス200は202で、生のパフォーマンス・データを受け取ることにより開始する。例えば、プロセス200は202で、オンライン・サービスまたはアプリケーションの状態の評価を要求することの一部として、サーバ・コンピュータを用いてクライアントが収集するクライアント中心のパフォーマンス・データを受け取るように動作ができる。一実施形態では、プロセス200は202で、クライアントのパフォーマンス・データを受け取るように動作する。クライアントのパフォーマンス・データは、ナビゲーション・タイミング、ページ・ロード・タイミング、および/または、オンライン・サービスまたはアプリケーションに関連付けられた健康状態またはユーザ・エクスペリエンスを評価する際に使用する他のパラメータを含む。
[0028] FIG. 2 illustrates an
[0029] プロセス200は204で、生のパフォーマンス・データを事前凝集するように動作する。一実施形態では、プロセス200は204で、事前凝集データを最終的な凝集動作のために1つ以上のデータベースにアップロードする前に、ログ・ファイルを解析することによって、また、テナント識別子、位置識別子、および/またはISP識別子の内1つ以上にクライアントIPアドレスをマップすることによって、生のパフォーマンス・データを事前凝集するように動作する。プロセス200は206で、事前凝集データを凝集するように動作する。一実施形態では、プロセス200は206で、テナント・レベル、位置レベル、および/またはISPレベルの内1つ以上で問題を特定するために、レイテンシまたは他のユーザ・エクスペリエンスの数量詞(quantifier)の出力を生成することによって、事前凝集データを凝集するように部分的に動作する。
[0029] The
[0030] 208で更なる凝集動作がない場合は、プロセス200は210に進み、レイテンシおよび/または他の分析のために凝集データを使用する。そうでない場合は、プロセス200は、206に戻って凝集動作を継続する。上述し、更に後述するように、偶発的または他の手段を実装することによって、特定された如何なる問題も改善させることの一部として、凝集出力を利用することができる。特定の数および順序の動作を図2の例示フローのために説明した一方で、他の数、組み合わせ、および/または順序を所望の実装形態にしたがって使用できることは言うまでもない。
[0030] If there is no further aggregation action at 208, the
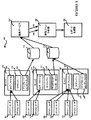
[0031] 図3は、例示のエンド・ツー・エンドのデータ処理パイプライン300のコンポーネントを示すブロック図である。パイプライン300は、インフラストラクチャ、パフォーマンス、ネットワーク、またはオンライン・アプリケーション若しくはサービスの利用に悪影響を与えることがある他の問題を特定することの一部として、ユーザの洞察を与えて、凝集データにするように部分的に動作する。例えば、クラウド・ベースのアプリケーション・サービスをサポートするオンライン・サービスは、ユーザ・シナリオ・レイテンシおよび詳細な故障の供給を含む、パフォーマンス・データまたは測定基準を、クライアント動作パラメータ、テナント・パラメータ、IPパラメータ、位置パラメータ、および/またはISPパラメータの内1つ以上に関連付けられる収集済みの測定基準によって準リアル・タイムに収集および定量化する機能を含むことができる。パイプライン300のコンポーネントは、テナント・レベル、IPレベル、地理的位置レベル、および/またはISPレベルでデータを凝集、ピボット、および/または格納するように部分的に動作する。パイプライン300のコンポーネントは、パフォーマンスの低下を低減させるために、率先してユーザ・エクスペリエンスをモニタリングするように部分的に動作すると共に、エンド・ユーザのパフォーマンス問題を改善するようにアラートおよび/または解決策を提供する。
FIG. 3 is a block diagram illustrating components of an exemplary end-to-end
[0032] 図3に示されるように、第1テナント・ユーザに関連付けられるクライアント302、および第2テナント・ユーザに関連付けられるクライアント304は、サーバ306と通信している。図示されるように、ログ・ファイル308は、クライアント302および304から、収集したデータを受け取って格納する。一実施形態では、クライアント302は、ユーザ・デバイス・システム上で起動しているブラウザ・アプリケーションの一部として実装することができる。ここでは、スクリプト・コードを使用して、例えばページ・ロード時間、接続時間、または幾らかの他のパラメータのような、オンライン・アプリケーションまたはサービスの使用に関連付けられる情報を収集することができる。一実施形態のサーバ306は、クライアント302および304にサービス提供する専用サーバ・コンピュータを備える。実施形態によれば、サーバ306は、関連付けられるノードのためにIPマッパー310およびアップロード・コンポーネント312を使用する診断サービスを含む。
As shown in FIG. 3, a
[0033] IPマッパー310およびアップロード・コンポーネント312は、ログ・ファイル308のデータに対し事前凝集サービスを提供するように部分的に動作する。上述したように、これらコンポーネントによって提供される事前凝集サービスを実行するために単一コンポーネントを構成することができる。実施形態のIPマッパー310は、クライアント毎またはテナント毎に、IPアドレス、位置、および/またはISPの内1つ以上に基づいて、ログ付けしたパフォーマンス・データまたは測定基準を抽出およびマップするために、ログ・ファイル308を解析するように部分的に動作する。一実施形態によれば、IPマッパー310は、クライアントIPアドレス、およびパフォーマンスまたはレイテンシ・データを、地理的位置(例えば、国/州)、ISP、および/またはテナントのグローバル・ユーザ識別子(GUID)の1つ以上にマップすることによって、クライアント・データを事前凝集または統合するように部分的に動作する。アップロード・コンポーネント312は、位置、ISPおよび/またはテナントGUIDの1つ以上によってグループ化され、IPマッパー310によって供給されたマッピング・データを専用データベース314にアップロードするように動作する。ログ付けしたデータがISPレベルに解決することができない場合は、事前凝集は、国および/またはテナントに制限されるグループ化を含むことができる。国およびISPパラメータをクライアントIPアドレスにしたがって決定できることは言うまでもない。
[0033] The
[0034] 引き続き図3を参照して、サーバ306のコンポーネントは、複雑なプログラム・コードで構成される。当該プログラム・コードは、収集済みのクライアント・データを解析することにより(例えば、パフォーマンス・データ・ログを解析することにより)、また、ユーザ・シナリオ、イベント時間、クライアントIP、レイテンシ、テナント・データ、およびクライアント情報に基づく他の詳細化した測定基準を抽出することにより、収集したクライアント・データを事前凝集するように部分的に動作する。従って、サーバ306は、レイテンシおよび/または他のパフォーマンス上の問題を特定する際に最終的な凝集負荷を軽減させることの一部として、クライアントから受け取ったデータを事前凝集することができる。
Still referring to FIG. 3, the components of the
[0035] 実施形態のIPマッパー310は、マッピング粒度にしたがってクライアントIPアドレスを地理的位置にマップし、および/または、既知の若しくは実装されることになるIPレンジに基づいて、クライアントIPを関連のISPにマップするように動作する。サーバ306は、クライアントの種別および/または関連のクライアント・データに基づいて分析するように動作する分析コードを含む。例えば、ウェブ・アクセス・クライアントのパフォーマンス・データは、収集されて、セッションをサービス提供するメールボックスのログ・ファイルにルーティングされる。ここでは、分析コードは特定のクライアント情報を分析して、シナリオ、レイテンシ、および関連の問題(例えば、遅いナビゲーション時間、遅いDNS時間等)を理解することになる。
[0035] The
[0036] 実施形態における解析は、クライアントIPアドレスおよびログ・ファイル中のテナント情報を、国/州、ISPおよび/またはテナントGUIDに変換するように動作する。一実施形態では、解析動作は、一般的なパブリック地理マッピング・データベースから生成される、導出されたマッピング・テーブルを用いて部分的に実行される。 [0036] The analysis in the embodiment operates to convert the client IP address and tenant information in the log file into country / state, ISP and / or tenant GUID. In one embodiment, the parsing operation is performed in part using a derived mapping table that is generated from a general public geographic mapping database.
[0037] 解析のための地理マッピング・データベースにおける例示のデータ入力は、以下のものを含むことができる。
StartIP|EndIP|CIDR|Continent|Country|Country_IS02|CountryConfidence|Region|State|State_CF|City|CityConfidence|Postal_Code|.....
16777472|16778239|24|asia|china|cn|8||beijingshi|73|beijing|5|100000|0|8|39.91176055|116.3792325|0|0|0|unknown||none|False|0|0|0|1307256208|0|RT_Unknown
16778240|16779263|24|oceania|australia|au|8||victoria|74|melbourne|5|3000|0|10|-37.8132|144.963|0|0|0|unknown||none|False|56203|7482486|440|1312156419|1312378472|RT_Unknown
[0037] Exemplary data entries in a geographic mapping database for analysis may include:
StartIP | EndIP | CIDR | Continent | Country | Country_Country_IS02 | CountryConfidence | Region | State | State_CF | City | CityConfidence | Postal_Code | .....
16777472 | 16778239 | 24 | asia | china | cn | 8 || beijingshi | 73 | beijing | 5 | 100000 | 0 | 8 | 39.91176055 | 116.3792325 | 0 | 0 | 0 | unknown || none | False | 0 | 0 | 0 | 1307256208 | 0 | RT_Unknown
16778240 | 16779263 | 24 | oceania | australia | au | 8 || victoria | 74 | melbourne | 5 | 3000 | 0 | 10 | -37.8132 | 144.963 | 0 | 0 | 0 | unknown || none | False | 56203 | 7482486 | 440 | 1312156419 | 1312378472 | RT_Unknown
[0041] 実施形態のIPマッパー310によって適用される解析動作は、IPレンジおよびこれにしたがう対応の国に基づいて各データ入力、ソートおよびマージを走査することによって、IPの国への導出マッピング・テーブルを生成する結果となる。
16777216,au
16777472,cn
16778240,au
16779264,cn
16781312,jp
16785408,cn
16793600,jp
16809984,th
16842752,cn
[0041] The parsing operations applied by the
16777216, au
16777472, cn
16778240, au
16779264, cn
16781312, jp
16785408, cn
16793600, jp
16809984, th
16842752, cn
[0051] マッピング・テーブルは、例示のマッピング{キー,値}データを含むことができる。上述したように、マップ・データは、開始IPアドレスを表す整数値であるキー、および国のISOコードである値を含む。上記のマッピング・データでは、16777216と16777472の間にあるIPアドレスはAUに属する。キーをソートすることによって、テーブルは、素早い参照(quick look-up)用にメモリにロードするために圧縮することができる。 [0051] The mapping table may include exemplary mapping {key, value} data. As described above, the map data includes a key that is an integer value representing the starting IP address, and a value that is the country's ISO code. In the above mapping data, the IP address between 16777216 and 16777472 belongs to AU. By sorting the keys, the table can be compressed for loading into memory for quick look-up.
[0052] 同様に、IPマッパー310によって適用される解析動作は、IPのISPマッピング(後記)への導出マッピング・テーブルを生成する結果となる(値がISPのASN番号であることを除き、キーは上記と同一である)。
17498112,18313
17514496,38091
17522688,38669
17530880,17839
17563648,18245
[0052] Similarly, the parsing operation applied by
17498112,18313
17514496,38091
17522688,38669
17530880,17839
17563648,18245
[0058] 引き続き図3およびその例を参照する。サーバ316は、IPマッパー322およびアップロード・コンポーネント324を使用することにより、ログ・ファイル321に格納されたクライアントのクライアント・データ318および320を処理、即ち、事前凝集し、該事前凝集したデータを処理して、他の専用データベース326にアップロードする。専用データベース314および326は、2以上のホスト・コンピュータを含んでもよいし、そうでなくてもよい。更に、特定の数および種別のコンポーネントが図示される一方で、パイプラインは付加コンポーネント、機構、および機能を含むことができることは言うまでもない。サーバ328は、ログ・ファイル317に格納されたクライアント330,332,334,336のクライアント・データを処理し、IPマッパー338およびアップロード・コンポーネント340を使用することによって、事前凝集データを処理して専用データベース326にアップロードする。
[0058] With continued reference to FIG.
[0059] 実施形態では、データベース314および326は、オンライン・アプリケーションまたはサービスを提供するようにネットワーク化できる様々なマシンから収集されるパフォーマンス・カウンタおよび測定基準を扱うように設計される。エンド・ユーザのパフォーマンス・データが追加ピボットを持ち込む(bring in)ので、データベース・スキーマを使用して、IP、地理的位置、テナント、並びに/またはISP測定基準およびパラメータをサポートすることができる。一実施形態では、サーバ306、サーバ316、およびサーバ328は、複数のクライアントからクライアント・データを収集する。例えば、ノード・レベルでは、サーバ306は、IPマッパー310を使用してクライアント・データを5分毎に事前凝集して、クライアント・データを所定のピボットに変換するように動作することができる。変換データは、アップロード・コンポーネント316がデータベース314に伝達する。
[0059] In embodiments,
[0060] 凝集サービス342は、データベース314および326にわたり事前凝集したデータを凝集し、オンライン/アプリケーションまたはサービスに関連付けられるテナント・レベル・レイテンシ、国レベル・レイテンシ、および/またはISPレベル・レイテンシの内1つ以上を決定することができるが、これに限定されない。例えば、凝集サービス342は、エンド・ユーザ測定基準のノード・レベル・データに対してスコープ(例えばグローバルおよび/またはサイト)レベル転換(conversion)を実行するために、事前凝集データまたは変換済みデータに対して動作する。図3の例に示すように、凝集サービス342は、凝集した出力を供給している。凝集出力は、第1テナントに関連付けられる定量化クライアント・パフォーマンス・データ346、および第2テナントに関連付けられる定量化クライアント・パフォーマンス・データ348を含む。サンプル数のカウントは、定量化パフォーマンス・データの統計上の精度を改良する加重要素として使用することができる。
[0060]
[0061] 凝集サービス342は、規定した時間間隔(例えば、直近1時間のデータのスライド窓に使用するのに15分ごとに起動する、直近24時間のデータのスライド窓に使用するのに24時間毎に起動する等)で、1またはそれ以上のアップロード・コンポーネントからアップロードされた事前凝集データを凝集するように構成することができる。凝集サービス342はまた、地理的位置、テナント、地理的位置当たりのISP、地理的位置当たりのテナント、および/またはサイト・レベル当たりのスコープによって、1つ以上のドメイン・コントローラにわたり、ピボット化またはグループ化するように構成することができる。凝集サービス342は、クライアント・シナリオ・レイテンシ、およびナビゲーション時間、CDN時間、認証時間、リダイレクト時間等を定量化するための他のパフォーマンス関連の統計値を生成するように部分的に動作する。例えば、凝集サービス342は、平均75%パーセンタイル、85%パーセンタイル、95%パーセンタイル等のような統計測定/値を供給することができる。凝集サービス342はまた、10,20,30,40,50,60,70,80,90番目のパーセンタイルでのレイテンシおよび最大レイテンシのパーセンタイル値を有するレイテンシのレンジを含む動的ビン(dynamic bin)を使用することもできる。
[0061]
[0062] 障害ゾーン分析器350は、統計手段または他のレイテンシの定量化を用いて凝集データの特定のセグメントまたは特性を特定するように設計されたルールを使用するように部分的に動作する。例えば、ルールは、1つ以上の定量化手段、例えばナビゲーション時間、ロード時間、接続時間等に基づいて、異なるレベルのパフォーマンス(例えばフェア、プア、エクセレント等)を識別するように設計することができる。凝集サービス342からの出力にしたがい、ルールは凝集データに適用される。例示のルールは、各実装態様にしたがって構成可能である。例えば、ルールは、地域またはISPの全体値に基づくことができ、例えば、他のものに対し特定の測定基準または手段の検討を優先順位付けするように構成されるルールである。
[0062] The
[0063] レポート生成器352は、解決される必要がある或る特定の問題を有するテナントについて、アプリケーションまたはサービスの状態に関して特定のあらゆるリコメンデーションと共に、レポートおよび/またはフィードバック伝達のためのレポート情報を生成するように動作する。例えば、レポート生成器352は、最も高いレイテンシを有する地理的位置ごとに上位(top number)(例えば10個の)テナント、または最も高いレイテンシを有する上位テナントをリストするユーザ洞察(insight)レポートを動的に生成するように動作することができる。統合コンポーネントとして図示される一方で、障害ゾーン分析器350およびレポート生成器352は、別個のコンポーネントとして構成できることは言うまでもない。代替の実施形態では、凝集サービス342においてピボットを単独で適用することができ、またはピボットを組み合わせてサーバ306,サーバ316,および/またはサーバ328に適用することができる。
[0063] The
[0064] 実施形態のパイプライン300は、パフォーマンス・マーカを次の一部として使用する。即ち、確実にクライアント・データを収集すること、成功および失敗したシナリオの実行の分離を可能にすること、モニタリング・データ(例えば、プローブ)のフィルタ/分離を許容すること、ユーザ・エクスペリエンスと結びつくシナリオの開始および終了を正確にマーク付けること(例えば、ナビゲーション時間、ページ・ロード、ページ表示、ページの相互作用等)、および/または、詳細なドリル・ダウンを用いて補助する欠落データ(例えば、認証を完了する時間、CDNリソースをダウンロードする時間、正しいウェブ接続サーバにリダイレクトする時間等)を特定および補充することである。
[0064] The
[0065] 一実施形態のナビゲーション・タイミングは、W3Cのナビゲージョン・タイミングAPIにおいて規定される各タイムスタンプに基づいて計算される値を含む。ユーザ・エクスペリエンスに関する完全な情報の必要性に対処するために、W3Cのナビゲーション・タイミングAPIは、JAVA SCRIPT機構がアプリケーション内の全クライアント側レイテンシ測定値を供給するのを可能にするパフォーマンス・タイミング・インタフェースを導入する。当該インタフェースは、ユーザが知覚したページ・ロード時間を測定するために使用することができる。一実施形態のリソース・タイミング・マーカは、JAVA SCRIPT機構がアプリケーション内の全クライアント側レイテンシ測定値を提供するのを可能にするインタフェースを定めるW3Cのリソース・タイミングAPIにおいて規定される各タイムスタンプに基づいて計算される値である。インタフェースは、リソースについてユーザが知覚したロード時間を測定するために使用することができる。 [0065] The navigation timing of one embodiment includes a value calculated based on each time stamp defined in the W3C navigation timing API. To address the need for complete information about the user experience, W3C's navigation timing API is a performance timing interface that enables the JAVA SCRIPT mechanism to provide all client-side latency measurements within an application. Is introduced. The interface can be used to measure the page load time perceived by the user. The resource timing marker of one embodiment is based on each timestamp specified in the W3C resource timing API that defines an interface that allows the JAVA SCRIPT mechanism to provide all client-side latency measurements in the application. It is a value calculated by The interface can be used to measure the load time perceived by the user for the resource.
[0066] 次のテーブルでは、一実施形態にしたがい、例示のマーカ、マーカ計算、および関連の説明が提供される。

[0067] 他の例示のマーカは、次のものを含むことができる。
ページ・ロード時間(PLT)−認証時間を伴わないPLT時間であり、このキーは、「種別(type)」がPLTのときのみに出現する(ノー・キャッシュ、即ちブラウザ・キャッシュからのブート)
ALT−認証時間を伴わないPLT時間であり、このキーは、「種別」がALTのときのみに出現する(アプリケーション・キャッシュからのブート)
RDT−ウェブ・アクセス終了抽出セッション・データからPLTエンド・マーカまでのレンダ時間
[0067] Other exemplary markers may include:
Page load time (PLT)-PLT time without authentication time, this key only appears when the "type" is PLT (no cache, ie boot from browser cache)
ALT-PLT time without authentication time, this key only appears when "Type" is ALT (boot from application cache)
RDT-Render time from Web access end extraction session data to PLT end marker
[0071] 次の例では、クライアントの生データは、これに限定されないが、次のパラメータを含む。
リダイレクト・カウント(RC)、
リダイレクト時間(RT)、
フェッチ時間(FT)、
ドメイン参照時間(DN)、
接続時間(CT)、
安全接続時間(ST)、
要求時間(RQ)、
応答時間(RS)、
総応答時間(TR)、
Domロード時間(DL)、
総ナビゲーション時間(NV)
[0071] In the following example, the client raw data includes, but is not limited to, the following parameters:
Redirect count (RC),
Redirect time (RT),
Fetch time (FT),
Domain reference time (DN),
Connection time (CT),
Safe connection time (ST),
Request time (RQ),
Response time (RS),
Total response time (TR),
Dom load time (DL),
Total navigation time (NV)
[0083] 例示のログ・ファイル308は、クライアント302と関連付けられる、次のウェブ・アクセス・ナビゲーション・タイミングの生データを含むことができる。
例示のログ・ファイル308は、クライアント302と関連付けられる次のウェブ・アクセス・ナビゲーション・タイミングの生データを含むことができる。
20XX-01-09T00:08:12.304Z,W3CNavTimeTestBox,PerfNavTime,S:mg=<<Tenant ID>>;S:ts=20XX-01-09T00:08:03.860;
S:UC=5f8a321a877591c42b7;I32:ds=132;I32:DC=1;S:Mowa=0;S:ip=<PII>IP Address</PII>;
S:tg=D73DD084-BF81-4F05-A0D0-B8599C0444D0;S:user=<PII>Username like user1@contoso.com<PII>;
S:cbld=15.0.609.0;S:BuildType=DEBUG;
S:I=<<Server URI>>;S:FT=12;S:DN=0;S:CT=0;S:RQ=0;S:RS=10;S:UL=5;S:NV=5000;S:DL=2000;
S:D1=1078;S:D2=1760;
S:DE=5;S:PL=2;S:RC=0;S:NT=1.
[0083] The
The
20XX-01-09T00: 08: 12.304Z, W3CNavTimeTestBox, PerfNavTime, S: mg = << Tenant ID >>; S: ts = 20XX-01-09T00: 08: 03.860;
S: UC = 5f8a321a877591c42b7; I32: ds = 132; I32: DC = 1; S: Mowa = 0; S: ip = <PII> IP Address </ PII>;
S: tg = D73DD084-BF81-4F05-A0D0-B8599C0444D0; S: user = <PII> Username like user1@contoso.com <PII>;
S: cbld = 15.0.609.0; S: BuildType = DEBUG;
S: I = << Server URI >>; S: FT = 12; S: DN = 0; S: CT = 0; S: RQ = 0; S: RS = 10; S: UL = 5; S: NV = 5000; S: DL = 2000;
S: D1 = 1078; S: D2 = 1760;
S: DE = 5; S: PL = 2; S: RC = 0; S: NT = 1.
[0091] また、クライアント304と関連付けられるナビゲーション・タイミングの生データは次のとおりである。
20XX-01-09T00:08:12.304Z,W3CNavTimeTestBox,PerfNavTime,S:mg=<<Tenant ID>>;S:ts=20XX-01-09T00:08:04.860;S:UC=f8a321a877591c42b7;I32:ds=132;I32:DC=l;S:Mowa=0;S:ip=<PII>IP Address</PII>;
S:tg=D73DD084-BF81-4F05-A0D0-B8599C0444D0;S:user=<PII> Username like user1@contoso.com</PII>;
S:cbld=15.0.609.0;S:BuildType=DEBUG;
S:URI=<<Server URI>>;S:FT=20;S:DN=1;S:CT=10;S:RQ=10;S:RS=10;S:UL=15;S:NV=6000;S:DL=4000;
S:D1=2156;S:D2=3000;
S:DE=10;S:PL=3;S:RC=2;S:NT=1.
Further, the raw data of the navigation timing associated with the client 304 is as follows.
20XX-01-09T00: 08: 12.304Z, W3CNavTimeTestBox, PerfNavTime, S: mg = << Tenant ID >>; S: ts = 20XX-01-09T00: 08: 04.860; S: UC = f8a321a877591c42b7; I32: ds = 132; I32: DC = l; S: Mowa = 0; S: ip = <PII> IP Address </ PII>;
S: tg = D73DD084-BF81-4F05-A0D0-B8599C0444D0; S: user = <PII> Username like user1@contoso.com </ PII>;
S: cbld = 15.0.609.0; S: BuildType = DEBUG;
S: URI = << Server URI >>; S: FT = 20; S: DN = 1; S: CT = 10; S: RQ = 10; S: RS = 10; S: UL = 15; S: NV = 6000; S: DL = 4000;
S: D1 = 2156; S: D2 = 3000;
S: DE = 10; S: PL = 3; S: RC = 2; S: NT = 1.
[0098] クライアント302と関連付けられる例示のロード・タイミングの生データは次のとおりである。
20XX-05-0T08:02: 12.304Z,ClientLoadTimeTestBox,CalculatedClientLoadTime,
S:ts=20XX-05-30T08:02: 16.20XX727Z;S:UC=411e478fdfef403c9a28clc3ffaa0317;
S:ip=<PII>IP Address</PII>;S:tg=la3ba9c6-00d3-4c2e-9862-f08a05a11f1f;
S:PLT=7000;S:RDT=4000;S:RT=18;S:DN=0;S:CT=0;S:RQ=1188;S:RS=2;S:SDN=0;S:SCT=10;S:SRQ=1800;
S:SRS=300;S:R1DN=0;S:R1CT=200;S:R1ST=100;S:R1RQ=50;S:R1RS=10;S:R2DN=0;S:R2CT=8;S:R2ST=0;
S:R2RQ=50;S:R2RS=200;S:brn=MSIE;S:brv=10;
[0098] The raw data for an exemplary load timing associated with the
20XX-05-0T08: 02: 12.304Z, ClientLoadTimeTestBox, CalculatedClientLoadTime,
S: ts = 20XX-05-30T08: 02: 16.20XX727Z; S: UC = 411e478fdfef403c9a28clc3ffaa0317;
S: ip = <PII> IP Address </ PII>; S: tg = la3ba9c6-00d3-4c2e-9862-f08a05a11f1f;
S: PLT = 7000; S: RDT = 4000; S: RT = 18; S: DN = 0; S: CT = 0; S: RQ = 1188; S: RS = 2; S: SDN = 0; S: SCT = 10; S: SRQ = 1800;
S: SRS = 300; S: R1DN = 0; S: R1CT = 200; S: R1ST = 100; S: R1RQ = 50; S: R1RS = 10; S: R2DN = 0; S: R2CT = 8; S: R2ST = 0;
S: R2RQ = 50; S: R2RS = 200; S: brn = MSIE; S: brv = 10;
[00105] また、クライアント304と関連付けられるロード・タイミングの生データは次のとおりである。
20XX-05-30T08:02:12.304Z,ClientLoadTimeTestBox,CalculatedClientLoadTime,
S:ts=20XX-05-30T08:03:16.20XX727Z;S:UC=412e478fdfef403c9a28c1c3ffaa0317;
S:ip=<PII>IP Address</PII>;S:tg=1a3ba9c6-00d3-4c2e-9862-f08a05a11f1f;S:PLT=8000;S:RT=18;S:DN=0;S:CT=0;S:RQ=1188;S:RS=2;S:SDN=100;S:SCT=50;S:SRQ=1600;
S:SRS=400;S:R1DN=0;S:R1CT=600;S:R1ST=300;S:R1RQ=90;S:R1RS=50;S:R2DN=0;S:R2CT=16;S:R2ST=0;
S:R2RQ=0;S:R2RS=400;S:brn=Chrome;S:brv=27.
[00105] The raw data of the load timing associated with the client 304 is as follows.
20XX-05-30T08: 02: 12.304Z, ClientLoadTimeTestBox, CalculatedClientLoadTime,
S: ts = 20XX-05-30T08: 03: 16.20XX727Z; S: UC = 412e478fdfef403c9a28c1c3ffaa0317;
S: ip = <PII> IP Address </ PII>; S: tg = 1a3ba9c6-00d3-4c2e-9862-f08a05a11f1f; S: PLT = 8000; S: RT = 18; S: DN = 0; S: CT = 0; S: RQ = 1188; S: RS = 2; S: SDN = 100; S: SCT = 50; S: SRQ = 1600;
S: SRS = 400; S: R1DN = 0; S: R1CT = 600; S: R1ST = 300; S: R1RQ = 90; S: R1RS = 50; S: R2DN = 0; S: R2CT = 16; S: R2ST = 0;
S: R2RQ = 0; S: R2RS = 400; S: brn = Chrome; S: brv = 27.
[00111] 例示のクライアント・データを用いると、次のテーブルは、テナント単位および国単位での、ユーザ・パフォーマンス・データを凝集する凝集サービス342からの例示の出力を示す。
[00112] 図4は、実施形態に従って、パフォーマンス診断分析および/または問題改善サービスの提供の一部として使用される例示のエンド・ツー・エンドのプロセス400の動作を示すフロー図である。プロセス400は402で、エンド・ユーザのデバイス/システム上で実行するクライアントを使用して、パフォーマンス・データを収集するように動作する。例えば、402で、ブラウザまたは他のアプリケーションおよびスクリプト・コード(例えば、JAVASCRIPT(登録商標)コード)のようなクライアントは、クライアント中心のパフォーマンス・データを収集し、および/または、パフォーマンス診断分析サービスを、オンライン・サービスまたはアプリケーションの使用に関連付けられる1つ以上のサーバ・コンピュータから要求する。一実施形態のプロセス400は402で、オンライン・サービスまたはアプリケーションに関連付けられるエンド・ユーザ・エクスペリエンスを評価することの一部として、ナビゲーション・タイミング、ページ・ロード・タイミング、および/またはレイテンシを示す他のパラメータ若しくは他のパフォーマンス問題を含んだ生のパフォーマンス・データを収集するように動作する。
[00112] FIG. 4 is a flow diagram illustrating the operation of an exemplary end-to-
[00113] プロセス400は404で、専用サーバ・コンピュータのログ・ファイルに、生のパフォーマンス・データを供給するように動作する。例えば、プロセス400は404で、ユーザ・デバイス/システム上で実行するブラウザの使用を含み、クライアントIPアドレスおよび収集したパフォーマンス・データまたは或る部分を1つ以上のログ・ファイルにアップロードすることができる。プロセス400は406で、クライアントIPアドレスと、地理的位置(例えば、国/州)、ISPおよび/またはテナントGUIDを含むマッピング・ターゲットとを使用して、ログ付けしたパフォーマンス・データを変換またはマップするように動作する。例えば、プロセス400は406で、ログ付けしたクライアント・データを複数のマッピング・テーブルにマップするように構成することができる。複数のマッピング・テーブルは、ログ付けしたクライアント・データについてマップした地理的位置に対しIPアドレスを規定する第1マッピング・テーブル、およびログ付けしたクライアント・データについてマップしたISPに対しIPアドレスを規定する第2マッピング・テーブルを含む。
[00113] The
[00114] プロセス400は408で、テナントGUID、地理的位置および/またはISPの内1つ以上によってグループ化された変換済みデータを1つ以上の診断サービス・データベースにアップロードするように動作する。プロセス400は410で、オンライン・サービスまたはアプリケーションについてのレイテンシおよび/または凝集に関連する他のパフォーマンスを生成するために、1つ以上のデータベースにわたり凝集動作を実行するように動作する。一実施形態では、プロセス400は410で、テナント・レベル、地理的位置レベル、および/またはISPレベルのレイテンシの内1つ以上を決定するように凝集動作を実行する。
[00114] The
[00115] プロセス400は412で、障害ゾーン分析を実行するために、凝集データに対して1つ以上のルールを使用し、1つ以上の障害ゾーンまたは潜在的障害ゾーンを特定する。例えば、プロセス400は412で、ユーザ・エクスペリエンスがプア、サティスファクトリまたはエクセレントであるかを、全ての国および/若しくはISPにわたる傾向またはベースラインの比較に部分的に基づいて検査するように構成されたルールを使用することができる。プロセス400は414で、如何なる矯正または軽減行為の実施の一部として、障害ゾーン情報を使用するように動作する。例えば、プロセス400は414で、レイテンシまたは他のパフォーマンス関連の問題を低減させることの一部として、潜在的なネットワークおよび/または通信アーキテクチャの修正を特定するオンライン・レポートを生成する障害ゾーン分析情報を使用することができる。特定の数および順序の動作について図4の例示のフローで説明した一方で、他の数、組み合わせおよび/または順序を所望の実装態様に従って使用できることは言うまでもない。
[00115] The
[00116] 例えば、プロセス400は、オンライン電子メール・サービスにおいて異なるネットワークの測定基準をビューするのを許容する電子レポートを生成するように部分的に使用することができる。その結果、第1位置のユーザが、関連する地域の他の国と比較して、CDNにおいてより長時間を費やしていることを特定することができる。レビュアは、次いで、第1位置のCDNプロバイダを追跡調査して問題を解決することができる。加えて、問題を通知および解決するようにコンタクトされる、より大規模ISPの1つのレイテンシ増加を通知する準備をISPが可能にすることによって、第1位置についての地理的ISPレポートのレビューがレイテンシの相違を明らかにする。
[00116] For example, the
[00117] 更に他の例として、エッジ・サーバ配備の一部として、プロセス400は、最大ダウンロード時間を有する特定地域のユーザを識別するために、地域単位のダウンロード時間を含む電子レポートを生成するように使用することができる。その結果、ユーザ・ネットワークの影響を低減させる新規のエッジ・サーバを配備させることができる。更新された報告は、特定地域のレイテンシの低減を明らかにする。特定したレイテンシを低減させる他の例として、プロセス400は、特定のテナントによって、傾向ビューを表示し、TCP接続時間が500ミリ秒増加したのと同様に、レイテンシの増加が直近数日に発生したことを判断するのを可能にする電子レポートを生成することができる。レポートに基づいて、影響を受けたテナントはコンタクトされて、他の位置とのISPピアリングによって問題を特定することができる。
[00117] As yet another example, as part of an edge server deployment, the
[00118] 本明細書で説明した様々な機構は、ハードウェアおよびソフトウェア・コンポーネントを含むプロセッサ駆動環境の一部として実装できることは言うまでもない。また、特定の実施形態および例を例示目的で上述した一方で、他の実施形態が含まれ利用可能であり、そして、説明する実施形態は特許請求の範囲に限定して使用されてはならないものである。好適なプログラム手段は、コンピュータ・システムまたはデバイスにプロセスまたは方法のステップを実行させる如何なる手段を含み、例えば、コンピュータ・メモリに結合される処理ユニットおよび論理演算回路を具備するシステムを含む。当該システムはコンピュータ・メモリに格納する機能を有し、当該コンピュータ・メモリはデータおよびプログラム命令またはコードを格納するように構成される電子回路を含む。 [00118] It will be appreciated that the various mechanisms described herein may be implemented as part of a processor-driven environment that includes hardware and software components. Also, while specific embodiments and examples have been described above for purposes of illustration, other embodiments are included and can be used, and the described embodiments should not be limited to the claims. It is. Suitable program means include any means for causing a computer system or device to perform a process or method step, for example, a system comprising a processing unit and logic circuitry coupled to a computer memory. The system has the functionality of storing in a computer memory, the computer memory including electronic circuitry configured to store data and program instructions or code.
[00119] 製造物品の例には、如何なる好適な処理システムでも使用可能なコンピュータ・プログラム製品が含まれる。一定数および一定種別のコンポーネントを上述した一方で、様々な実施形態により、他の数、種別、および/または構成を含めることができる。したがって、所望の実装態様により、コンポーネント機能を更に分割することができ、および/または他のコンポーネント機能と組み合わせることができる。本明細書において用いられる場合、コンピュータ可読媒体という用語は、コンピュータ記憶媒体またはコンピュータ記憶装置を含むことができる。実施形態のコンピュータ記憶装置は、幾らかの機能を実行するように動作するプログラム・コードまたは命令を格納する。コンピュータ記憶媒体は、情報(例えば、コンピュータ可読命令、データ構造、プログラム・モジュール等)の記憶のために如何なる方法または技術で実装される、揮発性および不揮発性、並びに着脱可能および着脱不能の媒体を含むことができる。 [00119] Examples of articles of manufacture include computer program products that can be used with any suitable processing system. While a certain number and type of components are described above, other numbers, types, and / or configurations may be included according to various embodiments. Thus, depending on the desired implementation, the component functions can be further divided and / or combined with other component functions. As used herein, the term computer readable media may include computer storage media or computer storage devices. The computer storage device of the embodiment stores program code or instructions that operate to perform some functions. Computer storage media includes volatile and non-volatile, removable and non-removable media implemented in any manner or technique for storing information (eg, computer-readable instructions, data structures, program modules, etc.). Can be included.
[00120] システム・メモリ、リムーバブル記憶装置、および非リムーバブル記憶装置は全て、コンピュータ記憶媒体の例である(即ち、メモリ・ストレージ)。コンピュータ記憶媒体は、RAM、ROM、電気的消去可能リード・オンリ・メモリ(「EEPROM」)、フラッシュ・メモリまたは他のメモリ技術、CD−ROM、ディジタル・バーサタイル・ディスク(「DVD」)、あるいは他の光ストレージ、磁気カセット、磁気テープ、磁気ディスク・ストレージまたは他の磁気記憶デバイス、あるいは情報を格納するために使用することができ、コンピューティング・デバイスによってアクセスすることができる他のあらゆる媒体を含むが、これらに限定されない。このようなコンピュータ記憶媒体はいずれも、デバイスまたはシステムの一部とすることができる。例えば、通信媒体は、有線ネットワークまたは直接有線接続のような有線媒体と、音響、RF、赤外線その他のワイヤレス媒体のようなワイヤレス媒体とを含むことができるが、これらに限定されない。 [00120] System memory, removable storage devices, and non-removable storage devices are all examples of computer storage media (ie, memory storage). Computer storage media can be RAM, ROM, electrically erasable read only memory (“EEPROM”), flash memory or other memory technology, CD-ROM, digital versatile disk (“DVD”), or others Including any optical storage, magnetic cassette, magnetic tape, magnetic disk storage or other magnetic storage device, or any other medium that can be used to store and be accessed by a computing device However, it is not limited to these. Any such computer storage media may be part of a device or system. For example, communication media can include, but is not limited to, wired media such as a wired network or direct wired connection and wireless media such as acoustic, RF, infrared and other wireless media.
[00121] 本明細書に説明する実施形態および例は限定を意図するものではなく、他の実施形態が使用可能である。更に、上述したコンポーネントは、ネットワーク化され、分散され、および/または他のコンピュータ実装された環境の一部として実装することができる。コンポーネントは、有線、無線および/または通信ネットワークの組み合わせを介して通信することができる。ネットワーク・コンポーネントおよび/またはコンポーネント間の結合は、如何なる種別、数および/またはネットワークの組み合わせ、並びに対応のネットワーク・コンポーネントを含むことができる。当該対応のネットワーク・コンポーネントは、ワイド・エリア・ネットワーク(WAN)、ローカル・エリア・ネットワーク(LAN)、メトロポリタン・エリア・ネットワーク(MAN)、私有ネットワーク、バックエンド・ネットワーク、セルラ・ネットワーク等を含むが、これらに限定されない。 [00121] The embodiments and examples described herein are not intended to be limiting and other embodiments may be used. Moreover, the components described above can be implemented as part of a networked, distributed, and / or other computer-implemented environment. The components can communicate via a combination of wired, wireless and / or communication networks. Network components and / or combinations between components can include any type, number and / or combination of networks and corresponding network components. Such supported network components include wide area networks (WAN), local area networks (LAN), metropolitan area networks (MAN), private networks, backend networks, cellular networks, etc. However, it is not limited to these.
[00122] クライアント・コンピューティング・デバイス/システムおよびサーバは、如何なる種別および/または組み合わせのプロセッサ・ベースのデバイスまたはシステムとすることができる。また、サーバ機能は、多くのコンポーネントを含むことができ、また、他のサーバを含むことができる。単一の時制(tense)で説明したコンピューティング環境におけるコンポーネントは、このようなコンポーネントの複数のインスタンスを含むことができる。特定の実施形態がソフトウェアによる実装を含む一方で、ハードウェアまたはハードウェア/ソフトウェア混合の解決策を含むが、これらに限定されない。 [00122] The client computing device / system and server may be any type and / or combination of processor-based devices or systems. A server function can also include many components and can include other servers. A component in a computing environment described in a single tense can include multiple instances of such a component. While certain embodiments include software implementations, including but not limited to hardware or mixed hardware / software solutions.
[00123] コンポーネント、モジュール、システム、デバイス、クラウド、ネットワークおよび他の用語のような、説明で用いた用語は、全般的にコンピュータ関連の動作環境について説明するものであり、ハードウェア、ソフトウェア、ファームウェア、および/または他のアイテムを含む。コンポーネントは、プロセッサを使用したプロセス、実行可能および/または他のコードを用いることができる。例示のコンポーネントには、アプリケーション、該アプリケーション上で起動するサーバ、および/または、通信アイテムを受信するためにサーバに結合される電子通信クライアントが含まれる。例えば、コンピュータ・リソースは、デジタル信号プロセッサ、マイクロ・プロセッサ、マルチコア・プロセッサ等のプロセッサおよびメモリ・リソース、並びに、磁気、光学および/または他の記憶デバイス、スマート・メモリ、フラッシュ・メモリ等のメモリ・コンポーネントを含むことができる。通信コンポーネントは、例えばインターネットのような1または複数の通信ネットワークを用いて電子通信アイテムを送信、受信および/またはレンダリングすることの一部としてコンピュータ可読情報を通信するように使用することができる。他の実施形態および構成が含まれる。 [00123] Terms used in the description, such as components, modules, systems, devices, clouds, networks, and other terms, generally describe a computer-related operating environment and include hardware, software, firmware , And / or other items. A component may employ a process using a processor, executable and / or other code. Exemplary components include an application, a server running on the application, and / or an electronic communication client coupled to the server to receive communication items. For example, computer resources include processor and memory resources such as digital signal processors, micro processors, multi-core processors, and memory resources such as magnetic, optical and / or other storage devices, smart memory, flash memory, etc. Components can be included. The communication component can be used to communicate computer readable information as part of sending, receiving and / or rendering an electronic communication item using one or more communication networks such as, for example, the Internet. Other embodiments and configurations are included.
[00124] これより図5を参照する。以下は、実施形態を実現することができる好適なコンピューティング環境についての簡潔で包括的な説明を行う。様々な種別のコンピューティング・デバイス/システム上のオペレーティング・システムで起動するプログラム・モジュールと連動して実行するプログラム・モジュールの包括的なコンテキストで説明される一方で、当業者は、本発明がまた、他の種別のコンピューティング・デバイス/システムおよびプログラム・モジュールと組み合わせて実装されてもよいことを認識するであろう。 [00124] Reference is now made to FIG. The following provides a brief and comprehensive description of a suitable computing environment in which embodiments may be implemented. While described in the generic context of program modules executing in conjunction with program modules running on operating systems on various types of computing devices / systems, those skilled in the art will also recognize that the present invention It will be appreciated that it may be implemented in combination with other types of computing devices / systems and program modules.
[00125] 一般に、プログラム・モジュールは、ルーチン、プログラム、コンポーネント、データ構造、および他のタイプの構造を含み、これらは特定のタスクを実行するか、または特定の抽象データ型を実装する。他のコンピュータ・システム構成も使用することができ、ハンドヘルド・デバイス、マルチプロセッサ・システム、マイクロプロセッサ・ベースまたはプログラマブル・コンシューマ・エレクトロニクス、ミニコンピュータ、メインフレーム・コンピュータ等が含まれることが当業者は認識するであろう。本発明はまた、分散型コンピューティング環境も使用することができ、その場合、通信ネットワークを通じてリンクされるリモート処理デバイスによってタスクが実行される。分散型計算環境では、プログラム・モジュールは、ローカルおよびリモート双方のメモリ記憶デバイス内に配置されてもよい。 [00125] Generally, program modules include routines, programs, components, data structures, and other types of structures that perform particular tasks or implement particular abstract data types. Those skilled in the art will recognize that other computer system configurations can be used and include handheld devices, multiprocessor systems, microprocessor-based or programmable consumer electronics, minicomputers, mainframe computers, and the like. Will do. The invention may also use a distributed computing environment in which tasks are performed by remote processing devices that are linked through a communications network. In a distributed computing environment, program modules may be located in both local and remote memory storage devices.
[00126] 図5に示されるように、コンピュータ2は、汎用サーバ、デスクトップ、ラップトップ、ハンドヘルド、または、電子メール・アプリケーション若しくは電子メール機能を含む他のアプリケーションを含んだ1つ以上のアプリケーション・プログラムを実行することができる他の種別のコンピュータを含む。コンピュータ2は、少なくとも、中央処理ユニット8(「CPU」)、ランダム・アクセス・メモリ18(「RAM」)およびリード・オンリ・メモリ(「ROM」)20を含むシステム・メモリ7、並びにメモリをCPU8に結合するシステム・バス10を含む。スタートアップ中のように、コンピュータ内部にあるエレメント間で情報を転送するのに役立つ基本的ルーチンを収容する基本入力/出力システムが、ROM20に格納される。更に、コンピュータ2は、オペレーティング・システム24、アプリケーション・プログラム、および他のプログラム・モジュール/リソース26格納する大容量記憶デバイス14も含む。
[00126] As shown in FIG. 5, the computer 2 may be a general purpose server, desktop, laptop, handheld, or one or more application programs that include an email application or other application that includes email functionality. Including other types of computers that can execute. The computer 2 includes at least a central processing unit 8 (“CPU”), a system memory 7 including a random access memory 18 (“RAM”) and a read only memory (“ROM”) 20, and a memory for the CPU 8. Includes a system bus 10 coupled to Stored in ROM 20 is a basic input / output system that contains the basic routines that help to transfer information between elements within the computer, such as during startup. In addition, the computer 2 also includes a mass storage device 14 that stores an operating system 24, application programs, and other program modules /
[00127] 大容量記憶デバイス14は、バス10に接続された大容量記憶コントローラ(図示せず)を通じてCPU8に接続される。大容量記憶デバイス14およびそれに付随するコンピュータ可読媒体は、コンピュータ2に不揮発性ストレージを設ける。本明細書に含まれるコンピュータ可読媒体の説明は、ハード・ディスクまたはCD−ROMドライブのような大容量記憶デバイスに言及するが、コンピュータ可読媒体は、コンピュータ2によってアクセスされ利用されることができる入手可能な媒体であればいずれでも可能であることが当業者にとって認められるべきである。 The mass storage device 14 is connected to the CPU 8 through a mass storage controller (not shown) connected to the bus 10. The mass storage device 14 and the computer readable media associated therewith provide the computer 2 with non-volatile storage. Although the description of the computer readable medium contained herein refers to a mass storage device such as a hard disk or CD-ROM drive, the computer readable medium can be accessed and utilized by the computer 2 It should be appreciated by those skilled in the art that any possible medium is possible.
[00128] 種々の実施形態によれば、コンピュータ2は、例えばローカル・ネットワークやインターネット等のようなネットワーク4を介したリモート・コンピュータへの論理接続を用いて、ネットワーク接続環境において動作することもできる。コンピュータ2は、バス10に接続されたネットワーク・インターフェース・ユニット16を介してネットワーク4に接続することができる。なお、ネットワーク・インターフェース・ユニット16は、他の種別のネットワークおよびリモート・コンピューター・システムに接続するために利用することもできることは言うまでもない。また、コンピュータ2は、キーボードやマウス等(図示せず)を多数の他のデバイスからの入力を受けて受信および処理するために入力/出力コントローラ22も含むことができる。同様に、入力/出力コントローラ22は、出力を、表示画面、プリンタまたは他の種別の出力デバイスに供給することができる。
[00128] According to various embodiments, the computer 2 can also operate in a network connection environment using a logical connection to a remote computer via a network 4, such as a local network or the Internet. . The computer 2 can be connected to the network 4 via the
[00129] 端的に上述したように、多数のプログラム・モジュールおよびデータ・ファイルを、コンピュータ2の大容量記憶デバイス14およびRAM18に格納することができる。その中には、ワシントン州RedmondのMICROSOFT CORPORATION(マイクロソフト社)からのWINDOWS(登録商標)オペレーティング・システムのような、ネットワーク化したパーソナル・コンピュータの動作を制御するのに適したオペレーティング・システム24が含まれる。大容量記憶デバイス14およびRAM18はまた、1つ以上のプログラム・モジュールも格納することもできる。特に、大容量記憶デバイス14およびRAM9は、文書処理、スプレッドシート、描画、電子メールや他のアプリケーションおよび/またはプログラム・モジュールのようなアプリケーション・プログラム24を格納することができる。
[00129] As described briefly above, a number of program modules and data files can be stored in the mass storage device 14 and
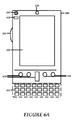
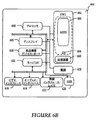
[00130] 図6Aおよび図6Bは、例えば、移動体電話、スマート・フォン、タブレット・パーソナル・コンピュータ、ラップトップ・コンピュータ等のモバイル・コンピューティング環境を示し、実施形態を実施することができる。図6Aを参照すると、実施形態を実施するための一実施形態のモバイル・コンピューティング・デバイス600が示される。基本構成において、モバイル・コンピューティング・デバイス600は、入力要素および出力要素の両方を有するハンドヘルド・コンピューターである。
[00130] FIGS. 6A and 6B illustrate mobile computing environments such as mobile phones, smart phones, tablet personal computers, laptop computers, and the like, and embodiments may be implemented. With reference to FIG. 6A, an embodiment of a
[00131] モバイル・コンピューティング・デバイス600は、ディスプレイ605、および、ユーザがモバイル・コンピューティング・デバイス600に情報を入力可能とする1つ以上の入力ボタン610を含む。モバイル・コンピューティング・デバイス600のディスプレイ605はまた、入力デバイス(例えば、タッチ・スクリーン・ディスプレイ)としても機能することができる。含まれる場合は、任意のサイド入力要素615が更なるユーザ入力を可能にする。任意のサイド入力要素615は、回転スイッチ、ボタンまたは他の如何なる種別の手入力要素とすることができる。代替の実施形態では、モバイル・コンピューティング・デバイス650は、多少の入力要素を組み込むことができる。例えば、ディスプレイ605は、幾らかの実施形態ではタッチ・スクリーンとしなくてもよい。更に他の代替の実施形態では、モバイル・コンピューティング・デバイス600は、セルラ・フォンのようなポータブル電話システムである。
[00131] The
[00132] モバイル・コンピューティング・デバイス600はまた、任意のキーパッド635を含むこともできる。任意のキーパッド635は、タッチ・スクリーン・ディスプレイ上に作られる物理的なキーパッドまたは「ソフト」キーパッドとすることができる。様々な実施形態では、出力要素はディスプレイ605を含み、グラフィカル・ユーザ・インターフェース(GUI)、視覚インジケータ620(例えば、発光ダイオード)、および/またはオーディオ変換器625(例えば、スピーカ)を示す。実施形態の中には、モバイル・コンピューティング・デバイス600は振動変換器を組み込み、ユーザに触覚のフィードバックを提供するものもある。更なる他の実施形態では、モバイル・コンピューティング・デバイス600は、信号を外部デバイスとの間で送受信するために、例えばオーディオ入力(例えばマイクロフォン・ジャック)やオーディオ出力(例えば、HDMI(登録商標)ポート)のような入力および/または出力ポートを組み込む。
[00132] The
[00133] 図6Bは、モバイル・コンピューティング・デバイスの一実施形態のアーキテクチャを示すブロック図である。即ち、モバイル・コンピューティング・デバイス600は、幾らかの実施形態を実装するためにシステム(即ち、アーキテクチャ)602を組み込むことができる。一実施形態では、システム602は、1つ以上のアプリケーション(例えば、ブラウザ、電子メール、カレンダ、コンタクト・マネージャ、メッセージング・クライアント、ゲーム、およびメディア・クライアント/プレイヤ)を起動することができる「スマート・フォン」として実施される。実施形態の中には、システム602は、統合パーソナル・デジタル・アシスタント(PDA)および無線電話機のようなコンピューティング・デバイスとして統合される。
[00133] FIG. 6B is a block diagram illustrating the architecture of one embodiment of a mobile computing device. That is, the
[00134] 1つ以上のアプリケーション・プログラム666は、メモリ662にロードすることができ、オペレーティング・システム664上で、またはこれに連携して起動することができる。アプリケーション・プログラムの例には、発呼(phone dialer)プログラム、電子メール・プログラム、個人情報管理(PIM)プログラム、文書処理プログラム、スプレッドシート・プログラム、インターネット・ブラウザ・プログラム、メッセージング・プログラム等を含む。システム602はまたメモリ662内に不揮発性記憶領域668も含む。不揮発性記憶領域668は、システム602の電源を落としても失ってはならない永続情報を格納するために使用することができる。
[00134] One or
[00135] アプリケーション666は、電子メール・アプリケーションによって用いられる電子メールまたは他のメッセージ等というような情報を用いて、不揮発性記憶領域668に格納することができる。また、同期アプリケーション(図示せず)もシステム602上に存在し、不揮発性記憶領域668に格納された情報を、ホスト・コンピュータに格納された対応する情報との同期を維持するために、ホスト・コンピュータ上に存在する対応の同期アプリケーションと相互作用するようにプログラミングされる。認められて然るべきであるが、他のアプリケーションがまた、メモリ662にロードされ、モバイル・コンピューティング・デバイス600上で起動することができる。
[00135] The
[00136] システム602は、電源670を有し、これは1つ以上のバッテリとして実装することができる。電源670は更に、ACアダプタ、またはバッテリを補助または再充電する充電ドッキング・クレードルというような外部電源を含んでもよい。また、システム602は、無線周波数通信を送受信する機能を実行する無線機672も含むことができる。無線機672は、システム602と「外部世界」との間における、通信キャリアまたはサービス・プロバイダを解したワイヤレス接続を容易にする。無線機672への送信および無線機1372からの送信は、オペレーティング・システム664の制御下で行われる。言い換えると、無線機672によって受信した通信は、オペレーティング・システム664を介してアプリケーション・プログラム666に伝搬することができ、そしてその逆もまた可能である。
[00136] The
[00137] 視覚インジケータ620は、視覚的通知を与えるために用いることができ、またオーディオ変換器674は、オーディオ変換器625を解して聴覚的通知を生成するために用いることができる。図示される実施形態では、視覚インジケータ620は発光ダイオード(LED)であり、オーディオ変換器625はスピーカである。これらのデバイスは、電源670に直接結合することができ、アクティブ化されているときに、プロセッサ660および他のコンポーネントがバッテリ電力を保存するために停止していても、これらは通知メカニズムによって指令される期間の間オンのままとすることができる。LEDは、ユーザが行動を起こすまで、不定期にオンのままとして、デバイスに電源が入っている状態を示すようにプログラミングされるのでもよい。
[00137] The
[00138] オーディオ・インターフェース674は、可聴信号をユーザに供給し、可聴信号をユーザから受けるために用いられる。例えば、オーディオ変換器625に結合されることに加えて、オーディオ・インターフェース674は、例えば電話での会話を容易にするために、可聴入力を受けるためにマイクロフォンに結合されてもよい。実施形態によれば、マイクロフォンはまた、次に説明するように、通知の制御を容易にするためのオーディオ・センサとしての役割を果たすこともできる。更に、システム602はビデオ・インタフェース1376も含むことができ、静止イメージやビデオ・ストリーム等を記録するために、内蔵カメラ630の動作を可能にする。システム602を実施するモバイル・コンピューティング・デバイスは、付加的な機構または機能も有することができる。例えば、モバイル・コンピューティング・デバイス600はまた、例えば磁気ディスク、光ディスクまたはテープのような付加的なデータ記憶デバイス(リムーバブルおよび/または非リムーバブル)も含むことができる。このような追加のストレージは、図6Bにおいて不揮発性記憶領域668によって示される。
[00138] The
[00139] デバイス600によって生成されまたは取り込まれ、また、システム602によって格納されたデータ/情報は、前述のように、モバイル・コンピューティング・デバイス600条にローカルに格納することができる。あるいは、無線機672を介して、または、モバイル・コンピューティング・デバイス600と該モバイル・コンピューティング・デバイス600に関連付けられた別個のコンピューティング・デバイス、例えば、インターネットのような分散型コンピューティング・ネットワークにおけるサーバ・コンピュータとの間における有線接続を介して、アクセスすることができるあらゆる数の記憶媒体上にデータを格納することができる。認められてしかるべきであるが、このようなデータ/情報は、モバイル・コンピューティング・デバイス600を介して、無線機1372を介して、または分散型コンピューティング・ネットワーク120を介してアクセスすることができる。同様に、このようなデータ/情報は、電子メールおよび連携データ/情報共有システムを含む、公知のデータ/情報の転送および記憶手段にしたがって、格納および使用のために容易にコンピューティング・デバイス間で転送することができる。
[00139] Data / information generated or captured by the
[00140] 図7は、レイテンシの特定および改善の機構を実施するシステム・アーキテクチャについての一実施形態である。データを処理する情報は、異なる通信チャネルまたは他のタイプのストレージに格納することができる。例えば、種々の情報は、ディレクトリ・サービス722、ウェブ・ポータル724、メールボックス・サービス726、インスタント・メッセージング・ストア728、およびソーシャル・ネットワーキング・サイト730を用いて格納/アクセスすることができる。サーバ720は、付加的なレイテンシ分析および他の機構を提供することができる。一例として、サーバ720は、例えばインターネットまたは他のネットワーク(1または複数)のようなネットワーク715を通じた多数のデータセンタ・パーティションを用いて、アウトバンドの電子メールを配信するのに使用されるルールを提供する。例えば、クライアント・コンピューティング・デバイスは、汎用コンピューティング・デバイス702として実装することができ、また、パーソナル・コンピュータ、タブレット・コンピューティング・デバイス704、および/またはモバイル・コンピューティング・デバイス706(例えばスマート・フォン)に組み込むことができる。これらのデバイスはいずれも、ストア716からのコンテンツを用いることができる。
[00140] FIG. 7 is an embodiment of a system architecture that implements a latency identification and improvement mechanism. The information processing data can be stored in different communication channels or other types of storage. For example, various information may be stored / accessed using a directory service 722, a
[00141] 本発明の実施形態は、例えば、方法、システム、およびコンピュータ・プログラム製品等においてブロック図および/または動作図を参照して先に説明されるものである。ブロックに記される機能/動作(act)は、いずれのフロー・チャートに示される順序外でも行うことができる。例えば、連続して示される2つのブロックは、実際には、実質的に同時に実行されてもよく、または関与する機能/動作に応じて、ブロックが逆の順序で実行されてもよいことも時折ある。 [00141] Embodiments of the invention are described above with reference to block diagrams and / or operational diagrams, for example, in methods, systems, and computer program products. The function / act described in the block can be performed out of the order shown in any flow chart. For example, two blocks shown in succession may actually be executed substantially simultaneously, or sometimes the blocks may be executed in reverse order, depending on the function / operation involved. is there.
[00142] 本出願で提供される1つ以上の実施形態に関する説明および図示は、如何なるやり方でも特許請求する発明の範囲を制限または限定することを意図するものではない。本出願で提供される実施形態、例示および詳細は、所有物を伝え、他の者が特許請求する発明のベスト・モードを作成および使用できるのに十分なものとみなされる。特許請求する発明は、本出願にて提供された如何なる実施形態、例または詳細に限定されるものと解釈してはならない。組み合わせてまたは別個に図示し説明したかに拘わらず、様々な(構造および方法上の両方の)機構は、特定の機構のセットを用いて実施形態を生み出すために、選択的に含まれ、または除外することが意図される。本出願の説明および図示を提供してきたが、当業者は、特許請求されるより広い範囲から逸脱することなく、本出願で実施される包括的で創意に富んだ概念(inventive concept)におけるより広い範囲の趣旨内に収まる、変形物、修正態様、および代替の実施形態を構想することができる。 [00142] The description and illustration of one or more embodiments provided in this application is not intended to limit or limit the scope of the claimed invention in any way. The embodiments, illustrations and details provided in this application are deemed sufficient to convey property and allow others to make and use the best mode of the claimed invention. The claimed invention should not be construed as limited to any embodiment, example, or detail provided in this application. Various (both structural and methodological) features, whether combined or separately illustrated and described, are optionally included to produce an embodiment with a particular set of features, or It is intended to be excluded. Although provided with the description and illustration of this application, those skilled in the art will be able to broaden the comprehensive and inventive concept implemented in this application without departing from the broader scope claimed. Variations, modifications, and alternative embodiments can be envisioned that fall within the scope of the scope.
[00143] 様々な実施形態は、(1)コンピューティング・システム上で起動する一連のコンピュータ実装行為若しくはプログラム・モジュールとして、および/または(2)コンピューティング・システム内で相互接続されるマシン論理回路若しくは回路モジュールとして、実施できることは言うまでもない。実装態様は、本発明を実施するコンピュータ・システムのパフォーマンス要件に依存する選択の余地の問題である。したがって、関連のアルゴリズムを含む論理動作は、動作、構造デバイス、行為またはモジュールと広範に称することができる。当業者にとって、これらの動作、構造デバイス、行為、およびモジュールは、本願明細書に記載される特許請求の範囲に記載される本発明の趣旨および範囲から逸脱することなく、ソフトウェア、ファームウェア、特定用途のデジタル・ロジック、およびこれらのいかなる組み合わせにおいて、実装することができるものと認識されよう。 [00143] The various embodiments can be (1) a series of computer-implemented acts or program modules that run on a computing system and / or (2) machine logic circuits that are interconnected within a computing system. Needless to say, it can be implemented as a circuit module. The implementation is a matter of choice depending on the performance requirements of the computer system implementing the invention. Accordingly, logical operations including associated algorithms can be broadly referred to as operations, structural devices, acts or modules. For those skilled in the art, these operations, structural devices, acts, and modules are not limited to software, firmware, specific applications, without departing from the spirit and scope of the invention as set forth in the claims set forth herein. It will be appreciated that any digital logic, and any combination thereof, can be implemented.
[00144] 本発明について、様々な例示の実施形態に関して説明してきたが、これらに対する数多くの修正態様が、以降の特許請求の範囲内でなされることができることが当業者にとって理解されるであろう。したがって、本発明の範囲は、如何なるやり方でも上記の説明によって限定されることは意図せず、その代替として、以降の特許請求の範囲を参照することで全面的に規定されるものである。 [00144] While the invention has been described in terms of various exemplary embodiments, those skilled in the art will recognize that numerous modifications thereto can be made within the scope of the following claims. . Accordingly, the scope of the invention is not intended to be limited by the foregoing description in any way, but instead is to be defined entirely by reference to the claims that follow.
Claims (10)
オンライン・サービスまたはアプリケーションの状態を分析することの一部として、ユーザのパフォーマンス・データを複数のクライアントから受け、
クライントのインターネット・プロトコル(IP)アドレスと前記パフォーマンス・データに関連付けられるテナント情報とを使用して、前記複数のクライアントの前記ユーザのパフォーマンス・データを部分的に事前凝集して、クライアントのIPアドレスと位置パラメータ、サービス・プロバイダ・パラメータ、およびテナントのグローバル一意識別子(GUID)パラメータの内1つ以上との間のマッピングを含む、マップ・データを供給し、
凝集データを生成するために、前記マップ・データを部分的に凝集して、テナント・レベル・イシュー、位置レベル・イシュー、およびISPレベル・イシューの内1つ以上を特定する
ように構成される、システム。 A system,
As part of analyzing the state of an online service or application, user performance data is received from multiple clients,
Using the client's Internet Protocol (IP) address and tenant information associated with the performance data, the user performance data of the plurality of clients is partially pre-aggregated to provide the client IP address and Providing map data, including mapping between location parameters, service provider parameters, and one or more of the tenant's globally unique identifier (GUID) parameters;
Configured to partially agglomerate the map data to identify one or more of tenant level issues, location level issues, and ISP level issues to generate agglomeration data; system.
ナビゲーション・タイミングおよびロード・タイミングの測定基準を含むクライアント・データを受け、
1つ以上のマッピング・テーブルを使用して、前記クライアント・データをマップ・データに変換し、
前記マッピング・テーブルおよびマップ・データを1つ以上のデータベースにアップロードし、
前記1つ以上のデータベースにわたり前記マップ・データを凝集して、1つ以上のテナント・レベル・レイテンシ、ロケーション・レベル・レイテンシ、およびISPレベル・レイテンシを定量化する
ことによって、凝集機構を提供するように動作する命令と共に構成される、製造物品。 A manufactured article,
Receive client data, including navigation timing and load timing metrics,
Converting the client data into map data using one or more mapping tables;
Upload the mapping table and map data to one or more databases;
Aggregating the map data across the one or more databases to provide an aggregation mechanism by quantifying one or more tenant level latencies, location level latencies, and ISP level latencies An article of manufacture constructed with instructions that operate on.
複数のクライアントのパフォーマンス測定基準を収集するステップであって、前記パフォーマンス測定基準がオンライン・サービスまたはアプリケーションに関連付けられる、ステップと、
国マッピングへのIPアドレスおよびISPマッピングへのIPアドレスに関連付けられるマッピングを生成することによって変換データを供給するために、前記複数のクライアントの前記パフォーマンス測定基準を部分的に事前凝集するステップと、
凝集データを供給し、テナント・レベル・レイテンシ、位置レベル・レイテンシ、およびISPレベル・レイテンシの内1つ以上を特定するために、前記変換データを凝集するステップと
を含む、方法。 A method,
Collecting a plurality of client performance metrics, wherein the performance metrics are associated with an online service or application; and
Partially preaggregating the performance metrics of the plurality of clients to provide translation data by generating a mapping associated with an IP address to country mapping and an IP address to ISP mapping;
Providing aggregated data and aggregating the transformed data to identify one or more of tenant level latency, location level latency, and ISP level latency.
Applications Claiming Priority (3)
| Application Number | Priority Date | Filing Date | Title |
|---|---|---|---|
| US14/087,413 | 2013-11-22 | ||
| US14/087,413 US20150149609A1 (en) | 2013-11-22 | 2013-11-22 | Performance monitoring to provide real or near real time remediation feedback |
| PCT/US2014/066480 WO2015077385A2 (en) | 2013-11-22 | 2014-11-20 | Performance monitoring to provide real or near real time remediation feedback |
Publications (2)
| Publication Number | Publication Date |
|---|---|
| JP2017500791A true JP2017500791A (en) | 2017-01-05 |
| JP2017500791A5 JP2017500791A5 (en) | 2017-12-28 |
Family
ID=52021441
Family Applications (1)
| Application Number | Title | Priority Date | Filing Date |
|---|---|---|---|
| JP2016533584A Pending JP2017500791A (en) | 2013-11-22 | 2014-11-20 | Performance monitoring that provides real-time or near real-time improvement feedback |
Country Status (6)
| Country | Link |
|---|---|
| US (2) | US20150149609A1 (en) |
| EP (1) | EP3072050A2 (en) |
| JP (1) | JP2017500791A (en) |
| CN (1) | CN105765907A (en) |
| RU (1) | RU2016119573A (en) |
| WO (1) | WO2015077385A2 (en) |
Cited By (1)
| Publication number | Priority date | Publication date | Assignee | Title |
|---|---|---|---|---|
| JP2021140675A (en) * | 2020-03-09 | 2021-09-16 | 株式会社日立製作所 | Performance analysis device, performance analysis method, and performance analysis program |
Families Citing this family (34)
| Publication number | Priority date | Publication date | Assignee | Title |
|---|---|---|---|---|
| US9800567B2 (en) * | 2014-03-31 | 2017-10-24 | Sap Se | Authentication of network nodes |
| US10003492B2 (en) * | 2015-02-24 | 2018-06-19 | CENX, Inc. | Systems and methods for managing data related to network elements from multiple sources |
| US10567246B2 (en) * | 2015-12-15 | 2020-02-18 | At&T Intellectual Property I, L.P. | Processing performance data of a content delivery network |
| US10355872B2 (en) * | 2016-02-05 | 2019-07-16 | Prysm, Inc | Techniques for a collaboration server network connection indicator |
| WO2017172541A1 (en) * | 2016-03-29 | 2017-10-05 | Anritsu Company | Systems and methods for measuring effective customer impact of network problems in real-time using streaming analytics |
| US20170346909A1 (en) * | 2016-05-31 | 2017-11-30 | Linkedin Corporation | Client-side bottleneck analysis using real user monitoring data |
| US10827366B2 (en) | 2016-11-07 | 2020-11-03 | Huawei Technologies Co., Ltd. | System and methods for monitoring performance of slices |
| CN106656666B (en) * | 2016-12-13 | 2020-05-22 | 中国联合网络通信集团有限公司 | Method and device for acquiring first screen time of webpage |
| US10666515B2 (en) * | 2017-01-17 | 2020-05-26 | International Business Machines Corporation | Control of activities executed by endpoints based on conditions involving aggregated parameters |
| US10680933B2 (en) | 2017-02-02 | 2020-06-09 | Microsoft Technology Licensing, Llc | Electronic mail system routing control |
| US10581954B2 (en) * | 2017-03-29 | 2020-03-03 | Palantir Technologies Inc. | Metric collection and aggregation for distributed software services |
| US10482000B2 (en) * | 2017-04-24 | 2019-11-19 | Microsoft Technology Licensing, Llc | Machine learned decision guidance for alerts originating from monitoring systems |
| CN107122448A (en) * | 2017-04-25 | 2017-09-01 | 广州市诚毅科技软件开发有限公司 | A kind of intelligent display method and device of the estimated response time of front end page request |
| US10951462B1 (en) * | 2017-04-27 | 2021-03-16 | 8X8, Inc. | Fault isolation in data communications centers |
| US11645131B2 (en) * | 2017-06-16 | 2023-05-09 | Cisco Technology, Inc. | Distributed fault code aggregation across application centric dimensions |
| US10476946B2 (en) * | 2017-07-27 | 2019-11-12 | Citrix Systems, Inc. | Heuristics for selecting nearest zone based on ICA RTT and network latency |
| US10698756B1 (en) | 2017-12-15 | 2020-06-30 | Palantir Technologies Inc. | Linking related events for various devices and services in computer log files on a centralized server |
| US10824497B2 (en) * | 2018-08-29 | 2020-11-03 | Oracle International Corporation | Enhanced identification of computer performance anomalies based on computer performance logs |
| US11144376B2 (en) * | 2018-11-19 | 2021-10-12 | Microsoft Technology Licensing, Llc | Veto-based model for measuring product health |
| CN111475429B (en) * | 2019-01-24 | 2023-08-29 | 爱思开海力士有限公司 | memory access method |
| US11068333B2 (en) | 2019-06-24 | 2021-07-20 | Bank Of America Corporation | Defect analysis and remediation tool |
| CN110493075B (en) * | 2019-08-01 | 2021-06-25 | 京信通信系统(中国)有限公司 | Method, device and system for monitoring online duration of equipment |
| US11558271B2 (en) * | 2019-09-04 | 2023-01-17 | Cisco Technology, Inc. | System and method of comparing time periods before and after a network temporal event |
| US10924334B1 (en) * | 2019-09-12 | 2021-02-16 | Salesforce.Com, Inc. | Monitoring distributed systems with auto-remediation |
| US11799741B2 (en) * | 2019-10-29 | 2023-10-24 | Fannie Mae | Systems and methods for enterprise information technology (IT) monitoring |
| US11012326B1 (en) * | 2019-12-17 | 2021-05-18 | CloudFit Software, LLC | Monitoring user experience using data blocks for secure data access |
| US10877867B1 (en) | 2019-12-17 | 2020-12-29 | CloudFit Software, LLC | Monitoring user experience for cloud-based services |
| US11379442B2 (en) | 2020-01-07 | 2022-07-05 | Bank Of America Corporation | Self-learning database issue remediation tool |
| ZA202100191B (en) | 2020-01-20 | 2023-12-20 | EXFO Solutions SAS | Method and device for estimating a number of distinct subscribers of a telecommunication network impacted by network issues |
| US11546408B2 (en) | 2020-11-02 | 2023-01-03 | Microsoft Technology Licensing, Llc | Client-side measurement of computer network conditions |
| US11467911B2 (en) | 2020-11-17 | 2022-10-11 | Citrix Systems, Inc. | Systems and methods for detection of degradation of a virtual desktop environment |
| CA3137473A1 (en) * | 2020-11-17 | 2022-05-17 | Citrix Systems, Inc. | Systems and methods for detection of degradation of a virtual desktop environment |
| US20220357968A1 (en) * | 2021-05-07 | 2022-11-10 | Citrix Systems, Inc. | Heuristic Policy Recommendations in a Virtual Environment |
| US20230099916A1 (en) * | 2021-09-24 | 2023-03-30 | Salesforce, Inc. | Determining insights related to performance bottlenecks in a multi-tenant database system |
Citations (1)
| Publication number | Priority date | Publication date | Assignee | Title |
|---|---|---|---|---|
| US8489923B1 (en) * | 2006-11-15 | 2013-07-16 | Conviva Inc. | Detecting problems in content distribution |
Family Cites Families (11)
| Publication number | Priority date | Publication date | Assignee | Title |
|---|---|---|---|---|
| US6738933B2 (en) * | 2001-05-09 | 2004-05-18 | Mercury Interactive Corporation | Root cause analysis of server system performance degradations |
| JP2007158623A (en) * | 2005-12-02 | 2007-06-21 | Matsushita Electric Ind Co Ltd | Method of monitoring quality of video distribution service and terminal |
| EP2069930A4 (en) * | 2006-10-05 | 2012-05-30 | Waratek Pty Ltd | Advanced contention detection |
| CN101192227B (en) * | 2006-11-30 | 2011-05-25 | 阿里巴巴集团控股有限公司 | Log file analytical method and system based on distributed type computing network |
| EP1931114B1 (en) * | 2006-12-08 | 2010-07-28 | Ubs Ag | Method and apparatus for detecting the IP address of a computer and location information associated therewith |
| US8874664B2 (en) * | 2008-03-07 | 2014-10-28 | Nec Corporation | E-mail receiving device, network server, and expiration management method for received E-mail |
| US20090245114A1 (en) * | 2008-04-01 | 2009-10-01 | Jayanth Vijayaraghavan | Methods for collecting and analyzing network performance data |
| EP2392182B1 (en) * | 2009-01-28 | 2018-08-08 | Headwater Research LLC | Quality of service for device assisted services |
| US9021362B2 (en) * | 2010-07-19 | 2015-04-28 | Soasta, Inc. | Real-time analytics of web performance using actual user measurements |
| CN102291594B (en) * | 2011-08-25 | 2015-05-20 | 中国电信股份有限公司上海信息网络部 | IP network video quality detecting and evaluating system and method |
| US8452871B2 (en) * | 2011-08-27 | 2013-05-28 | At&T Intellectual Property I, L.P. | Passive and comprehensive hierarchical anomaly detection system and method |
-
2013
- 2013-11-22 US US14/087,413 patent/US20150149609A1/en not_active Abandoned
-
2014
- 2014-11-20 EP EP14810075.3A patent/EP3072050A2/en not_active Withdrawn
- 2014-11-20 RU RU2016119573A patent/RU2016119573A/en not_active Application Discontinuation
- 2014-11-20 JP JP2016533584A patent/JP2017500791A/en active Pending
- 2014-11-20 CN CN201480063665.5A patent/CN105765907A/en active Pending
- 2014-11-20 WO PCT/US2014/066480 patent/WO2015077385A2/en active Application Filing
-
2017
- 2017-09-29 US US15/720,983 patent/US20180027088A1/en not_active Abandoned
Patent Citations (1)
| Publication number | Priority date | Publication date | Assignee | Title |
|---|---|---|---|---|
| US8489923B1 (en) * | 2006-11-15 | 2013-07-16 | Conviva Inc. | Detecting problems in content distribution |
Cited By (2)
| Publication number | Priority date | Publication date | Assignee | Title |
|---|---|---|---|---|
| JP2021140675A (en) * | 2020-03-09 | 2021-09-16 | 株式会社日立製作所 | Performance analysis device, performance analysis method, and performance analysis program |
| JP7285798B2 (en) | 2020-03-09 | 2023-06-02 | 株式会社日立製作所 | Performance analysis device, performance analysis method, and performance analysis program |
Also Published As
| Publication number | Publication date |
|---|---|
| WO2015077385A2 (en) | 2015-05-28 |
| RU2016119573A3 (en) | 2018-08-10 |
| WO2015077385A3 (en) | 2015-08-20 |
| CN105765907A (en) | 2016-07-13 |
| EP3072050A2 (en) | 2016-09-28 |
| US20180027088A1 (en) | 2018-01-25 |
| US20150149609A1 (en) | 2015-05-28 |
| RU2016119573A (en) | 2017-11-23 |
Similar Documents
| Publication | Publication Date | Title |
|---|---|---|
| JP2017500791A (en) | Performance monitoring that provides real-time or near real-time improvement feedback | |
| US20160092516A1 (en) | Metric time series correlation by outlier removal based on maximum concentration interval | |
| US20170031744A1 (en) | Time series metric data modeling and prediction | |
| JP2018522317A (en) | Software development and distributed platform | |
| US20150067147A1 (en) | Group server performance correction via actions to server subset | |
| US20120167083A1 (en) | Coalescing virtual machines to enable optimum performance | |
| EP3864516B1 (en) | Veto-based model for measuring product health | |
| US10275338B2 (en) | Automated system for fixing and debugging software deployed to customers | |
| US9658917B2 (en) | Server performance correction using remote server actions | |
| JP2018533779A (en) | Performance monitoring of distributed storage systems | |
| US20180276058A1 (en) | In-Product Notifications Targeting Specific Users Selected Via Data Analysis | |
| US10289528B2 (en) | Targeted user notification of bug fixes | |
| US20160321906A1 (en) | Alert management within a network based virtual collaborative space | |
| US10075520B2 (en) | Distributed aggregation of real-time metrics for large scale distributed systems | |
| WO2019070341A1 (en) | Application regression detection in computing systems | |
| US9667507B2 (en) | Increasing the accuracy of service quality management metrics | |
| US9577900B1 (en) | Application centric network experience monitoring | |
| US9800473B2 (en) | Network based virtual collaborative problem solving space | |
| JP6015750B2 (en) | Log collection server, log collection system, and log collection method | |
| US10715608B2 (en) | Automatic server cluster discovery | |
| US20170223136A1 (en) | Any Web Page Reporting and Capture | |
| US10616306B2 (en) | System and method for large-scale capture and tracking of web-based application parameters | |
| JP2009237807A (en) | Vulnerability diagnosis conducting apparatus and diagnostic schedule generating program | |
| US20090198760A1 (en) | Validating service components through data mining | |
| US11899568B2 (en) | Enriched application outage insights |
Legal Events
| Date | Code | Title | Description |
|---|---|---|---|
| A521 | Request for written amendment filed |
Free format text: JAPANESE INTERMEDIATE CODE: A523 Effective date: 20171114 |
|
| A621 | Written request for application examination |
Free format text: JAPANESE INTERMEDIATE CODE: A621 Effective date: 20171114 |
|
| A977 | Report on retrieval |
Free format text: JAPANESE INTERMEDIATE CODE: A971007 Effective date: 20181016 |
|
| A131 | Notification of reasons for refusal |
Free format text: JAPANESE INTERMEDIATE CODE: A131 Effective date: 20181022 |
|
| A02 | Decision of refusal |
Free format text: JAPANESE INTERMEDIATE CODE: A02 Effective date: 20190517 |