JP2013538543A - Machine learning for power grids - Google Patents
Machine learning for power grids Download PDFInfo
- Publication number
- JP2013538543A JP2013538543A JP2013520781A JP2013520781A JP2013538543A JP 2013538543 A JP2013538543 A JP 2013538543A JP 2013520781 A JP2013520781 A JP 2013520781A JP 2013520781 A JP2013520781 A JP 2013520781A JP 2013538543 A JP2013538543 A JP 2013538543A
- Authority
- JP
- Japan
- Prior art keywords
- failure
- data
- machine learning
- ranking
- feeder
- Prior art date
- Legal status (The legal status is an assumption and is not a legal conclusion. Google has not performed a legal analysis and makes no representation as to the accuracy of the status listed.)
- Pending
Links
Images


Classifications
-
- G—PHYSICS
- G06—COMPUTING; CALCULATING OR COUNTING
- G06N—COMPUTING ARRANGEMENTS BASED ON SPECIFIC COMPUTATIONAL MODELS
- G06N20/00—Machine learning
- G06N20/10—Machine learning using kernel methods, e.g. support vector machines [SVM]
-
- G—PHYSICS
- G05—CONTROLLING; REGULATING
- G05B—CONTROL OR REGULATING SYSTEMS IN GENERAL; FUNCTIONAL ELEMENTS OF SUCH SYSTEMS; MONITORING OR TESTING ARRANGEMENTS FOR SUCH SYSTEMS OR ELEMENTS
- G05B23/00—Testing or monitoring of control systems or parts thereof
- G05B23/02—Electric testing or monitoring
- G05B23/0205—Electric testing or monitoring by means of a monitoring system capable of detecting and responding to faults
- G05B23/0218—Electric testing or monitoring by means of a monitoring system capable of detecting and responding to faults characterised by the fault detection method dealing with either existing or incipient faults
- G05B23/0224—Process history based detection method, e.g. whereby history implies the availability of large amounts of data
- G05B23/0227—Qualitative history assessment, whereby the type of data acted upon, e.g. waveforms, images or patterns, is not relevant, e.g. rule based assessment; if-then decisions
- G05B23/0229—Qualitative history assessment, whereby the type of data acted upon, e.g. waveforms, images or patterns, is not relevant, e.g. rule based assessment; if-then decisions knowledge based, e.g. expert systems; genetic algorithms
-
- G—PHYSICS
- G05—CONTROLLING; REGULATING
- G05B—CONTROL OR REGULATING SYSTEMS IN GENERAL; FUNCTIONAL ELEMENTS OF SUCH SYSTEMS; MONITORING OR TESTING ARRANGEMENTS FOR SUCH SYSTEMS OR ELEMENTS
- G05B23/00—Testing or monitoring of control systems or parts thereof
- G05B23/02—Electric testing or monitoring
- G05B23/0205—Electric testing or monitoring by means of a monitoring system capable of detecting and responding to faults
- G05B23/0259—Electric testing or monitoring by means of a monitoring system capable of detecting and responding to faults characterized by the response to fault detection
- G05B23/0275—Fault isolation and identification, e.g. classify fault; estimate cause or root of failure
- G05B23/0281—Quantitative, e.g. mathematical distance; Clustering; Neural networks; Statistical analysis
-
- G—PHYSICS
- G06—COMPUTING; CALCULATING OR COUNTING
- G06N—COMPUTING ARRANGEMENTS BASED ON SPECIFIC COMPUTATIONAL MODELS
- G06N20/00—Machine learning
-
- G—PHYSICS
- G16—INFORMATION AND COMMUNICATION TECHNOLOGY [ICT] SPECIALLY ADAPTED FOR SPECIFIC APPLICATION FIELDS
- G16Z—INFORMATION AND COMMUNICATION TECHNOLOGY [ICT] SPECIALLY ADAPTED FOR SPECIFIC APPLICATION FIELDS, NOT OTHERWISE PROVIDED FOR
- G16Z99/00—Subject matter not provided for in other main groups of this subclass
-
- Y—GENERAL TAGGING OF NEW TECHNOLOGICAL DEVELOPMENTS; GENERAL TAGGING OF CROSS-SECTIONAL TECHNOLOGIES SPANNING OVER SEVERAL SECTIONS OF THE IPC; TECHNICAL SUBJECTS COVERED BY FORMER USPC CROSS-REFERENCE ART COLLECTIONS [XRACs] AND DIGESTS
- Y04—INFORMATION OR COMMUNICATION TECHNOLOGIES HAVING AN IMPACT ON OTHER TECHNOLOGY AREAS
- Y04S—SYSTEMS INTEGRATING TECHNOLOGIES RELATED TO POWER NETWORK OPERATION, COMMUNICATION OR INFORMATION TECHNOLOGIES FOR IMPROVING THE ELECTRICAL POWER GENERATION, TRANSMISSION, DISTRIBUTION, MANAGEMENT OR USAGE, i.e. SMART GRIDS
- Y04S10/00—Systems supporting electrical power generation, transmission or distribution
- Y04S10/50—Systems or methods supporting the power network operation or management, involving a certain degree of interaction with the load-side end user applications
- Y04S10/52—Outage or fault management, e.g. fault detection or location
Landscapes
- Engineering & Computer Science (AREA)
- Physics & Mathematics (AREA)
- General Physics & Mathematics (AREA)
- Theoretical Computer Science (AREA)
- Software Systems (AREA)
- Evolutionary Computation (AREA)
- Mathematical Physics (AREA)
- Artificial Intelligence (AREA)
- Medical Informatics (AREA)
- Data Mining & Analysis (AREA)
- Computing Systems (AREA)
- General Engineering & Computer Science (AREA)
- Computer Vision & Pattern Recognition (AREA)
- Automation & Control Theory (AREA)
- Bioinformatics & Cheminformatics (AREA)
- Bioinformatics & Computational Biology (AREA)
- Evolutionary Biology (AREA)
- Life Sciences & Earth Sciences (AREA)
- Algebra (AREA)
- Mathematical Analysis (AREA)
- Mathematical Optimization (AREA)
- Probability & Statistics with Applications (AREA)
- Pure & Applied Mathematics (AREA)
- Management, Administration, Business Operations System, And Electronic Commerce (AREA)
- Supply And Distribution Of Alternating Current (AREA)
Abstract
配電網内の同種の構成要素のフィルタリングされた故障傾向測定基準群の順位付けであって、配電網内の同種の構成要素を代表する生データを提供するための生データアセンブリと、生データアセンブリに連結され、1つまたは複数のデータ処理技術を用いて、生データをより均一なデータに変換するためのデータプロセッサと、より均一なデータを保存するためのデータベースと、同種の構成要素に関する故障傾向測定基準群を提供するための機械学習エンジンと、機械学習エンジンに動作可能に連結され、故障傾向測定基準群から非適合測定基準の検出および除去を行い、フィルタリングされた故障傾向測定基準群を提供するための評価エンジンと、配電網内の同種の構成要素のフィルタリングされた故障傾向測定基準群の順位付けを表示するように構成された意思決定支援アプリケーションとを含む。
【選択図】図1A raw data assembly for providing raw data representative of similar components in a distribution network, the ranking of filtered failure trend metrics for similar components in the distribution network; A data processor for converting raw data into more uniform data using one or more data processing techniques, a database for storing more uniform data, and failures of similar components A machine learning engine for providing trend metrics, and a operatively coupled machine learning engine that detects and removes non-conforming metrics from the fault trend metrics and creates a filtered fault trend metric group Represents the rating engine to provide and the ranking of filtered failure trend metrics for similar components in the distribution network And a configured decision support applications to.
[Selection] Figure 1
Description
本出願は、2010年7月16日に出願され、その開示内容全体が本明細書に援用される米国仮特許出願第61/364,988号明細書の便益を主張するものである。 This application claims the benefit of US Provisional Patent Application No. 61 / 364,988, filed July 16, 2010, the entire disclosure of which is incorporated herein by reference.
米国エネルギー省の「Grid 2030」の戦略の主な所見の1つは、「『20世紀最高のエンジニアリング成果』であるアメリカの電気システムは、老朽化し、非効率的であり、密集状態で、将来のエネルギー需要に応えることができない(・・・)。」ということである。これからの数十年間にわたり配電網が変わる際に、信頼性が重要な課題となり、送電系統の保全が現在よりもさらに重要なものとなるであろう。NERCによる2007年の調査では、「老朽化したインフラおよび限られた新規の建設」が、調査により考慮された全ての課題の中で、配電網の信頼性にとって最大の課題であると述べられている。スマートグリッドは、操作および保全をよりオンライン式にし、この業界を反応型の稼働から先行型の稼働へと移行させる。電力会社は、設備や過去の故障に関するこれまでのデータ記録を保持するが、これらの記録は一般的に、予知保全や送電系統の信頼性の支援に完全に活かされてはいない。 One of the main findings of the US Department of Energy's “Grid 2030” strategy is: “The 20th century's best engineering achievements in the US electrical system are aging, inefficient, dense, It cannot respond to the energy demand of (...) ". As the distribution network changes over the coming decades, reliability will become an important issue, and maintenance of the transmission system will become even more important than it is today. A 2007 survey by NERC states that "aged infrastructure and limited new construction" is the biggest challenge for distribution network reliability among all the issues considered by the survey. Yes. Smart grids make operations and maintenance more online and move the industry from reactive to advanced operations. Power companies maintain historical data records of equipment and past failures, but these records are generally not fully utilized to support predictive maintenance or transmission system reliability.
米国の都市における大部分の配電網(例えば、北東部および他の成熟した都市における配電網)は、ここ120年にわたり徐々に築かれてきたものである。これは、電気設備(変圧器、ケーブル、ジョイント、ターミネータ、および関連のスイッチ、ネットワーク保護装置、継電器等)の年齢が異なることを意味し、例えば、マンハッタンの低電圧ケーブルの少なくとも5%は、1930年以前に設置されたものであり、トーマス・エジソンの時代に設置された初代の高電圧フィーダセクションの幾つかは、今なおニューヨーク市で積極的に活用されている。ニューヨーク市では、地球の周りを3周半巻き付けるのに十分な94,000マイルを超える高電圧地中配電ケーブルが存在する。ボストンは、3,000マイルの地中ケーブルを有し、他の多くの都市も同様に広大な地中電気システムを有している。 Most distribution networks in US cities (eg, the distribution network in the northeast and other mature cities) have been built gradually over the last 120 years. This means that the ages of electrical equipment (transformers, cables, joints, terminators, and related switches, network protection devices, relays, etc.) are different, for example, at least 5% of Manhattan low voltage cables Some of the first high-voltage feeder sections that were installed before the year and were installed during the Thomas Edison era are still actively used in New York City. In New York City, there are over 94,000 miles of high-voltage underground distribution cables that are enough to wrap around the earth three and a half turns. Boston has 3,000 miles of underground cables, and many other cities have vast underground electrical systems as well.
新しい構成要素と古い構成要素の混合体である広大な送電系統の保全を行うことは、新しい送電系統(例えば、中国の一部で敷設されているような)の管理を行うよりずっと困難である。米国の送電系統は、一般的に、第二次世界大戦後に交換された多くのヨーロッパの送電系統よりも古く、自然災害により継続的にインフラの補充が必要な場所の送電系統よりも古い(例えば、日本には、電力システムの補充を余儀なくさせる地震がある)。 Maintaining a vast transmission system that is a mixture of new and old components is much more difficult than managing a new transmission system (eg, laid in some parts of China) . US transmission systems are generally older than many European transmission systems that were replaced after World War II, and older than those in places where natural disasters require continuous infrastructure replenishment (for example, , Japan has an earthquake that forces the replenishment of the power system).
スマートグリッドは、一夜にして実現するものではない。例えば、Brattle Groupによれば、2030年までに送電系統を最新の状態にする費用は、1.5兆ドル程度になり得る。スマートグリッドの主な構成要素は、(長期間)現在の送電系統の主な構成要素と同じであり、新しいインテリジェントメータが既存の設備と連携する必要がある。スマートグリッドへの転換は、「ボーイング747の摩耗した部品をその飛行中に交換すること」と比較されてきた。未来のスマートグリッドを作り出すには、現在そこにある配電網と連携しなければならない。送電系統の部品が徐々に交換され、スマート構成要素が追加されるので、ケーブル、スイッチ、センサ等を含む古い構成要素の保全をまだ行う必要がある。さらに、古い構成要素の状態は、特に二次ネットワークにおいて、新しいスマートスイッチおよびセンサの追加に対する優先度を決定するものである。 Smart grid is not something that can be achieved overnight. For example, according to the Brattle Group, the cost of bringing the power grid up to date by 2030 can be as much as $ 1.5 trillion. The main components of the smart grid are the same as the main components of the current transmission system (long term), and new intelligent meters need to work with existing equipment. The conversion to a smart grid has been compared to “changing worn parts of Boeing 747 during its flight”. In order to create a smart grid of the future, we must work with the current distribution network. As transmission system components are gradually replaced and smart components are added, older components including cables, switches, sensors, etc. still need to be maintained. Furthermore, the state of the old component determines the priority for the addition of new smart switches and sensors, especially in the secondary network.
スマートグリッドの構成要素を効果的にするための鍵は、現在のシステムを考えて、アップグレードが最も有益な場所を分析することである。医療関係機関における人間の患者の例えを考察し、スマートグリッドに使用される多くの機械学習アルゴリズムおよび技術がそもそも開発され、テストされてきた分野。各患者は、同じ種類の構成要素(フィーダ、変圧器、マンホール、およびジョイントに類似)から成るが、異なるこれまでのストレスおよび遺伝要因(異なる年式、負荷、製造業者に類似)によって、それらの摩耗および老化は異なるので、各患者は、唯一無二の個人として扱われる必要がある。とはいえ、個人は、比較的似た性質を持つ家族、近隣住民、および人口(フィーダ、ネットワーク、区に類似)にグループ化される。スマートグリッドは、配電網の構成要素(患者)がそれらの健康を向上させる援助を行うことにより、ネットワーク(近隣住民)がそれらの平均寿命を向上し、人口(区)がより持続可能に生活するという基盤の上に構築される必要がある。 The key to making smart grid components effective is to consider the current system and analyze where upgrades are most beneficial. An area where many machine learning algorithms and technologies used in smart grids have been developed and tested in the first place, considering the analogy of human patients in medical institutions. Each patient consists of the same type of components (similar to feeders, transformers, manholes, and joints), but due to different historical stresses and genetic factors (similar to different age, load, manufacturer) Because wear and aging are different, each patient needs to be treated as a unique individual. Nonetheless, individuals are grouped into families, neighborhoods, and populations (similar to feeders, networks, wards) that have relatively similar properties. Smart grids help the network components (patients) improve their health, helping the network (neighbors) improve their life expectancy and make the population (district) more sustainable It needs to be built on the foundation.
配電網の信頼性のために、先行型の予知保全プログラムに対するニーズが存在する。本来獲得されていなかった、または予測目的で設計されていなかったデータ資源(例えば、保全記録または保全要求)を含む既存のデータ資源の活用に対するニーズも存在する。 There is a need for advanced predictive maintenance programs because of the reliability of the distribution network. There is also a need for leveraging existing data resources, including data resources that were not originally acquired or designed for predictive purposes (eg, maintenance records or maintenance requests).
現在開示の要旨は、それらに限定されることはないが、プロセス構成要素のアップグレードを必要としている強固で成熟した都市の配電網(例えば、ニューヨーク市の配電網)を含む配電網の信頼性のための先行型予知保全プログラムの方法およびシステムを提供する。例えば、機械学習を用いた本出願の方法およびシステムは、向上した機械学習技術に基づき、予測目的で設計されたものではない送電系統管理の通常過程において得られたデータを利用する、配電網における二次構成要素の先行型予知保全を提供する。 The presently disclosed subject matter includes, but is not limited to, the reliability of distribution networks, including robust and mature urban distribution networks (eg, New York City distribution networks) that require process component upgrades. A method and system for a proactive predictive maintenance program is provided. For example, the method and system of the present application using machine learning is based on improved machine learning technology and uses data obtained in the normal process of power grid management that is not designed for prediction purposes. Provide advanced predictive maintenance of secondary components.
現在開示の要旨の局面の1つは、(a)配電網内の同種の構成要素を代表する生データを提供するための生データアセンブリと;(b)生データアセンブリに動作可能に連結され、1つまたは複数のデータ処理技術を用いて、生データをより均一なデータに変換するためのデータプロセッサと;(c)データプロセッサに動作可能に連結され、より均一なデータを保存するためのデータベースと;(d)データベースに動作可能に連結され、同種の構成要素に関する故障傾向測定基準群を提供するための機械学習エンジンと;(e)機械学習エンジンに動作可能に連結され、故障傾向測定基準群から非適合測定基準の検出および除去を行い、フィルタリングされた故障傾向測定基準群を提供するための評価エンジンと;(f)評価エンジンに動作可能に連結され、配電網内の同種の構成要素のフィルタリングされた故障傾向測定基準群の順位付けを表示するように構成された意思決定支援アプリケーションとを含む、配電網内の同種の構成要素のフィルタリングされた故障傾向測定基準群の順位付けを行うための機械学習システムを提供する。 One aspect of the presently disclosed subject matter is: (a) a raw data assembly for providing raw data representative of similar components in the distribution network; and (b) operatively coupled to the raw data assembly; A data processor for converting raw data into more uniform data using one or more data processing techniques; and (c) a database operatively coupled to the data processor for storing more uniform data And (d) a machine learning engine operably connected to the database and providing a group of failure tendency metrics for the same type of component; and (e) a failure tendency metric operably connected to the machine learning engine. An evaluation engine for detecting and removing non-conforming metrics from the group and providing a filtered group of failure tendency metrics; (f) to the evaluation engine A homogenous component in the distribution network, including a decision support application that is operably coupled and configured to display a ranking of the filtered failure trend metrics group of the homogenous component in the distribution network A machine learning system for ranking a set of filtered failure trend metrics is provided.
ある実施形態では、同種の構成要素を代表する生データは、少なくとも部分的に、同種の構成要素の少なくとも1つに関する保全記録または保全要求から得られる。データ処理技術には、推論結合(inferential join)、パターンマッチング、情報抽出、テキスト標準化、非一貫性を見つけ出すための重複データのクエリー、および関連または重複記録による推論の内の1つまたは複数が含まれ得る。 In some embodiments, the raw data representative of the same type of component is obtained, at least in part, from a maintenance record or maintenance request for at least one of the same type of component. Data processing techniques include one or more of inferential joins, pattern matching, information extraction, text normalization, duplicate data queries to find inconsistencies, and inferences with related or duplicate records Can be.
ある実施形態では、非適合測定基準は、AUC、重み付きAUC、および予め定義されたパーセンテージの失敗除外の内の1つまたは複数に基づいて検出される。評価エンジンは、同種の構成要素の少なくとも1つを代表する動的故障前兆データを捕捉する停電導出データセット(ODDS)を保存するための停電導出データベースをさらに含んでいてもよい。 In some embodiments, non-conforming metrics are detected based on one or more of AUC, weighted AUC, and a predefined percentage of failure exclusions. The evaluation engine may further include a power outage derivation database for storing a power outage derivation data set (ODDS) that captures dynamic failure precursor data representative of at least one of the same type of components.
ある実施形態では、動的故障前兆データは、故障時に、または故障の直前に終わり、故障前の予め選択された時点に始まる時間シフトされた時間領域から得られる。ある実施形態では、同種の構成要素は、ケーブル、ジョイント、ターミネータ、ハンマーヘッド、マンホール、および変圧器から選択される二次ネットワーク構成要素である。ある実施形態では、同種の構成要素はマンホールである。故障傾向測定基準は、ある実施形態では、平均故障間隔(MTBF)および平均故障時間(MTTF)から選択されてもよい。 In some embodiments, dynamic failure precursor data is obtained from a time-shifted time domain that ends at or just before the failure and begins at a pre-selected time before the failure. In certain embodiments, the homogenous component is a secondary network component selected from cables, joints, terminators, hammerheads, manholes, and transformers. In some embodiments, the homogenous component is a manhole. The failure trend metric may be selected from an average failure interval (MTBF) and an average failure time (MTTF) in certain embodiments.
ある実施形態では、評価エンジンは、第1の期間にわたるフィルタリングされた故障傾向測定基準群および第2の期間にわたるフィルタリングされた故障傾向測定基準群を記録するためのデータヒストリアンと、第1の期間におけるフィルタリングされた故障傾向測定基準群が、第2の期間におけるフィルタリングされた故障傾向測定基準群よりも統計的に改善したか否かを決定するためのデータアナライザとを含む。 In an embodiment, the evaluation engine includes a data historian for recording a filtered failure trend metric group over a first period and a filtered failure trend metric group over a second period, a first period And a data analyzer for determining whether the filtered failure trend metric group in FIG. 2 is statistically improved over the filtered failure trend metric group in the second time period.
現在開示の要旨の別の局面は、(a)配電網内の同種の構成要素を代表する生データを提供するための生データアセンブリを設けることと;(b)1つまたは複数のデータ処理技術を用いて、生データをより均一なデータに変換するために生データを処理することと;(c)より均一なデータをデータベースに保存することと;(d)より均一なデータを機械学習エンジンに送信することにより、同種の構成要素に関する故障傾向測定基準群を提供することと;(e)評価エンジンにおいて、故障傾向測定基準群の評価を行うことにより、故障傾向測定基準群から非適合測定基準の検出および除去を行い、フィルタリングされた故障傾向測定基準群を提供することと;及び(f)評価エンジンから得られたフィルタリングされた故障傾向測定基準群の順位付けを行い、意思決定支援アプリケーション上に順位付けを表示することとを含む、機械学習を用いて、配電網内の同種の構成要素のフィルタリングされた故障傾向測定基準群の順位付けを行うための方法を提供する。 Another aspect of the presently disclosed subject matter is: (a) providing a raw data assembly for providing raw data representative of similar components in the distribution network; and (b) one or more data processing techniques. Processing the raw data to convert the raw data into more uniform data using: (c) storing the more uniform data in a database; (d) the machine learning engine for more uniform data Providing a failure trend metric group for the same type of component by transmitting to the (e) non-conforming measurement from the failure trend metric group by evaluating the failure trend metric group in the evaluation engine; Providing detection and removal of criteria and providing a set of filtered failure trend metrics; and (f) filtered failure trend measurement obtained from an evaluation engine. Ranking filtered failure trend metrics groups of similar components in the distribution network using machine learning, including ranking quasigroups and displaying rankings on decision support applications Provide a way to do
この方法に関するさらなる詳細は、対応するシステムの記載から理解されるであろう。システムに関するさらなる詳細は、対応する方法の記載から理解されるであろう。 Further details regarding this method will be understood from the description of the corresponding system. Further details regarding the system will be understood from the description of the corresponding method.
電力会社は、予防保全のための知識発見法および統計的機械学習の使用から大きな恩恵を受けることができる。これまでの配電網データを電力会社が直接使用可能な予測モデルに変換するための方法およびシステムが提供される。このプロセスの特殊化バージョンを用いて、例えば、1)フィーダ故障の順位付け、2)ケーブル、ジョイント、ターミネータ、および変圧器の順位付け、3)フィーダおよび構成要素のMTBF(平均故障間隔)の推定、および4)マンホール事象脆弱性の順位付けを作成することができる。これらの方法およびシステムは、過去(静的)、半リアルタイム、またはリアルタイムの多様で雑音のあるソースを扱うことが可能で、優先順位付け(教師あり順位付け(supervised ranking)またはMTBF)のための最新の機械学習アルゴリズムを組み込み、相互検証およびブラインドテストによる結果の評価を含む。順位付けが行われたリストおよびMTBFの推定の他には、予測能力を経営計画や意思決定支援に直接的に組み込むことを可能にする経営管理インタフェースがあり、このようなインタフェースは、我々の一般的なモデル化法の幾つかの重要な性質である、機械学習特徴が分野の専門家にとって有意であること、データの処理が透過的であること、および予測結果が適正な意思決定の支援を十分に行えるほど正確であることに基づく。予測目的で設計されていなかったこれまでの配電網データと連携する際の課題と、これらの課題にどのように対処していたかを検討する。このデータの「未加工性」は、プロセスから得ることのできる統計的予測モデルの精度と対照をなし、これらのモデルは、ある特定の実施形態例によれば、ニューヨーク市の配電網の保全計画を立てる際に用いるのに十分正確なものである。 Power companies can greatly benefit from the use of knowledge discovery methods and statistical machine learning for preventive maintenance. A method and system are provided for converting historical distribution network data into a predictive model that can be used directly by a power company. Using specialized versions of this process, for example, 1) ranking of feeder failures, 2) ranking of cables, joints, terminators, and transformers, 3) estimation of MTBF (mean time between failures) of feeders and components And 4) A ranking of manhole event vulnerabilities can be created. These methods and systems can handle a variety of noisy sources in the past (static), semi-real time, or real time, and for prioritization (supervised ranking or MTBF) Incorporates the latest machine learning algorithms, including cross-validation and blind evaluation of results. In addition to the ranked list and MTBF estimation, there is a business management interface that allows predictive capabilities to be directly incorporated into business plans and decision support. Some important properties of a typical modeling method are: machine learning features are significant to domain experts, data processing is transparent, and predictive results support good decision making Based on being accurate enough to do. We will examine the issues in linking with existing grid data that were not designed for forecasting purposes and how these issues were addressed. The “rawness” of this data contrasts with the accuracy of the statistical prediction models that can be obtained from the process, which, according to certain example embodiments, is a maintenance plan for the New York City distribution network. It is accurate enough to be used when standing up.
単に便宜上目的で、現在開示の方法およびシステムをニューヨーク市の配電網に関連して説明する。しかしながら、現在開示の要旨は、世界中の配電網に移転可能であることを理解されたい。 For purposes of convenience only, the presently disclosed method and system will be described in the context of the New York City distribution network. However, it should be understood that the presently disclosed subject matter can be transferred to distribution networks around the world.
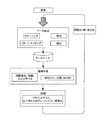
ある非限定的実施形態では、方法およびシステムは、二次送電系統構成要素の故障測定基準傾向を提供する。本明細書においては、二次送電系統構成要素とは、主要ネットワーク電気フィーダケーブルより下流に位置する構成要素を意味する。例えば、図1に示すように、配電網は、生成段階(10)(例えば、原子力発電所からの原子力)、変電所(30)で終了する送電段階(20)から成るものとして要約することができる。電気は、変電所から主要ネットワークを介して送電され、主要ネットワークは、フィーダケーブル(40)(例えば、27,000ボルトのフィーダであり、「配電フィーダ」および「送電フィーダ」を含む)において終了する。フィーダより下流のネットワークは、二次ネットワーク(50)と考えられる。主要ネットワークフィーダケーブルより下流に位置する構成要素は、二次ネットワーク送電系統構成要素と考えられ、限定されることはないが、変圧器(60)並びにジョイント、ターミネータ、ハンマーヘッド、およびマンホール(不図示)を含む。 In certain non-limiting embodiments, the methods and systems provide fault metric trends for secondary transmission system components. In this specification, the secondary power transmission system component means a component located downstream from the main network electric feeder cable. For example, as shown in FIG. 1, the distribution network may be summarized as comprising a generation phase (10) (eg, nuclear power from a nuclear power plant) and a power transmission phase (20) ending at a substation (30). it can. Electricity is transmitted from the substation through the main network, which ends at the feeder cable (40) (eg, a 27,000 volt feeder, including “distribution feeder” and “transmission feeder”). . The network downstream from the feeder is considered the secondary network (50). Components located downstream from the main network feeder cable are considered secondary network transmission system components and include, but are not limited to, the transformer (60) and joints, terminators, hammerheads, and manholes (not shown). )including.
技術的観点から、二次ネットワーク構成要素は、電圧の大きさと、固有の冗長性が存在する「メッシュ」構造を介して二次ネットワークの接続が行われていることとにより、主要ネットワーク構成要素とは異なる。 From a technical point of view, the secondary network components are separated from the main network components by the magnitude of the voltage and the connection of the secondary network through a “mesh” structure with inherent redundancy. Is different.
本明細書では、個々のアプリケーションに対して特殊化が可能な故障予測プロセスの形態でスマートグリッドの保全を行う技術を開示する。現在開示中の要旨は、データ処理(クリーニング、パターンマッチング、統計、統合)、データベースの形成、機械学習(時間集約、特徴およびラベルの形成、順位付け方法)、および評価(ブラインドテスト、視覚化)を提供する。特定の実施形態において、1)配電フィーダに関するフィーダ故障の順位付け、2)配電フィーダに関するケーブル、ジョイント、ターミネータ、および変圧器の順位付け、3)配電フィーダに関するフィーダおよび構成要素のMTBF(平均故障間隔)の推定、および4)マンホール脆弱性の順位付けに関するプロセスの特殊化バージョンの開発を行った。各プロセスは、特定の特徴を備えたデータを扱うことが可能である。最も一般的な形態では、プロセスは、過去(静的)、半リアルタイム、またはリアルタイムの多様で雑音のあるソースを扱うことが可能で、優先順位付け(教師あり順位付けまたはMTBF)のための機械学習アルゴリズムを組み込み、過去のデータに対する相互検証およびブラインド評価による結果の評価を含む。ブラインド評価は、事象が起きた際に生成されるデータに対して行うことができるので、未来の情報に対して真の障壁を生じさせる。機械学習アルゴリズムによって使用されるデータは、過去の事象(故障、交換、修理、テスト、負荷、電力品質事象等)、および資産特徴(設備の種類、環境条件、製造業者、仕様、それに接続される構成要素、それが設置される区、特定のネットワーク、設置、故障、またはテストの日付等)を含み得る。 This specification discloses a technique for maintaining a smart grid in the form of a failure prediction process that can be specialized for individual applications. The gist currently disclosed is data processing (cleaning, pattern matching, statistics, integration), database formation, machine learning (time aggregation, feature and label formation, ranking method), and evaluation (blind test, visualization). I will provide a. In certain embodiments, 1) ranking feeder failures for distribution feeders, 2) ranking cables, joints, terminators, and transformers for distribution feeders, 3) feeder and component MTBF for distribution feeders (mean failure interval) ) And 4) developed a specialized version of the process for ranking manhole vulnerabilities. Each process can handle data with specific characteristics. In the most general form, the process can handle a variety of noisy sources in the past (static), semi-real time, or real time, and is a machine for prioritization (supervised ranking or MTBF). Incorporates a learning algorithm, including cross-validation of past data and evaluation of results by blind evaluation. Blind evaluation can be performed on data that is generated when an event occurs, thus creating a real barrier to future information. Data used by machine learning algorithms is connected to past events (failures, replacements, repairs, tests, loads, power quality events, etc.) and asset characteristics (equipment types, environmental conditions, manufacturers, specifications, etc.) Component, ward in which it is installed, specific network, installation, failure, or test date, etc.).
順位付けが行われたリストおよびMTBFの推定の他には、計画や意思決定支援のために管理者や技術者によって使用可能なグラフィカル・ユーザ・インタフェースが設計されている。我々のモデルに基づいて構築されたニューヨーク市の成功した送電系統意思決定支援アプリケーションには、限定されることはないが、修理の優先順位付け、検査の優先順位付け、過剰処置の修正、交換プランの作成、およびシステムの防護作用の優先順位付けが含まれる。これらのインタフェースの有用性は、少なくとも部分的に、基礎となるモデルの予測精度から得られ、また、モデル結果の解釈に対しても得られる。 In addition to the ranked list and MTBF estimation, a graphical user interface is designed that can be used by administrators and technicians for planning and decision support. New York City's successful grid decision support applications built on our model include, but are not limited to, repair prioritization, inspection prioritization, overtreatment correction, replacement plans And the prioritization of the protective actions of the system. The usefulness of these interfaces is derived, at least in part, from the prediction accuracy of the underlying model and also for the interpretation of model results.
現在開示中の方法およびシステムのアプローチの重要な性質の1つは、機械学習特徴が分野の専門家にとって有意であること、およびデータの処理や予測に関与する原因因子の設計が透過的であることである。データの透過的使用は、幾つかの目的に適い、それらの目的は、それによって分野の専門家がモデルのトラブルシューティングを行う、または拡張を提案することが可能となること、それによってユーザが故障の根本的原因の根底にある因子を見つけ出すことが可能となること、およびそれにより管理者が決定を行うために(非ブラックボックス)モデルを理解し、その結果信頼することが可能となることである。 One of the important properties of the currently disclosed method and system approach is that machine learning features are significant for domain experts and the design of causal factors involved in data processing and prediction is transparent That is. The transparent use of data is suitable for several purposes, which allows field experts to troubleshoot models or propose enhancements, which can lead to user failure The ability to find the underlying factors of the root cause of the problem, and the ability of the administrator to understand and trust the model (non-black box) to make decisions is there.
現在開示中の要旨は、電気事業者らによって収集されたデータを、効果的な予測および意思決定支援アプリケーションを提供する機械学習を用いた予知保全プログラムに先行的に用いることが可能であることを示す。 The gist currently disclosed is that data collected by utilities can be used in advance in predictive maintenance programs using machine learning to provide effective prediction and decision support applications. Show.
以下の詳細な説明の編成は以下の通りであり、順位付け、予測、または構成要素に関するそれらを良くするまたは悪くする基礎的性質、あるいは、故障の根本的原因を含む配電網保全タスクが開示される。次に、これらの目標を達成するように生データを変換可能なプロセスを開示する。次に、知識発見プロセスに使用される具体的な機械学習法を開示する。4つの予測タスクに関するこれらのプロセスの特殊化の開示も行う。それらの結果およびニューヨーク市の送電網に関するサンプル結果の評価を開示する。これらの結果を使用可能にするため、および知識発見の支援を行うために開発された管理ソフトを開示する。ニューヨーク市の送電系統に対するこれらのシステムの実施から得られた例示的で非限定的なシステムおよび教訓も開示する。 The organization of the following detailed description is as follows, disclosing grid maintenance tasks including rankings, predictions, basic properties that make them better or worse with respect to components, or the root cause of failure: The Next, a process is disclosed that can transform raw data to achieve these goals. Next, a specific machine learning method used in the knowledge discovery process is disclosed. We also disclose specializations of these processes for the four prediction tasks. Disclose these results and an evaluation of sample results for the New York City grid. Disclose management software developed to enable these results and to assist in knowledge discovery. Also disclosed are exemplary, non-limiting systems and lessons learned from the implementation of these systems for the New York City transmission system.
先行保全タスク
電力会社は、反応型の保全計画(何か不具合が生じた時に直す)から先行型の保全計画(潜在的な問題をそれらが生じる前に直す)へと切り替え始めている。これには利点がある:故障が生じることを許す反応型の計画は、例えば火災やカスケード故障などの危険な状況に至り、費用のかかる緊急修理を招く可能性がある。しかしながら、潜在的に損傷を受けやすい構成要素を最も効果的に修理するために、限られた資源をどこに割り当てるべきかを決定することは、簡単な仕事ではない。
Pre-maintenance tasks Power companies are starting to switch from reactive maintenance plans (repair when something goes wrong) to advanced maintenance plans (repair potential problems before they occur). This has advantages: reactive planning that allows failures to occur can lead to dangerous situations such as fires and cascade failures, which can lead to costly emergency repairs. However, determining where to allocate limited resources in order to most effectively repair potentially damaged components is not an easy task.
大規模な電力システムでは、電気は、ソースから消費者まで、送電線を通って変電所に行き、そこから、主要フィーダケーブル(「フィーダ」)、および関連のセクション、ジョイント、およびハンマーヘッドへと行き、変圧器を通って、二次(低電圧)配電網の残りの部分へと流れる。2種類のフィーダである「配電フィーダ」および「送電フィーダ」が存在する。現在開示の要旨は、単に便宜上、二次ネットワークに供給を行う変圧器を葉の部分に備えた樹状構造を形成する大型高電圧ケーブル(13または27KV)である配電フィーダに関連して説明を行う。現在開示のシステムおよび方法は、配電フィーダに限定されず、例えば送電フィーダも包含する。 In large power systems, electricity goes from the source to the consumer, through the transmission line, to the substation, and from there to the main feeder cable (“feeder”) and related sections, joints, and hammerheads. Going through the transformer to the rest of the secondary (low voltage) distribution network. There are two types of feeders, “distribution feeder” and “transmission feeder”. The gist of the present disclosure is merely related to the distribution feeder, which is a large high-voltage cable (13 or 27 KV) that forms a tree-like structure with a transformer in the leaf portion that supplies the secondary network for convenience. Do. Currently disclosed systems and methods are not limited to power distribution feeders, but also include, for example, power transmission feeders.
一部の都市では、これらの変圧器は、建物または少数の顧客のために機能し、フィーダの故障は、全ての下流の顧客に停電をもたらす。対照的に、多くの都市の二次ケーブルは、1つまたは複数のフィーダが故障したとしても供給を継続することを目的として、重複する高電圧フィーダの供給を受けるメッシュまたは格子状構造を形成している。これらの構成要素のいずれにおいても、起こり得る弱点が存在し得る:フィーダが稼働休止になり得る、ケーブル、ジョイント、およびハンマーヘッドが故障し得る、変圧器が故障し得る、および二次配電網におけるケーブルの絶縁破壊が故障を引き起こし得る。データ駆動型の先制的な保全方針がこれらの故障の防止をどのように支援できるかを説明する。 In some cities, these transformers work for buildings or a small number of customers, and feeder failure results in a power outage for all downstream customers. In contrast, many urban secondary cables form a mesh or grid structure that is fed with overlapping high voltage feeders in order to continue feeding even if one or more feeders fail. ing. In any of these components, there may be possible weaknesses: feeders can go out of service, cables, joints, and hammerheads can fail, transformers can fail, and in secondary distribution networks Cable breakdown can cause failure. Explain how a data-driven preemptive maintenance policy can help prevent these failures.
フィーダの順位付け
主要配電フィーダケーブルは、大型ケーブルであり、ニューヨーク市では、それらは13,600または27,000ボルトで動作する。これらのケーブルは、通常、主要な道または通りに沿って敷設され、変電所から二次送電系統へと電力を分配する。
Feeder Ranking The main distribution feeder cables are large cables and in New York City they operate at 13,600 or 27,000 volts. These cables are usually laid along the main road or street and distribute power from the substation to the secondary transmission system.
フィーダは、フィーダに沿ったある場所の不良により、または計画的な電源停止(それによって保全を行うことができる)により、停電を経験する場合がある。フィーダ等の1つの構成要素が故障または稼働中止となると、この故障は、「第1の非常事態」と呼ばれ、同じネットワーク内で2つの構成要素が故障すると、「第2の非常事態」と呼ばれ、以下同様である。通常、少数のフィーダを失っても、システムにおける大規模な固有の冗長性により、顧客の電気供給の中断には至らない。(例えば、地中送電網システムは、上記のような第2の非常事態の下で動作するように設計可能である。)しかしながら、ネットワーク内の1つまたは複数のフィーダが稼働休止になると、残りのフィーダおよびそれらに関連する変圧器が切断されたフィーダの負荷を「引き取る」必要があり、その結果、それらのリスクが増加する。この追加された負荷により、残りのフィーダおよび変圧器の故障のリスクが高まり、ある点を過ぎると、残りの配電資産がネットワークの負荷を運ぶことができず、システムの修理を行えるまで、ネットワーク全体をシャットダウンさせる必要があるカスケード故障をネットワークが経験する。 A feeder may experience a power outage due to a fault in a location along the feeder or due to a planned power outage (which can provide maintenance). When one component, such as a feeder, fails or is shut down, this failure is called a “first emergency”, and when two components fail in the same network, a “second emergency” And so on. Typically, losing a small number of feeders will not disrupt the customer's electricity supply due to the massive inherent redundancy in the system. (For example, the underground power grid system can be designed to operate under the second emergency as described above.) However, if one or more feeders in the network go out of service, the rest Feeders and their associated transformers need to “take over” the disconnected feeder load, which increases their risk. This added load increases the risk of failure of the remaining feeders and transformers, after which the entire distribution network cannot carry the network load and repair the system until the remaining distribution assets can carry the network load. The network experiences a cascade fault that needs to be shut down.
各フィーダケーブルは、多くのケーブルセクション(「セクション」)から構成可能で、例えば、ニューヨーク市の各フィーダの平均セクション数は約150である。各セクションは、2つのマンホール間に伸び、それぞれの端部に「ジョイント」を有する。セクションは、多くの場合、それぞれが各電圧位相用の3束ケーブルから成る。ジョイントは、2つの単ケーブルセクション同士をつなぐ、または2つ以上に分岐させることが可能である。最終的に、フィーダセクションは、二次システムに必要とされる120または240ボルトに電圧を下げる変圧器で終了する。フィーダセクションは、分離可能なコネクタ(「ハンマーヘッド」)を介して変圧器に接続する。フィーダの故障は、一般的に、ジョイントにおいて、またはケーブルセクションの内部で生じる。地中でのフィーダの故障は、夏の間、特に熱波の間に、圧倒的に最も頻度が高い。このサブセクションでは、あるフィーダが将来故障するか否かの予測問題を説明する(その下位構成要素である、セクション、ジョイント、ハンマーヘッドを含む)。以下のセクションでは、個々のケーブル、ジョイント、およびハンマーヘッドに関する故障予測の説明を行う。 Each feeder cable can be composed of many cable sections ("sections"), for example, the average number of sections for each feeder in New York City is approximately 150. Each section extends between two manholes and has a “joint” at each end. Sections often consist of three bundle cables for each voltage phase. A joint can connect two single cable sections together or branch into two or more. Eventually, the feeder section ends with a transformer that reduces the voltage to 120 or 240 volts as required for the secondary system. The feeder section connects to the transformer via a separable connector (“hammerhead”). Feeder failures generally occur at joints or inside cable sections. Feeder failures in the ground are by far the most frequent during summer, especially during heat waves. This subsection describes the prediction problem of whether a feeder will fail in the future (including its subcomponents, sections, joints, and hammerheads). The following sections describe failure prediction for individual cables, joints, and hammerheads.
ジョイントの種類の1つである「ストップジョイント」は、不均衡な数の故障のもととなり得る。ストップジョイントは、固体誘電体を用いて、古い「PILC」を最新のケーブルに接続する。PILCは、Paper−Insulated Lead−sheathed Cable(紙絶縁鉛被ケーブル)を表し、1906年から約1960年代まで、ほとんどの都心において使用された旧式の技術である。PILCセクションは、オイルが充填されているので、ストップジョイントは、良好な電気的接続および絶縁を備える必要がある(全てのジョイントと同様)だけでなく、オイルが漏れることを防ぐためにオイルに蓋をする必要がある。全ての公益事業者がそれぞれのシステムから鉛ケーブルを積極的に除去しているが、その作業を完了するには長い時間がかかる。例えば、ニューヨーク市では、公益事業委員会が、残りの約30,000のPILCセクションの全てを2020年までに交換することを命じた。しかしながら、一部のPILCセクションは、非常に長い間、問題なしに稼働してきており、最も信頼性の低いセクションを最初に交換することによって限られた保全予算を最大限に活用することが実用的かつ重要であることに留意されたい。 One type of joint, a “stop joint”, can cause an unbalanced number of failures. The stop joint uses a solid dielectric to connect the old “PILC” to the latest cable. PILC stands for Paper-Insulated Lead-sheathed Cable and is an old technology used in most urban centers from 1906 to about 1960s. Since the PILC section is filled with oil, the stop joints need to have good electrical connection and insulation (similar to all joints) as well as capping the oil to prevent oil leaking. There is a need to. All utilities are actively removing lead cables from their systems, but it takes a long time to complete the work. For example, in New York City, the Utilities Commission ordered that all remaining 30,000 PILC sections be replaced by 2020. However, some PILC sections have been operating without problems for a very long time, and it is practical to make the best use of a limited maintenance budget by replacing the least reliable section first. Note that it is important.
以下に記載のフィーダ故障の順位付けアプリケーションでは、フィーダを最も高リスクから最も低リスクまで順序付ける。フィーダ順位付けタスクのためのデータは、停電履歴の他に、フィーダ毎に約300の特徴から構成され得る。これらのデータは、かなり完全で、雑音が多すぎないものと仮定される。データには、業務開始日、以前のOA(フィーダ故障)、予定された作業、テスト、および日付、PILCのパーセンテージ、電力品質事象等が含まれる。多くの概要特徴は、生データ、例えばデータ収集期間にわたるフィーダ毎のOA総数から計算可能である。モデル構築段階は、過去2年のデータを用いて、1年間のテスト段階の故障を予測する。 The feeder failure ranking application described below orders the feeders from the highest risk to the lowest risk. The data for the feeder ranking task can consist of about 300 features per feeder in addition to the power outage history. These data are assumed to be fairly complete and not too noisy. Data includes business start date, previous OA (feeder failure), scheduled work, test and date, PILC percentage, power quality events, and so on. Many summary features can be calculated from raw data, eg, the total number of OA per feeder over the data collection period. In the model construction stage, the failure in the test stage for one year is predicted using data of the past two years.
図2から分かるように、典型的な配電網において年間を通じて観測されるように、少数のフィーダ故障は日々生じている。故障率は、温かい気候の間、顕著に増加する。空調設備がシステムにかなりの負荷をかけ、それによって、夏の間、電気使用量が約50%増加する。システムが最も高リスクにあるのがこれらの期間である。 As can be seen from FIG. 2, a few feeder failures occur daily, as observed throughout the year in a typical distribution network. Failure rates increase significantly during warm weather. Air conditioning places a significant load on the system, which increases electricity usage by about 50% during the summer. It is during these periods that the system is at highest risk.
フィーダ故障順位付けリストを用いて、修理が開始される時期である春の公益事業者の交換予定表のガイダンスを提供することができる。毎年春先に、PILCセクションを除去し、負荷の平衡を向上させるため、または新しい建物の電力要件の変更を支援するためにフィーダのトポロジーを変更することによって、フィーダの数を改善する。負荷を春には軽くすることによって、フィーダを低リスクでアップグレードさせるために稼働休止にさせることができる。フィーダの優先順位付けが重要である。各セクションの計画的交換の費用は、約18,000ドルかかり、そのセクションが故障する可能性が非常に低ければ、故障する可能性の高いセクションの交換と比較して、資金が基本的に無駄となる。故障は、より費用のかかる緊急交換を必要とし、カスケード故障のリスクも持っている。 The feeder failure ranking list can be used to provide guidance on the replacement schedule for the spring utility, which is when repairs will begin. Every early spring, the number of feeders is improved by removing the PILC section and changing the feeder topology to improve load balancing or to assist in changing the power requirements of new buildings. By reducing the load in the spring, the feeder can be taken out of service to upgrade at low risk. Feeder prioritization is important. The cost of a planned replacement for each section is approximately $ 18,000, and if the section is very unlikely to fail, the fund is essentially wasted compared to replacing a section that is likely to fail It becomes. Failure requires a more expensive emergency replacement and also carries the risk of cascading failure.
ケーブル、ジョイント、ターミネータ、および変圧器の順位付け
ケーブル、ジョイント、ターミネータ、および変圧器は、かなり大きな集団を持つフィーダの構成要素である。(多構成要素フィーダの)個々の構成要素がどのように故障するかをモデル化することにより、フィーダ故障の理解がさらなるレベルに到達する。構成要素の特徴は、フィーダに関してまとめられた同様の特徴と比較して、局部的な故障に対してより直接的に関連し、非集約形式で保持され得る。例えば、構成要素のモデル化タスクの特徴が、1950年にOkoniteによってPILCセクションが製造されたものであることを符号化し得るのに対して、フィーダのモデル化タスクの特徴は、代わりに、そのフィーダに関して40年を超えるPILCセクションの総数を符号化し得る。順位付け構成要素により、信頼性向上のために影響を受けやすいフィーダを選択した後に(フィーダの順位付けによって導かれる)、より望ましい意思決定支援が可能となる。予算制約によりフィーダ全体の交換が妨げられる場合には、構成要素の順位付けが、故障に対する故障発生度による構成要素の優先順位付けを可能にする。最終的に、構成要素の順位付け自体を使用して、フィーダ順位付けタスクの特徴を定義することができる。一般的に、ある信用割当構造によって導かれる部分全体階層学習システムを構築することができる。Con Edisonの場合、ケーブル、ジョイント、およびハンマーヘッドの順位付けに使用されたデータは、次に説明するマンホール事象予測プロジェクトに使用されたデータよりは雑音が少ないが、多様でかなり雑音が多いものであった。
Ranking cables, joints, terminators, and transformers Cables, joints, terminators, and transformers are components of feeders that have a fairly large population. By modeling how individual components (of a multi-component feeder) fail, the understanding of feeder failure reaches a further level. Component features are more directly related to local failures and can be kept in a non-aggregated form as compared to similar features grouped for feeders. For example, a component modeling task feature may encode that the PILC section was manufactured by Okonite in 1950, whereas a feeder modeling task feature may instead be The total number of PILC sections over 40 years may be encoded. The ranking component enables more desirable decision support after selecting sensitive feeders (derived by feeder ranking) for improved reliability. Where budget constraints prevent replacement of the entire feeder, component ranking allows prioritization of components according to the degree of failure to failure. Finally, the component ranking itself can be used to define the characteristics of the feeder ranking task. In general, a partial whole hierarchy learning system guided by a certain credit allocation structure can be constructed. In the case of Con Edison, the data used to rank cables, joints, and hammerheads is less noisy than the data used in the manhole event prediction project described below, but it is diverse and quite noisy. there were.
マンホールの順位付け
火災および爆発を含む少数の重大な「マンホール事象」が、毎年多くの都市で発生している。これらの事象は、通常、二次ネットワークにおける低電圧ケーブルの絶縁破壊によって生じる。絶縁破壊は長期間にわたり得るので、過去の事象の特徴から未来の深刻な事象を予測しようとすることは合理的である。事象は、2つの多少単純化したカテゴリーである、「深刻な事象」(火災、爆発、重大な発煙を起こしたマンホール)および「潜在的前兆事象」(バーンアウト、点滅光等)の範囲内であると考えられる。潜在的前兆事象は、エリア全体に及ぶネットワーク問題の指標となり得る、あるいは、1〜2個のマンホールのみに影響を与える局所的問題が存在することを示し得る。
Ranking Manholes A few major “manhole events” occur in many cities each year, including fires and explosions. These events are usually caused by breakdown of low voltage cables in the secondary network. Since breakdown can occur over a long period of time, it is reasonable to try to predict future serious events from past event characteristics. Events are within two somewhat simplified categories: “serious events” (manholes that caused fires, explosions, and severe smoke) and “potential precursors” (burnout, flashing light, etc.) It is believed that there is. Potential precursor events can be indicative of network problems across the area, or can indicate that there is a local problem that affects only one or two manholes.
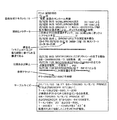
多くの電力会社は、発信者による速記録であるトラブルチケットの形式で、過去の全ての事象の記録を保持している。ニューヨーク市の発煙を起こしたマンホール事象のチケット例を図3に示す。本明細書に開示される機械学習技術は、効果的にこれらのチケットの処理を行うことができる。 Many utilities maintain a record of all past events in the form of trouble tickets, which are fast records by callers. An example of a ticket for a manhole event that caused New York City smoke is shown in FIG. The machine learning technique disclosed in this specification can effectively process these tickets.
MTBF(平均故障間隔)のモデル化
信頼性性能の測定基準は、修理可能な構成要素またはシステムの平均故障間隔(MTBF)および修理不可能な構成要素の平均故障時間(MTTF)である。無駄のない管理では、MTBFは、一般的な尺度または信頼性性能である。一旦信頼性を数値化すれば、費用対効果分析を実施することができ、交換方針、検査方針、および信頼性向上プログラムの計画を立てることができる。
Modeling MTBF (Mean Time Between Failures) The metrics of reliability performance are the repairable component or system mean failure time (MTBF) and the non-repairable component mean failure time (MTTF). For lean management, MTBF is a general measure or reliability performance. Once the reliability is quantified, a cost-effectiveness analysis can be performed and a replacement policy, inspection policy, and reliability improvement program can be planned.
フィーダは、MTBFが適用可能な故障し得る複数の構成要素から成る。ジョイントが一旦故障すると、それが交換されるので、代わりにMTTFが適用可能となる。 The feeder is composed of a plurality of components that can fail to which the MTBF is applicable. Once a joint has failed, it is replaced so MTTF can be applied instead.
一般的に、フィーダの様な構成要素または複合システムの故障率は、その寿命に亘って変化するMTBFを有する。新しいもの、または保全が行われたばかりのものが、「初期故障」としても知られる早い時期の故障を経験する場合がある。その後、システムは、より低い故障率の中年期に落ち着き、最終的に、それらの寿命の最後で、故障率が増加する。(図4を参照。) In general, the failure rate of a component such as a feeder or complex system has an MTBF that varies over its lifetime. New things or those that have just been maintained may experience premature failures, also known as “early failures”. The system then settles to the middle age of a lower failure rate, and eventually the failure rate increases at the end of their lifetime. (See Figure 4.)
電力産業の初期からのケーブルタイプの選択肢であるが、現在ではほとんどの公益事業者が段階的に廃止を行っているPILCケーブルは、非常に長い寿命を持つことが可能で、それらの寿命末期のサインを決定することは困難である。変圧器の場合は、故障率の増加により経年劣化を示す。 Although it is a cable type choice from the early days of the power industry, PILC cables that are being phased out by most utilities today can have very long lifespans, It is difficult to determine the signature. In the case of transformers, it shows deterioration over time due to an increase in failure rate.
送電網の故障予測の方法およびシステム
一般的目標は、「知識発見」、すなわち、暗示的で、新規の、潜在的に非常に有用である情報をデータ内で見つけ出すことである。Hardingらは、製造における知識発見の概要を提供している。一般的なCRISP−DMのフレームワークは、(潜在的に)極めて生のデータのためのデータ処理を取り込んでいるが、従来のデータベースからの知識発見(KDD)の概要は、これを包含していない。ここに提示する一般的プロセスは、CRISP−DMの特別なケースと見なすことができるが、データベースを構築する際に伴う大量のデータクリーニングおよび処理により、KDDの範囲外のものである。
Grid network failure prediction method and system The general goal is to “knowledge discovery”, that is, to find implicit, new, potentially very useful information in the data. Harding et al. Provide an overview of knowledge discovery in manufacturing. The general CRISP-DM framework incorporates data processing for (potentially) very raw data, but the overview of knowledge discovery (KDD) from traditional databases encompasses this. Absent. The general process presented here can be considered a special case of CRISP-DM, but is outside the scope of KDD due to the large amount of data cleaning and processing involved in building a database.
送電網データに関する一般的な知識発見プロセスを図5に示す。データは、まずクリーニングされ、正確にクエリーを行うことが可能な単一のデータベースに統合される。次に、適切な時間尺度に亘る1つまたは複数の機械学習問題を定式化する。特定の実施形態では、機械学習モデルに使用される特徴は、その分野の専門家にとって有意なものである。機械学習アルゴリズムのパラメータは、調整または相互検証によるテストが行われ、データベース内に存在しないデータに対する予測精度ブラインド予測テストに関して評価される。分野の専門家は、経営管理ツールを用いてモデルの評価も行い、改善点(通常、データの最初の操作およびクリーニング時のもの)を提案する。 A general knowledge discovery process for grid data is shown in FIG. The data is first cleaned and integrated into a single database that can be queried accurately. Next, formulate one or more machine learning problems over an appropriate time scale. In certain embodiments, the features used in the machine learning model are significant to the domain expert. Machine learning algorithm parameters are tested by adjustment or cross-validation and evaluated with respect to predictive accuracy blind prediction tests for data not present in the database. Field experts also use model management tools to evaluate models and suggest improvements (usually during initial manipulation and cleaning of data).
データ処理/クリーニングは、その結果生じるモデルの完全性を確実にするための重要要素である。この見解は、「・・・知識発見において顧みられないことの多い前処理および後処理ステップは、現実のデータマイニングアプリケーションの成功を決める最も重要な要素である」と述べるHsuらの見解と一致する。データクリーニング問題は、文献において、例えば、電子商取引において、広範囲に説明されている。多くの場合、機械学習技術の適用により、直接的に(データクリーニングステップなしに)、有用または有意なモデルがもたらされることはない。電気事業における適用では、これらのデータは、極めて生のものでもよく、データは、事象の時間または構成要素の識別を記録する方式が異なる、会社全体の多様なソースからのものでもよく、不完全または非常に雑音の多いものでもよく、多数の自由形式のテキスト文書(例えばトラブルチケット)を含んでいてもよい。データ処理は、データ入力の上記例を処理すること等により、機械学習モデルに使用されるデータの解釈を完全に定義する。この処理は、多様なソースからのこれまでのデータを、学習のための使用可能な予測特徴およびラベルに変換する。データクリーニングには、パターンマッチング(例えば、構造化または非構造化データ中で正規表現を見つけ出す)、情報抽出、テキスト標準化、非一貫性を見つけ出すための重複データの使用、関連または重複記録の推論等の多くのステップが含まれ得る。予備的統計は、データが欠けているか否かの評価、および推論結合に対するサニティーチェックに使用することができる。 Data processing / cleaning is an important factor to ensure the integrity of the resulting model. This view is consistent with Hsu et al.'S view stating that "... pre- and post-processing steps that are often neglected in knowledge discovery are the most important factors that determine the success of real data mining applications." . Data cleaning problems are extensively described in the literature, for example, in electronic commerce. In many cases, the application of machine learning techniques does not provide a useful or significant model directly (without a data cleaning step). For electric utility applications, these data may be extremely raw, and the data may be from a variety of sources across the company, differing in the manner in which the event time or component identification is recorded, and incomplete. Or it may be very noisy and may contain a large number of free-form text documents (eg trouble tickets). Data processing completely defines the interpretation of the data used in the machine learning model, such as by processing the above example of data input. This process converts historical data from various sources into usable predictive features and labels for learning. Data cleaning includes pattern matching (eg, finding regular expressions in structured or unstructured data), information extraction, text normalization, use of duplicate data to find inconsistencies, inference of related or duplicate records, etc. Many steps can be included. Preliminary statistics can be used for assessing whether data is missing and for sanity checking for inference joins.
推論結合とは、少なくとも1つの推論に基づいて、複数の生データ表を1つのデータベースに一体化させることができるプロセスである。推論結合は、データクリーニングの重要要素となり得る。推論結合のために基本的パターンマッチングおよび統計を使用することの背後にある論理を示す一例は、どのケーブルがどのマンホール内に入るかを決定するために、ニューヨーク市のマンホール事象プロセスに関する生のマンホールデータに主要ケーブル記録を一体化させることである。主要ケーブルは、2つのマンホールを接続する(1つのマンホールのみに入る引き込みまたは街灯ケーブルとは対照的である)。ケーブルデータは、マンホールの場所データのソースとは異なる公益事業者の経理課に由来し得る。マンホール対ケーブルの未加工の結合(3つのフィールドである、マンホールタイプ、番号、およびローカル3ブロックコードの結合体である固有のマンホール識別子に基づく)では、ケーブル記録の約半分のみと一致する。ケーブルデータに対して行われる1回目の修正には、スペルの標準化および隣接の3ブロックコード(隣接の3ブロックコードは、しばしば誤って境界線のマンホールに入力される)に対する一致を見つけ出すことが含まれる。次の回の修正では、主要ケーブルが限られた長さを持つという事実が用いられる:ケーブルの2つの端部の一方のみが、1つのマンホールと固有に一致し、他方の端部に関して、可能性のあるマンホールが幾つかある状態では、最も近いマンホールが選択される(とり得る中で最も短いケーブル長さ)。この処理により、ケーブル記録の約4分の3の一致が生じる。しかしながら、ケーブル長さのヒストグラムは、これらの結合された記録の約5%が、現実であるには長すぎるケーブルを表していることを示す。これらのケーブルを用いて、再び結合のトラブルシューティングを行うことが可能である。統計は一般的に、他の関連データに適切に結合されていないデータポケットを見つけ出す一助となり得る。 Inference joining is a process that allows multiple raw data tables to be integrated into a single database based on at least one inference. Inference coupling can be an important factor in data cleaning. An example showing the logic behind using basic pattern matching and statistics for inference coupling is a raw manhole for the New York City manhole event process to determine which cable falls into which manhole. The main cable record is integrated into the data. The main cable connects two manholes (as opposed to lead-in or streetlight cables that enter only one manhole). The cable data can come from the utility's accounting department, which is different from the source of the manhole location data. A raw manhole-to-cable combination (based on a unique manhole identifier that is a combination of three fields, manhole type, number, and local 3 block code) matches only about half of the cable record. The first corrections made to the cable data include spelling normalization and finding matches to adjacent 3 block codes (adjacent 3 block codes are often incorrectly entered into the boundary manhole) It is. In the next round of modification, the fact that the main cable has a limited length is used: only one of the two ends of the cable is uniquely matched to one manhole and is possible with respect to the other end In the presence of several characteristic manholes, the closest manhole is selected (the shortest possible cable length). This process results in approximately three-quarters of the cable record match. However, the cable length histogram shows that about 5% of these combined records represent cables that are too long to be real. These cables can be used to troubleshoot the coupling again. Statistics generally can help find data pockets that are not properly combined with other relevant data.
データは、静的(ケーブル数、接続性等のネットワークのトポロジーを表す)、半動的(時折、またはセクションが除去または交換される際に位相的に−ほぼ永久的)、および動的(リアルタイムで、タイムスタンプを有する)となり得る。動的データは、電子的に測定可能である(例えば、フィーダ負荷測定)、あるいは、故障が生じた際に測定可能である(例えばトラブルチケット)。半動的および動的データに関しては、機械学習の特徴およびラベルとして、集約の時間尺度を選択することができる。データは、構造化テキストまたはカテゴリーデータ、数値データ、または非構造化テキスト文書でもよい。 Data can be static (representing network topology such as cable count, connectivity, etc.), semi-dynamic (sometimes, or topologically-permanently when sections are removed or replaced), and dynamic (real-time) And have a time stamp). The dynamic data can be measured electronically (eg, feeder load measurement) or can be measured when a failure occurs (eg, trouble ticket). For semi-dynamic and dynamic data, aggregate time scales can be selected as machine learning features and labels. The data may be structured text or category data, numeric data, or unstructured text documents.
上記4つのアプリケーション全てに関して、機械学習モデルの形成、トレーニング、および過去のデータに対する相互検証を行うことができ、機械学習モデルは、例えば、順位付けまたはMTBF測定を用いたより最近のデータに対する「ブラインドテスト」を用いて、評価エンジンにおいて評価され得る。機械学習のための特徴およびラベルの形成と、機械学習アルゴリズムとを以下に説明する。 For all four applications, machine learning models can be formed, trained, and cross-validated against past data, which can be used, for example, by “blind testing” on more recent data using ranking or MTBF measurements. Can be evaluated in the evaluation engine. The formation of features and labels for machine learning and machine learning algorithms are described below.
評価エンジンにより、最初の処理に対する変更が生じることが多い。これらの修正は、順位付け問題にとって重要となり得る。リストの一番上が最も重要である場合が多い順位付け問題では、リストの一番上が、間違った、または不完全なデータ処理によって生じた異常値で完全に占められる可能性があり、従って、リスト全体が完全に無用である。これは、推論結合に雑音が多い場合に特に起こり、フィーダが2〜3の余分な故障事象に間違って関連付けられると、このフィーダが特に損傷を受けやすいかのように見える。その一方で、順位付けが行われたリストの一番上の構成要素の事例研究を行うことにより、この種の異常値のトラブルシューティングを行うことが可能である。 The evaluation engine often causes changes to the initial processing. These modifications can be important for ranking issues. In ranking problems where the top of the list is often the most important, the top of the list can be completely occupied by outliers caused by incorrect or incomplete data processing, and therefore The entire list is completely useless. This occurs especially when the inference coupling is noisy, and it appears as if the feeder is particularly susceptible to damage if the feeder is incorrectly associated with a few extra failure events. On the other hand, it is possible to troubleshoot this kind of outlier by conducting a case study of the top component of the ordered list.
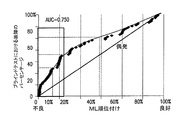
順位付けアルゴリズムに関しては、通常、順位統計を用いて評価が行われ、順位付けが行われたリストは、例えばROC(受信者動作特性)曲線として視覚化することができる。サンプルの評価測定基準には、以下のものが含まれ得る:
・トップk%の成功割合:順位付けが行われたリストのトップk%以内で故障した構成要素の割合。
・AUCまたは重み付きAUC:ROC曲線の下の領域、または以下に定式化するWilcoxon Mann Whitney U統計。AUCは、リスト内の誤って順位付けられたペアの合計に関連付けられる。重み付きAUC測定基準(例えば、以下に説明するP−Norm Pushアルゴリズムに使用)は、リストの一番上が最も重要である場合により有用である。
With respect to ranking algorithms, evaluation is usually performed using rank statistics, and the ranked list can be visualized, for example, as a ROC (Receiver Operating Characteristic) curve. Sample evaluation metrics may include the following:
Top k% success rate: The percentage of components that failed within the top k% of the ordered list.
AUC or weighted AUC: the area under the ROC curve, or the Wilcoxon Mann Whitney U statistic formulated below. The AUC is associated with the sum of misranked pairs in the list. A weighted AUC metric (eg, used for the P-Norm Push algorithm described below) is more useful when the top of the list is most important.
MTBFおよびMTTFは、直接的に評価を行うことが可能である。 MTBF and MTTF can be evaluated directly.
希事象予測フレームワークにおける順位付けのための機械学習方法
機械学習における順位付けのサブフィールドは、情報検索(IR)団体がこれらの方法の開発および使用を大規模に開始したので、ここ数年の間に急速に拡大した(LETORウェブサイトおよびそこの参考文献を参照)。「順位学習」(“Learning to Rank”)は、最近では、機械学習におけるYahoo!の主要な科学的挑戦の1つであると見なされている。順位付けアルゴリズムは、情報検索の域を越える適用に簡単に用いることが可能であり、我々の興味は、配電網の構成要素の順位付けを行うために、順位付けアルゴリズムを開発および適用することにある。IRにおいては、その目標は、所与のクエリーに対する関連度の順に一連の文書の順位付けを行うことである。電気構成要素の順位付けおよびIRの両方に関して、リストの一番上は、最も重要であると考えられる。
Machine Learning Methods for Ranking in the Rare Event Prediction Framework The ranking subfield in machine learning has been around for the past few years as information retrieval (IR) organizations have started to develop and use these methods on a large scale. It expanded rapidly (see LETOR website and references there). "Rank learning" ( "Learning to Rank") is, in recent years, Yahoo! in machine learning Is considered one of the major scientific challenges. Ranking algorithms can be easily used in applications beyond information retrieval, and our interest is in developing and applying ranking algorithms to rank distribution network components. is there. In IR, the goal is to rank a series of documents in order of relevance to a given query. With regard to both electrical component ranking and IR, the top of the list is considered the most important.
ここで考える順位付け問題は、教師あり学習(“supervised learning”)問題の一般カテゴリーに該当する。教師あり学習では、その目的は、所与のデータ集合(「トレーニング集合」と呼ばれる)から関数fを構築することである。トレーニング集合は、未知の確率分布からランダムに抜き出されたものであると仮定することができ、各々が特徴(すなわち属性)のベクトルおよびラベル(すなわち所望の出力)によって表される一連のオブジェクトから成る。その目的は、同じ分布から抜き出された新しいオブジェクトのラベルを予測する関数を構築することである。所与の学習問題に関して、損失関数R(f、データ)またはその関数に関する品質測定基準を定義することができる。この品質測定基準は、その目的に応じて、誤順位付け損失、回帰損失(MTBFで使用)、誤分類損失等であり得る。例えば、関数fは、「経験的リスク最小化」を用いて構築される場合が多く、fは、トレーニング集合に関してRを最適化することによって選択される:

高次元でのオーバーフィッティングを避けるために、関数Fのクラスは、特徴の線形結合の集合である。 To avoid overfitting in high dimensions, the class of function F is a set of linear combinations of features.
このアルゴリズムは、評価基準R(f、トレーニングデータ)のみを最適化するので、これらのモデルは、2つの目的を兼ねてはいない。順位付けモデルは、必ずしも、MTBF基準に対して評価された時のMTBF予測と同程度に正確とはならない(逆もまた同様)。以下では、バッチ型教師あり順位付け(batch supervised ranking)のための機械学習アルゴリズムおよび評価基準を開示する。フィーダ故障の順位付け、ケーブル、ジョイント、およびハンマーヘッドの順位付け、およびマンホール事象の順位付けを、バッチ型教師あり機械学習アルゴリズムを用いて構築することができる。 Since this algorithm only optimizes the evaluation criterion R (f, training data), these models do not serve two purposes. The ranking model is not necessarily as accurate as the MTBF prediction when evaluated against the MTBF criterion (and vice versa). The following discloses machine learning algorithms and evaluation criteria for batch-type supervised ranking. Feeder fault ranking, cable, joint, and hammerhead ranking, and manhole event ranking can be constructed using a batch supervised machine learning algorithm.
機械学習アルゴリズムの具体的な選択は、必ずしも、この分野における成功の主要素ではなく、むしろ、成功への鍵は、上記の通り、データクリーニングおよび処理であり得ることに注意する必要がある。機械学習の特徴およびラベルが上手く構築されていれば、妥当なアルゴリズムであれば十分に機能する。その逆もまた適用でき、下手に構築された特徴およびラベルでは、アルゴリズムの選択とは無関係に、有用なモデルを生み出すことはない。 It should be noted that the specific choice of machine learning algorithm is not necessarily the main element of success in this field, but rather the key to success can be data cleaning and processing as described above. If machine learning features and labels are well constructed, a reasonable algorithm will work well. The converse is also applicable, and poorly constructed features and labels will not produce useful models, regardless of algorithm choices.
教師ありバイパータイト順位付けタスクにおいては、その目的は、ある特定の属性を処理する確率に従ってランダムに抜き出された例集合の順位付けを行うことである。同じ(未知の)分布から抜き出されたトレーニング集合からスコア関数を構築する。形式上、トレーニング集合は、ラベルを有する例から成る:
ここでは、各例は、特徴値のベクトルによって特徴付けられる:
この場合、これらの例は、電気構成要素であり、予測を行いたい属性は、ある一定期間内に故障が生じるか否かである。特徴は、構成要素の過去の実績や製造業者等を符号化する。例えば、xは、ハンマーヘッドであり、そのハンマーヘッドが10年未満のものであれば、hj(x)は1であり、そうでなければ、hj(x)は0である。スコア関数は、特徴の線形結合となるように選択される:
順位付けタスクの目的は、例が抜き出された全(未知)分布に対して計算される、順位付けが行われたリストの統計を最小にすることである。この未知の分布は、特徴値(例えば、可能なハンマーヘッドのクラス)に関する可能性の完全集合を表す。可能な目的の1つは、ランダムに選択された新しい例ペアが誤って順位付けられる確率を最小限に抑えることである:
PDの表記は、X×{−1,+1}の分布Dからの(x+,y+)および(x−,y−)のランダムな抜き出しに対する確率を表す。例えばこれは、故障を起こさなかったハンマーヘッドが、故障を起こしたハンマーヘッドよりも影響を受けやすいと誤って順位付けられる確率である。分布Dは未知であるので、トレーニング集合に対して誤順位付けエラーを最小限に抑えるリスク最小化を用いて、スコア関数を構築することができ、これは、その解が全分布に対する一般化を行うことを期待したものである。確率的一般化の限界を用いて、理論上、この種の手法を正当化する。(1)に対応する経験的リスクは、トレーニング集合内の誤って順位付けられたペアの数である:
ペアワイズの誤順位付けエラーは、ROC曲線の下の領域(の負)、または同等に、Wilcoxon−Mann−Whitney U統計に直接関連し、その唯一の違いは、上記の定義において、同順位が誤順位付けとしてカウントされることである。自然アルゴリズムは、スコア関数としてのλに対してR1のミニマイザ(minimizer)を用いる。 Pairwise misranking errors are directly related to the Wilcoxon-Mann-Whitney U statistic in the area under (or negatively) the ROC curve, or equivalently, the only difference being that It is counted as a ranking. The natural algorithm uses a R 1 minimizer for λ as the score function.
このアルゴリズムに対して3つの潜在的欠点が存在する:第1に、これが直接的にR1(fλ)を最小化することが困難なNPであることである。第2に、誤順位付けエラーR1(fλ)は、故障予測問題において、リストの一番上の誤順位付けがより重要であると考えられるべきであることが明白であるにもかかわらず、リストの一番上の誤順位付けが、下に向かう誤順位付けと同等にカウントされるという意味で、全ての誤順位付けを同等に考える。第3の欠点は、高次元での一般化(予測能力)を可能にするために通常課される正則化の欠如である。これらの問題全てに対する救済策は、上記トラップのいずれにも陥らない、順位付けを目的とする以下の一般的定式化の特殊ケースを用いることである:
式中、gは、価格関数と呼ばれ、lは、損失関数と呼ばれる。R1(fλ)は、l(z)=1z≦0およびg(z)=zであるRl(fλ)の特殊ケースである。あるいは、その目的は、指数関数的損失l(z)=e−z、またはSVM(サポートベクトルマシン)ヒンジ損失l(z)=(1−z)+が使用される際のλにおける凸であり、他の幾つかの凸損失関数も使用することができる。正則化項に使用されるノルムは、一般的に、最も簡単なケースでは
In the equation, g is called a price function and l is called a loss function. R 1 (fλ) is a special case of Rl (fλ) where l (z) = 1 z ≦ 0 and g (z) = z. Alternatively, the objective is a convex at λ when an exponential loss l (z) = e −z , or SVM (support vector machine) hinge loss l (z) = (1−z) + is used. Several other convex loss functions can also be used. The norm used for the regularization term is generally the simplest case.
目的(2)の特殊ケースは、ヒンジ損失、価格関数としてg(z)=z、および再生核ヒルベルト空間正則化を使用するSVM Rank、指数関数的損失は使用するが、正則化は使用しないRankBoost、およびP−Norm Pushである。P−Norm Pushは、価格関数g(z)=zpを用い、これは、pが大きい場合に、目的の値が最も高く順位付けられた負例によって主に決定されることを強制し、指数pは、ソフト最大値として機能する。目的の「指数」のほとんどがリストの上部にあるので、アルゴリズムは、上部により集中する。完全なP−Norm Pushアルゴリズムは、以下である:
ベクトルλ*は、例えば傾斜降下により、計算を行うことが難しくはない。テスト集合では、スコアは、
ある実施形態では、分析中の構成要素がマンホールである場合に、P−Norm Pushが使用される(例えば、マンホール事象予測ツールとして)。別の実施形態として、L2正則化を用いたSVMアルゴリズムは、フィーダ故障ツールとして、すなわち、分析中の構成要素がフィーダである場合に、使用することができる。 In one embodiment, P-Norm Push is used when the component under analysis is a manhole (eg, as a manhole event prediction tool). Another embodiment, SVM algorithm using L 2 regularization as a feeder fault tool, i.e., when components in the analysis is the feeder, can be used.
バッチ型教師あり順位付け方法の場合は、希事象予測フレームワークにおいて故障予測が行われ、これは、その目的が、ある一定「予測間隔」内の事象を、その間隔以前のデータを用いて予測することであることを意味する。予測間隔の選択は、機械学習問題のラベルを決定する。具体的には、構成要素iが予測間隔中に故障した場合には、yiは+1であり、そうでない場合は、−1である。特徴は、予測間隔以前の期間から得られる。 In the case of the batch type supervised ranking method, failure prediction is performed in the rare event prediction framework, and the purpose is to predict events within a certain “prediction interval” using data before the interval. It means to be. The selection of the prediction interval determines the label of the machine learning problem. Specifically, y i is +1 if component i fails during the prediction interval, and -1 otherwise. The feature is obtained from a period before the prediction interval.
例えば、図6に示されるように、2010年に関する脆弱性について構成要素の順位付けを行うことが目的である場合は、2009年より前に得られた特徴および2009年から得られたラベルに対してモデルのトレーニングが行われる。テスト用の特徴は、2010年以前のデータから得られる。予測間隔長さの選択は、アプリケーションに依存し、間隔が小さすぎれば、予測は非常に難しくなり得る。長さが大きすぎると、有用となるには予測が粗くなりすぎる場合がある。ニューヨーク市のマンホール事象予測の場合、図6に示されるように、選択されたこの期間は1年であるが、当業者が追加の期間を選択することは可能である。 For example, as shown in FIG. 6, if the objective is to rank the components for 2010-related vulnerabilities, features obtained prior to 2009 and labels obtained from 2009 Model training. Test features are obtained from pre-2010 data. The selection of the prediction interval length depends on the application, and if the interval is too small, the prediction can be very difficult. If the length is too large, the prediction may be too coarse to be useful. In the case of New York City manhole event prediction, as shown in FIG. 6, this selected period is one year, but one of ordinary skill in the art can select additional periods.
マンホール事象予測のために、図6の方法を用いて時間集約を行う。フィーダ故障の順位付けに関連して、「時間シフトされた」特徴が用いられる、より複雑な時間集約スキームを説明する。これらの原理は、マンホールの順位付けを含む本明細書に記載の他の全てのアプリケーションに対して同等に適用される。 For manhole event prediction, time aggregation is performed using the method of FIG. A more complex time aggregation scheme is described in which “time shifted” features are used in connection with feeder failure ranking. These principles apply equally to all other applications described herein, including manhole ranking.
MTBFは、故障率によって非直接的に推定することができ、故障率は、予測された率の逆数を取得することによってMTBFに変換される。故障のない良好なフィーダは、無限のMTBFを有するという数値的理由から、MTBFではなく、故障率が推定される。故障率は、回帰アルゴリズム、例えば、SVM−R(サポートベクトルマシン回帰)、CART(分類回帰ツリー)、ランダムフォレスト(Rondom Forest)等のアンサンブルに基づく技術、および例えばコックス比例ハザード(Cox Proportional Hazard)の統計的手法による推定が可能である。 The MTBF can be estimated indirectly by the failure rate, and the failure rate is converted to MTBF by obtaining the reciprocal of the predicted rate. A good feeder without failure has an estimated failure rate, not MTBF, for the numerical reason that it has infinite MTBF. Failure rates can be calculated using regression algorithms such as SVM-R (Support Vector Machine Regression), CART (Classified Regression Tree), Ensemble-based techniques such as Random Forest, and Cox Proportional Hazard, for example. Estimation by statistical methods is possible.
具体的プロセスおよび課題
各電気信頼性タスクに固有のデータ処理および機械学習課題に対処するように、一般的プロセスを適応させることができる。ある具体的な非限定的実施形態による、フィーダの順位付けの課題およびCon Edisonのために開発されたフィーダ故障の順位付けプロセス(「Outage Derived Data Sets−ODDS」(「停電導出データセット」)とも呼ばれる)の詳細を開示する。次に、別の実施形態例として、ケーブル、ジョイント、およびハンマーヘッドに関するデータ処理課題を開示する。マンホール事象予測プロセスを次に開示し、最後に、他の具体的な非限定的実施形態として、MTBF推定プロセスを開示する。
Specific Processes and Challenges General processes can be adapted to address data processing and machine learning challenges specific to each electrical reliability task. According to certain specific non-limiting embodiments, the feeder ranking issue and the feeder failure ranking process developed for Con Edison ("Outage Derived Data Sets-ODDS") Details). Next, as another example embodiment, a data processing problem regarding a cable, a joint, and a hammer head is disclosed. The manhole event prediction process will now be disclosed, and finally, as another specific non-limiting embodiment, the MTBF estimation process will be disclosed.
フィーダ故障の順位付け
フィーダ順位付けタスクの場合、ある特定の実施形態においては、フィーダを構成する基本的構成要素の特性、電気負荷流動シミュレーションから得られた電気的特性、およびフィーダに取り付けられたリアルタイムテレメトリからの動的データを含む、フィーダの物理的特性から特徴を得ることができる。一部の追加的特徴は、分野の専門家によって開発された公式から計算することができる。
Ranking feeder faults For feeder ranking tasks, in certain embodiments, the characteristics of the basic components that make up the feeder, the electrical characteristics obtained from the electrical load flow simulation, and the real-time attached to the feeder Features can be derived from the physical properties of the feeder, including dynamic data from telemetry. Some additional features can be calculated from formulas developed by field experts.
フィーダの物理的組成に関するCon Edisonのデータは、雑音が多い場合があり、データベース入力のエラーや、あるフィーダから別のフィーダへの構成要素の再配線により、システムの現状の完全なスナップショットを得ることが困難となり得る。さらに、構成要素の集約を処理する必要があり、典型的なフィーダは、100を超えるケーブルセクション(同様の数のジョイントによって接続されている)から構成され、数十の変圧器で終結している。単一のフィーダに関しては、これらの下位構成要素は、様々な種類および年齢の寄せ集めとなり得、例えば、新品のケーブルセクションが、何十年もたったケーブルセクションに接続される場合がある。この「ロールアップ」問題を解決するために、最大値、平均値、90パーセンタイル(最大値に類似するが異常値は回避する)、および電気的特性(例えば、様々なネットワーク状態の下で、フィーダによってどのくらいの電流搬送が見込まれるか)を調べることを含む、多くの手法を採用することができる。電気的特性は、それらを生成する電気負荷流動シミュレーションが所与のシステムモデルの正確さに依存するので、不明確である。 Con Edison's data on the feeder's physical composition can be noisy and provides a complete snapshot of the current state of the system due to database entry errors and rewiring of components from one feeder to another Can be difficult. In addition, component aggregation needs to be handled, and a typical feeder consists of over 100 cable sections (connected by a similar number of joints) and ends with dozens of transformers. . For a single feeder, these subcomponents can be a collection of various types and ages, for example, a new cable section may be connected to a cable section that has been decades old. To solve this “roll-up” problem, the maximum, average, 90th percentile (similar to maximum but avoids outliers), and electrical characteristics (eg, under various network conditions, the feeder Many approaches can be employed, including examining how much current transfer is expected by The electrical characteristics are unclear because the electrical load flow simulations that generate them depend on the accuracy of a given system model.
動的データは、物理的データと同様の問題を提示するが、この場合の課題は、空間に代わり、時間の集約となり得る。テレメトリデータは、毎秒数百回(電力品質データの場合)から1日に2〜3回のみの測定(気象データ)まで様々に異なる率で収集される。これらは、再び最大値または平均値等の関数を用いて、異なる時間窓を使用して、経時的に集約されてもよい。一部の時間窓は、比較的単純なものであるが(例えば、15または45日間に亘って集約)、他の時間窓は、システムの周期性を利用して(図7を参照)、最新のデータに加えて、前年またはここ数年の同じ時期からのデータに亘って集約を行う。 Dynamic data presents similar problems as physical data, but the challenge in this case can be time aggregation instead of space. Telemetry data is collected at different rates, from hundreds of times per second (for power quality data) to only 2-3 measurements per day (meteorological data). These may be aggregated over time using different time windows, again using functions such as maximum or average values. Some time windows are relatively simple (eg, aggregated over 15 or 45 days), while other time windows take advantage of the periodicity of the system (see FIG. 7) and are current In addition to the above data, aggregation is performed over the data from the same period of the previous year or the past several years.
フィーダの順位付けアプリケーションの課題の1つは、不均衡なデータ/故障クラスを特徴付けるデータの不足により、一般化に問題が生じ得ることである。具体的には、主要配電フィーダは、様々な種類の故障を起こしやすく、各種類の事象に関してトレーニング例がほとんどない場合があり、それによって、統計的規則性を確実に抽出すること、または信頼性に影響を与える特徴を決定することが困難となる。例えば故障は、自動変電所継電器(Open AutoまたはOA)、例えば保全または検査のためのネットワーク内の他のフィーダのシャットダウン、経年劣化、電力品質事象(例えばスパイク)、過負荷(季節的変動があり、夏の熱波は特に問題となる)、既知の壊れやすい構成要素(例えばPILCケーブルおよび他のセクションにPILCを接続するジョイント)、危険な状態にあるトポロジー(カスケード故障が生じ得る場所)、出来栄えの問題、「HiPot」(高電位)テストのストレス、および「初期故障」と呼ばれる、短期間の内に複数の故障をもたらし得るフィーダの電源停止/再通電によって引き起こされる非常遮断によるものの場合がある。他のデータ不足問題は、フィーダの寿命の幅によって引き起こされる:一部のフィーダは、比較的新しく、非常に長期間(例えば5年を超えて)存続するが、他のフィーダは、短命(2〜3日以内の間隔での故障)の場合がある。さらに、まれな季節的影響(夏の高温等)が、フィーダの故障率に影響を与え得る。従って、一般化を難しくする、トレーニングデータにおける相当な不均衡が存在する。これらの潜在的な問題に対する解決法を以下に説明する。 One of the challenges of feeder ranking applications is that the lack of data characterizing unbalanced data / fault classes can cause problems with generalization. Specifically, the main distribution feeders are prone to various types of failures and there may be few training examples for each type of event, thereby ensuring that statistical regularity is extracted or reliable. It is difficult to determine the features that affect For example, faults include automatic substation relays (Open Auto or OA), eg shutdown of other feeders in the network for maintenance or inspection, aging, power quality events (eg spikes), overload (seasonal variations , Summer heat waves are particularly problematic), known fragile components (eg PILC cables and joints connecting PILC to other sections), dangerous topologies (where cascade failures can occur), workmanship May be due to the stress of "HiPot" (high potential) test stress, and an emergency shutdown called "early failure" caused by a power outage / re-energization of the feeder that can lead to multiple failures within a short period of time . Another data shortage problem is caused by the breadth of feeder life: some feeders are relatively new and live for a very long time (eg, over 5 years), while others are short-lived (2 Failure at intervals of ~ 3 days). In addition, rare seasonal effects (such as summer high temperatures) can affect feeder failure rates. There is therefore a considerable imbalance in the training data that makes generalization difficult. Solutions to these potential problems are described below.
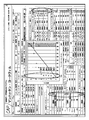
ある特定の実施形態では、センサによって検出された何らかの不良により、緊急変電所継電器によってフィーダ全体が自動的に接続を遮断されるという、最も深刻な故障の種類に着目する。データ集合を生成するための現在開示のシステムは、まれな正例(フィーダ故障)を用いた学習という課題に対処することができる。実際のフィーダ故障事故は瞬間的なものであり、その瞬間のシステムのスナップショットは、たった1つの故障例を有する。データのバランスをより良くするために、図6に示される希事象予測手順を用いて、ある時間窓の間に故障を経験した例を正としてラベル付けすることができる。しかしながら、これらの例に関する動的な特徴は、予測期間前の時間枠から構築され、従って、故障時の正確な状態を表すものではない。このことは、動的データの一部が故障直前の期間の予測値のみを有し得るので、問題となり得る。この問題を解決するために、時間シフトされた正例への切り替えが可能で、正例は、故障が発生した直前に捕捉された動的特徴を用いて、予測期間内の過去の停電から作成される。これにより、モデルが故障の短期前兆を捕捉することが可能となる。非故障(負例)のクラスは、システム内の全てのフィーダの現在のスナップショットの特性を用いて計算することができる。本明細書においてOutage Derived Data Setを表す「ODDS」と称されるこの手法は、故障の直前の動的データを捕捉するだけでなく、故障データにおいて自然に生じる正例および負例間の大きな不均衡を低減する一助となる。図7は、この特定の実施形態による、モデルのトレーニングおよびテストに用いられる期間の一例を示す。 In one particular embodiment, we focus on the most serious type of failure where the emergency feeder substation relay automatically disconnects the entire feeder due to some failure detected by the sensor. The presently disclosed system for generating data sets can address the challenge of learning with a rare positive example (feeder failure). An actual feeder failure accident is instantaneous and a snapshot of the system at that moment has only one failure example. To better balance the data, the rare event prediction procedure shown in FIG. 6 can be used to label an example that experienced a failure during a time window as positive. However, the dynamic features for these examples are built from the time frame before the prediction period and thus do not represent the exact state at the time of failure. This can be problematic because some of the dynamic data can only have a predicted value for the period immediately before the failure. To solve this problem, it is possible to switch to a time-shifted positive example, which is created from past power outages within the forecast period using dynamic features captured just before the failure occurred. Is done. This allows the model to capture a short-term precursor of failure. The non-fault (negative example) class can be calculated using the current snapshot characteristics of all feeders in the system. This technique, referred to herein as “ODDS”, which represents the Outage Derived Data Set, not only captures dynamic data just before the failure, but also a large error between positive and negative cases that occur naturally in the failure data. Helps reduce balance. FIG. 7 shows an example of time periods used for model training and testing, according to this particular embodiment.
現在開示のフィーダ故障順位付けアプリケーションによって取り上げられ、対処された別の課題は、「コンセプトドリフト」(“concept drift”)であり、これは、故障パターンが時間と共にかなり急激に変化することにより、過去のデータに対して生成された機械学習モデルが現在の設備に関する未来の故障パターンを完全に表すものではない可能性があることを意味する。特徴は、使用されなくなる、または質が変化する場合がある。これの原因には、(1)構成要素に対して修理が行われた結果、未来の故障の性質が変化する、(2)現在の設備とは異なる故障特性を持つ新しい設備、(3)故障モードの季節的変動(例えば、夏のフィーダ故障の高い可能性)が含まれる。この課題に対処するために、ODDSは、現在のデータセットに対して比較的短期間で定期的に(例えば4時間ごとに)、新しいモデルを学習する。 Taken up by the current disclosure feeder fault ranking applications, another problem that is addressed is the "concept drift" ( "concept drift"), which, by a failure pattern changes considerably rapidly with time, past This means that the machine learning model generated for this data may not fully represent the future failure pattern for the current facility. The feature may become obsolete or change in quality. The reasons for this are (1) the nature of the future failure will change as a result of repairs to the components, (2) new equipment with different failure characteristics from the current equipment, (3) failure Seasonal variations in mode (eg, high likelihood of summer feeder failure) are included. To address this challenge, ODDS learns new models for the current data set on a regular basis in a relatively short period of time (eg every 4 hours).
この特定の実施形態によるシステム全体の図を図8に示す。数多くの経営管理アプリケーションにおいて、出力データレポジトリ(Output Data Repository)内のデータを使用して、グラフィック表示およびマップオーバーレイを用いて、リスク領域を強調することができる。 A diagram of the overall system according to this particular embodiment is shown in FIG. In many business management applications, the data in the Output Data Repository can be used to highlight risk areas using graphical displays and map overlays.
多くの実生活での適用などの場合、アプリケーションは欠測データの問題に直面し得る。平均値代入(mean−imputation)等の技術を用いて、欠測値を補完することができる。 For many real-life applications, applications can face missing data problems. Missing values can be supplemented using techniques such as mean-imputation.
ケーブル、ジョイント、ターミネータ、および変圧器データの処理
フィーダ構成要素の順位付けの構築に関する主要課題は、フィーダに関する順位付けの構築の際に直面する主要課題である、これまでの企業データの使用およびデータの不均衡問題と多少重複する。
Cable, Joint, Terminator, and Transformer Data Processing The key challenge for building feeder component rankings is the main challenge faced when building rankings for feeders. It overlaps somewhat with the problem of imbalance.
理想的には、各構成要素の特徴と、故障時にそれが経験していた接続性、環境的、および動作的状況との一貫性のある完全な集合を組み立てることができるべきである。入手可能なデータを用いて、これらの状況を正確に再び作り出すことは不可能な場合がある。Con Edisonでは、ケーブル、ジョイント、およびターミネータの順位付けに使用されるケーブルデータは、「ビジョンマッピング」(“Vision Mapping”)システム内に存在し、システム内のケーブルの現在のレイアウトのみを表すように設計されたものであり、過去の特定の時期のレイアウトを提供するために設計されたものではなかった。データアーカイブの試みが開始され、これは、公益事業者により入手可能となるケーブルデータ、例えばCon Edisonのネットワーク信頼性指標プログラムのために捕捉されたケーブルデータの他のスナップショットに依存するものでもあった。 Ideally, it should be possible to assemble a complete set that is consistent with the characteristics of each component and the connectivity, environmental, and operational conditions it experienced at the time of failure. It may not be possible to accurately recreate these situations using available data. In Con Edison, the cable data used to rank cables, joints, and terminators is present in the “ Vision Mapping” system and represents only the current layout of the cables in the system. It was designed and not designed to provide a layout for a specific period in the past. A data archiving attempt was initiated, which also relied on other snapshots of cable data made available by the utility, such as cable data captured for the Con Edison network reliability indicator program. It was.
ニューヨーク市のジョイントに関するトレーニングデータの生成は、特に難易度が高いものであった。ジョイントは、フィーダ内で最も弱いリンクであり、熱に弱い特定のジョイントタイプは、熱波の期間に故障率が加速する。Con Edisonは、CAJACと呼ばれるフィーダ構成要素の故障に関するデータベースを保持する。これは、ジョイントの故障データを詳細にキャプチャする。Con Edisonは、故障した構成要素の原因究明を行い、発見した故障理由は、このデータベースにキャプチャされる。ジョイント故障データは詳細に記録されるが、送電系統内に設置された一連のジョイントの完全なリストが存在しない場合がある。この一連の設置ジョイントは、主にケーブル間の接続から補完される必要がある。さらに、マンホールにおいて接続を行うために使用される、インサートと呼ばれる短い長さのケーブルは、ビジョンマッピングシステムにおいては捕捉されないので、一般的に言って、いずれのマンホールにおいてもジョイントの数のみが推定され得る。また、非常に古いジョイントの場合は、ジョイントの性質(ジョイントの種類、製造業者等)は、設置年月日から推論されなければならなかった。これは、設置年月日において実施されていた方針がそのジョイントに用いられたと仮定することによって行うことができ、これにより、我々が製造業者および使用された技術を推論することが可能となる。 The generation of training data for New York City joints was particularly challenging. The joint is the weakest link in the feeder, and certain joint types that are sensitive to heat accelerate the failure rate during the heat wave. Con Edison maintains a database of feeder component failures called CAJAC. This captures the joint failure data in detail. Con Edison investigates the cause of the failed component, and the found failure reason is captured in this database. Although joint failure data is recorded in detail, there may not be a complete list of a series of joints installed in the transmission system. This series of installation joints needs to be supplemented mainly by the connection between the cables. In addition, short length cables called inserts used to make connections in manholes are not captured in vision mapping systems, so generally speaking, only the number of joints is estimated in any manhole. obtain. For very old joints, the nature of the joint (joint type, manufacturer, etc.) had to be inferred from the date of installation. This can be done by assuming that the policy implemented at the date of installation was used for the joint, which allows us to infer the manufacturer and the technology used.
推論結合を用いて、幾つかのデータソースを統合し、Con Edisonの経理課からのデータ、検査記録データベース、および溶解ガスデータベースを含む変圧器データベースを作成した。変圧器の順位付けは、幾つかの意味的課題を持つ。多数の異なる変圧器の設計および製造業者が存在し、変圧器クラスのフルセットは、地方の公益事業者の専門家のみが知っており、予測的機械学習アプリケーションにおいて使用するために譲渡されることは決してない場合がある。また、変圧器の集団に対して、Con Edisonによる能動的な監視および積極的な交換(これは、故障を起こさなかった変圧器がいずれにせよ交換された場合があることを意味する)が行われ、右側打ち切り(変圧器の一生におけるある時期以降の欠測情報を意味する)につながることに留意されたい。さらに、時には、故障前に変圧器の交換が行われていたので、いつ故障が生じたかを決定することが難問であり、故障の不正確な割り当てにより、機械学習にラベルバイアスが生じることとなった。 Using inference coupling, several data sources were integrated to create a transformer database that included data from Con Edison's accounting department, a test record database, and a dissolved gas database. Transformer ranking has several semantic challenges. There are a number of different transformer designs and manufacturers, and the full set of transformer classes is known only to local utility specialists and will be transferred for use in predictive machine learning applications. May never be. In addition, Con Edison actively monitors and actively replaces a group of transformers (this means that a transformer that did not fail may have been replaced anyway). Note that this will lead to a right censorship (meaning missing information after a certain time in the lifetime of the transformer). In addition, sometimes transformers were replaced before the failure, so it was difficult to determine when the failure occurred, and an incorrect assignment of the failure would cause a label bias in machine learning. It was.
ターミネータ等の、複数の役割を持つ、または複数種類の構成要素間のインタフェースとして機能する構成要素は、複数のデータベースを1つにまとめることによって、その構成要素に関する全状況を捕捉するという課題を提示する。ハンマーヘッド(これは、変圧器に対するケーブルのターミネータの一種である)の順位付けを行うために、接合チケットデータ、ケーブルデータ、および変圧器データ(変圧器データ自体が大きなデータベースの以前の結合から得られたものである場合)を結合したデータベースの構築を行った。 A component that has multiple roles or functions as an interface between multiple types of components, such as a terminator, presents the challenge of capturing the entire status of the components by combining multiple databases into one To do. Junction ticket data, cable data, and transformer data (transformer data itself is derived from a previous combination of large databases to rank hammerheads (this is a type of cable terminator to transformer) The database was constructed by combining (if any).
全てのデータセットが日付の記録に関して同じ様式を用いるわけではなく、一部のケースでは、日付入力は、仕事が行われた日付を表し、他のケースでは、日付は、データ入力日である。時には、時間がGMT、EDST、またはEDTで提供されたかに基づいてタイミングの混乱があり、これは、機械学習システムが完璧な予測ではあるが、間違った理由で予測を行うケースにつながる場合もある:システムは、不可避の故障結果を検出するように学習したものであるが、この場合、これらの結果は、データのタイミングの歪みにより、明らかに停電より以前に遡るものであった。 Not all datasets use the same format for date recording, in some cases the date entry represents the date on which the work was performed and in other cases the date is the data entry date. Sometimes there is a timing mess based on whether the time was provided by GMT, EDST, or EDT, which can lead to cases where the machine learning system is a perfect prediction but for the wrong reason : The system was learned to detect inevitable failure results, but in this case these results clearly dated before the power outage due to data timing distortions.
マンホール事象の順位付け
マンホール事象予測の主な課題の1つは、多くのデータソースの内のどのデータソースと、これらのソース内のどのフィールドとを信頼すべきかを決定することであった。マンホール事象予測プロセスに使用されるデータには、インフラに関する情報、すなわち、マンホールの場所や情報の表、およびCon Edisonの経理課からの最近のケーブルデータのスナップショット(ケーブルの種類、ケーブルの両端のマンホール、設置年月日);検査者によって記入された5年間の検査報告書;および最も重要である事象データが含まれる。事象データは、幾つかの異なるソース:構造化フィールドおよび非構造化テキストの両方を含んだECS(Emergency Control Systems(緊急制御システム))のトラブルチケット、マンホール事象(ELINと呼ばれる−ELectrical INcidents)に関する構造化データの表、および感電や電圧印加設備事象(ESR/ENEと呼ばれる)に関する第3の表に由来したものであった。これらのデータは、図9に概要を示すマンホール事象予測プロセスへの入力であった。
Ranking Manhole Events One of the main challenges of manhole event prediction was to decide which data sources among many data sources and which fields in these sources should be trusted. The data used for the manhole event prediction process includes infrastructure information, including a table of manhole locations and information, and a snapshot of recent cable data from Con Edison's accounting department (cable type, cable end Manhole, date of installation); 5-year inspection report completed by the inspector; and most important event data. Event data comes from several different sources: ECS (Emergency Control Systems) trouble ticket, including both structured fields and unstructured text, structure for manhole events (called ELIN-ELECTRICAL INCIDENTS) Derived from the data table and the third table for electrical shock and voltage application equipment events (called ESR / ENE). These data were inputs to the manhole event prediction process outlined in FIG.
トラブルチケットは、非構造化テキスト文書でもよいので、学習問題用にチケットの表現を定義する必要があった。この表現により、事象の時間、場所、および性質(深刻度)に関する情報を符号化することができる。チケットのタイムスタンプは直接使用することができるが、場所および深刻度は、以下に記載するように、推論される(および/または学習される)必要がある。 Since the trouble ticket may be an unstructured text document, it is necessary to define a representation of the ticket for the learning problem. With this representation, information about the time, location, and nature (severity) of the event can be encoded. Ticket timestamps can be used directly, but location and severity need to be inferred (and / or learned) as described below.
事象の場所は、通りの住所(例えば、GREENWHICH通りの325番地)、チケットのテキストにタイプされた構造名(S/B153267)、および時には3つの表の構造化フィールドに含まれた構造名(チケットのフロント部、ELINまたはESR/ENE)を含む、トラブルチケットに示される場所情報の幾つかのソースを用いて推論されたものであった。全ての場所情報は、手作業でタイプされたものであり、これらのデータは、非常に雑音の多いものであり(例えば、「サービスボックス」という用語は、少なくとも38の異なる様式で書かれていた)、完全な1つの情報ソースは存在しなかった。信頼できる場所データを得るために、データの冗長性を利用した:情報抽出技術を用いて、チケットテキストから構造番号の抽出を行った(図10を参照)。次に、チケットのジオコーディングを行い、事象のおおよその場所を決定した。ジオコーディングされた住所が、チケットに名称が記された構造の近距離(200m)内に存在しなければ、その情報の廃棄を行った。残りの(2度検証を行った)一致を用いることにより、チケットと、事象に関与したマンホールとの同定を正確に行った。 The location of the event is the street address (eg, address 325 on GREENWHICH street), the structure name typed in the ticket text (S / B153267), and sometimes the structure name contained in the structured fields of three tables (tickets) Inferred using several sources of location information shown in trouble tickets, including the front part of ELI or ESR / ENE). All location information was manually typed and these data were very noisy (eg, the term “service box” was written in at least 38 different styles ), There was no complete source of information. To obtain reliable location data, data redundancy was used: structure number extraction was performed from ticket text using information extraction techniques (see FIG. 10). The tickets were then geocoded to determine the approximate location of the event. If the geocoded address does not exist within the short distance (200m) of the structure named on the ticket, the information was discarded. By using the remaining matches (verified twice), the ticket and the manhole involved in the event were accurately identified.
事象の深刻度を決定することも必要であったが、ECSトラブルチケットは、事象自体の記述を含むように設計されたものではなく、深刻度を直接符号化するための構造化フィールドは存在しないが、その一方で、チケットは、事象の性質を符号化するように設計された「トラブルの種類」のフィールドを有する(例えば、地中AC事象の「UAC」、点滅光の「FLT」等)。元来、トラブルの種類は、事象の深刻度を特徴付けるために用いられたものであり、コード「MHX」(マンホールの爆発)、「MHF」(マンホールの火災)、および「SMH」(発煙したマンホール)を用いて、深刻な事象の識別を行った。しかしながら、トラブルの種類が専門家によるチケットのラベル付けとは一致せず、深刻度を測る正しい尺度ではないことを示した研究が後に行われた。事象の深刻度をより上手く推定するために、チケットの長さ、深刻なメタデータの存在(例えば「SMOKING LIGHTLY」(「軽度の発煙」)の用語)、およびテキスト内にケーブルサイズが出現するか否か(ケーブルの交換を示す)を含むチケットのテキストから抽出された情報に基づいて、各チケットの表現を作成した。この情報抽出は、Generalized Architecture for Text Engineering「GATE」を含むテキスト処理ツールを用いて、半自動的に行った。 Although it was also necessary to determine the severity of the event, the ECS trouble ticket was not designed to contain a description of the event itself, and there is no structured field to directly encode the severity. However, the ticket has a “trouble type” field designed to encode the nature of the event (eg, “UAC” for underground AC events, “FLT” for flashing light, etc.). . Originally, the type of trouble was used to characterize the severity of the event, and the codes “MHX” (manhole explosion), “MHF” (manhole fire), and “SMH” (smoke manhole) ) Was used to identify serious events. However, a later study showed that the type of trouble was not consistent with expert ticket labeling and was not the correct measure of severity. Whether the length of the ticket, the presence of serious metadata (eg, the term “SMOKING LIGHTLY” (“light smoke”)), and the cable size appear in the text to better estimate the severity of the event A representation of each ticket was created based on information extracted from the ticket text including whether or not (indicating cable replacement). This information extraction was performed semi-automatically using a text processing tool including Generalized Architecture for Text Engineering “GATE”.
チケット表現を用いて、深刻な事象、可能性のある前兆事象、および非事象のカテゴリーにチケットを分類した。この分類は、手作業、規則に基づく方法、または一般的機械学習クラスタリング手法(k平均クラスタリング)のいずれかを用いて行った。この実施形態では、マンホール事象順位付けプロセスにおいて、チケット分類ステップおよびマンホール順位付けステップの2つの機械学習ステップが存在した。 Ticket expressions were used to categorize tickets into categories of serious events, potential precursors, and non-events. This classification was performed using either manual, rule-based methods, or general machine learning clustering techniques (k-means clustering). In this embodiment, there were two machine learning steps in the manhole event ranking process, a ticket classification step and a manhole ranking step.
早い段階で直面した課題の1つは、希事象予測フレームワークの時間枠の選択にあった。当初は、短い時間尺度(約60日)が有用な予測モデルを生み出すという分野の専門家の直観に基づいて、そのような時間尺度でマンホール事象を予測する試みを行った。しかしながら、そのような短期間ではマンホール事象を簡単に予測できないことが明らかとなり、例えば、マンホール事象が前の事象後60日以内に生じることが分かっている場合、その60日以内のいつそれが生じるかを予測することは不可能に近い。実際、マンホール事象を引き起こす絶縁破壊は、数か月または数年に亘って発生する、ゆっくりとしたプロセスとなり得る。従って、図6に示すように、機械学習のために、1年の予測期間を選択した。 One of the challenges faced early on was the selection of a rare event prediction framework timeframe. Initially, attempts were made to predict manhole events on such a time scale based on the intuition of experts in the field that a short time scale (about 60 days) would produce a useful prediction model. However, it becomes clear that manhole events cannot be easily predicted in such a short period of time, eg if it is known that a manhole event will occur within 60 days after the previous event, it will occur when within that 60 days It is almost impossible to predict. In fact, the breakdown that causes manhole events can be a slow process that occurs over months or years. Therefore, as shown in FIG. 6, a one-year prediction period was selected for machine learning.
ある(最近の)時点のスナップショットであるケーブルデータをその他のデータと一体化することによって、順位付けタスクのための「静的」特徴およびラベルの構築を行った。これは、このスナップショットが予測期間中のケーブルの数および種類を近似的に表すことを暗に仮定している。過去のある時におけるマンホール内のケーブルの正確な状態が入手可能ではない場合があるので、この仮定は必要である。しかしながら、この仮定は、普遍的事実ではなく、例えば、これは、Con Edisonの中性(非通電、接地)ケーブルに関しては当てはまらず、従って、中性ケーブルデータを故障予測に用いることはできない。 The construction of “static” features and labels for ranking tasks was done by integrating cable data, which is a snapshot of one (recent) time, with other data. This implicitly assumes that this snapshot approximately represents the number and type of cables during the forecast period. This assumption is necessary because the exact state of the cable in the manhole at some time in the past may not be available. However, this assumption is not a universal fact; for example, this is not the case for Con Edison's neutral (non-energized, grounded) cable, so neutral cable data cannot be used for failure prediction.
この実施形態では、マンホールの順位付け用の主な順位付けアルゴリズムとして、P−Norm Push(上記に開示)を使用した。 In this embodiment, P-Norm Push (disclosed above) was used as the main ranking algorithm for manhole ranking.
MTBFプロセス
先行保全に対するフィーダの仕事の価値を高めるためには、相対的(順位付け)測定ではなく、脆弱性の絶対的測定を可能にする推定も行う必要があったことが明白となり、他の無駄のない管理努力において見られるように、資産交換の決定の多くは、ある特定の選択が行われる場合(例えば、1式のPILCケーブルの交換対同じコストの別の交換)、日数の信頼性をどの程度得られるかを評価することによって行われる。ある特定の実施形態に従って、データからMTBFを分析し、統計的および機械学習モデルを用いてそれを推定するツールを次に説明する。
MTBF process It became clear that in order to increase the value of feeder work for proactive maintenance, it was also necessary to make estimates that would allow absolute measurement of vulnerability rather than relative (ranking) measurement, As can be seen in lean management efforts, many asset exchange decisions are reliable in days when certain choices are made (eg, replacement of a set of PILC cables versus another replacement at the same cost). It is done by evaluating how much can be obtained. A tool for analyzing MTBF from data and estimating it using statistical and machine learning models will now be described in accordance with certain embodiments.
信頼性工学および統計的生存率分析の分野は、モデル化を行い、故障率を構成要素またはシステムの特徴に関連付ける技術を提供する。このような技術の1つは、コックスの比例ハザードモデルである。乗法的に故障率に影響を与え得る共変量関係の研究が可能である。代替手段の1つは、共変量効果が予測された事象時間をある定数で乗算することであると仮定する加速故障時間モデルである。 The fields of reliability engineering and statistical survival analysis provide techniques for modeling and relating failure rates to component or system characteristics. One such technique is Cox's proportional hazard model. It is possible to study covariate relationships that can affect the failure rate in a multiplicative manner. One alternative is an accelerated failure time model that assumes that the covariate effect is to multiply the predicted event time by a constant.
機械学習技術を用いて、同様に共変量からMTBFを推定することができる。幾人かの研究者らは、SVM回帰において制約の順序付けを行う際に打ち切りデータを処理する能力の開発を行った。図11は、クイーンズにおけるPILCケーブルの生存時間予測に対する、これらの技術の1つの適用を示す。SVM回帰を用いて、フィーダの共変量からMTBFの推定を行った。図11は、本明細書においてその内容全体が援用される「A Support Vector Approach to Censored Targets」(Pannagadatta Shivaswamy,Wei Chu,Martin Jansche,Seventh IEEE International Conference on Data Mining(ICDM),2007,pp.655−660)において詳細に記載されるSVCR予測結果の形式である。 Similarly, MTBF can be estimated from covariates using machine learning techniques. Some researchers have developed the ability to process censored data when ordering constraints in SVM regression. FIG. 11 shows one application of these techniques to PILC cable lifetime prediction in Queens. MTBF was estimated from feeder covariates using SVM regression. 11 is “A Support Vector Approach to Censored Targets” (Panagagatatta Shiverwas, Wei Chu, Martin Jenche, Seven Int.). -660) is the format of the SVCR prediction result described in detail.
ニューヨーク市における評価
ニューヨーク市の送電網に適用された我々の特定プロセスの結果を説明する。Con Edisonは、現在、300万を超える取引先に最大14,000MWの電気を届ける世界最大の地下電気システムを稼働している。一つの取引先が、ニューヨーク市では、オフィスビルまたはアパート全体の場合があるので、最大1,500万人に電気が供給されている。Con Edisonでは、1世紀以上前に、構成要素の製造業者、年齢、および保全履歴のデータ記録の保存を開始し、Supervisory Control and Data Acquisition(SCADA)のレベル向上により、過去15年の間に精度が大きく増した。2002年より、全ての構成要素の性能統計対投資および保全コストを自動的に計測している。
Evaluation in New York City Describes the results of our specific process applied to the New York City grid. Con Edison currently operates the world's largest underground electrical system that delivers up to 14,000 MW of electricity to over 3 million customers. One business partner in New York City may be an office building or an entire apartment, so electricity is supplied to up to 15 million people. Con Edison began storing component manufacturer, age, and maintenance history data records more than a century ago, and has improved accuracy over the past 15 years by improving the level of Supervision Control and Data Acquisition (SCADA). Increased significantly. Since 2002, we have automatically measured performance statistics versus investment and maintenance costs for all components.
ニューヨーク市の電力分配システムの基幹を成す全ての1,000を超える高電圧(13〜27KV)フィーダの信頼性の順位付けを行うための、並びに、約150,000のケーブルセクションおよびそれらを接続する約150,000のジョイントの各々;約50,000の変圧器および変圧器をフィーダに結合させる約50,000のコネクタ;およびそれを用いて変圧器からの低電圧(120〜240V)電力をニューヨーク市の全ての建物に分配する約150,000の二次構造(マンホールおよびサービスボックス)用の機械学習モデルを作成した。 For ranking the reliability of all the over 1,000 high voltage (13-27 KV) feeders that form the backbone of New York City's power distribution system, as well as about 150,000 cable sections and connecting them Each of about 150,000 joints; about 50,000 transformers and about 50,000 connectors coupling the transformer to the feeder; and using it, low voltage (120-240V) power from the transformer is used in New York A machine learning model was created for about 150,000 secondary structures (manholes and service boxes) distributed to all buildings in the city.
フィーダおよび構成要素の故障評価
現在開示の機械学習モデルの性能は、故障が生じるたびに、故障したフィーダ構成要素の順位付けをチェックすることによって追跡可能である。次に、故障した構成要素(図12)および故障が生じた際に回路遮断器を自動的に開いたフィーダ(図13)の両方を示すリアルタイムROC曲線を蓄積することができる。これらのブラインドテストは、公益事業者の保全プログラムに影響を与える運用決定における使用にアルゴリズムが十分役立っているという確証を与えることができる。
Feeder and component failure assessment The performance of the presently disclosed machine learning model can be tracked by checking the ranking of the failed feeder components each time a failure occurs. A real-time ROC curve can then be accumulated showing both the failed component (FIG. 12) and the feeder that automatically opened the circuit breaker when the failure occurred (FIG. 13). These blind tests can provide assurance that the algorithms are sufficiently useful for use in operational decisions that affect utility maintenance programs.
ODDSシステムに基づいてフィーダの故障発生度を計算する現在開示の機械学習システムは、オンライン式である。故障発生度の順位付けは、幾つかの経営管理アプリケーションにおいて使用することができる。1つには、フィーダの故障発生度に対する潜在的影響を判断するために、モデルに対して、仮説的なフィーダの修理および改善の評価を行う。その後、最も有益な保全活動が運用管理センターに伝えられる。継続的に作動する別のツールが、予想される最悪の次の故障が何か、すなわち、どのような後続の故障がシステムを最大の危険にさらすかを自動的に評価する。このアプリケーションは、ODDSによる故障発生度の順位付けと共に現在増えており、これにより、次に故障する可能性が最も高いのはどのフィーダかという追加の重要な入力が与えられる。これでオペレータは、システムに対するストレスを軽減するためにどのような行動をとるかを決定する際に、推定尤度および推定重大度の両方を考慮することができる。 The currently disclosed machine learning system that calculates feeder failure occurrence based on the ODDS system is online. Fault ranking can be used in some business management applications. First, a hypothetical feeder repair and improvement assessment is performed on the model to determine the potential impact on feeder failure rates. Afterwards, the most beneficial maintenance activities are communicated to the operations management center. Another tool that operates continuously automatically evaluates what the worst possible next failure is expected, ie what subsequent failures put the system at maximum risk. This application is currently increasing with failure ranking by ODDS, which gives additional important input as to which feeder is most likely to fail next. This allows the operator to consider both the estimated likelihood and the estimated severity in determining what action to take to reduce stress on the system.
ODDS性能は、1つの新しいOA(フィーダ故障)が生じた際に、モデルからの故障発生度の順位付けを記録(4時間ごとに起動)することによって、リアルタイムでの追跡が可能である。ODDSシステムは、変圧器、セクション、ジョイント、ハンマーヘッド、およびマンホールを含む、起動中の全ての構成要素モデルからの順位付けを有する。さらに、ODDSは、負荷ポケットの重み、電力品質、および停電履歴の3つの動的リアルタイムシステムからの供給によって駆動される。27KVのネットワークを持つブルックリン、クイーンズ、13KVのネットワークを持つマンハッタンやブロンクスでの別々のトレーニングが、より良い結果を生み出したことが分かっている。 The ODDS performance can be tracked in real time by recording the order of failure occurrence from the model (started every 4 hours) when one new OA (feeder failure) occurs. The ODDS system has a ranking from all active component models, including transformers, sections, joints, hammerheads, and manholes. In addition, ODDS is driven by feeds from three dynamic real-time systems: load pocket weights, power quality, and power outage history. It has been found that separate training in Brooklyn, Queens with a 27 KV network and Manhattan and Bronx with a 13 KV network produced better results.
各区内の各ネットワークのROCのAUCを使用して、ODDSシステムの性能を測定することができる(図12)。ODDSが最も故障を起こしやすいと順位付けるフィーダの15%において故障の60%が生じるところまで、機械学習システムは向上している。同じく重要なことに、1%未満の故障が、ODDSによるフィーダの故障発生度順位付けの上位25%のフィーダに生じる(図14)。 The ROC AUC of each network in each ward can be used to measure the performance of the ODDS system (FIG. 12). Machine learning systems have improved to the point where 60% of failures occur in 15% of feeders where ODDS ranks most prone to failure. Equally important, less than 1% of failures occur in the top 25% feeders of feeder failure ranking by ODDS (FIG. 14).
MTBF評価
2002年より性能向上のために予防保全作業が行われているので、平均故障間隔の改善がネットワークごとに追跡されている。この改善が有意なものであるかをテストするために、2つのサンプルの生存分布を比較するログランク検定と呼ばれる統計的検定を用いた。この場合、2009年のネットワーク毎のその年のMTBFの線形回帰の終点が、2002年の回帰の開始点から有意に向上したか否かを決定することを意図したものであった。これは、2002年のネットワーク性能が対照群であると仮定する。その結果を図15に要約する。
MTBF Assessment Since preventive maintenance work has been carried out to improve performance since 2002, improvements in mean time between failures have been tracked on a network-by-network basis. To test whether this improvement was significant, a statistical test called the log rank test was used to compare the survival distributions of the two samples. In this case, it was intended to determine whether the end point of the linear regression of the MTBF for that year for each 2009 network was significantly improved from the start point of the 2002 regression. This assumes that the 2002 network performance is the control group. The results are summarized in FIG.
図15は、サンプル群および対照群に関するROC様曲線を示す。この曲線は、ワーストからベストまで生存時間(MTBF)のログを累積的に減算することによって得られたものである(Con Edisonの2009年の「ネットワーク信頼性指標」の順位付けにおける各ネットワークの順位付けを使用し、横軸上で、左側のワーストから右側のベストまでフィーダを配置した)。システムの性能は、2009年の夏までの期間を2002年夏の対照群と比較して、有意な改善を示した。実際、2009年の治療集団が2002年の対照集団に対して改善を示さなかった可能性は、10億に1つよりも小さい。累積パーセントのMTBF改善(点線)と2002年の対照群(実線)との開きが大きいほど、結果の有意水準が高くなる。例えば、2008年では、4590日のネットワーク日数の内、故障が生じなかったのは1468日、または夏の3日の内の1日であったが、2002年の対照群では、故障が生じなかったのは、たった908日または夏の5日の内の1日であった。故障が生じなかったネットワーク日数のパーセンテージが大きいほど、多重故障の可能性が低くなり、これによってもまた、ネットワーク信頼性指標が有意に改善される(図16)。 FIG. 15 shows ROC-like curves for the sample group and the control group. This curve was obtained by cumulatively subtracting the log of survival (MTBF) from worst to best (ranking each network in Con Edison's 2009 Network Reliability Index ranking). The feeder was placed on the horizontal axis from the worst on the left side to the best on the right side). The performance of the system showed a significant improvement compared to the summer of 2002 compared to the summer of 2002. In fact, the likelihood that the 2009 treatment population did not show improvement over the 2002 control population is less than one in a billion. The greater the difference between the cumulative percent MTBF improvement (dotted line) and the 2002 control group (solid line), the higher the significance level of the result. For example, in 2008, out of 4590 network days, the failure did not occur on 1468 days, or on one of the three summer days, whereas in the 2002 control group, no failure occurred. It was only 908 days or one of the 5 summer days. The larger the percentage of network days that have not failed, the lower the likelihood of multiple failures, which also significantly improves the network reliability index (FIG. 16).
図17は、フィーダMTBFモデルの3年の期間に亘る計画外の停電の全クラスに対する停電率の予測精度を示す。その結果は、明らかにかなり優れたものである。注目に値する研究のコンセプト:1)初期故障。この研究は、初期故障、すなわち、修理されたシステムが業務を再開した後の故障する可能性の増大をモデル化したものではなかった。経験的に、約6週間の初期故障の可能性の増大を観測した。2)打ち切りデータ。機械学習トレーニングサンプル内で事象が非常に希である場合には、それらの頻度を正確に予測するために学習システムを正確にトレーニングすることは不可能である。例えば、故障が3年間にたった1回であれば、2つの期間(データ収集の開始から事象までと、事象からデータ収集の終了まで)のどちらも、実際の事象頻度の正確な推定をもたらさない。以下に説明するCAPおよびCAPTシステムは、事象の数で割ったトレーニング期間長さに等しい事象頻度の推定を使用し、これは、図17に示されるものと比較して、より良いトレーニングデータと、結果的に、「良い」資産に対するより正確な推定とにつながる方法である。 FIG. 17 shows the prediction accuracy of the outage rate for all classes of unplanned outages over a three year period of the feeder MTBF model. The result is clearly quite good. Remarkable research concept: 1) Early failure. This study did not model the initial failure, that is, the increased likelihood of failure after the repaired system resumed operations. Empirically, we have observed an increased likelihood of early failure of about 6 weeks. 2) Censored data. If events are very rare within a machine learning training sample, it is impossible to accurately train the learning system to accurately predict their frequency. For example, if the failure is only once in 3 years, neither of the two periods (from the start of data collection to the event and from the event to the end of data collection) will give an accurate estimate of the actual event frequency. . The CAP and CAPT systems described below use an event frequency estimate that is equal to the length of the training period divided by the number of events, which results in better training data compared to that shown in FIG. The result is a method that leads to a more accurate estimate of “good” assets.
マンホール事象の順位付け評価:
マンホールの順位付けの最新の評価は、ブロンクスの2009年の事象を予測するためのブラインドテストであった。データベースは、2007年までのデータと、不完全な2008年のデータとを有し、2009年以降のデータは有していない。ブロンクスには、27,212のマンホールが存在する。ブラインドテストは、以下を示した:
・順位付けが行われたリストの最も高リスクの10%(2721/27212)が、深刻な事象を経験したマンホールの44%(8/18)を含んでおり、
・順位付けが行われたリストの最も高リスクの20%(5442/27212)が、深刻な事象のトラブルホール(trouble hole)の55%(10/18)を含んでいた。
Ranking of manhole events:
The latest assessment of manhole ranking was a blind test to predict
• 10% of the highest risk (2721/27212) in the ranked list includes 44% (8/18) of manholes that experienced serious events,
• 20% of the highest risk (5442/27212) in the ranked list included 55% (10/18) of the serious event trouble hole.
図18は、全順位付けリストのROC曲線を含む。 FIG. 18 includes the ROC curve of the full ranking list.
プロジェクトの開始前には、そもそも非常に雑音の多い二次データからマンホール事象が予測できるか否かが不明であった。これらの結果は、予測を行うためにマンホール事象をモデル化する価値が確かにあることを示している。 Before the start of the project, it was unclear whether manhole events could be predicted from very noisy secondary data. These results show that it is definitely worth modeling manhole events to make predictions.
管理ソフトウェア
結果を有用にするため、かつ、知識発見における支援を行うために、インタフェースの開発を行った。
Management software An interface was developed to make the results useful and to assist in knowledge discovery.
CAP(Contingency Analysis Program)(非常事態分析プログラム)
CAPは、主要制御センターにおいて使用されるツールである。これは、主要フィーダケーブルの停電に関連する情報を1つにまとめる。非常事態が生じると、さらなるフィーダが故障する可能性に関してネットワークを先制的にモデル化するアプリケーションが使用中となる(CAPツールに統合される)。オペレータに新しい重要な1つの情報を与えるフィーダ故障発生度指標(上記に記載)が提供され、これは、どのフィーダが次に故障する可能性が最も高いかの指標である。オペレータは、カスケードの防止に向けて労力および資源の配分を決定する助けとして、この情報を使用できる。「最悪の結果」のフィーダが、「故障の可能性が最も高い」フィーダと同一ではない場合があるので、オペレータは、必ずしも故障の可能性が最も高いフィーダに対して全資源を割り当てる選択をするとは限らないことがある。
CAP (Contingency Analysis Program) (Emergency Analysis Program)
CAP is a tool used in major control centers. This brings together information related to a power failure on the main feeder cable. In the event of an emergency, an application that preemptively models the network for possible failure of additional feeders is in use (integrated into the CAP tool). A feeder failure rate index (described above) is provided that gives the operator one new important piece of information, which is an indicator of which feeder is most likely to fail next. Operators can use this information to help determine effort and resource allocations to prevent cascading. Because the “worst outcome” feeder may not be the same as the “most likely failure” feeder, the operator will not necessarily choose to allocate all resources to the most likely failure feeder. May not be limited.
CAPT(Capital Asset Prioritization Tool)(資本資産優先順位付けツール)
CAPTは、技術者や管理者がニューヨーク市のフィーダシステムのアップグレードを計画する支援を行うための高度なメカニズムを提供するアプリケーションである。グラフィックインタフェースを用いて、ユーザは最初に、自分達が行いたい作業に関する制約を入力する。例えば、ユーザは、区またはネットワーク、1つまたは複数の特定のフィーダセクションまたはフィーダセクションの種類、割り当てられる金額等を指定することができる。次に、CAPTは、「支出に見合う価値」の最適化(費やした金額にとって最大のシステムMTBF(平均故障間隔)の増加)を目的とする、様々な交換戦略の利益対コスト曲線のグラフを生成する。
CAPT (Capital Asset Prioritization Tool) (Capital Asset Prioritization Tool)
CAPT is an application that provides an advanced mechanism for helping engineers and administrators plan upgrades in New York City feeder systems. Using the graphic interface, users first enter constraints on the work they want to do. For example, the user can specify a ward or network, one or more specific feeder sections or feeder section types, amount allocated, and the like. Next, CAPT generates graphs of profit vs. cost curves for various replacement strategies aimed at optimizing “value for money” (increasing the maximum system MTBF (mean time between failures) for the amount spent). To do.
CAPTの重要構成要素は、1)変化が生じる前の両フィーダのMTBFを推定するために使用されるSVM回帰モデル、2)全てのケーブルセクションおよびジョイントを最も高リスクから最も低リスクまで順序付けることにより、CAPTが交換の有力候補を決定することを可能にする故障発生度モデル、3)提案された改善済みフィーダのMTBFを再推定するために使用される1)と同じモデル、および3)様々な交換戦略に関する利益対コストのトレードオフ(パレート)曲線(図21)をユーザに対して図表形式で表示するシステムを含む。フィーダに関するモデルは、CAP用のもの、およびケーブル、ジョイント、およびハンマーヘッドのモデルと同じであるが、秋のプランニングのために過去の最も暑い夏の期間に対してトレーニングが行われたものである。 The key components of CAPT are: 1) SVM regression model used to estimate the MTBF of both feeders before the change occurs, 2) Order all cable sections and joints from highest risk to lowest risk A failure probability model that enables CAPT to determine potential candidates for replacement, 3) the same model used in 1) to re-estimate the MTBF of the proposed improved feeder, and 3) various A system for displaying a profit versus cost trade-off (Pareto) curve (FIG. 21) for a simple exchange strategy in a graphical format to the user. The feeder model is the same as that for the CAP and cable, joint, and hammerhead models, but trained for the hottest summer period of the past for autumn planning .
マンホール事象構造プロファイリングツールおよび視覚化ツール
分野の専門家による結果および方法の定性的評価を可能にするツールが幾つか開発されている。最も有用なツールは、ある特定の個々のマンホールに関する生および加工データの詳細な報告書を作成する「構造プロファイリングツール」(「レポートカード」ツールとも呼ばれる)であった。このツールが実施される前は、マンホールの個々の事例研究には数日がかかり、不完全な研究に終わっていた。事象、マンホール、およびケーブルの場所を表示するために、背景としてGoogle Earthを使用する視覚化ツールの開発も行った。図22は、視覚化ツールからの2つのスクリーンショットを示している。
Manhole event structure profiling tools and visualization tools Several tools have been developed that allow qualitative evaluation of results and methods by experts in the field. The most useful tool was a “structural profiling tool” (also called “report card” tool) that produces detailed reports of raw and processed data for a particular individual manhole. Prior to the implementation of this tool, individual case studies in manholes took days and resulted in incomplete studies. We also developed a visualization tool that uses Google Earth as the background to display events, manholes, and cable locations. FIG. 22 shows two screenshots from the visualization tool.
関連作業
アプリケーションには、電力安全侵害の予測、予報、電力システムの運用および制御、および電力システム外乱の分類が含まれる。別の技術を用いることにより得られる予測精度は、発見プロセスの他のステップを用いて、あるいは問題を異なって定式化することによって得られる精度と比較して小さい場合が多い。電力工学問題におけるデータは通常、我々のデータとは対照的に、生の形態での学習に適していると考えられている。本開示が電力工学文献とは明らかに異なる第2の理由は、電力工学団体によって開発された機械学習技術がニューラルネットワークおよび遺伝的アルゴリズム等の「ブラックボックス」方法である場合が多いことである。ニューラルネットワークおよび遺伝的アルゴリズムは、複数の極小値を有する目標のための発見的非凸最適化プロシージャと見なすことができ、アルゴリズムの出力は、初期状態に非常に敏感となり得る。現在開示の方法およびシステムは、この問題を回避するために、凸最適化プロシージャを用いることができる。さらに、これらの種類のアルゴリズムは通常、解釈可能/有意な解を生み出さないが(例えば、多層ニューラルネットワークの入出力関係は、通常解釈可能ではない)、本出願の実施形態は、特徴の単純な線形結合を用いることができる。
Related tasks Applications include power safety breach prediction, forecasting, power system operation and control, and power system disturbance classification. The prediction accuracy obtained by using another technique is often small compared to the accuracy obtained using other steps of the discovery process or by formulating the problem differently. Data in power engineering problems are usually considered suitable for learning in raw form, in contrast to our data. A second reason that this disclosure is clearly different from the power engineering literature is that machine learning techniques developed by the power engineering community are often “black box” methods such as neural networks and genetic algorithms. Neural networks and genetic algorithms can be viewed as heuristic non-convex optimization procedures for targets with multiple local minima, and the output of the algorithm can be very sensitive to the initial state. The presently disclosed methods and systems can use a convex optimization procedure to avoid this problem. Further, although these types of algorithms typically do not produce interpretable / significant solutions (eg, the input / output relationships of a multilayer neural network are not normally interpretable), the embodiments of the present application provide simple features Linear combinations can be used.
本開示は、高複雑度のこれまでの送電網データのマイニングを前例のない方法で行う際の課題に対処する。本開示は、モンテカルロシミュレーションを用いてデータの生成を行い、機械学習アルゴリズムを用いてシミュレーションした故障の予測を行う電力工学の作業の一部とは完全に対照をなす。ある意味では、本開示は、全発見プロセスを包含する、電子商取引、犯罪捜査、または内科患者処理等の他の分野におけるデータマイニングの課題と似ている場合がある。例えば、マンホール事象に関する本開示と、分野の専門家を使って発電機における「周波数インシデント」のラベル付けを行い、故障を正確に示す周波数信号およびラベルから機械学習モデルを構築したCornelusseらの研究との対比は興味深い。本明細書で説明したマンホール事象予測タスクもまた、分野の専門家を使って、トラブルチケットが深刻な事象を表すか否かについてトラブルチケットのラベル付けを行ったが、事象の場所を正確に示すために必要なジオコーディングおよび情報抽出に加えた、チケットのクリーニングおよび表現に必要とされる処理レベルは、チケットラベル付け機械学習タスクと機械学習順位付けタスクとの統合と相まって、後者のタスクをはるかに大きな仕事にしている。 The present disclosure addresses the challenges of mining high complexity traditional grid data in an unprecedented manner. The present disclosure is in stark contrast to some of the power engineering tasks that generate data using Monte Carlo simulations and predict simulated faults using machine learning algorithms. In a sense, the present disclosure may be similar to data mining challenges in other areas such as e-commerce, criminal investigations, or medical patient processing that encompass the entire discovery process. For example, this disclosure on manhole events and the work of Cornelius et al., Who used field experts to label “frequency incidents” in generators and built machine learning models from frequency signals and labels that accurately indicate faults The contrast is interesting. The manhole event prediction task described here also used a domain expert to label the trouble ticket as to whether the trouble ticket represents a serious event, but shows the exact location of the event. In addition to the geocoding and information extraction required for processing, the processing level required for ticket cleaning and representation, coupled with the integration of the ticket labeling machine learning task with the machine learning ranking task, Have a big job.
学んだ教訓
ニューヨーク市の送電系統に対する我々のツールの実施から「持ち帰る」メッセージが幾つかある:
Lessons Learned There are several “takeaway” messages from the implementation of our tools on the New York City transmission system:
予測は可能である。
主な電力公益事業会社によって収集されたデータに基づいた、電気構成要素の故障予測の成功が示された。最初は、知識発見およびデータマイニングの手法が電気構成要素の故障を予測できるか、ましてや、先行保全プログラムに関して分野の技術者の手助けができるかは不明であった。マンホール事象プロジェクトの成功以前は、公益事業者の技術者の多くは、マンホール事象予測を現実的な目標とは見なしていなかった。トラブルチケットデータは、簡単に放置され、Fayyadらが「データの墓」と見なしたものとなった可能性がある。この場合、その救済策は、入念な問題の定式化、高度なテキスト処理ツール、および最先端の機械学習技術から生み出された。
Prediction is possible.
Successful prediction of electrical component failure based on data collected by major utility companies was shown. Initially, it was unclear whether knowledge discovery and data mining techniques could predict failure of electrical components or even help engineers in the field with advanced maintenance programs. Prior to the success of the manhole event project, many utilities engineers did not regard manhole event prediction as a realistic goal. The trouble ticket data may have been left alone and become what Fayyad et al. Considered as a “data tomb”. In this case, the remedy came from careful problem formulation, advanced text processing tools, and state-of-the-art machine learning techniques.
データが鍵である。
電力会社は既に大量のデータを収集しているが、このデータを故障予測に使用するつもりであれば、理想的には、このデータは、特定の性質を持つはずである:第1に、いつ故障が生じたか、および故障の種類(入手可能であれば、原因も)がデータから明らかであるべきである。第2に、データは可能な限り「クリーン」であるべきであり、これは、例えば各構成要素に対して固有の識別子が使用されるべきであることを意味する。また、ある構成要素を交換する場合は、交換前に古い構成要素の特性を記録することが重要であり、そうでなければ、構成要素のどの特性が、交換が行われている構成要素の特性と共通するかを決定することができない。
Data is the key.
The power company has already collected a large amount of data, but ideally this data should have certain properties if this data is going to be used for failure prediction: First, when The failure should occur and the type of failure (and the cause, if available) should be clear from the data. Second, the data should be as “clean” as possible, which means that, for example, a unique identifier should be used for each component. Also, when replacing a component, it is important to record the characteristics of the old component prior to replacement, otherwise which characteristics of the component are the characteristics of the component being replaced. Can't decide what is common.
トラブルチケットに関しては、非構造化テキストフィールドが除外されるべきではない。構造化データの分析がより簡単であることは事実であるが、その一方で、自由形式のテキストは、ずっと信頼性がある場合がある。このことは、ウェブトランザクションデータからのトラブルチケット処理に関してDalalらによっても説明されており、彼らのケースでは、40文字の自由形式テキストフィールドは、データベース中の他のどのフィールドよりも多くの情報を含んでいた。本明細書で説明したトラブルチケットの場合、自由形式テキストに基づく現在の表現は、(構造化された)トラブルの種類コードと比較して、事象の深刻度をずっと確実に決定することが可能である。さらに、トラブルチケットに通常記録される情報の種類は、限られた数のカテゴリーには簡単に適合できず、時間的制約のある中で、オペレータにカテゴリーの選択を求めることは実用的ではない。非構造化テキストの分析が可能であり、実用的でさえあることが証明されている。 For trouble tickets, unstructured text fields should not be excluded. While it is true that the analysis of structured data is easier, free-form text can be much more reliable. This has also been explained by Dalal et al. Regarding trouble ticket processing from web transaction data, in which case the 40-character free-form text field contains more information than any other field in the database. It was out. In the case of the trouble ticket described here, the current representation based on free-form text can be compared to the (structured) trouble type code to determine the severity of the event much more reliably. is there. Furthermore, the type of information normally recorded in trouble tickets cannot easily fit into a limited number of categories, and it is impractical to ask the operator to select a category under time constraints. Analysis of unstructured text is possible and has proven to be practical.
機械学習順位付け方法は、優先順位付けに有用である。
順位付けのための機械学習方法は、情報検索を除いては、多くの適用分野で使用されていない。これまでに、配電網保全の分野において、成功への鍵は、使用される正確な機械学習方法にではなく、データの解釈および処理にあることが分かっているが、これらの新しい順位付け方法は、優先順位付け問題用に精密に設計されており、多くの適用において、これらの方法が旧来の方法に対する優位性を提供できることが可能である。さらに、データ収集がより自動化されるにつれて、処理への依存性を軽減することができ、優先順位付けのタスク用に精密に設計されたアルゴリズムの使用において、多大な利点が存在する。
The machine learning ranking method is useful for prioritization.
Machine learning methods for ranking are not used in many application areas except for information retrieval. So far, in the field of distribution network maintenance, we know that the key to success is not the exact machine learning method used, but the interpretation and processing of the data, but these new ranking methods are Designed precisely for the prioritization problem, it is possible that in many applications these methods can offer advantages over the traditional methods. Furthermore, as data collection becomes more automated, processing dependencies can be reduced, and there are tremendous advantages in using a precisely designed algorithm for the prioritization task.
反応型保全は、過剰処置をもたらす場合がある。
傾向と呼ばれる統計的手法を用いて、Con Edisonの高電位(Hipot)テストプログラムが、「患者」すなわちフィーダを過剰処置していることが証明された。Hipotは、定義上は、意図的にフィーダにストレスを加えることによって初期の不良が故障に追い込まれる点で、予防保全である。しかしながら、特に直流電流のhipotテストでは、Con Edisonによって同等に「病気」であるとのスコア付けがなされたが、それに対して何の作業も行われていない「プラシーボ」対照群をしのぐことはなかったことが分かっている(図23)。一部の過剰処置を取り消すために新しい交流電流テストが追加されたところ、このテストがCon Edisonシステムに最適であったため、性能レベルが向上し、対照群の性能レベルを後に上回ったであろうことが示された。その後、実際に対照群の性能よりも向上したので、Con Edisonの運用および配電工学は、自身が有する改良型の交流電流テストを追加した。機械学習、統計、予防保全プログラム、および分野の専門家の間のこの相互作用により、現在故障に対して主に反応型である大部分の公益事業者において、過剰処置が確認されるであろうと思われる。これは、自動車および航空宇宙、軍隊、並びに医療産業等の、自身のためにこれらの技術の開発を行ってきた産業を含む他の産業においても経験されている。
Reactive maintenance can result in overtreatment.
Using a statistical technique called trends, Con Edison's Hipot test program proved to over-treat “patients” or feeders. Hipot is, by definition, preventive maintenance in that initial defects are driven into failure by intentionally stressing the feeder. However, especially in the DC current hippot test, Con Edison scored the same “disease”, but it did not outperform the “placebo” control group, which did not do anything to it. (Fig. 23). A new AC test was added to cancel some overtreatment, and this test was optimal for the Con Edison system, so the level of performance would have improved and would later exceed that of the control group. It has been shown. Subsequently, Con Edison's operation and distribution engineering added an improved alternating current test that it had, since it actually improved over the performance of the control group. This interaction between machine learning, statistics, preventive maintenance programs, and field experts will confirm overtreatment in most utilities that are currently responsive to failures. Seem. This has also been experienced in other industries, including those that have developed these technologies for themselves, such as the automotive and aerospace, military, and medical industries.
結論
これからの数十年に亘り、老朽化し、酷使された電気インフラに対する依存度が増すであろう。未来の送電系統の信頼性は、現在世界中で実施が行われている新しい先制的保全方針に大きく依存するであろう。本開示は、損傷を受けやすい構成要素の予測のための機械学習および知識発見という、効果的な方針を構築するための基本的手段を提供する。電力事業者は、故障予測および先制的保全を行うために、現在開示の方法およびシステムを用いることができる。フィーダの順位付け、フィーダ構成要素の順位付け(ケーブル、ジョイント、ハンマーヘッド等)、MTBF推定、およびマンホール脆弱性の順位付けへのこのプロセスの特殊化を示した。ニューヨーク市の送電網への直接適用により、電力会社によって既に収集済みのデータを、送電系統故障の予測、ひいては予防に役立てることが可能であることが証明されている。
Conclusion Over the coming decades, the reliance on aging and overused electrical infrastructure will increase. The reliability of future transmission systems will depend heavily on new pre-emptive maintenance policies that are currently being implemented around the world. The present disclosure provides a basic means for building an effective strategy of machine learning and knowledge discovery for predicting vulnerable components. Power utilities can use the presently disclosed methods and systems to perform failure prediction and preemptive maintenance. Specialization of this process to feeder ranking, feeder component ranking (cable, joint, hammerhead, etc.), MTBF estimation, and manhole vulnerability ranking was demonstrated. Direct application to the New York City power grid has proven that data already collected by power companies can be used to predict and thus prevent transmission system failures.
Claims (20)
(a)前記配電網内の前記同種の構成要素を代表する生データを提供するための生データアセンブリと、
(b)前記生データアセンブリに動作可能に連結され、1つまたは複数のデータ処理技術を用いて、前記生データをより均一なデータに変換するためのデータプロセッサと、
(c)前記データプロセッサに動作可能に連結され、前記より均一なデータを保存するためのデータベースと、
(d)前記データベースに動作可能に連結され、前記同種の構成要素に関する故障傾向測定基準群を提供するための機械学習エンジンと、
(e)前記機械学習エンジンに動作可能に連結され、前記故障傾向測定基準群から非適合測定基準の検出および除去を行い、前記フィルタリングされた故障傾向測定基準群を提供するための評価エンジンと、
(f)前記評価エンジンに動作可能に連結され、前記配電網内の同種の構成要素の前記フィルタリングされた故障傾向測定基準群の順位付けを表示するように構成された意思決定支援アプリケーションと、
を含む機械学習システム。 A machine learning system for ranking filtered failure trend metrics for like components in a distribution network,
(A) a raw data assembly for providing raw data representative of the same type of components in the distribution network;
(B) a data processor operatively coupled to the raw data assembly for converting the raw data into more uniform data using one or more data processing techniques;
(C) a database operably coupled to the data processor for storing the more uniform data;
(D) a machine learning engine operably coupled to the database for providing a failure trend metric group for the same type of component;
(E) an evaluation engine operably coupled to the machine learning engine for detecting and removing non-conforming metrics from the failure trend metrics and providing the filtered failure trend metrics;
(F) a decision support application operatively coupled to the evaluation engine and configured to display a ranking of the filtered failure trend metrics group of similar components in the distribution network;
Including machine learning system.
(a)前記配電網内の前記同種の構成要素を代表する生データを提供するための生データアセンブリを設けることと、
(b)1つまたは複数のデータ処理技術を用いて、前記生データをより均一なデータに変換するために前記生データを処理することと、
(c)前記より均一なデータをデータベースに保存することと、
(d)前記より均一なデータを機械学習エンジンに送信することにより、前記同種の構成要素に関する故障傾向測定基準群を提供することと、
(e)評価エンジンにおいて、前記故障傾向測定基準群の評価を行うことにより、前記故障傾向測定基準群から非適合測定基準の検出および除去を行い、前記フィルタリングされた故障傾向測定基準群を提供することと、
(f)前記評価エンジンから得られた前記フィルタリングされた故障傾向測定基準群の順位付けを行い、意思決定支援アプリケーション上に前記順位付けを表示することと、
を含む方法。 A method for ranking filtered failure trend metrics groups of similar components in a distribution network using machine learning, comprising:
(A) providing a raw data assembly for providing raw data representative of the same type of components in the distribution network;
(B) processing the raw data to convert the raw data into more uniform data using one or more data processing techniques;
(C) storing the more uniform data in a database;
(D) providing a failure trend metric group for the same type of component by sending the more uniform data to a machine learning engine;
(E) In the evaluation engine, the failure trend metric group is evaluated to detect and remove non-conforming metrics from the failure trend metric group, and provide the filtered failure trend metric group And
(F) ranking the filtered failure trend metrics obtained from the evaluation engine and displaying the ranking on a decision support application;
Including methods.
The evaluating records a filtered failure trend metric group over a first period and a filtered failure trend metric group over a second period; and the filtered failure in the first period 2. The method of claim 1, further comprising: analyzing to determine whether a trend metric group is statistically improved over the filtered failure trend metric group in the second time period. the method of.
Applications Claiming Priority (3)
| Application Number | Priority Date | Filing Date | Title |
|---|---|---|---|
| US36498810P | 2010-07-16 | 2010-07-16 | |
| US61/364,988 | 2010-07-16 | ||
| PCT/US2011/044389 WO2012009724A1 (en) | 2010-07-16 | 2011-07-18 | Machine learning for power grids |
Publications (1)
| Publication Number | Publication Date |
|---|---|
| JP2013538543A true JP2013538543A (en) | 2013-10-10 |
Family
ID=45469829
Family Applications (1)
| Application Number | Title | Priority Date | Filing Date |
|---|---|---|---|
| JP2013520781A Pending JP2013538543A (en) | 2010-07-16 | 2011-07-18 | Machine learning for power grids |
Country Status (7)
| Country | Link |
|---|---|
| US (1) | US8751421B2 (en) |
| EP (1) | EP2593844A4 (en) |
| JP (1) | JP2013538543A (en) |
| CN (1) | CN103154845A (en) |
| CA (1) | CA2805747A1 (en) |
| MX (1) | MX2013000577A (en) |
| WO (1) | WO2012009724A1 (en) |
Cited By (6)
| Publication number | Priority date | Publication date | Assignee | Title |
|---|---|---|---|---|
| WO2018154702A1 (en) * | 2017-02-24 | 2018-08-30 | 株式会社日立製作所 | Power grid decision-making support device and method, and system applying same |
| JP2018142256A (en) * | 2017-02-28 | 2018-09-13 | ファナック株式会社 | Inventory management system having inventory management and preventative maintenance functions |
| JP2020503835A (en) * | 2016-12-23 | 2020-01-30 | ベー・カー・ヴェー エナギー アー・ゲーBKW Energie AG | How to structure an existing grid for distributing electrical energy |
| JP2020522055A (en) * | 2017-05-14 | 2020-07-27 | デジタル リーズニング システムズ インコーポレイテッド | System and method for rapidly building, managing, and sharing machine learning models |
| JP2020527227A (en) * | 2017-07-03 | 2020-09-03 | サウジ アラビアン オイル カンパニー | Equipment and methods for non-destructive inspection of fiberglass and non-metal pipes |
| WO2022085553A1 (en) * | 2020-10-20 | 2022-04-28 | 株式会社日立製作所 | System for assisting with creation of grid plan for changing structure of power grid, and method for same |
Families Citing this family (100)
| Publication number | Priority date | Publication date | Assignee | Title |
|---|---|---|---|---|
| WO2009117741A1 (en) * | 2008-03-21 | 2009-09-24 | The Trustees Of Columbia University In The City Of New York | Decision support control centers |
| WO2009117742A1 (en) * | 2008-03-21 | 2009-09-24 | The Trustees Of Columbia University In The City Of New York | Methods and systems of determining the effectiveness of capital improvement projects |
| WO2010096783A1 (en) | 2009-02-20 | 2010-08-26 | The Trustees Of Columbia University In The City Of New York | Dynamic contingency avoidance and mitigation system |
| US8725625B2 (en) | 2009-05-28 | 2014-05-13 | The Trustees Of Columbia University In The City Of New York | Capital asset planning system |
| EP2539861A4 (en) | 2010-02-24 | 2013-08-07 | Univ Columbia | Metric monitoring and financial validation system for tracking performance of improvement to an infrastructure |
| US8849469B2 (en) | 2010-10-28 | 2014-09-30 | Microsoft Corporation | Data center system that accommodates episodic computation |
| US9083183B2 (en) * | 2011-08-30 | 2015-07-14 | General Electric Company | Systems and methods for presenting contingency analysis results |
| US9753909B2 (en) | 2012-09-07 | 2017-09-05 | Splunk, Inc. | Advanced field extractor with multiple positive examples |
| US10394946B2 (en) | 2012-09-07 | 2019-08-27 | Splunk Inc. | Refining extraction rules based on selected text within events |
| US8751963B1 (en) | 2013-01-23 | 2014-06-10 | Splunk Inc. | Real time indication of previously extracted data fields for regular expressions |
| US9594814B2 (en) | 2012-09-07 | 2017-03-14 | Splunk Inc. | Advanced field extractor with modification of an extracted field |
| US8682906B1 (en) | 2013-01-23 | 2014-03-25 | Splunk Inc. | Real time display of data field values based on manual editing of regular expressions |
| US8751499B1 (en) | 2013-01-22 | 2014-06-10 | Splunk Inc. | Variable representative sampling under resource constraints |
| US20140208217A1 (en) | 2013-01-22 | 2014-07-24 | Splunk Inc. | Interface for managing splittable timestamps across event records |
| US9563722B2 (en) * | 2012-11-13 | 2017-02-07 | Gridquant, Inc. | Sigma algebraic approximants as a diagnostic tool in power networks |
| US9152929B2 (en) | 2013-01-23 | 2015-10-06 | Splunk Inc. | Real time display of statistics and values for selected regular expressions |
| US10215814B2 (en) * | 2013-08-30 | 2019-02-26 | International Business Machines Corporation | System and method for cognitive alarm management for the power grid |
| CN103617554A (en) * | 2013-10-22 | 2014-03-05 | 芜湖大学科技园发展有限公司 | Flexible drive system for grid data evaluation |
| US10409926B2 (en) | 2013-11-27 | 2019-09-10 | Falkonry Inc. | Learning expected operational behavior of machines from generic definitions and past behavior |
| US10037128B2 (en) | 2014-02-04 | 2018-07-31 | Falkonry, Inc. | Operating behavior classification interface |
| WO2015131916A1 (en) * | 2014-03-06 | 2015-09-11 | Abb Technology Ag | Optimized method for sorting alarms |
| BR112014007965A2 (en) * | 2014-03-28 | 2020-10-27 | Sicpa Holding Sa | global management system and method for managing oil and gas assets, and non-tangible or non-transitory computer readable medium storing a set of instructions for managing oil and gas assets |
| US10558932B1 (en) * | 2014-04-23 | 2020-02-11 | Google Llc | Multi-machine distributed learning systems |
| US9933804B2 (en) * | 2014-07-11 | 2018-04-03 | Microsoft Technology Licensing, Llc | Server installation as a grid condition sensor |
| WO2016011007A1 (en) | 2014-07-17 | 2016-01-21 | 3M Innovative Properties Company | Systems and methods for maximizing expected utility of signal injection test patterns in utility grids |
| US10698371B2 (en) | 2014-07-17 | 2020-06-30 | 3M Innovative Properties Company | Systems and methods for classifying in-situ sensor response data patterns representative of grid pathology severity |
| KR101894680B1 (en) | 2014-07-17 | 2018-09-04 | 쓰리엠 이노베이티브 프로퍼티즈 컴파니 | Systems and methods for coordinating signal injections to understand and maintain orthogonality among signal injections patterns in utility grids |
| US10770899B2 (en) | 2014-09-11 | 2020-09-08 | Gerald Bernard Sheble | Resource control by probability tree convolution production cost valuation by iterative equivalent demand duration curve expansion (aka. tree convolution) |
| EP3245699A4 (en) | 2015-01-16 | 2018-06-20 | 3M Innovative Properties Company | Systems and methods for selecting grid actions to improve grid outcomes |
| US20160313216A1 (en) * | 2015-04-25 | 2016-10-27 | Prophecy Sensors, Llc | Fuel gauge visualization of iot based predictive maintenance system using multi-classification based machine learning |
| CN104578427B (en) * | 2015-01-27 | 2017-02-22 | 国家电网公司 | Fault self-healing method for power distribution network containing microgrid power source |
| US10389600B2 (en) | 2015-03-23 | 2019-08-20 | Utopus Insights, Inc. | Network management based on modeling of cascading effect of failure |
| US10984338B2 (en) | 2015-05-28 | 2021-04-20 | Raytheon Technologies Corporation | Dynamically updated predictive modeling to predict operational outcomes of interest |
| US20170132057A1 (en) * | 2015-11-05 | 2017-05-11 | Microsoft Technology Licensing, Llc | Full duplex distributed telemetry system |
| US10776712B2 (en) | 2015-12-02 | 2020-09-15 | Preferred Networks, Inc. | Generative machine learning systems for drug design |
| US10366451B2 (en) | 2016-01-27 | 2019-07-30 | Huawei Technologies Co., Ltd. | System and method for prediction using synthetic features and gradient boosted decision tree |
| US9960952B2 (en) | 2016-03-17 | 2018-05-01 | Ca, Inc. | Proactive fault detection and diagnostics for networked node transaction events |
| US10001981B2 (en) * | 2016-05-26 | 2018-06-19 | At&T Intellectual Property I, L.P. | Autonomous server installation |
| CN106056462A (en) * | 2016-06-06 | 2016-10-26 | 中国船舶重工集团公司第七〇九研究所 | Marine oil and gas fracturing operation assistant decision-making system |
| US10540358B2 (en) * | 2016-06-20 | 2020-01-21 | Microsoft Technology Licensing, Llc | Telemetry data contextualized across datasets |
| WO2018013148A1 (en) * | 2016-07-15 | 2018-01-18 | University Of Connecticut | Systems and methods for outage prediction |
| US10210037B2 (en) | 2016-08-25 | 2019-02-19 | Uptake Technologies, Inc. | Interface tool for asset fault analysis |
| CN106372747B (en) * | 2016-08-27 | 2023-07-25 | 天津大学 | Random forest-based reasonable line loss rate estimation method for transformer area |
| US11012461B2 (en) * | 2016-10-27 | 2021-05-18 | Accenture Global Solutions Limited | Network device vulnerability prediction |
| US11205103B2 (en) | 2016-12-09 | 2021-12-21 | The Research Foundation for the State University | Semisupervised autoencoder for sentiment analysis |
| EP3343717A1 (en) | 2016-12-27 | 2018-07-04 | Vito NV | Hierarchical implicit controller for shielded system in a grid |
| KR101943423B1 (en) * | 2016-12-28 | 2019-01-29 | 효성중공업 주식회사 | Asset management method for substation |
| CN106709662B (en) * | 2016-12-30 | 2021-07-02 | 山东鲁能软件技术有限公司 | Power equipment operation condition division method |
| US10482000B2 (en) | 2017-04-24 | 2019-11-19 | Microsoft Technology Licensing, Llc | Machine learned decision guidance for alerts originating from monitoring systems |
| US10769540B2 (en) * | 2017-04-27 | 2020-09-08 | Hewlett Packard Enterprise Development Lp | Rare event prediction |
| KR101904868B1 (en) | 2017-04-28 | 2018-10-10 | 효성중공업 주식회사 | Asset management method for substation |
| US11823067B2 (en) * | 2017-06-27 | 2023-11-21 | Hcl Technologies Limited | System and method for tuning and deploying an analytical model over a target eco-system |
| US10761974B2 (en) | 2017-11-10 | 2020-09-01 | International Business Machines Corporation | Cognitive manufacturing systems test repair action |
| CN107817404B (en) * | 2017-11-18 | 2023-06-20 | 广西电网有限责任公司电力科学研究院 | Portable metering automation terminal fault diagnosis device and diagnosis method thereof |
| US10560366B2 (en) | 2017-11-29 | 2020-02-11 | International Business Machines Corporation | Predictive analytics of device performance |
| US20190324832A1 (en) * | 2018-04-18 | 2019-10-24 | Alberto Avritzer | Metric for the assessment of distributed high-availability architectures using survivability modeling |
| US10879732B2 (en) * | 2018-04-19 | 2020-12-29 | Microsoft Technology Licensing, Llc | Power supply mode selection |
| WO2019216878A1 (en) * | 2018-05-07 | 2019-11-14 | Inhand Networks Inc. | System for locating fault in power distribution network based on mixed mode wave recording |
| WO2019224750A1 (en) | 2018-05-22 | 2019-11-28 | BluWave Inc. | Methods and systems for an enhanced energy grid system |
| US11481581B2 (en) * | 2018-08-23 | 2022-10-25 | Florida Power & Light Company | Proactive power outage impact adjustments via machine learning |
| WO2020043317A1 (en) | 2018-08-31 | 2020-03-05 | Telefonaktiebolaget Lm Ericsson (Publ) | Determining reliability information for a network component |
| US10895855B2 (en) | 2018-09-21 | 2021-01-19 | Microsoft Technology Licensing, Llc | Controlling devices using a rich representation of their environment |
| CN109447418B (en) * | 2018-09-29 | 2022-07-12 | 广东工业大学 | Power transmission and transformation two-stage multi-element parallel power grid maintenance outage probability calculation method |
| US11681929B2 (en) * | 2018-10-02 | 2023-06-20 | Honeywell International Inc. | Methods and systems for predicting a remaining useful life of a component using an accelerated failure time model |
| US11367053B2 (en) | 2018-11-16 | 2022-06-21 | University Of Connecticut | System and method for damage assessment and restoration |
| CN109740766B (en) * | 2018-12-29 | 2021-04-06 | 科技谷(厦门)信息技术有限公司 | Industrial equipment maintenance service planning method |
| US11514220B2 (en) | 2019-01-09 | 2022-11-29 | International Business Machines Corporation | Predicting power usage of a chip |
| CN109816033A (en) * | 2019-01-31 | 2019-05-28 | 清华四川能源互联网研究院 | A method of the supervised learning based on optimization carries out area user identification zone |
| CN109886328B (en) * | 2019-02-14 | 2021-07-23 | 国网浙江省电力有限公司电力科学研究院 | Electric vehicle charging facility fault prediction method and system |
| JP7162550B2 (en) * | 2019-02-15 | 2022-10-28 | オムロン株式会社 | Model generation device, prediction device, model generation method, and model generation program |
| CN110222743A (en) * | 2019-05-23 | 2019-09-10 | 山西金晖隆开关有限公司 | The method for generating plan of power grid accident |
| US10762166B1 (en) | 2019-06-07 | 2020-09-01 | International Business Machines Corporation | Adaptive accelerated yield analysis |
| US11099537B2 (en) * | 2019-06-28 | 2021-08-24 | Utilidata, Inc. | Utility grid control using a dynamic power flow model |
| US11447164B2 (en) | 2019-10-11 | 2022-09-20 | Progress Rail Services Corporation | Artificial intelligence watchdog for distributed system synchronization |
| WO2021113360A1 (en) * | 2019-12-02 | 2021-06-10 | Purdue Research Foundation | Efficient fault prevention and repair in complex systems |
| US11269901B2 (en) | 2020-01-16 | 2022-03-08 | International Business Machines Corporation | Cognitive test advisor facility for identifying test repair actions |
| CN111401731A (en) * | 2020-03-13 | 2020-07-10 | 贵州电网有限责任公司 | Risk control aid decision-making method and system based on artificial intelligence learning |
| CN111654463A (en) * | 2020-03-18 | 2020-09-11 | 中国南方电网有限责任公司 | Support vector electromechanical network intrusion detection system and method based on feature selection |
| US11593680B2 (en) | 2020-07-14 | 2023-02-28 | International Business Machines Corporation | Predictive models having decomposable hierarchical layers configured to generate interpretable results |
| CN111817313B (en) * | 2020-07-14 | 2022-05-06 | 国网山东省电力公司电力科学研究院 | Optical storage capacity optimal configuration method and system based on sub-band mixed energy storage |
| CN112036710A (en) * | 2020-08-12 | 2020-12-04 | 国家电网有限公司 | Method, system, storage medium and equipment for evaluating composite state of high-voltage cable |
| CN112100225B (en) * | 2020-09-18 | 2023-12-15 | 国网辽宁省电力有限公司电力科学研究院 | Distribution network line panoramic visualization data monitoring and analyzing system based on big data |
| CN112381321B (en) * | 2020-11-27 | 2023-01-24 | 广东电网有限责任公司肇庆供电局 | Power distribution network operation state sensing method based on gridding division |
| CN112463858B (en) * | 2020-12-11 | 2023-05-30 | 广东电网有限责任公司佛山供电局 | Intelligent power transmission line maintenance method based on state evaluation |
| KR102354342B1 (en) * | 2020-12-30 | 2022-01-21 | 서울대학교산학협력단 | Fault diagnosis device of transformer and fault diagnosis method using the same |
| AU2022209671A1 (en) * | 2021-01-21 | 2023-08-17 | Electronet Technology Limited | Voltage based fault detection |
| US11674994B2 (en) | 2021-02-24 | 2023-06-13 | Mitsubishi Electric Research Laboratories, Inc. | Distribution fault location using graph neural network with both node and link attributes |
| US11575263B2 (en) * | 2021-03-12 | 2023-02-07 | Utilidata, Inc. | Optimal power flow control via dynamic power flow modeling |
| US11784358B2 (en) | 2021-07-07 | 2023-10-10 | The Aerospace Corporation | Self regulating modular battery |
| US20230036218A1 (en) * | 2021-07-27 | 2023-02-02 | Qualitrol Company Llc | Systems and methods for ai continued learning in electrical power grid fault analysis |
| JP2023063742A (en) * | 2021-10-25 | 2023-05-10 | 三菱電機株式会社 | Power distribution system accident sign cause estimation system |
| US11782784B2 (en) | 2021-10-25 | 2023-10-10 | Capital One Services, Llc | Remediation action system |
| US11892903B2 (en) | 2021-12-17 | 2024-02-06 | Bank Of America Corporation | System and method for continuous failure prediction and remediation within a computational environment using independent execution units |
| US11782780B2 (en) | 2021-12-17 | 2023-10-10 | Bank Of America Corporation | Automatic remediation of failures within a computational environment using independent execution units |
| US20230419228A1 (en) * | 2022-06-28 | 2023-12-28 | Xendee Corporation | Machine learning based multiyear projection planning for energy systems |
| CN115577122B (en) * | 2022-11-09 | 2024-04-19 | 国网安徽省电力有限公司黄山供电公司 | Construction method of power outage information knowledge graph of power distribution network |
| US11901732B1 (en) * | 2023-04-06 | 2024-02-13 | Coulomb Technologies | Discovering upgrade to increase capacity for supporting electrical load at particular location of power grid |
| US11956138B1 (en) | 2023-04-26 | 2024-04-09 | International Business Machines Corporation | Automated detection of network anomalies and generation of optimized anomaly-alleviating incentives |
| CN116436002B (en) * | 2023-06-13 | 2023-09-05 | 成都航空职业技术学院 | Building electricity utilization prediction method |
| CN117688848B (en) * | 2024-02-02 | 2024-04-16 | 湖南璟德科技有限公司 | High-power stator vane coil fatigue life testing method |
Citations (1)
| Publication number | Priority date | Publication date | Assignee | Title |
|---|---|---|---|---|
| US20090157573A1 (en) * | 2006-01-23 | 2009-06-18 | The Trustees Of Columbia University In The City Of New York | System And Method For Grading Electricity Distribution Network Feeders Susceptible To Impending Failure |
Family Cites Families (112)
| Publication number | Priority date | Publication date | Assignee | Title |
|---|---|---|---|---|
| US6581045B1 (en) | 1989-05-12 | 2003-06-17 | Building Technology Associates, Inc. | Asset management system for analyzing the condition of assets and evaluating repair/replacement options |
| US5396635A (en) | 1990-06-01 | 1995-03-07 | Vadem Corporation | Power conservation apparatus having multiple power reduction levels dependent upon the activity of the computer system |
| US5083039B1 (en) | 1991-02-01 | 1999-11-16 | Zond Energy Systems Inc | Variable speed wind turbine |
| US5963457A (en) | 1994-03-18 | 1999-10-05 | Hitachi, Ltd. | Electrical power distribution monitoring system and method |
| US5625751A (en) | 1994-08-30 | 1997-04-29 | Electric Power Research Institute | Neural network for contingency ranking dynamic security indices for use under fault conditions in a power distribution system |
| US5959547A (en) | 1995-02-09 | 1999-09-28 | Baker Hughes Incorporated | Well control systems employing downhole network |
| US6321205B1 (en) | 1995-10-03 | 2001-11-20 | Value Miner, Inc. | Method of and system for modeling and analyzing business improvement programs |
| US6055517A (en) | 1995-10-30 | 2000-04-25 | Efi Actuaries | Method of determining optimal asset allocation utilizing asset cash flow simulation |
| US7243081B2 (en) | 1995-10-30 | 2007-07-10 | Efi Actuaries | Method of determining optimal asset allocation utilizing asset cash flow simulation |
| US5875431A (en) | 1996-03-15 | 1999-02-23 | Heckman; Frank | Legal strategic analysis planning and evaluation control system and method |
| US5764155A (en) | 1996-04-03 | 1998-06-09 | General Electric Company | Dynamic data exchange server |
| US5862391A (en) | 1996-04-03 | 1999-01-19 | General Electric Company | Power management control system |
| US6581048B1 (en) | 1996-06-04 | 2003-06-17 | Paul J. Werbos | 3-brain architecture for an intelligent decision and control system |
| US5893069A (en) | 1997-01-31 | 1999-04-06 | Quantmetrics R&D Associates, Llc | System and method for testing prediction model |
| US6434435B1 (en) | 1997-02-21 | 2002-08-13 | Baker Hughes Incorporated | Application of adaptive object-oriented optimization software to an automatic optimization oilfield hydrocarbon production management system |
| CA2289473A1 (en) | 1997-05-21 | 1998-11-26 | Khimetrics, Inc. | Method for controlled optimization of enterprise planning models |
| WO1999006935A1 (en) | 1997-08-01 | 1999-02-11 | Monks Robert A G | Entreprise simulation module |
| US6012016A (en) | 1997-08-29 | 2000-01-04 | Bj Services Company | Method and apparatus for managing well production and treatment data |
| US6807537B1 (en) | 1997-12-04 | 2004-10-19 | Microsoft Corporation | Mixtures of Bayesian networks |
| US6311144B1 (en) | 1998-05-13 | 2001-10-30 | Nabil A. Abu El Ata | Method and apparatus for designing and analyzing information systems using multi-layer mathematical models |
| US6125453A (en) | 1998-06-30 | 2000-09-26 | Sandia Corporation | Cut set-based risk and reliability analysis for arbitrarily interconnected networks |
| US6125044A (en) | 1999-03-23 | 2000-09-26 | Hewlett-Packard Company | Suppressing EMI with PCB mounted ferrite attenuator |
| US6519568B1 (en) | 1999-06-15 | 2003-02-11 | Schlumberger Technology Corporation | System and method for electronic data delivery |
| US6266619B1 (en) | 1999-07-20 | 2001-07-24 | Halliburton Energy Services, Inc. | System and method for real time reservoir management |
| US6826483B1 (en) | 1999-10-13 | 2004-11-30 | The Trustees Of Columbia University In The City Of New York | Petroleum reservoir simulation and characterization system and method |
| US6629044B1 (en) | 2000-03-17 | 2003-09-30 | General Electric Company | Electrical distribution analysis method and apparatus |
| US20010049651A1 (en) | 2000-04-28 | 2001-12-06 | Selleck Mark N. | Global trading system and method |
| US20020001307A1 (en) | 2000-05-20 | 2002-01-03 | Equipe Communications Corporation | VPI/VCI availability index |
| JP4523124B2 (en) | 2000-07-14 | 2010-08-11 | 日立アプライアンス株式会社 | Energy service business system |
| US7236953B1 (en) | 2000-08-18 | 2007-06-26 | Athena Capital Advisors, Inc. | Deriving a probability distribution of a value of an asset at a future time |
| US8655698B2 (en) | 2000-10-17 | 2014-02-18 | Accenture Global Services Limited | Performance-based logistics for aerospace and defense programs |
| US20020084655A1 (en) | 2000-12-29 | 2002-07-04 | Abb Research Ltd. | System, method and computer program product for enhancing commercial value of electrical power produced from a renewable energy power production facility |
| US20040215551A1 (en) | 2001-11-28 | 2004-10-28 | Eder Jeff S. | Value and risk management system for multi-enterprise organization |
| US6829384B2 (en) | 2001-02-28 | 2004-12-07 | Carnegie Mellon University | Object finder for photographic images |
| US7389204B2 (en) * | 2001-03-01 | 2008-06-17 | Fisher-Rosemount Systems, Inc. | Data presentation system for abnormal situation prevention in a process plant |
| US6868310B2 (en) | 2001-04-06 | 2005-03-15 | Eni Technology, Inc. | Predictive failure scheme for industrial thin films processing power delivery system |
| US6944678B2 (en) | 2001-06-18 | 2005-09-13 | Transtech Networks Usa, Inc. | Content-aware application switch and methods thereof |
| US7324876B2 (en) | 2001-07-10 | 2008-01-29 | Yingco Electronic Inc. | System for remotely controlling energy distribution at local sites |
| US7106045B2 (en) | 2001-07-10 | 2006-09-12 | Uppi Corporation | Apparatus for a simplified power disturbance indicator gage with learning capability options |
| US7797062B2 (en) | 2001-08-10 | 2010-09-14 | Rockwell Automation Technologies, Inc. | System and method for dynamic multi-objective optimization of machine selection, integration and utilization |
| US6999829B2 (en) | 2001-12-26 | 2006-02-14 | Abb Inc. | Real time asset optimization |
| US20030171851A1 (en) | 2002-03-08 | 2003-09-11 | Peter J. Brickfield | Automatic energy management and energy consumption reduction, especially in commercial and multi-building systems |
| CA2480363A1 (en) | 2002-03-27 | 2003-10-09 | Praxair Technology, Inc. | Luminescence sensing system for welding |
| EP1490941A4 (en) | 2002-03-28 | 2007-01-10 | Robertshaw Controls Co | Energy management system and method |
| US7227281B2 (en) | 2002-06-14 | 2007-06-05 | Hewlett-Packard Development Company, L.P. | Causing operation of load in alternate, reduced peak power mode |
| US20040143477A1 (en) | 2002-07-08 | 2004-07-22 | Wolff Maryann Walsh | Apparatus and methods for assisting with development management and/or deployment of products and services |
| US20040158417A1 (en) | 2002-11-06 | 2004-08-12 | Bonet Antonio Trias | System and method for monitoring and managing electrical power transmission and distribution networks |
| US7519506B2 (en) | 2002-11-06 | 2009-04-14 | Antonio Trias | System and method for monitoring and managing electrical power transmission and distribution networks |
| SG119203A1 (en) | 2002-12-13 | 2006-02-28 | Inventio Ag | Method and device for controlling a zonally operated elevator installation |
| US20050034023A1 (en) | 2002-12-16 | 2005-02-10 | Maturana Francisco P. | Energy management system |
| US7203622B2 (en) | 2002-12-23 | 2007-04-10 | Abb Research Ltd. | Value-based transmission asset maintenance management of electric power networks |
| US7369950B2 (en) | 2003-02-07 | 2008-05-06 | Power Measurement Ltd. | System and method for power quality analytics |
| JP3954511B2 (en) | 2003-03-14 | 2007-08-08 | 株式会社東芝 | Power distribution system monitoring and control device |
| EP1642385A1 (en) | 2003-06-05 | 2006-04-05 | Enfo Broadcast AS | A method and a system for automatic management of demand for non-durables |
| WO2004114095A2 (en) | 2003-06-20 | 2004-12-29 | Strategic Capital Network Llc | Improved resource allocation technique |
| US7925557B1 (en) | 2003-07-01 | 2011-04-12 | Accenture Global Services Limited | Cost analysis and reduction tool |
| US7233843B2 (en) | 2003-08-08 | 2007-06-19 | Electric Power Group, Llc | Real-time performance monitoring and management system |
| WO2005020044A1 (en) | 2003-08-26 | 2005-03-03 | The Trustees Of Columbia University In The City Of New York | Innervated stochastic controller for real time business decision-making support |
| US8560476B2 (en) | 2003-08-26 | 2013-10-15 | The Trustees Of Columbia University In The City Of New York | Martingale control of production for optimal profitability of oil and gas fields |
| US7127584B1 (en) | 2003-11-14 | 2006-10-24 | Intel Corporation | System and method for dynamic rank specific timing adjustments for double data rate (DDR) components |
| US7526461B2 (en) | 2004-11-17 | 2009-04-28 | Gm Global Technology Operations, Inc. | System and method for temporal data mining |
| US20060168398A1 (en) | 2005-01-24 | 2006-07-27 | Paul Cadaret | Distributed processing RAID system |
| JP4373941B2 (en) | 2005-02-23 | 2009-11-25 | 本田技研工業株式会社 | Fuel supply station information distribution system, fuel supply station information distribution server, and fuel supply station information display device |
| US7274975B2 (en) | 2005-06-06 | 2007-09-25 | Gridpoint, Inc. | Optimized energy management system |
| US7672811B2 (en) | 2005-06-17 | 2010-03-02 | Gm Global Technology Operations, Inc. | System and method for production system performance prediction |
| US7464119B1 (en) | 2005-07-28 | 2008-12-09 | Sprint Communications Company L.P. | System and method of measuring the reliability of a software application |
| WO2007033300A2 (en) | 2005-09-13 | 2007-03-22 | The Trustees Of Columbia University In The City Of New York | Systems and methods for martingale boosting in machine learning |
| US20100185557A1 (en) | 2005-12-16 | 2010-07-22 | Strategic Capital Network, Llc | Resource allocation techniques |
| US7664038B2 (en) | 2006-01-31 | 2010-02-16 | At&T Corp. | Method and apparatus for evaluating component costs in a communication network |
| WO2007095585A2 (en) | 2006-02-14 | 2007-08-23 | Edsa Micro Corporation | Systems and methods for real-time system monitoring and predictive analysis |
| US8131401B2 (en) | 2006-07-19 | 2012-03-06 | Power Analytics Corporation | Real-time stability indexing for intelligent energy monitoring and management of electrical power network system |
| US7539550B2 (en) | 2006-02-23 | 2009-05-26 | Rockwell Automation Technologies, Inc. | Safety versus availability graphical user interface |
| US7693608B2 (en) * | 2006-04-12 | 2010-04-06 | Edsa Micro Corporation | Systems and methods for alarm filtering and management within a real-time data acquisition and monitoring environment |
| US8103389B2 (en) | 2006-05-18 | 2012-01-24 | Gridpoint, Inc. | Modular energy control system |
| WO2008005006A1 (en) | 2006-06-30 | 2008-01-10 | Unisys Corporation | A method for facilitating the outsourcing of technology services |
| US7844370B2 (en) | 2006-08-10 | 2010-11-30 | Gridpoint, Inc. | Scheduling and control in a power aggregation system for distributed electric resources |
| US8359248B2 (en) | 2006-08-24 | 2013-01-22 | Blue Pillar, Inc. | Systems, methods, and devices for managing emergency power supply systems |
| US8180622B2 (en) | 2006-10-24 | 2012-05-15 | Power Analytics Corporation | Systems and methods for a real-time synchronized electrical power system simulator for “what-if” analysis and prediction over electrical power networks |
| US7590472B2 (en) | 2006-11-09 | 2009-09-15 | Gridpoint, Inc. | Energy arbitrage by load shifting |
| WO2008086114A2 (en) | 2007-01-03 | 2008-07-17 | Gridpoint, Inc. | Utility console for controlling energy resources |
| US20080177678A1 (en) | 2007-01-24 | 2008-07-24 | Paul Di Martini | Method of communicating between a utility and its customer locations |
| US7853417B2 (en) | 2007-01-30 | 2010-12-14 | Silver Spring Networks, Inc. | Methods and system for utility network outage detection |
| US7730364B2 (en) | 2007-04-05 | 2010-06-01 | International Business Machines Corporation | Systems and methods for predictive failure management |
| WO2008141246A2 (en) | 2007-05-09 | 2008-11-20 | Gridpoint, Inc. | Method and system for scheduling the discharge of distributed power storage devices and for levelizing dispatch participation |
| US8229722B2 (en) | 2007-05-16 | 2012-07-24 | Power Analytics Corporation | Electrical power system modeling, design, analysis, and reporting via a client-server application framework |
| CA2616627A1 (en) | 2007-06-21 | 2008-12-21 | Copperleaf Technologies Inc. | System and method for modeling an asset-based business cross-reference to related applications |
| US8078332B2 (en) | 2007-07-26 | 2011-12-13 | Areva T & D, Inc. | Methods for managing high or low voltage conditions from selected areas of a power system of a utility company |
| US7991577B2 (en) | 2007-08-30 | 2011-08-02 | HSB Solomon Associates, LLP | Control asset comparative performance analysis system and methodology |
| WO2009136230A2 (en) | 2007-11-07 | 2009-11-12 | Edsa Micro Corporation | Systems and methods for real-time forecasting and predicting of electrical peaks and managing the energy, health, reliability, and performance of electrical power systems based on an artificial adaptive neural network |
| US9185351B2 (en) | 2008-01-09 | 2015-11-10 | Harmonic, Inc. | Browsing and viewing video assets using TV set-top box |
| US7965195B2 (en) | 2008-01-20 | 2011-06-21 | Current Technologies, Llc | System, device and method for providing power outage and restoration notification |
| US8116915B2 (en) | 2008-03-03 | 2012-02-14 | University Of Delaware | Methods and apparatus using hierarchical priority and control algorithms for grid-integrated vehicles |
| WO2009117679A2 (en) | 2008-03-20 | 2009-09-24 | Illumitron International | A conductive magnetic coupling system |
| WO2009117742A1 (en) | 2008-03-21 | 2009-09-24 | The Trustees Of Columbia University In The City Of New York | Methods and systems of determining the effectiveness of capital improvement projects |
| WO2009117741A1 (en) | 2008-03-21 | 2009-09-24 | The Trustees Of Columbia University In The City Of New York | Decision support control centers |
| US20100107173A1 (en) | 2008-09-29 | 2010-04-29 | Battelle Memorial Institute | Distributing resources in a market-based resource allocation system |
| SG10201704635VA (en) | 2008-12-15 | 2017-07-28 | Accenture Global Services Ltd | Power grid outage and fault condition management |
| US20100207728A1 (en) | 2009-02-18 | 2010-08-19 | General Electric Corporation | Energy management |
| WO2010096783A1 (en) | 2009-02-20 | 2010-08-26 | The Trustees Of Columbia University In The City Of New York | Dynamic contingency avoidance and mitigation system |
| US20100332373A1 (en) | 2009-02-26 | 2010-12-30 | Jason Crabtree | System and method for participation in energy-related markets |
| WO2010138906A1 (en) * | 2009-05-28 | 2010-12-02 | The Trustees Of Columbia University In The City Of Newyork | Capital asset planning system |
| US20100306014A1 (en) * | 2009-06-01 | 2010-12-02 | Consolidated Edison Company | Utility service component reliability and management |
| US8725625B2 (en) | 2009-05-28 | 2014-05-13 | The Trustees Of Columbia University In The City Of New York | Capital asset planning system |
| US8305737B2 (en) | 2009-06-25 | 2012-11-06 | Server Technology, Inc. | Power distribution apparatus with input and output power sensing and method of use |
| IL201360A (en) | 2009-10-11 | 2014-08-31 | Moshe Henig | Loads management and outages detection for smart grid |
| US20110264276A1 (en) | 2009-10-30 | 2011-10-27 | Rudin Management Co. Inc. | Interconnected electrical network and building management system and method of operation |
| US8494826B2 (en) * | 2010-01-13 | 2013-07-23 | The United States Postal Service | Systems and methods for analyzing equipment failures and maintenance schedules |
| EP2539861A4 (en) | 2010-02-24 | 2013-08-07 | Univ Columbia | Metric monitoring and financial validation system for tracking performance of improvement to an infrastructure |
| EP2539725A1 (en) | 2010-02-24 | 2013-01-02 | The Trustees of Columbia University in the City of New York | Adaptive stochastic controller for distributed electrical energy storage management |
| US8583405B2 (en) | 2010-05-11 | 2013-11-12 | Maggie Chow | Contingency analysis information for utility service network |
| US8779927B2 (en) | 2010-09-07 | 2014-07-15 | Grid Net, Inc. | Power outage notification |
| US20120200423A1 (en) | 2011-02-08 | 2012-08-09 | Avista Corporation | Outage Prediction With Next Generation Smart Grid |
-
2011
- 2011-07-18 WO PCT/US2011/044389 patent/WO2012009724A1/en active Application Filing
- 2011-07-18 CN CN2011800446074A patent/CN103154845A/en active Pending
- 2011-07-18 EP EP11807624.9A patent/EP2593844A4/en not_active Withdrawn
- 2011-07-18 MX MX2013000577A patent/MX2013000577A/en active IP Right Grant
- 2011-07-18 CA CA2805747A patent/CA2805747A1/en not_active Abandoned
- 2011-07-18 JP JP2013520781A patent/JP2013538543A/en active Pending
-
2013
- 2013-01-15 US US13/742,124 patent/US8751421B2/en not_active Expired - Fee Related
Patent Citations (1)
| Publication number | Priority date | Publication date | Assignee | Title |
|---|---|---|---|---|
| US20090157573A1 (en) * | 2006-01-23 | 2009-06-18 | The Trustees Of Columbia University In The City Of New York | System And Method For Grading Electricity Distribution Network Feeders Susceptible To Impending Failure |
Cited By (12)
| Publication number | Priority date | Publication date | Assignee | Title |
|---|---|---|---|---|
| JP2020503835A (en) * | 2016-12-23 | 2020-01-30 | ベー・カー・ヴェー エナギー アー・ゲーBKW Energie AG | How to structure an existing grid for distributing electrical energy |
| JP7073397B2 (en) | 2016-12-23 | 2022-05-23 | ベー・カー・ヴェー エナギー アー・ゲー | How to Structure an Existing Grid That Distributes Electrical Energy |
| US11354457B2 (en) | 2016-12-23 | 2022-06-07 | Bkw Energie Ag | Method for structuring an existing grid for distributing electric energy |
| WO2018154702A1 (en) * | 2017-02-24 | 2018-08-30 | 株式会社日立製作所 | Power grid decision-making support device and method, and system applying same |
| JPWO2018154702A1 (en) * | 2017-02-24 | 2019-06-27 | 株式会社日立製作所 | Decision support apparatus and method in power system, and application system thereof |
| JP2018142256A (en) * | 2017-02-28 | 2018-09-13 | ファナック株式会社 | Inventory management system having inventory management and preventative maintenance functions |
| US10621545B2 (en) | 2017-02-28 | 2020-04-14 | Fanuc Corporation | Inventory management system having functions of performing inventory management and preventive maintenance |
| JP2020522055A (en) * | 2017-05-14 | 2020-07-27 | デジタル リーズニング システムズ インコーポレイテッド | System and method for rapidly building, managing, and sharing machine learning models |
| JP7216021B2 (en) | 2017-05-14 | 2023-01-31 | デジタル リーズニング システムズ インコーポレイテッド | Systems and methods for rapidly building, managing, and sharing machine learning models |
| JP2020527227A (en) * | 2017-07-03 | 2020-09-03 | サウジ アラビアン オイル カンパニー | Equipment and methods for non-destructive inspection of fiberglass and non-metal pipes |
| US11460412B2 (en) | 2017-07-03 | 2022-10-04 | Saudi Arabian Oil Company | System for nondestructively inspecting fiberglass and nonmetallic pipes |
| WO2022085553A1 (en) * | 2020-10-20 | 2022-04-28 | 株式会社日立製作所 | System for assisting with creation of grid plan for changing structure of power grid, and method for same |
Also Published As
| Publication number | Publication date |
|---|---|
| EP2593844A4 (en) | 2017-05-31 |
| MX2013000577A (en) | 2013-06-05 |
| US20130232094A1 (en) | 2013-09-05 |
| CN103154845A (en) | 2013-06-12 |
| CA2805747A1 (en) | 2012-01-19 |
| EP2593844A1 (en) | 2013-05-22 |
| US8751421B2 (en) | 2014-06-10 |
| WO2012009724A1 (en) | 2012-01-19 |
Similar Documents
| Publication | Publication Date | Title |
|---|---|---|
| JP2013538543A (en) | Machine learning for power grids | |
| Umunnakwe et al. | Quantitative analysis of power systems resilience: Standardization, categorizations, and challenges | |
| He et al. | A fuzzy TOPSIS and rough set based approach for mechanism analysis of product infant failure | |
| US10534361B2 (en) | Industrial asset health model update | |
| EP2697699B1 (en) | Dynamic assessment system for high-voltage electrical components | |
| US20140156031A1 (en) | Adaptive Stochastic Controller for Dynamic Treatment of Cyber-Physical Systems | |
| Yang et al. | A graph-based method for vulnerability analysis of renewable energy integrated power systems to cascading failures | |
| Goyal et al. | Asset health management using predictive and prescriptive analytics for the electric power grid | |
| CN109492790A (en) | Wind turbines health control method based on neural network and data mining | |
| Cao | Modeling the effects of dependence between competing failure processes on the condition-based preventive maintenance policy | |
| Honarmand et al. | Reliability modeling of process-oriented smart monitoring in the distribution systems | |
| Ghasemi et al. | Equipment failure rate in electric power distribution networks: An overview of concepts, estimation, and modeling methods | |
| Ramesh et al. | Reliability assessment of cogeneration power plant in textile mill using fault tree analysis | |
| CN103675518A (en) | Maintenance method and device for oil-immersed high-voltage equipment | |
| KR20220089853A (en) | Method for Failure prediction and prognostics and health management of renewable energy generation facilities using machine learning technology | |
| CN104573361A (en) | GIS (Gas Insulated Switchgear) evaluation method and device | |
| Lu et al. | The development of a smart distribution grid testbed for integrated information management systems | |
| Stewart et al. | Integrated multi-scale data analytics and machine learning for the distribution grid and building-to-grid interface | |
| CN115936663A (en) | Maintenance method and device for power system | |
| Feijoo-Martinez et al. | Event analysis on power communication networks with big data for maintenance forms | |
| Aizpurua et al. | Determining appropriate data analytics for transformer health monitoring | |
| CN113379314A (en) | Intelligent annual production plan supervision method based on reasoning algorithm | |
| Khalyasmaa et al. | The methodology of risk evaluation for power equipment technical state assessment | |
| Lybeck et al. | Lifecycle prognostics architecture for selected high-cost active components | |
| AU2020103327A4 (en) | IPMI- Advanced Grid Connected Systems: Intelligent Power Quality Monitoring and Improvement in Advanced Grid Connected Systems |
Legal Events
| Date | Code | Title | Description |
|---|---|---|---|
| A621 | Written request for application examination |
Free format text: JAPANESE INTERMEDIATE CODE: A621 Effective date: 20140627 |
|
| A977 | Report on retrieval |
Free format text: JAPANESE INTERMEDIATE CODE: A971007 Effective date: 20150319 |
|
| A131 | Notification of reasons for refusal |
Free format text: JAPANESE INTERMEDIATE CODE: A131 Effective date: 20150421 |
|
| A601 | Written request for extension of time |
Free format text: JAPANESE INTERMEDIATE CODE: A601 Effective date: 20150717 |
|
| A601 | Written request for extension of time |
Free format text: JAPANESE INTERMEDIATE CODE: A601 Effective date: 20150820 |
|
| A02 | Decision of refusal |
Free format text: JAPANESE INTERMEDIATE CODE: A02 Effective date: 20151117 |