JP2012164314A - Method of determining influence of variable in phenomenon - Google Patents
Method of determining influence of variable in phenomenon Download PDFInfo
- Publication number
- JP2012164314A JP2012164314A JP2012023565A JP2012023565A JP2012164314A JP 2012164314 A JP2012164314 A JP 2012164314A JP 2012023565 A JP2012023565 A JP 2012023565A JP 2012023565 A JP2012023565 A JP 2012023565A JP 2012164314 A JP2012164314 A JP 2012164314A
- Authority
- JP
- Japan
- Prior art keywords
- variable
- variable nodes
- node
- nodes
- class
- Prior art date
- Legal status (The legal status is an assumption and is not a legal conclusion. Google has not performed a legal analysis and makes no representation as to the accuracy of the status listed.)
- Pending
Links
Images


Classifications
-
- G—PHYSICS
- G06—COMPUTING; CALCULATING OR COUNTING
- G06F—ELECTRIC DIGITAL DATA PROCESSING
- G06F17/00—Digital computing or data processing equipment or methods, specially adapted for specific functions
- G06F17/10—Complex mathematical operations
- G06F17/18—Complex mathematical operations for evaluating statistical data, e.g. average values, frequency distributions, probability functions, regression analysis
-
- G—PHYSICS
- G06—COMPUTING; CALCULATING OR COUNTING
- G06F—ELECTRIC DIGITAL DATA PROCESSING
- G06F30/00—Computer-aided design [CAD]
-
- G—PHYSICS
- G06—COMPUTING; CALCULATING OR COUNTING
- G06F—ELECTRIC DIGITAL DATA PROCESSING
- G06F18/00—Pattern recognition
- G06F18/20—Analysing
- G06F18/29—Graphical models, e.g. Bayesian networks
-
- G—PHYSICS
- G06—COMPUTING; CALCULATING OR COUNTING
- G06F—ELECTRIC DIGITAL DATA PROCESSING
- G06F2218/00—Aspects of pattern recognition specially adapted for signal processing
- G06F2218/12—Classification; Matching
-
- G—PHYSICS
- G06—COMPUTING; CALCULATING OR COUNTING
- G06F—ELECTRIC DIGITAL DATA PROCESSING
- G06F30/00—Computer-aided design [CAD]
- G06F30/20—Design optimisation, verification or simulation
Landscapes
- Engineering & Computer Science (AREA)
- Physics & Mathematics (AREA)
- Data Mining & Analysis (AREA)
- Theoretical Computer Science (AREA)
- General Physics & Mathematics (AREA)
- General Engineering & Computer Science (AREA)
- Bioinformatics & Cheminformatics (AREA)
- Evolutionary Biology (AREA)
- Computational Mathematics (AREA)
- Mathematical Analysis (AREA)
- Mathematical Optimization (AREA)
- Bioinformatics & Computational Biology (AREA)
- Mathematical Physics (AREA)
- Pure & Applied Mathematics (AREA)
- Life Sciences & Earth Sciences (AREA)
- Evolutionary Computation (AREA)
- Artificial Intelligence (AREA)
- Software Systems (AREA)
- Algebra (AREA)
- Probability & Statistics with Applications (AREA)
- Computer Vision & Pattern Recognition (AREA)
- Operations Research (AREA)
- Databases & Information Systems (AREA)
- Geometry (AREA)
- Computer Hardware Design (AREA)
- Testing And Monitoring For Control Systems (AREA)
- Management, Administration, Business Operations System, And Electronic Commerce (AREA)
- Complex Calculations (AREA)
- Measuring And Recording Apparatus For Diagnosis (AREA)
Abstract
Description
本明細書で説明する技術は、現象における所与の変数の影響を決定する方法に関する。 The techniques described herein relate to a method for determining the effect of a given variable on a phenomenon.
機械内または観察される事象(event)内の特定の変質(disease)または故障モード(failure mode)に関連するパターンを検出することは、非常に困難だがやりがいがある。一般に、症状(または測定値)が異常であるときには、決定することは、より容易である。状態が異常であることを知ることは、かなり貴重でありうる。しかし、異常性が重大性評価(severity rating)によってタグ付け可能であり、かつ/または特定の条件または故障モードと関連づけることができるならば、より一層大きな価値がある。診断情報が、入力変数(例えば、測定パラメータ)と異常(anomaly)との間の関連性のパターンの中に含まれる。しかし、このパターンは、抽出することが非常に困難でありうる。 It is very difficult but challenging to detect patterns associated with a particular change or failure mode within a machine or observed event. In general, it is easier to determine when symptoms (or measurements) are abnormal. Knowing that the condition is abnormal can be quite valuable. However, it is even more valuable if the anomaly can be tagged with a severity rating and / or associated with a specific condition or failure mode. Diagnostic information is included in the pattern of association between input variables (eg, measurement parameters) and anomaly. However, this pattern can be very difficult to extract.
プロセス産業において、主成分分析(PCA)が、異常検出または故障診断(fault diagnosis)のために、しばしば使用される。残差(residual)または主成分(principal component)に対する変数の寄与を、計算することができる。この方法は、どの変数が異常性の測度(measure)に対して最も寄与するかの目安(indication)を提供する。しかし、PCAには制約がある。PCAは単峰型(uni-modal)であり、PCAの有用性は、データが複雑な密度から生成される場合に限られ、PCAは、欠落したデータを処理するための直感的な方法を提供しないことを意味する。 In the process industry, principal component analysis (PCA) is often used for anomaly detection or fault diagnosis. The contribution of the variable to the residual or principal component can be calculated. This method provides an indication of which variables contribute most to the anomaly measure. However, PCA has limitations. PCA is uni-modal and the usefulness of PCA is limited to when data is generated from complex densities, and PCA provides an intuitive way to handle missing data It means not.
変数の寄与を検出するための別の手法(approach)は、残差を計算することである。特定の変数に対して、変数の値を予測するために回帰法(regression technique)が使用され、次に、その値が測定された値から減算されて、残差が導き出される。残差の大きさは、異常な状態(state)に対する残差の寄与の測度をもたらす。しかし、異なる変数を直接比較することは、依然として困難でありうる。そして、複数の変数が異常に対して寄与しているならば、残差からの出力が、判断を誤らせている可能性がある。回帰法は、多くの場合、単峰型であり、PCAと同様の制約を受ける。 Another approach for detecting the contribution of a variable is to calculate the residual. For a particular variable, a regression technique is used to predict the value of the variable, and that value is then subtracted from the measured value to derive a residual. The magnitude of the residual provides a measure of the contribution of the residual to the abnormal state. However, direct comparison of different variables can still be difficult. If a plurality of variables contribute to the abnormality, the output from the residual may be misjudging. The regression method is often unimodal and is subject to the same constraints as PCA.
一態様では、現象における変数の影響を決定する方法は、モデルの成分(component)と、モデルの成分に関連する階級(class)を表す少なくとも1つの階級ノードと、階級内の変数に関連する値を表し、現象を経験するシステム内の物理データをすべて表す複数の変数ノードとを含む、グラフ形状(graphical form)の混合モデル(mixture model)を提供するステップと、変数ノードのうちの1つまたは部分集合(subset)の変数ノードを選択するステップと、選択されたもの以外の変数ノードにエビデンス(evidence)を設定することによって、グラフ形状において演算を実施するステップと、周辺化して新しいグラフを生成することによって、選択された変数ノードおよび1つまたは複数の階級ノードに対して結合分布(joint distribution)を計算するステップと、新しいグラフから、選択された変数ノードに対して変数影響指標(variable influence indicator)を計算するステップと、他の選択された変数ノードに対して、選択するステップ、実施するステップ、および計算するステップを繰り返すステップと、互いに関連する変数ノードに対する変数影響指標の大きさを評価するステップとを含む。 In one aspect, a method for determining an effect of a variable on a phenomenon includes a model component, at least one class node representing a class associated with the model component, and a value associated with a variable within the class. Providing a mixture model of a graphical form, including a plurality of variable nodes representing all physical data in the system experiencing the phenomenon and one or more of the variable nodes Select a variable node in a subset and perform an operation on the graph shape by setting evidence to variable nodes other than the selected one, and generate a new graph by marginalization To calculate a joint distribution for the selected variable node and one or more class nodes. And calculating a variable influence indicator for the selected variable node from the new graph and selecting, implementing and calculating for the other selected variable nodes. And a step of evaluating a magnitude of a variable influence index with respect to mutually related variable nodes.
別の態様では、新しいグラフは、f:P(X1,I|eX-Xj,eS)→P(X1’,I’)によって記述される変換であり、ここで、Iはモデルの成分を表し、Xは変数を表し、Sは階級全体にわたる状態または分布を表し、eはエビデンスを表す。 In another aspect, the new graph is a transformation described by f: P (X 1 , I | e X-Xj , e S ) → P (X 1 ′, I ′), where I is the model X represents a variable, S represents a state or distribution across the class, and e represents evidence.
他の態様では、変数影響指標は、変数ノードの値における方向変化(directional change)を表す。同様に、選択するステップ(selecting)は、用途(application)に応じて決まる可能性がある。その上、実施するステップは、変数影響指標の種類(type)を決定するために、パターンによってかつ優先順位づけ(sequencing)によってエビデンスを設定するステップを含んでよい。一実施形態では、現象は、航空機エンジンのシステム内で発生し、混合モデルが、航空機エンジンの性能を表す。 In another aspect, the variable impact indicator represents a directional change in the value of the variable node. Similarly, the selecting step may depend on the application. Moreover, the step of performing may include setting evidence by pattern and by sequencing to determine the type of variable impact indicator. In one embodiment, the phenomenon occurs in the aircraft engine system and the mixed model represents the performance of the aircraft engine.
以下の説明(description)では、解説(explanation)を目的として、本明細書で説明される技術の完全な理解をもたらすために、多くの具体的な詳細が明記される。しかし、例示的実施形態が、これらの具体的な詳細がなくても実施されうることは、当業者には明らかであろう。他の例(instance)では、例示的実施形態の説明を容易にするために、構造およびデバイスが、図表(diagram)の形で示される。 In the following description, for the purposes of explanation, numerous specific details are set forth in order to provide a thorough understanding of the techniques described herein. However, it will be apparent to one skilled in the art that the exemplary embodiments may be practiced without these specific details. In other instances, structures and devices are shown in diagram form in order to facilitate describing the exemplary embodiments.
例示的実施形態が、図面を参照して以下に説明される。これらの図面は、本明細書で説明される、モジュール、方法およびコンピュータプログラム製品を実施する具体的な実施形態について、一定の詳細を例示する。しかし、図面は、図面の中に存在しうる何らかの限定を課すものとして解釈されるべきではない。方法およびコンピュータプログラム製品は、それらの動作を遂行するために、任意の機械可読媒体にもたらされてよい。実施形態は、既存のコンピュータプロセッサを使用して、またはこの目的もしくは他の目的で組み込まれた専用コンピュータプロセッサによって、またはハードウェアシステムによって、実施されてよい。 Exemplary embodiments are described below with reference to the drawings. The drawings illustrate certain details of specific embodiments that implement the modules, methods, and computer program products described herein. However, the drawings should not be construed as imposing any limitations that may exist in the drawings. The method and computer program product may be provided on any machine-readable medium to perform those operations. Embodiments may be implemented using existing computer processors, or by dedicated computer processors incorporated for this or other purposes, or by hardware systems.
上述の通り、本明細書で説明される実施形態は、その媒体に記憶された機械実行可能命令またはデータ構造を収容もしくは保有するために、非一時的な機械可読媒体を備える、コンピュータプログラム製品を含む。そのような機械可読媒体は、汎用もしくは専用のコンピュータ、またはプロセッサを有する他の機械によってアクセス可能な、任意の利用可能な媒体であってよい。例として、そのような機械可読媒体は、機械実行可能命令もしくはデータ構造の形で所望のプログラムコードを収容もしくは記憶するために使用可能であり、汎用もしくは専用のコンピュータ、またはプロセッサを有する他の機械によってアクセス可能な、RAM、ROM、EPROM、EEPROM、CD−ROM、または他の光ディスク記憶装置、磁気ディスク記憶装置もしくは他の磁気記憶装置、または任意の他の媒体を備えてよい。情報が、ネットワークまたは別の通信接続(ハードウェア、無線、またはハードウェアと無線との組合せのいずれか)を介して機械に伝達もしくは提供されると、機械は、その接続を機械可読媒体として適切に調査する(view)。したがって、任意のそのような接続は、適切に、機械可読媒体と称される。また、上の組合せが、機械可読媒体の範囲内に含まれる。機械実行可能命令は、例えば、汎用コンピュータ、専用コンピュータまたは専用処理機械に、ある機能もしくは機能群を実施させる命令およびデータを含む。 As described above, the embodiments described herein provide a computer program product comprising a non-transitory machine-readable medium to contain or retain machine-executable instructions or data structures stored on the medium. Including. Such machine-readable media can be any available media that can be accessed by a general purpose or special purpose computer or other machine with a processor. By way of example, such machine-readable media can be used to contain or store the desired program code in the form of machine-executable instructions or data structures and may be a general purpose or special purpose computer or other machine having a processor. RAM, ROM, EPROM, EEPROM, CD-ROM, or other optical disk storage device, magnetic disk storage device or other magnetic storage device, or any other medium accessible by. When information is communicated or provided to a machine via a network or another communication connection (either hardware, wireless, or a combination of hardware and wireless), the machine will make the connection suitable as a machine-readable medium. Investigate (view). Thus, any such connection is suitably referred to as a machine readable medium. Combinations of the above are also included within the scope of machine-readable media. Machine-executable instructions comprise, for example, instructions and data which cause a general purpose computer, special purpose computer, or special purpose processing machines to perform a certain function or group of functions.
実施形態は、例えば、ネットワーク環境において機械で実行されるプログラムモジュールの形のプログラムコードなど、機械実行可能命令を含むプログラム製品によって一実施形態の中で実施されうる、方法ステップの一般的な関連の中で説明される。一般に、プログラムモジュールは、特定のタスクを実行する、または特定の抽象的データ型(abstract data type)を実施する技術的効果を有する、ルーチン、プログラム、オブジェクト、コンポーネント、データ構造などを含む。機械実行可能命令、関連するデータ構造、およびプログラムモジュールは、本明細書で開示する方法のステップを実行するためのプログラムコードの例を表す。そのような実行可能な命令または関連するデータ構造の特定のシーケンスは、そのようなステップの中で説明する機能を実施するための、対応する活動の例を表す。 Embodiments are generally associated with method steps that can be implemented in an embodiment by a program product that includes machine-executable instructions, such as, for example, program code in the form of program modules that are executed by machines in a network environment. Explained in. Generally, program modules include routines, programs, objects, components, data structures, etc. that have the technical effect of performing a specific task or implementing a specific abstract data type. Machine-executable instructions, associated data structures, and program modules represent examples of program code for executing steps of the methods disclosed herein. A particular sequence of such executable instructions or associated data structures represents an example of a corresponding activity for performing the functions described in such steps.
実施形態は、プロセッサを有する1つまたは複数のリモートコンピュータへの論理的な接続を使用するネットワーク環境の中で実施されてよい。論理的な接続は、限定ではない例によって本明細書で提示する、ローカルエリアネットワーク(LAN)および広域ネットワーク(WAN)を含んでよい。そのようなネットワーク環境は、オフィス内もしくは企業内のコンピュータネットワーク、イントラネットおよびインターネットにおいて一般的であり、広範な種類の異なる通信プロトコルを使用してよい。そのようなネットワークコンピューティング環境は、通常、パーソナルコンピュータ、ハンドヘルドデバイス、マルチプロセッサシステム、マイクロプロセッサベースのもしくはプログラム可能な家庭用電化製品、ネットワークPC、ミニコンピュータ、メインフレームコンピュータ、他を含む、多くの種類のコンピュータシステム構成を包含することは、当業者には明らかであろう。 Embodiments may be implemented in a network environment using logical connections to one or more remote computers having processors. Logical connections may include a local area network (LAN) and a wide area network (WAN) that are presented here by way of non-limiting examples. Such network environments are common in office or corporate computer networks, intranets and the Internet, and may use a wide variety of different communication protocols. Such network computing environments typically include many, including personal computers, handheld devices, multiprocessor systems, microprocessor-based or programmable consumer electronics, network PCs, minicomputers, mainframe computers, etc. It will be apparent to those skilled in the art to encompass various types of computer system configurations.
また、実施形態は、タスクが、通信ネットワークを介して(配線接続リンク、無線リンクによるか、または配線接続もしくは無線のリンクの組合せによるかのいずれかで)リンクされる、ローカルおよびリモートの処理デバイスによって実施される、分散コンピューティング環境の中で実行されてよい。分散コンピューティング環境では、プログラムモジュールは、ローカルおよびリモート両方のメモリ記憶装置の中に置かれてよい。 Embodiments also provide local and remote processing devices in which tasks are linked via a communications network (either by wired connection links, wireless links, or by a combination of wired connections or wireless links). Implemented in a distributed computing environment. In a distributed computing environment, program modules may be located in both local and remote memory storage devices.
例示的実施形態の全体または一部を実施するための例示的システムは、処理ユニット、システムメモリ、およびシステムメモリを含む種々のシステムの成分を処理ユニットに結合するシステムバスを含む、コンピュータの形態の汎用コンピューティングデバイスを含んでよい。システムメモリは、読み出し専用メモリ(ROM)およびランダムアクセスメモリ(RAM)を含んでよい。また、コンピュータは、磁気ハードディスクから読み出し、そこに書き込むための磁気ハードディスクドライブと、着脱交換式磁気ディスクから読み出し、そこに書き込むための磁気ディスクドライブと、CD−ROMもしくは他の光媒体などの着脱交換式光ディスクから読み出し、そこに書き込むための光ディスクドライブとを含んでよい。ドライブおよびそれらに関連する機械可読媒体は、機械実行可能命令、データ構造、プログラムモジュールおよび他のコンピュータ用データの不揮発性記憶装置を提供する。 An exemplary system for implementing all or part of an exemplary embodiment is in the form of a computer that includes a processing unit, a system memory, and a system bus that couples various system components including the system memory to the processing unit. A general purpose computing device may be included. The system memory may include read only memory (ROM) and random access memory (RAM). Also, the computer reads from the magnetic hard disk and writes to the magnetic hard disk drive, and the removable magnetic disk drive to read from and writes to the magnetic disk drive, and the removable exchange of CD-ROM or other optical media, etc. And an optical disk drive for reading from and writing to an optical disk. The drives and their associated machine-readable media provide non-volatile storage of machine-executable instructions, data structures, program modules and other computer data.
本実施形態で開示する方法の技術的効果は、より効率的に、機械内の特定の変質または故障モードに関連するパターンを検出すること、診断時間および故障点検時間を短縮すること、ならびにより良好な保全計画および維持計画を可能にすることを含む。 The technical effects of the method disclosed in this embodiment are more efficient to detect patterns associated with specific alterations or failure modes in the machine, reduce diagnostic and fault inspection times, and better Including enabling efficient maintenance and maintenance plans.
変数影響指標は、変数の「興味深い」挙動の目安を与えるために使用される。変数影響指標の用途の一例は、どの変数が異常な挙動に対する原因であるかを決定することである。変数影響指標は、混合モデルとして知られている、一種のデータ駆動型ビルトモデル(data driven built model)を使用して計算される。このモデルは、特定の用途に対して興味深い挙動を強調する方式で、履歴データ(historical data)を使用して訓練済みであるものとみなされる。混合モデルは、G. McLachlan and D. Peel in Finite Mixture Models, John Wiley & Sons, (2000)によって説明されるように、広範囲の物理現象をモデリングするための豊富な資源を提供する。混合モデルは、現象における正常な挙動をモデル化するため、およびそれにより、同様に、異常な挙動を検出するために使用されてよい。混合モデルからの尤度スコアが、異常な挙動を監視するために使用されてよい。本質的に、変数影響指標は、尤度スコアである。 The variable impact indicator is used to give an indication of the “interesting” behavior of the variable. One example of the use of a variable impact indicator is to determine which variable is responsible for abnormal behavior. The variable influence index is calculated using a kind of data driven built model known as a mixed model. This model is considered trained using historical data in a manner that highlights interesting behavior for a particular application. Mixed models provide an abundant resource for modeling a wide range of physical phenomena, as explained by G. McLachlan and D. Peel in Finite Mixture Models, John Wiley & Sons, (2000). A mixed model may be used to model normal behavior in a phenomenon, and thereby detect abnormal behavior as well. Likelihood scores from the mixed model may be used to monitor abnormal behavior. In essence, the variable influence measure is a likelihood score.
この関連における興味深い挙動は、変数が、混合モデルの密度の縁部に位置する空間の領域内に存在することを意味する。モデルは、これらの領域内に存在するデータに、より良く反応する。健全性監視など、多くの用途に対して、低密度空間の領域は、多くの場合、最も興味深い領域を表す。というのは、これらの領域内で動作する機械は、それらの設計限界(designed limit)の外で機能しているからである。 An interesting behavior in this context means that the variables exist in a region of space located at the edge of the density of the mixed model. The model responds better to the data present in these regions. For many applications, such as health monitoring, the area of low density space often represents the most interesting area. This is because machines operating in these areas are functioning outside their designed limits.
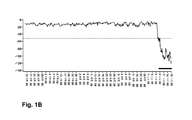
尤度スコアは、データが低密度の領域を通って推移するときに、有用な診断情報を提供することができる。尤度は、多くの場合、(健全性が悪化している、または感知が不規則に現れ、測定不良を伴う可能性がある、など)挙動についての情報を提供する、傾向的特性(trend characteristics)を明示する。このことを、図1Aおよび図1Bに示す。図1Aは、1つの所与の現象における8つの異なる変数の値のデータプロットを示す。図1Bは、図1Aのすべての入力変数に対する尤度スコアの時間履歴プロットである。ここで、本発明者らは、完全なデータに対する尤度は、いくつかの入力変数の形状を反映すること−完全なデータに対する尤度は、融合の形状をもたらし、すべての入力変数にわたる挙動を要約すること(尤度は、常に対数空間で示されることに留意されたい)−を知る。すべての入力変数に対する完全な履歴が、高密度領域内に存在するならば、尤度スコアにおいて、いかなる形状(下降傾向)も存在しない。また、尤度スコアの大きさは、異常に挙動する入力変数の数によって決まる。 Likelihood scores can provide useful diagnostic information as the data transitions through low density regions. Likelihood is often a trend characteristic that provides information about behavior (such as poor health or perceived irregularity, possibly with poor measurement). ) Is specified. This is illustrated in FIGS. 1A and 1B. FIG. 1A shows a data plot of the values of eight different variables in one given phenomenon. FIG. 1B is a time history plot of likelihood scores for all input variables of FIG. 1A. Here, we believe that the likelihood for complete data reflects the shape of some input variables-the likelihood for complete data results in the shape of the fusion, and the behavior across all input variables. Summarize (note that likelihood is always shown in log space). If a complete history for all input variables exists in the high density region, there is no shape (downtrend) in the likelihood score. In addition, the likelihood score is determined by the number of input variables that behave abnormally.
尤度スコアは、混合モデルが、データの時間履歴の最終の部分に関連するレベルで動作するデータの経験を、ほとんど持たないことを明示する。混合モデルが正常な挙動を表すように訓練されているならば、尤度スコアは、より一層異常な挙動を明示する。しかし、尤度スコアが異常な挙動を示すとしても、尤度スコアは、入力変数のうちのどの組合せが異常に挙動しているかを示すものではない。さらに、直接、入力変数と共に動作しているときに、この情報を導き出すことは容易ではない。これは、これらの入力変数の規模(scale)および統計的性質が、大幅に変化する可能性があるからである。変数影響指標は、どの変数が、ある異常に顕著に寄与する化を明示することができる。 The likelihood score demonstrates that the mixed model has little experience with data operating at the level associated with the final portion of the data's time history. If the mixed model is trained to represent normal behavior, the likelihood score will reveal even more abnormal behavior. However, even if the likelihood score shows an abnormal behavior, the likelihood score does not indicate which combination of input variables behaves abnormally. Furthermore, it is not easy to derive this information when working directly with input variables. This is because the scale and statistical properties of these input variables can change significantly. The variable influence index can clearly indicate which variables contribute significantly to a certain abnormality.
変数影響指標は対数尤度スコアであるが、情報を明示するために特定の方法で計算される。このことは、混合モデルを、興味深い挙動を明示する方式で生成する必要があることを意味する。好都合には、このことは、混合モデルをグラフ形状で説明するときに明白にされる。 The variable influence index is a log-likelihood score, but is calculated in a specific way to clarify the information. This means that the mixed model needs to be generated in a manner that demonstrates interesting behavior. Conveniently, this is made clear when the mixed model is described in graphical form.
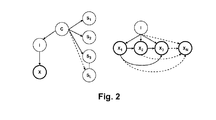
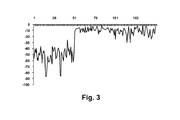
標準的混合モデルは、混合成分(時に「クラスタ」としても知られる)を表す離散的な親ノードに接続されたガウス分布を有する。このことを、図2に示す。本発明の一実施形態では、変数影響指標を計算するためのモデルは、フィルタとして働く追加ノードを含む。これらのノードは、多くの場合離散的であるが、連続的であって良い。これらのフィルタは、予測を実施するとき、モデルの成分の混合の重みを変えるように設定されて良い。例えば、異なる成分(または成分の組合せ)が個々の階級と関連し、ケース(case)の階級が知られているならば、現在の階級の表現(representation)を除去して、すべての他の階級の観点から現在のケースの表示(view)を得ることができる。尤度スコアにおけるそのようなフィルタリングの効果を示す特定の例を、図3に示す。これは、よく知られているアヤメの計測値(Iris flower data set)−それぞれの種の中に50ケースを有する3つの種のアヤメからの、萼片と花弁との測定値の一組を含む簡単なデータ集合−に対して築かれたモデルによるものである。すべての入力変数を使用する対数尤度が、それぞれの種に対して示される。予測は、現在の種に関連する成分が計算に使用されないことを確実にするフィルタを使用して実施される。この種類の予測は、種のうちのどの種が、(もし存在すれば)最も異なっているかを示すことができる。図3は、種がSetosaであることを示し、Setosaは、これらのような簡単なデータに対して、散布図をプロットすることによって容易に確認されうる(尤度スコアは、最初にSetosa、次にVersicolor、その次にVirginicaがプロットされて、種の順に並べられる)。 A standard mixture model has a Gaussian distribution connected to discrete parent nodes that represent the mixture components (sometimes also known as “clusters”). This is shown in FIG. In one embodiment of the invention, the model for calculating the variable impact indicator includes an additional node that acts as a filter. These nodes are often discrete, but can be continuous. These filters may be set to change the mixing weight of the model components when performing the prediction. For example, if different components (or combinations of components) are associated with individual classes and the case class is known, the representation of the current class is removed and all other classes are removed. You can get a view of the current case from the point of view. A specific example showing the effect of such filtering on the likelihood score is shown in FIG. This is a well-known Iris flower data set--a simple set containing sepal and petal measurements from three species of iris with 50 cases in each species It is based on a model built for a large data set. The log likelihood using all input variables is shown for each species. The prediction is performed using a filter that ensures that the components associated with the current species are not used in the calculation. This type of prediction can indicate which of the species is most different (if any). FIG. 3 shows that the species is Setosa, which can be easily ascertained by plotting a scatter plot against simple data like these (likelihood scores are first setosa, then Versicor and then Virginica are plotted in the order of species).
図2で、Iは、モデルの成分を表し、Xは、X1、X2、X3...XNを含む多変量ガウシアンである。ノードCは、階級変数を表す。一実施形態では、ノードSLは、階級内の変数の値(すなわち、個別の階級)を示す。ノードCは、階級の数に相当する状態の数(各SLに対して1つの状態)を有する。各SLの分布は、通常、バイナリであり、現在の階級(SLに相当)が活性されていない(すなわち、モデルの予測から除去されている)ときに、すべての他の階級が活性化されたままであるようにエンコードされる。また、分布は、このフィルタリングの逆を実施するようにエンコードされてよい。別の実施形態では、ノードSLは、各ノードがノードCの値全体にわたって、1つの「ソフト」エビデンス('soft' evidence)の形状をエンコードする、連続ノードであってよい。 In FIG. 2, I represents a component of the model, and X represents X 1 , X 2 , X 3 . . . It is a multivariate Gaussian, including X N. Node C represents a class variable. In one embodiment, node S L indicates the value of a variable within the class (ie, an individual class). Node C has a number of states corresponding to the number of classes (one state for each S L). The distribution of each S L is usually binary and all other classes are activated when the current class (corresponding to S L ) is not activated (ie removed from the model prediction). Encoded as it is. The distribution may also be encoded to perform the inverse of this filtering. In another embodiment, node S L may be a continuous node where each node encodes the shape of one “soft” evidence across the values of node C.
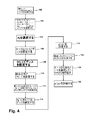
図2に示すような混合モデルを使用する変数影響指標を評価する方法の流れ図の一例を、図4に示す。この方法では、変数影響指標は、グラフィック変換およびグラフィック推定(graphical transformations and inference)を使用して計算されてよい。変換は、新しいグラフ構造を結果的にもたらす、グラフ構造上の演算である。推定は、エビデンスを入力するステップ(1つまたは複数のノードに値を割り当てるステップ)と、結合確率(joint probability)または個々のノードの確率を計算するステップとを含む。異なる変換および推定のステップが、異なる挙動の特徴を明示する、変数影響指標の異なる変量(variant)を与える。例えば、航空機エンジンの挙動のモデルを考える。排気ガス温度は、フライト中の特定のフェーズに対する動作の正常範囲を有し、非常に高い値または非常に低い値は、異常な挙動の前兆となりうる。1つの種類の変数影響指標は、この「範囲外の」異常な挙動を監視するために使用されてよい。別の種類の変数影響指標は、測定パラメータ(燃料流量および低圧スプール測度など)の間に相関が存在するとき、異常な挙動の異なるパターンを監視するために使用されてよい。個々の測定値は正常な範囲内にあるのに、パラメータ全体にわたるパターンが、異常であることがありうる(例えば、相関の喪失がある場合)。 An example of a flow chart of a method for evaluating a variable influence index using a mixed model as shown in FIG. In this way, variable influence measures may be calculated using graphical transformations and inference. A transformation is an operation on a graph structure that results in a new graph structure. The estimation includes inputting evidence (assigning values to one or more nodes) and calculating joint probabilities or individual node probabilities. Different transformations and estimation steps give different variants of the variable influence index that clearly characterize different behaviors. For example, consider a model of aircraft engine behavior. Exhaust gas temperature has a normal range of operation for a particular phase in flight, and very high or very low values can be a precursor to abnormal behavior. One type of variable impact indicator may be used to monitor this “out of range” abnormal behavior. Another type of variable influence indicator may be used to monitor different patterns of abnormal behavior when there is a correlation between measurement parameters (such as fuel flow and low pressure spool measures). Although individual measurements are within normal ranges, the pattern across the parameters can be abnormal (eg, when there is a loss of correlation).
図4では、100で、リストYが、空白に初期化される。このリストは、処理が完了した測定ノードの経過(track)を保持する。102で、図2で説明したような混合モデルが、グラフを使って定義される。104で、変数ノードXJのうちの1つが選択され、106で、エビデンスが、XJを除くすべての変数の測定ノードに対して生成される。エビデンスが存在し、真とみなされる(例えば、測定値が、あり得ない値であるとみなされうる)ときだけ、エビデンスが入力される。必要であれば、108で、エビデンスが、Sに属する変数の上に設定される。次いで、110で、XjおよびIに対する結合分布が計算される。次いで、112で、110で計算された結合分布をエンコードする新しいノードXj’およびI’を含む、新しいグラフが生成される。新しいグラフに対する変換の一例が、以下のように示されうる、
f:P(X1,I|eX-Xj,eS)→P(X1’,I’)、
ここで、Iはモデルの成分を表し、Xは変数を表し、Sは階級全体にわたる状態または分布を表し、eはエビデンスを示す。114で、エビデンスがXj’の上に設定され(このエビデンスはxjで示される)、116で、p(xj)が計算される。118で、Xjが完成されたリストYに追加され、新しいノードが選択され、プロセスが104から繰り返される。p(xj)の対数が、Xjに対する基本的な変数影響指標である。一例として、図2のグラフを考える。本発明者らは、X2、X3およびX4との関連で、X1に対する変数影響指標を計算したい。また、本発明者らは、このケースが、階級S2からであることを知っている(本例では、Sの中のすべてのノードは離散的であるが、それらは連続的であってよく、または離散的と連続的の組合せであってよい)。本発明者らは、本ケースに対する値を、以下の
X1=x1、X2=x2、X3=x3、X4=x4、Class=S2
ように示す。
In FIG. 4, at 100, list Y is initialized to blank. This list keeps track of the measurement nodes that have been processed. At 102, a mixed model as described in FIG. 2 is defined using a graph. At 104, one of the variable nodes X J is selected, and at 106, evidence is generated for the measurement nodes for all variables except X J. Evidence is entered only when evidence exists and is considered true (eg, a measured value can be considered an impossible value). If necessary, at 108, evidence is set on variables belonging to S. Then, at 110, the bond distribution for X j and I is calculated. Then, at 112, a new graph is generated that includes new nodes X j ′ and I ′ that encode the joint distribution calculated at 110. An example of a transformation for a new graph can be shown as follows:
f: P (X 1 , I | e X-Xj , e S ) → P (X 1 ′, I ′),
Here, I represents a component of the model, X represents a variable, S represents a state or distribution over the entire class, and e represents evidence. At 114, evidence is set on X j ′ (this evidence is indicated by x j ), and at 116, p (x j ) is calculated. At 118, X j is added to the completed list Y, a new node is selected, and the process is repeated from 104. The logarithm of p (x j ) is a basic variable influence index for X j . As an example, consider the graph of FIG. We want to calculate a variable influence index for X 1 in the context of X 2 , X 3 and X 4 . We also know that this case is from the class S 2 (in this example, all nodes in S are discrete, but they may be continuous). Or a combination of discrete and continuous). The inventors set values for this case as follows: X 1 = x 1 , X 2 = x 2 , X 3 = x 3 , X 4 = x 4 , Class = S 2
As shown.
エビデンスが入力され、112で、新しいグラフが、(X1,I):
f:P(X1,I|x2,x3,x4,S2=true)→P(X1’,I’)
に対する結合分布を要求することによって生成される。関数fは、新しいグラフを生成するために、周辺化(marginalization)を引用する。上付き文字’は、新しい分布を有する新しい変数を示す。周辺化は、Bayesian Networks and Decision Graphs, Finn V. Jensen and Thomas D. Nielsen, Springer (2007)において教示されるように、グラフに適用される標準的な方法である。新しいグラフをインスタンス化する(instantiate)ことで、さらなる予測を実施することが可能になる。この例におけるX1に対する基本的な変数影響指標は
p(x1)
であり、116で、新しいグラフから計算される。
Evidence is entered and at 112, a new graph is (X 1 , I):
f: P (X 1 , I | x 2 , x 3 , x 4 , S 2 = true) → P (X 1 ′, I ′)
Generated by requesting a joint distribution for. The function f quotes marginalization to generate a new graph. The 'superscript' indicates a new variable with a new distribution. Peripheralization is a standard method applied to graphs, as taught in Bayesian Networks and Decision Graphs, Finn V. Jensen and Thomas D. Nielsen, Springer (2007). By instantiating a new graph, further predictions can be performed. The basic variable influence index for X 1 in this example is p (x 1 )
And is calculated from the new graph at 116.
エビデンスを設定するプロセスは、作成された変数影響指標の変量を決定する。例えば、範囲外の一変量データに良く反応する変数影響指標を計算するために、他の変数上のエビデンスは、設定されない。しかし、他の連続変数のエビデンスは、新しいグラフィックモデル(graphical model)に入れられるノードIの後部重み付け(posterior weighting)を決定するために、エビデンスとして依然として使用されてよい。さらに、後部重み付けを計算するためのこのエビデンスの設定は、ノードXNが独立であるとみなされている間は、反復されてよい。この反復は、エビデンスノードのうちの1つに対してエビデンスを入力するステップと、I上の分布を記録するステップと、すべての他のエビデンスノードに対して繰り返すステップと、次いでI内の各状態に対して、記録された分布の積を計算するステップとを伴う。したがって、ステップ120で、他の変数ノードに対して変数影響指標を選択するステップ、生成するステップ、実施するステップ、および計算するステップのプロセスが繰り返され、それにより、選択された変数ノードの影響を決定するために、122で、変数影響指標の(プロットされたような)大きさが、互いに対して評価されてよい。122での評価は、所定の基準(criterion)に対する比較によって自動化されてよく、またはプロットされた分布の目視検査による手動であってよい。それゆえ、変数影響指標の変量の計算には柔軟性が存在し、最も適切な変量は、用途によって決まる。
The process of setting evidence determines the variables of the created variable impact indicator. For example, no evidence on other variables is set to calculate a variable impact index that responds well to univariate data outside the range. However, other continuous variable evidence may still be used as evidence to determine the posterior weighting of node I that will be put into the new graphical model. Furthermore, this evidence setting for calculating the back weight may be repeated while node X N is considered independent. This iteration consists of entering evidence for one of the evidence nodes, recording a distribution on I, repeating for all other evidence nodes, then each state in I For calculating the product of the recorded distributions. Accordingly, in
また、変数影響指標は、元の変数における方向変化を反映するように符号を付けられてよい。例えば、測定パラメータが下降の傾向を示すならば、変数影響指標における傾向と同じ方向を有することが有用でありうる。変数影響指標に符号を付けるための簡単な方法は、新しいグラフを生成するために設定するエビデンスと同じ経路をたどることである。次いで、実際の値(例えば、x1)が、周辺分布(marginal distribution)の平均値を用いて比較されてよい。値が平均より低いならば、変数影響指標は負の符号を有し、平均を超えるならば、正の符号を有する。 Also, the variable influence index may be signed to reflect the direction change in the original variable. For example, if the measured parameter shows a downward trend, it may be useful to have the same direction as the trend in the variable impact indicator. A simple way to sign a variable impact indicator is to follow the same path as the evidence you set to generate a new graph. The actual value (eg, x 1 ) may then be compared using the average value of the marginal distribution. If the value is lower than the average, the variable influence index has a negative sign, and if it exceeds the average, it has a positive sign.
また、変数影響指標は、適合性スコア(fitness score)およびモデルの閾値に対して拡縮されてよい。 In addition, the variable influence index may be scaled with respect to the fitness score and the model threshold.
変数XNが従属集合とみなされるとき、異常な変数は、他の変数の変数影響指標に対して大きな影響を与える可能性がある。このような状況では、外側のループが、図4に示すデータの流れの上に置かれてよい。次いで、図4のプロセスが実行されて、最大の影響を有する変数が検出される。この変数は、NULLに設定されて欠落として扱われ、図4のプロセスが繰り返される。プロセスは、残りの変数(すなわち、NULLに設定されない変数)が、正常とみなされる集合的尤度スコア(collective likelihood score)を有するときに終了する。図4のプロセスを繰り返す別の変形では、XNの中の変数の異なる部分集合(組合せ)が、NULLに設定されてよい。Nが小さいとき、XNのすべての組合せに対して、図4のプロセスを余すところなく実行することが可能である。小さなNの定義は、用途によって決まり、利用可能なコンピューティング資源、データ負荷および用途によって要求されるシステム応答時間を考慮することによって定義される。 When the variable X N is regarded as a dependent set, an abnormal variable can have a great influence on the variable influence index of other variables. In such a situation, the outer loop may be placed on the data flow shown in FIG. The process of FIG. 4 is then performed to find the variable with the greatest impact. This variable is set to NULL and treated as missing and the process of FIG. 4 is repeated. The process ends when the remaining variables (ie, variables not set to NULL) have a collective likelihood score that is considered normal. In another variation repeating the process of FIG. 4, different subset of variables in the X N (combination) may be set to NULL. When N is small, for all combinations of X N, it is possible to perform the very best process of FIG. The small N definition depends on the application and is defined by considering the available computing resources, data load and system response time required by the application.
図1Aに示す入力データに対して計算された変数影響指標の一例を、図5に示す。異なる種類の変数影響指標が、一変量の外れ値(outlier)および多変量の外れ値、または無相関など、異なる種類の異常についての情報を提供することができる。変数影響指標の種類は、入力されたエビデンスのパターンおよび入力されたエビデンスの優先順位付けによって決定されてよい。 An example of the variable influence index calculated for the input data shown in FIG. 1A is shown in FIG. Different types of variable impact indicators can provide information about different types of abnormalities, such as univariate outliers and multivariate outliers, or uncorrelated. The type of variable impact indicator may be determined by the input evidence pattern and prioritization of the input evidence.
この書面による説明は、本発明を、その最良のモードを含めて開示するため、かつ、同様に、当業者が本発明を作製し使用することを可能にするために、例を使用する。本発明の特許性のある範囲は特許請求の範囲によって定義され、当業者が想到する他の例を含んでよい。そのような他の例は、特許請求の範囲の字義通りの言葉に相違しない構造要素を有するならば、または特許請求の範囲の字義通りの言葉とごくわずかな差違を有する等価な構造要素を含むならば、特許請求の範囲の中にあることが意図されている。 This written description uses examples to disclose the invention, including its best mode, and also to enable any person skilled in the art to make and use the invention. The patentable scope of the invention is defined by the claims, and may include other examples that occur to those skilled in the art. Such other examples include structural elements that do not differ in literal terms from the claims, or equivalent structural elements that have negligible differences from literal terms in the claims. If so, it is intended to be within the scope of the claims.
I モデルの成分
X 変数
C 階級変数
S 階級
e エビデンス
I Model Components X Variable C Class Variable S Class e Evidence
Claims (9)
モデルの成分と、前記モデルの成分に関連する階級を表す少なくとも1つの階級ノードと、前記現象を経験するシステム内の物理データをすべて表す複数の変数ノードとを含む、グラフ形状の、非一時的媒体内の混合モデルを提供するステップと、
プロセッサの中で、前記非一時的媒体から、前記複数の変数ノードのうちの少なくとも1つの変数ノードを選択するステップと、
前記複数の変数ノードのうちの前記選択された少なくとも1つの変数ノード以外の前記複数の変数ノードにエビデンスを設定することによって、前記グラフ形状において演算を実施するステップと、
周辺化して新しいグラフを生成することによって、前記複数の変数ノードのうちの前記選択された1つの変数ノード、および前記少なくとも1つの階級ノードに対して結合分布を計算するステップと、
前記新しいグラフから、前記複数の変数ノードのうちの前記選択された1つの変数ノードに対して変数影響指標を計算するステップと、
前記複数の変数ノードのうちの他の選択された変数ノードに対して、選択するステップ、実施するステップ、および計算するステップを繰り返すステップと、
互いに関連する前記複数の変数ノードに対する前記変数影響指標の大きさを評価するステップとを含む、方法。 A method for determining the effect of a variable on a phenomenon,
A graph-shaped, non-transitory, comprising a model component, at least one class node representing a class associated with the model component, and a plurality of variable nodes representing all physical data in the system experiencing the phenomenon Providing a mixed model in the medium;
Selecting at least one variable node of the plurality of variable nodes from the non-transitory medium in a processor;
Performing operations on the graph shape by setting evidence for the plurality of variable nodes other than the selected at least one variable node of the plurality of variable nodes;
Computing a joint distribution for the selected one of the plurality of variable nodes and the at least one class node by marginalizing to generate a new graph;
Calculating a variable impact index for the selected one of the plurality of variable nodes from the new graph;
Repeating the selecting, performing and calculating steps for other selected variable nodes of the plurality of variable nodes;
Evaluating the magnitude of the variable impact indicator for the plurality of variable nodes associated with each other.
Applications Claiming Priority (2)
| Application Number | Priority Date | Filing Date | Title |
|---|---|---|---|
| US13/023,181 US8560279B2 (en) | 2011-02-08 | 2011-02-08 | Method of determining the influence of a variable in a phenomenon |
| US13/023,181 | 2011-02-08 |
Publications (2)
| Publication Number | Publication Date |
|---|---|
| JP2012164314A true JP2012164314A (en) | 2012-08-30 |
| JP2012164314A5 JP2012164314A5 (en) | 2015-03-19 |
Family
ID=45655393
Family Applications (1)
| Application Number | Title | Priority Date | Filing Date |
|---|---|---|---|
| JP2012023565A Pending JP2012164314A (en) | 2011-02-08 | 2012-02-07 | Method of determining influence of variable in phenomenon |
Country Status (7)
| Country | Link |
|---|---|
| US (1) | US8560279B2 (en) |
| EP (1) | EP2492829A1 (en) |
| JP (1) | JP2012164314A (en) |
| CN (1) | CN102693262B (en) |
| BR (1) | BR102012002812A8 (en) |
| CA (1) | CA2766560A1 (en) |
| IN (1) | IN2012DE00312A (en) |
Families Citing this family (9)
| Publication number | Priority date | Publication date | Assignee | Title |
|---|---|---|---|---|
| US9940405B2 (en) | 2011-04-05 | 2018-04-10 | Beyondcore Holdings, Llc | Automatically optimizing business process platforms |
| US8560279B2 (en) * | 2011-02-08 | 2013-10-15 | General Electric Company | Method of determining the influence of a variable in a phenomenon |
| US20120209575A1 (en) * | 2011-02-11 | 2012-08-16 | Ford Global Technologies, Llc | Method and System for Model Validation for Dynamic Systems Using Bayesian Principal Component Analysis |
| US10802687B2 (en) * | 2011-12-04 | 2020-10-13 | Salesforce.Com, Inc. | Displaying differences between different data sets of a process |
| US10796232B2 (en) * | 2011-12-04 | 2020-10-06 | Salesforce.Com, Inc. | Explaining differences between predicted outcomes and actual outcomes of a process |
| EP2645257A3 (en) * | 2012-03-29 | 2014-06-18 | Prelert Ltd. | System and method for visualisation of behaviour within computer infrastructure |
| CA2932069A1 (en) * | 2013-11-29 | 2015-06-04 | Ge Aviation Systems Limited | Method of construction of anomaly models from abnormal data |
| CN106156067B (en) * | 2015-03-30 | 2019-11-01 | 日本电气株式会社 | For creating the method and system of data model for relation data |
| US11232175B2 (en) | 2019-03-28 | 2022-01-25 | Nec Corporation | Method, system, and computer program product for determining causality |
Citations (3)
| Publication number | Priority date | Publication date | Assignee | Title |
|---|---|---|---|---|
| JPS60171507A (en) * | 1984-02-16 | 1985-09-05 | Nippon Atom Ind Group Co Ltd | Diagnosis method for plant fault |
| US20080177513A1 (en) * | 2007-01-04 | 2008-07-24 | Fisher-Rosemount Systems, Inc. | Method and System for Modeling Behavior in a Process Plant |
| JP2009086706A (en) * | 2007-09-27 | 2009-04-23 | Fujitsu Ltd | Model creation support system, method and program |
Family Cites Families (7)
| Publication number | Priority date | Publication date | Assignee | Title |
|---|---|---|---|---|
| US6671661B1 (en) * | 1999-05-19 | 2003-12-30 | Microsoft Corporation | Bayesian principal component analysis |
| US7636651B2 (en) * | 2003-11-28 | 2009-12-22 | Microsoft Corporation | Robust Bayesian mixture modeling |
| US7519564B2 (en) * | 2004-11-16 | 2009-04-14 | Microsoft Corporation | Building and using predictive models of current and future surprises |
| US8775358B2 (en) | 2007-11-30 | 2014-07-08 | Massachusetts Institute Of Technology | Method and apparatus for performing probabilistic inference and providing related solution methods |
| WO2011016928A1 (en) * | 2009-08-07 | 2011-02-10 | Exxonmobil Upstream Research Company | Drilling advisory systems and method based on at least two controllable drilling parameters |
| US8306791B2 (en) * | 2009-12-21 | 2012-11-06 | United Technologies Corporation | Method and system for modeling the performance of a gas turbine engine |
| US8560279B2 (en) * | 2011-02-08 | 2013-10-15 | General Electric Company | Method of determining the influence of a variable in a phenomenon |
-
2011
- 2011-02-08 US US13/023,181 patent/US8560279B2/en active Active
-
2012
- 2012-02-02 CA CA2766560A patent/CA2766560A1/en not_active Abandoned
- 2012-02-03 IN IN312DE2012 patent/IN2012DE00312A/en unknown
- 2012-02-06 EP EP12154062A patent/EP2492829A1/en not_active Ceased
- 2012-02-07 BR BR102012002812A patent/BR102012002812A8/en not_active IP Right Cessation
- 2012-02-07 JP JP2012023565A patent/JP2012164314A/en active Pending
- 2012-02-08 CN CN201210034651.3A patent/CN102693262B/en active Active
Patent Citations (3)
| Publication number | Priority date | Publication date | Assignee | Title |
|---|---|---|---|---|
| JPS60171507A (en) * | 1984-02-16 | 1985-09-05 | Nippon Atom Ind Group Co Ltd | Diagnosis method for plant fault |
| US20080177513A1 (en) * | 2007-01-04 | 2008-07-24 | Fisher-Rosemount Systems, Inc. | Method and System for Modeling Behavior in a Process Plant |
| JP2009086706A (en) * | 2007-09-27 | 2009-04-23 | Fujitsu Ltd | Model creation support system, method and program |
Also Published As
| Publication number | Publication date |
|---|---|
| CN102693262A (en) | 2012-09-26 |
| US8560279B2 (en) | 2013-10-15 |
| CN102693262B (en) | 2017-01-18 |
| EP2492829A1 (en) | 2012-08-29 |
| CA2766560A1 (en) | 2012-08-08 |
| BR102012002812A2 (en) | 2017-11-07 |
| BR102012002812A8 (en) | 2017-11-21 |
| IN2012DE00312A (en) | 2015-04-10 |
| US20120203517A1 (en) | 2012-08-09 |
Similar Documents
| Publication | Publication Date | Title |
|---|---|---|
| JP2012164314A (en) | Method of determining influence of variable in phenomenon | |
| Alaswad et al. | A review on condition-based maintenance optimization models for stochastically deteriorating system | |
| Peng et al. | A prognosis method using age-dependent hidden semi-Markov model for equipment health prediction | |
| Moghaddass et al. | An integrated framework for online diagnostic and prognostic health monitoring using a multistate deterioration process | |
| KR101713985B1 (en) | Method and apparatus for prediction maintenance | |
| Louit et al. | A practical procedure for the selection of time-to-failure models based on the assessment of trends in maintenance data | |
| EP3847586A1 (en) | Computer-implemented method, computer program product and system for anomaly detection and/or predictive maintenance | |
| US20100138368A1 (en) | Methods and systems for self-improving reasoning tools | |
| CN104350471A (en) | Detecting anomalies in real-time in multiple time series data with automated thresholding | |
| JP6711323B2 (en) | Abnormal state diagnosis method and abnormal state diagnosis device | |
| Skordilis et al. | A condition monitoring approach for real-time monitoring of degrading systems using Kalman filter and logistic regression | |
| Lazarova-Molnar et al. | Data-driven fault tree modeling for reliability assessment of cyber-physical systems | |
| Wang et al. | Availability analysis and preventive maintenance planning for systems with general time distributions | |
| Moallemi et al. | Robust decision making and Epoch–Era analysis: A comparison of two robustness frameworks for decision-making under uncertainty | |
| Yang et al. | A physics-informed Run-to-Run control framework for semiconductor manufacturing | |
| Baek | An intelligent condition‐based maintenance scheduling model | |
| GB2465861A (en) | A reasoning inference making tool for recommending actions based on a hybridisation of a data driven model and knowledge based logic. | |
| Gupta et al. | Collaborative creation with customers for predictive maintenance solutions on hitachi iot platform | |
| Burmeister et al. | Exploration of production data for predictive maintenance of industrial equipment: A case study | |
| US10394255B2 (en) | Diagnostic device and method for monitoring frictional behavior in a control loop | |
| Ragab et al. | Remaining useful life prognostics using pattern-based machine learning | |
| Terceno et al. | Economic-financial forecasting model of businesses using fuzzy relations | |
| Agrell et al. | Pitfalls of machine learning for tail events in high risk environments | |
| JP2022127958A (en) | Business improvement support device, program, and storage medium storing program | |
| Shahraki et al. | Predicting remaining useful life based on instance-based learning |
Legal Events
| Date | Code | Title | Description |
|---|---|---|---|
| A521 | Request for written amendment filed |
Free format text: JAPANESE INTERMEDIATE CODE: A523 Effective date: 20150202 |
|
| A621 | Written request for application examination |
Free format text: JAPANESE INTERMEDIATE CODE: A621 Effective date: 20150202 |
|
| A977 | Report on retrieval |
Free format text: JAPANESE INTERMEDIATE CODE: A971007 Effective date: 20151224 |
|
| A131 | Notification of reasons for refusal |
Free format text: JAPANESE INTERMEDIATE CODE: A131 Effective date: 20160126 |
|
| A521 | Request for written amendment filed |
Free format text: JAPANESE INTERMEDIATE CODE: A523 Effective date: 20160420 |
|
| A02 | Decision of refusal |
Free format text: JAPANESE INTERMEDIATE CODE: A02 Effective date: 20160927 |
|
| A521 | Request for written amendment filed |
Free format text: JAPANESE INTERMEDIATE CODE: A523 Effective date: 20170123 |
|
| A911 | Transfer to examiner for re-examination before appeal (zenchi) |
Free format text: JAPANESE INTERMEDIATE CODE: A911 Effective date: 20170202 |
|
| A912 | Re-examination (zenchi) completed and case transferred to appeal board |
Free format text: JAPANESE INTERMEDIATE CODE: A912 Effective date: 20170310 |