JP2010121975A - Sound-source localizing device - Google Patents
Sound-source localizing device Download PDFInfo
- Publication number
- JP2010121975A JP2010121975A JP2008293831A JP2008293831A JP2010121975A JP 2010121975 A JP2010121975 A JP 2010121975A JP 2008293831 A JP2008293831 A JP 2008293831A JP 2008293831 A JP2008293831 A JP 2008293831A JP 2010121975 A JP2010121975 A JP 2010121975A
- Authority
- JP
- Japan
- Prior art keywords
- sound source
- eigenvalue
- sound
- frequency
- eigenvalues
- Prior art date
- Legal status (The legal status is an assumption and is not a legal conclusion. Google has not performed a legal analysis and makes no representation as to the accuracy of the status listed.)
- Pending
Links
Images
Landscapes
- Obtaining Desirable Characteristics In Audible-Bandwidth Transducers (AREA)
- Circuit For Audible Band Transducer (AREA)
- Measurement Of Velocity Or Position Using Acoustic Or Ultrasonic Waves (AREA)
Abstract
Description
この発明は実環境における音源定位技術に関し、特に、実環境におけるMUSIC(MUltiPle SIgnal Classification)法を用いた音源定位の技術に関する。 The present invention relates to a sound source localization technique in a real environment, and more particularly, to a sound source localization technique using a MUSIC (MultiPle Signal Classification) method in a real environment.
人とロボットとの音声コミュニケーションにおいて、ロボットに取付けたマイクロホンは通常離れた位置(1m以上)にあり、例えば電話音声のようにマイクと口との距離が数センチの場合と比べて、信号と雑音の比(SNR)は低くなる。このため、傍にいる他人の声や環境の雑音が妨害音となり、ロボットによる目的音声の認識が難しくなる。従って、ロボットへの応用として、音源定位や音源分離は重要である。 In voice communication between a person and a robot, the microphone attached to the robot is usually located at a distance (1 m or more). Compared to the case where the distance between the microphone and the mouth is several centimeters, such as telephone voice, the signal and noise The ratio (SNR) is low. For this reason, the voices of others nearby and the noise of the environment become interference sounds, making it difficult for the robot to recognize the target speech. Therefore, sound source localization and sound source separation are important for robot applications.
音源定位に関しては過去にさまざまな研究がされている。しかし、その大半ではシミュレーション・データ又はラボ・データのみが使用され、ロボットが動作する実環境のデータを評価するものは少ない。3次元の音源定位を評価する研究も少ない。発話相手の顔を見ながら話したり聞いたりすることも人間とロボットの対話インタラクションを改善するための重要なビヘービアであり、そのためには3次元の音源定位も重要となる。 Various studies have been conducted on sound source localization in the past. However, most of them use only simulation data or lab data, and few evaluate real-world data in which the robot operates. There are few studies to evaluate 3D sound source localization. Talking and listening while looking at the face of the utterance partner is also an important behavior for improving the interaction between humans and robots. For that purpose, three-dimensional sound source localization is also important.
実環境を想定した従来技術として特許文献1に記載のものがある。特許文献1に記載の技術は、分解能が高いMUSIC法と呼ばれる有名な音源定位の手法を用いている。
There exists a thing of
特許文献1に記載の発明では、マイクロホンアレイを用い、マイクロホンアレイからの信号をフーリエ変換し、その結果得られた受信信号ベクトルと、過去の相関行列とに基づいて現在の相関行列を計算する。このようにして求められた相関行列を固有値分解し、最大固有値と、最大固有値以外の固有値に対応する固有ベクトルである雑音空間とを求める。さらに、マイクロホンアレイのうちの1つのマイクロホンを基準として、各マイクの出力の位相差と、雑音空間と、最大固有値とに基づいて、MUSIC法により音源の方向を推定する。
MUSIC法は分解能が高いという特長があるが、MUSIC法を使用する場合には音源の数を与えなければならないという問題がある。特許文献1に記載の技術では、音源は一つであることが想定されているため、こうした問題は生じない。しかし、実際にロボットが稼動する環境としてはそのような環境であることはまれで、常に複数の音源が存在しており、しかもその数は一定していない。MUSIC法を用いる場合、音源の数の予測を誤ると音源定位も誤ってしまい、ロボットが人間と正しくインタラクションをすることが困難となってしまう。
The MUSIC method has a feature of high resolution, but there is a problem that the number of sound sources must be given when the MUSIC method is used. In the technique described in
さらに特許文献1に記載の技術では、音源定位は2次元的に行なわれている。しかし、実際のロボットの稼働環境は2次元ではなく、3次元的である。例えば、商店街などでは比較的高い位置にスピーカが置かれており、そのスピーカから常に音声が流されていることが多い。また、スピーカの位置は一定であるが、音量が変化することもある。そうした環境では音源を3次元的に定位することが好ましいが、特許文献1に記載の技術では2次元的にしか行なえないという問題がある。
Furthermore, in the technique described in
特に人間を相手にするロボットの場合、人間の身長はさまざまで、大人の場合にはロボットより高い位置で話し、子供の場合には逆にロボットより低い位置で話すことが多い。そうした点からも、3次元的な音源定位をすることが望まれる。 In particular, in the case of a robot against a human being, the height of the human being varies, and in the case of an adult, the person speaks at a higher position than the robot, and the child often speaks at a lower position than the robot. From such a point, it is desirable to perform three-dimensional sound source localization.
さらに、人間は頻繁に移動するため、音源を実時間で安定してトラッキングすることも必要である。 Furthermore, since humans move frequently, it is also necessary to track the sound source stably in real time.
それゆえに本発明の目的は、MUSIC法を使用して安定的に音源定位を行なうことができる音源定位装置を提供することである。 SUMMARY OF THE INVENTION Therefore, an object of the present invention is to provide a sound source localization apparatus that can stably perform sound source localization using the MUSIC method.
本発明の他の目的は、MUSIC法を使用して安定的に音源定位を行なうために、音源数を精度高く推定可能な音源定位装置を提供することである。 Another object of the present invention is to provide a sound source localization apparatus that can estimate the number of sound sources with high accuracy in order to stably perform sound source localization using the MUSIC method.
本発明のさらに他の目的は、MUSIC法を使用して安定的に音源定位を行なうために、音源数を精度高く推定可能でかつ安定してトラッキングができる音源定位装置を提供することである。 Still another object of the present invention is to provide a sound source localization apparatus that can estimate the number of sound sources with high accuracy and can perform tracking stably in order to stably perform sound source localization using the MUSIC method.
本発明に係る音源定位装置は、マイクロホンアレイの出力から得られる複数チャンネルの音源信号の各々を、所定の時間間隔ごとに複数個の周波数帯域の周波数成分に変換するための変換手段と、変換手段により得られた複数チャンネルの音源信号の複数個の周波数帯域の各々について、所定の時間間隔ごとに周波数成分間の空間相関行列を求めるための相関行列算出手段と、相関行列算出手段により所定時間間隔ごとに、かつ複数個の周波数帯域の各々について算出される空間相関行列の各々を固有値分解し、複数個の周波数帯域の各々について固有ベクトル及び固有値を算出するための固有ベクトル算出手段と、固有ベクトル算出手段により所定時間間隔ごとに、かつ複数個の周波数帯域の各々について算出される固有値に基づき、第1及び第2の周波数範囲についての固有値プロファイルを算出するための固有値プロファイル算出手段とを含む。第1及び第2の周波数範囲の各々は、複数個の周波数帯域のうちの1又は複数個の周波数帯域を含む。音源定位装置はさらに、固有値プロファイル算出手段により第1及び第2の周波数範囲について算出された固有値プロファイルの組をパラメータとして、所定の時間間隔ごとに音源数を推定するための音源数推定手段と、音源数推定手段により推定された音源数と、マイクロホンアレイに属するマイクロホン素子の配置に関する情報と、所定の時間間隔ごとに固有ベクトル算出手段により算出された固有ベクトルとに基づいて、MUSIC法により音源数と等しい数の音源方位を推定するための音源推定手段とを含む。 A sound source localization apparatus according to the present invention includes a conversion unit for converting each of a plurality of sound source signals obtained from the output of a microphone array into frequency components of a plurality of frequency bands at predetermined time intervals, and a conversion unit. Correlation matrix calculation means for obtaining a spatial correlation matrix between frequency components for each predetermined time interval for each of a plurality of frequency bands of the sound source signals of a plurality of channels obtained by the above, and a predetermined time interval by the correlation matrix calculation means Eigenvalue decomposition for each of the spatial correlation matrices calculated for each of the plurality of frequency bands, and eigenvector calculation means for calculating eigenvectors and eigenvalues for each of the plurality of frequency bands, and eigenvector calculation means Based on eigenvalues calculated for each of a plurality of frequency bands at predetermined time intervals, the first And a unique value profile calculating means for calculating an eigenvalue profile for beauty second frequency range. Each of the first and second frequency ranges includes one or more frequency bands of the plurality of frequency bands. The sound source localization apparatus further includes a sound source number estimating unit for estimating the number of sound sources for each predetermined time interval using the set of eigen value profiles calculated for the first and second frequency ranges by the eigen value profile calculating unit as parameters. Based on the number of sound sources estimated by the sound source number estimating means, information on the arrangement of microphone elements belonging to the microphone array, and the eigenvectors calculated by the eigenvector calculating means at predetermined time intervals, the number of sound sources is equal to the number of sound sources by the MUSIC method. Sound source estimation means for estimating the number of sound source directions.
MUSIC法で音源定位をする場合、音源数を推定する必要がある。上のように算出された相関行列の固有値と音源数との間に関係があることは知られているが、特に上のように2つの周波数範囲に属する周波数帯域の周波数成分についてそれぞれ別々に算出された固有値を用いた固有値プロファイルを使用して音源数を推定すると高い精度が得られることが実験により判明した。音源数を高い精度で推定可能となったことにより、MUSIC法によって、安定して、かつ精度高く音源定位を行なうことが可能になる。 When performing sound source localization using the MUSIC method, it is necessary to estimate the number of sound sources. Although it is known that there is a relationship between the eigenvalues of the correlation matrix calculated as above and the number of sound sources, it is calculated separately for the frequency components in the frequency bands belonging to the two frequency ranges as shown above. Experiments have shown that high accuracy can be obtained by estimating the number of sound sources using the eigenvalue profile using the eigenvalues. Since the number of sound sources can be estimated with high accuracy, sound source localization can be performed stably and with high accuracy by the MUSIC method.
好ましくは、第1の周波数範囲と第2の周波数範囲とは互いに連続している。 Preferably, the first frequency range and the second frequency range are continuous with each other.
より好ましくは、第1の周波数範囲と第2の周波数範囲とは互いに重複していない。 More preferably, the first frequency range and the second frequency range do not overlap each other.
さらに好ましくは、第1及び第2の周波数範囲の下限は1kHzであり、上限は6kHzである。 More preferably, the lower limit of the first and second frequency ranges is 1 kHz, and the upper limit is 6 kHz.
固有値プロファイル算出手段は、固有ベクトル算出手段により所定時間間隔ごとに、かつ第1の周波数範囲に属する周波数帯域について算出される固有値を、固有値番号ごとに平均するための第1の固有値平均手段と、固有ベクトル算出手段により所定時間間隔ごとに、かつ第2の周波数範囲に属する周波数帯域について算出される固有値を、固有値番号ごとに平均するための第2の固有値平均手段と、第1および第2の固有値平均手段により固有値番号ごとに算出された固有値の平均により、固有値プロファイルを作成し出力するための手段とを含んでもよい。 The eigenvalue profile calculating means includes a first eigenvalue averaging means for averaging eigenvalues calculated for the frequency bands belonging to the first frequency range for each eigenvalue number at predetermined time intervals by the eigenvector calculating means, and eigenvectors. Second eigenvalue averaging means for averaging eigenvalues calculated for the frequency bands belonging to the second frequency range by the calculating means for each eigenvalue number, and first and second eigenvalue averages Means for creating and outputting an eigenvalue profile based on an average of eigenvalues calculated for each eigenvalue number by the means.
実験によれば、固有値プロファイルを作成するにあたり、第1及び第2の周波数範囲の各々において、それら範囲に属する周波数帯域に対して算出された固有値を、固有値番号ごとに平均してそれを音源数の予測パラメータに用いると、音源数の予測精度が高くなることが判明した。したがってこのようにして固有値プロファイルを算出することにより、MUSIC法によって、安定して、かつ精度高く音源定位を行なうことが可能になる。 According to the experiment, in creating the eigenvalue profile, in each of the first and second frequency ranges, the eigenvalues calculated for the frequency bands belonging to these ranges are averaged for each eigenvalue number and the number is calculated. It was found that the accuracy of predicting the number of sound sources increases when used as a prediction parameter. Therefore, by calculating the eigenvalue profile in this way, sound source localization can be performed stably and with high accuracy by the MUSIC method.
好ましくは、第1の周波数範囲と第2の周波数範囲との境界は、2.5kHz以上4kHz以下の範囲内にあり、例えば3kHz、又は4kHzである。 Preferably, the boundary between the first frequency range and the second frequency range is in a range of 2.5 kHz to 4 kHz, for example, 3 kHz or 4 kHz.
より好ましくは、音源数推定手段は、固有値プロファイルの組をパラメータとして正しい音源数を推定するように予め学習済の非線形推定手段を含む。 More preferably, the sound source number estimation unit includes a nonlinear estimation unit that has been learned in advance so as to estimate the correct number of sound sources using a set of eigenvalue profiles as a parameter.
さらに好ましくは、非線形推定手段は、固有値プロファイルの組をパラメータとして、各々が固有値プロファイルの組と対応する音源数との組合せからなる複数個の学習データを記憶するための学習データ記憶手段と、固有値プロファイル算出手段により算出された固有値プロファイルの組をパラメータとして、学習データ記憶手段に記憶された学習データを用いたk近傍法によって音源数を推定するための手段とを含む。 More preferably, the nonlinear estimation means includes learning data storage means for storing a plurality of learning data, each of which includes a combination of eigenvalue profiles and the number of sound sources corresponding to each set of eigenvalue profiles, and eigenvalues. Means for estimating the number of sound sources by the k-nearest neighbor method using the learning data stored in the learning data storage means using the set of eigenvalue profiles calculated by the profile calculation means as parameters.
k近傍法は計算量も少なく、リソースに限りがあるロボットに実装する上で都合がよい。実験によってもよい結果が得られることが分かった。したがってk近傍法を用いて音源数を推定することで、MUSIC法により、安定して、かつ精度高く音源定位を行なうことができる。 The k-neighbor method has a small amount of calculation and is convenient for implementation in a robot with limited resources. Experiments have shown that good results can be obtained. Therefore, by estimating the number of sound sources using the k-nearest neighbor method, sound source localization can be performed stably and accurately with the MUSIC method.
k近傍法によって音源数を推定するための手段で使用される近傍の学習データ数は6でもよい。 The number of nearby learning data used in the means for estimating the number of sound sources by the k-nearest neighbor method may be six.
実験によれば、k近傍法では近傍としてk=6を選択した場合が最も精度を高くすることができた。 According to experiments, in the k-nearest neighbor method, the highest accuracy was obtained when k = 6 was selected as the neighborhood.
より好ましくは、音源定位装置は、音源推定手段により所定の時間間隔ごとに推定された音源方位を時間軸上でトラッキングするための音源トラッキング手段をさらに含む。 More preferably, the sound source localization apparatus further includes sound source tracking means for tracking the sound source azimuth estimated at predetermined time intervals by the sound source estimating means on the time axis.
以下の本発明の実施の形態の説明において、同一の部品には同一の参照番号を付してある。それらの機能も同一である。したがってそれらについての詳細な説明は繰返さない。 In the following description of the embodiments of the present invention, the same reference numerals are assigned to the same components. Their functions are also the same. Therefore, detailed description thereof will not be repeated.
[概要]
本実施の形態では、ロボットの頭部付近にマイクロホンアレイを配置し、これらマイクロホンアレイから得られた信号からリアルタイムで複数個の音源を定位し、それらのトラッキングを行なう。そのために、以下に説明する実施の形態の音源定位装置は、予め取得した学習データに基づき、音源信号から得られた情報を用いて音源数を推定する仕組みを用いる。推定された音源数を用いてMUSIC法(付録を参照。)により音源定位を行なうことにより、安定して精度高い音源定位を行なうことができる。
[Overview]
In the present embodiment, a microphone array is arranged near the head of the robot, a plurality of sound sources are localized in real time from signals obtained from these microphone arrays, and tracking thereof is performed. For this purpose, the sound source localization apparatus according to the embodiment described below uses a mechanism for estimating the number of sound sources using information obtained from sound source signals based on learning data acquired in advance. By performing sound source localization by the MUSIC method (see the appendix) using the estimated number of sound sources, sound source localization can be performed stably and accurately.
[構成]
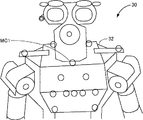
図1に、マイクロホンアレイをロボット30の胸部にフィットさせた状態を示す。具体的には、ロボット30の首の周囲にマイクロホンをフィットさせるためのマイクロホン台32を作成し、複数のマイクロホンMC1等をこのマイクロホン台32に固定した後にマイクロホン台32をロボット30の首の周りに固定してある。
[Constitution]
FIG. 1 shows a state in which the microphone array is fitted to the chest of the
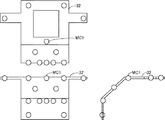
図2に、マイクロホン台32の正面図、平面図、及び右側面図を示す。図2を参照して、マイクロホンMC1等は全部で14個だけ使用される。それらのうち9個はマイクロホン台32の前部に取付けられ、残りの5個はロボット30の首を囲む形でマイクロホン台32の上面に取付けられている。なお、14個のマイクロホンのうち、中央にあるマイクロホンMC1の出力については、後の処理で他と区別して使用する。本実施の形態では、、各マイクロホンは無指向性のものを用いている。
FIG. 2 shows a front view, a plan view, and a right side view of the
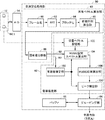
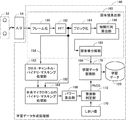
図3は、図1に示すロボットのうち、音源定位に関係する音源定位処理部50のみを取り出してブロック図形式で示した図である。図3を参照して、音源定位処理部50は、マイクロホンMC1等を含むマイクロホンアレイ52から14個のアナログ音源信号を受け、アナログ/デジタル変換を行なって14個のデジタル音源信号を出力するA/D変換器54と、A/D変換器54から出力される14個のデジタル音源信号を受け、MUSIC法で必要とされる相関行列とその固有値及び固有ベクトルを200ミリ秒ごとに出力するための固有ベクトル算出部60と、固有ベクトル算出部60から200ミリ秒ごとに出力される固有ベクトル及び固有値を使用し、MUSIC法に基づいて複数個の音源位置を推定してその位置(方向)を表す値(本実施の形態では、3次元極座標の内の2つの偏角φ及びθとする。付録の「MUSIC応答」を参照。)を逐次出力する音源推定部62と、音源推定部62の出力の時系列を蓄積し、時間的に連続して存在する音源をグルーピングし、孤立した音源を削除(フィルタリング)して時間的に変動する音源の方位を推定するためのグルーピング部64と、グルーピング部64が音源位置を表す情報を蓄積するために使用するバッファ66とを含む。
FIG. 3 is a block diagram showing only the sound source
本実施の形態では、A/D変換器54は、一般的な16kHz/16ビットで各マイクロホンの出力をA/D変換する。
In the present embodiment, the A /
固有ベクトル算出部60は、A/D変換器54の出力する14個のデジタル音源信号を25ミリ秒のフレーム長でフレーム化するためのフレーム化処理部80と、フレーム化処理部80の出力する14チャンネルのフレーム化された音源信号に対してそれぞれFFT(Fast Fourier Transformation)を施し、所定個数の周波数領域(以下、各周波数領域を「ビン」と呼び、周波数領域の数を「ビン数」と呼ぶ。)に変換して出力するFFT処理部82と、FFT処理部82から25ミリ秒ごとに出力される各チャネルの各ビンの値を200ミリ秒ごとにブロック化するためのブロック化処理部84と、ブロック化処理部84から出力される各ビンの値の間の相関を要素とする相関行列を所定時間ごと(200ミリ秒ごと)に算出し出力する相関行列算出部86と、相関行列算出部86から出力される相関行列を固有値分解し、固有値90と固有ベクトル92とを音源推定部62に出力する固有値分解部88とを含む。なお本実施の形態では、音源信号の周波数成分のうち、空間的分解能が低い1kHz以下の帯域と、空間的aliasingが起こり得る6kHz以上の帯域を除外する。
The
音源推定部62は、マイクロホンアレイ52に含まれる各マイクロホンの位置を所定の座標系を用いて表す位置ベクトルを記憶するための位置ベクトル記憶部100と、固有値分解部88から与えられる固有値をパラメータとして、音源数を推定し推定音源数(これを「NOS」と呼ぶ。)を出力するための音源数推定部102と、音源数推定部102から与えられるNOS,位置ベクトル記憶部100に記憶されているマイクロホンの位置ベクトル、及び固有値分解部88から出力される固有ベクトルを用いて、MUSIC法においてMUSIC空間スペクトルと呼ばれる値を算出し出力するMUSIC空間スペクトル算出部104とを含む。ブロックごとに得られる相関行列の固有値が音源数に関連することは、例えばF.アサノら、「リアルタイム音源定位及び生成システムと自動音声認識におけるその応用」、Eurospeech,2001、アールボルグ、デンマーク、2001、1013−1016頁(F. Asano, M. Goto, K. Itou, and H. Asoh, “Real-time sound source localization and separation system and its application on automatic speech recognition,” in Eurospeech 2001, Aalborg, Denmark, 2001, pp. 1013-1016)にも記載されており、既に知られている事項である。
The sound
なお、本実施の形態では、各音源の2次元的な方位角だけでなく、仰角も推定する。そのために、MUSICアルゴリズムの3次元版(付録を参照)を実装した。方位角と仰角とのセットを、これ以降、音源方位(DOA)と呼ぶ。このアルゴリズムでは、音源までの距離は推定しない。音源方位のみを推定するようにすることで、処理時間を大幅に減少させることができる。 In the present embodiment, not only the two-dimensional azimuth angle of each sound source but also the elevation angle is estimated. To that end, a three-dimensional version of the MUSIC algorithm (see appendix) was implemented. The set of azimuth and elevation is hereinafter referred to as sound source azimuth (DOA). This algorithm does not estimate the distance to the sound source. By estimating only the sound source azimuth, the processing time can be significantly reduced.
音源推定部62はさらに、MUSIC空間スペクトル算出部104により算出されたMUSIC空間スペクトルに基づいて、MUSIC法にしたがいMUSIC応答と呼ばれる値を各方位ごとに算出し出力するためのMUSIC応答算出部106と、MUSIC応答算出部106により算出されたMUSIC応答のピークを、音源数推定部102により推定された個数だけ、値の大きいものから順番に各ブロックごとに検出し、音源方位を示す情報としてその方位を出力するためのピーク検出部108とを含む。
The sound
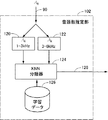
図4は、図3に示す音源数推定部102のより詳細なブロック図である。図4を参照して、音源数推定部102は、固有値分解部88からビンごとに与えられる固有値90のうち、1−3kHz(1kHz以上、3kHz以下)の周波数帯の各ビンから得られた固有値の平均値を固有値番号別に算出するための第1の平均値算出部120と、3−6kHzの周波数帯の各ビンから得られた固有値の平均値を固有値番号別に算出するための第2の平均値算出部122とを含む。音源数推定部102はさらに、第1の平均値算出部120から与えられる固有値の平均値の組と、第2の平均値算出部122から与えられる固有値の平均値の組とをパラメータとして、KNN(k−Nearest Neighbor:k近傍法)分類によって音源数を推定しNOS128として出力するためのKNN分類器124と、KNN分類器124がNOS推定の際に使用する学習データを記憶する学習データ記憶部126とを含む。
4 is a more detailed block diagram of the sound source
学習データ記憶部126には、後述するとおり、事前の学習データ作成時に得られた第1の平均値算出部120及び第2の平均値算出部122からの出力の値と、そのときの音源数とが組になったサンプル(学習データ)が、複数個記憶されている。推定時には、第1の平均値算出部120及び第2の平均値算出部122から与えられるパラメータ(2組の固有値)を入力ベクトルとして、ベクトル空間で入力ベクトルに最も近いk個の学習データが選ばれ、それらk個の学習データを音源数で分類し、最も多数の学習データが分類された音源数を推定音源数として出力する。本実施の形態ではk=6である。
In the learning
音源数推定部102は、図4に示すとおり、1kHz−6kHzの周波数帯域を2つに分け、各々について固有値の平均値の組を算出してそれを予測のためのパラメータとしている。この理由については後述するが、要するに実験によればこのようにパラメータを設定した場合に最も音源方位の推定精度が高かったことによる。
As shown in FIG. 4, the number-of-sound
ピーク検出部108では、局所的なピークを検出することでDOAを求める。ただし、2つの音源の方位が近い場合には、局所的なピークが1つしか見出せないことがあり得る。例えば図11(A)に示すピーク200のように、2つのピークがほぼ重なっている場合である。このようなときにも音源数だけのピークを検出できるようにするため、ピーク検出部108はピーク検出を以下のように行なう。
The
まず、最大の局所ピーク200を検出する。この局所ピークが1つのピーク(DOA)となる。次に、この局所ピーク部分のMUSIC応答からから2次元ガウシアン202(図11(B)を参照。)を差引く。この2次元ガウシアンは、1つの音源が存在するときの標準偏差を持ち、かつ検出されたピークの振幅を持つものとする。この作業により、仮にこのピークに他のピークが重なっている場合には、重なっていて検出できなかったピーク204(図11(C)を参照)のみがこの部分に残ることになる。この作業を音源の数(NOS)だけ繰返す。
First, the maximum
グルーピング部64による音源方位のフィルタリング及びトラッキングは以下のようにして行なわれる。音源数が過大推定された場合、誤ったDOAの挿入が起きる。本実施の形態に係る手法では、グルーピングによるフィルタリングのアルゴリズムを用いることで、孤立したDOAを削除する。本アルゴリズムは、過去10ブロック(2秒に相当)に検出されたDOAより、現在のDOA候補をグループ化するか否かを判断する。具体的には、以下の条件にあてはまる場合、グループ化を行なう。
Filtering and tracking of the sound source direction by the
(1)前のDOAは、現在のDOAを先端とした「円錐」の内部にある。ここでの「円錐」は、「付録」に述べる3次元MUSIC法で求める音源方位(θ、φ)及び時刻tを座標とする3次元座標空間内での円錐である。円錐の高さ方向を時間軸に平行にとる。本実施の形態では、円錐の底面は方位角が±30度、仰角が±7度となるような形状に設定した。これらの値は、人は縦方向(仰角の変化)よりも、横方向(方位角の変化)に移動する確率が高いことに基づき、ヒューリステックに設定した。 (1) The previous DOA is inside a “cone” with the current DOA as the tip. Here, the “cone” is a cone in the three-dimensional coordinate space with the sound source azimuth (θ, φ) and the time t obtained by the three-dimensional MUSIC method described in the “Appendix” as coordinates. The height direction of the cone is parallel to the time axis. In the present embodiment, the bottom surface of the cone is set to have a shape with an azimuth angle of ± 30 degrees and an elevation angle of ± 7 degrees. These values were set to heuristics based on the higher probability that a person would move in the horizontal direction (change in azimuth) than in the vertical direction (change in elevation angle).
(2)現在のDOAと前のDOAが属するグループの傾向線との距離がある閾値よりも小さい。ここで、「傾向線」とは、そのグループに属するDOA列に対する回帰線を現在の時点まで外挿して考えられる直線のことをいう。 (2) The distance between the current DOA and the trend line of the group to which the previous DOA belongs is smaller than a certain threshold. Here, the “trend line” refers to a straight line that can be considered by extrapolating the regression line for the DOA column belonging to the group to the current time point.
1番目の条件により、DOAは音源方位(θ、φ)が近いグループにのみグループ化可能となり、2番目の条件により、方向性が異なるグループにはグループ化されないこととなる。実験によれば、こうした基準でDOAをグループ化することにより、いずれの音源もうまくトラッキング出来ることが分かった。特に、2つの互いに異なる音源が、音源方位が重なるように近づき、互いに交差して遠ざかるような移動を行なった場合にも、音源方位を正しく検出することができた。 According to the first condition, the DOA can be grouped only into a group having a sound source direction (θ, φ) close to each other, and according to the second condition, the DOA is not grouped into a group having a different directionality. Experiments have shown that any sound source can be tracked well by grouping DOAs according to these criteria. In particular, even when two different sound sources approach each other so that the sound source directions overlap and move so as to cross each other and move away from each other, the sound source directions can be correctly detected.
図5は、図4に示す学習データ記憶部126に予め記憶される学習データを事前に作成するための学習データ作成処理部140のブロック図である。本実施の形態では、この学習データ作成処理部140もロボット30中に設けられているが、学習データ作成処理部140をロボット30の外に設けて学習データを作成し、作成された学習データのみをロボット30中に組み込むようにしてもよいことはいうまでもない。
FIG. 5 is a block diagram of the learning data
図5を参照して、学習データ作成処理部140は、図3に示すものと同じマイクロホンアレイ52及びA/D変換器54と、A/D変換器54の出力するデジタル音源信号を受け、図3に示す固有ベクトル算出部60と同様の処理で200ミリ秒ごとに音源信号の各周波数帯域ごとに固有値を算出し出力するための固有値算出部160を含む。固有値算出部160は、図3に示すフレーム化処理部80、FFT処理部82、ブロック化処理部84、相関行列算出部86及び固有値分解部88とそれぞれ同様の処理を行なうフレーム化処理部180、FFT処理部182、ブロック化処理部184、相関行列算出部186及び固有値分解部188を含む。ただし、固有値分解部188は固有値のみを出力する。
Referring to FIG. 5, learning data
固有値算出部160はさらに、FFT処理部182が25ミリ秒ごとに出力するフレーム化された周波数成分の出力194を受け、音源信号の各チャンネル間でクロス・チャンネル・スペクトル・バイナリ・マスキング処理(この詳細については後述する。)を行なうための第1のバイナリ・マスキング処理部162と、第1のバイナリ・マスキング処理部162から出力されるクロス・チャンネル・スペクトル・バイナリ・マスキング処理がされた音源信号の各々について、さらに、中央のマイクロホンMC1から得られた周波数成分(FFT処理部182の出力192)との間でバイナリ・マスキング処理を行なうための第2のバイナリ・マスキング処理部164とを含む。
The
第1のバイナリ・マスキング処理部162が行なうクロス・チャンネル・バイナリ・マスキング処理とは以下のような処理をいう。2つのチャンネルの信号を周波数領域に変換し、変換後の2つの信号についてフレームごとに個々の周波数成分の値を比較する。値の大きな(強い)方の値は残し、小さな(弱い)方の値に0を割当てる。この後、双方の信号を時間領域に戻す。この処理は、マイクロホン間で相関のある音声を拾っている場合に、音源により近い方のマイクロホンからの信号のみを残すために行なわれる。この処理により、チャンネル間の音漏れを抑え、より信頼性の高いレファレンス信号が得られる。
The cross channel binary masking process performed by the first binary
第2のバイナリ・マスキング処理部164が行なうバイナリ・マスキング処理は以下のような処理をいう。任意の信号(これを処理対象の信号と呼ぶ。)をとり、その信号とマイクロホンMC1から得られた信号とをともに周波数領域に変換する。この2つの信号についてフレームごとに個々の周波数成分の値を比較する。処理対象の信号の方の値が大きければ(強ければ)その値を残し、小さければその周波数成分の値に0を割当てる。この後、処理対象の信号を時間領域に戻す。この処理は、各音源信号から環境音を除外するための処理である。したがってここでは中央のマイクロホンMC1からの周波数成分を基準として用いている。
The binary masking process performed by the second binary masking
学習データ作成処理部140はさらに、第2のバイナリ・マスキング処理部164から25ミリ秒ごとのフレームについて出力される各チャンネルの音源信号について、25ミリ秒ごとにパワーを算出するためのパワー算出部168と、パワー算出部168の算出する各チャンネルのパワーの値の時系列(パワー軌道)としきい値とを比較し、しきい値を上回った音源信号をアクティブであると判定し、アクティブである音源信号の数をそのフレームの音源数として出力するための音源数判定部172と、音源数判定部172が判定に用いるしきい値を予め記憶するためのしきい値記憶部170とを含む。音源数判定部172の出力する音源数を、図3に示す音源数推定部102が出力する音源数(NOS)と区別するためにPNOSと呼ぶ。
The learning data
学習データ作成処理部140はさらに、固有値分解部188から200ミリ秒ごとに出力される固有値の組と、音源数判定部172から与えられるPNOSの値とを組として学習データ記憶部126に学習データとして格納させるための学習データ蓄積部174とを含む。なお、図5には図示していないが、学習データ蓄積部174は、固有値分解部188から与えられる固有値を、図4に示す音源数推定部102と同様に1−3kHzの帯域と、3kHz−6kHzの帯域とで別々に平均して2組の固有値に変換してから学習データ記憶部126にそのときのPNOSの値と共に記憶させる。固有値分解部188からの固有値は200ミリ秒ごとに得られ、PNOSは25ミリ秒ごとに得られるため、平均と四捨五入とによって200ミリ秒ごとのブロックに変換する。
The learning data
以下、図4の音源数推定部102において固有値を1−3kHzの帯域と3−6kHzの帯域とに分けてそれぞれ別々に平均する理由について説明する。
The reason why the eigenvalues are averaged separately in the 1-3 kHz band and the 3-6 kHz band in the sound source
発明者は、固有値が、環境の変化によりどのように影響されるかを調べるため以下のような実験を行ない、PNOSごとに固有値を整理した。ビンごとに固有値のセットが得られるが、ここでは、ブロックごとに1つの代表的な固有値のセットを求めるため、特定の周波数帯域で平均化した固有値をそのブロックの固有値プロファイルとして扱う。 The inventor conducted the following experiment in order to examine how the eigenvalue is affected by the environmental change, and arranged the eigenvalue for each PNOS. A set of eigenvalues is obtained for each bin. Here, in order to obtain one typical eigenvalue set for each block, eigenvalues averaged in a specific frequency band are treated as eigenvalue profiles of the blocks.
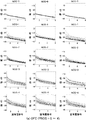
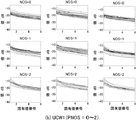
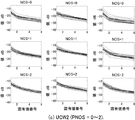
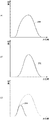
図6−図8に、3つの異なった環境(OFC、UCW1、UCW2)において、PNOS毎に整理したブロック毎の固有値のプロファイルを表示する。これら環境は実験のための音声を収録した環境であり、具体的には以下のとおりである。 6 to 8 show profiles of eigenvalues for each block arranged for each PNOS in three different environments (OFC, UCW1, and UCW2). These environments are environments that record audio for experiments, and are specifically as follows.
すなわち、マイクロホンアレイによるデータ収録を2つの異なった環境で行なった。一つ目はオフィス環境(OFC)で、室内のエアコンとロボットの内部雑音が主な雑音源となる。二つ目の環境は、現在ロボビーの実証実験が行なわれている野外のショッピングモールの通路(UCW)である。UCWでの主な雑音源は、天井に設置されているスピーカから流れてくるポップ・ロックミュージックとなる。通路内のさまざまな位置およびさまざまな向きで収録を行なった。 That is, data recording by a microphone array was performed in two different environments. The first is the office environment (OFC), where the internal noise of indoor air conditioners and robots is the main noise source. The second environment is an open-air shopping mall corridor (UCW) where Robbie's demonstration experiment is currently being conducted. The main noise source in UCW is pop-rock music flowing from speakers installed on the ceiling. Recorded at various locations and in various directions in the aisle.
ここでは、その中の4つ収録の結果を示す。1つ目はオフィス環境(OFC)で、残りの3つはショッピングモールの環境(UCW1−3)である。テーブル1にそれぞれの収録での音源に関する詳細を示す。 Here, the results of four of them are shown. The first is an office environment (OFC), and the remaining three are shopping mall environments (UCW1-3). Table 1 shows the details about the sound source in each recording.

図6−図8を参照すると、音源数(NOS)が、固有値プロファイルの全般的なオフセット及び形状に関連していることが観察される。理想的な固有値プロファイルの形状としては、指向的な音源の数Nに対応する最初のN個の固有値が強いパワーを示し、無指向的な音源に対応する残りのM−N個の固有値が小さいパワーを示す。しかしながら、図6−図8に表示している実際の形状では、指向的音源の成分と無指向的音源の成分の境目が不明確であり、無指向成分もフラットではなく、緩やかな傾きを示している。
With reference to FIGS. 6-8, it is observed that the number of sound sources (NOS) is related to the general offset and shape of the eigenvalue profile. As the shape of an ideal eigenvalue profile, the first N eigenvalues corresponding to the number N of directional sound sources indicate strong power, and the remaining MN eigenvalues corresponding to omnidirectional sound sources are small. Indicates power. However, in the actual shape displayed in FIG. 6 to FIG. 8, the boundary between the directional sound source component and the omnidirectional sound source component is unclear, and the omnidirectional component is not flat and shows a gentle inclination. ing.
また、異なったPNOS間でも固有値プロファイルが一部重複することも観察される。例えば、OFC(図6)では、PNOS=1とPNOS=2のプロファイルが大幅に重複していることが観察される。従って、分類器による厳密な音源数の推定は困難であることが予想される。 It is also observed that eigenvalue profiles partially overlap even between different PNOS. For example, in the OFC (FIG. 6), it is observed that the profiles of PNOS = 1 and PNOS = 2 are significantly overlapped. Therefore, it is expected that it is difficult to accurately estimate the number of sound sources by the classifier.
更には、環境の変化による、固有値プロファイルの形状への影響も強いことが観られる。幅にも傾きにも違いが観られる。例えば、OFCとUCW1のPNOS=0の固有値プロファイル(図6,図7のNOS=0)を比較すると、その違いは明らかである。UCW1では、背景の音楽があるため、OFCよりも値が大きく、ばらつきも大きくなっている。これは環境の変化を分類器に考慮する必要があることを示している。 Furthermore, it can be seen that the influence of the change in the environment on the shape of the eigenvalue profile is strong. Differences can be seen in width and inclination. For example, when the OFC and UCW1 PNOS = 0 eigenvalue profiles (NOS = 0 in FIGS. 6 and 7) are compared, the difference is clear. In UCW1, since there is background music, the value is larger than that of OFC, and the variation is larger. This indicates that environmental changes need to be considered in the classifier.
また、環境音楽の音源に近づくことによる固有値プロファイルへの影響も観られる。UCW2のPNOS=0のプロファイルの形状は、UCW1のPNOS=1のものと類似している。これは、ロボットが環境音楽の音源に近づく場合は、環境音楽が新たな指向的音源となり、離れている場合は、無指向的音源となることが反映されている。環境音楽が指向的音源の場合、その方位を求めることが出来、後続処理となるターゲット音声の音源分離にも役立つ。 Moreover, the influence on the eigenvalue profile by approaching the sound source of environmental music is also seen. The profile of UCW2's PNOS = 0 profile is similar to that of UCW1's PNOS = 1. This reflects that the environmental music becomes a new directional sound source when the robot approaches the sound source of the environmental music, and the omnidirectional sound source when the robot is away. When the environmental music is a directional sound source, the direction can be obtained, which is useful for the sound source separation of the target sound which is the subsequent processing.
最後に、異なった周波数帯域で平均化した固有値のプロファイルを分析した。図6−図8の3列に、それぞれ1‐6kHz(AVG1_6)、1−3kHz(AVG1_3)および3−6kHz(AVG3_6)の3つの異なった周波数帯域の周波数ビンで平均化した固有値のプロファイルを示す。NOS>0のプロファイルで図6−図8の3列を比較すると、AVG3_6(右の列)では、第1と第6の固有値の差がより大きいことが分かる。この結果より、AVG3_6の方が、帯域幅が広域であるAVG1_6よりも高い識別性を持つと考えられる。しかし、/u/及び/O/のように3kHz以上の成分が弱い音声区間では、AVG3_6では検出されない恐れがある。これらの結果より、分割した周波数帯域から求められる固有値の2セットを分類器に用いるようにした。こうすることで、3kHz以上の成分が弱い区間ではAVG1_3によって比較的識別性を高くすることができ、3kHz以上の成分が十分強い区間ではAVG3_6によって十分な識別性を期待できる。 Finally, eigenvalue profiles averaged in different frequency bands were analyzed. 6 to 8 show profiles of eigenvalues averaged in frequency bins in three different frequency bands of 1-6 kHz (AVG1_6), 1-3 kHz (AVG1_3), and 3-6 kHz (AVG3_6), respectively. . Comparing the three columns in FIGS. 6 to 8 with a profile of NOS> 0, it can be seen that the difference between the first and sixth eigenvalues is larger in AVG3_6 (right column). From this result, it is considered that AVG3_6 has higher discrimination than AVG1_6 having a wide bandwidth. However, there is a possibility that the AVG3_6 may not detect in a voice section where a component of 3 kHz or more is weak such as / u / and / O /. From these results, two sets of eigenvalues obtained from the divided frequency bands were used for the classifier. By doing so, the AVG1_3 can relatively increase the discriminability in the interval where the component of 3 kHz or higher is weak, and the AVG3_6 can expect sufficient discriminability in the interval where the component of 3 kHz or higher is sufficiently strong.
分類アルゴリズムとして、kNN(k−Nearest Neighbors)アルゴリズムを選択した。kNNは計算量も少なく、非線形にも対応できるためである。kNNに限らず、非線形に対応できる機械学習方式、例えばSVM(Support Vector Machine)又はNN(Neural Network)などを用いることも可能である。 The kNN (k-Nearest Neighbors) algorithm was selected as the classification algorithm. This is because kNN has a small amount of calculation and can cope with non-linearity. Not only kNN but also a machine learning method that can deal with non-linearity, for example, SVM (Support Vector Machine) or NN (Neural Network) can be used.
観測信号の相関行列から得られた固有値を分類アルゴリズムの入力パラメータとして用いる。さまざまな周波数帯域の周波数ビンを通して求めた固有値の平均値セット(AVG)又は最大値セット(MAX)を入力として、さまざまな分類器を学習・評価した。周波数帯域を2つに分割して得られた固有値の2セットも評価した。 The eigenvalue obtained from the correlation matrix of the observed signal is used as an input parameter for the classification algorithm. Various classifiers were learned and evaluated using an average value set (AVG) or a maximum value set (MAX) of eigenvalues obtained through frequency bins in various frequency bands as inputs. Two sets of eigenvalues obtained by dividing the frequency band into two were also evaluated.
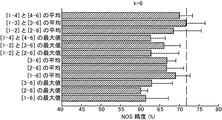
kNN分類器の性能を、さまざまなk(nearest neighborsの数)に対し、10重クロス検証により評価した。図9に、さまざまな分類器において、推定したNOSとレファレンスのPNOSがマッチした度合い(NOS精度)を示す。図9は、最もNOS精度が高かったk=6の場合の結果である。 The performance of the kNN classifier was evaluated by 10-fold cross validation for various k (number of nearest neighbors). FIG. 9 shows the degree of matching (NOS accuracy) between the estimated NOS and the reference PNOS in various classifiers. FIG. 9 shows the result when k = 6 where the NOS accuracy was highest.
図9より、まず固有値の最大値(MAX)よりも、平均値(AVG)の方が高い性能を示すことが分かる。最も性能が高かったのは、[1−3](周波数大域1kHz−3kHz)と「3−6」(3kHz−6kHz)との平均を使用した場合である。また、[1−4]と[4−6]を使用した場合も、[1−3]及び「3−6」の組合せより低いものの、全体をまとめた[1−6]の場合と比較してよい値を示している。これは、周波数帯域を分割した固有値の2セットを使用することが効果的であることを示している。
FIG. 9 shows that the average value (AVG) exhibits higher performance than the maximum eigenvalue (MAX). The highest performance was obtained when the average of [1-3] (
図9からはさらに、[1−2]と[2-6]を用いた場合には[1−6]とほぼ同等の精度を示すこと、したがって周波数帯域を2つに分割したときに、[1−6]より精度が高くなる分割周波数位置が、2.5kHz以上で4kHz以下のあたりにあることが分かる。 FIG. 9 further shows that when [1-2] and [2-6] are used, the accuracy is almost the same as [1-6]. Therefore, when the frequency band is divided into two, It can be seen that the division frequency position where the accuracy becomes higher than 1-6] is around 2.5 kHz or more and 4 kHz or less.
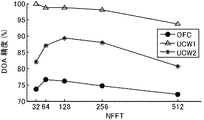
音源方位(DOA)の検出におけるFFTのビン数(NFFT)の影響を調べた。図10に、NFFTのさまざまな値(32,64,128,256、512)に対する、DOAの性能を表示する。NFFT=128が音源方位の推定において最も高い性能を示した。しかし、図10からわかるように、より小さいNFFTでも著しい性能の劣化は観られない。より小さいNFFTを使うことで計算量は大幅に減少できる。したがって上記実施の形態では、NFFT=64を採用した。 The influence of FFT bin number (NFFT) on the detection of sound source direction (DOA) was examined. FIG. 10 displays the DOA performance for various values of NFFT (32, 64, 128, 256, 512). NFFT = 128 showed the highest performance in estimating the sound source direction. However, as can be seen from FIG. 10, no significant performance degradation is observed even with a smaller NFFT. Using a smaller NFFT can greatly reduce the amount of computation. Therefore, NFFT = 64 is adopted in the above embodiment.
[動作]
上記実施の形態に係る音源定位処理部50は以下のように動作する。マイクロホンアレイが図1及び図2に示すようにマイクロホン台32を用いてロボット30に装着されるものとする。
[Operation]
The sound source
最初に、学習データの作成時の学習データ作成処理部140は以下のように動作する。マイクロホンアレイ52は音源からの音声を14個のアナログ電気信号に変換し、A/D変換器54に与える。A/D変換器54は16kHzでこれら信号を16ビットのデジタル信号化し、14個のデジタル信号をフレーム化処理部180に与える。
First, the learning data
フレーム化処理部180は、25ミリ秒のフレーム長でこれら各チャンネルのデジタル音源信号をフレーム化し、FFT処理部182に与える。FFT処理部182は、各チャンネルの各フレームのデジタル音源信号に対してFFTを施し、各周波数成分の出力194に変換してブロック化処理部184及び第1のバイナリ・マスキング処理部162に与える。FFT処理部182の出力194のうちマイクロホンMC1からの音源信号から得られた出力192は第2のバイナリ・マスキング処理部164にも与えられる。
The framing
ブロック化処理部184は、FFT処理部182から25ミリ秒ごとに出力される信号を200ミリ秒ごとにブロック化し、相関行列算出部186に与える。相関行列算出部186はこれら各ブロックについて、チャンネル毎の相関行列を算出し、固有値分解部188に与える。固有値分解部188は、相関行列算出部186により算出された相関行列に固有値分解を施し、学習データ蓄積部174に与える。
The blocking
一方、第1のバイナリ・マスキング処理部162は、FFT処理部182の出力194に対してクロス・チャンネル・スペクトル・バイナリ・マスキング処理を施して結果を第2のバイナリ・マスキング処理部164に与える。第2のバイナリ・マスキング処理部164は、第1のバイナリ・マスキング処理部162の出力する各チャンネルの周波数領域の値に対し、マイクロホンMC1からの音源信号から得られたFFT後の周波数成分(FFT処理部82の出力192)を基準にバイナリ・マスキング処理を施し、各チャンネルの信号を時間領域に戻して出力する。
On the other hand, the first binary
パワー算出部168は、第2のバイナリ・マスキング処理部164が出力する各チャンネルの音源信号について、25ミリ秒ごとにパワーを算出して音源数判定部172に与える。音源数判定部172は、パワー算出部168から与えられる各チャンネルの音源信号のパワーのパワー軌跡を追跡し、しきい値記憶部170に記憶されたしきい値よりも大きなパワーをもったチャンネルがあればそのチャンネルの音源信号がアクティブであると判定し、ブロックごとに、そのブロックでアクティブな音源信号の数をPNOSとして学習データ蓄積部174に出力する。
The
学習データ蓄積部174は、固有値分解部188から与えられる固有値のうち、1−3kHzの固有値を固有値番号ごとにそれぞれ平均化して第1の固有値の組を算出する。学習データ蓄積部174はさらに、同様にして3−6kHzの固有値を固有値番号ごとにそれぞれ平均化して第2の固有値の組を算出する。学習データ蓄積部174は、これら2組の固有値をパラメータとして、PNOSとともに1つの学習データ項目として学習データ記憶部126に記憶させる。
The learning
こうして学習データ記憶部126に学習データが記憶されると、この学習データ記憶部126を図4の音源数推定部102において使用することで音源定位処理部50が動作可能となる。
When the learning data is stored in the learning
ランタイムには、音源定位処理部50は以下のように動作する。マイクロホンアレイ52、A/D変換器54、フレーム化処理部80、FFT処理部82、ブロック化処理部84、相関行列算出部86、及び固有値分解部88は、学習データ作成時の学習データ作成処理部140のフレーム化処理部180、FFT処理部182、ブロック化処理部184、相関行列算出部186、及び固有値分解部188と同様に動作する。ただし固有値分解部88は、固有値だけでなく各固有値に対応する固有ベクトル92も算出しMUSIC空間スペクトル算出部104に200ミリ秒ごとに与える。固有値分解部88が算出した固有値90は音源数推定部102に与えられる。なお、位置ベクトル記憶部100には予めマイクロホンアレイ52のマイクロホンの配置に応じた位置ベクトルが記憶されているものとする。
At runtime, the sound source
音源数推定部102は以下のように動作する。第1の平均値算出部120は、200ミリ秒ごとに与えられる固有値90のうち、1−3kHzの領域の固有値を固有値番号ごとに平均し、第1の組の固有値としてKNN分類器124に与える。第2の平均値算出部122は、200ミリ秒ごとに与えられる固有値90のうち、3−6kHzの領域の固有値を固有値番号ごとに平均し、第2の組の固有値としてKNN分類器124に与える。
The sound source
KNN分類器124は、第1の平均値算出部120及びKNN分類器124から与えられる第1及び第2の組の固有値をパラメータとして、学習データ記憶部126に記憶された学習データに基づき、KNN分類によってNOS128を推定し、MUSIC空間スペクトル算出部104に与える。
The
MUSIC空間スペクトル算出部104以下の処理は通常のMUSIC法の処理を3次元化したものである。まずMUSIC空間スペクトル算出部104は、位置ベクトル記憶部100に記憶された位置ベクトルと、音源数推定部102から与えられたNOSとに基づいてMUSIC空間スペクトルを200ミリ秒ごとに算出しMUSIC応答算出部106に与える。MUSIC応答算出部106はMUSIC空間スペクトルに基づき、200ミリ秒ごとにMUSIC応答を算出しピーク検出部108に与える。ピーク検出部108はこのMUSIC応答の中を探索し、音源数推定部102から与えられるNOSと同じ個数だけのピークを大きい方から検出し、グルーピング部64に与える。グルーピング部64には、200ミリ秒ごとにNOSと同じ個数の音源方位が与えられる。
The processing after the MUSIC spatial
グルーピング部64は、最初の10ブロック分については、各ブロックで算出された音源方位をバッファ66に記憶する。グルーピング部64は同時に、ブロック間で同じ音源と思われるものをグループ化する処理を実行する。グループ化の手法については既に説明したとおりである。11ブロック以降は、グルーピング部64は、先入先出方式で各ブロックでの音源方位をバッファ66に記憶するとともに、10ブロック分の時間が経過しても他の音源方位とグループ化されなかった音源方位を削除する。こうして、2ブロック以上継続したグループが存在する場合には、グルーピング部64はそれらグループが1つの音源を表すものとして、ブロックごとにその音源方位を出力する。
For the first 10 blocks, the
以上のような動作によって、音源定位処理部50は継続的に複数個の音源の定位とトラッキングとを行なうことができる。
With the above operation, the sound source
上記実施の形態に係る音源定位処理部50によれば、音源の数と関連があるとして知られている、チャンネル間の相関行列の固有値について、各ブロックごとに、1−3kHzの周波数領域と3−6kHzの周波数領域とに分けて固有値番号ごとに平均を算出して音源数推定のパラメータとしている。実験結果からも明らかなように、このようなパラメータを用いることにより、高い精度で音源数を予測することができ、MUSIC法による音源定位を安定して精度高く行なうことができる。
According to the sound source
さらに、本実施の形態では3次元MUSIC法を用いているため、方位角だけではなく、ある範囲で仰角を含めて音源方位を推定することができる。そのため、実環境でさまざまな方向から音声を受ける環境でもロボットなどが正しく音源を定位して適切な動作を行なうことが可能になる。ロボットが人間とのインタラクションを行なう場合でも、相手の顔を見つめながら適切な動作を行なうことが期待でき、ロボットと人間とのインタラクションをよりスムーズなものとすることができる。 Furthermore, since the three-dimensional MUSIC method is used in the present embodiment, it is possible to estimate the sound source azimuth including not only the azimuth angle but also the elevation angle within a certain range. Therefore, even in an environment where voice is received from various directions in a real environment, a robot or the like can correctly locate a sound source and perform an appropriate operation. Even when the robot interacts with a human, it can be expected to perform an appropriate operation while looking at the face of the other party, and the interaction between the robot and the human can be made smoother.
今回開示された実施の形態は単に例示であって、本発明が上記した実施の形態のみに制限されるわけではない。本発明の範囲は、発明の詳細な説明の記載を参酌した上で、特許請求の範囲の各請求項によって示され、そこに記載された文言と均等の意味および範囲内でのすべての変更を含む。 The embodiment disclosed herein is merely an example, and the present invention is not limited to the above-described embodiment. The scope of the present invention is indicated by each of the claims after taking into account the description of the detailed description of the invention, and all modifications within the meaning and scope equivalent to the wording described therein are intended. Including.
[付録:MUSIC法]
M個のマイク入力のフーリエ変換Xm(k、t)は、式(1)のようにモデル化される。
[Appendix: MUSIC method]
The Fourier transform Xm (k, t) of M microphone inputs is modeled as shown in Equation (1).
![]()
ただし、ベクトルs(k、t)はN個の音源のスペクトルSn(k,t)から成る:s(k、t)=[S1(k,t),…,SN(k、t)]T。kとtはそれぞれ周波数と時間フレームのインデックスを示す。ベクトルn(k、t)は背景雑音を示す。行列Akは変換関数行列であり、その(m、n)要素はn番目の音源から、m番目のマイクロホンへの直接パスの変換関数である。Akのn列目のベクトルをn番目の音源の位置ベクトル(Steering Vector)と呼ぶ。
![]()
However, the vector s (k, t) consists of N sound source spectra S n (k, t): s (k, t) = [S 1 (k, t),..., S N (k, t) )] T. k and t indicate frequency and time frame indexes, respectively. Vector n (k, t) indicates background noise. The matrix A k is a conversion function matrix, and its (m, n) element is a conversion function of a direct path from the nth sound source to the mth microphone. The n-th column vectors of A k is referred to as a position vector of the n-th sound source (Steering Vector).
まず、式(2)で定義される空間相関行列Rkを求め、式(3)に示すRkの固有値分解により、固有値の対角行列Λk及び固有ベクトルから成るEkが求められる。 First, a spatial correlation matrix R k defined by Equation (2) is obtained, and E k composed of an eigenvalue diagonal matrix Λ k and an eigenvector is obtained by eigenvalue decomposition of R k shown in Equation (3).
固有ベクトルはEk=[Eks|Ekn]のように分割出来る。EksとEknとはそれぞれ支配的なN個の固有値に対応する固有ベクトルと、それ以外の固有ベクトルとを示す。
The eigenvector can be divided as E k = [E ks | E kn ]. E ks and E kn indicate eigenvectors corresponding to the dominant N eigenvalues and other eigenvectors, respectively.
MUSIC空間スペクトルは式(4)と(5)とで求める。rは距離、θとφとはそれぞれ方位角と仰角とを示す。式(5)は、スキャンされる点(r、θ、φ)における正規化した位置ベクトルである。 The MUSIC spatial spectrum is obtained by equations (4) and (5). r is a distance, and θ and φ are an azimuth angle and an elevation angle, respectively. Equation (5) is a normalized position vector at the scanned point (r, θ, φ).
空間スペクトル(本明細書では「MUSIC応答」と呼ぶ。)は、MUSIC空間スペクトルを式(6)のように平均化したものである。
The spatial spectrum (referred to herein as a “MUSIC response”) is an averaged MUSIC spatial spectrum as shown in Equation (6).
式(6)においてkL及びkHは、それぞれ周波数帯域の下位と上位の境界のインデックスであり、K=kH−kL+1。音源の方位は、MUSIC応答のN個のピークから求められる。
In Expression (6), k L and k H are indices of the lower and upper boundaries of the frequency band, respectively, and K = k H −k L +1. The direction of the sound source is obtained from N peaks of the MUSIC response.
30 ロボット
32 マイクロホン台
50 音源定位処理部
52 マイクロホンアレイ
60 固有ベクトル算出部
62 音源推定部
64 グルーピング部
86,186 相関行列算出部
88,188 固有値分解部
102 音源数推定部
104 MUSIC空間スペクトル算出部
106 MUSIC応答算出部
108 ピーク検出部
120 第1の平均値算出部
122 第2の平均値算出部
124 KNN分類器
126 学習データ記憶部
162 第1のバイナリ・マスキング処理部
164 第2のバイナリ・マスキング処理部
168 パワー算出部
172 音源数判定部
174 学習データ蓄積部
30
Claims (10)
前記変換手段により得られた前記複数チャンネルの音源信号の前記複数個の周波数帯域の各々について、前記所定の時間間隔ごとに周波数成分間の空間相関行列を求めるための相関行列算出手段と、
前記相関行列算出手段により前記所定時間間隔ごとに、かつ前記複数個の周波数帯域の各々について算出される空間相関行列の各々を固有値分解し、前記複数個の周波数帯域の各々について固有ベクトル及び固有値を算出するための固有ベクトル算出手段と、
前記固有ベクトル算出手段により前記所定時間間隔ごとに、かつ前記複数個の周波数帯域の各々について算出される固有値に基づき、第1及び第2の周波数範囲についての固有値プロファイルを算出するための固有値プロファイル算出手段とを含み、前記第1及び第2の周波数範囲の各々は、前記複数個の周波数帯域のうちの1又は複数個の周波数帯域を含み、
さらに、
前記固有値プロファイル算出手段により前記第1及び第2の周波数範囲について算出された固有値プロファイルの組をパラメータとして、前記所定の時間間隔ごとに音源数を推定するための音源数推定手段と、
前記音源数推定手段により推定された音源数と、前記マイクロホンアレイに属するマイクロホン素子の配置に関する情報と、前記所定の時間間隔ごとに前記固有ベクトル算出手段により算出された固有ベクトルとに基づいて、MUSIC法により前記音源数と等しい数の音源方位を推定するための音源推定手段とを含む、音源定位装置。 Conversion means for converting each of the sound source signals of a plurality of channels obtained from the output of the microphone array into frequency components of a plurality of frequency bands at predetermined time intervals;
Correlation matrix calculating means for obtaining a spatial correlation matrix between frequency components for each of the predetermined time intervals for each of the plurality of frequency bands of the sound source signals of the plurality of channels obtained by the converting means;
The correlation matrix calculation means performs eigenvalue decomposition on each of the spatial correlation matrices calculated for each of the plurality of frequency bands at each predetermined time interval, and calculates eigenvectors and eigenvalues for each of the plurality of frequency bands. Eigenvector calculation means for performing,
Eigenvalue profile calculation means for calculating eigenvalue profiles for the first and second frequency ranges based on the eigenvalues calculated for each of the plurality of frequency bands by the eigenvector calculation means at each predetermined time interval. Each of the first and second frequency ranges includes one or more of the plurality of frequency bands,
further,
A sound source number estimating means for estimating the number of sound sources at each predetermined time interval, using as a parameter the set of eigen value profiles calculated by the eigen value profile calculating means for the first and second frequency ranges;
Based on the number of sound sources estimated by the sound source number estimating means, information on the arrangement of microphone elements belonging to the microphone array, and eigenvectors calculated by the eigenvector calculating means at each predetermined time interval, the MUSIC method is used. A sound source localization apparatus including sound source estimation means for estimating the number of sound source directions equal to the number of sound sources.
前記固有ベクトル算出手段により前記所定時間間隔ごとに、かつ前記第1の周波数範囲に属する周波数帯域について算出される固有値を、固有値番号ごとに平均するための第1の固有値平均手段と、
前記固有ベクトル算出手段により前記所定時間間隔ごとに、かつ前記第2の周波数範囲に属する周波数帯域について算出される固有値を、固有値番号ごとに平均するための第2の固有値平均手段と、
前記第1および第2の固有値平均手段により固有値番号ごとに算出された固有値の平均により、前記固有値プロファイルを作成し出力するための手段とを含む、請求項1〜請求項4のいずれかに記載の音源定位装置。 The eigenvalue profile calculation means includes:
First eigenvalue averaging means for averaging eigenvalues calculated for the frequency bands belonging to the first frequency range by the eigenvector calculating means for each eigenvalue number;
Second eigenvalue averaging means for averaging eigenvalues calculated for the frequency bands belonging to the second frequency range by the eigenvector calculating means for each eigenvalue number;
5. A means for creating and outputting the eigenvalue profile by averaging eigenvalues calculated for each eigenvalue number by the first and second eigenvalue averaging means. Sound source localization device.
前記固有値プロファイルの組をパラメータとして、各々が固有値プロファイルの組と対応する音源数との組合せからなる複数個の学習データを記憶するための学習データ記憶手段と、
前記固有値プロファイル算出手段により算出された固有値プロファイルの組をパラメータとして、前記学習データ記憶手段に記憶された前記学習データを用いたk近傍法によって音源数を推定するための手段とを含む、請求項7に記載の音源定位装置。 The nonlinear estimation means includes
Learning data storage means for storing a plurality of learning data each comprising a combination of the eigenvalue profile and the number of sound sources corresponding to the set of eigenvalue profiles as a parameter;
And a means for estimating the number of sound sources by a k-nearest neighbor method using the learning data stored in the learning data storage means using the set of eigenvalue profiles calculated by the eigenvalue profile calculation means as a parameter. The sound source localization apparatus according to 7.
Priority Applications (1)
| Application Number | Priority Date | Filing Date | Title |
|---|---|---|---|
| JP2008293831A JP2010121975A (en) | 2008-11-17 | 2008-11-17 | Sound-source localizing device |
Applications Claiming Priority (1)
| Application Number | Priority Date | Filing Date | Title |
|---|---|---|---|
| JP2008293831A JP2010121975A (en) | 2008-11-17 | 2008-11-17 | Sound-source localizing device |
Publications (1)
| Publication Number | Publication Date |
|---|---|
| JP2010121975A true JP2010121975A (en) | 2010-06-03 |
Family
ID=42323454
Family Applications (1)
| Application Number | Title | Priority Date | Filing Date |
|---|---|---|---|
| JP2008293831A Pending JP2010121975A (en) | 2008-11-17 | 2008-11-17 | Sound-source localizing device |
Country Status (1)
| Country | Link |
|---|---|
| JP (1) | JP2010121975A (en) |
Cited By (12)
| Publication number | Priority date | Publication date | Assignee | Title |
|---|---|---|---|---|
| JP2012042465A (en) * | 2010-08-17 | 2012-03-01 | Honda Motor Co Ltd | Sound source direction estimation device and sound source direction estimation method |
| JP2012150237A (en) * | 2011-01-18 | 2012-08-09 | Sony Corp | Sound signal processing apparatus, sound signal processing method, and program |
| JP2012211768A (en) * | 2011-03-30 | 2012-11-01 | Advanced Telecommunication Research Institute International | Sound source positioning apparatus |
| JP2014059225A (en) * | 2012-09-18 | 2014-04-03 | Toshiba Corp | Receiver, noise suppression method, and noise suppression program |
| CN103901888A (en) * | 2014-03-18 | 2014-07-02 | 北京工业大学 | Robot autonomous motion control method based on infrared and sonar sensors |
| WO2014125736A1 (en) * | 2013-02-14 | 2014-08-21 | ソニー株式会社 | Speech recognition device, speech recognition method and program |
| US9318124B2 (en) | 2011-04-18 | 2016-04-19 | Sony Corporation | Sound signal processing device, method, and program |
| US9357298B2 (en) | 2013-05-02 | 2016-05-31 | Sony Corporation | Sound signal processing apparatus, sound signal processing method, and program |
| CN109188347A (en) * | 2018-10-11 | 2019-01-11 | 北京遥感设备研究所 | Three classification method of polarizations mode based on MUSIC spectrum |
| CN109239648A (en) * | 2018-10-24 | 2019-01-18 | 同方电子科技有限公司 | Spectrum correlation subspaces direction-finding method based on symmetrical cycle frequency |
| CN116148770A (en) * | 2023-04-21 | 2023-05-23 | 湖南工商大学 | Sound source positioning method, device and system based on array signal processing |
| CN117031399A (en) * | 2023-10-10 | 2023-11-10 | 浙江华创视讯科技有限公司 | Multi-agent cooperative sound source positioning method, equipment and storage medium |
-
2008
- 2008-11-17 JP JP2008293831A patent/JP2010121975A/en active Pending
Cited By (16)
| Publication number | Priority date | Publication date | Assignee | Title |
|---|---|---|---|---|
| JP2012042465A (en) * | 2010-08-17 | 2012-03-01 | Honda Motor Co Ltd | Sound source direction estimation device and sound source direction estimation method |
| JP2012150237A (en) * | 2011-01-18 | 2012-08-09 | Sony Corp | Sound signal processing apparatus, sound signal processing method, and program |
| US9361907B2 (en) | 2011-01-18 | 2016-06-07 | Sony Corporation | Sound signal processing apparatus, sound signal processing method, and program |
| JP2012211768A (en) * | 2011-03-30 | 2012-11-01 | Advanced Telecommunication Research Institute International | Sound source positioning apparatus |
| US9318124B2 (en) | 2011-04-18 | 2016-04-19 | Sony Corporation | Sound signal processing device, method, and program |
| JP2014059225A (en) * | 2012-09-18 | 2014-04-03 | Toshiba Corp | Receiver, noise suppression method, and noise suppression program |
| US10475440B2 (en) | 2013-02-14 | 2019-11-12 | Sony Corporation | Voice segment detection for extraction of sound source |
| WO2014125736A1 (en) * | 2013-02-14 | 2014-08-21 | ソニー株式会社 | Speech recognition device, speech recognition method and program |
| US9357298B2 (en) | 2013-05-02 | 2016-05-31 | Sony Corporation | Sound signal processing apparatus, sound signal processing method, and program |
| CN103901888A (en) * | 2014-03-18 | 2014-07-02 | 北京工业大学 | Robot autonomous motion control method based on infrared and sonar sensors |
| CN109188347A (en) * | 2018-10-11 | 2019-01-11 | 北京遥感设备研究所 | Three classification method of polarizations mode based on MUSIC spectrum |
| CN109239648A (en) * | 2018-10-24 | 2019-01-18 | 同方电子科技有限公司 | Spectrum correlation subspaces direction-finding method based on symmetrical cycle frequency |
| CN116148770A (en) * | 2023-04-21 | 2023-05-23 | 湖南工商大学 | Sound source positioning method, device and system based on array signal processing |
| CN116148770B (en) * | 2023-04-21 | 2023-07-07 | 湖南工商大学 | Sound source positioning method, device and system based on array signal processing |
| CN117031399A (en) * | 2023-10-10 | 2023-11-10 | 浙江华创视讯科技有限公司 | Multi-agent cooperative sound source positioning method, equipment and storage medium |
| CN117031399B (en) * | 2023-10-10 | 2024-02-20 | 浙江华创视讯科技有限公司 | Multi-agent cooperative sound source positioning method, equipment and storage medium |
Similar Documents
| Publication | Publication Date | Title |
|---|---|---|
| JP2010121975A (en) | Sound-source localizing device | |
| Diaz-Guerra et al. | Robust sound source tracking using SRP-PHAT and 3D convolutional neural networks | |
| Grondin et al. | Lightweight and optimized sound source localization and tracking methods for open and closed microphone array configurations | |
| US10127922B2 (en) | Sound source identification apparatus and sound source identification method | |
| Ishi et al. | Evaluation of a MUSIC-based real-time sound localization of multiple sound sources in real noisy environments | |
| EP2530484B1 (en) | Sound source localization apparatus and method | |
| JP2004274763A (en) | Microphone array structure, beam forming apparatus and method, and method and apparatus for estimating acoustic source direction | |
| WO2019187589A1 (en) | Sound source direction estimation device, sound source direction estimation method, and program | |
| Grondin et al. | Time difference of arrival estimation based on binary frequency mask for sound source localization on mobile robots | |
| Asaei et al. | Model-based sparse component analysis for reverberant speech localization | |
| Traa et al. | Multichannel source separation and tracking with RANSAC and directional statistics | |
| US8416642B2 (en) | Signal processing apparatus and method for removing reflected wave generated by robot platform | |
| Pertilä | Online blind speech separation using multiple acoustic speaker tracking and time–frequency masking | |
| JP5660362B2 (en) | Sound source localization apparatus and computer program | |
| Lin | Jointly tracking and separating speech sources using multiple features and the generalized labeled multi-bernoulli framework | |
| Murase et al. | Multiple moving speaker tracking by microphone array on mobile robot. | |
| Grondin et al. | Fast and robust 3-D sound source localization with DSVD-PHAT | |
| Abutalebi et al. | Performance improvement of TDOA-based speaker localization in joint noisy and reverberant conditions | |
| Zhao et al. | A robust real-time sound source localization system for olivia robot | |
| Teng et al. | Disambiguation in multidimensional tracking of multiple acoustic sources using a gaussian likelihood criterion | |
| Lian et al. | Self-rotation angle estimation of circular microphone array based on sound field interpolation | |
| Hadad et al. | Multi-speaker direction of arrival estimation using SRP-PHAT algorithm with a weighted histogram | |
| Hu et al. | Robust speaker's location detection in a vehicle environment using GMM models | |
| Rudzyn et al. | Real time robot audition system incorporating both 3D sound source localisation and voice characterisation | |
| Nguyen et al. | Selection of the closest sound source for robot auditory attention in multi-source scenarios |