JP2005169077A - Method for finding transformation relating data point of first data set to data point of second data set, and computer program for performing the method - Google Patents
Method for finding transformation relating data point of first data set to data point of second data set, and computer program for performing the method Download PDFInfo
- Publication number
- JP2005169077A JP2005169077A JP2004261609A JP2004261609A JP2005169077A JP 2005169077 A JP2005169077 A JP 2005169077A JP 2004261609 A JP2004261609 A JP 2004261609A JP 2004261609 A JP2004261609 A JP 2004261609A JP 2005169077 A JP2005169077 A JP 2005169077A
- Authority
- JP
- Japan
- Prior art keywords
- data
- transformation
- data point
- data set
- images
- Prior art date
- Legal status (The legal status is an assumption and is not a legal conclusion. Google has not performed a legal analysis and makes no representation as to the accuracy of the status listed.)
- Pending
Links
- 238000000034 method Methods 0.000 title claims abstract description 41
- 230000009466 transformation Effects 0.000 title claims abstract description 31
- 238000004590 computer program Methods 0.000 title claims description 3
- 238000011524 similarity measure Methods 0.000 abstract description 12
- 230000004927 fusion Effects 0.000 abstract description 2
- 238000000844 transformation Methods 0.000 abstract description 2
- 230000008569 process Effects 0.000 description 7
- 210000004556 brain Anatomy 0.000 description 3
- 230000008859 change Effects 0.000 description 3
- 238000013459 approach Methods 0.000 description 2
- 230000007246 mechanism Effects 0.000 description 2
- 230000035945 sensitivity Effects 0.000 description 2
- 210000004872 soft tissue Anatomy 0.000 description 2
- 238000007476 Maximum Likelihood Methods 0.000 description 1
- QVGXLLKOCUKJST-UHFFFAOYSA-N atomic oxygen Chemical compound [O] QVGXLLKOCUKJST-UHFFFAOYSA-N 0.000 description 1
- 230000008901 benefit Effects 0.000 description 1
- 239000008280 blood Substances 0.000 description 1
- 210000004369 blood Anatomy 0.000 description 1
- 238000004422 calculation algorithm Methods 0.000 description 1
- 238000004364 calculation method Methods 0.000 description 1
- 238000013461 design Methods 0.000 description 1
- 238000002059 diagnostic imaging Methods 0.000 description 1
- 238000010586 diagram Methods 0.000 description 1
- 238000002474 experimental method Methods 0.000 description 1
- 238000009499 grossing Methods 0.000 description 1
- 238000005259 measurement Methods 0.000 description 1
- 238000005457 optimization Methods 0.000 description 1
- 229910052760 oxygen Inorganic materials 0.000 description 1
- 239000001301 oxygen Substances 0.000 description 1
- 230000002093 peripheral effect Effects 0.000 description 1
- 230000000717 retained effect Effects 0.000 description 1
- 210000004761 scalp Anatomy 0.000 description 1
- 238000002603 single-photon emission computed tomography Methods 0.000 description 1
- 210000003625 skull Anatomy 0.000 description 1
- 230000002123 temporal effect Effects 0.000 description 1
Images


Classifications
-
- G—PHYSICS
- G06—COMPUTING; CALCULATING OR COUNTING
- G06T—IMAGE DATA PROCESSING OR GENERATION, IN GENERAL
- G06T7/00—Image analysis
- G06T7/30—Determination of transform parameters for the alignment of images, i.e. image registration
-
- G—PHYSICS
- G06—COMPUTING; CALCULATING OR COUNTING
- G06T—IMAGE DATA PROCESSING OR GENERATION, IN GENERAL
- G06T2207/00—Indexing scheme for image analysis or image enhancement
- G06T2207/30—Subject of image; Context of image processing
- G06T2207/30004—Biomedical image processing
- G06T2207/30016—Brain
Landscapes
- Engineering & Computer Science (AREA)
- Computer Vision & Pattern Recognition (AREA)
- Physics & Mathematics (AREA)
- General Physics & Mathematics (AREA)
- Theoretical Computer Science (AREA)
- Apparatus For Radiation Diagnosis (AREA)
- Image Analysis (AREA)
- Image Processing (AREA)
- Magnetic Resonance Imaging Apparatus (AREA)
- Measuring And Recording Apparatus For Diagnosis (AREA)
Abstract
Description
[発明の詳細な説明]
本発明は、データセット(data set)の互いに対する一致度を測定するために用いられる類似性測度に関する。
Detailed Description of the Invention
The present invention relates to a similarity measure used to measure the degree of coincidence of data sets with respect to each other.
あるデータセットと別のデータセットの類似性または一致度を測定できることが望ましい分野は多い。例えば、2つの画像を比較して、この2つの画像を関係付ける空間変換を求める状況は多い。例えば、画像の時間シーケンスを圧縮する一方法は、第1フレームに見られる画像特徴が第2フレームのどこに配置されているかを記述する移動ベクトルを検出することである。別法として、医用画像分野では、同じ物体(例えば患者の身体の一部)の2つの画像を重ね合わせて表示することが望ましい場合が多い。この2つの画像は、異なる時点で撮影された画像、または異なるモダリティで撮影された画像である可能性がある。重ね合わせた2つの画像の表示は、それらの画像が位置合わせ(register)されていることを要し、この位置合わせには、それぞれの画像において対応する画像特徴の位置を見つけることが伴う。同様の技法は、例えば可視または赤外線画像を合成開口レーダ等の異なる種類の画像と位置合わせする、いわゆるデータの融合を伴う他の分野でも有用である。この必要性は、位置合わせすることが有用である可能性があるECGおよび血中酸素濃度等の1次元信号、および3D画像が時間の経過とともに変化するコントラスト増強MRI等の4次元画像においても生じる可能性がある。 There are many areas where it is desirable to be able to measure the similarity or agreement between one data set and another. For example, there are many situations where two images are compared and a spatial transformation relating these two images is required. For example, one way to compress the temporal sequence of images is to detect a motion vector that describes where the image features found in the first frame are located in the second frame. Alternatively, in the medical imaging field, it is often desirable to display two images of the same object (eg, part of a patient's body) superimposed. The two images may be images taken at different times or taken with different modalities. Display of the two superimposed images requires that the images be registered, and this alignment involves finding the position of the corresponding image feature in each image. Similar techniques are useful in other areas involving so-called data fusion, for example aligning visible or infrared images with different types of images such as synthetic aperture radar. This need also arises in one-dimensional signals such as ECG and blood oxygen levels that may be useful for alignment, and in four-dimensional images such as contrast-enhanced MRI where the 3D image changes over time. there is a possibility.
このような方法でデータセットを位置合わせする際には通常、様々な候補変換を画像に適用して、2つの画像をどの程度正確に位置合わせするかに基づいてスコアリングする。スコアは、類似性測度を用いて自動的に計算することができ、多数の様々な類似性測度が提案されており(例えば最小二乗誤差(differences)、相互相関等)、異なるタイプのデータセットには概して異なる類似性測度が適している。 When aligning data sets in this manner, various candidate transforms are typically applied to the images and scored based on how accurately the two images are aligned. Scores can be calculated automatically using similarity measures, and many different similarity measures have been proposed (eg, least squares differences, cross-correlation, etc.) for different types of datasets Generally different similarity measures are suitable.
現在まで、類似性測度は傾向として、照合する特定のデータセットについて試行錯誤法で選択されるか、あるいは、データ生成の基礎を成す機構、例えば画像生成の背後にある物理プロセスの理解から導出されてきた。しかし、所与の類似性測度が特定のタイプのデータに適していることを予測することは困難である可能性があり、新たな類似性測度の設計は時間のかかる困難なプロセスである。 To date, similarity measures are trended, selected by trial and error for specific data sets to be matched, or derived from an understanding of the underlying mechanisms of data generation, such as the physical processes behind image generation. I came. However, it can be difficult to predict that a given similarity measure is appropriate for a particular type of data, and designing a new similarity measure is a time consuming and difficult process.
本発明によれば、所与の変換が正しいものである尤度を測定する類似性測度の設計は、統計的な枠組みにおいて2つのデータセット自体の特性に基づいて、最尤推定法を用いて行われる。 According to the present invention, the design of a similarity measure that measures the likelihood that a given transformation is correct uses a maximum likelihood estimation method based on the characteristics of the two data sets themselves in a statistical framework. Done.
より詳細には、本発明は、第1データセットのデータポイント(data point)を第2データセットのデータポイントと関係付ける変換を見つける方法を提供する。本方法は、複数の候補変換のそれぞれについて、候補変換が2つのデータセット間の関係を正確に表す尤度を表す尤度測度(likelihood measure)を計算することを含み、この尤度測度は、候補変換において対応すると考えられる2つのデータセットのデータポイント対について計算される局所パラメータ結合(local parametric joint)および周辺(marginal)確率密度関数(pdf)に基づき、関数のパラメータは、データポイント対の局所尤度基準を最大化することによって設定される。 More particularly, the present invention provides a method for finding a transformation that relates a data point of a first data set to a data point of a second data set. The method includes, for each of a plurality of candidate transforms, calculating a likelihood measure that represents a likelihood that the candidate transform accurately represents the relationship between the two data sets, the likelihood measure being Based on the local parametric joint and marginal probability density function (pdf) calculated for the data point pairs of the two data sets considered to correspond in the candidate transformation, the parameters of the function are Set by maximizing local likelihood criterion.
好ましくは、確率密度関数は、データポイント対に対して局所的なデータポイントの特徴に基づく。したがって、ポイント毎に異なる可能性があるパラメータ関数は、データポイントの近傍に有効であると仮定されるが、互いから離れたポイントに関しては異なる可能性がある。 Preferably, the probability density function is based on data point features that are local to the data point pair. Thus, parameter functions that may differ from point to point are assumed to be valid in the vicinity of the data points, but may differ for points far from each other.
したがって、本発明では、確率密度関数は、検討中の特定の候補変換によって生成されるデータポイント対について計算される。したがって尤度測度は、照合中の2つのデータセットに適合する。データセットの生成機構に関する事前知識は必要ない。 Thus, in the present invention, the probability density function is calculated for the data point pairs generated by the particular candidate transformation under consideration. The likelihood measure therefore fits the two data sets being matched. Prior knowledge of the dataset generation mechanism is not required.
確率密度関数は、二次多項式関数等の単純なパラメータ関数であってよい。関数のパラメータは、データポイント対の局所尤度基準を最大化することによって設定され、この局所尤度基準は、確率密度関数と、好ましくは窓関数およびスケールパラメータとに基づく。窓関数およびスケールパラメータは、本方法の性能を調整するために発見的に(heuristically)調節することができる。パラメータは、それぞれのデータポイント対について、または少なくとも画像の異なる部分について再計算してもよい。 The probability density function may be a simple parameter function such as a quadratic polynomial function. The function parameters are set by maximizing the local likelihood criterion of the data point pair, which local likelihood criterion is based on a probability density function and preferably a window function and a scale parameter. Window functions and scale parameters can be adjusted heuristically to tune the performance of the method. The parameters may be recalculated for each data point pair, or at least for different parts of the image.
本方法は、データセットが例えば画素の輝度(intensity)である画像の位置合わせに適用することができ、この場合、変換は、2つの画像を位置合わせする空間変換である。画像は例えば、異なるモダリティおよび/または時間間隔をおいた画像である可能性があり、本方法は特に、医用画像の位置合わせに適している。 The method can be applied to registration of images whose data set is, for example, pixel intensity, where the transformation is a spatial transformation that aligns the two images. The images can be, for example, images with different modalities and / or time intervals, and the method is particularly suitable for registration of medical images.
しかし、本方法は、信号または測定値を表すもの等、他のデータセットにも適用することができる。 However, the method can also be applied to other data sets, such as those representing signals or measurements.
本発明は、コンピュータソフトウェアにおいて実施することができ、よって適切にプログラムされたコンピュータシステム上で本方法を実行するコンピュータプログラムを提供することができることが理解されるだろう。別法として、当然ながら、本発明は、ファームウェアまたは専用ハードウェアにおいて実施してもよい。 It will be appreciated that the present invention can be implemented in computer software and thus can provide a computer program for performing the method on a suitably programmed computer system. Alternatively, it will be appreciated that the present invention may be implemented in firmware or dedicated hardware.
本発明を、例として、添付図面を参照してさらに説明する。 The invention will be further described, by way of example, with reference to the accompanying drawings.
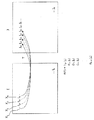
本発明の1実施形態を、画像である2つのデータセットを参照して説明する。たとえば、図1に示すように、2つの画像IおよびJが与えられ、JがIを変換Tによって変換したものであり、TがIおよびJそれぞれの座標系を関係付けることになっている場合、目的は、変換Tがどの程度「正しい」変換に近いかを正確にスコアリングする類似性測度を開発することである。言い換えれば、Jが変換Tによって変換された画像Iである尤度はどれほどか、である。変換Tは、Iの画素とJの画素の間の空間的対応のセットを定める。 One embodiment of the present invention is described with reference to two datasets that are images. For example, as shown in FIG. 1, when two images I and J are given, J is a transformation of I by transformation T, and T is to associate the respective coordinate systems of I and J The goal is to develop a similarity measure that accurately scores how close the transformation T is to the “correct” transformation. In other words, what is the likelihood that J is an image I transformed by transformation T? Transform T defines a set of spatial correspondences between I and J pixels.
Iが元画像であり、Jがターゲット画像であると仮定すると、これは、画像Iの座標系において座標xを有する画素が画像Jの座標系において座標T(x)を有する画素と一致することを意味する。{xk}(k=1,...,n)は、画像Iの画素セットを示すものとする。xkに対応する輝度値をikで示す。同様に、Jにおける対応画素の輝度値、すなわち座標T(xk)を有する画素をjkで示す。 Assuming I is the original image and J is the target image, this means that the pixel with coordinate x in the image I coordinate system matches the pixel with coordinate T (x) in the image J coordinate system. Means. {X k } (k = 1,..., N) represents a pixel set of the image I. a luminance value corresponding to x k indicated by i k. Similarly, the pixel having the luminance value of the corresponding pixel in J, that is, the coordinate T (x k ) is denoted by j k .
所与の変換Tからこのように進んでいくと、輝度対(intensity pair)A(T)={(ik,jk),k=1,...,n}のセットが得られることに留意されたい。また、輝度対のセットは、推定変換Tの変化に伴って変化することが予期される、すなわち輝度対のセットは数学的にTの関数として考えることができることにも留意されたい。Tの尤度、すなわちTが正しい位置合わせ変換である確率は、次式によって得られる。 Proceeding in this way from a given transformation T, the intensity pair A (T) = {(i k , j k ), k = 1,. . . , N} is obtained. It should also be noted that the set of luminance pairs is expected to change with changes in the estimated transform T, ie the set of luminance pairs can be considered mathematically as a function of T. The likelihood of T, ie the probability that T is the correct alignment transformation, is obtained by

ここで、pは結合輝度pdfであり、p1およびp2はそれぞれIおよびJに対応する周辺pdfである。しかし、式(1)は実際には、これら3つのpdfが指定された場合にのみ利用することができる。 Here, p is the combined luminance pdf, and p 1 and p 2 are the peripheral pdfs corresponding to I and J, respectively. However, equation (1) can actually be used only when these three pdfs are specified.
本実施形態において用いられる基本原理は、局所尤度密度推定(Local Likelihood Density Estimation)(LLDE)を用いて、一般にそうであるように、pdf全体の単純なパラメータ形式がない場合にも、pdfが局所的に単純なパラメータ形式によって近似できると仮定することによって、データセットからpdfを推定することである。本実施形態ではさらに、pdfの対数は局所的に二次多項式であると仮定するが、任意の他のパラメータ形式、例えばより高次の多項式を用いることもできることを理解することができる。 The basic principle used in the present embodiment is that the local likelihood density estimation (LLDE) is used, and as is generally the case, even if there is no simple parameter format of the entire pdf, the pdf is Estimating pdf from the data set by assuming that it can be approximated by a locally simple parameter form. This embodiment further assumes that the logarithm of pdf is locally a quadratic polynomial, but it can be understood that any other parameter form, such as a higher order polynomial, can be used.
したがって、任意の観察された輝度対(i,j)について、iおよびjにそれぞれ十分近い Thus, for any observed luminance pair (i, j), close enough to i and j respectively
![]()
![]()
および and
![]()
![]()
に関してpdfの多項式近似が(i,j)の近傍において有効であるように、係数セット(a0,a1,...,a5)を計算する。 Compute the coefficient set (a 0 , a 1 ,..., A 5 ) so that the polynomial approximation of pdf is valid in the vicinity of (i, j).
![]()
![]()
本方法の1実施形態において、多項式の係数は、次の局所尤度基準を最大化するように設定される。 In one embodiment of the method, the polynomial coefficients are set to maximize the next local likelihood criterion.
ここで、 here,
![]()
![]()
は所与の窓関数であり、s1s2はスケールパラメータである。 Is a given window function and s 1 s 2 is a scale parameter.
![]()
![]()
の通常の選択肢は、1)箱形関数、すなわち The usual choice of 1) is a box function, ie
ならびに2)ガウス関数、すなわち And 2) a Gaussian function, ie
![]()
![]()
である。 It is.
![]()
![]()
が局所重み関数の形状を決める一方、スケールパラメータs1およびs2は、窓のサポート(window support)によって定められる近傍の拡張を調節し、よって局所サイズを制御する。s1およびs2はともに本方法のパラメータであり、これらのパラメータを調整する方法は、本発明とは完全に独立している。実験に基づく実施では、s1およびs2は、検討中の特定の画像タイプに応じて、同様の画像を用いた以前の実験において良好な位置合わせ結果をもたらすことが立証された値に設定することができる。例として、実際に有用であることが分かった規則の例は、s1を画像I中の最大輝度の所与の割合に設定することであり、この割合は、CT画像の場合に1%、MR画像の場合に2%、PETまたはSPECT画像の場合に5%である。同一の規則を、画像Jのタイプに応じてs2に当てはめてもよい。 Determines the shape of the local weight function, while the scale parameters s 1 and s 2 adjust the neighborhood expansion defined by the window support, and thus control the local size. Both s1 and s2 are parameters of the method, and the method of adjusting these parameters is completely independent of the present invention. In an experimental implementation, depending on the particular image type under consideration, s1 and s2 may be set to values that have been proven to give good alignment results in previous experiments with similar images. it can. By way of example, an example of a rule that has proven useful in practice is to set s1 to a given percentage of the maximum luminance in image I, which is 1% for MR images, MR 2% for images and 5% for PET or SPECT images. The same rule may be applied to s2 depending on the type of image J.
理論的な観点で見れば、s1およびs2が大きくなるほど、局所多項式モデルを当てはめるために用いられる輝度近傍は大きくなり、よって結果として得られるpdfの推定値は滑らかになる。一方、s1およびs2に小さな値を選択すると、pdf推定値により急激な変化が許容されるため、より大きな柔軟性が得られるが、その代償として、位置合わせは画像のアーチファクトおよび雑音により敏感になる傾向がある。このよく知られたトレードオフのスケールパラメータは、統計的推定では一般的なものであり、「帯域幅選択」として知られる。 From a theoretical point of view, the larger s1 and s2 are, the larger the luminance neighborhood used to fit the local polynomial model is, and hence the resulting pdf estimate is smoother. On the other hand, choosing small values for s1 and s2 allows greater flexibility because the pdf estimates allow for abrupt changes, but at the cost of alignment, the alignment is more sensitive to image artifacts and noise. Tend. This well-known trade-off scale parameter is common in statistical estimation and is known as “bandwidth selection”.
周辺pdf p1およびp2の推定は同じ原理から得られる。局所的な二次多項式の形式を次のように仮定し、 Estimates of the surrounding pdf p 1 and p 2 are obtained from the same principle. Assuming the form of a local quadratic polynomial as
![]()
![]()
p2についても同様に行う。 It carried out in the same manner also for p 2.
局所多項式は、式(3)を1次元にしたものを最大化することによって当てはめ、 The local polynomial is fit by maximizing the one-dimensional expression (3),
p2についても同様に行う。結合pdfの推定との一貫性を保つために、窓関数 It carried out in the same manner also for p 2. To be consistent with the estimation of the combined pdf, the window function
![]()
![]()
および and
![]()
![]()
は、二次元窓関数 Is a two-dimensional window function
から、 From
として定義する。 Define as
LLDEの主な利点は、pdfの形状に関する非常にわずかな仮定に頼る一方で正確な密度推定値を与えることができることにある。これは、類似性測度(1)に伴う密度p、p1およびp2の指定誤りが実質的な位置合わせ誤差に反映される場合があるため、重要である。 The main advantage of LLDE is that it can give accurate density estimates while relying on very few assumptions about the shape of the pdf. This is important because the specification errors for the densities p, p 1 and p 2 associated with the similarity measure (1) may be reflected in the substantial alignment error.
パラメータ手法とは異なり、選択に画像取得プロセスをモデル化する退屈で困難なタスクを必要とする結合pdfのグローバルモデルは不要である。さらに、パラメータ手法は通常、その実際の実施を困難にする非凸形の(non-convex)最適化問題をもたらす。 Unlike the parametric approach, a global model of combined pdf that requires tedious and difficult tasks to model the image acquisition process for selection is not required. In addition, parametric approaches typically result in non-convex optimization problems that make their actual implementation difficult.
図2は、ステップを例示的なアルゴリズムで行われることのできる順番で示すフロー図である。ステップ200において2つのデータセット、例えば2つの画像を取得し、次にステップ201では、上述のようにスケールパラメータs1およびs2ならびに窓関数
FIG. 2 is a flow diagram illustrating the steps in an order that can be performed with an exemplary algorithm. In
![]()
![]()
を選択する必要がある。 It is necessary to select.
ステップ202において、式4および式5を用いて、それぞれのデータセットの周辺pdfを計算する、つまり、式5を最大化することにより式4の局所多項式を当てはめることによってa0 a1 a2を計算する。(このステップは、a0 a1 a2が必要となる尤度の計算以前の任意の時点で実行することができる。)
In
次にステップ203において、所与の候補変換Tについて、輝度対A(T)を見つける。図1を参照すると、図示される変換Tは、右側へ1画素分の単純なシフトである。したがって、変換Tにおいて、画素j2は画素i1に対応し、画素j3は画素i2に対応する、等となる。このように、輝度対A(T)のセットが2つの画像フレームの下に示される。 Next, in step 203, the luminance pair A (T) is found for a given candidate transformation T. Referring to FIG. 1, the illustrated transformation T is a simple shift of one pixel to the right. Thus, in transformation T, pixel j2 corresponds to pixel i1, pixel j3 corresponds to pixel i2, and so on. Thus, a set of luminance versus A (T) is shown below the two image frames.
次にステップ204において輝度対を取得し、ステップ205において、式(3)の局所尤度基準を最大化することによって多項式係数a1、a2、a3、a4、a5を計算する。(係数a1、a2、a3、a4、a5は対毎に異なることに留意されたい。)
Next, a luminance pair is acquired in
多項式係数を取得したら、ステップ206において式(2)を用いて結合確率密度関数pを計算することができる。
Once the polynomial coefficients are obtained, the joint probability density function p can be calculated at
ステップ207では、全ての輝度対を処理したかどうかを調べ、全ての輝度対を処理していない場合、全ての対が完了するまでプロセスを繰り返す。全ての対が完了したら、ステップ209において、式(1)を用いてその変換の尤度測度を計算することができる。
In
次にステップ210および211において、他の候補変換を取得し、プロセスを繰り返す。
Next, in
すると、各候補変換に尤度が関連付けられ、ステップ212において、尤度の最も高い変換を選択することができる。これは、第2画像フレームが第1画像フレームに関係する方法の最良推定値を表す。ステップ213に示すように、s1、s2および
Then, the likelihood is associated with each candidate transform, and in
![]()
![]()
に異なる値を用いてプロセスを繰り返し、結果を改善することが可能である。 It is possible to repeat the process using different values for to improve the results.
図3(a)は、脳のCT−MR画像対の位置合わせ後の結合ヒストグラムを示す。このように、ヒストグラム中の各ポイントは、位置合わせされた画像において所与のCT輝度および所与のMR輝度を有する画素数を表す。良好な位置合わせは結果として、明確な構造および少数のピークをヒストグラム中に生じる。不良な位置合わせは結果として、より多くの散乱したピークを生じる。図3(a)の未処理のヒストグラムは、特にCT骨−MR軟組織領域で雑音が多い。この未処理のヒストグラム(すなわちp(i,j)=h(i,j))のみからp(i,j)を直接推定すると、変換の小さな変化がヒストグラムひいては類似性スコアに大きな変化を生じるため、結果として位置合わせ変換の推定の頑強性が限定される。図3(b)は、単純で均一なぼかし技法、または単純なパルゼン(Parzen)窓掛け処理を用いてヒストグラムを平滑化したものを示す。CT軟組織−MR軟組織領域は平滑化され、よって変換に対する類似性測度の感受性を有効に低減することが分かる。しかし、分布の鮮明さは必然的に低くなるため、結合ヒストグラムのそのような単純すぎる平滑化は、分布の重要な特性を失い、正確なp(i,j)の推定を偏らせる可能性がある。この結果、2つの画像の位置合わせ精度は低くなる(変換に対する類似性スコアの感受性を低くしたことによる必然的な結果である)。図3(c)および図3(d)は、本発明に従ってs1およびs2に異なる値を用いて推定されたp(i,j)を示す。図示のように、雑音は相殺されるが、分布の特性、例えば高いピークの鮮明さは保持される。雑音の低減により頑強性が増す一方で、鮮明なピークの保持により正確な位置合わせを行うことができる。 FIG. 3 (a) shows a combined histogram after alignment of brain CT-MR image pairs. Thus, each point in the histogram represents the number of pixels having a given CT luminance and a given MR luminance in the registered image. Good alignment results in a well-defined structure and a few peaks in the histogram. Poor alignment results in more scattered peaks. The unprocessed histogram of FIG. 3A is noisy, especially in the CT bone-MR soft tissue region. If p (i, j) is directly estimated from only this unprocessed histogram (ie, p (i, j) = h (i, j)), a small change in transformation will cause a large change in the histogram and thus the similarity score. As a result, the robustness of the alignment transform estimation is limited. FIG. 3B shows a smoothed histogram using a simple and uniform blurring technique or a simple Parzen windowing process. It can be seen that the CT soft tissue-MR soft tissue region is smoothed, thus effectively reducing the sensitivity of the similarity measure to the transformation. However, since the sharpness of the distribution will inevitably be low, such too simple smoothing of the combined histogram may lose important properties of the distribution and bias the accurate p (i, j) estimation. is there. As a result, the registration accuracy of the two images is low (this is an inevitable result due to the low sensitivity of the similarity score to the transformation). 3 (c) and 3 (d) show p (i, j) estimated using different values for s 1 and s 2 in accordance with the present invention. As shown, the noise is cancelled, but the characteristics of the distribution, such as high peak sharpness, are retained. While robustness is increased by reducing noise, accurate alignment can be achieved by maintaining sharp peaks.
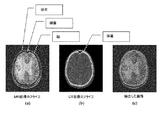
図4(a)および図4(b)はそれぞれMR画像およびCT画像のスライスの例を示し、図4(c)は本発明の技法を用いてMR画像とCT画像を融合した結果を示す。頭蓋構造がCT(明るい楕円形)とMR(脳と頭皮の間)の両方の画像で良好に整列していることが分かる。 4 (a) and 4 (b) show examples of slices of the MR image and CT image, respectively, and FIG. 4 (c) shows the result of fusing the MR image and CT image using the technique of the present invention. It can be seen that the skull structure is well aligned in both CT (bright oval) and MR (brain and scalp) images.
Claims (11)
複数の候補変換のそれぞれについて、前記候補変換が2つの前記データセット間の関係を正確に表す尤度を表す尤度測度を計算することを含み、
前記尤度測度は、前記候補変換において対応すると考えられる2つの前記データセットのデータポイント対について計算される局所パラメータ結合および周辺確率密度関数に基づき、
前記関数のパラメータは、前記データポイント対の局所尤度基準を最大化することによって設定される、
第1データセットのデータポイントを第2データセットのデータポイントと関係付ける変換を見つける方法。 A method for finding a transformation relating a data point of a first data set to a data point of a second data set, comprising:
For each of a plurality of candidate transforms, calculating a likelihood measure representing the likelihood that the candidate transform accurately represents the relationship between the two data sets;
The likelihood measure is based on a local parameter combination and a marginal probability density function calculated for a data point pair of two of the data sets considered to correspond in the candidate transformation,
The function parameters are set by maximizing a local likelihood criterion for the data point pair.
A method of finding a transformation relating a data point of a first data set to a data point of a second data set.
前記確率密度関数と、
前記局所データポイントの特徴の窓関数およびスケールパラメータのうちの少なくとも1つと
に基づいて計算される請求項1に記載の方法。 The local likelihood criterion for each probability density function is
The probability density function;
The method of claim 1, wherein the method is calculated based on at least one of a window function and a scale parameter of the feature of the local data point.
前記変換は前記画像を位置合わせする空間変換である請求項1〜6のいずれか一項に記載の方法。 Each of the data sets represents an image,
The method according to claim 1, wherein the transformation is a spatial transformation for aligning the images.
A computer program comprising program code means for performing the method according to any one of claims 1 to 10 on a programmed computer system.
Applications Claiming Priority (1)
| Application Number | Priority Date | Filing Date | Title |
|---|---|---|---|
| GBGB0320973.1A GB0320973D0 (en) | 2003-09-08 | 2003-09-08 | Improvements in or relating to similarity measures |
Publications (1)
| Publication Number | Publication Date |
|---|---|
| JP2005169077A true JP2005169077A (en) | 2005-06-30 |
Family
ID=29226675
Family Applications (1)
| Application Number | Title | Priority Date | Filing Date |
|---|---|---|---|
| JP2004261609A Pending JP2005169077A (en) | 2003-09-08 | 2004-09-08 | Method for finding transformation relating data point of first data set to data point of second data set, and computer program for performing the method |
Country Status (4)
| Country | Link |
|---|---|
| US (1) | US7450780B2 (en) |
| EP (1) | EP1513104A3 (en) |
| JP (1) | JP2005169077A (en) |
| GB (1) | GB0320973D0 (en) |
Cited By (3)
| Publication number | Priority date | Publication date | Assignee | Title |
|---|---|---|---|---|
| JP2006136724A (en) * | 2004-11-10 | 2006-06-01 | Agfa Gevaert Nv | Method for implementing measurement on digital image |
| JP2006136718A (en) * | 2004-11-10 | 2006-06-01 | Agfa Gevaert Nv | Display device for displaying blended image |
| JP2013008364A (en) * | 2011-06-22 | 2013-01-10 | Boeing Co:The | Display of image |
Families Citing this family (19)
| Publication number | Priority date | Publication date | Assignee | Title |
|---|---|---|---|---|
| GB0320973D0 (en) * | 2003-09-08 | 2003-10-08 | Isis Innovation | Improvements in or relating to similarity measures |
| US7639896B2 (en) * | 2004-08-09 | 2009-12-29 | Carestream Health, Inc. | Multimodal image registration using compound mutual information |
| US7822291B2 (en) * | 2004-10-28 | 2010-10-26 | Siemens Medical Solutions Usa, Inc. | Non-rigid multi-modal registration using statistical learning methods |
| WO2008005408A2 (en) * | 2006-06-29 | 2008-01-10 | Vassol Inc. | Sub-voxel motion correction for phase-contrast magnetic resonance imaging |
| US20080131029A1 (en) * | 2006-10-10 | 2008-06-05 | Coleby Stanley E | Systems and methods for visualizing and measuring real world 3-d spatial data |
| FR2914466B1 (en) * | 2007-04-02 | 2009-06-12 | Inst Nat Rech Inf Automat | IMAGE PROCESSING DEVICE FOR MATCHING IMAGES OF THE SAME PORTION OF A BODY OBTAINED BY MAGNETIC RESONANCE AND ULTRASOUND. |
| JP5088030B2 (en) * | 2007-07-26 | 2012-12-05 | ヤマハ株式会社 | Method, apparatus and program for evaluating similarity of performance sound |
| US8238635B2 (en) * | 2008-03-21 | 2012-08-07 | General Electric Company | Method and system for identifying defects in radiographic image data corresponding to a scanned object |
| US8233715B2 (en) * | 2008-04-28 | 2012-07-31 | Microsoft Corporation | Probabilistic intensity similarity measure based on noise distributions |
| US9547902B2 (en) * | 2008-09-18 | 2017-01-17 | Siemens Healthcare Gmbh | Method and system for physiological image registration and fusion |
| US9405996B2 (en) | 2008-09-18 | 2016-08-02 | Siemens Aktiengesellschaft | Method and system for generating a personalized anatomical heart model |
| DE102008049467B4 (en) * | 2008-09-29 | 2016-12-29 | Siemens Healthcare Gmbh | Method and device for registration of tomographic volume data sets of the intestine |
| US8527251B2 (en) * | 2009-05-01 | 2013-09-03 | Siemens Aktiengesellschaft | Method and system for multi-component heart and aorta modeling for decision support in cardiac disease |
| US8224640B2 (en) * | 2009-09-08 | 2012-07-17 | Siemens Aktiengesellschaft | Method and system for computational modeling of the aorta and heart |
| US8892186B2 (en) * | 2010-09-20 | 2014-11-18 | Siemens Aktiengesellschaft | Method and system for detection and tracking of coronary sinus catheter electrodes in fluoroscopic images |
| US8666477B2 (en) * | 2011-03-07 | 2014-03-04 | Siemens Aktiengesellschaft | Method and system for tracking of a virtual electrode on a coronary sinus catheter in fluoroscopic images |
| US9002436B2 (en) * | 2011-09-19 | 2015-04-07 | Siemens Aktiengesellschaft | Method and system for ablation catheter and circumferential mapping catheter tracking in fluoroscopic images |
| EP3128892A4 (en) * | 2014-04-05 | 2018-05-09 | Surgisense Corporation | Apparatus, systems, and methods for mapping of tissue oxygenation |
| US20220051017A1 (en) * | 2020-08-11 | 2022-02-17 | Nvidia Corporation | Enhanced object identification using one or more neural networks |
Family Cites Families (14)
| Publication number | Priority date | Publication date | Assignee | Title |
|---|---|---|---|---|
| US5956418A (en) * | 1996-12-10 | 1999-09-21 | Medsim Ltd. | Method of mosaicing ultrasonic volumes for visual simulation |
| FR2781906B1 (en) * | 1998-07-28 | 2000-09-29 | Inst Nat Rech Inf Automat | ELECTRONIC DEVICE FOR AUTOMATIC IMAGE RECORDING |
| US6173240B1 (en) * | 1998-11-02 | 2001-01-09 | Ise Integrated Systems Engineering Ag | Multidimensional uncertainty analysis |
| GB9906420D0 (en) * | 1999-03-19 | 1999-05-12 | Isis Innovation | Method and apparatus for image processing |
| US6266453B1 (en) * | 1999-07-26 | 2001-07-24 | Computerized Medical Systems, Inc. | Automated image fusion/alignment system and method |
| US6728424B1 (en) * | 2000-09-15 | 2004-04-27 | Koninklijke Philips Electronics, N.V. | Imaging registration system and method using likelihood maximization |
| US6775405B1 (en) | 2000-09-29 | 2004-08-10 | Koninklijke Philips Electronics, N.V. | Image registration system and method using cross-entropy optimization |
| GB0320973D0 (en) * | 2003-09-08 | 2003-10-08 | Isis Innovation | Improvements in or relating to similarity measures |
| US7263243B2 (en) * | 2003-12-29 | 2007-08-28 | Carestream Health, Inc. | Method of image registration using mutual information |
| US7639896B2 (en) * | 2004-08-09 | 2009-12-29 | Carestream Health, Inc. | Multimodal image registration using compound mutual information |
| US20060133694A1 (en) * | 2004-11-10 | 2006-06-22 | Agfa-Gevaert | Display device for displaying a blended image |
| US7876938B2 (en) * | 2005-10-06 | 2011-01-25 | Siemens Medical Solutions Usa, Inc. | System and method for whole body landmark detection, segmentation and change quantification in digital images |
| US7764819B2 (en) * | 2006-01-25 | 2010-07-27 | Siemens Medical Solutions Usa, Inc. | System and method for local pulmonary structure classification for computer-aided nodule detection |
| US8923577B2 (en) * | 2006-09-28 | 2014-12-30 | General Electric Company | Method and system for identifying regions in an image |
-
2003
- 2003-09-08 GB GBGB0320973.1A patent/GB0320973D0/en not_active Ceased
-
2004
- 2004-09-07 US US10/935,045 patent/US7450780B2/en not_active Expired - Fee Related
- 2004-09-08 JP JP2004261609A patent/JP2005169077A/en active Pending
- 2004-09-08 EP EP04255447A patent/EP1513104A3/en not_active Withdrawn
Cited By (4)
| Publication number | Priority date | Publication date | Assignee | Title |
|---|---|---|---|---|
| JP2006136724A (en) * | 2004-11-10 | 2006-06-01 | Agfa Gevaert Nv | Method for implementing measurement on digital image |
| JP2006136718A (en) * | 2004-11-10 | 2006-06-01 | Agfa Gevaert Nv | Display device for displaying blended image |
| JP2011224388A (en) * | 2004-11-10 | 2011-11-10 | Agfa Healthcare Nv | Method of performing measurement on digital image |
| JP2013008364A (en) * | 2011-06-22 | 2013-01-10 | Boeing Co:The | Display of image |
Also Published As
| Publication number | Publication date |
|---|---|
| GB0320973D0 (en) | 2003-10-08 |
| US20050152617A1 (en) | 2005-07-14 |
| US7450780B2 (en) | 2008-11-11 |
| EP1513104A2 (en) | 2005-03-09 |
| EP1513104A3 (en) | 2006-06-14 |
Similar Documents
| Publication | Publication Date | Title |
|---|---|---|
| JP2005169077A (en) | Method for finding transformation relating data point of first data set to data point of second data set, and computer program for performing the method | |
| Xue et al. | CLASSIC: consistent longitudinal alignment and segmentation for serial image computing | |
| US8682054B2 (en) | Method and system for propagation of myocardial infarction from delayed enhanced cardiac imaging to cine magnetic resonance imaging using hybrid image registration | |
| Zhu et al. | Multicontext fuzzy clustering for separation of brain tissues in magnetic resonance images | |
| US7804986B2 (en) | System and method for detecting intervertebral disc alignment using vertebrae segmentation | |
| JP6564018B2 (en) | Radiation image lung segmentation technology and bone attenuation technology | |
| EP3397166B1 (en) | Method and system for segmentation of vascular structure in a volumetric image dataset | |
| US20060188139A1 (en) | Tree structure based 2D to 3D registration | |
| Wein et al. | Automatic bone detection and soft tissue aware ultrasound–CT registration for computer-aided orthopedic surgery | |
| US8897519B2 (en) | System and method for background phase correction for phase contrast flow images | |
| US20060110071A1 (en) | Method and system of entropy-based image registration | |
| JP5889265B2 (en) | Image processing method, apparatus, and program | |
| US10034610B2 (en) | System and method for registration of brain images | |
| US8229189B2 (en) | Visual enhancement of interval changes using temporal subtraction, convolving, and non-rigid transformation field mapping | |
| CN108701360B (en) | Image processing system and method | |
| US10438345B2 (en) | Improving symmetry in brain scans | |
| US7983464B2 (en) | System and method for corpus callosum segmentation in magnetic resonance images | |
| Shen et al. | 3D Gabor wavelets for evaluating SPM normalization algorithm | |
| Roy et al. | An accurate and robust skull stripping method for 3-D magnetic resonance brain images | |
| JP4708740B2 (en) | Image processing apparatus and image processing method | |
| US10413364B1 (en) | Internal organ localization of a subject for providing assistance during surgery | |
| US7298923B2 (en) | Method and system for focus-adaptive reconstruction of spine images | |
| JP7277131B2 (en) | Image processing device, image processing method, and program | |
| US11138736B2 (en) | Information processing apparatus and information processing method | |
| Noe et al. | Segmentation of cerebral mri scans using a partial volume model, shading correction, and an anatomical prior |