EP3024397B1 - Method for aligning spatially different subvolumes of ultrasonic data of a blood vessel - Google Patents
Method for aligning spatially different subvolumes of ultrasonic data of a blood vessel Download PDFInfo
- Publication number
- EP3024397B1 EP3024397B1 EP14771366.3A EP14771366A EP3024397B1 EP 3024397 B1 EP3024397 B1 EP 3024397B1 EP 14771366 A EP14771366 A EP 14771366A EP 3024397 B1 EP3024397 B1 EP 3024397B1
- Authority
- EP
- European Patent Office
- Prior art keywords
- doppler
- dimensional
- blood vessel
- array
- additional
- Prior art date
- Legal status (The legal status is an assumption and is not a legal conclusion. Google has not performed a legal analysis and makes no representation as to the accuracy of the status listed.)
- Active
Links
- 238000000034 method Methods 0.000 title claims description 27
- 210000004204 blood vessel Anatomy 0.000 title claims description 16
- 230000003595 spectral effect Effects 0.000 claims description 36
- 238000012545 processing Methods 0.000 claims description 7
- 230000017531 blood circulation Effects 0.000 claims description 6
- 238000009499 grossing Methods 0.000 claims description 3
- 239000000523 sample Substances 0.000 description 64
- 210000001715 carotid artery Anatomy 0.000 description 33
- 208000031481 Pathologic Constriction Diseases 0.000 description 25
- 208000037804 stenosis Diseases 0.000 description 25
- 230000036262 stenosis Effects 0.000 description 25
- 238000002604 ultrasonography Methods 0.000 description 18
- 238000001228 spectrum Methods 0.000 description 11
- 210000003484 anatomy Anatomy 0.000 description 9
- 210000001168 carotid artery common Anatomy 0.000 description 8
- 238000003384 imaging method Methods 0.000 description 7
- 210000001367 artery Anatomy 0.000 description 6
- 230000008569 process Effects 0.000 description 6
- 208000006011 Stroke Diseases 0.000 description 5
- 230000000875 corresponding effect Effects 0.000 description 5
- 230000034994 death Effects 0.000 description 4
- 231100000517 death Toxicity 0.000 description 4
- 230000033001 locomotion Effects 0.000 description 4
- 238000013507 mapping Methods 0.000 description 4
- 239000011159 matrix material Substances 0.000 description 4
- 230000002792 vascular Effects 0.000 description 4
- 208000006170 carotid stenosis Diseases 0.000 description 3
- 238000010586 diagram Methods 0.000 description 3
- 230000000541 pulsatile effect Effects 0.000 description 3
- 230000004044 response Effects 0.000 description 3
- 230000009897 systematic effect Effects 0.000 description 3
- 238000004458 analytical method Methods 0.000 description 2
- 230000005540 biological transmission Effects 0.000 description 2
- 210000004369 blood Anatomy 0.000 description 2
- 239000008280 blood Substances 0.000 description 2
- 210000000601 blood cell Anatomy 0.000 description 2
- 238000001514 detection method Methods 0.000 description 2
- 238000003745 diagnosis Methods 0.000 description 2
- 201000010099 disease Diseases 0.000 description 2
- 208000037265 diseases, disorders, signs and symptoms Diseases 0.000 description 2
- 230000000694 effects Effects 0.000 description 2
- 238000011835 investigation Methods 0.000 description 2
- 230000004807 localization Effects 0.000 description 2
- 239000000463 material Substances 0.000 description 2
- 238000005259 measurement Methods 0.000 description 2
- 238000012216 screening Methods 0.000 description 2
- 208000014882 Carotid artery disease Diseases 0.000 description 1
- 206010007687 Carotid artery stenosis Diseases 0.000 description 1
- 208000032382 Ischaemic stroke Diseases 0.000 description 1
- 230000004075 alteration Effects 0.000 description 1
- 238000013459 approach Methods 0.000 description 1
- 238000003491 array Methods 0.000 description 1
- 230000003143 atherosclerotic effect Effects 0.000 description 1
- 230000008901 benefit Effects 0.000 description 1
- 210000004556 brain Anatomy 0.000 description 1
- 208000037876 carotid Atherosclerosis Diseases 0.000 description 1
- 230000000739 chaotic effect Effects 0.000 description 1
- 238000012937 correction Methods 0.000 description 1
- 230000002596 correlated effect Effects 0.000 description 1
- 238000009556 duplex ultrasonography Methods 0.000 description 1
- 238000002592 echocardiography Methods 0.000 description 1
- 238000011156 evaluation Methods 0.000 description 1
- 230000005284 excitation Effects 0.000 description 1
- 238000000605 extraction Methods 0.000 description 1
- 230000002349 favourable effect Effects 0.000 description 1
- 238000010304 firing Methods 0.000 description 1
- 238000005206 flow analysis Methods 0.000 description 1
- 230000036541 health Effects 0.000 description 1
- 230000010354 integration Effects 0.000 description 1
- 238000004519 manufacturing process Methods 0.000 description 1
- 230000008520 organization Effects 0.000 description 1
- 230000000750 progressive effect Effects 0.000 description 1
- 238000009877 rendering Methods 0.000 description 1
- 230000000717 retained effect Effects 0.000 description 1
- 230000035945 sensitivity Effects 0.000 description 1
- 238000000926 separation method Methods 0.000 description 1
- 238000010183 spectrum analysis Methods 0.000 description 1
- 238000012549 training Methods 0.000 description 1
- 238000000827 velocimetry Methods 0.000 description 1
Images


Classifications
-
- A—HUMAN NECESSITIES
- A61—MEDICAL OR VETERINARY SCIENCE; HYGIENE
- A61B—DIAGNOSIS; SURGERY; IDENTIFICATION
- A61B8/00—Diagnosis using ultrasonic, sonic or infrasonic waves
- A61B8/06—Measuring blood flow
-
- A—HUMAN NECESSITIES
- A61—MEDICAL OR VETERINARY SCIENCE; HYGIENE
- A61B—DIAGNOSIS; SURGERY; IDENTIFICATION
- A61B8/00—Diagnosis using ultrasonic, sonic or infrasonic waves
- A61B8/08—Detecting organic movements or changes, e.g. tumours, cysts, swellings
- A61B8/0891—Detecting organic movements or changes, e.g. tumours, cysts, swellings for diagnosis of blood vessels
-
- A—HUMAN NECESSITIES
- A61—MEDICAL OR VETERINARY SCIENCE; HYGIENE
- A61B—DIAGNOSIS; SURGERY; IDENTIFICATION
- A61B8/00—Diagnosis using ultrasonic, sonic or infrasonic waves
- A61B8/46—Ultrasonic, sonic or infrasonic diagnostic devices with special arrangements for interfacing with the operator or the patient
- A61B8/461—Displaying means of special interest
- A61B8/466—Displaying means of special interest adapted to display 3D data
-
- A—HUMAN NECESSITIES
- A61—MEDICAL OR VETERINARY SCIENCE; HYGIENE
- A61B—DIAGNOSIS; SURGERY; IDENTIFICATION
- A61B8/00—Diagnosis using ultrasonic, sonic or infrasonic waves
- A61B8/48—Diagnostic techniques
- A61B8/483—Diagnostic techniques involving the acquisition of a 3D volume of data
-
- A—HUMAN NECESSITIES
- A61—MEDICAL OR VETERINARY SCIENCE; HYGIENE
- A61B—DIAGNOSIS; SURGERY; IDENTIFICATION
- A61B8/00—Diagnosis using ultrasonic, sonic or infrasonic waves
- A61B8/48—Diagnostic techniques
- A61B8/488—Diagnostic techniques involving Doppler signals
-
- G—PHYSICS
- G01—MEASURING; TESTING
- G01S—RADIO DIRECTION-FINDING; RADIO NAVIGATION; DETERMINING DISTANCE OR VELOCITY BY USE OF RADIO WAVES; LOCATING OR PRESENCE-DETECTING BY USE OF THE REFLECTION OR RERADIATION OF RADIO WAVES; ANALOGOUS ARRANGEMENTS USING OTHER WAVES
- G01S15/00—Systems using the reflection or reradiation of acoustic waves, e.g. sonar systems
- G01S15/88—Sonar systems specially adapted for specific applications
- G01S15/89—Sonar systems specially adapted for specific applications for mapping or imaging
- G01S15/8906—Short-range imaging systems; Acoustic microscope systems using pulse-echo techniques
- G01S15/8909—Short-range imaging systems; Acoustic microscope systems using pulse-echo techniques using a static transducer configuration
- G01S15/8915—Short-range imaging systems; Acoustic microscope systems using pulse-echo techniques using a static transducer configuration using a transducer array
- G01S15/8925—Short-range imaging systems; Acoustic microscope systems using pulse-echo techniques using a static transducer configuration using a transducer array the array being a two-dimensional transducer configuration, i.e. matrix or orthogonal linear arrays
-
- G—PHYSICS
- G01—MEASURING; TESTING
- G01S—RADIO DIRECTION-FINDING; RADIO NAVIGATION; DETERMINING DISTANCE OR VELOCITY BY USE OF RADIO WAVES; LOCATING OR PRESENCE-DETECTING BY USE OF THE REFLECTION OR RERADIATION OF RADIO WAVES; ANALOGOUS ARRANGEMENTS USING OTHER WAVES
- G01S15/00—Systems using the reflection or reradiation of acoustic waves, e.g. sonar systems
- G01S15/88—Sonar systems specially adapted for specific applications
- G01S15/89—Sonar systems specially adapted for specific applications for mapping or imaging
- G01S15/8906—Short-range imaging systems; Acoustic microscope systems using pulse-echo techniques
- G01S15/8979—Combined Doppler and pulse-echo imaging systems
-
- G—PHYSICS
- G01—MEASURING; TESTING
- G01S—RADIO DIRECTION-FINDING; RADIO NAVIGATION; DETERMINING DISTANCE OR VELOCITY BY USE OF RADIO WAVES; LOCATING OR PRESENCE-DETECTING BY USE OF THE REFLECTION OR RERADIATION OF RADIO WAVES; ANALOGOUS ARRANGEMENTS USING OTHER WAVES
- G01S15/00—Systems using the reflection or reradiation of acoustic waves, e.g. sonar systems
- G01S15/88—Sonar systems specially adapted for specific applications
- G01S15/89—Sonar systems specially adapted for specific applications for mapping or imaging
- G01S15/8906—Short-range imaging systems; Acoustic microscope systems using pulse-echo techniques
- G01S15/8993—Three dimensional imaging systems
-
- G—PHYSICS
- G01—MEASURING; TESTING
- G01S—RADIO DIRECTION-FINDING; RADIO NAVIGATION; DETERMINING DISTANCE OR VELOCITY BY USE OF RADIO WAVES; LOCATING OR PRESENCE-DETECTING BY USE OF THE REFLECTION OR RERADIATION OF RADIO WAVES; ANALOGOUS ARRANGEMENTS USING OTHER WAVES
- G01S7/00—Details of systems according to groups G01S13/00, G01S15/00, G01S17/00
- G01S7/52—Details of systems according to groups G01S13/00, G01S15/00, G01S17/00 of systems according to group G01S15/00
- G01S7/52017—Details of systems according to groups G01S13/00, G01S15/00, G01S17/00 of systems according to group G01S15/00 particularly adapted to short-range imaging
- G01S7/52053—Display arrangements
- G01S7/52057—Cathode ray tube displays
- G01S7/5206—Two-dimensional coordinated display of distance and direction; B-scan display
- G01S7/52065—Compound scan display, e.g. panoramic imaging
Definitions
- This invention relates to medical diagnostic ultrasound systems and, in particular, to a non-imaging Doppler probe system for automated screening of carotid stenosis.
- Stroke is the third leading cause of death worldwide. According to the World Health Organization, stroke accounted for more than 5.5 million deaths in 2002 with about 50% of those deaths occurring in China and India. Although the incidence is declining in developed countries, stroke nevertheless accounts for a mortality of 163,000 in the United States. A significant portion of these deaths are believed to be a result of disease in the carotid bifurcation.
- the carotid artery bifurcation where the common carotid artery (CCA) branches into the internal (ICA) and external (ECA) carotid arteries, is a common site of atherosclerotic disease. Stenosis or narrowing of the ICA, the branch which supplies blood to the brain, has long been known to be related to the incidence of ischemic stroke. The use of the severity of carotid stenosis has evolved as a surrogate measure of the risk of stroke.
- carotid atherosclerosis and mortality associated with stroke is an increasing problem in the developing world.
- a carotid artery screening device that can be used in low resource settings would address this growing problem by offering several features.
- WO 2013/088320 A1 discloses a closest prior art method, namely a method for generating a three dimensional blood vessel map comprising: acquiring temporally discrete signals of a blood vessel in a first subvolume with independently operated elements of a two dimensional array of ultrasonic transducer elements from spatially different depths of scanning opposed by each transducer element, said array being located in a first position with respect to the blood vessel during the acquiring; Doppler processing the temporally discrete signals received from each transducer element to produce spectral Doppler data of the scanning depth in the first subvolume opposed by each transducer element; producing a first three dimensional map of the spectral Doppler data in spatial relationship to the position of the array with respect to the blood vessel in the first subvolume.
- a diagnostic ultrasound system for carotid artery diagnosis includes a simple, non-imaging Doppler ultrasound probe.
- the probe has a two dimensional array of transducer elements with a low count of elements of relatively large size which can cover an area of the carotid artery at its bifurcation.
- the large sized elements are operated independently with no phasing, thereby reducing the cost of the Doppler system.
- the probe and system of the present invention can produce a representation of carotid blood flow in two or three dimensions and can assemble an extended view of the flow by matching segments of the carotid flow as the probe is moved over the vessel.
- An ultrasound system constructed in accordance with the principles of the present invention is shown in block diagram form.
- An ultrasound probe 10 contains a transducer array 12 of transducer elements which transmit ultrasound waves into the body and receive returning echo signals for Doppler processing. Control and timing of ultrasound transmission and reception is provided by a beamformer controller 16 which controls system beamformer 14.
- the beamformer 14 is not a conventional delay-and-sum beamformer as the transducer array is not operated in a phased manner. Instead, each element is separately actuated to transmit ultrasound waves directly into the body from its front surface and receive reflections from the waves individually.
- the beamformer controls the timing of successive transmit-receive intervals (the pulse repetition interval or PRI) by each transducer so that an ensemble of temporally spaced echoes is received by each transducer element at successive depths over a depth range of interest, which is the nominal depth at which the carotid artery is located.
- Each ensemble of echo samples can then be Doppler-processed to detect the flow condition in front of every transducer element.
- a quadrature bandpass filter 18 processes the echo signals into quadrature I and Q components. The separate components are used by a Doppler angle estimator 20 to estimate the phase or frequency shift of a Doppler signal at the depths in front of each transducer element where Doppler interrogation is to be performed.
- Doppler power may be estimated.
- the Doppler frequencies or intensities at depths in front of each transducer which are produced by the Doppler angle estimator 20 can be mapped directly to velocity values of flow or Doppler power at those depth locations.
- This Doppler data is coupled to a flow image processor 30 which spatially processes the data into a two or three dimensional image format, in which the velocity values are color- or intensity-coded.
- This spatial Doppler vessel map is processed by a display processor 36 and displayed on display 52 to illustrate the locations in the anatomy beneath the array transducer where flow is taking place and the velocity and direction of that flow by the color coding or Doppler power by intensity modulation.
- Doppler data is also coupled to a spectral Doppler processor 32 which produces a spectral analysis of the Doppler data for peak systolic velocity and turbulence analysis as described below.
- a Doppler angle processor 40 conditions the process for the angle of Doppler interrogation which is preferably set by inclining the direction of wave transmission by the transducer elements as described below.
- a graphics processor 34 is provided to overlay vessel map coordinates and other graphical data such as patient name on the displayed image.
- a volume renderer 24 performs volume rendering of three dimensional vessel map data for the production of three dimensional vessel maps as described below. The entire system is operated by user controls 50.
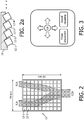
- FIGURE 2 illustrates a transducer array 12 for a probe 10 of the present invention.
- This embodiment is an array for a probe with a total of 80 elements, each measuring 3 mm by 3 mm arranged in a two dimensional matrix containing 10 rows by 8 columns. In such a configuration, the area of coverage is 30 mm by 24 mm.
- Transducer arrays with this small number of elements and elements of this relatively large individual size are easier to dice than fine-pitched array elements, making this array simple to fabricate with high yields and hence relatively inexpensive to make.
- the factors to consider in selecting the number of element include coverage, resolution, and a number which provides acceptable accuracy as compared to a standard ultrasound probe.
- Element sizes ranging from 3mm by 3mm to 6mm by 6mm have been found to be acceptable for unfocused elements used with nominal depths of the carotid artery.
- An array size of around 40mm has been found suitable for covering the branches of the carotid artery.
- the probe is intended to be placed against the neck of a patient over the carotid artery.
- the transducer will cover an appreciable area of the carotid artery with the common carotid artery (CCA) at one end and the internal (ICA) and external (ECA) branches at the other end.
- CCA common carotid artery
- ICA internal
- ECA external
- the elements in the probe are placed at an angle to provide a Doppler angle of 30-60 degrees.
- no Doppler signal can be obtained when the direction of blood flow is orthogonal to the direction of the ultrasound waves, and maximal signals are obtained when the wave are directed in line with the flow.
- the elements of the array 12 were aimed straight into the body, little or no Doppler signals would be realized from the carotid flow immediately beneath the array.
- the elements of the array 12 are angled at an angle of 30-60 degrees away from normal as illustrated in FIGURE 2a . A tilt of around 30 degrees has been found to yield acceptable results. Additional angulation can be provided by tilting the probe in relation to the skin surface during scanning.
- This drawing shows the end elements 12-1, 12-2, 12-3 and 12-4 of the first four rows of elements canted at the selected Doppler angle and retained in position by an overlying layer of transducer lens material layer 11 which is generally a polymeric rubber-like material such as RTV.
- the thickness of the RTV lens can be uniform across the array transducer, or can be tapered in thickness to provide some or all of the tilt for setting the nominal Doppler angle.
- the Doppler angle at which the elements are angled can be entered into the ultrasound system automatically from the probe's personality chip or manually from the user controls to condition the system to account for the proper angle correction to be used for the Doppler angle of the probe elements.
- the system may desirably also include a Doppler angle feedback indicator controlled by an algorithm that processes the strength of the Doppler return signals and detects unfavorable Doppler angles, which suggests that the user manually reposition the probe at a more favorable angle.
- the elements of the array transducer are excited with excitation pulses to work in the pulsed wave mode.
- the pulsed wave mode it is possible to provide depth resolution of the Doppler signals.
- an element size of 3 mm by 3 mm generally provides enough resolution to sample and obtain the velocity in a narrow region of the high speed jet produced in carotid arteries with stenosis.
- the elements of the non-phased transducer array 12 are fired simultaneously or independently in a customizable firing sequence under control by the beamformer 14.
- Operation of a probe and system of the present invention proceeds as follows.
- a sequence of elements (a small sub-section of the entire probe) is fired simultaneously.
- the sample volume for Doppler flow interrogation in front of each element is increased sequentially to cover a range of depths.
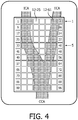
- 4 rows could be activated simultaneously, e.g., rows #1, #5, #8 and #12 as shown in this drawing.
- the Doppler spectrum is acquired continuously from each of the 8 elements in each of these rows.
- the flow image processor 30 computes a sum-plot (integration of Doppler power in a specified frequency band, e.g. 300 Hz to 1500 Hz).
- transducer element 12-25 is not over a portion of the carotid artery and will sense no flow (will produce a negligible power Doppler signal.)
- Transducer element 12-61 is directly above the carotid artery and will produce a significant power Doppler signal.
- the flow image processor 30 can then produce a grid-like map of the location and position of the carotid artery branches beneath the probe as indicated in FIGURES 4 and 5 .
- Each box in an 8 by 12 display grid is filled in with a brightness or color when a significant Doppler signal is detected by a corresponding transducer element, and is not illuminated when substantially no Doppler signal is detected.
- the third, fourth, seventh and eighth boxes in the first row of the grid are illuminated in response to the detection of flow in the ICA and ECA by those elements in that row which are over those carotid branches.
- a similar result is obtained from elements 34, 35, 38 and 39 in row 5.
- Boxes corresponding to elements 59-63 of row 8 are illuminated because they detected flow in the CCA below the carotid bifurcation, as is also the case for boxes corresponding to elements 92-94 in row 12.
- FIGURE 4 illustrates, this will present a simple two dimensional grid vessel map of the flow in the carotid artery beneath the array transducer.
- a similar result can also be obtained in the depth dimension as shown in FIGURE 5 .
- This shows the results from depth-gating the Doppler signal samples from six discrete depths below the elements in the top and bottom rows of the array 12.
- the transverse maps to the right of the array illustration shows faintly illuminated blocks at six depths where the second, third, seventh and eighth elements in the top row have detected flow in the ICA and the ECA.
- the lower map shows a wider, more illuminated set of depth blocks where the center three elements of the bottom row of elements have detected the stronger flow in the CCA which is beneath that row of elements.
- the values of these vertical depth block in each column can be combined in various ways to obtain a display value for a box in the longitudinal display shown to the left of the transverse maps, if desired.
- An object of an implementation of the present invention is to provide real-time feedback to the user such that the user is guided in placing the probe on the neck so that it covers the bifurcation of the carotid artery. Since this is a non-image based system, feedback can be given to the user through a set of indicators on the screen that guides the user to move the probe in the appropriate direction.
- the ideal placement of the probe is when the flow image detector detects a single vessel branch (CCA) at rows 8 & 12 of the grid display and two separate vessel branches (ICA and ECA) in rows 1 & 5 of the grid as shown in FIGURE 4 . The elements in these rows are continuous fired and the flow image processor computes the accumulated Doppler power of the signals received by each element in real time.
- the grid blocks which are illuminated in response to significant Doppler signal returns inform the system of the placement adjustment needed to obtain good probe placement. If the placement is good, the "OK" indicator is highlighted in the probe guidance display of FIGURE 3 . If not, appropriate one of the arrows in the guidance display are highlighted to guide the user in probe placement. An optimal positioning of the probe is achieved when the display grid showing the depth accumulated Doppler power ( FIGURE 4 ) indicates a separation of the vessel segments in the carotid bifurcation.
- the "Probe placement” and “Vessel Mapping" display buttons at the bottom of the guidance display tell the user the current mode of operation, either probe placement or vessel mapping.
- the user taps the Probe placement display button to return the system to that mode and the Probe placement button responds by illuminating. Since approximately 3 seconds worth of Doppler data is required for a single iteration, a guidance indication can be determined and updated in a time of 3 seconds. The maximum time to achieve acceptable placement of the probe over the carotid artery depends on the number of iterations required to successfully place the probe in the proper position for carotid artery stenosis detection.
- the next step is to obtain ultrasound Doppler data from all the elements in the probe array and map the vessels in accordance with the elements which detect flow.
- the accumulated Doppler power is computed as described above in conjunction with FIGURE 5 for the depths of interest to generate a 3D representation of the carotid vessels.
- the 3D representation is produced from the depth values detected by all of the elements and processed by the volume renderer 24 into a 3D display map. As shown in FIGURE 6 , a 3D display map 60 of the bifurcated vessel is displayed.
- Doppler data is acquired from all of the elements to extract the peak systolic velocity which can aid in classification of a stenosis. Additionally if desired a Doppler spectrum can be extracted at a suspected point of stenosis to further aid the diagnosis as described below.
- the probe 10 When the probe 10 has a small aperture, it may not be possible to acquire a sufficiently sized portion of the carotid, its branches and bifurcation in a single acquisition. In such a case multiple volume acquisition is employed to acquire segments of the carotid artery in sub-areas or sub-volumes by movement of the probe along the neck, then stitching the smaller segments together to form the desired vessel map.
- Manual movement of probe implies that there is no calibration, the overlap region may vary among two consecutive acquisitions, and there is also potential variation in the angle and quality of signal acquisition.
- data is acquired in multiple sub-volumes to cover the entire carotid anatomy.
- the carotid vascular anatomy must be reconstructed to verify if the entire carotid anatomy was scanned, and so the sub-volumes must be stitched together. This is done by "stitching" together successively acquired, spatially different but overlapping subvolumes by aligning their matching data in the overlapping region.
- the overlapping region of each subvolume is determined from a match of the time domain Doppler obtained from the individual transducer elements.
- one subvolume may have a column of voxels with flow velocity values of 0, 3, 5, 3, and 0 cm/sec.
- the subvolumes are aligned on the basis of this identity of sequential voxel values.
- Other Doppler spectral characteristic instead of or in addition to velocity can be used to make the match. This stitching is performed purely based on the signal characteristics because relative position of the probe with reference to the neck is not easy to obtain.
- Peak systolic velocity is a clinically accepted diagnostic indicator to grade stenosis according to the following consensus criteria: Degree of stenosis PSV (cm/s) Normal or ⁇ 50 % ⁇ 125 50% - 69% 125-230 >70% >230 Total occlusion No flow
- the probe 10 Since the probe 10 is non imaging, it is difficult for the user to understand how much of the artery cluster under investigation has been covered by a sweep of the probe. It is difficult to interpret from the reconstruction of any of the typical sampled sub-volumes, e.g ., (a) (b) or (c) of FIGURE 7 , whether the artery structure has been covered with anatomical cues from a single volume. Therefore, the data from multiple volumes is stitched together to completely reconstruct the vascular anatomy and provide an anatomical basis for artery identification. Anatomical cues from the generated vessel map of the sub-volumes are used as well as signal characteristics to complete the vascular anatomy reconstruction.
- the following steps may be employed in accordance with the present invention to reconstruct the full anatomy.
- the probe 10 is placed in a location L1 resulting in acquisition of sample volume VI.
- the probe is manually moved to location L2, adjacent to L1 such that the resulting new acquisition sample volume V2 is partially overlapped with VI.
- Each volume in this example is a three dimensional matrix containing returned ultrasound echo data.
- further sample volumes Vn are acquired in the same manner, such that the vessel structure of interest is fully covered. Since this is a non-imaging approach, it may not be feasible to know the completion of vessel map reconstruction until the end of the process.
- Vessel map identification is used to identify a vessel segment in a given volume.
- VM a list of unique vessel segments identified using the previous step.
- the number of vessel segments VM i is compared among the sample volumes. This helps to clearly identify the region of overlap in the sample volume where the number of regions is non uniform, such as the volume containing the bifurcation point of the carotid artery, using anatomical information from the reconstruction. It also gives an indication of where to search for matching signal data, e.g., the overlap between FIGURE 7(b) and FIGURE 7(c) can only be where there are two distinct vessels in FIGURE 7(b) .
- the data of all the good spectra from the top most row of each column of one sample volume is extracted in order, and correlated with the data of each of the rows of the subsequent (adjacent) volume.
- a spike in correlation at row k indicates that all the data from row k to the last row of the probe are in the overlapping region. Since the effects of noise are unpredictable on the signal, it may happen that one of the acquisitions of the overlapping volumes is more contaminated by noise than the other. In this case, the overlapping area is assigned to the volume where this area has more analyzable spectra. In the event that the number of such spectra is equal, the overlapping region can be assigned to either volume.
- RM ( i + k ) is R 1 i + k R 2 i + k R 3 i + k . . . R p i + k
- and R k is the row corresponding to index k. Since the direction of motion is assumed to be uniform and correlation is performed to find the start of the overlapping region we know that R k to R p is the overlapping region.
- Volume data from R k to R p is assigned to the corresponding volume. This yields the volumes to be stitched as S 1 , S 2 and S 3 .
- the volumes to be stitched are stacked in the direction of motion and connected by interpolation and/or smoothing.
- Blood flow in the carotid artery can be laminar or turbulent.
- Laminar flow is uniform, with all blood cells moving at relatively the same speed and in the same direction.
- Turbulent flow is characterized by random chaotic swirling, in which blood cells within the vessel are moving in many directions but typically have a net forward flow.
- Doppler spectra of laminar flow appear as broadening of the spectral line and filling of the spectral window.
- a turbulent flow pattern appears as spectral broadening with components below the baseline.
- Spectral broadening is a term applied to waveform alterations that are representative of turbulent flow. It is defined as the increased distribution of the frequencies present in a Doppler spectrum as illustrated by the Doppler flow spectrograms of FIGURE 8 .
- this type of turbulence is present at the bifurcation point (i.e., the carotid bulb, equivalent from the point of view of flow characteristics) and at a narrowing or stenosis of the vessel.
- the main way of distinguishing these two cases of turbulence is through the measurement of the peak systolic velocity (PSV).
- PSV peak systolic velocity
- the presence of stenosis is usually characterized by an elevated PSV accompanying turbulence.
- the criteria for dangerous levels of plaque are generally related to percentage of stenosis; also, the degree of stenosis is determined by the peak velocity of the blood as follows: Degree of stenosis PSV (cm/s) Turbulence (Spectral Broadening) Normal ⁇ 125 Normal & High at carotid bulb ⁇ 50% ⁇ 125 High 50% - 69% 125-230 High >70% >230 High Total occlusion No flow Nil Detecting the Doppler shift caused by increased velocity can determine whether there is dangerous plaque present.
- Distinguishing the characteristics of the bifurcation of the carotid artery from the characteristics of a stenosis can be done as follows: Condition/Feature PSV Turbulence (Spectral Broadening) Bifurcations (Carotid bulb) Normal High Stenosis High High This relationship shows that by estimating the turbulence in terms of spectral broadening and the PSV one can easily identify the segments of interest (like bifurcation and a stenosis jet) with the help of suitable thresholds for PSV and spectral broadening. The present invention uses this information to detect the segments of interest without any imaging of the carotid artery.
- the present invention provides an automated method to characterize the turbulence present in the carotid cluster with differentiated degrees of stenosis.
- Experimental results have shown this estimation of stenosis in a segment of interest, together with a combination of turbulence with peak systolic velocity, provide a robust technique for evaluating stenosis.
- Spectral Doppler ultrasound velocimetry involves the systematic analysis of the spectrum of frequencies that constitute the Doppler signal.
- the Doppler signal obtained for clinical use is composed of a range of frequencies with varying amplitude content. Therefore, systematic processing is required before the Doppler shift frequencies are computed.
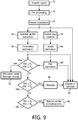
- the systematic process of FIGURE 9 estimates the two most important parameters to be estimated for stenosis evaluation, the PSV and turbulence.
- Doppler signals are acquired from the volumetric region of the carotid artery as described above and the Doppler signals is pre-processed (74) to remove unwanted noisy signal components.
- the vessel localization step 76 identifies whether the acquired Doppler signals contain vessel information (CCA, ICA, ECA or bifurcation point) or not. This is done with the help of a predefined power threshold for the Doppler power.
- the power in the time domain (the sum of the square of all the values divided by signal length) is computed for all of the sample volumes of the carotid artery. Then the average power is computed from all the sample volumes. Finally the sample volume that exhibits the highest power above the average value is considered as a segment having vessel information.
- the spectral profile extraction at step 82 involves two steps: (i) computing a spectrogram using the spectral Doppler processor 32 and (ii) processing the spectrogram (smoothing, thresholding, noise removal, etc .,) to obtain a good spectral profile.
- the spectrogram is obtained using a Fast Fourier Transform (FFT) based power spectrum with a 20 millisecond Hamming window using 256 data points and 50% overlap. After this a smooth and reproducible maximum frequency envelope is extracted from the generated spectrogram.
- FFT Fast Fourier Transform
- a smooth and reproducible maximum frequency envelope is extracted from the generated spectrogram.
- To obtain a high quality maximum frequency envelop a first order Infinite Impulse Response (IIR) filter is initially applied to the obtained spectrogram.
- IIR Infinite Impulse Response
- a 2D median filter is applied to the pulse waveform obtained from the IIR filter.
- the output of the median filter is used to extract the
- step 88 To estimate PSV in step 88, first a 3D vessel map is created in step 78 from the identified vessel information as described previously. From the vessel map the Doppler angle is estimated in step 86 by piecewise linear fit of the geometrical centroids of the carotid vessel structure obtained from the vessel map. The maximum Doppler shift frequency is also computed from the estimated spectral profile.
- the turbulence is characterized by the spectral broadening which is normally seen in the presence of high flow velocity at the branching of a vessel or in small-diameter vessels.
- Spectral broadening can be estimated by estimating the bandwidth of the spectrum, also referred to as the spectral width.
- Turbulence is characterized by estimating the spectral width and therefore extracting both an upper and a lower trace of the envelope of the spectrogram.
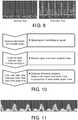
- the turbulence was estimated by using the area between the upper and lower spectral traces as a proportion of the area under the upper spectral trace as described by FIGURE 10 .
- FIGURE 11 illustrates the computation steps involved and an illustration of a traced Doppler spectrogram is shown in FIGURE 11 .
- the concluding determinations of the method of FIGURE 9 are to report the finding of the carotid bifurcation point (92), indication of stenosis (90), or a normal carotid (96) to the user. These determinations are made by comparing the turbulence estimate of spectral width SW from step 84 and the PSV estimate from step 88 to a turbulence threshold T s and a velocity threshold T p in comparison steps 98a, 98b, and 98c.
- a nominal velocity threshold T p is 125 cm/sec, and a nominal turbulence criteria is 0.5. The results of these comparisons are then presented to the user on the display screen.
- an implementation of the present invention provides a method for detecting and characterizing the segments of interest in a carotid artery without any imaging of the vessel.
- the inventive technique makes use of the non-imaging two dimensional array Doppler probe described above and the method of vessel localization previously described, together with Doppler angle estimation for detecting a stenosis and estimating its severity.
- Major elements of the invention include computing the turbulence at various points in the carotid structure and characterizing turbulence with differentiated degrees of stenosis; combining the estimates of turbulence and PSV to identify the segments of interest in a carotid artery; and combining the turbulence and PSV estimates to automatically characterize the stenosis of vessel segments in terms of the degree of stenosis.
Description
- This invention relates to medical diagnostic ultrasound systems and, in particular, to a non-imaging Doppler probe system for automated screening of carotid stenosis.
- Stroke is the third leading cause of death worldwide. According to the World Health Organization, stroke accounted for more than 5.5 million deaths in 2002 with about 50% of those deaths occurring in China and India. Although the incidence is declining in developed countries, stroke nevertheless accounts for a mortality of 163,000 in the United States. A significant portion of these deaths are believed to be a result of disease in the carotid bifurcation. The carotid artery bifurcation, where the common carotid artery (CCA) branches into the internal (ICA) and external (ECA) carotid arteries, is a common site of atherosclerotic disease. Stenosis or narrowing of the ICA, the branch which supplies blood to the brain, has long been known to be related to the incidence of ischemic stroke. The use of the severity of carotid stenosis has evolved as a surrogate measure of the risk of stroke.
- The incidence of carotid atherosclerosis and mortality associated with stroke is an increasing problem in the developing world. In these countries, a carotid artery screening device that can be used in low resource settings would address this growing problem by offering several features. First, there is often a lack of skilled personnel in these settings, and so the device should be able to be used with minimal training and instruction. Second, the device should be inexpensive so as to be affordable in these settings. Third, the device should be able to classify the degree of stenosis in the carotid arteries in a highly automated way without the use of high-end duplex ultrasound scanners that may not be available in the rural setting.
WO 2013/088320 A1 discloses a closest prior art method, namely a method for generating a three dimensional blood vessel map comprising: acquiring temporally discrete signals of a blood vessel in a first subvolume with independently operated elements of a two dimensional array of ultrasonic transducer elements from spatially different depths of scanning opposed by each transducer element, said array being located in a first position with respect to the blood vessel during the acquiring; Doppler processing the temporally discrete signals received from each transducer element to produce spectral Doppler data of the scanning depth in the first subvolume opposed by each transducer element; producing a first three dimensional map of the spectral Doppler data in spatial relationship to the position of the array with respect to the blood vessel in the first subvolume. In accordance with the principles of the present invention, a diagnostic ultrasound system for carotid artery diagnosis includes a simple, non-imaging Doppler ultrasound probe. The probe has a two dimensional array of transducer elements with a low count of elements of relatively large size which can cover an area of the carotid artery at its bifurcation. The large sized elements are operated independently with no phasing, thereby reducing the cost of the Doppler system. The probe and system of the present invention can produce a representation of carotid blood flow in two or three dimensions and can assemble an extended view of the flow by matching segments of the carotid flow as the probe is moved over the vessel. Once the carotid artery has been localized, the degree of stenosis is assessed by automated measurements of peak systolic velocity and blood flow turbulence. - In the drawings:
-
FIGURE 1 illustrates in block diagram form an ultrasound system constructed in accordance with the principles of the present invention. -
FIGURE 2 illustrates the size and dimensions of the elements of an array transducer of a probe of the present invention. -
FIGURE 2a illustrates the angling of the transducer elements of the array ofFIGURE 2 for good Doppler reception. -
FIGURE 3 illustrates a probe placement display of an ultrasound system of the present invention which guides an operator in proper probe placement over the carotid artery. -
FIGURE 4 illustrates the operation of a Doppler probe of the present invention in discrete rows of elements. -
FIGURE 5 illustrates a two dimensional vessel map produced by an ultrasound system of the present invention. -
FIGURE 6 illustrates a three dimensional vessel map produced by an ultrasound system of the present invention. -
FIGURE 7 illustrates the progressive assembly of a three dimensional vessel map produce by scanning with a probe and system of the present invention. -
FIGURE 8 illustrates spectral Doppler displays of flow conditions encountered in the carotid artery. -
FIGURE 9 is a flow chart of the automated assessment of turbulence and peak systolic velocity in a system of the present invention. -
FIGURE 10 is a diagram of the basic steps of flow analysis in accordance with the present invention. -
FIGURE 11 illustrates a Doppler spectrum with the upper and lower extremes of its envelope traced. - Referring first to
FIGURE 1 , an ultrasound system constructed in accordance with the principles of the present invention is shown in block diagram form. Anultrasound probe 10 contains atransducer array 12 of transducer elements which transmit ultrasound waves into the body and receive returning echo signals for Doppler processing. Control and timing of ultrasound transmission and reception is provided by abeamformer controller 16 which controlssystem beamformer 14. Thebeamformer 14 is not a conventional delay-and-sum beamformer as the transducer array is not operated in a phased manner. Instead, each element is separately actuated to transmit ultrasound waves directly into the body from its front surface and receive reflections from the waves individually. The beamformer controls the timing of successive transmit-receive intervals (the pulse repetition interval or PRI) by each transducer so that an ensemble of temporally spaced echoes is received by each transducer element at successive depths over a depth range of interest, which is the nominal depth at which the carotid artery is located. Each ensemble of echo samples can then be Doppler-processed to detect the flow condition in front of every transducer element. Aquadrature bandpass filter 18 processes the echo signals into quadrature I and Q components. The separate components are used by aDoppler angle estimator 20 to estimate the phase or frequency shift of a Doppler signal at the depths in front of each transducer element where Doppler interrogation is to be performed. Alternatively Doppler power may be estimated. The Doppler frequencies or intensities at depths in front of each transducer which are produced by theDoppler angle estimator 20 can be mapped directly to velocity values of flow or Doppler power at those depth locations.
This Doppler data is coupled to aflow image processor 30 which spatially processes the data into a two or three dimensional image format, in which the velocity values are color- or intensity-coded. This spatial Doppler vessel map is processed by adisplay processor 36 and displayed ondisplay 52 to illustrate the locations in the anatomy beneath the array transducer where flow is taking place and the velocity and direction of that flow by the color coding or Doppler power by intensity modulation. Doppler data is also coupled to a spectral Dopplerprocessor 32 which produces a spectral analysis of the Doppler data for peak systolic velocity and turbulence analysis as described below. ADoppler angle processor 40 conditions the process for the angle of Doppler interrogation which is preferably set by inclining the direction of wave transmission by the transducer elements as described below. Agraphics processor 34 is provided to overlay vessel map coordinates and other graphical data such as patient name on the displayed image. Avolume renderer 24 performs volume rendering of three dimensional vessel map data for the production of three dimensional vessel maps as described below. The entire system is operated byuser controls 50. -
FIGURE 2 illustrates atransducer array 12 for aprobe 10 of the present invention. This embodiment is an array for a probe with a total of 80 elements, each measuring 3 mm by 3 mm arranged in a two dimensional matrix containing 10 rows by 8 columns. In such a configuration, the area of coverage is 30 mm by 24 mm. Transducer arrays with this small number of elements and elements of this relatively large individual size are easier to dice than fine-pitched array elements, making this array simple to fabricate with high yields and hence relatively inexpensive to make. The factors to consider in selecting the number of element include coverage, resolution, and a number which provides acceptable accuracy as compared to a standard ultrasound probe. Element sizes ranging from 3mm by 3mm to 6mm by 6mm have been found to be acceptable for unfocused elements used with nominal depths of the carotid artery. An array size of around 40mm has been found suitable for covering the branches of the carotid artery. AsFIGURE 2 illustrates, the probe is intended to be placed against the neck of a patient over the carotid artery. When the probe aperture is longitudinally in line with the carotid artery and the bifurcation of the artery is within the field of view, the transducer will cover an appreciable area of the carotid artery with the common carotid artery (CCA) at one end and the internal (ICA) and external (ECA) branches at the other end. The elements in the probe are placed at an angle to provide a Doppler angle of 30-60 degrees. As is well known, no Doppler signal can be obtained when the direction of blood flow is orthogonal to the direction of the ultrasound waves, and maximal signals are obtained when the wave are directed in line with the flow. Thus, if the elements of thearray 12 were aimed straight into the body, little or no Doppler signals would be realized from the carotid flow immediately beneath the array. To account for this directional sensitivity the elements of thearray 12 are angled at an angle of 30-60 degrees away from normal as illustrated inFIGURE 2a . A tilt of around 30 degrees has been found to yield acceptable results. Additional angulation can be provided by tilting the probe in relation to the skin surface during scanning. This drawing shows the end elements 12-1, 12-2, 12-3 and 12-4 of the first four rows of elements canted at the selected Doppler angle and retained in position by an overlying layer of transducerlens material layer 11 which is generally a polymeric rubber-like material such as RTV. The thickness of the RTV lens can be uniform across the array transducer, or can be tapered in thickness to provide some or all of the tilt for setting the nominal Doppler angle. The Doppler angle at which the elements are angled can be entered into the ultrasound system automatically from the probe's personality chip or manually from the user controls to condition the system to account for the proper angle correction to be used for the Doppler angle of the probe elements. The system may desirably also include a Doppler angle feedback indicator controlled by an algorithm that processes the strength of the Doppler return signals and detects unfavorable Doppler angles, which suggests that the user manually reposition the probe at a more favorable angle. - The elements of the array transducer are excited with excitation pulses to work in the pulsed wave mode. In the pulsed wave mode, it is possible to provide depth resolution of the Doppler signals. For instance, an element size of 3 mm by 3 mm generally provides enough resolution to sample and obtain the velocity in a narrow region of the high speed jet produced in carotid arteries with stenosis. The elements of the
non-phased transducer array 12 are fired simultaneously or independently in a customizable firing sequence under control by thebeamformer 14. - Operation of a probe and system of the present invention proceeds as follows. A sequence of elements (a small sub-section of the entire probe) is fired simultaneously. The sample volume for Doppler flow interrogation in front of each element is increased sequentially to cover a range of depths. In the embodiment of
FIGURE 4 , in which the probe contains an array of 96 elements, 4 rows could be activated simultaneously, e.g.,rows # 1, #5, #8 and #12 as shown in this drawing. The Doppler spectrum is acquired continuously from each of the 8 elements in each of these rows. After at least 3 cycles of Doppler flow data are acquired, theflow image processor 30 computes a sum-plot (integration of Doppler power in a specified frequency band, e.g. 300 Hz to 1500 Hz). The magnitudes of the sum-plot values enable the elements that are directly above the vessel to be identified. For instance, transducer element 12-25 is not over a portion of the carotid artery and will sense no flow (will produce a negligible power Doppler signal.) Transducer element 12-61, on the other hand, is directly above the carotid artery and will produce a significant power Doppler signal. Theflow image processor 30 can then produce a grid-like map of the location and position of the carotid artery branches beneath the probe as indicated inFIGURES 4 and5 . Each box in an 8 by 12 display grid is filled in with a brightness or color when a significant Doppler signal is detected by a corresponding transducer element, and is not illuminated when substantially no Doppler signal is detected. InFIGURE 4 , for instance, the third, fourth, seventh and eighth boxes in the first row of the grid are illuminated in response to the detection of flow in the ICA and ECA by those elements in that row which are over those carotid branches. A similar result is obtained fromelements row 5. Boxes corresponding to elements 59-63 ofrow 8 are illuminated because they detected flow in the CCA below the carotid bifurcation, as is also the case for boxes corresponding to elements 92-94 inrow 12. AsFIGURE 4 illustrates, this will present a simple two dimensional grid vessel map of the flow in the carotid artery beneath the array transducer. A similar result can also be obtained in the depth dimension as shown inFIGURE 5 . This shows the results from depth-gating the Doppler signal samples from six discrete depths below the elements in the top and bottom rows of thearray 12. The transverse maps to the right of the array illustration shows faintly illuminated blocks at six depths where the second, third, seventh and eighth elements in the top row have detected flow in the ICA and the ECA. The lower map shows a wider, more illuminated set of depth blocks where the center three elements of the bottom row of elements have detected the stronger flow in the CCA which is beneath that row of elements. The values of these vertical depth block in each column can be combined in various ways to obtain a display value for a box in the longitudinal display shown to the left of the transverse maps, if desired. - An object of an implementation of the present invention is to provide real-time feedback to the user such that the user is guided in placing the probe on the neck so that it covers the bifurcation of the carotid artery. Since this is a non-image based system, feedback can be given to the user through a set of indicators on the screen that guides the user to move the probe in the appropriate direction. In this example, the ideal placement of the probe is when the flow image detector detects a single vessel branch (CCA) at
rows 8 & 12 of the grid display and two separate vessel branches (ICA and ECA) inrows 1 & 5 of the grid as shown inFIGURE 4 . The elements in these rows are continuous fired and the flow image processor computes the accumulated Doppler power of the signals received by each element in real time. The grid blocks which are illuminated in response to significant Doppler signal returns inform the system of the placement adjustment needed to obtain good probe placement. If the placement is good, the "OK" indicator is highlighted in the probe guidance display ofFIGURE 3 . If not, appropriate one of the arrows in the guidance display are highlighted to guide the user in probe placement. An optimal positioning of the probe is achieved when the display grid showing the depth accumulated Doppler power (FIGURE 4 ) indicates a separation of the vessel segments in the carotid bifurcation. The "Probe placement" and "Vessel Mapping" display buttons at the bottom of the guidance display tell the user the current mode of operation, either probe placement or vessel mapping. If the user is in the Vessel Mapping mode and wants to readjust the positioning of the probe over the carotid artery, the user taps the Probe placement display button to return the system to that mode and the Probe placement button responds by illuminating. Since approximately 3 seconds worth of Doppler data is required for a single iteration, a guidance indication can be determined and updated in a time of 3 seconds. The maximum time to achieve acceptable placement of the probe over the carotid artery depends on the number of iterations required to successfully place the probe in the proper position for carotid artery stenosis detection. - Once the probe is placed, the next step is to obtain ultrasound Doppler data from all the elements in the probe array and map the vessels in accordance with the elements which detect flow. The accumulated Doppler power is computed as described above in conjunction with
FIGURE 5 for the depths of interest to generate a 3D representation of the carotid vessels. The 3D representation is produced from the depth values detected by all of the elements and processed by thevolume renderer 24 into a 3D display map. As shown inFIGURE 6 , a3D display map 60 of the bifurcated vessel is displayed. - Following vessel mapping in either two (
FIGURE 4 ) or three (FIGURE 6 ) dimensions, Doppler data is acquired from all of the elements to extract the peak systolic velocity which can aid in classification of a stenosis. Additionally if desired a Doppler spectrum can be extracted at a suspected point of stenosis to further aid the diagnosis as described below. - When the
probe 10 has a small aperture, it may not be possible to acquire a sufficiently sized portion of the carotid, its branches and bifurcation in a single acquisition. In such a case multiple volume acquisition is employed to acquire segments of the carotid artery in sub-areas or sub-volumes by movement of the probe along the neck, then stitching the smaller segments together to form the desired vessel map. Manual movement of probe implies that there is no calibration, the overlap region may vary among two consecutive acquisitions, and there is also potential variation in the angle and quality of signal acquisition. Thus, instead of all the data being acquired in one volume, data is acquired in multiple sub-volumes to cover the entire carotid anatomy. From the multiple acquisitions, the carotid vascular anatomy must be reconstructed to verify if the entire carotid anatomy was scanned, and so the sub-volumes must be stitched together. This is done by "stitching" together successively acquired, spatially different but overlapping subvolumes by aligning their matching data in the overlapping region. The overlapping region of each subvolume is determined from a match of the time domain Doppler obtained from the individual transducer elements. As a simple example, one subvolume may have a column of voxels with flow velocity values of 0, 3, 5, 3, and 0 cm/sec. When a matching column of voxels in an overlapping subvolume is found with the same or similar Doppler values, the subvolumes are aligned on the basis of this identity of sequential voxel values. Other Doppler spectral characteristic instead of or in addition to velocity can be used to make the match. This stitching is performed purely based on the signal characteristics because relative position of the probe with reference to the neck is not easy to obtain. - Accurate vessel stitching is essential in order to reconstruct the vascular anatomy to estimate the angle of insonation across multiple volumes at one sweep of the probe. This enables the determination of peak systolic velocity across the anatomy. Peak systolic velocity is a clinically accepted diagnostic indicator to grade stenosis according to the following consensus criteria:
Degree of stenosis PSV (cm/s) Normal or <50 % <125 50% - 69% 125-230 >70% >230 Total occlusion No flow - Since the
probe 10 is non imaging, it is difficult for the user to understand how much of the artery cluster under investigation has been covered by a sweep of the probe. It is difficult to interpret from the reconstruction of any of the typical sampled sub-volumes, e.g., (a) (b) or (c) ofFIGURE 7 , whether the artery structure has been covered with anatomical cues from a single volume. Therefore, the data from multiple volumes is stitched together to completely reconstruct the vascular anatomy and provide an anatomical basis for artery identification. Anatomical cues from the generated vessel map of the sub-volumes are used as well as signal characteristics to complete the vascular anatomy reconstruction. When the Doppler signal is of sufficient signal to noise ratio to obtain a complete anatomical reconstruction in pulsatile flow, and the probe is moved uniformly over the artery structure under investigation, the following steps may be employed in accordance with the present invention to reconstruct the full anatomy. First, theprobe 10 is placed in a location L1 resulting in acquisition of sample volume VI. The probe is manually moved to location L2, adjacent to L1 such that the resulting new acquisition sample volume V2 is partially overlapped with VI. Each volume in this example is a three dimensional matrix containing returned ultrasound echo data. Next, further sample volumes Vn are acquired in the same manner, such that the vessel structure of interest is fully covered. Since this is a non-imaging approach, it may not be feasible to know the completion of vessel map reconstruction until the end of the process. - Next, for each volume Vi, signal in the volume is identified by highlighting the different segments in the 3D space of the vessel as shown in
FIGURE 7 . Vessel map identification is used to identify a vessel segment in a given volume. Let VM = a list of unique vessel segments identified using the previous step. The number of vessel segments VMi is compared among the sample volumes. This helps to clearly identify the region of overlap in the sample volume where the number of regions is non uniform, such as the volume containing the bifurcation point of the carotid artery, using anatomical information from the reconstruction. It also gives an indication of where to search for matching signal data, e.g., the overlap betweenFIGURE 7(b) and FIGURE 7(c) can only be where there are two distinct vessels inFIGURE 7(b) . - The data of all the good spectra from the top most row of each column of one sample volume is extracted in order, and correlated with the data of each of the rows of the subsequent (adjacent) volume. A spike in correlation at row k indicates that all the data from row k to the last row of the probe are in the overlapping region. Since the effects of noise are unpredictable on the signal, it may happen that one of the acquisitions of the overlapping volumes is more contaminated by noise than the other. In this case, the overlapping area is assigned to the volume where this area has more analyzable spectra. In the event that the number of such spectra is equal, the overlapping region can be assigned to either volume.
- Let there be p rows matching the anatomical cues (or number of regions in the slice). Let the signals of each transducer on these p rows at all depths showing pulsatile flow (signal from blood flow) be Tij . Let the pulsatile signal of the ith row of transducers be Ri :


- Blood flow in the carotid artery can be laminar or turbulent. Laminar flow is uniform, with all blood cells moving at relatively the same speed and in the same direction. Turbulent flow is characterized by random chaotic swirling, in which blood cells within the vessel are moving in many directions but typically have a net forward flow. Doppler spectra of laminar flow appear as broadening of the spectral line and filling of the spectral window. A turbulent flow pattern appears as spectral broadening with components below the baseline. Spectral broadening is a term applied to waveform alterations that are representative of turbulent flow. It is defined as the increased distribution of the frequencies present in a Doppler spectrum as illustrated by the Doppler flow spectrograms of
FIGURE 8 . In the carotid artery, this type of turbulence is present at the bifurcation point (i.e., the carotid bulb, equivalent from the point of view of flow characteristics) and at a narrowing or stenosis of the vessel. - The main way of distinguishing these two cases of turbulence is through the measurement of the peak systolic velocity (PSV). The presence of stenosis is usually characterized by an elevated PSV accompanying turbulence. The criteria for dangerous levels of plaque are generally related to percentage of stenosis; also, the degree of stenosis is determined by the peak velocity of the blood as follows:
Degree of stenosis PSV (cm/s) Turbulence (Spectral Broadening) Normal <125 Normal & High at carotid bulb <50% <125 High 50% - 69% 125-230 High >70% >230 High Total occlusion No flow Nil - Distinguishing the characteristics of the bifurcation of the carotid artery from the characteristics of a stenosis can be done as follows:
Condition/Feature PSV Turbulence (Spectral Broadening) Bifurcations (Carotid bulb) Normal High Stenosis High High - Spectral Doppler ultrasound velocimetry involves the systematic analysis of the spectrum of frequencies that constitute the Doppler signal. The Doppler signal obtained for clinical use is composed of a range of frequencies with varying amplitude content. Therefore, systematic processing is required before the Doppler shift frequencies are computed. The systematic process of
FIGURE 9 estimates the two most important parameters to be estimated for stenosis evaluation, the PSV and turbulence. - In
block 72 Doppler signals are acquired from the volumetric region of the carotid artery as described above and the Doppler signals is pre-processed (74) to remove unwanted noisy signal components. Thevessel localization step 76 identifies whether the acquired Doppler signals contain vessel information (CCA, ICA, ECA or bifurcation point) or not. This is done with the help of a predefined power threshold for the Doppler power. The power in the time domain (the sum of the square of all the values divided by signal length) is computed for all of the sample volumes of the carotid artery. Then the average power is computed from all the sample volumes. Finally the sample volume that exhibits the highest power above the average value is considered as a segment having vessel information. - The spectral profile extraction at
step 82 involves two steps: (i) computing a spectrogram using thespectral Doppler processor 32 and (ii) processing the spectrogram (smoothing, thresholding, noise removal, etc.,) to obtain a good spectral profile. The spectrogram is obtained using a Fast Fourier Transform (FFT) based power spectrum with a 20 millisecond Hamming window using 256 data points and 50% overlap. After this a smooth and reproducible maximum frequency envelope is extracted from the generated spectrogram. To obtain a high quality maximum frequency envelop a first order Infinite Impulse Response (IIR) filter is initially applied to the obtained spectrogram. Next, a 2D median filter is applied to the pulse waveform obtained from the IIR filter. The output of the median filter is used to extract the spectral frequency envelope. - To estimate PSV in
step 88, first a 3D vessel map is created instep 78 from the identified vessel information as described previously. From the vessel map the Doppler angle is estimated instep 86 by piecewise linear fit of the geometrical centroids of the carotid vessel structure obtained from the vessel map. The maximum Doppler shift frequency is also computed from the estimated spectral profile. - The peak systolic velocity is estimated in
step 88 from the Doppler angle and the maximum Doppler shift using the standard Doppler equation
- The turbulence is characterized by the spectral broadening which is normally seen in the presence of high flow velocity at the branching of a vessel or in small-diameter vessels. Spectral broadening can be estimated by estimating the bandwidth of the spectrum, also referred to as the spectral width. Turbulence is characterized by estimating the spectral width and therefore extracting both an upper and a lower trace of the envelope of the spectrogram. In an implementation of the present invention, the turbulence was estimated by using the area between the upper and lower spectral traces as a proportion of the area under the upper spectral trace as described by
FIGURE 10 . Thisdrawing 5 illustrates the computation steps involved and an illustration of a traced Doppler spectrogram is shown inFIGURE 11 . This criterion has the added advantage of placing the three arteries, the common, internal and external carotid, on an equal footing with respect to their peaks. It negates the effect of peak height on the estimate of spectral width. If only the width between the upper and lower envelope traces is used, this can lead to erroneous estimates owing to the external and common carotid having higher peaks than the internal carotid. Accordingly, turbulence is estimated by:
- The concluding determinations of the method of
FIGURE 9 are to report the finding of the carotid bifurcation point (92), indication of stenosis (90), or a normal carotid (96) to the user. These determinations are made by comparing the turbulence estimate of spectral width SW fromstep 84 and the PSV estimate fromstep 88 to a turbulence threshold Ts and a velocity threshold Tp incomparison steps - In summary, an implementation of the present invention provides a method for detecting and characterizing the segments of interest in a carotid artery without any imaging of the vessel. The inventive technique makes use of the non-imaging two dimensional array Doppler probe described above and the method of vessel localization previously described, together with Doppler angle estimation for detecting a stenosis and estimating its severity. Major elements of the invention include computing the turbulence at various points in the carotid structure and characterizing turbulence with differentiated degrees of stenosis; combining the estimates of turbulence and PSV to identify the segments of interest in a carotid artery; and combining the turbulence and PSV estimates to automatically characterize the stenosis of vessel segments in terms of the degree of stenosis.
Claims (12)
- A method for aligning spatially different subvolumes of ultrasonic data of a blood vessel comprising:acquiring temporally discrete signals of a blood vessel in a first subvolume with independently operated elements of a two dimensional array (12) of ultrasonic transducer elements from spatially different depths of scanning opposed by each transducer element, said array being located in a first position with respect to the blood vessel during the acquiring;Doppler processing the temporally discrete signals received from each transducer element to produce spectral Doppler data of the scanning depth in the first subvolume opposed by each transducer element;producing a first three dimensional map of the spectral Doppler data in spatial relationship to the position of the array with respect to the blood vessel in the first subvolume;acquiring temporally discrete signals of the blood vessel in a second subvolume with independently operated elements of the two dimensional array of ultrasonic transducer elements from spatially different depths of scanning opposed by each transducer element, said array being located in a second position with respect to the blood vessel during the acquiring, wherein the second subvolume has at least one partially overlapping region with the first subvolume;Doppler processing the temporally discrete signals received from each transducer element to produce spectral Doppler data of the scanning depth in the second subvolume opposed by each transducer element;producing a second three dimensional map of the spectral Doppler data in spatial relationship to the position of the array with respect to the blood vessel in the second subvolume;aligning the first three dimensional map with the second three dimensional map on the basis of one or more identified regions of matching spectral Doppler data of the two three dimensional maps corresponding to the partially overlapping regions; andproducing a combined three dimensional map of the blood flow of the vessel from the aligned first and second three dimensional maps.
- The method of Claim 1, further comprising:acquiring additional temporally discrete signals of the blood vessel in additional subvolumes with the two dimensional array when the array is located in additional positions with respect to the blood vessel wherein each additional subvolume has a partially overlapping region with at least one other subvolume;Doppler processing the additional temporally discrete signals to produce additional spectral Doppler data of scanning depth in the additional subvolumes opposed by each transducer element;producing additional three dimensional maps of the additional spectral Doppler data in spatial relationship to the additional positions of the array with respect to the blood vessel in the additional subvolumes;aligning each of the additional three dimensional maps with at least one other three dimensional map on the basis of the identified regions of matching spectral Doppler data of the two three dimensional maps corresponding to the partially overlapping regions; andproducing a combined three dimensional map from the first, second and additional three dimensional maps.
- The method of Claim 1, wherein the matching spectral Doppler data further comprises time domain Doppler data.
- The method of Claim 3, wherein the time domain Doppler data further comprises peak systolic velocity data.
- The method of Claim 1, wherein each three dimensional map comprises a plurality of voxels extending in the depth dimension in front of each transducer element.
- The method of Claim 5, wherein a plurality of voxels extending in the depth dimension further comprises a column of voxels, each having a Doppler flow value.
- The method of Claim 6, wherein aligning further comprises matching a column of voxels having Doppler flow values of one three dimensional map with a column of voxels having similar Doppler flow values of another three dimensional map.
- The method of Claim 6, wherein the Doppler flow values further comprise flow velocity values.
- The method of Claim 1, wherein aligning three dimensional maps further comprises correlating the data of one three dimensional map with the data of another three dimensional map on a spatial basis.
- The method of Claim 1, wherein acquiring further comprising acquiring temporally discrete signals of a blood vessel with elements of a two dimensional array configured to be operated in a non-phased manner.
- The method of Claim 1, wherein producing first and second three dimensional maps further comprises producing partially spatially overlapping first and second three dimensional maps.
- The method of Claim 1, further comprising interpolating or smoothing aligned first and second three dimensional maps.
Applications Claiming Priority (2)
| Application Number | Priority Date | Filing Date | Title |
|---|---|---|---|
| US201361857833P | 2013-07-24 | 2013-07-24 | |
| PCT/IB2014/063077 WO2015011599A1 (en) | 2013-07-24 | 2014-07-14 | Method for aligning spatially different subvolumes of ultrasonic data of a blood vessel |
Publications (2)
| Publication Number | Publication Date |
|---|---|
| EP3024397A1 EP3024397A1 (en) | 2016-06-01 |
| EP3024397B1 true EP3024397B1 (en) | 2017-12-20 |
Family
ID=51582431
Family Applications (1)
| Application Number | Title | Priority Date | Filing Date |
|---|---|---|---|
| EP14771366.3A Active EP3024397B1 (en) | 2013-07-24 | 2014-07-14 | Method for aligning spatially different subvolumes of ultrasonic data of a blood vessel |
Country Status (5)
| Country | Link |
|---|---|
| US (1) | US11382596B2 (en) |
| EP (1) | EP3024397B1 (en) |
| JP (1) | JP6297150B2 (en) |
| CN (1) | CN105407808B (en) |
| WO (1) | WO2015011599A1 (en) |
Families Citing this family (11)
| Publication number | Priority date | Publication date | Assignee | Title |
|---|---|---|---|---|
| JP2015154885A (en) * | 2014-02-21 | 2015-08-27 | セイコーエプソン株式会社 | blood pressure measuring device |
| EP2989986B1 (en) * | 2014-09-01 | 2019-12-18 | Samsung Medison Co., Ltd. | Ultrasound diagnosis apparatus and method of operating the same |
| US10575825B2 (en) | 2015-07-27 | 2020-03-03 | Siemens Medical Solutions Usa, Inc. | Doppler imaging |
| US10456113B2 (en) * | 2016-09-08 | 2019-10-29 | B-K Medical Aps | Wall-to-wall vessel segmentation in US imaging using a combination of VFI data and US imaging data |
| CN108627803B (en) * | 2017-03-17 | 2021-10-08 | 南京理工大学 | Spectrum pairing method and system based on beam forming |
| CN107979987B (en) * | 2017-05-27 | 2020-12-08 | 北京悦琦创通科技有限公司 | Spectrogram analysis method, device and equipment and computer-readable storage medium |
| KR102072524B1 (en) * | 2017-10-27 | 2020-02-03 | (주)코리센 | Apparatus for recognizing finger vein |
| CN108279417A (en) * | 2018-01-08 | 2018-07-13 | 上海应用技术大学 | The method of ultrasonic measurement thin-walled composite steel tube thickness |
| CN110584709B (en) * | 2019-08-14 | 2022-03-11 | 深圳市德力凯医疗设备股份有限公司 | Brain blood flow data acquisition method, storage medium and ultrasonic equipment |
| EP4119060A1 (en) * | 2021-07-15 | 2023-01-18 | Koninklijke Philips N.V. | Apparatuses, systems and methods for spectral pulse wave doppler ultrasound measurements |
| CN116965849A (en) * | 2022-04-24 | 2023-10-31 | 武汉联影医疗科技有限公司 | Signal processing method, signal processing device, computer equipment, storage medium and ultrasonic instrument |
Family Cites Families (29)
| Publication number | Priority date | Publication date | Assignee | Title |
|---|---|---|---|---|
| US4202215A (en) * | 1978-10-26 | 1980-05-13 | Kurt Orban Company, Inc. | Sonic pulse-echo method and apparatus for determining attenuation coefficients |
| US5474073A (en) * | 1994-11-22 | 1995-12-12 | Advanced Technology Laboratories, Inc. | Ultrasonic diagnostic scanning for three dimensional display |
| US7399279B2 (en) * | 1999-05-28 | 2008-07-15 | Physiosonics, Inc | Transmitter patterns for multi beam reception |
| US7534209B2 (en) * | 2000-05-26 | 2009-05-19 | Physiosonics, Inc. | Device and method for mapping and tracking blood flow and determining parameters of blood flow |
| EP1196090B1 (en) * | 1999-05-28 | 2009-10-28 | PhysioSonics, Inc. | Device and method for mapping and tracking blood flow and determining parameters of blood flow |
| US6682483B1 (en) | 1999-05-28 | 2004-01-27 | Vuesonix Sensors, Inc. | Device and method for mapping and tracking blood flow and determining parameters of blood flow |
| US6773402B2 (en) * | 2001-07-10 | 2004-08-10 | Biosense, Inc. | Location sensing with real-time ultrasound imaging |
| US7285094B2 (en) * | 2002-01-30 | 2007-10-23 | Nohara Timothy J | 3D ultrasonic imaging apparatus and method |
| AU2003278424A1 (en) | 2002-11-06 | 2004-06-07 | Koninklijke Philips Electronics N.V. | Phased array acoustic system for 3d imaging of moving parts_____ |
| CN1764849B (en) * | 2003-03-27 | 2010-05-26 | 皇家飞利浦电子股份有限公司 | Guidance of invasive medical devices by wide view three dimensional ultrasonic imaging |
| JP2008536578A (en) * | 2005-04-14 | 2008-09-11 | ヴェラゾニックス,インコーポレーテッド | Ultrasonic image processing system using pixel-oriented processing |
| CN101299968A (en) * | 2005-11-07 | 2008-11-05 | 西格诺斯蒂克斯有限公司 | Ultrasound measurement system and method |
| JP2009530009A (en) | 2006-03-21 | 2009-08-27 | コーニンクレッカ フィリップス エレクトロニクス エヌ ヴィ | Optimization of velocity scale for color tissue Doppler imaging |
| US20080183077A1 (en) * | 2006-10-19 | 2008-07-31 | Siemens Corporate Research, Inc. | High intensity focused ultrasound path determination |
| US20090024034A1 (en) * | 2006-10-19 | 2009-01-22 | Romain Moreau-Gobard | Relative position determination medical ultrasound scans |
| US7920731B2 (en) * | 2007-03-27 | 2011-04-05 | Siemens Medical Solutions Usa, Inc. | Bleeding detection using a blanket ultrasound device |
| JP2009131420A (en) * | 2007-11-29 | 2009-06-18 | Toshiba Corp | Ultrasonic image diagnosing device |
| WO2010097728A1 (en) * | 2009-02-24 | 2010-09-02 | Koninklijke Philips Electronics, N.V. | Ultrasonic vascular flow sensor with triangular sensor geometry |
| RU2012112934A (en) | 2009-09-04 | 2013-10-10 | Конинклейке Филипс Электроникс Н.В. | SHAPING AN ULTRASONIC ELASTOGRAPHIC STRETCH IMAGE IMAGE |
| US8326012B2 (en) * | 2009-10-07 | 2012-12-04 | Hologic, Inc. | Selective display of computer-aided detection findings with associated breast X-ray mammogram and/or tomosynthesis image information |
| US20110125022A1 (en) * | 2009-11-25 | 2011-05-26 | Siemens Medical Solutions Usa, Inc. | Synchronization for multi-directional ultrasound scanning |
| US9204858B2 (en) * | 2010-02-05 | 2015-12-08 | Ultrasonix Medical Corporation | Ultrasound pulse-wave doppler measurement of blood flow velocity and/or turbulence |
| RU2607510C2 (en) | 2010-12-22 | 2017-01-10 | Конинклейке Филипс Электроникс Н.В. | Automated measurement of doppler velocity using cheap converter |
| JP6099641B2 (en) * | 2011-06-30 | 2017-03-22 | コーニンクレッカ フィリップス エヌ ヴェKoninklijke Philips N.V. | Method and apparatus for automated ultrasonic Doppler angle and flow velocity evaluation |
| JP2015503253A (en) * | 2011-10-10 | 2015-01-29 | コーニンクレッカ フィリップス エヌ ヴェ | Depth map processing |
| IN2014CN04916A (en) * | 2011-12-16 | 2015-09-18 | Koninkl Philips Nv | |
| WO2013088320A1 (en) | 2011-12-16 | 2013-06-20 | Koninklijke Philips Electronics N.V. | Automatic blood vessel identification by name |
| US9392992B2 (en) * | 2012-02-28 | 2016-07-19 | Siemens Medical Solutions Usa, Inc. | High intensity focused ultrasound registration with imaging |
| US10945702B2 (en) * | 2013-07-24 | 2021-03-16 | Koninklijke Philips N.V. | Doppler ultrasound system for diagnosing carotid stenosis |
-
2014
- 2014-07-14 CN CN201480041677.8A patent/CN105407808B/en active Active
- 2014-07-14 US US14/906,611 patent/US11382596B2/en active Active
- 2014-07-14 WO PCT/IB2014/063077 patent/WO2015011599A1/en active Application Filing
- 2014-07-14 EP EP14771366.3A patent/EP3024397B1/en active Active
- 2014-07-14 JP JP2016528626A patent/JP6297150B2/en active Active
Also Published As
| Publication number | Publication date |
|---|---|
| JP6297150B2 (en) | 2018-03-20 |
| CN105407808A (en) | 2016-03-16 |
| WO2015011599A1 (en) | 2015-01-29 |
| CN105407808B (en) | 2018-12-04 |
| US11382596B2 (en) | 2022-07-12 |
| JP2016525406A (en) | 2016-08-25 |
| US20160151038A1 (en) | 2016-06-02 |
| EP3024397A1 (en) | 2016-06-01 |
Similar Documents
| Publication | Publication Date | Title |
|---|---|---|
| EP3024396B1 (en) | System with two dimensional array probe for automated screening of carotid stenosis | |
| EP3024395B1 (en) | Non-imaging two dimensional array probe and system for classifying carotid stenosis | |
| EP3024397B1 (en) | Method for aligning spatially different subvolumes of ultrasonic data of a blood vessel | |
| US9398898B2 (en) | Multiple beam spectral doppler in medical diagnostic ultrasound imaging | |
| US8672849B2 (en) | Method and apparatus for ultrasonic detection and imaging of hemodynamic information, particularly venous blood flow information | |
| US10338203B2 (en) | Classification preprocessing in medical ultrasound shear wave imaging | |
| JPH07250835A (en) | Ultrasonic wave pulse echo device and ultrasonic diagnostic device using said device | |
| CN102667522A (en) | Ultrasonic shear wave imaging with focused scanline beamforming | |
| US20130211253A1 (en) | On-axis Shear Wave Characterization with Ultrasound | |
| WO2014140657A1 (en) | Ultrasound vector flow imaging (vfi) with curve tracing | |
| US20060079783A1 (en) | Method and system for deriving a fetal heart rate without the use of an electrocardiogram in non-3D imaging applications | |
| US11364015B2 (en) | Ultrasonic shear wave imaging with background motion compensation | |
| US20090299179A1 (en) | Method For Detecting Cardiac Transplant Rejection | |
| US20230143880A1 (en) | Three dimensional color doppler for ultrasonic volume flow measurement | |
| CN112672696A (en) | System and method for tracking tools in ultrasound images | |
| EP3340887B1 (en) | Spectral doppler processing with adaptive sample window size |
Legal Events
| Date | Code | Title | Description |
|---|---|---|---|
| PUAI | Public reference made under article 153(3) epc to a published international application that has entered the european phase |
Free format text: ORIGINAL CODE: 0009012 |
|
| 17P | Request for examination filed |
Effective date: 20160224 |
|
| AK | Designated contracting states |
Kind code of ref document: A1 Designated state(s): AL AT BE BG CH CY CZ DE DK EE ES FI FR GB GR HR HU IE IS IT LI LT LU LV MC MK MT NL NO PL PT RO RS SE SI SK SM TR |
|
| AX | Request for extension of the european patent |
Extension state: BA ME |
|
| DAX | Request for extension of the european patent (deleted) | ||
| GRAP | Despatch of communication of intention to grant a patent |
Free format text: ORIGINAL CODE: EPIDOSNIGR1 |
|
| INTG | Intention to grant announced |
Effective date: 20170717 |
|
| GRAS | Grant fee paid |
Free format text: ORIGINAL CODE: EPIDOSNIGR3 |
|
| GRAA | (expected) grant |
Free format text: ORIGINAL CODE: 0009210 |
|
| AK | Designated contracting states |
Kind code of ref document: B1 Designated state(s): AL AT BE BG CH CY CZ DE DK EE ES FI FR GB GR HR HU IE IS IT LI LT LU LV MC MK MT NL NO PL PT RO RS SE SI SK SM TR |
|
| REG | Reference to a national code |
Ref country code: GB Ref legal event code: FG4D |
|
| REG | Reference to a national code |
Ref country code: CH Ref legal event code: EP |
|
| REG | Reference to a national code |
Ref country code: IE Ref legal event code: FG4D |
|
| REG | Reference to a national code |
Ref country code: AT Ref legal event code: REF Ref document number: 955623 Country of ref document: AT Kind code of ref document: T Effective date: 20180115 |
|
| REG | Reference to a national code |
Ref country code: DE Ref legal event code: R096 Ref document number: 602014018836 Country of ref document: DE |
|
| REG | Reference to a national code |
Ref country code: NL Ref legal event code: MP Effective date: 20171220 |
|
| PG25 | Lapsed in a contracting state [announced via postgrant information from national office to epo] |
Ref country code: NO Free format text: LAPSE BECAUSE OF FAILURE TO SUBMIT A TRANSLATION OF THE DESCRIPTION OR TO PAY THE FEE WITHIN THE PRESCRIBED TIME-LIMIT Effective date: 20180320 Ref country code: LT Free format text: LAPSE BECAUSE OF FAILURE TO SUBMIT A TRANSLATION OF THE DESCRIPTION OR TO PAY THE FEE WITHIN THE PRESCRIBED TIME-LIMIT Effective date: 20171220 Ref country code: SE Free format text: LAPSE BECAUSE OF FAILURE TO SUBMIT A TRANSLATION OF THE DESCRIPTION OR TO PAY THE FEE WITHIN THE PRESCRIBED TIME-LIMIT Effective date: 20171220 Ref country code: FI Free format text: LAPSE BECAUSE OF FAILURE TO SUBMIT A TRANSLATION OF THE DESCRIPTION OR TO PAY THE FEE WITHIN THE PRESCRIBED TIME-LIMIT Effective date: 20171220 |
|
| REG | Reference to a national code |
Ref country code: LT Ref legal event code: MG4D |
|
| REG | Reference to a national code |
Ref country code: AT Ref legal event code: MK05 Ref document number: 955623 Country of ref document: AT Kind code of ref document: T Effective date: 20171220 |
|
| PG25 | Lapsed in a contracting state [announced via postgrant information from national office to epo] |
Ref country code: GR Free format text: LAPSE BECAUSE OF FAILURE TO SUBMIT A TRANSLATION OF THE DESCRIPTION OR TO PAY THE FEE WITHIN THE PRESCRIBED TIME-LIMIT Effective date: 20180321 Ref country code: BG Free format text: LAPSE BECAUSE OF FAILURE TO SUBMIT A TRANSLATION OF THE DESCRIPTION OR TO PAY THE FEE WITHIN THE PRESCRIBED TIME-LIMIT Effective date: 20180320 Ref country code: LV Free format text: LAPSE BECAUSE OF FAILURE TO SUBMIT A TRANSLATION OF THE DESCRIPTION OR TO PAY THE FEE WITHIN THE PRESCRIBED TIME-LIMIT Effective date: 20171220 Ref country code: HR Free format text: LAPSE BECAUSE OF FAILURE TO SUBMIT A TRANSLATION OF THE DESCRIPTION OR TO PAY THE FEE WITHIN THE PRESCRIBED TIME-LIMIT Effective date: 20171220 Ref country code: RS Free format text: LAPSE BECAUSE OF FAILURE TO SUBMIT A TRANSLATION OF THE DESCRIPTION OR TO PAY THE FEE WITHIN THE PRESCRIBED TIME-LIMIT Effective date: 20171220 |
|
| PG25 | Lapsed in a contracting state [announced via postgrant information from national office to epo] |
Ref country code: NL Free format text: LAPSE BECAUSE OF FAILURE TO SUBMIT A TRANSLATION OF THE DESCRIPTION OR TO PAY THE FEE WITHIN THE PRESCRIBED TIME-LIMIT Effective date: 20171220 |
|
| REG | Reference to a national code |
Ref country code: FR Ref legal event code: PLFP Year of fee payment: 5 |
|
| PG25 | Lapsed in a contracting state [announced via postgrant information from national office to epo] |
Ref country code: EE Free format text: LAPSE BECAUSE OF FAILURE TO SUBMIT A TRANSLATION OF THE DESCRIPTION OR TO PAY THE FEE WITHIN THE PRESCRIBED TIME-LIMIT Effective date: 20171220 Ref country code: CZ Free format text: LAPSE BECAUSE OF FAILURE TO SUBMIT A TRANSLATION OF THE DESCRIPTION OR TO PAY THE FEE WITHIN THE PRESCRIBED TIME-LIMIT Effective date: 20171220 Ref country code: CY Free format text: LAPSE BECAUSE OF FAILURE TO SUBMIT A TRANSLATION OF THE DESCRIPTION OR TO PAY THE FEE WITHIN THE PRESCRIBED TIME-LIMIT Effective date: 20171220 Ref country code: ES Free format text: LAPSE BECAUSE OF FAILURE TO SUBMIT A TRANSLATION OF THE DESCRIPTION OR TO PAY THE FEE WITHIN THE PRESCRIBED TIME-LIMIT Effective date: 20171220 Ref country code: SK Free format text: LAPSE BECAUSE OF FAILURE TO SUBMIT A TRANSLATION OF THE DESCRIPTION OR TO PAY THE FEE WITHIN THE PRESCRIBED TIME-LIMIT Effective date: 20171220 |
|
| PG25 | Lapsed in a contracting state [announced via postgrant information from national office to epo] |
Ref country code: AT Free format text: LAPSE BECAUSE OF FAILURE TO SUBMIT A TRANSLATION OF THE DESCRIPTION OR TO PAY THE FEE WITHIN THE PRESCRIBED TIME-LIMIT Effective date: 20171220 Ref country code: SM Free format text: LAPSE BECAUSE OF FAILURE TO SUBMIT A TRANSLATION OF THE DESCRIPTION OR TO PAY THE FEE WITHIN THE PRESCRIBED TIME-LIMIT Effective date: 20171220 Ref country code: PL Free format text: LAPSE BECAUSE OF FAILURE TO SUBMIT A TRANSLATION OF THE DESCRIPTION OR TO PAY THE FEE WITHIN THE PRESCRIBED TIME-LIMIT Effective date: 20171220 Ref country code: IS Free format text: LAPSE BECAUSE OF FAILURE TO SUBMIT A TRANSLATION OF THE DESCRIPTION OR TO PAY THE FEE WITHIN THE PRESCRIBED TIME-LIMIT Effective date: 20180420 Ref country code: RO Free format text: LAPSE BECAUSE OF FAILURE TO SUBMIT A TRANSLATION OF THE DESCRIPTION OR TO PAY THE FEE WITHIN THE PRESCRIBED TIME-LIMIT Effective date: 20171220 |
|
| REG | Reference to a national code |
Ref country code: DE Ref legal event code: R097 Ref document number: 602014018836 Country of ref document: DE |
|
| PLBE | No opposition filed within time limit |
Free format text: ORIGINAL CODE: 0009261 |
|
| STAA | Information on the status of an ep patent application or granted ep patent |
Free format text: STATUS: NO OPPOSITION FILED WITHIN TIME LIMIT |
|
| PG25 | Lapsed in a contracting state [announced via postgrant information from national office to epo] |
Ref country code: DK Free format text: LAPSE BECAUSE OF FAILURE TO SUBMIT A TRANSLATION OF THE DESCRIPTION OR TO PAY THE FEE WITHIN THE PRESCRIBED TIME-LIMIT Effective date: 20171220 |
|
| 26N | No opposition filed |
Effective date: 20180921 |
|
| PG25 | Lapsed in a contracting state [announced via postgrant information from national office to epo] |
Ref country code: SI Free format text: LAPSE BECAUSE OF FAILURE TO SUBMIT A TRANSLATION OF THE DESCRIPTION OR TO PAY THE FEE WITHIN THE PRESCRIBED TIME-LIMIT Effective date: 20171220 |
|
| REG | Reference to a national code |
Ref country code: CH Ref legal event code: PL |
|
| PG25 | Lapsed in a contracting state [announced via postgrant information from national office to epo] |
Ref country code: LU Free format text: LAPSE BECAUSE OF NON-PAYMENT OF DUE FEES Effective date: 20180714 Ref country code: MC Free format text: LAPSE BECAUSE OF FAILURE TO SUBMIT A TRANSLATION OF THE DESCRIPTION OR TO PAY THE FEE WITHIN THE PRESCRIBED TIME-LIMIT Effective date: 20171220 |
|
| REG | Reference to a national code |
Ref country code: BE Ref legal event code: MM Effective date: 20180731 |
|
| REG | Reference to a national code |
Ref country code: IE Ref legal event code: MM4A |
|
| PG25 | Lapsed in a contracting state [announced via postgrant information from national office to epo] |
Ref country code: IE Free format text: LAPSE BECAUSE OF NON-PAYMENT OF DUE FEES Effective date: 20180714 Ref country code: LI Free format text: LAPSE BECAUSE OF NON-PAYMENT OF DUE FEES Effective date: 20180731 Ref country code: CH Free format text: LAPSE BECAUSE OF NON-PAYMENT OF DUE FEES Effective date: 20180731 |
|
| PG25 | Lapsed in a contracting state [announced via postgrant information from national office to epo] |
Ref country code: BE Free format text: LAPSE BECAUSE OF NON-PAYMENT OF DUE FEES Effective date: 20180731 |
|
| PG25 | Lapsed in a contracting state [announced via postgrant information from national office to epo] |
Ref country code: MT Free format text: LAPSE BECAUSE OF NON-PAYMENT OF DUE FEES Effective date: 20180714 |
|
| PG25 | Lapsed in a contracting state [announced via postgrant information from national office to epo] |
Ref country code: TR Free format text: LAPSE BECAUSE OF FAILURE TO SUBMIT A TRANSLATION OF THE DESCRIPTION OR TO PAY THE FEE WITHIN THE PRESCRIBED TIME-LIMIT Effective date: 20171220 |
|
| PG25 | Lapsed in a contracting state [announced via postgrant information from national office to epo] |
Ref country code: PT Free format text: LAPSE BECAUSE OF FAILURE TO SUBMIT A TRANSLATION OF THE DESCRIPTION OR TO PAY THE FEE WITHIN THE PRESCRIBED TIME-LIMIT Effective date: 20171220 |
|
| PG25 | Lapsed in a contracting state [announced via postgrant information from national office to epo] |
Ref country code: MK Free format text: LAPSE BECAUSE OF NON-PAYMENT OF DUE FEES Effective date: 20171220 Ref country code: HU Free format text: LAPSE BECAUSE OF FAILURE TO SUBMIT A TRANSLATION OF THE DESCRIPTION OR TO PAY THE FEE WITHIN THE PRESCRIBED TIME-LIMIT; INVALID AB INITIO Effective date: 20140714 |
|
| PG25 | Lapsed in a contracting state [announced via postgrant information from national office to epo] |
Ref country code: AL Free format text: LAPSE BECAUSE OF FAILURE TO SUBMIT A TRANSLATION OF THE DESCRIPTION OR TO PAY THE FEE WITHIN THE PRESCRIBED TIME-LIMIT Effective date: 20171220 |
|
| PGFP | Annual fee paid to national office [announced via postgrant information from national office to epo] |
Ref country code: IT Payment date: 20230721 Year of fee payment: 10 Ref country code: GB Payment date: 20230725 Year of fee payment: 10 |
|
| PGFP | Annual fee paid to national office [announced via postgrant information from national office to epo] |
Ref country code: FR Payment date: 20230725 Year of fee payment: 10 Ref country code: DE Payment date: 20230726 Year of fee payment: 10 |
|
| REG | Reference to a national code |
Ref country code: DE Ref legal event code: R084 Ref document number: 602014018836 Country of ref document: DE |