EP2968952B1 - Clinical response data mapping - Google Patents
Clinical response data mapping Download PDFInfo
- Publication number
- EP2968952B1 EP2968952B1 EP14719164.7A EP14719164A EP2968952B1 EP 2968952 B1 EP2968952 B1 EP 2968952B1 EP 14719164 A EP14719164 A EP 14719164A EP 2968952 B1 EP2968952 B1 EP 2968952B1
- Authority
- EP
- European Patent Office
- Prior art keywords
- graphical
- stimulation
- clinical
- example embodiment
- map
- Prior art date
- Legal status (The legal status is an assumption and is not a legal conclusion. Google has not performed a legal analysis and makes no representation as to the accuracy of the status listed.)
- Active
Links
- 230000004044 response Effects 0.000 title description 45
- 238000013506 data mapping Methods 0.000 title 1
- 230000000638 stimulation Effects 0.000 claims description 112
- 230000000694 effects Effects 0.000 claims description 65
- 238000000034 method Methods 0.000 claims description 57
- WABPQHHGFIMREM-UHFFFAOYSA-N lead(0) Chemical compound [Pb] WABPQHHGFIMREM-UHFFFAOYSA-N 0.000 claims description 46
- 230000001225 therapeutic effect Effects 0.000 claims description 36
- 230000007012 clinical effect Effects 0.000 claims description 32
- 230000002411 adverse Effects 0.000 description 26
- 238000002560 therapeutic procedure Methods 0.000 description 22
- 210000003484 anatomy Anatomy 0.000 description 10
- 210000001519 tissue Anatomy 0.000 description 10
- 230000004913 activation Effects 0.000 description 6
- 208000024891 symptom Diseases 0.000 description 6
- 210000004556 brain Anatomy 0.000 description 5
- 208000037265 diseases, disorders, signs and symptoms Diseases 0.000 description 5
- 239000000835 fiber Substances 0.000 description 5
- 238000012545 processing Methods 0.000 description 5
- 238000012552 review Methods 0.000 description 4
- 208000035475 disorder Diseases 0.000 description 3
- 238000004070 electrodeposition Methods 0.000 description 3
- 229920006395 saturated elastomer Polymers 0.000 description 3
- 238000010187 selection method Methods 0.000 description 3
- 208000014094 Dystonic disease Diseases 0.000 description 2
- 208000018737 Parkinson disease Diseases 0.000 description 2
- 206010044565 Tremor Diseases 0.000 description 2
- 210000003050 axon Anatomy 0.000 description 2
- 239000003086 colorant Substances 0.000 description 2
- 201000010099 disease Diseases 0.000 description 2
- 208000010118 dystonia Diseases 0.000 description 2
- 238000001914 filtration Methods 0.000 description 2
- 230000012447 hatching Effects 0.000 description 2
- 230000003993 interaction Effects 0.000 description 2
- 208000035824 paresthesia Diseases 0.000 description 2
- 210000000278 spinal cord Anatomy 0.000 description 2
- 230000000007 visual effect Effects 0.000 description 2
- 208000000884 Airway Obstruction Diseases 0.000 description 1
- 206010006100 Bradykinesia Diseases 0.000 description 1
- 206010008589 Choking Diseases 0.000 description 1
- 208000006083 Hypokinesia Diseases 0.000 description 1
- 208000002740 Muscle Rigidity Diseases 0.000 description 1
- 208000021384 Obsessive-Compulsive disease Diseases 0.000 description 1
- 208000030886 Traumatic Brain injury Diseases 0.000 description 1
- 230000009471 action Effects 0.000 description 1
- 210000004227 basal ganglia Anatomy 0.000 description 1
- 230000008901 benefit Effects 0.000 description 1
- 210000004027 cell Anatomy 0.000 description 1
- 238000004891 communication Methods 0.000 description 1
- 238000005094 computer simulation Methods 0.000 description 1
- 239000003814 drug Substances 0.000 description 1
- 229940079593 drug Drugs 0.000 description 1
- 230000005684 electric field Effects 0.000 description 1
- 206010015037 epilepsy Diseases 0.000 description 1
- 201000006517 essential tremor Diseases 0.000 description 1
- 239000007943 implant Substances 0.000 description 1
- 230000007246 mechanism Effects 0.000 description 1
- 238000002483 medication Methods 0.000 description 1
- 238000002620 method output Methods 0.000 description 1
- 238000012986 modification Methods 0.000 description 1
- 230000004048 modification Effects 0.000 description 1
- 230000001537 neural effect Effects 0.000 description 1
- 230000002093 peripheral effect Effects 0.000 description 1
- 230000008092 positive effect Effects 0.000 description 1
- 230000008569 process Effects 0.000 description 1
- 208000020016 psychiatric disease Diseases 0.000 description 1
- 230000003252 repetitive effect Effects 0.000 description 1
- 238000011125 single therapy Methods 0.000 description 1
- 210000003625 skull Anatomy 0.000 description 1
- 239000007787 solid Substances 0.000 description 1
- 230000004936 stimulating effect Effects 0.000 description 1
- 210000001103 thalamus Anatomy 0.000 description 1
- 230000009529 traumatic brain injury Effects 0.000 description 1
- 210000005166 vasculature Anatomy 0.000 description 1
Images


Classifications
-
- A—HUMAN NECESSITIES
- A61—MEDICAL OR VETERINARY SCIENCE; HYGIENE
- A61N—ELECTROTHERAPY; MAGNETOTHERAPY; RADIATION THERAPY; ULTRASOUND THERAPY
- A61N1/00—Electrotherapy; Circuits therefor
- A61N1/18—Applying electric currents by contact electrodes
- A61N1/32—Applying electric currents by contact electrodes alternating or intermittent currents
- A61N1/36—Applying electric currents by contact electrodes alternating or intermittent currents for stimulation
- A61N1/3605—Implantable neurostimulators for stimulating central or peripheral nerve system
- A61N1/36128—Control systems
- A61N1/36132—Control systems using patient feedback
-
- A—HUMAN NECESSITIES
- A61—MEDICAL OR VETERINARY SCIENCE; HYGIENE
- A61N—ELECTROTHERAPY; MAGNETOTHERAPY; RADIATION THERAPY; ULTRASOUND THERAPY
- A61N1/00—Electrotherapy; Circuits therefor
- A61N1/18—Applying electric currents by contact electrodes
- A61N1/32—Applying electric currents by contact electrodes alternating or intermittent currents
- A61N1/36—Applying electric currents by contact electrodes alternating or intermittent currents for stimulation
- A61N1/372—Arrangements in connection with the implantation of stimulators
- A61N1/37211—Means for communicating with stimulators
- A61N1/37235—Aspects of the external programmer
- A61N1/37241—Aspects of the external programmer providing test stimulations
-
- A—HUMAN NECESSITIES
- A61—MEDICAL OR VETERINARY SCIENCE; HYGIENE
- A61N—ELECTROTHERAPY; MAGNETOTHERAPY; RADIATION THERAPY; ULTRASOUND THERAPY
- A61N1/00—Electrotherapy; Circuits therefor
- A61N1/18—Applying electric currents by contact electrodes
- A61N1/32—Applying electric currents by contact electrodes alternating or intermittent currents
- A61N1/36—Applying electric currents by contact electrodes alternating or intermittent currents for stimulation
- A61N1/372—Arrangements in connection with the implantation of stimulators
- A61N1/37211—Means for communicating with stimulators
- A61N1/37235—Aspects of the external programmer
- A61N1/37247—User interfaces, e.g. input or presentation means
Definitions
- the present invention relates to a system and method for generating and outputting a clinical response data map in which recorded clinical response data are graphically represented in correlation with stimulation program settings for a leadwire, e.g., of a Deep Brain Stimulation (DBS) device, a Spinal Cord Stimulation (SCS) device, or other stimulation device.
- a leadwire e.g., of a Deep Brain Stimulation (DBS) device, a Spinal Cord Stimulation (SCS) device, or other stimulation device.
- DBS Deep Brain Stimulation
- SCS Spinal Cord Stimulation
- DBS deep brain stimulation
- SCS spinal cord stimulation
- Occipital NS therapy Trigemenal NS therapy
- Vagus NS therapy peripheral field stimulation therapy
- sacral root stimulation therapy or other such therapies.
- DBS can include stimulation of the thalamus or basal ganglia and may be used to treat disorders such as essential tremor, Parkinson's disease (PD), and other physiological disorders, including psychiatric disorders.
- PD Parkinson's disease
- DBS can also be useful for traumatic brain injury and stroke.
- DBS is also used for treating dystonia, epilepsy, and obsessive-compulsive disorder.
- a neurosurgeon can select a target region within the patient anatomy, e.g., within the brain for DBS, an entry point, e.g., on the patient's skull, and a desired trajectory between the entry point and the target region.
- the entry point and trajectory are typically carefully selected to avoid intersecting or otherwise damaging certain nearby critical structures or vasculature.
- a stimulation electrode leadwire used to provide the stimulation to the relevant anatomical region is inserted along the trajectory from the entry point toward the target region.
- the stimulation electrode leadwire typically includes multiple closely-spaced electrically independent stimulation electrode contacts.
- the target anatomical region can include tissue that exhibit high electrical conductivity.
- a stimulation parameter can include a current amplitude or voltage amplitude, which can be the same for all of the electrodes of the leadwire, or which can vary between different electrodes of the leadwire.
- the applied amplitude setting results in a corresponding current in the surrounding fibers, and therefore a corresponding voltage distribution in the surrounding tissue.
- the complexity of the inhomogeneous and anisotropic fibers makes it difficult to predict the particular volume of tissue influenced by the applied stimulation.
- a treating physician typically would like to tailor the stimulation parameters (such as which one or more of the stimulating electrode contacts to use, the stimulation pulse amplitude, e.g., current or voltage depending on the stimulator being used, the stimulation pulse width, and/or the stimulation frequency) for a particular patient to improve the effectiveness of the therapy.
- Parameter selections for the stimulation can be achieved via tedious and variable trial-and-error, without visual aids of the electrode location in the tissue medium or computational models of the volume of tissue influenced by the stimulation. Such a method of parameter selection is difficult and time-consuming and, therefore, expensive. Moreover, it may not necessarily result in the best possible therapy.
- US 2012/302912 A1 discloses techniques for graphical representation and analysis of clinical data. Vertical bars represent a therapeutic effect and a horizontal bar represents a side effect.
- the leadwire can include cylindrically symmetrical electrodes, which, when operational, produce approximately the same electric values in all positions at a similar distance from the electrode in any plane that cuts through the electrode.
- the leadwire can include directional electrodes that produce different electrical values depending on the direction from the electrode.
- the leadwire can include multiple separately controllable electrodes arranged cylindrically about the leadwire at each of a plurality of levels of the leadwire. Each electrode may be set as an anode or cathode in a bipolar configuration or as a cathode, with, for example, the stimulator casing being used as ground, in a monopolar arrangement.
- a leadwire for tissue stimulation e.g., DBS
- the clinical standard of care is often to perform a monopolar review (MPR) upon activation of the leadwire in order to determine the efficacy and side-effect thresholds for all electrodes on the leadwire, on an electrode-by-electrode basis.
- MPR monopolar review
- the MPR can inform the selection of a first clinical program (parameters for stimulation) for treating a patient.
- Example systems for programming a leadwire for tissue stimulation display a graphical representation of an area within which it is estimated that there is or could be tissue activation, referred to herein as a volume of activation (VOA), that results from input stimulation parameters.
- VOA volume of activation
- the VOA can be calculated as a region outside of which stimulation is estimated to be unlikely.
- the VOA can be displayed relative to an image or model of a portion of the patient's anatomy.
- VOA may be based on Neural Element Models such as a model of fibers, e.g., axons, and a voltage distribution about the leadwire and on detailed processing thereof. Performing such processing to provide a VOA preview in real-time response to a clinician's input of parameters is not practical because of the significant required processing time. Therefore, conventional systems pre-process various stimulation parameter settings to determine which axons are activated by the respective settings.
- Those systems also provide interfaces via which to input selections of the stimulation parameters and notes concerning therapeutic and/or side effects of stimulations associated with graphically represented VOAs.
- the systems also allow user input of, or automatically determine, a target stimulation region, e.g., within or encompassing one or more defined anatomic structures, or allow user input of, or automatically determine, a target defined anatomic structure, which target region or structure is targeted for stimulation.
- Example embodiments of the present invention provide a system and method for providing a therapy effect history map.
- Example embodiments of the present invention provide a system and method for inputting therapy effect information in relation to a therapy effect map.
- Example embodiments of the present invention provide a system and method for selecting therapy parameters using an interface that includes a map, which map includes a plurality of positions corresponding to respective therapy parameters which may be selected by the user. According to an example embodiment, the map is also a therapy effect map.
- the therapy effect history map is integrated with a system for parameter selection, which selected parameters are, according to an example embodiment, usable for programming an implanted leadwire, using the same interface and/or system in which the therapy effect history map is provided.
- the therapy effect history map is provided as a stand-alone program and/or system, separate from the application used for programming the leadwire.
- a system is configured to obtain information representing one or more effects of a stimulation therapy.
- the system is configured to receive information concerning therapeutic and/or adverse side effects of a stimulation therapy.
- the information is received in connection with particular stimulation parameters and the system stores the effects information in association with the stimulation parameters to which the information indicates the effects relate.
- the system generates, and outputs in a user interface, a map whose positions correspond to different respective stimulation parameter sets with respect to, for example, two (or more) predefined or user-selected parameters.
- the map is a two-dimensional map, of which a first axis corresponds to position along a leadwire, e.g., a particular actual or virtual electrode, and a second axis corresponds to stimulation amplitude.
- a virtual electrode is a leadwire position with which a stimulation is associated, as though the stimulation was produced by an electrode at that location, when, instead, the stimulation is actually produced by activation of a combination of a plurality of electrodes at other locations.
- the system outputs a, for example, two dimensional model of the leadwire as or alongside an edge of the map to represent or complements the values of the corresponding axis.
- the model includes representations of electrodes of the leadwire.
- the system generates a graphical marking including one or more variable visual characteristics, where the selected value(s) of the characteristic(s) indicates a respective aspect of the information associated with the map position which the graphical marking populates.
- a graphical marking including one or more variable visual characteristics, where the selected value(s) of the characteristic(s) indicates a respective aspect of the information associated with the map position which the graphical marking populates.
- a non-exhaustive list of example characteristics includes color, hatching, transparency, size, thickness, and shape.
- the system generates one or more revised values for the effects based on a combination of the effects information recorded in association with the parameters to which the map position corresponds.
- each of one or more of the records includes one or more respective scores, with the system calculating a score based on a combination, e.g., average, of the scores of the different records.
- the system calculates a new score, e.g., the average score of 2.5, and populates the map position corresponding the electrode and amplitude combination with a graphical marking representative of the calculated combinatory score.
- the system uses the latest recorded effects information for a particular stimulation parameter set to which a map position corresponds for populating the map position.
- the obtained records associated with the parameters corresponding to a single map location can correspond to a plurality of patients who have been subjected to a stimulation at that parameter set; a plurality of indications, symptoms, and/or diseases for which different stimulations have been conducted for one or more patients; and/or a plurality of stimulation sessions conducted at different times for one or more patients.
- the system provides a user interface component via which to receive user input of criteria by which to limit the scope of the stimulations whose information are used for populating the map.
- the user can limit the population to information corresponding to stimulations associated with particular patients, e.g., a current patient being treated or patients having certain characteristics (e.g., those of a certain height, weight, gender, taking certain medications, etc.), particular diseases, particular times, e.g., the last 5 months, and/or particular sessions, e.g., last 5 sessions.
- certain characteristics e.g., those of a certain height, weight, gender, taking certain medications, etc.
- particular diseases e.g., the last 5 months
- particular sessions e.g., last 5 sessions.
- a combination of filter parameters can be used.
- subsequent to an initial display of the graphical markings using no or few filter parameters the user can add filter parameters to gradually remove some of the markings. This can be useful because the user may want to see how various criteria impact stimulation score.
- the graphical marking includes a plurality of parts, each corresponding to a different aspect of the information associated with the stimulation settings to which the map position populated by the graphical marking corresponds.
- received information includes an adverse side effect score and a therapeutic effect score
- the graphical marking includes a first part representative of the side effect score and a second part representative of the therapeutic effect score.
- different scores may be obtained, and accordingly represented by respective parts of the graphical marking, for different adverse side effects, e.g., parasthesia, dyskenisia, etc., and different therapeutic effects, e.g., positive effects with respect to rigidity, tremor, etc.
- the system calculates and represents as a respective part of the marking an overall score based on a combination of both adverse side effect information and therapeutic effect information, the adverse side effect score adversely affecting the overall score and the therapeutic effect score positively affecting the overall score.
- the different parts of the graphical marking are concentrically arranged, one within the other, with different bands about the center dedicated for representing different types of information. That records corresponding to a particular map location include information regarding only one of the types to which the bands correspond can occur.
- the band(s) corresponding to the missing information is left devoid of any of the graphical characteristics used for representing the information. For example, a pure black and solid band can be used where there is no information to represent for the particular band.
- the concentrically arranged marking can be a circle, square, or any other shape.
- An example embodiment of the present invention is directed to one or more processors, which can be implemented using any conventional processing circuit and device or combination thereof, e.g., a Central Processing Unit (CPU) of a Personal Computer (PC) or other workstation processor, to execute code provided, e.g., on a hardware computer-readable medium including any conventional memory device, to perform any of the methods described herein, alone or in combination, and to generate any of the user interface displays described herein, alone or in combination.
- the one or more processors can be embodied in a server or user terminal or combination thereof.
- the user terminal can be embodied, for example, as a desktop, laptop, hand-held device, Personal Digital Assistant (PDA), television set-top Internet appliance, mobile telephone, smart phone, iPad etc., or as a combination of one or more thereof.
- PDA Personal Digital Assistant
- described features can be integrated with and be embodiment as a clinician programmer terminal, e.g., as referred to in the '330, '312, '340, '343, and '314 applications. Additionally, some of the described methods can be performed by a processor on one device or terminal and using a first memory, while other methods can be performed by a processor on another device and using, for example, a different memory.
- the features can be embodied in an application for a smartphone and/or iPad, for example.
- the memory device can include any conventional permanent and/or temporary memory circuits or combination thereof, a non-exhaustive list of which includes Random Access Memory (RAM), Read Only Memory (ROM), Compact Disks (CD), Digital Versatile Disk (DVD), and magnetic tape.
- RAM Random Access Memory
- ROM Read Only Memory
- CD Compact Disks
- DVD Digital Versatile Disk
- An example embodiment of the present invention is directed to one or more hardware computer-readable media, e.g., as described above, on which are stored instructions executable by a processor to perform the methods and/or provide the user interface features described herein.
- An example embodiment of the present invention is directed to a method, e.g., of a hardware component or machine, of transmitting instructions executable by a processor to perform the methods and/or provide the user interface features described herein.
- system features draw upon data, such as clinical effects data for producing the therapy effect history map, and/or produce such data, where such data is obtained from and/or stored to a data store.
- the data store can be located, for example, on a simulator device, a computer used for inputting such data, a patient remote control usable by the patient for adjusting stimulation parameters of an implanted stimulation leadwire, a central local database, or a cloud database.
- the data store stores data of a plurality of patients, the data of the plurality of patients being used for generating a single therapy effect history map.
- the system generates a therapy effect history map for a particular patient selectively using only the clinical history data of only the respective patient.
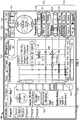
- FIG. 1 shows an example user interface screen 100 generated and output according to an example embodiment of the present invention.
- the screen 100 includes a clinical response map 102 including a first axis 104 corresponding to leadwire position or electrode number and a second axis 106 corresponding to stimulation amplitude. Positions in the map therefore correspond to respective stimulations, each associated with activation of a respective actual or virtual electrode at a particular stimulation amplitude.
- the system displays at respective ones of those positions respective graphical markings 108 (only one is labeled in FIG. 1 for purposes of clarity).
- the markings include a ring 108a about a center region 108b.
- the ring 108a represents an adverse side effect score and the center region 108b corresponds to a therapeutic effect score.
- the ring 108a and the center region 108b are graphically demarcated from each other, for example by use of different colors and/or hatching.
- the center region 108b is filled (where a respective score is available) using a blue color and the ring 108a is filled (wherein a respective score is available) using a yellow color.
- the appropriately colored ring 108a is displayed about an empty center region 108b, e.g., the center region 108b being black or whichever other background color is used for the map 102.
- the appropriately colored center region 108b is displayed without any ring 108a surrounding the center region 108b or with only a ring outline where the ring 108a would otherwise be displayed, the ring outline being black filled, or filled with whichever other background color is used for the map 102.
- the center regions 108b of different ones of the graphical markings 108 are differently saturated with the selected color, i.e., their transparencies differ, in correspondence with differences in their respective scores.
- the center regions 108b of the graphical markings 108 at those map positions associated with high therapeutic effect scores are highly saturated with the therapeutic effect color (with low transparency), and the center regions 108b of the graphical markings 108 at those map positions associated with low therapeutic effect scores are less saturated with the therapeutic effect color (with higher transparency).
- the degrees of saturation and transparency are many for representing many different scores.
- the rings 108a of different ones of the graphical markings 108 are of different thicknesses in correspondence with differences in their respective scores.
- the ring 108a of the graphical markings 108 at those map positions associated with high adverse side effect scores are thick, and the rings 108a of the graphical markings 108 at those map positions associated with low adverse effect scores thinner.
- the degrees of thickness are many for representing many different scores.
- the user interface screen 100 includes a user-selectable criteria selector control 110, which can be selected for input of filter criteria for filtering the records used for generating the map 102.
- FIG. 1 shows that all records are being used. (This may be limited to certain default filter criteria in any case.
- the system may be set to limit the used records to those associated to a patient currently being programmed.)
- the system responsive to selection of the control 110, the system provides input fields in which a user can input filter criteria, such as those described above, for limiting the records being used for the generation of the map.
- the displayed graphical markings 108 are selectable, in response to which selection, the system outputs, e.g., textual, details concerning the effects information represented by the displayed graphical marking 108.
- the interface screen 100 shown in FIG. 1 includes a details box 112 textually identifying details concerning the stimulation effects information of a selected one of the graphical markings 108.
- Such details can include the respective score(s) for therapeutic and/or adverse side effects and/or identifications of particular recorded therapeutic effects and/or side effects.
- a user can input specific therapeutic effects and/or adverse side effects produced by a stimulation using a particular set of stimulation parameters.
- the user can input data representing that a stimulation provides a therapeutic effect for one or more of rigidity, tremor, choking, bradykinesia, and/or other symptoms, and/or provides an adverse side effect such as, for example, one or more of parasthesia, dyskenisia, dystonia, etc.
- the user can input an overall therapeutic score and/or an overall adverse side effect score. (In an example embodiment, separate scores can be input for specific therapeutic and/or adverse side effects.)
- the details box 112 shows that the selected map position (i.e., the stimulation parameters to which the selected map position corresponds) is associated with a recorded adverse side effect of dyskenisia, with an overall therapeutic effect score of 2, and an overall adverse side effect of 3.
- the details box 112 further identifies some of the stimulation parameters for which the clinical response information has been received.
- the details box 112 includes information regarding a single stimulation session.
- the details box 112 in FIG. 1 shows clinical response information obtained for a stimulation session that was performed on October 30, 2012, with a stimulation at an amplitude of 4.5mA, frequency of 120Hz, and pulse width of 60 ⁇ s.
- the system further provides a session navigation control 115 for selecting different sessions, where, in response to a navigation instruction, input by a user using the navigation control 115 for navigating to a different session, the details box 112 is updated to reflect the information corresponding to the session to which the user has navigated.
- the details box 112 can include an "earlier" button and/or a "later” button, only the former being shown in FIG. 1 , for changing the stimulation session whose details are displayed to either an earlier or later session than the one that is currently displayed.
- the graphical marking 108 is generated based on the information of all of the sessions (meeting any predefined or user-selected filter criteria), but the details box 112 shows the information of only one of the sessions at a time.
- a criteria selector control 110 is selectable by which to limit the sessions on which basis the characteristics of the graphical marking 108 are determined.
- One such filter is a history filter, by which the user can select a particular one or more sessions on which basis to generate the graphical marking 108, and therefore, the characteristics of the graphical marking 108 can reflect the information of the single session whose details are provided in the details box 112, even where information of other sessions and corresponding clinical response records are stored.
- the system and method display the map 102 in a touch-screen display, and the selection of a displayed graphical marking 108 can be by touch of the graphical marking 108.
- an input device such as predetermined keys of a keyboard, a joystick, or navigation pad is usable for moving between different points of the map 102, to select different ones of the graphical markings 108.
- the system and method display a cursor 120 for highlighting the currently selected graphical marking 108.
- the system and method provide for user input of new session data, including clinical response information, by interaction with the map 102 for updating the map 102.
- the user can move the cursor 120 to location of the map 102, for example, a location not currently populated with a graphical marking 108, input stimulation parameter information for the session, such as frequency and pulse width, and further input therapeutic and/or side effects information, for example, by selecting one or more of the therapeutic effect buttons 125 and/or one or more of the adverse side effect buttons 130.
- the buttons 125 and 130 include overall intensity indicator buttons 126 and 131 by which to input, respectively, a general level of therapeutic and/or adverse side effect.
- the intensity indicator buttons 126 and 131 can be used to input scores on a per effect basis to indicate a degree of the respective indicated effects.
- the buttons 125 and 130 include specific effect type indicator buttons 127 and 132 by which to input, respectively, particular types of therapeutic and/or adverse side effects associated with a session.
- the clinical effect buttons 125 and 130 include respective "other" buttons 128 and 133 response to the selection of which the system and method display buttons corresponding to additional therapeutic effects and/or adverse side effects for which buttons are not displayed on the main screen.
- FIG. 3 shows an example effect indicator menu screen 300 which includes additional buttons corresponding to respective therapeutic effects which the system and method display in response to selection of the "other" button 128, according to an example embodiment of the present invention.
- the map 102 is navigable between positions thereof.
- the system highlights the one or more of the buttons 125 and 130 that were previously selected to indicate clinical effect, in accordance with which selection(s) the graphical marking 108 was generated.
- the buttons that are highlighted are those selected for one of the sessions, e.g., whichever session is represented by the details box 112.
- information for a new session associated with electrode and amplitude settings corresponding to a position of the map 102 that is already populated with a graphical marking 108 can be input, based on which new input information, the graphical marking 108 can be updated.
- the system and method display a button by which a user can indicate that new session information is to be input.
- the system and method is configured to obtain other user input for entering a mode by which the user enters new session information.
- a user can choose whether to update information of a stimulation session for which clinical effect information had previously been recorded or to input information for an entirely new session.
- the details box 112 includes a button for updating a session whose details are displayed in the details box 112 and/or includes a button for input of new session information.
- the details box 112 includes a "delete" button for removing a clinical response record.
- a "delete" button for removing a clinical response record. For example, if the graphical marking 108 at a position is based on a single clinical response record that is being deleted, the graphical marking 108 is also responsively removed. If the graphical marking 108 is based on a number of stimulation response records, then the graphical marking 108 is updated to reflect removal of the effect thereon by the clinical response record being removed.
- a plurality of graphical markings 108 can overlap where clinical response information is recorded for settings that only slightly differ with respect to electrode location and/or amplitude setting.
- FIG. 1 shows a displayed user-interactive navigation pad 150 that includes a first section (shown in FIG. 1 to be represented by an up arrow) to shift the cursor 120 to a map position corresponding to a higher electrode position of the leadwire than to which the current map position of the cursor 120 corresponds; a second section (shown in FIG. 1 to be represented by a down arrow) to shift the cursor 120 to a map position corresponding to a lower electrode position of the leadwire than to which the current map position of the cursor 120 corresponds; a third section (shown in FIG.
- the pad 150 is a tool that provides the user with more control to fine tune the cursor position. According to an example embodiment, and as shown in FIG. 1 , the system and method display in the navigation pad 150 a textual indication of the amplitude setting to which the current cursor location corresponds.
- the system and method provide, e.g., display, a step size control 151 by which the user can toggle between different step sizes, e.g., .1 and .5, by which each selection of the regions of the navigation pad 150 corresponding to amplitude effects the selected amplitude for repositioning of the cursor 120.
- a step size control 151 by which the user can toggle between different step sizes, e.g., .1 and .5, by which each selection of the regions of the navigation pad 150 corresponding to amplitude effects the selected amplitude for repositioning of the cursor 120.
- each selection of the '+' sign of the pad 150 is interpreted as an instruction to move the cursor 120 to a position of the map that corresponds to an amplitude setting that is .1 higher than that to which the current cursor position corresponds
- each selection of the '+' sign of the pad 150 is interpreted as an instruction to move the cursor 120 to a position of the map that corresponds to an amplitude setting that is .5 higher than that to which the current cursor position corresponds.
- selection of the '-' sign is interpreted as an instruction to move the cursor 120 to a position of the map that corresponds to an amplitude setting that is .1 or .5 (depending on the step size setting) lower than that to which the current cursor position corresponds.
- the cursor 120 can be dragged via a touch-screen.
- the user can touch any point in the map 102, responsive to which the system shifts the cursor 120 to the touched position of the map 102.
- the system and method output, e.g., display, toggle buttons 152 and 153 by which to toggle between different common settings for other stimulation parameters, such as frequency and pulse width. While such other parameters do not affect map position of the cursor 120 (in an embodiment in which the map 102 is two dimensional with one axis corresponding to electrode location and the other axis corresponding to amplitude), nevertheless the indicated values for such other parameters are, according to an example embodiment, indicated in the details box 112. Moreover, according to an example embodiment of the present invention, the selected values for such other parameters are used as filter criteria to filter the data on whose basis the clinical response map 102 is generated.
- the system For example, if the user selects a pulse width of 60 ⁇ s and a frequency of 125Hz, the system generates the graphical markings 108 based on only that data which corresponds to stimulations performed at those settings. According to an alternative example embodiment, the system does not use the parameters as filter criteria. According to an alternative example embodiment, the system is configured to obtain user input selecting whether to apply one or more of the settings as filter criteria for filtering the data on whose basis to generate the graphical markings 108. The selected parameter settings can similarly be used to filter the data used for generating other described aspects of the user interface, e.g., the records traversable using the session navigation control 115.
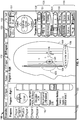
- the system and method display the clinical response map 102 overlapping an anatomical region representation 400 that graphically represents an anatomical region in which the leadwire is implanted.
- the anatomical region representation 400 is a silhouette of a head.
- Such an overlapping display can visually indicate how the electrodes location along the leadwire corresponds to the implant location.
- the system and method display a circle 405, centered on the electrode location to which the map position at which the cursor 120 is positioned corresponds and the outer perimeter of which passes through the map position at which the cursor 120 is positioned to provide the user with an indication of a relative magnitude of stimulation reach for the amplitude to which the cursor position corresponds.
- the value spacing is selected so that the size of the circle 405 corresponding to amplitude value approximately indicates an actual expected reach of produced electric field or tissue activation.
- the map 102 is usable for setting leadwire parameters to program an implanted pulse generator (IPG), for causing the leadwire to stimulate an anatomical region of a patient.
- IPG implanted pulse generator
- a user can navigate to a position in the map 102, which position corresponds to a particular electrode (actual or virtual) and amplitude setting, and can select a control interpreted by the system as an instruction to program the IPG accordingly. If frequency and pulse width values need to be changed, controls, for example as described above, can be used to modify the values of those parameters before input of the instruction to program the IPG.
- FIG. 1 shows the clinical response map 102 displayed in a same display screen as, and alongside, program panel 180 displaying information of a selected stimulation program.
- the program information is responsively updated in the program panel 180.
- the program panel 180 includes a stimulation application toggle button 182 to toggle between turning the program on and off.
- the system responsively programs the IPG with the stimulation parameters to which the selected position of the map 102 corresponds.
- the system includes one control for toggling between turning a stimulation program on and off and another control for selecting whether to apply settings to which the map position corresponds to the program.
- the IPG can be causing the leadwire to stimulate a tissue region according to the stimulation program which has been turned on. While the stimulation is ongoing, the user can use the map 102 to select new settings, and then select a button interpreted as an instruction to apply the new settings to the program currently being implemented.
- the system and method provide a program mode and a clinical response entry and viewing mode.
- the program mode When in the program mode, the user's selection of a position within the map 102 is automatically interpreted as an instruction to program the IPG according to the parameters to which the selected map position corresponds, but, when in the clinical response entry and viewing mode, the selection of a position in the map 102 provides for viewing and/or inputting clinical response information as described above.
- the system and method display the graphical markings 108, and, in an example embodiment, show the details box 112 and highlight previously selected ones of the buttons 125 and/or 130 where such information is available for the selected position of the map 102.
- a map position is selectable in more than one way. If a first selection method is used, the details box 112 is displayed and if a second selection method is used, the program is set with the corresponding parameters. For example, cursor movement by drag or selection of a cursor movement input control can be used for changing program settings, and touch of a position can be used for viewing and/or updating clinical response information. Alternatively, the different selection methods can be left-click and right-click.
- More than one leadwire may be implanted in a patient. Additionally, a clinician may set up a number of programs to be implemented, for example, in a defined repetitive sequence, or at different predefined times or periods. Therefore, according to an example embodiment of the present invention, and as an example is shown in FIG. 1 , the system and method display a program selection panel 190 in which a plurality of defined programs are listed, where the program listings are selectable. In an example embodiment in which two leadwires are implanted, in response to selection of a program listing, the system and method responsively expands the program listing to display selectable listings of the left and right implanted leadwires. The program panel 180 is populated with information for the selected leadwire of the selected program.
- the map 102 can be used for selecting parameter values with which to set the right leadwire for program 1, and can be used for likewise selecting parameter values with which to set the left leadwire for program 1, and/or the right and/or left leadwires for other programs.
- the system and method display, for example in the program panel 180, baseline metrics concerning symptoms targeted to be treated by the stimulations.
- changes to such symptoms can be recorded over time in association with stimulation sessions, and the details box 112 shows the symptoms information recorded in association with the session whose details are displayed in the details box 112, to provide for easy comparison to the baseline symptoms.
- the system and method besides for the individual graphical markings 108 displayed at respective positions of the map 102, each marking representing clinical response data input for one or more sessions associated with stimulation using the electrode to which the map position corresponds at the amplitude level to which the map position corresponds, the system and method also displays a in the map 102 an umbrella graphical marking that spans many of the positions of the map 102, where a characteristic, e.g., color or color intensity, of the umbrella graphical marking gradually changes between positions of the map 102 based on the different clinical response data associated with different positions within the map 102.
- the system and method interpolates the clinical response data associated with different positions of the map 102 to obtain interpolated data for those positions not associated with clinical response data, thereby filling in the voids.
- the system and method display the umbrella graphical marking simultaneously with the graphical markings 108, and graphically demarcate the graphical markings 108 from the umbrella graphical marking.
- the graphical markings are outlined, e.g., with a black line, so that they stand out.
- the umbrella graphical marking is displayed using lighter shades of color than those used for the graphical markings 108, so that if, for example, a position of the map 102 is not associated with input clinical response data, but is assigned an interpolated clinical response value, the shade of color used at that position is softer than that used for a graphical marking 108 representing the same clinical response value.
- the system and method displays a first umbrella graphical marking representing the therapeutic effect data and a second umbrella graphical marking representing the adverse side effect data. Since they may be difficult to distinguish when they overlap each other, according to an example embodiment, the system and method provide a control by which the user can select which of the umbrella graphical markings to display, so that the user can thereby choose to display only one of them at a time.
- the system and method calculate an overall score based on both the therapeutic effect and adverse side effect information associated with the respective position, further calculate interpolated scores for the positions not associated with clinical response data, and output a single umbrella graphical marking based on the interpolated combinatory scores, which single umbrella marking gradually changes between positions according to the different scores, as described above.
- the system and method first generate interpolated scores separately for adverse side effects and therapeutic effects, and then calculate overall scores based on the interpolated scores to generate the single umbrella graphical marking.
- the system is configured to generate a report including information of previously implemented stimulation sessions according to user input filter criteria, where, for each particular row, all information used for generating the data of the respective row corresponds to use of the same electrode number (actual or virtual) and amplitude setting.
- the system is configured to generate, for each row for whose electrode number and amplitude value clinical response data is available, a respective graphical marking 108 as described above, and display the generated graphical marking 108 in a cell of the respective row.
- the system generates the report with a column in which graphical markings 108 are displayed for those rows corresponding to an electrode and amplitude value for which clinical response data is available.
- FIG. 5 is an example report generated according to an example embodiment of the present invention.
- Column 1 500 includes graphical markings 108 for all of the populated rows except the second to last row which corresponds to an electrode and amplitude value for which no clinical responds data has been recorded.
- Stimulation parameters can be set by a clinician logging into a programming platform under a clinician profile, and can be set by a patient logging into the programming platform under a patient profile.
- a clinician may want to limit the amount of control the patient has over the stimulation settings.
- the clinician may determine that certain minimum and/or maximum amplitude levels must be met.
- the system is configured to receive input from a clinician of amplitude limits which the patient cannot violate.
- the system is configured to visually indicate such a limit(s) in the map 102.
- the system displays a line representing a maximum amplitude level and/or a line representing a minimum amplitude level extending perpendicular to the amplitude axis, and at respective positions along the amplitude axis, the respective positions corresponding to the respective maximum and/or minim amplitude values input by the clinician (or, in an example embodiment, default values if not altered or removed by the clinician).
- a line displayed at a first amplitude position and a second line displayed a second higher amplitude position would be recognized as corresponding to minimum and maximum values.
- the lines additionally otherwise graphically or textually indicate whether the line corresponds to a maximum or minimum.
- the line graphically or textually identifies whether the line represents a maximum or minimum limit. For example, text can be printed along the line to textually identify the line, or predefined colors and/or line forms (dashed, dotted, etc.) can be used.
- FIG. 6 shows an example system according to an example embodiment of the present invention.
- a system 600 includes a clinician and/or patient programmer terminal 605 that includes a telemetry module 606 and a user interface generation module 607.
- the telemetry module 606 is in communication with an implanted pulse generator (IPG) 610.
- IPG implanted pulse generator
- the user interface generation module 607 includes software executable by a processor for generating graphical user interface displays, as described above, for example, including code for generating the various described graphical markings and soft controls and for recording and displaying clinical effects information.
- interaction with one or more graphical user interface displays and/or a hardware input device is usable for input of one or more stimulation parameter settings in accordance with which the telemetry module 606 outputs instructions to the IPG 610, the IPG 610 accordingly controlling a leadwire 620 to activate one or more electrodes 621a-621g to produce electric pulses at specified amplitudes.
- the leadwire 620 is implanted in a patient, e.g., in the patient's brain, and the electric pulses are intended to activate anatomic fibers to produce a therapeutic effect, e.g., as described in further detail in the '330, '312, '340, '343, and '314 applications.
- the electrodes 621a-621g can include one or more directional electrodes which can be controlled to direct stimulation in a particular radial direction from the central longitudinal axis of the leadwire 620 and/or can include one or more cylindrical electrodes that produce essentially the same stimulation in all directions rotationally about the cylindrically symmetrical stimulation about the central longitudinal axis of the leadwire 620.
- the user interface displays provide for navigation of a clinical effects map to select the parameters for the instructions provided to the IPG 610.
Landscapes
- Health & Medical Sciences (AREA)
- Engineering & Computer Science (AREA)
- Radiology & Medical Imaging (AREA)
- Biomedical Technology (AREA)
- Nuclear Medicine, Radiotherapy & Molecular Imaging (AREA)
- Life Sciences & Earth Sciences (AREA)
- Animal Behavior & Ethology (AREA)
- General Health & Medical Sciences (AREA)
- Public Health (AREA)
- Veterinary Medicine (AREA)
- Neurosurgery (AREA)
- Neurology (AREA)
- Human Computer Interaction (AREA)
- User Interface Of Digital Computer (AREA)
- Electrotherapy Devices (AREA)
Description
- The present invention relates to a system and method for generating and outputting a clinical response data map in which recorded clinical response data are graphically represented in correlation with stimulation program settings for a leadwire, e.g., of a Deep Brain Stimulation (DBS) device, a Spinal Cord Stimulation (SCS) device, or other stimulation device. Features of the present invention can aid the selection of electrical stimulation parameters for performing anatomic stimulation using the leadwire.
- Stimulation of anatomical regions of a patient is a clinical technique for the treatment of disorders. Such stimulation can include deep brain stimulation (DBS), spinal cord stimulation (SCS), Occipital NS therapy, Trigemenal NS therapy, Vagus NS therapy, peripheral field stimulation therapy, sacral root stimulation therapy, or other such therapies. For example, DBS can include stimulation of the thalamus or basal ganglia and may be used to treat disorders such as essential tremor, Parkinson's disease (PD), and other physiological disorders, including psychiatric disorders. DBS can also be useful for traumatic brain injury and stroke. DBS is also used for treating dystonia, epilepsy, and obsessive-compulsive disorder.
- However, understanding of the therapeutic mechanisms of action remains elusive. The stimulation parameters, electrode geometries, or electrode locations that are best suited for existing or future uses of DBS also are unclear.
- For conducting a therapeutic stimulation, a neurosurgeon can select a target region within the patient anatomy, e.g., within the brain for DBS, an entry point, e.g., on the patient's skull, and a desired trajectory between the entry point and the target region. The entry point and trajectory are typically carefully selected to avoid intersecting or otherwise damaging certain nearby critical structures or vasculature. A stimulation electrode leadwire used to provide the stimulation to the relevant anatomical region is inserted along the trajectory from the entry point toward the target region. The stimulation electrode leadwire typically includes multiple closely-spaced electrically independent stimulation electrode contacts.
- The target anatomical region can include tissue that exhibit high electrical conductivity. For a given stimulation parameter setting, a respective subset of the fibers are responsively activated. A stimulation parameter can include a current amplitude or voltage amplitude, which can be the same for all of the electrodes of the leadwire, or which can vary between different electrodes of the leadwire. The applied amplitude setting results in a corresponding current in the surrounding fibers, and therefore a corresponding voltage distribution in the surrounding tissue. The complexity of the inhomogeneous and anisotropic fibers makes it difficult to predict the particular volume of tissue influenced by the applied stimulation.
- A treating physician typically would like to tailor the stimulation parameters (such as which one or more of the stimulating electrode contacts to use, the stimulation pulse amplitude, e.g., current or voltage depending on the stimulator being used, the stimulation pulse width, and/or the stimulation frequency) for a particular patient to improve the effectiveness of the therapy. Parameter selections for the stimulation can be achieved via tedious and variable trial-and-error, without visual aids of the electrode location in the tissue medium or computational models of the volume of tissue influenced by the stimulation. Such a method of parameter selection is difficult and time-consuming and, therefore, expensive. Moreover, it may not necessarily result in the best possible therapy.
- Systems have been proposed that provide an interface that facilitates parameter selections. See, for example,
U.S. Pat. App. Ser. No. 12/454,330, filed May 15, 2009 U.S. Pat. App. Ser. No. 12/454,312, filed May 15, 2009 U.S. Pat. App. Ser. No. 12/454,340, filed May 15, 2009 U.S. Pat. App. Ser. No. 12/454,343, filed May 15, 2009 U.S. Pat. App. Ser. No. 12/454,314, filed May 15, 2009 -
US 2012/302912 A1 discloses techniques for graphical representation and analysis of clinical data. Vertical bars represent a therapeutic effect and a horizontal bar represents a side effect. - The leadwire can include cylindrically symmetrical electrodes, which, when operational, produce approximately the same electric values in all positions at a similar distance from the electrode in any plane that cuts through the electrode. Alternatively, the leadwire can include directional electrodes that produce different electrical values depending on the direction from the electrode. For example, the leadwire can include multiple separately controllable electrodes arranged cylindrically about the leadwire at each of a plurality of levels of the leadwire. Each electrode may be set as an anode or cathode in a bipolar configuration or as a cathode, with, for example, the stimulator casing being used as ground, in a monopolar arrangement.
- When programming a leadwire for tissue stimulation, e.g., DBS, the clinical standard of care is often to perform a monopolar review (MPR) upon activation of the leadwire in order to determine the efficacy and side-effect thresholds for all electrodes on the leadwire, on an electrode-by-electrode basis. Monopolar review, rather than bipolar review, is performed because monopolar stimulation often requires a lower stimulation intensity than bipolar stimulation to achieve the same clinical benefit. The MPR can inform the selection of a first clinical program (parameters for stimulation) for treating a patient.
- Example systems for programming a leadwire for tissue stimulation display a graphical representation of an area within which it is estimated that there is or could be tissue activation, referred to herein as a volume of activation (VOA), that results from input stimulation parameters. For example, the VOA can be calculated as a region outside of which stimulation is estimated to be unlikely. The VOA can be displayed relative to an image or model of a portion of the patient's anatomy.
- Generation of the VOA may be based on Neural Element Models such as a model of fibers, e.g., axons, and a voltage distribution about the leadwire and on detailed processing thereof. Performing such processing to provide a VOA preview in real-time response to a clinician's input of parameters is not practical because of the significant required processing time. Therefore, conventional systems pre-process various stimulation parameter settings to determine which axons are activated by the respective settings.
- Those systems also provide interfaces via which to input selections of the stimulation parameters and notes concerning therapeutic and/or side effects of stimulations associated with graphically represented VOAs. The systems also allow user input of, or automatically determine, a target stimulation region, e.g., within or encompassing one or more defined anatomic structures, or allow user input of, or automatically determine, a target defined anatomic structure, which target region or structure is targeted for stimulation.
- Example embodiments of the present invention provide a system and method for providing a therapy effect history map. Example embodiments of the present invention provide a system and method for inputting therapy effect information in relation to a therapy effect map. Example embodiments of the present invention provide a system and method for selecting therapy parameters using an interface that includes a map, which map includes a plurality of positions corresponding to respective therapy parameters which may be selected by the user. According to an example embodiment, the map is also a therapy effect map.
- Thus, according to an example embodiment, the therapy effect history map is integrated with a system for parameter selection, which selected parameters are, according to an example embodiment, usable for programming an implanted leadwire, using the same interface and/or system in which the therapy effect history map is provided. According to an alternative example embodiment, the therapy effect history map is provided as a stand-alone program and/or system, separate from the application used for programming the leadwire.
- According to an example embodiment of the present invention, a system is configured to obtain information representing one or more effects of a stimulation therapy. According to an example embodiment, the system is configured to receive information concerning therapeutic and/or adverse side effects of a stimulation therapy. In an example embodiment, the information is received in connection with particular stimulation parameters and the system stores the effects information in association with the stimulation parameters to which the information indicates the effects relate.
- In an example embodiment of the present invention, the system generates, and outputs in a user interface, a map whose positions correspond to different respective stimulation parameter sets with respect to, for example, two (or more) predefined or user-selected parameters. For example, according to an example embodiment, the map is a two-dimensional map, of which a first axis corresponds to position along a leadwire, e.g., a particular actual or virtual electrode, and a second axis corresponds to stimulation amplitude. (In an example embodiment, a virtual electrode is a leadwire position with which a stimulation is associated, as though the stimulation was produced by an electrode at that location, when, instead, the stimulation is actually produced by activation of a combination of a plurality of electrodes at other locations.)
- According to the example embodiment in which one of the axis of the map corresponds to electrode position, the system outputs a, for example, two dimensional model of the leadwire as or alongside an edge of the map to represent or complements the values of the corresponding axis. In an example embodiment, the model includes representations of electrodes of the leadwire.
- According to an example embodiment, populates the map with the received therapy effects information, different items of the information, associated with different combinations of the parameters to which the map positions correspond, being used for populating the different positions of the map.
- According to an example embodiment of the present invention, the system generates a graphical marking including one or more variable visual characteristics, where the selected value(s) of the characteristic(s) indicates a respective aspect of the information associated with the map position which the graphical marking populates. A non-exhaustive list of example characteristics includes color, hatching, transparency, size, thickness, and shape.
- According to an example embodiment of the present invention, where the information includes more than one recorded set of effects information for a single particular map position, the system generates one or more revised values for the effects based on a combination of the effects information recorded in association with the parameters to which the map position corresponds. For example, in an example embodiment, each of one or more of the records includes one or more respective scores, with the system calculating a score based on a combination, e.g., average, of the scores of the different records. For example, in an example embodiment, in an instance where a first record of effects of a stimulation conducted using a particular combination of electrode and amplitude indicates a side effect score of 1, representing a side effect of low severity, and a second record of effects of a stimulation using that same combination of electrode and amplitude indicates a side effect score of 4, representing a side effect of extreme severity, the system calculates a new score, e.g., the average score of 2.5, and populates the map position corresponding the electrode and amplitude combination with a graphical marking representative of the calculated combinatory score. According to an alternative example embodiment, the system uses the latest recorded effects information for a particular stimulation parameter set to which a map position corresponds for populating the map position.
- According to an example embodiment, the obtained records associated with the parameters corresponding to a single map location can correspond to a plurality of patients who have been subjected to a stimulation at that parameter set; a plurality of indications, symptoms, and/or diseases for which different stimulations have been conducted for one or more patients; and/or a plurality of stimulation sessions conducted at different times for one or more patients. According to an example embodiment, the system provides a user interface component via which to receive user input of criteria by which to limit the scope of the stimulations whose information are used for populating the map. For example, the user can limit the population to information corresponding to stimulations associated with particular patients, e.g., a current patient being treated or patients having certain characteristics (e.g., those of a certain height, weight, gender, taking certain medications, etc.), particular diseases, particular times, e.g., the last 5 months, and/or particular sessions, e.g., last 5 sessions. These are just some of the usable filter parameters, and, according example embodiments, other filter parameters can be used. According to an example embodiment, a combination of filter parameters can be used. According to an example embodiment, subsequent to an initial display of the graphical markings using no or few filter parameters, the user can add filter parameters to gradually remove some of the markings. This can be useful because the user may want to see how various criteria impact stimulation score.
- According to an example embodiment of the present invention, the graphical marking includes a plurality of parts, each corresponding to a different aspect of the information associated with the stimulation settings to which the map position populated by the graphical marking corresponds. For example, in an example embodiment received information includes an adverse side effect score and a therapeutic effect score, and the graphical marking includes a first part representative of the side effect score and a second part representative of the therapeutic effect score. Still further, according to an example embodiment, different scores may be obtained, and accordingly represented by respective parts of the graphical marking, for different adverse side effects, e.g., parasthesia, dyskenisia, etc., and different therapeutic effects, e.g., positive effects with respect to rigidity, tremor, etc. Still further, according to an example embodiment, the system calculates and represents as a respective part of the marking an overall score based on a combination of both adverse side effect information and therapeutic effect information, the adverse side effect score adversely affecting the overall score and the therapeutic effect score positively affecting the overall score.
- For example, according to an example embodiment, the different parts of the graphical marking are concentrically arranged, one within the other, with different bands about the center dedicated for representing different types of information. That records corresponding to a particular map location include information regarding only one of the types to which the bands correspond can occur. According to an example embodiment, in such an instance, the band(s) corresponding to the missing information is left devoid of any of the graphical characteristics used for representing the information. For example, a pure black and solid band can be used where there is no information to represent for the particular band. The concentrically arranged marking can be a circle, square, or any other shape.
- An example embodiment of the present invention is directed to one or more processors, which can be implemented using any conventional processing circuit and device or combination thereof, e.g., a Central Processing Unit (CPU) of a Personal Computer (PC) or other workstation processor, to execute code provided, e.g., on a hardware computer-readable medium including any conventional memory device, to perform any of the methods described herein, alone or in combination, and to generate any of the user interface displays described herein, alone or in combination. The one or more processors can be embodied in a server or user terminal or combination thereof. The user terminal can be embodied, for example, as a desktop, laptop, hand-held device, Personal Digital Assistant (PDA), television set-top Internet appliance, mobile telephone, smart phone, iPad etc., or as a combination of one or more thereof. In an example embodiment, described features can be integrated with and be embodiment as a clinician programmer terminal, e.g., as referred to in the '330, '312, '340, '343, and '314 applications. Additionally, some of the described methods can be performed by a processor on one device or terminal and using a first memory, while other methods can be performed by a processor on another device and using, for example, a different memory. The features can be embodied in an application for a smartphone and/or iPad, for example.
- The memory device can include any conventional permanent and/or temporary memory circuits or combination thereof, a non-exhaustive list of which includes Random Access Memory (RAM), Read Only Memory (ROM), Compact Disks (CD), Digital Versatile Disk (DVD), and magnetic tape.
- An example embodiment of the present invention is directed to one or more hardware computer-readable media, e.g., as described above, on which are stored instructions executable by a processor to perform the methods and/or provide the user interface features described herein.
- An example embodiment of the present invention is directed to a method, e.g., of a hardware component or machine, of transmitting instructions executable by a processor to perform the methods and/or provide the user interface features described herein.
- Additionally, according to an example embodiment, system features draw upon data, such as clinical effects data for producing the therapy effect history map, and/or produce such data, where such data is obtained from and/or stored to a data store. The data store can be located, for example, on a simulator device, a computer used for inputting such data, a patient remote control usable by the patient for adjusting stimulation parameters of an implanted stimulation leadwire, a central local database, or a cloud database. According to an example embodiment, the data store stores data of a plurality of patients, the data of the plurality of patients being used for generating a single therapy effect history map. According to an alternative or additional embodiment, the system generates a therapy effect history map for a particular patient selectively using only the clinical history data of only the respective patient.
- In the drawings, which are not necessarily drawn to scale, like numerals may describe similar components in different views. The drawings illustrate generally, by way of example, but not by way of limitation, various embodiments discussed in the present document.
-
FIG. 1 is a screenshot of a graphical user interface including a clinical response map, according to an example embodiment of the present invention. -
FIG. 2 is a screenshot of a graphical user interface including a clinical response map and including a control by which to bring up an extended menu of effect types, according to an example embodiment of the present invention. -
FIG. 3 is a screenshot showing an extended menu of effect types, according to an example embodiment of the present invention. -
FIG. 4 is a screenshot showing a clinical response map overlapping a representation of an anatomical structure and including a circular indicator of stimulation magnitude, according to an example embodiment of the present invention. -
FIG. 5 shows a report including a column of graphical clinical effects representations generatable by a processor based on clinical effects data, according to an example embodiment of the present invention. -
FIG. 6 shows a system according to an example embodiment of the present invention. -
FIG. 1 shows an exampleuser interface screen 100 generated and output according to an example embodiment of the present invention. Thescreen 100 includes aclinical response map 102 including afirst axis 104 corresponding to leadwire position or electrode number and asecond axis 106 corresponding to stimulation amplitude. Positions in the map therefore correspond to respective stimulations, each associated with activation of a respective actual or virtual electrode at a particular stimulation amplitude. - At those positions of the map corresponding to the electrode/amplitude combination for which the system has obtained clinical response information, e.g., in the form of an adverse side effect and/or therapeutic effect score, the system displays at respective ones of those positions respective graphical markings 108 (only one is labeled in
FIG. 1 for purposes of clarity). The markings include a ring 108a about acenter region 108b. For example, the ring 108a represents an adverse side effect score and thecenter region 108b corresponds to a therapeutic effect score. - According to an example embodiment, the ring 108a and the
center region 108b are graphically demarcated from each other, for example by use of different colors and/or hatching. For example, according to an example embodiment, thecenter region 108b is filled (where a respective score is available) using a blue color and the ring 108a is filled (wherein a respective score is available) using a yellow color. For those map positions for which there is only an adverse side effect score, the appropriately colored ring 108a is displayed about anempty center region 108b, e.g., thecenter region 108b being black or whichever other background color is used for themap 102. Similarly, for those map positions for which there is only a therapeutic effect score, the appropriatelycolored center region 108b is displayed without any ring 108a surrounding thecenter region 108b or with only a ring outline where the ring 108a would otherwise be displayed, the ring outline being black filled, or filled with whichever other background color is used for themap 102. - In
FIG. 1 , thecenter regions 108b of different ones of thegraphical markings 108 are differently saturated with the selected color, i.e., their transparencies differ, in correspondence with differences in their respective scores. For example, thecenter regions 108b of thegraphical markings 108 at those map positions associated with high therapeutic effect scores are highly saturated with the therapeutic effect color (with low transparency), and thecenter regions 108b of thegraphical markings 108 at those map positions associated with low therapeutic effect scores are less saturated with the therapeutic effect color (with higher transparency). The degrees of saturation and transparency are many for representing many different scores. - In
FIG. 1 , the rings 108a of different ones of thegraphical markings 108 are of different thicknesses in correspondence with differences in their respective scores. For example, the ring 108a of thegraphical markings 108 at those map positions associated with high adverse side effect scores are thick, and the rings 108a of thegraphical markings 108 at those map positions associated with low adverse effect scores thinner. The degrees of thickness are many for representing many different scores. - The
user interface screen 100 includes a user-selectablecriteria selector control 110, which can be selected for input of filter criteria for filtering the records used for generating themap 102. For example,FIG. 1 shows that all records are being used. (This may be limited to certain default filter criteria in any case. For example, the system may be set to limit the used records to those associated to a patient currently being programmed.) According to an example embodiment, responsive to selection of thecontrol 110, the system provides input fields in which a user can input filter criteria, such as those described above, for limiting the records being used for the generation of the map. - According to an example embodiment of the present invention, the displayed
graphical markings 108 are selectable, in response to which selection, the system outputs, e.g., textual, details concerning the effects information represented by the displayedgraphical marking 108. For example, theinterface screen 100 shown inFIG. 1 includes adetails box 112 textually identifying details concerning the stimulation effects information of a selected one of thegraphical markings 108. Such details, as shown inFIG. 1 , can include the respective score(s) for therapeutic and/or adverse side effects and/or identifications of particular recorded therapeutic effects and/or side effects. - For example, as described in
U.S. Pat. App. Ser. No. 61/699,135 - For example, the
details box 112 shows that the selected map position (i.e., the stimulation parameters to which the selected map position corresponds) is associated with a recorded adverse side effect of dyskenisia, with an overall therapeutic effect score of 2, and an overall adverse side effect of 3. - According to an example embodiment, as shown in
FIG. 1 , thedetails box 112 further identifies some of the stimulation parameters for which the clinical response information has been received. For example, thedetails box 112 includes information regarding a single stimulation session. For example, thedetails box 112 inFIG. 1 shows clinical response information obtained for a stimulation session that was performed on October 30, 2012, with a stimulation at an amplitude of 4.5mA, frequency of 120Hz, and pulse width of 60µs. - According to an example embodiment, and as shown in
FIG. 1 , if a map location is associated with clinical response records for a plurality of stimulation sessions of a patient that were conducted over time, the system further provides a session navigation control 115 for selecting different sessions, where, in response to a navigation instruction, input by a user using the navigation control 115 for navigating to a different session, thedetails box 112 is updated to reflect the information corresponding to the session to which the user has navigated. For example, thedetails box 112 can include an "earlier" button and/or a "later" button, only the former being shown inFIG. 1 , for changing the stimulation session whose details are displayed to either an earlier or later session than the one that is currently displayed. According to an example embodiment, thegraphical marking 108 is generated based on the information of all of the sessions (meeting any predefined or user-selected filter criteria), but thedetails box 112 shows the information of only one of the sessions at a time. However, according to an example embodiment, as noted above, acriteria selector control 110 is selectable by which to limit the sessions on which basis the characteristics of thegraphical marking 108 are determined. One such filter is a history filter, by which the user can select a particular one or more sessions on which basis to generate thegraphical marking 108, and therefore, the characteristics of thegraphical marking 108 can reflect the information of the single session whose details are provided in thedetails box 112, even where information of other sessions and corresponding clinical response records are stored. - According to an example embodiment of the present invention, the system and method display the
map 102 in a touch-screen display, and the selection of a displayedgraphical marking 108 can be by touch of thegraphical marking 108. Alternative or additionally, according to an example embodiment, an input device, such as predetermined keys of a keyboard, a joystick, or navigation pad is usable for moving between different points of themap 102, to select different ones of thegraphical markings 108. - According to an example embodiment of the present invention, the system and method display a
cursor 120 for highlighting the currently selectedgraphical marking 108. - According to an example embodiment of the present invention, the system and method provide for user input of new session data, including clinical response information, by interaction with the
map 102 for updating themap 102. For example, the user can move thecursor 120 to location of themap 102, for example, a location not currently populated with agraphical marking 108, input stimulation parameter information for the session, such as frequency and pulse width, and further input therapeutic and/or side effects information, for example, by selecting one or more of thetherapeutic effect buttons 125 and/or one or more of the adverseside effect buttons 130. According to an example embodiment, thebuttons intensity indicator buttons intensity indicator buttons buttons type indicator buttons - As shown in
FIG. 2 , according to an example embodiment, theclinical effect buttons buttons FIG. 3 shows an example effectindicator menu screen 300 which includes additional buttons corresponding to respective therapeutic effects which the system and method display in response to selection of the "other"button 128, according to an example embodiment of the present invention. - According to an example embodiment, the
map 102 is navigable between positions thereof. When a user navigates to a position of themap 102 at which agraphical marking 108 indicating clinical effect is displayed, the system highlights the one or more of thebuttons graphical marking 108 was generated. According to an example embodiment, if a map position at which agraphical marking 108 is displayed is associated with records of a plurality of stimulation sessions, the buttons that are highlighted are those selected for one of the sessions, e.g., whichever session is represented by thedetails box 112. - According to an example embodiment, information for a new session associated with electrode and amplitude settings corresponding to a position of the
map 102 that is already populated with agraphical marking 108 can be input, based on which new input information, thegraphical marking 108 can be updated. For example, according to an example embodiment, the system and method display a button by which a user can indicate that new session information is to be input. Alternatively or additionally, the system and method is configured to obtain other user input for entering a mode by which the user enters new session information. According to an example embodiment, a user can choose whether to update information of a stimulation session for which clinical effect information had previously been recorded or to input information for an entirely new session. - For example, although not shown, according to an example embodiment of the present invention, the
details box 112 includes a button for updating a session whose details are displayed in thedetails box 112 and/or includes a button for input of new session information. - In addition, according to an example embodiment, and as shown in
FIG. 1 , thedetails box 112 includes a "delete" button for removing a clinical response record. For example, if thegraphical marking 108 at a position is based on a single clinical response record that is being deleted, thegraphical marking 108 is also responsively removed. If thegraphical marking 108 is based on a number of stimulation response records, then thegraphical marking 108 is updated to reflect removal of the effect thereon by the clinical response record being removed. - As shown in
FIG. 1 , a plurality ofgraphical markings 108 can overlap where clinical response information is recorded for settings that only slightly differ with respect to electrode location and/or amplitude setting. - According to an example embodiment of the present invention, the system and method provide a navigation pad for navigating between different positions of the
map 102. For example,FIG. 1 shows a displayed user-interactive navigation pad 150 that includes a first section (shown inFIG. 1 to be represented by an up arrow) to shift thecursor 120 to a map position corresponding to a higher electrode position of the leadwire than to which the current map position of thecursor 120 corresponds; a second section (shown inFIG. 1 to be represented by a down arrow) to shift thecursor 120 to a map position corresponding to a lower electrode position of the leadwire than to which the current map position of thecursor 120 corresponds; a third section (shown inFIG. 1 to be represented by a '+' sign) to shift thecursor 120 to a map position corresponding to a higher amplitude level than to which the current map position of thecursor 120 corresponds; and a fourth section (shown inFIG. 1 to be represented by a '-' sign) to shift thecursor 120 to a map position corresponding to a lower amplitude level than to which the current map position of thecursor 120 corresponds. Thepad 150 is a tool that provides the user with more control to fine tune the cursor position. According to an example embodiment, and as shown inFIG. 1 , the system and method display in the navigation pad 150 a textual indication of the amplitude setting to which the current cursor location corresponds. - According to an example embodiment, and as shown in
FIG. 1 , the system and method provide, e.g., display, astep size control 151 by which the user can toggle between different step sizes, e.g., .1 and .5, by which each selection of the regions of thenavigation pad 150 corresponding to amplitude effects the selected amplitude for repositioning of thecursor 120. For example, while thestep size control 151 is set to the .1 step-size, each selection of the '+' sign of thepad 150 is interpreted as an instruction to move thecursor 120 to a position of the map that corresponds to an amplitude setting that is .1 higher than that to which the current cursor position corresponds, whereas, while thestep size control 151 is set to the .5 step-size, each selection of the '+' sign of thepad 150 is interpreted as an instruction to move thecursor 120 to a position of the map that corresponds to an amplitude setting that is .5 higher than that to which the current cursor position corresponds. Similarly, selection of the '-' sign is interpreted as an instruction to move thecursor 120 to a position of the map that corresponds to an amplitude setting that is .1 or .5 (depending on the step size setting) lower than that to which the current cursor position corresponds. - According to an example embodiment, the
cursor 120 can be dragged via a touch-screen. According to an alternative example embodiment, the user can touch any point in themap 102, responsive to which the system shifts thecursor 120 to the touched position of themap 102. - According to an example embodiment of the present invention, and as shown in
FIG. 1 , the system and method output, e.g., display, togglebuttons map 102 is two dimensional with one axis corresponding to electrode location and the other axis corresponding to amplitude), nevertheless the indicated values for such other parameters are, according to an example embodiment, indicated in thedetails box 112. Moreover, according to an example embodiment of the present invention, the selected values for such other parameters are used as filter criteria to filter the data on whose basis theclinical response map 102 is generated. For example, if the user selects a pulse width of 60µs and a frequency of 125Hz, the system generates thegraphical markings 108 based on only that data which corresponds to stimulations performed at those settings. According to an alternative example embodiment, the system does not use the parameters as filter criteria. According to an alternative example embodiment, the system is configured to obtain user input selecting whether to apply one or more of the settings as filter criteria for filtering the data on whose basis to generate thegraphical markings 108. The selected parameter settings can similarly be used to filter the data used for generating other described aspects of the user interface, e.g., the records traversable using the session navigation control 115. - According to an example embodiment, and as shown in
FIG. 4 , the system and method display theclinical response map 102 overlapping ananatomical region representation 400 that graphically represents an anatomical region in which the leadwire is implanted. For example, if the leadwire is implanted in the brain of a patient, then, according to an example embodiment, theanatomical region representation 400 is a silhouette of a head. Such an overlapping display can visually indicate how the electrodes location along the leadwire corresponds to the implant location. - According to an example embodiment of the present invention, and as shown in
FIG. 4 , the system and method display acircle 405, centered on the electrode location to which the map position at which thecursor 120 is positioned corresponds and the outer perimeter of which passes through the map position at which thecursor 120 is positioned to provide the user with an indication of a relative magnitude of stimulation reach for the amplitude to which the cursor position corresponds. According to an example embodiment of the present invention, although the different amplitude levels are evenly spaced apart according to value interval, the value spacing is selected so that the size of thecircle 405 corresponding to amplitude value approximately indicates an actual expected reach of produced electric field or tissue activation. - According to an example embodiment, aside from using the
map 102 to review previously recorded clinical response information and/or to enter new clinical response data, themap 102 is usable for setting leadwire parameters to program an implanted pulse generator (IPG), for causing the leadwire to stimulate an anatomical region of a patient. For example, according to an example embodiment, a user can navigate to a position in themap 102, which position corresponds to a particular electrode (actual or virtual) and amplitude setting, and can select a control interpreted by the system as an instruction to program the IPG accordingly. If frequency and pulse width values need to be changed, controls, for example as described above, can be used to modify the values of those parameters before input of the instruction to program the IPG. - For example,
FIG. 1 shows theclinical response map 102 displayed in a same display screen as, and alongside,program panel 180 displaying information of a selected stimulation program. As the user navigates theclinical response map 102, the program information is responsively updated in theprogram panel 180. Theprogram panel 180 includes a stimulationapplication toggle button 182 to toggle between turning the program on and off. When the user selects thestimulation toggle button 182 to turn the stimulation on, the system responsively programs the IPG with the stimulation parameters to which the selected position of themap 102 corresponds. - According to an alternative example embodiment, the system includes one control for toggling between turning a stimulation program on and off and another control for selecting whether to apply settings to which the map position corresponds to the program. For example, the IPG can be causing the leadwire to stimulate a tissue region according to the stimulation program which has been turned on. While the stimulation is ongoing, the user can use the
map 102 to select new settings, and then select a button interpreted as an instruction to apply the new settings to the program currently being implemented. - According to an alternative example embodiment, the system and method provide a program mode and a clinical response entry and viewing mode. When in the program mode, the user's selection of a position within the
map 102 is automatically interpreted as an instruction to program the IPG according to the parameters to which the selected map position corresponds, but, when in the clinical response entry and viewing mode, the selection of a position in themap 102 provides for viewing and/or inputting clinical response information as described above. According to an example embodiment, even in the program mode, the system and method display thegraphical markings 108, and, in an example embodiment, show thedetails box 112 and highlight previously selected ones of thebuttons 125 and/or 130 where such information is available for the selected position of themap 102. - According to an alternative example embodiment, a map position is selectable in more than one way. If a first selection method is used, the
details box 112 is displayed and if a second selection method is used, the program is set with the corresponding parameters. For example, cursor movement by drag or selection of a cursor movement input control can be used for changing program settings, and touch of a position can be used for viewing and/or updating clinical response information. Alternatively, the different selection methods can be left-click and right-click. - More than one leadwire may be implanted in a patient. Additionally, a clinician may set up a number of programs to be implemented, for example, in a defined repetitive sequence, or at different predefined times or periods. Therefore, according to an example embodiment of the present invention, and as an example is shown in
FIG. 1 , the system and method display aprogram selection panel 190 in which a plurality of defined programs are listed, where the program listings are selectable. In an example embodiment in which two leadwires are implanted, in response to selection of a program listing, the system and method responsively expands the program listing to display selectable listings of the left and right implanted leadwires. Theprogram panel 180 is populated with information for the selected leadwire of the selected program. For example, according to an example embodiment, themap 102 can be used for selecting parameter values with which to set the right leadwire forprogram 1, and can be used for likewise selecting parameter values with which to set the left leadwire forprogram 1, and/or the right and/or left leadwires for other programs. - According to an example embodiment, the system and method display, for example in the
program panel 180, baseline metrics concerning symptoms targeted to be treated by the stimulations. According to an example embodiment, changes to such symptoms can be recorded over time in association with stimulation sessions, and thedetails box 112 shows the symptoms information recorded in association with the session whose details are displayed in thedetails box 112, to provide for easy comparison to the baseline symptoms. - According to an example embodiment, besides for the individual
graphical markings 108 displayed at respective positions of themap 102, each marking representing clinical response data input for one or more sessions associated with stimulation using the electrode to which the map position corresponds at the amplitude level to which the map position corresponds, the system and method also displays a in themap 102 an umbrella graphical marking that spans many of the positions of themap 102, where a characteristic, e.g., color or color intensity, of the umbrella graphical marking gradually changes between positions of themap 102 based on the different clinical response data associated with different positions within themap 102. For example, according to an example embodiment, the system and method interpolates the clinical response data associated with different positions of themap 102 to obtain interpolated data for those positions not associated with clinical response data, thereby filling in the voids. - According to an example embodiment, the system and method display the umbrella graphical marking simultaneously with the
graphical markings 108, and graphically demarcate thegraphical markings 108 from the umbrella graphical marking. For example, according to an example embodiment, the graphical markings are outlined, e.g., with a black line, so that they stand out. Alternatively, the umbrella graphical marking is displayed using lighter shades of color than those used for thegraphical markings 108, so that if, for example, a position of themap 102 is not associated with input clinical response data, but is assigned an interpolated clinical response value, the shade of color used at that position is softer than that used for agraphical marking 108 representing the same clinical response value. - According to an example embodiment, the system and method displays a first umbrella graphical marking representing the therapeutic effect data and a second umbrella graphical marking representing the adverse side effect data. Since they may be difficult to distinguish when they overlap each other, according to an example embodiment, the system and method provide a control by which the user can select which of the umbrella graphical markings to display, so that the user can thereby choose to display only one of them at a time.
- According to an example embodiment, for each of the positions of the
map 102 corresponding to recorded therapeutic and adverse side effect data, the system and method calculate an overall score based on both the therapeutic effect and adverse side effect information associated with the respective position, further calculate interpolated scores for the positions not associated with clinical response data, and output a single umbrella graphical marking based on the interpolated combinatory scores, which single umbrella marking gradually changes between positions according to the different scores, as described above. According to an example embodiment, the system and method first generate interpolated scores separately for adverse side effects and therapeutic effects, and then calculate overall scores based on the interpolated scores to generate the single umbrella graphical marking. - According to an example embodiment of the present invention, the system is configured to generate a report including information of previously implemented stimulation sessions according to user input filter criteria, where, for each particular row, all information used for generating the data of the respective row corresponds to use of the same electrode number (actual or virtual) and amplitude setting. Using the clinical response data of the records that satisfy the filter criteria, the system is configured to generate, for each row for whose electrode number and amplitude value clinical response data is available, a respective
graphical marking 108 as described above, and display the generatedgraphical marking 108 in a cell of the respective row. For example, the system generates the report with a column in whichgraphical markings 108 are displayed for those rows corresponding to an electrode and amplitude value for which clinical response data is available. For example,FIG. 5 is an example report generated according to an example embodiment of the present invention.Column 1 500 includesgraphical markings 108 for all of the populated rows except the second to last row which corresponds to an electrode and amplitude value for which no clinical responds data has been recorded. - Stimulation parameters can be set by a clinician logging into a programming platform under a clinician profile, and can be set by a patient logging into the programming platform under a patient profile. However, a clinician may want to limit the amount of control the patient has over the stimulation settings. For example, the clinician may determine that certain minimum and/or maximum amplitude levels must be met. Accordingly, according to an example embodiment, the system is configured to receive input from a clinician of amplitude limits which the patient cannot violate. According to an example embodiment, the system is configured to visually indicate such a limit(s) in the
map 102. For example, in an example embodiment, the system displays a line representing a maximum amplitude level and/or a line representing a minimum amplitude level extending perpendicular to the amplitude axis, and at respective positions along the amplitude axis, the respective positions corresponding to the respective maximum and/or minim amplitude values input by the clinician (or, in an example embodiment, default values if not altered or removed by the clinician). For example, a line displayed at a first amplitude position and a second line displayed a second higher amplitude position would be recognized as corresponding to minimum and maximum values. Alternatively, the lines additionally otherwise graphically or textually indicate whether the line corresponds to a maximum or minimum. Additionally, according to an example embodiment, where only a maximum amplitude or only a minimum amplitude is set, so that only a single limit line is displayed (so that context does not indicate whether the line is a maximum or minimum limit), the line graphically or textually identifies whether the line represents a maximum or minimum limit. For example, text can be printed along the line to textually identify the line, or predefined colors and/or line forms (dashed, dotted, etc.) can be used. -
FIG. 6 shows an example system according to an example embodiment of the present invention. In an example embodiment, a system 600 includes a clinician and/orpatient programmer terminal 605 that includes atelemetry module 606 and a userinterface generation module 607. Thetelemetry module 606 is in communication with an implanted pulse generator (IPG) 610. The userinterface generation module 607 includes software executable by a processor for generating graphical user interface displays, as described above, for example, including code for generating the various described graphical markings and soft controls and for recording and displaying clinical effects information. In an example embodiment, interaction with one or more graphical user interface displays and/or a hardware input device is usable for input of one or more stimulation parameter settings in accordance with which thetelemetry module 606 outputs instructions to theIPG 610, theIPG 610 accordingly controlling aleadwire 620 to activate one ormore electrodes 621a-621g to produce electric pulses at specified amplitudes. For example, theleadwire 620 is implanted in a patient, e.g., in the patient's brain, and the electric pulses are intended to activate anatomic fibers to produce a therapeutic effect, e.g., as described in further detail in the '330, '312, '340, '343, and '314 applications. Theelectrodes 621a-621g can include one or more directional electrodes which can be controlled to direct stimulation in a particular radial direction from the central longitudinal axis of theleadwire 620 and/or can include one or more cylindrical electrodes that produce essentially the same stimulation in all directions rotationally about the cylindrically symmetrical stimulation about the central longitudinal axis of theleadwire 620. As described above, according to an example embodiment, the user interface displays provide for navigation of a clinical effects map to select the parameters for the instructions provided to theIPG 610. - The above description is intended to be illustrative, and not restrictive. Those skilled in the art can appreciate from the foregoing description that the present invention can be implemented in a variety of forms, and that the various embodiments can be implemented alone or in combination. Therefore, while the embodiments of the present invention have been described in connection with particular examples thereof, the true scope of the embodiments and/or methods of the present invention should not be so limited since other modifications will become apparent to the skilled practitioner upon a study of the drawings, specification, and following claims.
Claims (15)
- A computer-implemented clinical data output method comprising:
based on at least a subset of stored data of clinical effects of one or more stimulations of anatomical tissue performed using electrodes of an implanted leadwire, generating and outputting via a display, by a computer processor, a plurality of graphical markings representing at least the subset of the stored data by plotting each of the graphical markings at a respective coordinate of a graph, wherein each of the graphical markings represents a respective portion of at least the subset of the stored data and is output in association with a respective set of values for each of at least two parameters by which one or more the stimulations were performed, characterized by the subset of stored data of clinical effects comprising a first clinical effect and a second clinical effect, and each of the graphical markings comprising a center region corresponding to one of a respective clinical effect type of the first clinical effect or a respective score of the first clinical effect and a ring corresponding to one of a respective clinical effect type of the second clinical effect or a respective score of the second clinical effect. - The method of claim 1, wherein the data of clinical effects is stored on a stimulation device that controls the implanted leadwire or on the implanted leadwire.
- The method of claim 1, wherein:the graph includes a first axis corresponding to values of a first of the at least two parameters and a second axis corresponding to values of a second of the at least two parameters; andthe association with the respective set of values is via the location at which the respective graphical marking is plotted.
- The method of claim 3, wherein the first parameter is a leadwire location and the second parameter is a stimulation amplitude.
- The method of claim 3, wherein each of the graphical markings is selectable, and the method further comprises:
responsive to a selection of one of the graphical markings, displaying, by the processor, textual details from the stored data of clinical effects on which basis the respective selected graphical marking was generated. - The method of claim 3, wherein each of the graphical markings is selectable, and the method further comprises:displaying, by the processor, a plurality of clinical effect detail indicators, each corresponding to one of a respective clinical effect type and a respective degree of clinical effect; andresponsive to a selection of one of the graphical markings, selectively highlighting, by the processor, those of the clinical effect detail indicators that are associated with the selected graphical marking.
- The method of claim 6, further comprising:
responsive to user-selection of one of the plurality of clinical effect detail indicators, recording new clinical effects data in association with stimulation parameters of a currently selected stimulation program, and one of updating and generating a graphical marking at one of the coordinates which corresponds to the stimulation parameters of the currently selected stimulation program. - The method of claim 3, wherein the coordinates of the graph are selectable, the method further comprising:
programming, by the processor and based on a selection of one of the coordinates of the graph, a stimulation device for operating the implanted leadwire to stimulate anatomical tissue using values of the first and second parameters corresponding to the selected coordinate. - The method of claim 1, further comprising programming, by the processor and based on a selection of one of the graphical markings when in a programming mode, a stimulation device for operating the implanted leadwire to stimulate anatomical tissue using values of the first and second parameters corresponding to the selected graphical marking.
- The method of claim 1, wherein the first clinical effect is a therapeutic effect and the second clinical effect is a side effect.
- The method of claim 1, wherein:a graphical characteristic of the center region of the graphical markings is set in accordance with a score based on the first clinical effect associated with the set of values with which the respective graphical marking is associated; anda graphical characteristic of the ring of the graphical markings is set in accordance with a score calculated based on the second clinical effect associated with the set of values with which the respective graphical marking is associated.
- The method of claim 1, wherein the center region is displayed in a first color and the ring is displayed in a second color different than the first color.
- The method of claim 12, wherein the first and second color vary in transparency based on scores associated with the first and second clinical effects, respectively.
- A computer system comprising a processor configured to perform the method as recited in any one of the preceding claims.
- A non-transitory computer-readable medium on which is stored instructions that are executable by a processor, the instructions which, when executed by the processor, cause the processor to perform the method as recited in any of claims 1-13.
Applications Claiming Priority (3)
| Application Number | Priority Date | Filing Date | Title |
|---|---|---|---|
| US201361793773P | 2013-03-15 | 2013-03-15 | |
| US201361830855P | 2013-06-04 | 2013-06-04 | |
| PCT/US2014/028264 WO2014144029A2 (en) | 2013-03-15 | 2014-03-14 | Clinical response data mapping |
Publications (2)
| Publication Number | Publication Date |
|---|---|
| EP2968952A2 EP2968952A2 (en) | 2016-01-20 |
| EP2968952B1 true EP2968952B1 (en) | 2018-07-11 |
Family
ID=50543688
Family Applications (1)
| Application Number | Title | Priority Date | Filing Date |
|---|---|---|---|
| EP14719164.7A Active EP2968952B1 (en) | 2013-03-15 | 2014-03-14 | Clinical response data mapping |
Country Status (5)
| Country | Link |
|---|---|
| US (1) | US9474903B2 (en) |
| EP (1) | EP2968952B1 (en) |
| JP (1) | JP6185142B2 (en) |
| AU (1) | AU2014227964B2 (en) |
| WO (1) | WO2014144029A2 (en) |
Families Citing this family (73)
| Publication number | Priority date | Publication date | Assignee | Title |
|---|---|---|---|---|
| US7346382B2 (en) | 2004-07-07 | 2008-03-18 | The Cleveland Clinic Foundation | Brain stimulation models, systems, devices, and methods |
| US9220889B2 (en) | 2008-02-11 | 2015-12-29 | Intelect Medical, Inc. | Directional electrode devices with locating features |
| US8019440B2 (en) | 2008-02-12 | 2011-09-13 | Intelect Medical, Inc. | Directional lead assembly |
| US9272153B2 (en) | 2008-05-15 | 2016-03-01 | Boston Scientific Neuromodulation Corporation | VOA generation system and method using a fiber specific analysis |
| EP3536376A1 (en) | 2008-07-30 | 2019-09-11 | Ecole Polytechnique Fédérale de Lausanne | Apparatus for optimized stimulation of a neurological target |
| WO2010055421A1 (en) | 2008-11-12 | 2010-05-20 | Aleva Neurotherapeutics, S.A. | Microfabricated neurostimulation device |
| CA2772330A1 (en) | 2009-08-27 | 2011-03-03 | The Cleveland Clinic Foundation | System and method to estimate region of tissue activation |
| WO2011068997A1 (en) | 2009-12-02 | 2011-06-09 | The Cleveland Clinic Foundation | Reversing cognitive-motor impairments in patients having a neuro-degenerative disease using a computational modeling approach to deep brain stimulation programming |
| JP5927176B2 (en) | 2010-04-01 | 2016-06-01 | エコーレ ポリテクニーク フェデラーレ デ ローザンヌ (イーピーエフエル) | Device for interacting with neural tissue and methods of making and using it |
| US8913804B2 (en) | 2010-06-14 | 2014-12-16 | Boston Scientific Neuromodulation Corporation | Programming interface for spinal cord neuromodulation |
| AU2012236737B2 (en) | 2011-03-29 | 2017-03-02 | Boston Scientific Neuromodulation Corporation | System and method for atlas registration |
| US9592389B2 (en) | 2011-05-27 | 2017-03-14 | Boston Scientific Neuromodulation Corporation | Visualization of relevant stimulation leadwire electrodes relative to selected stimulation information |
| US8751008B2 (en) | 2011-08-09 | 2014-06-10 | Boston Scientific Neuromodulation Corporation | Remote control data management with correlation of patient condition to stimulation settings and/or with clinical mode providing a mismatch between settings and interface data |
| WO2014025624A1 (en) | 2012-08-04 | 2014-02-13 | Boston Scientific Neuromodulation Corporation | Techniques and methods for storing and transferring registration, atlas, and lead information between medical devices |
| EP2891091B1 (en) | 2012-08-28 | 2018-01-31 | Boston Scientific Neuromodulation Corporation | Capture and visualization of clinical effects data in relation to a lead and/or locus of stimulation |
| WO2014070290A2 (en) | 2012-11-01 | 2014-05-08 | Boston Scientific Neuromodulation Corporation | Systems and methods for voa model generation and use |
| CN111569263B (en) * | 2013-12-23 | 2024-04-26 | 脑深部创新有限责任公司 | Programming system for deep brain stimulator system |
| US11311718B2 (en) | 2014-05-16 | 2022-04-26 | Aleva Neurotherapeutics Sa | Device for interacting with neurological tissue and methods of making and using the same |
| WO2015173787A1 (en) | 2014-05-16 | 2015-11-19 | Aleva Neurotherapeutics Sa | Device for interacting with neurological tissue and methods of making and using the same |
| US9959388B2 (en) | 2014-07-24 | 2018-05-01 | Boston Scientific Neuromodulation Corporation | Systems, devices, and methods for providing electrical stimulation therapy feedback |
| US10265528B2 (en) | 2014-07-30 | 2019-04-23 | Boston Scientific Neuromodulation Corporation | Systems and methods for electrical stimulation-related patient population volume analysis and use |
| US10272247B2 (en) | 2014-07-30 | 2019-04-30 | Boston Scientific Neuromodulation Corporation | Systems and methods for stimulation-related volume analysis, creation, and sharing with integrated surgical planning and stimulation programming |
| CN111624346A (en) * | 2014-08-14 | 2020-09-04 | 米密德诊断学有限公司 | Kit for predicting and/or determining prognosis |
| US9474894B2 (en) | 2014-08-27 | 2016-10-25 | Aleva Neurotherapeutics | Deep brain stimulation lead |
| WO2016057544A1 (en) | 2014-10-07 | 2016-04-14 | Boston Scientific Neuromodulation Corporation | Systems, devices, and methods for electrical stimulation using feedback to adjust stimulation parameters |
| US9984209B2 (en) | 2015-02-13 | 2018-05-29 | Medtronic, Inc. | Graphical controls for programming medical device operation |
| US20160263386A1 (en) * | 2015-03-09 | 2016-09-15 | Boston Scientific Neuromodulation Corporation | Deep brain stimulation clinical effects map with visual indicators for patient amplitude limits |
| US10780283B2 (en) | 2015-05-26 | 2020-09-22 | Boston Scientific Neuromodulation Corporation | Systems and methods for analyzing electrical stimulation and selecting or manipulating volumes of activation |
| AU2016268259B2 (en) | 2015-05-26 | 2019-01-31 | Boston Scientific Neuromodulation Corporation | Systems and methods for analyzing electrical stimulation and selecting or manipulating volumes of activation |
| WO2017209673A1 (en) * | 2016-06-03 | 2017-12-07 | Neuronano Ab | Method and system for improving stimulation of excitable tissue |
| US10052490B2 (en) * | 2015-06-09 | 2018-08-21 | Nuvectra Corporation | Systems, methods, and devices for performing electronically controlled test stimulation |
| EP3280491B1 (en) | 2015-06-29 | 2023-03-01 | Boston Scientific Neuromodulation Corporation | Systems for selecting stimulation parameters by targeting and steering |
| US20160375248A1 (en) | 2015-06-29 | 2016-12-29 | Boston Scientific Neuromodulation Corporation | Systems and methods for selecting stimulation parameters based on stimulation target region, effects, or side effects |
| US10071249B2 (en) | 2015-10-09 | 2018-09-11 | Boston Scientific Neuromodulation Corporation | System and methods for clinical effects mapping for directional stimulation leads |
| US10814127B2 (en) | 2016-02-05 | 2020-10-27 | Boston Scientific Neuromodulation Corporation | Slotted sleeve neurostimulation device |
| EP3389763B1 (en) | 2016-02-19 | 2023-06-28 | Boston Scientific Neuromodulation Corporation | Electrical stimulation cuff devices and systems |
| US10315038B2 (en) | 2016-02-19 | 2019-06-11 | Boston Scientific Neuromodulation Corporation | Clinical guidance user interfaces for neurostimulator programming |
| US10716942B2 (en) | 2016-04-25 | 2020-07-21 | Boston Scientific Neuromodulation Corporation | System and methods for directional steering of electrical stimulation |
| US10493269B2 (en) | 2016-06-02 | 2019-12-03 | Boston Scientific Neuromodulation Corporation | Leads for electrostimulation of peripheral nerves and other targets |
| WO2017223505A2 (en) | 2016-06-24 | 2017-12-28 | Boston Scientific Neuromodulation Corporation | Systems and methods for visual analytics of clinical effects |
| US10709888B2 (en) | 2016-07-29 | 2020-07-14 | Boston Scientific Neuromodulation Corporation | Systems and methods for making and using an electrical stimulation system for peripheral nerve stimulation |
| US10350404B2 (en) | 2016-09-02 | 2019-07-16 | Boston Scientific Neuromodulation Corporation | Systems and methods for visualizing and directing stimulation of neural elements |
| US10780282B2 (en) | 2016-09-20 | 2020-09-22 | Boston Scientific Neuromodulation Corporation | Systems and methods for steering electrical stimulation of patient tissue and determining stimulation parameters |
| WO2018071865A1 (en) | 2016-10-14 | 2018-04-19 | Boston Scientific Neuromodulation Corporation | Systems and methods for closed-loop determination of stimulation parameter settings for an electrical simulation system |
| WO2018102773A1 (en) | 2016-12-02 | 2018-06-07 | Boston Scientific Neuromodulation Corporation | Methods and systems for selecting stimulation parameters for electrical stimulation devices |
| ES2871008T3 (en) | 2017-01-03 | 2021-10-28 | Boston Scient Neuromodulation Corp | Systems and Procedures for Selecting MRI-Compatible Stimulation Parameters |
| EP3519043B1 (en) | 2017-01-10 | 2020-08-12 | Boston Scientific Neuromodulation Corporation | Systems and methods for creating stimulation programs based on user-defined areas or volumes |
| US10625082B2 (en) | 2017-03-15 | 2020-04-21 | Boston Scientific Neuromodulation Corporation | Visualization of deep brain stimulation efficacy |
| US11357986B2 (en) | 2017-04-03 | 2022-06-14 | Boston Scientific Neuromodulation Corporation | Systems and methods for estimating a volume of activation using a compressed database of threshold values |
| WO2019014224A1 (en) | 2017-07-14 | 2019-01-17 | Boston Scientific Neuromodulation Corporation | Systems and methods for estimating clinical effects of electrical stimulation |
| WO2019036180A1 (en) | 2017-08-15 | 2019-02-21 | Boston Scientific Neuromodulation Corporation | Systems and methods for controlling electrical stimulation using multiple stimulation fields |
| US10987016B2 (en) * | 2017-08-23 | 2021-04-27 | The Boeing Company | Visualization system for deep brain stimulation |
| EP3684463A4 (en) | 2017-09-19 | 2021-06-23 | Neuroenhancement Lab, LLC | Method and apparatus for neuroenhancement |
| US11690575B2 (en) * | 2017-10-12 | 2023-07-04 | Nihon Kohden Corporation | Apparatus and method for processing physiological information |
| EP3710103B1 (en) | 2017-11-17 | 2024-02-21 | Boston Scientific Neuromodulation Corporation | Systems for generating intermittent stimulation using electrical stimulation systems |
| US11717686B2 (en) | 2017-12-04 | 2023-08-08 | Neuroenhancement Lab, LLC | Method and apparatus for neuroenhancement to facilitate learning and performance |
| WO2019133997A1 (en) | 2017-12-31 | 2019-07-04 | Neuroenhancement Lab, LLC | System and method for neuroenhancement to enhance emotional response |
| US10702692B2 (en) | 2018-03-02 | 2020-07-07 | Aleva Neurotherapeutics | Neurostimulation device |
| WO2019183078A1 (en) | 2018-03-23 | 2019-09-26 | Boston Scientific Neuromodulation Corporation | Optical stimulation systems using therapy cycling and methods of using |
| US11364361B2 (en) | 2018-04-20 | 2022-06-21 | Neuroenhancement Lab, LLC | System and method for inducing sleep by transplanting mental states |
| US20190329050A1 (en) * | 2018-04-25 | 2019-10-31 | Aleva Neurotherapeutics | Clinical neurostimulation controller |
| AU2019260740B2 (en) | 2018-04-27 | 2022-05-19 | Boston Scientific Neuromodulation Corporation | Multi-mode electrical stimulation systems and methods of making and using |
| EP3784332B1 (en) | 2018-04-27 | 2023-04-26 | Boston Scientific Neuromodulation Corporation | Systems for visualizing and programming electrical stimulation |
| EP3849410A4 (en) | 2018-09-14 | 2022-11-02 | Neuroenhancement Lab, LLC | System and method of improving sleep |
| USD950588S1 (en) * | 2019-02-18 | 2022-05-03 | Samsung Electronics Co., Ltd. | Display screen or portion thereof with graphical user interface |
| US11707622B2 (en) | 2019-12-31 | 2023-07-25 | Boston Scientific Neuromodulation Corporation | Automatic determination of inputs for closed-loop algorithms for optimization of stimulation parameters |
| WO2022103590A1 (en) | 2020-11-11 | 2022-05-19 | Boston Scientific Neuromodulation Corporation | Voice command handler for programming stimulation systems and methods of using |
| US20220266014A1 (en) | 2021-02-25 | 2022-08-25 | Boston Scientific Neuromodulation Corporation | Methods and systems for deep brain stimulation of the nucleus basalis of meynert |
| WO2022232036A1 (en) | 2021-04-27 | 2022-11-03 | Boston Scientific Neuromodulation Corporation | Systems and methods for automated programming of electrical stimulation |
| WO2022261004A1 (en) | 2021-06-07 | 2022-12-15 | Boston Scientific Neuromodulation Corporation | Methods and systems for charge balancing of electrical stimulation |
| US20230181090A1 (en) | 2021-12-10 | 2023-06-15 | Boston Scientific Neuromodulation Corporation | Systems and methods for generating and using response maps for electrical stimulation |
| US20230264025A1 (en) | 2022-02-24 | 2023-08-24 | Boston Scientific Neuromodulation Corporation | Systems and methods for using cost parameters for programming electrical stimulation |
| EP4368242A1 (en) | 2022-11-14 | 2024-05-15 | Boston Scientific Neuromodulation Corporation | Systems and methods for generating and using stimulation programs with temporal variation |
Family Cites Families (130)
| Publication number | Priority date | Publication date | Assignee | Title |
|---|---|---|---|---|
| US6240308B1 (en) | 1988-12-23 | 2001-05-29 | Tyrone L. Hardy | Method and apparatus for archiving and displaying anatomico-physiological data in a normalized whole brain mapping and imaging system |
| US5099846A (en) | 1988-12-23 | 1992-03-31 | Hardy Tyrone L | Method and apparatus for video presentation from a variety of scanner imaging sources |
| US5365996A (en) | 1992-06-10 | 1994-11-22 | Amei Technologies Inc. | Method and apparatus for making customized fixation devices |
| US5361763A (en) | 1993-03-02 | 1994-11-08 | Wisconsin Alumni Research Foundation | Method for segmenting features in an image |
| US6694163B1 (en) | 1994-10-27 | 2004-02-17 | Wake Forest University Health Sciences | Method and system for producing interactive, three-dimensional renderings of selected body organs having hollow lumens to enable simulated movement through the lumen |
| US5782762A (en) | 1994-10-27 | 1998-07-21 | Wake Forest University | Method and system for producing interactive, three-dimensional renderings of selected body organs having hollow lumens to enable simulated movement through the lumen |
| US5724985A (en) | 1995-08-02 | 1998-03-10 | Pacesetter, Inc. | User interface for an implantable medical device using an integrated digitizer display screen |
| US6463328B1 (en) | 1996-02-02 | 2002-10-08 | Michael Sasha John | Adaptive brain stimulation method and system |
| US6066163A (en) | 1996-02-02 | 2000-05-23 | John; Michael Sasha | Adaptive brain stimulation method and system |
| US5938688A (en) | 1997-10-22 | 1999-08-17 | Cornell Research Foundation, Inc. | Deep brain stimulation method |
| US6106460A (en) | 1998-03-26 | 2000-08-22 | Scimed Life Systems, Inc. | Interface for controlling the display of images of diagnostic or therapeutic instruments in interior body regions and related data |
| US6115626A (en) | 1998-03-26 | 2000-09-05 | Scimed Life Systems, Inc. | Systems and methods using annotated images for controlling the use of diagnostic or therapeutic instruments in instruments in interior body regions |
| US6748098B1 (en) | 1998-04-14 | 2004-06-08 | General Electric Company | Algebraic reconstruction of images from non-equidistant data |
| US6319241B1 (en) | 1998-04-30 | 2001-11-20 | Medtronic, Inc. | Techniques for positioning therapy delivery elements within a spinal cord or a brain |
| US7242984B2 (en) | 1998-08-05 | 2007-07-10 | Neurovista Corporation | Apparatus and method for closed-loop intracranial stimulation for optimal control of neurological disease |
| US7231254B2 (en) | 1998-08-05 | 2007-06-12 | Bioneuronics Corporation | Closed-loop feedback-driven neuromodulation |
| US7209787B2 (en) | 1998-08-05 | 2007-04-24 | Bioneuronics Corporation | Apparatus and method for closed-loop intracranial stimulation for optimal control of neurological disease |
| US7324851B1 (en) | 1998-08-05 | 2008-01-29 | Neurovista Corporation | Closed-loop feedback-driven neuromodulation |
| US9113801B2 (en) | 1998-08-05 | 2015-08-25 | Cyberonics, Inc. | Methods and systems for continuous EEG monitoring |
| US6310619B1 (en) | 1998-11-10 | 2001-10-30 | Robert W. Rice | Virtual reality, tissue-specific body model having user-variable tissue-specific attributes and a system and method for implementing the same |
| US6909917B2 (en) | 1999-01-07 | 2005-06-21 | Advanced Bionics Corporation | Implantable generator having current steering means |
| US6491699B1 (en) | 1999-04-20 | 2002-12-10 | Surgical Navigation Technologies, Inc. | Instrument guidance method and system for image guided surgery |
| US6539263B1 (en) | 1999-06-11 | 2003-03-25 | Cornell Research Foundation, Inc. | Feedback mechanism for deep brain stimulation |
| US6289248B1 (en) | 1999-08-20 | 2001-09-11 | Cardiac Pacemakers, Inc. | System and method for detecting and displaying parameter interactions |
| US6351675B1 (en) | 1999-10-04 | 2002-02-26 | Medtronic, Inc. | System and method of programming an implantable medical device |
| WO2001039831A1 (en) | 1999-12-06 | 2001-06-07 | Advanced Bionics Corporation | Implantable device programmer |
| US7050857B2 (en) | 1999-12-16 | 2006-05-23 | St. Jude Medical Ab | Programming system for medical devices |
| SE9904626D0 (en) | 1999-12-16 | 1999-12-16 | Pacesetter Ab | Programming system for medical devices |
| JP2003534080A (en) | 2000-05-24 | 2003-11-18 | コーニンクレッカ フィリップス エレクトロニクス エヌ ヴィ | Method and apparatus for convenient processing of medical images |
| US6748276B1 (en) | 2000-06-05 | 2004-06-08 | Advanced Neuromodulation Systems, Inc. | Neuromodulation therapy system |
| JP2002267761A (en) * | 2001-03-14 | 2002-09-18 | Osaka Gas Co Ltd | Display method of coordinate related information |
| DE50106039D1 (en) | 2001-06-28 | 2005-06-02 | Brainlab Ag | Device for transcranial magnetic stimulation |
| EP1269913B1 (en) | 2001-06-28 | 2004-08-04 | BrainLAB AG | Device for transcranial magnetic stimulation and cortical cartography |
| US7136695B2 (en) | 2001-10-12 | 2006-11-14 | Pless Benjamin D | Patient-specific template development for neurological event detection |
| DE50102342D1 (en) | 2001-10-24 | 2004-06-24 | Brainlab Ag | Navigated micro-probe |
| WO2003045222A2 (en) | 2001-11-21 | 2003-06-05 | Viatronix Incorporated | System and method for visualization and navigation of three-dimensional medical images |
| US7146223B1 (en) | 2002-02-04 | 2006-12-05 | Advanced Bionics Corporation | Method for optimizing search for spinal cord stimulation parameter settings |
| US7831292B2 (en) | 2002-03-06 | 2010-11-09 | Mako Surgical Corp. | Guidance system and method for surgical procedures with improved feedback |
| US7894877B2 (en) | 2002-05-17 | 2011-02-22 | Case Western Reserve University | System and method for adjusting image parameters based on device tracking |
| US7151961B1 (en) | 2002-05-24 | 2006-12-19 | Advanced Bionics Corporation | Treatment of movement disorders by brain stimulation |
| US7003352B1 (en) | 2002-05-24 | 2006-02-21 | Advanced Bionics Corporation | Treatment of epilepsy by brain stimulation |
| US7136518B2 (en) | 2003-04-18 | 2006-11-14 | Medispectra, Inc. | Methods and apparatus for displaying diagnostic data |
| AU2003263003A1 (en) | 2002-08-29 | 2004-03-19 | Computerized Medical Systems, Inc. | Methods and systems for localizing of a medical imaging probe and of a biopsy needle |
| US7218968B2 (en) | 2002-10-31 | 2007-05-15 | Medtronic, Inc. | User interface for programming rate response technical field |
| WO2004041080A2 (en) | 2002-10-31 | 2004-05-21 | Medtronic, Inc. | Body region indication |
| US7181286B2 (en) | 2002-10-31 | 2007-02-20 | Medtronic, Inc. | Distributed system for neurostimulation therapy programming |
| US7146219B2 (en) | 2002-10-31 | 2006-12-05 | Medtronic, Inc. | Applying filter information to identify combinations of electrodes |
| US7216000B2 (en) | 2002-10-31 | 2007-05-08 | Medtronic, Inc. | Neurostimulation therapy manipulation |
| US7035690B2 (en) | 2002-11-15 | 2006-04-25 | Medtronic, Inc. | Human-implantable-neurostimulator user interface having multiple levels of abstraction |
| US7043293B1 (en) | 2002-12-24 | 2006-05-09 | Cardiodynamics International Corporation | Method and apparatus for waveform assessment |
| US7001357B2 (en) | 2003-02-07 | 2006-02-21 | Berry Sr Donald P | Baby safe feeder with integrally fitted food container |
| US7155279B2 (en) | 2003-03-28 | 2006-12-26 | Advanced Bionics Corporation | Treatment of movement disorders with drug therapy |
| US7894908B2 (en) | 2003-04-02 | 2011-02-22 | Medtronic, Inc. | Neurostimulation therapy optimization based on a rated session log |
| US7548786B2 (en) | 2003-04-02 | 2009-06-16 | Medtronic, Inc. | Library for management of neurostimulation therapy programs |
| US7505815B2 (en) | 2003-04-02 | 2009-03-17 | Medtronic, Inc. | Neurostimulation therapy usage diagnostics |
| US7489970B2 (en) | 2003-04-02 | 2009-02-10 | Medtronic, Inc. | Management of neurostimulation therapy using parameter sets |
| US7266412B2 (en) | 2003-04-22 | 2007-09-04 | Medtronic, Inc. | Generation of multiple neurostimulation therapy programs |
| US7463928B2 (en) | 2003-04-25 | 2008-12-09 | Medtronic, Inc. | Identifying combinations of electrodes for neurostimulation therapy |
| US7167760B2 (en) | 2003-04-28 | 2007-01-23 | Vanderbilt University | Apparatus and methods of optimal placement of deep brain stimulator |
| EP1638459A2 (en) | 2003-06-11 | 2006-03-29 | Case Western Reserve University | Computer-aided-design of skeletal implants |
| US7313430B2 (en) | 2003-08-28 | 2007-12-25 | Medtronic Navigation, Inc. | Method and apparatus for performing stereotactic surgery |
| US8396565B2 (en) | 2003-09-15 | 2013-03-12 | Medtronic, Inc. | Automatic therapy adjustments |
| US7239926B2 (en) | 2003-09-15 | 2007-07-03 | Medtronic, Inc. | Selection of neurostimulator parameter configurations using genetic algorithms |
| US7252090B2 (en) | 2003-09-15 | 2007-08-07 | Medtronic, Inc. | Selection of neurostimulator parameter configurations using neural network |
| US7617002B2 (en) | 2003-09-15 | 2009-11-10 | Medtronic, Inc. | Selection of neurostimulator parameter configurations using decision trees |
| US7184837B2 (en) | 2003-09-15 | 2007-02-27 | Medtronic, Inc. | Selection of neurostimulator parameter configurations using bayesian networks |
| JP2005103055A (en) | 2003-09-30 | 2005-04-21 | Konica Minolta Medical & Graphic Inc | Medical image processor |
| JP4403453B2 (en) | 2003-11-13 | 2010-01-27 | 株式会社島津製作所 | Method for converting head surface coordinates into brain surface coordinates, and transcranial brain function measuring device using the converted data |
| WO2005053789A2 (en) | 2003-11-25 | 2005-06-16 | Advanced Neuromodulation Systems, Inc. | Directional stimulation lead and orientation system, and improved percutaneous-insertion needle and method of implanting a lead |
| US7295876B1 (en) | 2004-03-04 | 2007-11-13 | Advanced Neuromodulation Systems, Inc. | System and method for generating and testing treatment protocols |
| US7254446B1 (en) | 2004-03-04 | 2007-08-07 | Advanced Neuromodulation Systems, Inc. | System and method for stimulus calibration for an implantable pulse generator |
| US8308661B2 (en) | 2004-03-16 | 2012-11-13 | Medtronic, Inc. | Collecting activity and sleep quality information via a medical device |
| US7596399B2 (en) | 2004-04-29 | 2009-09-29 | Medtronic, Inc | Implantation of implantable medical device |
| US7346382B2 (en) | 2004-07-07 | 2008-03-18 | The Cleveland Clinic Foundation | Brain stimulation models, systems, devices, and methods |
| US8180601B2 (en) | 2006-03-09 | 2012-05-15 | The Cleveland Clinic Foundation | Systems and methods for determining volume of activation for deep brain stimulation |
| US8209027B2 (en) | 2004-07-07 | 2012-06-26 | The Cleveland Clinic Foundation | System and method to design structure for delivering electrical energy to tissue |
| US7819909B2 (en) * | 2004-07-20 | 2010-10-26 | Medtronic, Inc. | Therapy programming guidance based on stored programming history |
| US8694115B2 (en) | 2004-07-20 | 2014-04-08 | Medtronic, Inc. | Therapy programming guidance based on stored programming history |
| US7257447B2 (en) | 2005-04-20 | 2007-08-14 | Cardiac Pacemakers, Inc. | Method and apparatus for indication-based programming of cardiac rhythm management devices |
| WO2006119046A1 (en) | 2005-04-30 | 2006-11-09 | Medtronic, Inc. | Impedance-based stimulation adjustment |
| EP1894090A2 (en) | 2005-06-16 | 2008-03-05 | Michael J. Russell | Guided electrical transcranial stimulation (gets) technique |
| SG129351A1 (en) | 2005-07-22 | 2007-02-26 | Inventio Ag | Lift installation with a support means end connection and a support means, and a method of fasteningan end of a support means in a lift installation |
| US20070049817A1 (en) | 2005-08-30 | 2007-03-01 | Assaf Preiss | Segmentation and registration of multimodal images using physiological data |
| US7766840B2 (en) * | 2005-12-01 | 2010-08-03 | Cardiac Pacemakers, Inc. | Method and system for heart failure status evaluation based on a disordered breathing index |
| US8016776B2 (en) | 2005-12-02 | 2011-09-13 | Medtronic, Inc. | Wearable ambulatory data recorder |
| US7957808B2 (en) | 2006-01-13 | 2011-06-07 | Vanderbilt University | System and methods of deep brain stimulation for post-operation patients |
| US20070191912A1 (en) | 2006-02-10 | 2007-08-16 | Vision Quest Industries, Inc. | Interactive electrical stimulator device and server-based support system |
| US7869854B2 (en) | 2006-02-23 | 2011-01-11 | Magnetecs, Inc. | Apparatus for magnetically deployable catheter with MOSFET sensor and method for mapping and ablation |
| US20070203538A1 (en) | 2006-02-24 | 2007-08-30 | Medtronic, Inc. | User interface with an atlas for configuring stimulation therapy |
| US7676273B2 (en) | 2006-02-24 | 2010-03-09 | Medtronic, Inc. | Stimulation templates for programming a stimulation lead with complex electrode array geometry |
| US7822483B2 (en) | 2006-02-24 | 2010-10-26 | Medtronic, Inc. | Electrical and activation field models for configuring stimulation therapy |
| US8612024B2 (en) | 2006-02-24 | 2013-12-17 | Medtronic, Inc. | User interface with 3D environment for configuring stimulation therapy |
| US8452415B2 (en) | 2006-02-24 | 2013-05-28 | Medtronic, Inc. | Electrical and activation field models for programming a stimulation lead with complex electrode array geometry |
| US8543217B2 (en) | 2006-02-24 | 2013-09-24 | Medtronic, Inc. | Stimulation templates for configuring stimulation therapy |
| US7657319B2 (en) | 2006-02-24 | 2010-02-02 | Medtronic, Inc. | Programming interface with an unwrapped 2D view of a stimulation lead with complex electrode array geometry |
| US7826902B2 (en) | 2006-02-24 | 2010-11-02 | Medtronic, Inc. | User interface with 2D views for configuring stimulation therapy |
| US8380321B2 (en) | 2006-02-24 | 2013-02-19 | Medtronic, Inc. | Programming interface with a cross-sectional view of a stimulation lead with complex electrode array geometry |
| US7848802B2 (en) | 2006-02-24 | 2010-12-07 | Medtronic, Inc. | Programming interface with a concentric axial view of a stimulation lead with complex electrode array geometry |
| US9067076B2 (en) | 2006-03-09 | 2015-06-30 | Medtronic, Inc. | Management of multiple stimulation program groups |
| US7747330B2 (en) | 2006-03-09 | 2010-06-29 | Medtronic, Inc. | Global parameter adjustment for multiple stimulation programs |
| US8010203B2 (en) | 2006-03-23 | 2011-08-30 | Medtronic, Inc. | Guided programming with feedback |
| US8712539B2 (en) | 2006-04-12 | 2014-04-29 | Medtronic, Inc. | Rule-based stimulation program search |
| US7774067B2 (en) | 2006-04-12 | 2010-08-10 | Medtronic, Inc. | Autogeneration of neurostimulation therapy program groups |
| US8306624B2 (en) | 2006-04-28 | 2012-11-06 | Medtronic, Inc. | Patient-individualized efficacy rating |
| US8380300B2 (en) | 2006-04-28 | 2013-02-19 | Medtronic, Inc. | Efficacy visualization |
| US8160676B2 (en) | 2006-09-08 | 2012-04-17 | Medtronic, Inc. | Method for planning a surgical procedure |
| US8160677B2 (en) | 2006-09-08 | 2012-04-17 | Medtronic, Inc. | Method for identification of anatomical landmarks |
| US8660635B2 (en) | 2006-09-29 | 2014-02-25 | Medtronic, Inc. | Method and apparatus for optimizing a computer assisted surgical procedure |
| US7729760B2 (en) | 2006-10-27 | 2010-06-01 | Cyberonics, Inc. | Patient management system for providing parameter data for an implantable medical device |
| US8321808B2 (en) | 2006-12-06 | 2012-11-27 | Medtronic, Inc. | User interface with toolbar for programming electrical stimulation therapy |
| WO2008070033A2 (en) | 2006-12-06 | 2008-06-12 | Medtronic, Inc. | Operating environment monitor for medical device programming |
| US8082034B2 (en) | 2007-01-26 | 2011-12-20 | Medtronic, Inc. | Graphical configuration of electrodes for electrical stimulation |
| US8014578B2 (en) | 2007-02-05 | 2011-09-06 | General Electric Company | Method and system for image segmentation using models |
| US8010177B2 (en) | 2007-04-24 | 2011-08-30 | Medtronic, Inc. | Intraoperative image registration |
| US8140167B2 (en) | 2007-05-31 | 2012-03-20 | Enteromedics, Inc. | Implantable therapy system with external component having multiple operating modes |
| US8376943B2 (en) | 2007-09-24 | 2013-02-19 | Medtronic, Inc. | Patient event information |
| US8380314B2 (en) | 2007-09-26 | 2013-02-19 | Medtronic, Inc. | Patient directed therapy control |
| US9452288B2 (en) | 2007-12-06 | 2016-09-27 | Boston Scientific Neuromodulation Corporation | Multimodal neurostimulation systems and methods |
| EP2237809A2 (en) | 2008-01-18 | 2010-10-13 | Porex Surgical, Inc. | Composite implants and methods of making and using the same |
| US8862240B2 (en) | 2008-01-31 | 2014-10-14 | Medtronic, Inc. | Automated programming of electrical stimulation electrodes using post-implant imaging |
| US9220889B2 (en) | 2008-02-11 | 2015-12-29 | Intelect Medical, Inc. | Directional electrode devices with locating features |
| WO2009137121A1 (en) | 2008-05-09 | 2009-11-12 | Medtronic, Inc. | Programming techniques for peripheral nerve field stimulation |
| US9498622B2 (en) | 2008-05-09 | 2016-11-22 | Medtronic, Inc. | Programming techniques for peripheral nerve field stimulation |
| US9072905B2 (en) | 2008-05-15 | 2015-07-07 | Intelect Medical, Inc. | Clinician programmer system and method for steering volumes of activation |
| WO2010009072A1 (en) | 2008-07-14 | 2010-01-21 | Medtronic, Inc. | Improved interface for implantable medical device programming |
| EP2419171B1 (en) | 2009-04-13 | 2017-11-01 | Research Foundation Of The City University Of New York | Neurocranial electrostimulation models |
| CA2772330A1 (en) | 2009-08-27 | 2011-03-03 | The Cleveland Clinic Foundation | System and method to estimate region of tissue activation |
| AU2011248594B2 (en) | 2010-04-27 | 2015-07-16 | Spr Therapeutics, Inc. | Systems and methods for percutaneous electrical stimulation |
| US8913804B2 (en) | 2010-06-14 | 2014-12-16 | Boston Scientific Neuromodulation Corporation | Programming interface for spinal cord neuromodulation |
| ES2900585T3 (en) * | 2011-05-27 | 2022-03-17 | Boston Scient Neuromodulation Corp | Collection of clinical data for graphic representation and analysis |
-
2014
- 2014-03-14 JP JP2016502749A patent/JP6185142B2/en not_active Expired - Fee Related
- 2014-03-14 US US14/212,730 patent/US9474903B2/en active Active
- 2014-03-14 EP EP14719164.7A patent/EP2968952B1/en active Active
- 2014-03-14 WO PCT/US2014/028264 patent/WO2014144029A2/en active Application Filing
- 2014-03-14 AU AU2014227964A patent/AU2014227964B2/en not_active Expired - Fee Related
Non-Patent Citations (1)
| Title |
|---|
| None * |
Also Published As
| Publication number | Publication date |
|---|---|
| JP2016517327A (en) | 2016-06-16 |
| EP2968952A2 (en) | 2016-01-20 |
| WO2014144029A2 (en) | 2014-09-18 |
| AU2014227964B2 (en) | 2016-12-15 |
| JP6185142B2 (en) | 2017-08-23 |
| US9474903B2 (en) | 2016-10-25 |
| AU2014227964A1 (en) | 2015-10-01 |
| WO2014144029A3 (en) | 2015-01-08 |
| US20140277284A1 (en) | 2014-09-18 |
Similar Documents
| Publication | Publication Date | Title |
|---|---|---|
| EP2968952B1 (en) | Clinical response data mapping | |
| US9592389B2 (en) | Visualization of relevant stimulation leadwire electrodes relative to selected stimulation information | |
| US20240157157A1 (en) | Point-and-click programming for deep brain stimulation using real-time monopolar review trendlines | |
| WO2014143709A1 (en) | Visualization of relevant stimulation leadwire electrodes relative to selected stimulation information |
Legal Events
| Date | Code | Title | Description |
|---|---|---|---|
| PUAI | Public reference made under article 153(3) epc to a published international application that has entered the european phase |
Free format text: ORIGINAL CODE: 0009012 |
|
| 17P | Request for examination filed |
Effective date: 20151008 |
|
| AK | Designated contracting states |
Kind code of ref document: A2 Designated state(s): AL AT BE BG CH CY CZ DE DK EE ES FI FR GB GR HR HU IE IS IT LI LT LU LV MC MK MT NL NO PL PT RO RS SE SI SK SM TR |
|
| AX | Request for extension of the european patent |
Extension state: BA ME |
|
| RIN1 | Information on inventor provided before grant (corrected) |
Inventor name: KOTHANDARAMAN, SRIDHAR Inventor name: LUBENSKY, DAVID ARI Inventor name: LUI, MUN POOK Inventor name: VANSICKLE, DENNIS ALLEN Inventor name: CHEN, DEAN Inventor name: HOFFER, BRIAN JAMES Inventor name: MOFFITT, MICHAEL A. |
|
| DAX | Request for extension of the european patent (deleted) | ||
| STAA | Information on the status of an ep patent application or granted ep patent |
Free format text: STATUS: EXAMINATION IS IN PROGRESS |
|
| 17Q | First examination report despatched |
Effective date: 20170327 |
|
| RIC1 | Information provided on ipc code assigned before grant |
Ipc: A61N 1/36 20060101ALI20171215BHEP Ipc: A61N 1/372 20060101AFI20171215BHEP |
|
| GRAP | Despatch of communication of intention to grant a patent |
Free format text: ORIGINAL CODE: EPIDOSNIGR1 |
|
| STAA | Information on the status of an ep patent application or granted ep patent |
Free format text: STATUS: GRANT OF PATENT IS INTENDED |
|
| INTG | Intention to grant announced |
Effective date: 20180206 |
|
| RIN1 | Information on inventor provided before grant (corrected) |
Inventor name: VANSICKLE, DENNIS ALLEN Inventor name: KOTHANDARAMAN, SRIDHAR Inventor name: LUI, MUN POOK Inventor name: LUBENSKY, DAVID ARI Inventor name: HOFFER, BRIAN JAMES Inventor name: CHEN, DEAN Inventor name: MOFFITT, MICHAEL A. |
|
| GRAS | Grant fee paid |
Free format text: ORIGINAL CODE: EPIDOSNIGR3 |
|
| GRAA | (expected) grant |
Free format text: ORIGINAL CODE: 0009210 |
|
| STAA | Information on the status of an ep patent application or granted ep patent |
Free format text: STATUS: THE PATENT HAS BEEN GRANTED |
|
| AK | Designated contracting states |
Kind code of ref document: B1 Designated state(s): AL AT BE BG CH CY CZ DE DK EE ES FI FR GB GR HR HU IE IS IT LI LT LU LV MC MK MT NL NO PL PT RO RS SE SI SK SM TR |
|
| REG | Reference to a national code |
Ref country code: GB Ref legal event code: FG4D |
|
| REG | Reference to a national code |
Ref country code: CH Ref legal event code: EP |
|
| REG | Reference to a national code |
Ref country code: AT Ref legal event code: REF Ref document number: 1016264 Country of ref document: AT Kind code of ref document: T Effective date: 20180715 |
|
| REG | Reference to a national code |
Ref country code: IE Ref legal event code: FG4D |
|
| REG | Reference to a national code |
Ref country code: DE Ref legal event code: R096 Ref document number: 602014028253 Country of ref document: DE |
|
| REG | Reference to a national code |
Ref country code: NL Ref legal event code: FP |
|
| REG | Reference to a national code |
Ref country code: LT Ref legal event code: MG4D |
|
| REG | Reference to a national code |
Ref country code: AT Ref legal event code: MK05 Ref document number: 1016264 Country of ref document: AT Kind code of ref document: T Effective date: 20180711 |
|
| PG25 | Lapsed in a contracting state [announced via postgrant information from national office to epo] |
Ref country code: NO Free format text: LAPSE BECAUSE OF FAILURE TO SUBMIT A TRANSLATION OF THE DESCRIPTION OR TO PAY THE FEE WITHIN THE PRESCRIBED TIME-LIMIT Effective date: 20181011 Ref country code: GR Free format text: LAPSE BECAUSE OF FAILURE TO SUBMIT A TRANSLATION OF THE DESCRIPTION OR TO PAY THE FEE WITHIN THE PRESCRIBED TIME-LIMIT Effective date: 20181012 Ref country code: BG Free format text: LAPSE BECAUSE OF FAILURE TO SUBMIT A TRANSLATION OF THE DESCRIPTION OR TO PAY THE FEE WITHIN THE PRESCRIBED TIME-LIMIT Effective date: 20181011 Ref country code: AT Free format text: LAPSE BECAUSE OF FAILURE TO SUBMIT A TRANSLATION OF THE DESCRIPTION OR TO PAY THE FEE WITHIN THE PRESCRIBED TIME-LIMIT Effective date: 20180711 Ref country code: FI Free format text: LAPSE BECAUSE OF FAILURE TO SUBMIT A TRANSLATION OF THE DESCRIPTION OR TO PAY THE FEE WITHIN THE PRESCRIBED TIME-LIMIT Effective date: 20180711 Ref country code: RS Free format text: LAPSE BECAUSE OF FAILURE TO SUBMIT A TRANSLATION OF THE DESCRIPTION OR TO PAY THE FEE WITHIN THE PRESCRIBED TIME-LIMIT Effective date: 20180711 Ref country code: IS Free format text: LAPSE BECAUSE OF FAILURE TO SUBMIT A TRANSLATION OF THE DESCRIPTION OR TO PAY THE FEE WITHIN THE PRESCRIBED TIME-LIMIT Effective date: 20181111 Ref country code: PL Free format text: LAPSE BECAUSE OF FAILURE TO SUBMIT A TRANSLATION OF THE DESCRIPTION OR TO PAY THE FEE WITHIN THE PRESCRIBED TIME-LIMIT Effective date: 20180711 Ref country code: LT Free format text: LAPSE BECAUSE OF FAILURE TO SUBMIT A TRANSLATION OF THE DESCRIPTION OR TO PAY THE FEE WITHIN THE PRESCRIBED TIME-LIMIT Effective date: 20180711 Ref country code: SE Free format text: LAPSE BECAUSE OF FAILURE TO SUBMIT A TRANSLATION OF THE DESCRIPTION OR TO PAY THE FEE WITHIN THE PRESCRIBED TIME-LIMIT Effective date: 20180711 |
|
| PG25 | Lapsed in a contracting state [announced via postgrant information from national office to epo] |
Ref country code: AL Free format text: LAPSE BECAUSE OF FAILURE TO SUBMIT A TRANSLATION OF THE DESCRIPTION OR TO PAY THE FEE WITHIN THE PRESCRIBED TIME-LIMIT Effective date: 20180711 Ref country code: LV Free format text: LAPSE BECAUSE OF FAILURE TO SUBMIT A TRANSLATION OF THE DESCRIPTION OR TO PAY THE FEE WITHIN THE PRESCRIBED TIME-LIMIT Effective date: 20180711 Ref country code: ES Free format text: LAPSE BECAUSE OF FAILURE TO SUBMIT A TRANSLATION OF THE DESCRIPTION OR TO PAY THE FEE WITHIN THE PRESCRIBED TIME-LIMIT Effective date: 20180711 Ref country code: HR Free format text: LAPSE BECAUSE OF FAILURE TO SUBMIT A TRANSLATION OF THE DESCRIPTION OR TO PAY THE FEE WITHIN THE PRESCRIBED TIME-LIMIT Effective date: 20180711 |
|
| REG | Reference to a national code |
Ref country code: DE Ref legal event code: R097 Ref document number: 602014028253 Country of ref document: DE |
|
| PG25 | Lapsed in a contracting state [announced via postgrant information from national office to epo] |
Ref country code: EE Free format text: LAPSE BECAUSE OF FAILURE TO SUBMIT A TRANSLATION OF THE DESCRIPTION OR TO PAY THE FEE WITHIN THE PRESCRIBED TIME-LIMIT Effective date: 20180711 Ref country code: IT Free format text: LAPSE BECAUSE OF FAILURE TO SUBMIT A TRANSLATION OF THE DESCRIPTION OR TO PAY THE FEE WITHIN THE PRESCRIBED TIME-LIMIT Effective date: 20180711 Ref country code: CZ Free format text: LAPSE BECAUSE OF FAILURE TO SUBMIT A TRANSLATION OF THE DESCRIPTION OR TO PAY THE FEE WITHIN THE PRESCRIBED TIME-LIMIT Effective date: 20180711 Ref country code: RO Free format text: LAPSE BECAUSE OF FAILURE TO SUBMIT A TRANSLATION OF THE DESCRIPTION OR TO PAY THE FEE WITHIN THE PRESCRIBED TIME-LIMIT Effective date: 20180711 |
|
| PLBE | No opposition filed within time limit |
Free format text: ORIGINAL CODE: 0009261 |
|
| STAA | Information on the status of an ep patent application or granted ep patent |
Free format text: STATUS: NO OPPOSITION FILED WITHIN TIME LIMIT |
|
| PG25 | Lapsed in a contracting state [announced via postgrant information from national office to epo] |
Ref country code: SM Free format text: LAPSE BECAUSE OF FAILURE TO SUBMIT A TRANSLATION OF THE DESCRIPTION OR TO PAY THE FEE WITHIN THE PRESCRIBED TIME-LIMIT Effective date: 20180711 Ref country code: DK Free format text: LAPSE BECAUSE OF FAILURE TO SUBMIT A TRANSLATION OF THE DESCRIPTION OR TO PAY THE FEE WITHIN THE PRESCRIBED TIME-LIMIT Effective date: 20180711 Ref country code: SK Free format text: LAPSE BECAUSE OF FAILURE TO SUBMIT A TRANSLATION OF THE DESCRIPTION OR TO PAY THE FEE WITHIN THE PRESCRIBED TIME-LIMIT Effective date: 20180711 |
|
| 26N | No opposition filed |
Effective date: 20190412 |
|
| PG25 | Lapsed in a contracting state [announced via postgrant information from national office to epo] |
Ref country code: SI Free format text: LAPSE BECAUSE OF FAILURE TO SUBMIT A TRANSLATION OF THE DESCRIPTION OR TO PAY THE FEE WITHIN THE PRESCRIBED TIME-LIMIT Effective date: 20180711 |
|
| PG25 | Lapsed in a contracting state [announced via postgrant information from national office to epo] |
Ref country code: MC Free format text: LAPSE BECAUSE OF FAILURE TO SUBMIT A TRANSLATION OF THE DESCRIPTION OR TO PAY THE FEE WITHIN THE PRESCRIBED TIME-LIMIT Effective date: 20180711 |
|
| REG | Reference to a national code |
Ref country code: CH Ref legal event code: PL |
|
| PG25 | Lapsed in a contracting state [announced via postgrant information from national office to epo] |
Ref country code: LU Free format text: LAPSE BECAUSE OF NON-PAYMENT OF DUE FEES Effective date: 20190314 |
|
| REG | Reference to a national code |
Ref country code: BE Ref legal event code: MM Effective date: 20190331 |
|
| PG25 | Lapsed in a contracting state [announced via postgrant information from national office to epo] |
Ref country code: CH Free format text: LAPSE BECAUSE OF NON-PAYMENT OF DUE FEES Effective date: 20190331 Ref country code: LI Free format text: LAPSE BECAUSE OF NON-PAYMENT OF DUE FEES Effective date: 20190331 Ref country code: IE Free format text: LAPSE BECAUSE OF NON-PAYMENT OF DUE FEES Effective date: 20190314 |
|
| PG25 | Lapsed in a contracting state [announced via postgrant information from national office to epo] |
Ref country code: BE Free format text: LAPSE BECAUSE OF NON-PAYMENT OF DUE FEES Effective date: 20190331 |
|
| PG25 | Lapsed in a contracting state [announced via postgrant information from national office to epo] |
Ref country code: TR Free format text: LAPSE BECAUSE OF FAILURE TO SUBMIT A TRANSLATION OF THE DESCRIPTION OR TO PAY THE FEE WITHIN THE PRESCRIBED TIME-LIMIT Effective date: 20180711 |
|
| PG25 | Lapsed in a contracting state [announced via postgrant information from national office to epo] |
Ref country code: MT Free format text: LAPSE BECAUSE OF NON-PAYMENT OF DUE FEES Effective date: 20190314 Ref country code: PT Free format text: LAPSE BECAUSE OF FAILURE TO SUBMIT A TRANSLATION OF THE DESCRIPTION OR TO PAY THE FEE WITHIN THE PRESCRIBED TIME-LIMIT Effective date: 20181111 |
|
| PG25 | Lapsed in a contracting state [announced via postgrant information from national office to epo] |
Ref country code: CY Free format text: LAPSE BECAUSE OF FAILURE TO SUBMIT A TRANSLATION OF THE DESCRIPTION OR TO PAY THE FEE WITHIN THE PRESCRIBED TIME-LIMIT Effective date: 20180711 |
|
| PG25 | Lapsed in a contracting state [announced via postgrant information from national office to epo] |
Ref country code: HU Free format text: LAPSE BECAUSE OF FAILURE TO SUBMIT A TRANSLATION OF THE DESCRIPTION OR TO PAY THE FEE WITHIN THE PRESCRIBED TIME-LIMIT; INVALID AB INITIO Effective date: 20140314 |
|
| PG25 | Lapsed in a contracting state [announced via postgrant information from national office to epo] |
Ref country code: MK Free format text: LAPSE BECAUSE OF FAILURE TO SUBMIT A TRANSLATION OF THE DESCRIPTION OR TO PAY THE FEE WITHIN THE PRESCRIBED TIME-LIMIT Effective date: 20180711 |
|
| PGFP | Annual fee paid to national office [announced via postgrant information from national office to epo] |
Ref country code: FR Payment date: 20230222 Year of fee payment: 10 |
|
| PGFP | Annual fee paid to national office [announced via postgrant information from national office to epo] |
Ref country code: NL Payment date: 20240220 Year of fee payment: 11 |
|
| PGFP | Annual fee paid to national office [announced via postgrant information from national office to epo] |
Ref country code: DE Payment date: 20240220 Year of fee payment: 11 Ref country code: GB Payment date: 20240220 Year of fee payment: 11 |