EP2683643B1 - Prostate cancer cell lines, gene signatures and uses thereof - Google Patents
Prostate cancer cell lines, gene signatures and uses thereof Download PDFInfo
- Publication number
- EP2683643B1 EP2683643B1 EP12755544.9A EP12755544A EP2683643B1 EP 2683643 B1 EP2683643 B1 EP 2683643B1 EP 12755544 A EP12755544 A EP 12755544A EP 2683643 B1 EP2683643 B1 EP 2683643B1
- Authority
- EP
- European Patent Office
- Prior art keywords
- prostate
- prostate cancer
- oncogene
- cancer
- tumor
- Prior art date
- Legal status (The legal status is an assumption and is not a legal conclusion. Google has not performed a legal analysis and makes no representation as to the accuracy of the status listed.)
- Active
Links
- 206010060862 Prostate cancer Diseases 0.000 title claims description 127
- 208000000236 Prostatic Neoplasms Diseases 0.000 title claims description 126
- 230000004547 gene signature Effects 0.000 title description 12
- 206010028980 Neoplasm Diseases 0.000 claims description 127
- 206010027476 Metastases Diseases 0.000 claims description 59
- 230000009401 metastasis Effects 0.000 claims description 59
- 201000011510 cancer Diseases 0.000 claims description 43
- 238000011282 treatment Methods 0.000 claims description 22
- 210000000988 bone and bone Anatomy 0.000 claims description 18
- 210000004556 brain Anatomy 0.000 claims description 15
- 239000003067 chemokine receptor CCR5 antagonist Substances 0.000 claims description 15
- GSNHKUDZZFZSJB-QYOOZWMWSA-N maraviroc Chemical group CC(C)C1=NN=C(C)N1[C@@H]1C[C@H](N2CC[C@H](NC(=O)C3CCC(F)(F)CC3)C=3C=CC=CC=3)CC[C@H]2C1 GSNHKUDZZFZSJB-QYOOZWMWSA-N 0.000 claims description 12
- 229960004710 maraviroc Drugs 0.000 claims description 12
- 210000004072 lung Anatomy 0.000 claims description 10
- 210000004185 liver Anatomy 0.000 claims description 8
- 230000002401 inhibitory effect Effects 0.000 claims description 7
- 210000003734 kidney Anatomy 0.000 claims description 5
- 210000000056 organ Anatomy 0.000 claims description 4
- CNPVJJQCETWNEU-CYFREDJKSA-N (4,6-dimethyl-5-pyrimidinyl)-[4-[(3S)-4-[(1R)-2-methoxy-1-[4-(trifluoromethyl)phenyl]ethyl]-3-methyl-1-piperazinyl]-4-methyl-1-piperidinyl]methanone Chemical compound N([C@@H](COC)C=1C=CC(=CC=1)C(F)(F)F)([C@H](C1)C)CCN1C(CC1)(C)CCN1C(=O)C1=C(C)N=CN=C1C CNPVJJQCETWNEU-CYFREDJKSA-N 0.000 claims description 3
- 229950009860 vicriviroc Drugs 0.000 claims description 3
- 210000004100 adrenal gland Anatomy 0.000 claims description 2
- 210000003932 urinary bladder Anatomy 0.000 claims description 2
- 210000004027 cell Anatomy 0.000 description 202
- 108700020796 Oncogene Proteins 0.000 description 124
- 108090000623 proteins and genes Proteins 0.000 description 106
- 230000014509 gene expression Effects 0.000 description 86
- 210000000064 prostate epithelial cell Anatomy 0.000 description 84
- 102100038895 Myc proto-oncogene protein Human genes 0.000 description 72
- 101710135898 Myc proto-oncogene protein Proteins 0.000 description 72
- 101710150448 Transcriptional regulator Myc Proteins 0.000 description 72
- 241000699670 Mus sp. Species 0.000 description 63
- 102100029974 GTPase HRas Human genes 0.000 description 56
- 101000584633 Homo sapiens GTPase HRas Proteins 0.000 description 56
- UIIMBOGNXHQVGW-UHFFFAOYSA-M Sodium bicarbonate Chemical compound [Na+].OC([O-])=O UIIMBOGNXHQVGW-UHFFFAOYSA-M 0.000 description 47
- 210000002307 prostate Anatomy 0.000 description 40
- 238000000034 method Methods 0.000 description 38
- 208000023958 prostate neoplasm Diseases 0.000 description 32
- 102000001332 SRC Human genes 0.000 description 29
- 108060006706 SRC Proteins 0.000 description 29
- 239000000523 sample Substances 0.000 description 28
- 239000013598 vector Substances 0.000 description 27
- 108010072866 Prostate-Specific Antigen Proteins 0.000 description 25
- 102100038358 Prostate-specific antigen Human genes 0.000 description 25
- 230000002068 genetic effect Effects 0.000 description 25
- 238000010186 staining Methods 0.000 description 24
- 201000010099 disease Diseases 0.000 description 23
- 208000037265 diseases, disorders, signs and symptoms Diseases 0.000 description 23
- 108010058765 Oncogene Protein pp60(v-src) Proteins 0.000 description 21
- 102000043276 Oncogene Human genes 0.000 description 20
- 238000002474 experimental method Methods 0.000 description 20
- 238000001727 in vivo Methods 0.000 description 20
- 210000002919 epithelial cell Anatomy 0.000 description 19
- 238000012360 testing method Methods 0.000 description 19
- 238000011771 FVB mouse Methods 0.000 description 18
- 238000004458 analytical method Methods 0.000 description 18
- 210000001519 tissue Anatomy 0.000 description 18
- 241001465754 Metazoa Species 0.000 description 17
- 239000003446 ligand Substances 0.000 description 17
- 206010061289 metastatic neoplasm Diseases 0.000 description 17
- 238000002493 microarray Methods 0.000 description 17
- 241000699666 Mus <mouse, genus> Species 0.000 description 16
- 210000002950 fibroblast Anatomy 0.000 description 16
- 108010047303 von Willebrand Factor Proteins 0.000 description 15
- 102100036537 von Willebrand factor Human genes 0.000 description 15
- 206010006187 Breast cancer Diseases 0.000 description 14
- 102100035875 C-C chemokine receptor type 5 Human genes 0.000 description 14
- 101710149870 C-C chemokine receptor type 5 Proteins 0.000 description 14
- 229960001134 von willebrand factor Drugs 0.000 description 14
- 229920001817 Agar Polymers 0.000 description 13
- 241001529936 Murinae Species 0.000 description 13
- 239000008272 agar Substances 0.000 description 13
- 150000001875 compounds Chemical class 0.000 description 13
- 230000001177 retroviral effect Effects 0.000 description 13
- 230000000694 effects Effects 0.000 description 12
- 230000004907 flux Effects 0.000 description 12
- 239000007925 intracardiac injection Substances 0.000 description 12
- 230000001394 metastastic effect Effects 0.000 description 11
- 102000016914 ras Proteins Human genes 0.000 description 11
- 108010014186 ras Proteins Proteins 0.000 description 11
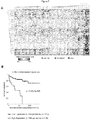
- 230000004083 survival effect Effects 0.000 description 11
- 238000003556 assay Methods 0.000 description 10
- 239000000090 biomarker Substances 0.000 description 10
- 239000007924 injection Substances 0.000 description 10
- 238000002347 injection Methods 0.000 description 10
- 230000000010 osteolytic effect Effects 0.000 description 10
- 102100032367 C-C motif chemokine 5 Human genes 0.000 description 9
- 101000797762 Homo sapiens C-C motif chemokine 5 Proteins 0.000 description 9
- 230000012010 growth Effects 0.000 description 9
- 238000003384 imaging method Methods 0.000 description 9
- 108010082117 matrigel Proteins 0.000 description 9
- 108091003079 Bovine Serum Albumin Proteins 0.000 description 8
- 239000006144 Dulbecco’s modified Eagle's medium Substances 0.000 description 8
- 230000029918 bioluminescence Effects 0.000 description 8
- 238000005415 bioluminescence Methods 0.000 description 8
- 239000012091 fetal bovine serum Substances 0.000 description 8
- 239000003112 inhibitor Substances 0.000 description 8
- 102000005962 receptors Human genes 0.000 description 8
- 108020003175 receptors Proteins 0.000 description 8
- 238000010361 transduction Methods 0.000 description 8
- 230000026683 transduction Effects 0.000 description 8
- 108020001507 fusion proteins Proteins 0.000 description 7
- 102000037865 fusion proteins Human genes 0.000 description 7
- 239000002609 medium Substances 0.000 description 7
- 108020004707 nucleic acids Proteins 0.000 description 7
- 102000039446 nucleic acids Human genes 0.000 description 7
- 150000007523 nucleic acids Chemical class 0.000 description 7
- 238000012216 screening Methods 0.000 description 7
- PUZPDOWCWNUUKD-UHFFFAOYSA-M sodium fluoride Chemical compound [F-].[Na+] PUZPDOWCWNUUKD-UHFFFAOYSA-M 0.000 description 7
- 238000007920 subcutaneous administration Methods 0.000 description 7
- 238000011830 transgenic mouse model Methods 0.000 description 7
- 230000003827 upregulation Effects 0.000 description 7
- 238000001262 western blot Methods 0.000 description 7
- 241000699660 Mus musculus Species 0.000 description 6
- 108010032050 Tartrate-Resistant Acid Phosphatase Proteins 0.000 description 6
- 102000007591 Tartrate-Resistant Acid Phosphatase Human genes 0.000 description 6
- 230000008859 change Effects 0.000 description 6
- 230000009545 invasion Effects 0.000 description 6
- 239000000203 mixture Substances 0.000 description 6
- 210000005267 prostate cell Anatomy 0.000 description 6
- 102000004169 proteins and genes Human genes 0.000 description 6
- 239000013589 supplement Substances 0.000 description 6
- 238000002560 therapeutic procedure Methods 0.000 description 6
- 210000004881 tumor cell Anatomy 0.000 description 6
- 230000004614 tumor growth Effects 0.000 description 6
- 108091032973 (ribonucleotides)n+m Proteins 0.000 description 5
- 102100034871 C-C motif chemokine 8 Human genes 0.000 description 5
- 102000004127 Cytokines Human genes 0.000 description 5
- 108090000695 Cytokines Proteins 0.000 description 5
- 108020004414 DNA Proteins 0.000 description 5
- 101000946794 Homo sapiens C-C motif chemokine 8 Proteins 0.000 description 5
- 206010027458 Metastases to lung Diseases 0.000 description 5
- 102100040557 Osteopontin Human genes 0.000 description 5
- 230000027455 binding Effects 0.000 description 5
- 210000004369 blood Anatomy 0.000 description 5
- 239000008280 blood Substances 0.000 description 5
- 238000004113 cell culture Methods 0.000 description 5
- 238000001514 detection method Methods 0.000 description 5
- 239000003814 drug Substances 0.000 description 5
- YQGOJNYOYNNSMM-UHFFFAOYSA-N eosin Chemical compound [Na+].OC(=O)C1=CC=CC=C1C1=C2C=C(Br)C(=O)C(Br)=C2OC2=C(Br)C(O)=C(Br)C=C21 YQGOJNYOYNNSMM-UHFFFAOYSA-N 0.000 description 5
- 238000002513 implantation Methods 0.000 description 5
- 239000012528 membrane Substances 0.000 description 5
- 108091033319 polynucleotide Proteins 0.000 description 5
- 102000040430 polynucleotide Human genes 0.000 description 5
- 239000002157 polynucleotide Substances 0.000 description 5
- 206010061728 Bone lesion Diseases 0.000 description 4
- 208000026310 Breast neoplasm Diseases 0.000 description 4
- 102100032366 C-C motif chemokine 7 Human genes 0.000 description 4
- WZUVPPKBWHMQCE-UHFFFAOYSA-N Haematoxylin Natural products C12=CC(O)=C(O)C=C2CC2(O)C1C1=CC=C(O)C(O)=C1OC2 WZUVPPKBWHMQCE-UHFFFAOYSA-N 0.000 description 4
- 101000797758 Homo sapiens C-C motif chemokine 7 Proteins 0.000 description 4
- PIWKPBJCKXDKJR-UHFFFAOYSA-N Isoflurane Chemical compound FC(F)OC(Cl)C(F)(F)F PIWKPBJCKXDKJR-UHFFFAOYSA-N 0.000 description 4
- 208000008839 Kidney Neoplasms Diseases 0.000 description 4
- 206010027452 Metastases to bone Diseases 0.000 description 4
- 238000000692 Student's t-test Methods 0.000 description 4
- 239000012472 biological sample Substances 0.000 description 4
- 238000001574 biopsy Methods 0.000 description 4
- 239000013068 control sample Substances 0.000 description 4
- 230000003828 downregulation Effects 0.000 description 4
- 229940079593 drug Drugs 0.000 description 4
- 238000010195 expression analysis Methods 0.000 description 4
- 239000013604 expression vector Substances 0.000 description 4
- 230000006870 function Effects 0.000 description 4
- 238000009650 gentamicin protection assay Methods 0.000 description 4
- 230000002055 immunohistochemical effect Effects 0.000 description 4
- 229960002725 isoflurane Drugs 0.000 description 4
- 230000003902 lesion Effects 0.000 description 4
- 239000002502 liposome Substances 0.000 description 4
- 238000005259 measurement Methods 0.000 description 4
- 108020004999 messenger RNA Proteins 0.000 description 4
- 201000005825 prostate adenocarcinoma Diseases 0.000 description 4
- 238000011002 quantification Methods 0.000 description 4
- 230000000306 recurrent effect Effects 0.000 description 4
- 230000001105 regulatory effect Effects 0.000 description 4
- 230000035945 sensitivity Effects 0.000 description 4
- 239000011775 sodium fluoride Substances 0.000 description 4
- 239000007929 subcutaneous injection Substances 0.000 description 4
- 238000010254 subcutaneous injection Methods 0.000 description 4
- 239000005483 tyrosine kinase inhibitor Substances 0.000 description 4
- 210000002700 urine Anatomy 0.000 description 4
- 239000013603 viral vector Substances 0.000 description 4
- 208000018084 Bone neoplasm Diseases 0.000 description 3
- 102000009410 Chemokine receptor Human genes 0.000 description 3
- 108050000299 Chemokine receptor Proteins 0.000 description 3
- IGXWBGJHJZYPQS-SSDOTTSWSA-N D-Luciferin Chemical compound OC(=O)[C@H]1CSC(C=2SC3=CC=C(O)C=C3N=2)=N1 IGXWBGJHJZYPQS-SSDOTTSWSA-N 0.000 description 3
- IAZDPXIOMUYVGZ-UHFFFAOYSA-N Dimethylsulphoxide Chemical compound CS(C)=O IAZDPXIOMUYVGZ-UHFFFAOYSA-N 0.000 description 3
- 241000124008 Mammalia Species 0.000 description 3
- 241000700159 Rattus Species 0.000 description 3
- 102100030086 Receptor tyrosine-protein kinase erbB-2 Human genes 0.000 description 3
- 230000002159 abnormal effect Effects 0.000 description 3
- 230000004913 activation Effects 0.000 description 3
- 208000009956 adenocarcinoma Diseases 0.000 description 3
- 230000033115 angiogenesis Effects 0.000 description 3
- 239000005557 antagonist Substances 0.000 description 3
- 210000004204 blood vessel Anatomy 0.000 description 3
- 230000001413 cellular effect Effects 0.000 description 3
- 238000002512 chemotherapy Methods 0.000 description 3
- 230000002596 correlated effect Effects 0.000 description 3
- 230000034994 death Effects 0.000 description 3
- 231100000517 death Toxicity 0.000 description 3
- 238000003745 diagnosis Methods 0.000 description 3
- 238000001943 fluorescence-activated cell sorting Methods 0.000 description 3
- 239000012737 fresh medium Substances 0.000 description 3
- 238000001476 gene delivery Methods 0.000 description 3
- 239000001963 growth medium Substances 0.000 description 3
- 238000007490 hematoxylin and eosin (H&E) staining Methods 0.000 description 3
- 210000000987 immune system Anatomy 0.000 description 3
- 238000000338 in vitro Methods 0.000 description 3
- 238000011081 inoculation Methods 0.000 description 3
- 238000000370 laser capture micro-dissection Methods 0.000 description 3
- 210000003141 lower extremity Anatomy 0.000 description 3
- 210000004962 mammalian cell Anatomy 0.000 description 3
- 238000004519 manufacturing process Methods 0.000 description 3
- 238000010208 microarray analysis Methods 0.000 description 3
- 238000011580 nude mouse model Methods 0.000 description 3
- 238000002135 phase contrast microscopy Methods 0.000 description 3
- 230000002265 prevention Effects 0.000 description 3
- WOQIDNWTQOYDLF-RPWUZVMVSA-N quarfloxin Chemical compound CN1CCC[C@H]1CCNC(=O)C(C1=O)=CN2C3=C1C=C(F)C(N1C[C@@H](CC1)C=1N=CC=NC=1)=C3OC1=CC3=CC=CC=C3C=C12 WOQIDNWTQOYDLF-RPWUZVMVSA-N 0.000 description 3
- 150000003384 small molecules Chemical class 0.000 description 3
- 235000013024 sodium fluoride Nutrition 0.000 description 3
- PUZPDOWCWNUUKD-ULWFUOSBSA-M sodium;fluorine-18(1-) Chemical compound [18F-].[Na+] PUZPDOWCWNUUKD-ULWFUOSBSA-M 0.000 description 3
- 238000007619 statistical method Methods 0.000 description 3
- 238000001890 transfection Methods 0.000 description 3
- 230000005740 tumor formation Effects 0.000 description 3
- 229940121358 tyrosine kinase inhibitor Drugs 0.000 description 3
- WZUVPPKBWHMQCE-XJKSGUPXSA-N (+)-haematoxylin Chemical compound C12=CC(O)=C(O)C=C2C[C@]2(O)[C@H]1C1=CC=C(O)C(O)=C1OC2 WZUVPPKBWHMQCE-XJKSGUPXSA-N 0.000 description 2
- OZFAFGSSMRRTDW-UHFFFAOYSA-N (2,4-dichlorophenyl) benzenesulfonate Chemical compound ClC1=CC(Cl)=CC=C1OS(=O)(=O)C1=CC=CC=C1 OZFAFGSSMRRTDW-UHFFFAOYSA-N 0.000 description 2
- 241000283690 Bos taurus Species 0.000 description 2
- 208000003174 Brain Neoplasms Diseases 0.000 description 2
- 206010055113 Breast cancer metastatic Diseases 0.000 description 2
- 102100031151 C-C chemokine receptor type 2 Human genes 0.000 description 2
- 101710149815 C-C chemokine receptor type 2 Proteins 0.000 description 2
- 102100021943 C-C motif chemokine 2 Human genes 0.000 description 2
- 102000004274 CCR5 Receptors Human genes 0.000 description 2
- 108010017088 CCR5 Receptors Proteins 0.000 description 2
- 102100032912 CD44 antigen Human genes 0.000 description 2
- 201000009030 Carcinoma Diseases 0.000 description 2
- 108010035532 Collagen Proteins 0.000 description 2
- 102000008186 Collagen Human genes 0.000 description 2
- ZBNZXTGUTAYRHI-UHFFFAOYSA-N Dasatinib Chemical compound C=1C(N2CCN(CCO)CC2)=NC(C)=NC=1NC(S1)=NC=C1C(=O)NC1=C(C)C=CC=C1Cl ZBNZXTGUTAYRHI-UHFFFAOYSA-N 0.000 description 2
- 206010061819 Disease recurrence Diseases 0.000 description 2
- 239000012591 Dulbecco’s Phosphate Buffered Saline Substances 0.000 description 2
- KCXVZYZYPLLWCC-UHFFFAOYSA-N EDTA Chemical compound OC(=O)CN(CC(O)=O)CCN(CC(O)=O)CC(O)=O KCXVZYZYPLLWCC-UHFFFAOYSA-N 0.000 description 2
- 201000009051 Embryonal Carcinoma Diseases 0.000 description 2
- 206010019695 Hepatic neoplasm Diseases 0.000 description 2
- 101000868273 Homo sapiens CD44 antigen Proteins 0.000 description 2
- 101000942967 Homo sapiens Leukemia inhibitory factor Proteins 0.000 description 2
- 102000011782 Keratins Human genes 0.000 description 2
- 108010076876 Keratins Proteins 0.000 description 2
- 239000005411 L01XE02 - Gefitinib Substances 0.000 description 2
- 239000002136 L01XE07 - Lapatinib Substances 0.000 description 2
- 102100032352 Leukemia inhibitory factor Human genes 0.000 description 2
- 238000007807 Matrigel invasion assay Methods 0.000 description 2
- 108091034117 Oligonucleotide Proteins 0.000 description 2
- 208000003076 Osteolysis Diseases 0.000 description 2
- 102000004264 Osteopontin Human genes 0.000 description 2
- 108010081689 Osteopontin Proteins 0.000 description 2
- 101710100968 Receptor tyrosine-protein kinase erbB-2 Proteins 0.000 description 2
- 241000283984 Rodentia Species 0.000 description 2
- 206010039491 Sarcoma Diseases 0.000 description 2
- 241000700605 Viruses Species 0.000 description 2
- 238000002441 X-ray diffraction Methods 0.000 description 2
- 230000004075 alteration Effects 0.000 description 2
- 238000010171 animal model Methods 0.000 description 2
- 239000002246 antineoplastic agent Substances 0.000 description 2
- 238000003705 background correction Methods 0.000 description 2
- 230000008901 benefit Effects 0.000 description 2
- 210000000601 blood cell Anatomy 0.000 description 2
- 239000000872 buffer Substances 0.000 description 2
- 230000010261 cell growth Effects 0.000 description 2
- 229920001436 collagen Polymers 0.000 description 2
- 239000003636 conditioned culture medium Substances 0.000 description 2
- 230000000875 corresponding effect Effects 0.000 description 2
- 229960002448 dasatinib Drugs 0.000 description 2
- 230000003247 decreasing effect Effects 0.000 description 2
- 230000001419 dependent effect Effects 0.000 description 2
- 238000011161 development Methods 0.000 description 2
- 230000018109 developmental process Effects 0.000 description 2
- 238000013399 early diagnosis Methods 0.000 description 2
- 238000011156 evaluation Methods 0.000 description 2
- XGALLCVXEZPNRQ-UHFFFAOYSA-N gefitinib Chemical compound C=12C=C(OCCCN3CCOCC3)C(OC)=CC2=NC=NC=1NC1=CC=C(F)C(Cl)=C1 XGALLCVXEZPNRQ-UHFFFAOYSA-N 0.000 description 2
- PCHJSUWPFVWCPO-UHFFFAOYSA-N gold Chemical compound [Au] PCHJSUWPFVWCPO-UHFFFAOYSA-N 0.000 description 2
- 239000010931 gold Substances 0.000 description 2
- 229910052737 gold Inorganic materials 0.000 description 2
- 230000005802 health problem Effects 0.000 description 2
- JYGXADMDTFJGBT-VWUMJDOOSA-N hydrocortisone Chemical compound O=C1CC[C@]2(C)[C@H]3[C@@H](O)C[C@](C)([C@@](CC4)(O)C(=O)CO)[C@@H]4[C@@H]3CCC2=C1 JYGXADMDTFJGBT-VWUMJDOOSA-N 0.000 description 2
- 238000011532 immunohistochemical staining Methods 0.000 description 2
- 238000011534 incubation Methods 0.000 description 2
- NOESYZHRGYRDHS-UHFFFAOYSA-N insulin Chemical compound N1C(=O)C(NC(=O)C(CCC(N)=O)NC(=O)C(CCC(O)=O)NC(=O)C(C(C)C)NC(=O)C(NC(=O)CN)C(C)CC)CSSCC(C(NC(CO)C(=O)NC(CC(C)C)C(=O)NC(CC=2C=CC(O)=CC=2)C(=O)NC(CCC(N)=O)C(=O)NC(CC(C)C)C(=O)NC(CCC(O)=O)C(=O)NC(CC(N)=O)C(=O)NC(CC=2C=CC(O)=CC=2)C(=O)NC(CSSCC(NC(=O)C(C(C)C)NC(=O)C(CC(C)C)NC(=O)C(CC=2C=CC(O)=CC=2)NC(=O)C(CC(C)C)NC(=O)C(C)NC(=O)C(CCC(O)=O)NC(=O)C(C(C)C)NC(=O)C(CC(C)C)NC(=O)C(CC=2NC=NC=2)NC(=O)C(CO)NC(=O)CNC2=O)C(=O)NCC(=O)NC(CCC(O)=O)C(=O)NC(CCCNC(N)=N)C(=O)NCC(=O)NC(CC=3C=CC=CC=3)C(=O)NC(CC=3C=CC=CC=3)C(=O)NC(CC=3C=CC(O)=CC=3)C(=O)NC(C(C)O)C(=O)N3C(CCC3)C(=O)NC(CCCCN)C(=O)NC(C)C(O)=O)C(=O)NC(CC(N)=O)C(O)=O)=O)NC(=O)C(C(C)CC)NC(=O)C(CO)NC(=O)C(C(C)O)NC(=O)C1CSSCC2NC(=O)C(CC(C)C)NC(=O)C(NC(=O)C(CCC(N)=O)NC(=O)C(CC(N)=O)NC(=O)C(NC(=O)C(N)CC=1C=CC=CC=1)C(C)C)CC1=CN=CN1 NOESYZHRGYRDHS-UHFFFAOYSA-N 0.000 description 2
- BCFGMOOMADDAQU-UHFFFAOYSA-N lapatinib Chemical compound O1C(CNCCS(=O)(=O)C)=CC=C1C1=CC=C(N=CN=C2NC=3C=C(Cl)C(OCC=4C=C(F)C=CC=4)=CC=3)C2=C1 BCFGMOOMADDAQU-UHFFFAOYSA-N 0.000 description 2
- 210000005240 left ventricle Anatomy 0.000 description 2
- 208000014018 liver neoplasm Diseases 0.000 description 2
- 238000011068 loading method Methods 0.000 description 2
- 230000004807 localization Effects 0.000 description 2
- 208000029791 lytic metastatic bone lesion Diseases 0.000 description 2
- 230000001404 mediated effect Effects 0.000 description 2
- 238000010603 microCT Methods 0.000 description 2
- 230000005012 migration Effects 0.000 description 2
- 238000013508 migration Methods 0.000 description 2
- 210000003205 muscle Anatomy 0.000 description 2
- 239000002547 new drug Substances 0.000 description 2
- 238000010606 normalization Methods 0.000 description 2
- 231100000590 oncogenic Toxicity 0.000 description 2
- 230000002246 oncogenic effect Effects 0.000 description 2
- 210000000963 osteoblast Anatomy 0.000 description 2
- 230000002018 overexpression Effects 0.000 description 2
- 239000012188 paraffin wax Substances 0.000 description 2
- 239000002245 particle Substances 0.000 description 2
- 238000007781 pre-processing Methods 0.000 description 2
- XJMOSONTPMZWPB-UHFFFAOYSA-M propidium iodide Chemical compound [I-].[I-].C12=CC(N)=CC=C2C2=CC=C(N)C=C2[N+](CCC[N+](C)(CC)CC)=C1C1=CC=CC=C1 XJMOSONTPMZWPB-UHFFFAOYSA-M 0.000 description 2
- 150000003230 pyrimidines Chemical class 0.000 description 2
- 238000011160 research Methods 0.000 description 2
- 101150077543 st gene Proteins 0.000 description 2
- 239000000126 substance Substances 0.000 description 2
- 238000001356 surgical procedure Methods 0.000 description 2
- 230000008685 targeting Effects 0.000 description 2
- 230000001225 therapeutic effect Effects 0.000 description 2
- 238000004448 titration Methods 0.000 description 2
- 230000009466 transformation Effects 0.000 description 2
- 230000001131 transforming effect Effects 0.000 description 2
- 230000009261 transgenic effect Effects 0.000 description 2
- 241000701161 unidentified adenovirus Species 0.000 description 2
- 241001430294 unidentified retrovirus Species 0.000 description 2
- 229960005486 vaccine Drugs 0.000 description 2
- 230000002792 vascular Effects 0.000 description 2
- 230000003612 virological effect Effects 0.000 description 2
- NHBKXEKEPDILRR-UHFFFAOYSA-N 2,3-bis(butanoylsulfanyl)propyl butanoate Chemical compound CCCC(=O)OCC(SC(=O)CCC)CSC(=O)CCC NHBKXEKEPDILRR-UHFFFAOYSA-N 0.000 description 1
- JKMHFZQWWAIEOD-UHFFFAOYSA-N 2-[4-(2-hydroxyethyl)piperazin-1-yl]ethanesulfonic acid Chemical compound OCC[NH+]1CCN(CCS([O-])(=O)=O)CC1 JKMHFZQWWAIEOD-UHFFFAOYSA-N 0.000 description 1
- QTBSBXVTEAMEQO-UHFFFAOYSA-M Acetate Chemical compound CC([O-])=O QTBSBXVTEAMEQO-UHFFFAOYSA-M 0.000 description 1
- 238000012935 Averaging Methods 0.000 description 1
- 206010005949 Bone cancer Diseases 0.000 description 1
- 102100031172 C-C chemokine receptor type 1 Human genes 0.000 description 1
- 101710149814 C-C chemokine receptor type 1 Proteins 0.000 description 1
- 102100037853 C-C chemokine receptor type 4 Human genes 0.000 description 1
- 101710149863 C-C chemokine receptor type 4 Proteins 0.000 description 1
- 101150023944 CXCR5 gene Proteins 0.000 description 1
- OYPRJOBELJOOCE-UHFFFAOYSA-N Calcium Chemical compound [Ca] OYPRJOBELJOOCE-UHFFFAOYSA-N 0.000 description 1
- UXVMQQNJUSDDNG-UHFFFAOYSA-L Calcium chloride Chemical compound [Cl-].[Cl-].[Ca+2] UXVMQQNJUSDDNG-UHFFFAOYSA-L 0.000 description 1
- GAGWJHPBXLXJQN-UORFTKCHSA-N Capecitabine Chemical compound C1=C(F)C(NC(=O)OCCCCC)=NC(=O)N1[C@H]1[C@H](O)[C@H](O)[C@@H](C)O1 GAGWJHPBXLXJQN-UORFTKCHSA-N 0.000 description 1
- GAGWJHPBXLXJQN-UHFFFAOYSA-N Capecitabine Natural products C1=C(F)C(NC(=O)OCCCCC)=NC(=O)N1C1C(O)C(O)C(C)O1 GAGWJHPBXLXJQN-UHFFFAOYSA-N 0.000 description 1
- 241000283707 Capra Species 0.000 description 1
- 241000700198 Cavia Species 0.000 description 1
- 108010012236 Chemokines Proteins 0.000 description 1
- 102000019034 Chemokines Human genes 0.000 description 1
- 241001227713 Chiron Species 0.000 description 1
- 102000012422 Collagen Type I Human genes 0.000 description 1
- 108010022452 Collagen Type I Proteins 0.000 description 1
- 102000029816 Collagenase Human genes 0.000 description 1
- 108060005980 Collagenase Proteins 0.000 description 1
- 230000004544 DNA amplification Effects 0.000 description 1
- CYCGRDQQIOGCKX-UHFFFAOYSA-N Dehydro-luciferin Natural products OC(=O)C1=CSC(C=2SC3=CC(O)=CC=C3N=2)=N1 CYCGRDQQIOGCKX-UHFFFAOYSA-N 0.000 description 1
- 241000702421 Dependoparvovirus Species 0.000 description 1
- 102000001301 EGF receptor Human genes 0.000 description 1
- 108060006698 EGF receptor Proteins 0.000 description 1
- 241000283086 Equidae Species 0.000 description 1
- 206010015548 Euthanasia Diseases 0.000 description 1
- BJGNCJDXODQBOB-UHFFFAOYSA-N Fivefly Luciferin Natural products OC(=O)C1CSC(C=2SC3=CC(O)=CC=C3N=2)=N1 BJGNCJDXODQBOB-UHFFFAOYSA-N 0.000 description 1
- 238000012413 Fluorescence activated cell sorting analysis Methods 0.000 description 1
- WSFSSNUMVMOOMR-UHFFFAOYSA-N Formaldehyde Chemical compound O=C WSFSSNUMVMOOMR-UHFFFAOYSA-N 0.000 description 1
- CEAZRRDELHUEMR-URQXQFDESA-N Gentamicin Chemical compound O1[C@H](C(C)NC)CC[C@@H](N)[C@H]1O[C@H]1[C@H](O)[C@@H](O[C@@H]2[C@@H]([C@@H](NC)[C@@](C)(O)CO2)O)[C@H](N)C[C@@H]1N CEAZRRDELHUEMR-URQXQFDESA-N 0.000 description 1
- 229930182566 Gentamicin Natural products 0.000 description 1
- 239000007995 HEPES buffer Substances 0.000 description 1
- 229920000209 Hexadimethrine bromide Polymers 0.000 description 1
- 241000282412 Homo Species 0.000 description 1
- 101000897480 Homo sapiens C-C motif chemokine 2 Proteins 0.000 description 1
- 101001133056 Homo sapiens Mucin-1 Proteins 0.000 description 1
- 101001012157 Homo sapiens Receptor tyrosine-protein kinase erbB-2 Proteins 0.000 description 1
- 102000004877 Insulin Human genes 0.000 description 1
- 108090001061 Insulin Proteins 0.000 description 1
- 238000010824 Kaplan-Meier survival analysis Methods 0.000 description 1
- 239000005551 L01XE03 - Erlotinib Substances 0.000 description 1
- 239000002067 L01XE06 - Dasatinib Substances 0.000 description 1
- 239000002145 L01XE14 - Bosutinib Substances 0.000 description 1
- 241000713666 Lentivirus Species 0.000 description 1
- 108060001084 Luciferase Proteins 0.000 description 1
- 239000005089 Luciferase Substances 0.000 description 1
- DDWFXDSYGUXRAY-UHFFFAOYSA-N Luciferin Natural products CCc1c(C)c(CC2NC(=O)C(=C2C=C)C)[nH]c1Cc3[nH]c4C(=C5/NC(CC(=O)O)C(C)C5CC(=O)O)CC(=O)c4c3C DDWFXDSYGUXRAY-UHFFFAOYSA-N 0.000 description 1
- 206010025323 Lymphomas Diseases 0.000 description 1
- FYYHWMGAXLPEAU-UHFFFAOYSA-N Magnesium Chemical compound [Mg] FYYHWMGAXLPEAU-UHFFFAOYSA-N 0.000 description 1
- 102100034256 Mucin-1 Human genes 0.000 description 1
- 208000002231 Muscle Neoplasms Diseases 0.000 description 1
- 229920002274 Nalgene Polymers 0.000 description 1
- 102000048850 Neoplasm Genes Human genes 0.000 description 1
- 108700019961 Neoplasm Genes Proteins 0.000 description 1
- 206010061309 Neoplasm progression Diseases 0.000 description 1
- 206010029113 Neovascularisation Diseases 0.000 description 1
- 239000000020 Nitrocellulose Substances 0.000 description 1
- -1 OCT compound Chemical class 0.000 description 1
- 238000012879 PET imaging Methods 0.000 description 1
- 241001631646 Papillomaviridae Species 0.000 description 1
- 229930040373 Paraformaldehyde Natural products 0.000 description 1
- 241001494479 Pecora Species 0.000 description 1
- 229920001213 Polysorbate 20 Polymers 0.000 description 1
- 229940124158 Protease/peptidase inhibitor Drugs 0.000 description 1
- 238000002123 RNA extraction Methods 0.000 description 1
- FAPWRFPIFSIZLT-UHFFFAOYSA-M Sodium chloride Chemical compound [Na+].[Cl-] FAPWRFPIFSIZLT-UHFFFAOYSA-M 0.000 description 1
- 241000282887 Suidae Species 0.000 description 1
- 102000004338 Transferrin Human genes 0.000 description 1
- 108090000901 Transferrin Proteins 0.000 description 1
- GLNADSQYFUSGOU-GPTZEZBUSA-J Trypan blue Chemical compound [Na+].[Na+].[Na+].[Na+].C1=C(S([O-])(=O)=O)C=C2C=C(S([O-])(=O)=O)C(/N=N/C3=CC=C(C=C3C)C=3C=C(C(=CC=3)\N=N\C=3C(=CC4=CC(=CC(N)=C4C=3O)S([O-])(=O)=O)S([O-])(=O)=O)C)=C(O)C2=C1N GLNADSQYFUSGOU-GPTZEZBUSA-J 0.000 description 1
- 102000044209 Tumor Suppressor Genes Human genes 0.000 description 1
- 108700025716 Tumor Suppressor Genes Proteins 0.000 description 1
- ZHAFUINZIZIXFC-UHFFFAOYSA-N [9-(dimethylamino)-10-methylbenzo[a]phenoxazin-5-ylidene]azanium;chloride Chemical compound [Cl-].O1C2=CC(=[NH2+])C3=CC=CC=C3C2=NC2=C1C=C(N(C)C)C(C)=C2 ZHAFUINZIZIXFC-UHFFFAOYSA-N 0.000 description 1
- 238000010317 ablation therapy Methods 0.000 description 1
- 230000003213 activating effect Effects 0.000 description 1
- 239000000853 adhesive Substances 0.000 description 1
- 230000001070 adhesive effect Effects 0.000 description 1
- 208000037842 advanced-stage tumor Diseases 0.000 description 1
- 238000011256 aggressive treatment Methods 0.000 description 1
- 230000003321 amplification Effects 0.000 description 1
- 239000003098 androgen Substances 0.000 description 1
- 239000000051 antiandrogen Substances 0.000 description 1
- 238000011394 anticancer treatment Methods 0.000 description 1
- 239000000427 antigen Substances 0.000 description 1
- 108091007433 antigens Proteins 0.000 description 1
- 102000036639 antigens Human genes 0.000 description 1
- 229940041181 antineoplastic drug Drugs 0.000 description 1
- 238000003491 array Methods 0.000 description 1
- 238000011888 autopsy Methods 0.000 description 1
- 230000009286 beneficial effect Effects 0.000 description 1
- 230000008827 biological function Effects 0.000 description 1
- 230000000903 blocking effect Effects 0.000 description 1
- 230000037396 body weight Effects 0.000 description 1
- 229960003736 bosutinib Drugs 0.000 description 1
- UBPYILGKFZZVDX-UHFFFAOYSA-N bosutinib Chemical compound C1=C(Cl)C(OC)=CC(NC=2C3=CC(OC)=C(OCCCN4CCN(C)CC4)C=C3N=CC=2C#N)=C1Cl UBPYILGKFZZVDX-UHFFFAOYSA-N 0.000 description 1
- 239000011575 calcium Substances 0.000 description 1
- 229910052791 calcium Inorganic materials 0.000 description 1
- 239000001110 calcium chloride Substances 0.000 description 1
- 235000011148 calcium chloride Nutrition 0.000 description 1
- 229910001628 calcium chloride Inorganic materials 0.000 description 1
- 239000001506 calcium phosphate Substances 0.000 description 1
- 229910000389 calcium phosphate Inorganic materials 0.000 description 1
- 235000011010 calcium phosphates Nutrition 0.000 description 1
- 239000012830 cancer therapeutic Substances 0.000 description 1
- 230000005773 cancer-related death Effects 0.000 description 1
- 229960004117 capecitabine Drugs 0.000 description 1
- 231100000504 carcinogenesis Toxicity 0.000 description 1
- 230000024245 cell differentiation Effects 0.000 description 1
- 230000012292 cell migration Effects 0.000 description 1
- 230000004663 cell proliferation Effects 0.000 description 1
- 239000006285 cell suspension Substances 0.000 description 1
- 229960005395 cetuximab Drugs 0.000 description 1
- 239000003153 chemical reaction reagent Substances 0.000 description 1
- 239000003795 chemical substances by application Substances 0.000 description 1
- 239000002975 chemoattractant Substances 0.000 description 1
- 230000000973 chemotherapeutic effect Effects 0.000 description 1
- 230000004087 circulation Effects 0.000 description 1
- 238000010367 cloning Methods 0.000 description 1
- 229940096422 collagen type i Drugs 0.000 description 1
- 229960002424 collagenase Drugs 0.000 description 1
- 230000005757 colony formation Effects 0.000 description 1
- 238000010835 comparative analysis Methods 0.000 description 1
- 238000002591 computed tomography Methods 0.000 description 1
- 210000002808 connective tissue Anatomy 0.000 description 1
- 238000012937 correction Methods 0.000 description 1
- 239000013078 crystal Substances 0.000 description 1
- 238000012258 culturing Methods 0.000 description 1
- 238000011498 curative surgery Methods 0.000 description 1
- 238000011461 current therapy Methods 0.000 description 1
- 238000005520 cutting process Methods 0.000 description 1
- 102000003675 cytokine receptors Human genes 0.000 description 1
- 108010057085 cytokine receptors Proteins 0.000 description 1
- 210000000805 cytoplasm Anatomy 0.000 description 1
- 231100000433 cytotoxic Toxicity 0.000 description 1
- 230000001472 cytotoxic effect Effects 0.000 description 1
- 238000007405 data analysis Methods 0.000 description 1
- 238000009826 distribution Methods 0.000 description 1
- 230000009977 dual effect Effects 0.000 description 1
- 235000013601 eggs Nutrition 0.000 description 1
- 238000004520 electroporation Methods 0.000 description 1
- 238000005516 engineering process Methods 0.000 description 1
- 229960001433 erlotinib Drugs 0.000 description 1
- AAKJLRGGTJKAMG-UHFFFAOYSA-N erlotinib Chemical compound C=12C=C(OCCOC)C(OCCOC)=CC2=NC=NC=1NC1=CC=CC(C#C)=C1 AAKJLRGGTJKAMG-UHFFFAOYSA-N 0.000 description 1
- DEFVIWRASFVYLL-UHFFFAOYSA-N ethylene glycol bis(2-aminoethyl)tetraacetic acid Chemical compound OC(=O)CN(CC(O)=O)CCOCCOCCN(CC(O)=O)CC(O)=O DEFVIWRASFVYLL-UHFFFAOYSA-N 0.000 description 1
- 238000000605 extraction Methods 0.000 description 1
- 239000012530 fluid Substances 0.000 description 1
- 230000004927 fusion Effects 0.000 description 1
- 229960002584 gefitinib Drugs 0.000 description 1
- 238000001415 gene therapy Methods 0.000 description 1
- 238000012252 genetic analysis Methods 0.000 description 1
- 229960002518 gentamicin Drugs 0.000 description 1
- 230000036433 growing body Effects 0.000 description 1
- 230000003394 haemopoietic effect Effects 0.000 description 1
- 238000003306 harvesting Methods 0.000 description 1
- 230000036541 health Effects 0.000 description 1
- 210000001308 heart ventricle Anatomy 0.000 description 1
- 210000003958 hematopoietic stem cell Anatomy 0.000 description 1
- 230000002008 hemorrhagic effect Effects 0.000 description 1
- 230000002440 hepatic effect Effects 0.000 description 1
- 230000003054 hormonal effect Effects 0.000 description 1
- 108091008039 hormone receptors Proteins 0.000 description 1
- 238000001794 hormone therapy Methods 0.000 description 1
- 210000005260 human cell Anatomy 0.000 description 1
- 229960000890 hydrocortisone Drugs 0.000 description 1
- 239000002955 immunomodulating agent Substances 0.000 description 1
- 230000002584 immunomodulator Effects 0.000 description 1
- 229940121354 immunomodulator Drugs 0.000 description 1
- 238000012744 immunostaining Methods 0.000 description 1
- 230000006872 improvement Effects 0.000 description 1
- 238000011503 in vivo imaging Methods 0.000 description 1
- 238000011065 in-situ storage Methods 0.000 description 1
- 230000006698 induction Effects 0.000 description 1
- 208000015181 infectious disease Diseases 0.000 description 1
- 229940125396 insulin Drugs 0.000 description 1
- 239000007928 intraperitoneal injection Substances 0.000 description 1
- 229940084651 iressa Drugs 0.000 description 1
- 239000000644 isotonic solution Substances 0.000 description 1
- 229960004891 lapatinib Drugs 0.000 description 1
- HPJKCIUCZWXJDR-UHFFFAOYSA-N letrozole Chemical compound C1=CC(C#N)=CC=C1C(N1N=CN=C1)C1=CC=C(C#N)C=C1 HPJKCIUCZWXJDR-UHFFFAOYSA-N 0.000 description 1
- 229960003881 letrozole Drugs 0.000 description 1
- 208000032839 leukemia Diseases 0.000 description 1
- 238000001325 log-rank test Methods 0.000 description 1
- 210000004324 lymphatic system Anatomy 0.000 description 1
- 229920002521 macromolecule Polymers 0.000 description 1
- 239000011777 magnesium Substances 0.000 description 1
- 229910052749 magnesium Inorganic materials 0.000 description 1
- 230000036210 malignancy Effects 0.000 description 1
- 210000005075 mammary gland Anatomy 0.000 description 1
- 238000007726 management method Methods 0.000 description 1
- 239000003550 marker Substances 0.000 description 1
- 239000000463 material Substances 0.000 description 1
- 201000001441 melanoma Diseases 0.000 description 1
- 238000003358 metastasis assay Methods 0.000 description 1
- 208000010658 metastatic prostate carcinoma Diseases 0.000 description 1
- WSFSSNUMVMOOMR-NJFSPNSNSA-N methanone Chemical compound O=[14CH2] WSFSSNUMVMOOMR-NJFSPNSNSA-N 0.000 description 1
- 238000012737 microarray-based gene expression Methods 0.000 description 1
- 238000000520 microinjection Methods 0.000 description 1
- 230000011278 mitosis Effects 0.000 description 1
- 230000009456 molecular mechanism Effects 0.000 description 1
- 238000010172 mouse model Methods 0.000 description 1
- 229920001220 nitrocellulos Polymers 0.000 description 1
- 208000002154 non-small cell lung carcinoma Diseases 0.000 description 1
- 238000003199 nucleic acid amplification method Methods 0.000 description 1
- 210000004940 nucleus Anatomy 0.000 description 1
- 230000030648 nucleus localization Effects 0.000 description 1
- 229920002113 octoxynol Polymers 0.000 description 1
- 230000005959 oncogenic signaling Effects 0.000 description 1
- 230000006712 oncogenic signaling pathway Effects 0.000 description 1
- 238000011369 optimal treatment Methods 0.000 description 1
- 230000001582 osteoblastic effect Effects 0.000 description 1
- 210000002997 osteoclast Anatomy 0.000 description 1
- 230000007170 pathology Effects 0.000 description 1
- 230000037361 pathway Effects 0.000 description 1
- 239000008188 pellet Substances 0.000 description 1
- 239000000137 peptide hydrolase inhibitor Substances 0.000 description 1
- 229960002087 pertuzumab Drugs 0.000 description 1
- 239000008363 phosphate buffer Substances 0.000 description 1
- 230000001817 pituitary effect Effects 0.000 description 1
- 239000013612 plasmid Substances 0.000 description 1
- 239000000256 polyoxyethylene sorbitan monolaurate Substances 0.000 description 1
- 235000010486 polyoxyethylene sorbitan monolaurate Nutrition 0.000 description 1
- 239000011148 porous material Substances 0.000 description 1
- 238000012636 positron electron tomography Methods 0.000 description 1
- 238000001556 precipitation Methods 0.000 description 1
- 239000002243 precursor Substances 0.000 description 1
- 238000002360 preparation method Methods 0.000 description 1
- 201000001514 prostate carcinoma Diseases 0.000 description 1
- 150000003212 purines Chemical class 0.000 description 1
- 159000000018 pyrido[2,3-d]pyrimidines Chemical class 0.000 description 1
- 150000008518 pyridopyrimidines Chemical class 0.000 description 1
- 150000004943 pyrrolo[2,3-d]pyrimidines Chemical class 0.000 description 1
- 150000004944 pyrrolopyrimidines Chemical class 0.000 description 1
- 238000001303 quality assessment method Methods 0.000 description 1
- 238000004445 quantitative analysis Methods 0.000 description 1
- 230000005855 radiation Effects 0.000 description 1
- 238000011472 radical prostatectomy Methods 0.000 description 1
- 238000002601 radiography Methods 0.000 description 1
- 238000001959 radiotherapy Methods 0.000 description 1
- 108700042226 ras Genes Proteins 0.000 description 1
- 230000009467 reduction Effects 0.000 description 1
- 238000009877 rendering Methods 0.000 description 1
- 230000001850 reproductive effect Effects 0.000 description 1
- 230000004044 response Effects 0.000 description 1
- 230000011218 segmentation Effects 0.000 description 1
- 210000002966 serum Anatomy 0.000 description 1
- 230000019491 signal transduction Effects 0.000 description 1
- 230000011664 signaling Effects 0.000 description 1
- 239000011780 sodium chloride Substances 0.000 description 1
- 210000004872 soft tissue Anatomy 0.000 description 1
- 239000007787 solid Substances 0.000 description 1
- 239000000243 solution Substances 0.000 description 1
- 230000009870 specific binding Effects 0.000 description 1
- 108010087686 src-Family Kinases Proteins 0.000 description 1
- 102000009076 src-Family Kinases Human genes 0.000 description 1
- 210000000130 stem cell Anatomy 0.000 description 1
- 239000011550 stock solution Substances 0.000 description 1
- 238000013517 stratification Methods 0.000 description 1
- 229960005322 streptomycin Drugs 0.000 description 1
- 239000000758 substrate Substances 0.000 description 1
- 239000006228 supernatant Substances 0.000 description 1
- 230000000153 supplemental effect Effects 0.000 description 1
- 239000000725 suspension Substances 0.000 description 1
- 230000002459 sustained effect Effects 0.000 description 1
- 230000001839 systemic circulation Effects 0.000 description 1
- 230000009885 systemic effect Effects 0.000 description 1
- 238000012353 t test Methods 0.000 description 1
- LMBFAGIMSUYTBN-MPZNNTNKSA-N teixobactin Chemical compound C([C@H](C(=O)N[C@@H]([C@@H](C)CC)C(=O)N[C@@H](CO)C(=O)N[C@H](CCC(N)=O)C(=O)N[C@H]([C@@H](C)CC)C(=O)N[C@@H]([C@@H](C)CC)C(=O)N[C@@H](CO)C(=O)N[C@H]1C(N[C@@H](C)C(=O)N[C@@H](C[C@@H]2NC(=N)NC2)C(=O)N[C@H](C(=O)O[C@H]1C)[C@@H](C)CC)=O)NC)C1=CC=CC=C1 LMBFAGIMSUYTBN-MPZNNTNKSA-N 0.000 description 1
- 238000013518 transcription Methods 0.000 description 1
- 230000035897 transcription Effects 0.000 description 1
- 238000012546 transfer Methods 0.000 description 1
- 239000012581 transferrin Substances 0.000 description 1
- 238000012256 transgenic experiment Methods 0.000 description 1
- 238000012250 transgenic expression Methods 0.000 description 1
- 229960000575 trastuzumab Drugs 0.000 description 1
- QORWJWZARLRLPR-UHFFFAOYSA-H tricalcium bis(phosphate) Chemical compound [Ca+2].[Ca+2].[Ca+2].[O-]P([O-])([O-])=O.[O-]P([O-])([O-])=O QORWJWZARLRLPR-UHFFFAOYSA-H 0.000 description 1
- 230000005751 tumor progression Effects 0.000 description 1
- 208000029729 tumor suppressor gene on chromosome 11 Diseases 0.000 description 1
- 229940094060 tykerb Drugs 0.000 description 1
- 230000009452 underexpressoin Effects 0.000 description 1
- 241001529453 unidentified herpesvirus Species 0.000 description 1
- 239000003981 vehicle Substances 0.000 description 1
- 230000000007 visual effect Effects 0.000 description 1
- XLYOFNOQVPJJNP-UHFFFAOYSA-N water Substances O XLYOFNOQVPJJNP-UHFFFAOYSA-N 0.000 description 1
- 230000003442 weekly effect Effects 0.000 description 1
- 230000029663 wound healing Effects 0.000 description 1
Images


Classifications
-
- C—CHEMISTRY; METALLURGY
- C12—BIOCHEMISTRY; BEER; SPIRITS; WINE; VINEGAR; MICROBIOLOGY; ENZYMOLOGY; MUTATION OR GENETIC ENGINEERING
- C12N—MICROORGANISMS OR ENZYMES; COMPOSITIONS THEREOF; PROPAGATING, PRESERVING, OR MAINTAINING MICROORGANISMS; MUTATION OR GENETIC ENGINEERING; CULTURE MEDIA
- C12N5/00—Undifferentiated human, animal or plant cells, e.g. cell lines; Tissues; Cultivation or maintenance thereof; Culture media therefor
- C12N5/06—Animal cells or tissues; Human cells or tissues
- C12N5/0602—Vertebrate cells
- C12N5/0693—Tumour cells; Cancer cells
-
- A—HUMAN NECESSITIES
- A01—AGRICULTURE; FORESTRY; ANIMAL HUSBANDRY; HUNTING; TRAPPING; FISHING
- A01K—ANIMAL HUSBANDRY; AVICULTURE; APICULTURE; PISCICULTURE; FISHING; REARING OR BREEDING ANIMALS, NOT OTHERWISE PROVIDED FOR; NEW BREEDS OF ANIMALS
- A01K67/00—Rearing or breeding animals, not otherwise provided for; New or modified breeds of animals
- A01K67/027—New or modified breeds of vertebrates
- A01K67/0275—Genetically modified vertebrates, e.g. transgenic
-
- A—HUMAN NECESSITIES
- A61—MEDICAL OR VETERINARY SCIENCE; HYGIENE
- A61K—PREPARATIONS FOR MEDICAL, DENTAL OR TOILETRY PURPOSES
- A61K31/00—Medicinal preparations containing organic active ingredients
- A61K31/33—Heterocyclic compounds
- A61K31/395—Heterocyclic compounds having nitrogen as a ring hetero atom, e.g. guanethidine or rifamycins
- A61K31/435—Heterocyclic compounds having nitrogen as a ring hetero atom, e.g. guanethidine or rifamycins having six-membered rings with one nitrogen as the only ring hetero atom
- A61K31/46—8-Azabicyclo [3.2.1] octane; Derivatives thereof, e.g. atropine, cocaine
-
- A—HUMAN NECESSITIES
- A61—MEDICAL OR VETERINARY SCIENCE; HYGIENE
- A61K—PREPARATIONS FOR MEDICAL, DENTAL OR TOILETRY PURPOSES
- A61K31/00—Medicinal preparations containing organic active ingredients
- A61K31/33—Heterocyclic compounds
- A61K31/395—Heterocyclic compounds having nitrogen as a ring hetero atom, e.g. guanethidine or rifamycins
- A61K31/495—Heterocyclic compounds having nitrogen as a ring hetero atom, e.g. guanethidine or rifamycins having six-membered rings with two or more nitrogen atoms as the only ring heteroatoms, e.g. piperazine or tetrazines
- A61K31/505—Pyrimidines; Hydrogenated pyrimidines, e.g. trimethoprim
- A61K31/506—Pyrimidines; Hydrogenated pyrimidines, e.g. trimethoprim not condensed and containing further heterocyclic rings
-
- A—HUMAN NECESSITIES
- A61—MEDICAL OR VETERINARY SCIENCE; HYGIENE
- A61P—SPECIFIC THERAPEUTIC ACTIVITY OF CHEMICAL COMPOUNDS OR MEDICINAL PREPARATIONS
- A61P35/00—Antineoplastic agents
-
- A—HUMAN NECESSITIES
- A61—MEDICAL OR VETERINARY SCIENCE; HYGIENE
- A61P—SPECIFIC THERAPEUTIC ACTIVITY OF CHEMICAL COMPOUNDS OR MEDICINAL PREPARATIONS
- A61P35/00—Antineoplastic agents
- A61P35/04—Antineoplastic agents specific for metastasis
-
- A—HUMAN NECESSITIES
- A61—MEDICAL OR VETERINARY SCIENCE; HYGIENE
- A61P—SPECIFIC THERAPEUTIC ACTIVITY OF CHEMICAL COMPOUNDS OR MEDICINAL PREPARATIONS
- A61P43/00—Drugs for specific purposes, not provided for in groups A61P1/00-A61P41/00
-
- C—CHEMISTRY; METALLURGY
- C12—BIOCHEMISTRY; BEER; SPIRITS; WINE; VINEGAR; MICROBIOLOGY; ENZYMOLOGY; MUTATION OR GENETIC ENGINEERING
- C12Q—MEASURING OR TESTING PROCESSES INVOLVING ENZYMES, NUCLEIC ACIDS OR MICROORGANISMS; COMPOSITIONS OR TEST PAPERS THEREFOR; PROCESSES OF PREPARING SUCH COMPOSITIONS; CONDITION-RESPONSIVE CONTROL IN MICROBIOLOGICAL OR ENZYMOLOGICAL PROCESSES
- C12Q1/00—Measuring or testing processes involving enzymes, nucleic acids or microorganisms; Compositions therefor; Processes of preparing such compositions
- C12Q1/68—Measuring or testing processes involving enzymes, nucleic acids or microorganisms; Compositions therefor; Processes of preparing such compositions involving nucleic acids
- C12Q1/6876—Nucleic acid products used in the analysis of nucleic acids, e.g. primers or probes
- C12Q1/6883—Nucleic acid products used in the analysis of nucleic acids, e.g. primers or probes for diseases caused by alterations of genetic material
- C12Q1/6886—Nucleic acid products used in the analysis of nucleic acids, e.g. primers or probes for diseases caused by alterations of genetic material for cancer
-
- G—PHYSICS
- G01—MEASURING; TESTING
- G01N—INVESTIGATING OR ANALYSING MATERIALS BY DETERMINING THEIR CHEMICAL OR PHYSICAL PROPERTIES
- G01N33/00—Investigating or analysing materials by specific methods not covered by groups G01N1/00 - G01N31/00
- G01N33/48—Biological material, e.g. blood, urine; Haemocytometers
- G01N33/50—Chemical analysis of biological material, e.g. blood, urine; Testing involving biospecific ligand binding methods; Immunological testing
- G01N33/53—Immunoassay; Biospecific binding assay; Materials therefor
- G01N33/574—Immunoassay; Biospecific binding assay; Materials therefor for cancer
Definitions
- Methods and compositions for diagnosing and treating cancer, including prostate cancer are provided.
- methods and compositions useful for prostate cancer diagnostics, research, treatment stratification, and treatment are provided.
- cells and transgenic, non-human mammals that can be used in these methods.
- Cancer is a significant health problem throughout the world. Although advances have been made in detection and therapy of cancer, no vaccine or other universally successful method for prevention and/or treatment is currently available. Current therapies, which are generally based on a combination of chemotherapy or surgery and radiation, continue to prove inadequate in many patients.
- Prostate cancer for example, is a significant health problem for men in the United States and throughout the world. Although advances have been made in the detection and treatment of the disease, prostate cancer remains an important cause of cancer-related deaths in men, affecting more than 221,000 men in the United States each year. For men in North America, the life-time odds of getting prostate cancer are now 19.6%, with a 4.6% risk of death. Prostate cancer was the cause of approximately 250,000 deaths worldwide in 2009.
- PSA Prostate-Specific Antigen
- aggressive treatment which may include one or more of a variety of treatments such as surgery, radiotherapy, chemotherapy and hormone therapy.
- the course of treatment for a particular Prostate cancer is often selected based on a variety of prognostic parameters, including an analysis of histology and disease spread.
- PSA which is the current standard for screening, results in less than optimal treatment decisions because the PSA test has high false positive and false negative rates.
- Approximately 45 million PSA were conducted in 2009min the USA, with a specificity of approximately 27%.
- biopsies of the prostate were undertaken last year in the USA based on elevated PSA, from which 250,000 tumors were identified.
- the high mortality observed in prostate cancer patients indicates that improvements are needed in the treatment, diagnosis and prevention of the disease.
- PSA level below 4.0 ng/mL is considered as normal.
- prostate cancer was diagnosed in 15.2 percent of men with a PSA level at or below 4.0 ng/mL. Fifteen percent of those men, or approximately 2.3 percent overall, had high-grade cancers. According to Smith DS et al. 25 to 35 percent of men who had a PSA level between 4.1 and 9.9 ng/mL and who underwent a prostate biopsy were found to have prostate cancer, while 65 to 75 percent of the remaining men did not have prostate cancer. Thus, there is no specific normal or abnormal PSA level.
- a mammalian prostate cancer cell line comprising at least one or more of a set of primary mammalian epithelial cells which have been infected with a retroviral vector carrying an oncogene.
- the oncogene may be selected from the group consisting of c-Myc, Ha-Ras, NeuT, c-Src and combinations thereof and in which said oncogene or combination of genes is expressed.
- the mammalian prostate cancer cell line can include any suitable mammalian cell, including primary murine epithelial cells.
- the primary mammalian epithelial cells may be derived from any immune competent mammal, including immune competent rodents, including rats and mice.
- an animal model of cancer comprising an immune competent mammal implanted with a cancer cell line transformed with one or more of a set of oncogenes selected from the group consisting of c-Myc, Ha-Ras, NeuT, c-Src and combinations thereof.
- An immunocompetent transgenic mouse created using the mammalian prostate cancer cell line may develop a prostate tumor capable of producing a detectable molecular genetic signature based on an expression level of one or more of a set of oncogenes selected from the group consisting of c-Myc, Ha-Ras, NeuT, c-Src and combinations thereof.
- a method for the in vitro production of immortalized primary mammalian epithelial cells comprising infecting primary mammalian epithelial cells with a retroviral vector carrying an oncogene selected from the group consisting of c-Myc, Ha-Ras, NeuT, c-Src and combinations thereof to provide infected cells, wherein said primary mammalian epithelial cells are capable of being infected by said retroviral vector and under conditions whereby the c-Myc, Ha-Ras, NeuT, c-Src and combinations thereof are expressed in said infected cells.
- Also provided is a method for diagnosing a prostate cancer comprising: (a) providing a biological test sample from a subject afflicted with a prostate cancer or suspected of having prostate cancer or at risk for developing prostate cancer; (b) determining a level of at least one biological marker or a molecular genetic signature based on a gene expression pattern or activity of one or more of a set of genes in the test sample, wherein the one or more set of genes are selected from the group consisting of c-Myc, Ha-Ras, NeuT, c-Src and combinations thereof; (c) comparing the level of said at least one biological marker or said molecular genetic signature in said test sample to the level of the biological marker or the level of the molecular genetic signature in a control sample, wherein an elevated level of the biological marker or the molecular genetic signature in said test sample relative to the level of the biological marker or the molecular genetic signature in said control sample is a diagnostic indicator of the presence of prostate cancer in said subject.
- a method of classifying a cancer tumor, including a prostate tumor may comprise: (a) providing a cancer tumor or a prostate tumor sample; (b) detecting a molecular genetic signature derived from gene expression pattern or activity of one or more of a set of genes in the sample, wherein the genes are selected from the group consisting of c-Myc, Ha-Ras, NeuT, c-Src and combinations thereof; and (c) classifying the prostate tumor as belonging to a tumor subclass based on the results of the detecting step (b).
- a method of selecting a treatment for a subject having a prostate tumor may comprise: (a) providing a sample derived from a subject having a prostate tumor; (b) detecting a molecular genetic signature derived from a gene expression pattern or activity of one or more of a set of genes in the sample, wherein the genes are selected from the group consisting of c-Myc, Ha-Ras, NeuT, c-Src and combinations thereof; and (c) selecting a treatment based on the results of the detecting step.
- non-naturally occurring cell produced by transforming a cell with one or more exogenous oncogenes, allowing the cell to divide at least once, wherein the cell is a mammalian cell transformed by a vector containing the one or more exogenous oncogenes, wherein the one or more exogenous oncogenes are selected from the group consisting of c-Myc, Ha-Ras, NeuT, c-Src and combinations thereof.
- CCR5 chemokine receptor type 5
- CCL5 chemokine receptor type 5
- a CCR5 antagonist for use in inhibiting metastasis of cancer susceptible to treatment in an immunocompetent subject at risk for developing metastasis of cancer, wherein the CCR5 antagonist is maraviroc or vicriviroc.
- immune competent or "immunocompetent” animals.
- Cancer cell lines that can be implanted in immune competent, or immunocompetent, animals, including humans and non- human animals, including mammals, are disclosed.
- exemplary non-human mammals include, for example, rodents such as rats, guinea pigs, and mice, and farm animals such as pigs, sheep, goats, horses, and cattle.
- any type of cell in the body may be a source of cancer
- any suitable type of cancer cell line may be used.
- a suitable cancer type includes carcinoma (cancer of the epithelial cells), sarcoma (cancer of the bone, muscle or other connective tissues), lymphoma (cancer of the lymphatic system), leukemia (cancer of blood cells or blood precursor cells) and melanoma (cancer of the pigment-providing cells).
- a prostate cancer cell line comprising at least one or more of a set of primary mammalian epithelial cells which have been infected with a retroviral vector carrying an oncogene selected from the group consisting of c-Myc, Ha-Ras, NeuT, c-Src and combinations thereof, and wherein said oncogene or combinations of genes are expressed.
- a mouse prostate cancer cell line wherein murine prostate cells are transduced with an oncogene selected from the group consisting of c-Myc, Ha-Ras, NeuT, c-Src and combinations thereof.
- Suitable mouse prostate cell line can be obtained by infecting the primary murine epithelial cells with a retroviral vector carrying the oncogene under conditions that allow the oncogene to be expressed in the primary murine epithelial cells.
- Transgenic immunocompetent mouse models of human cancers have the potential to be more reflective of human cancers than xenograft models because, inter alia, transgenic mice form tumors in situ, (i.e., in an environment more similar to the human tumor and in the setting of a normal immune system). Therefore, immunocompetent non-human mammals may be engineered to express one or more of the oncogenes described herein, including c-Myc, Ha-Ras, NeuT, c-Src or combinations thereof, and to develop cancer
- transgenic mouse models of human cancer in research.
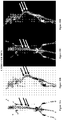
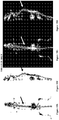
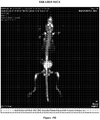
- small-animal X-ray computed tomography could be used to monitor progression of tumor relatively cheaply and also as highly quantitative three- dimensional method for visualizing blood vessels and angiogenesis preclinically.
- Using such a method it is possible to achieve rapid and accurate assessment of vascularity during preclinical therapeutic trials in living mice.
- Tumor assessment with microCT enables rapid qualitative visual renderings of data as well as quantitative analysis of tumor blood volume, vessel density, vessel caliber, degree of branching, and tortuosity using segmentation analysis.
- immunocompetent mice examples include (random bred CD1, Charles River Laboratories, St. Constant, PQ), C57BI/6J (B6), C57BI/6x 129/J Fl (Fl, Jackson Laboratories, Bar Harbor, ME), FVB/N, C57BV6, BALB/c and ND4.
- FVB/N mice may be used to engineer the transgenic mouse models. FVB/N mice are suitable for most transgenic experiments and genetic analyses contemplated and/or described herein.
- the inbred FVB/N strain is characterized by vigorous reproductive performance and consistently large litters and fertilized FVB/N eggs contain large and prominent pronuclei, which facilitate microinjection of DNA.
- An immunocompetent transgenic mouse created using the mammalian prostate cancer cell line described herein develops a prostate tumor capable of producing a detectable molecular genetic signature based on an expression level of one or more of a set of oncogenes selected from the group consisting of c-Myc, Ha-Ras, NeuT, c-Src and combinations thereof
- Metastasis is the leading cause of death in cancer patients.
- Current chemotherapeutic anti-cancer treatments use cytotoxic, hormonal or immunomodulator drugs aimed at decreasing the number of cancer cells in the patient's body.
- cytotoxic, hormonal or immunomodulator drugs aimed at decreasing the number of cancer cells in the patient's body.
- a growing body of evidence suggests that most metastatic cells are resistant to anti-cancer drugs and therefore currently available drugs are not effectively stopping the dissemination of cancer cells to other tissues or organs.
- there is no effective method for treating most metastatic tumors despite the numerous and diverse therapeutic innovations in the cancer therapeutic field.
- a “vector” or “construct” refers to a macromolecule or complex of molecules comprising a polynucleotide to be delivered to a host cell, either in vitro or in vivo.
- the polynucleotide to be delivered may comprise a sequence of interest for gene therapy.
- Vectors include, for example, transposons and other site-specific mobile elements, viral vectors, e.g., adenovirus, adeno-associated virus (AAV), poxvirus, papillomavirus, lentivirus, herpesvirus, foamivirus and retrovirus vectors, and including pseudotyped viruses, liposomes and other lipid- containing complexes, and other macromolecular complexes capable of mediating delivery of a polynucleotide to a host cell, e.g., DNA coated gold particles, polymer-DNA complexes, liposome-DNA complexes, liposome-polymer-DNA complexes, virus-polymer-DNA complexes, e.g., adenovirus-polylysine-DNA complexes, and antibody-DNA complexes.
- viral vectors e.g., adenovirus, adeno-associated virus (AAV), poxvirus, papillomavirus, lentivirus
- Vectors can also comprise other components or functionalities that further modulate gene delivery and/or gene expression, or that otherwise provide beneficial properties to the cells to which the vectors will be introduced.
- Such other components include, for example, components that influence binding or targeting to cells (including components that mediate cell-type or tissue-specific binding); components that influence uptake of the vector nucleic acid by the cell; components that influence localization of the polynucleotide within the cell after uptake (such as agents mediating nuclear localization); and components that influence expression of the polynucleotide.
- Such components also might include markers, such as detectable and/or selectable markers that can be used to detect or select for cells that have taken up and are expressing the nucleic acid delivered by the vector.
- Such components can be provided as a natural feature of the vector (such as the use of certain viral vectors which have components or functionalities mediating binding and uptake), or vectors can be modified to provide such functionalities.
- vectors can be provided as a natural feature of the vector (such as the use of certain viral vectors which have components or functionalities mediating binding and uptake), or vectors can be modified to provide such functionalities.
- a large variety of such vectors are known in the art and are generally available.
- the vector When a vector is maintained in a host cell, the vector can either be stably replicated by the cells during mitosis as an autonomous structure, incorporated within the genome of the host cell, or maintained in the host cell's nucleus or cytoplasm.
- Human Prostate cancer has embedded within the genetic makeup and signatures that reflect oncogenic signaling.
- the cell lines described herein advantageously reflect one or more of these oncogenic signaling pathways, thus facilitating, for example, the testing of oncogene specific compounds or nucleic acids based therapies.
- prostate cancer cell lines as provided herein are useful for the testing of and/or screening for oncogene specific compounds or nucleic acids based therapies.
- oncogene specific inhibitors examples include inibitors for c-Myc, Ha-Ras c-Src, and ErbB2 oncogenes.
- suitable anti-cancer agents targeting the ErbBs which are in clinical use or development, including those that fall in the categories of chimeric or humanised monoclonal antibodies against the ErbB family and Small Molecule ErbB Tyrosine Kinase Inhibitors.
- the chimeric or humanised monoclonal include antibodies that prevent ligand-binding and ligand-dependent receptor activation (e.g., Cetuximab that targets the ligand-binding subdomain III of ErbB1), antibodies that interfere with ligand-independent receptor activation (e.g., Trastuzumab that targets subdomain IV of ErbB2), and antibodies that prevent receptor heterodimerisation (e.g. the anti-ErbB2 antibody Pertuzumab that targets an area around the dimerisation loop in subdomain II of ErbB2).
- ligand-binding and ligand-dependent receptor activation e.g., Cetuximab that targets the ligand-binding subdomain III of ErbB1
- antibodies that interfere with ligand-independent receptor activation e.g., Trastuzumab that targets subdomain IV of ErbB2
- antibodies that prevent receptor heterodimerisation e.g. the anti-ErbB2 antibody Pertu
- Exemplary Small molecule ErbB tyrosine kinase inhibitors include two ErbB 1-specific tyrosine kinase inhibitors Gefitinib/Iressa and Erlotinib, which have been approved for the treatment of non-small cell lung cancer, and the dual ErbBl/ErbB2 inhibitor Lapatinib, which is marketed as TYKERB® and is indicated in combination with capecitabine for the treatment of patients with advanced or metastatic breast cancer; and in combination with letrozole for the treatment of postmenopausal women with hormone receptor positive metastatic breast cancer that overexpresses the HER2.
- ErbB2 receptor inhibitors include GW-282974 (Glaxo Wellcome PLC), and the monoclonal antibodies AR-209 (Aronex Pharmaceuticals Inc. of The Woodlands, Tex., USA) and 2B-1 (Chiron).
- Exemplary ErbB2 inhibitors also include those described in WO 1998/02434 (published Jan. 22, 1998 ), WO 1999/35146 (published Jul. 15, 1999 ), WO 1999/35132 (published Jul. 15, 1999 ), WO 1998/02437 (published Jan. 22, 1998 ), WO 1997/13760 (published Apr. 17, 1997 ), WO 1995/19970 (published Jul. 27, 1995 ), U.S. Pat. No. 5,587,458 (issued Dec. 24, 1996 ), and U.S.
- Examples of c-Src protein tyrosine kinase inhibitors that are useful include, but are not limited to, the compounds which are generically and specifically disclosed in WO 1996/10028 , WO 1997/28161 , WO 1997/32879 and WO1997/49706 , including those belonging to the structure classes of pyrrolopyrimidines, especially pyrrolo[2,3- d]pyrimidines, purines, pyrazopyrimidines, especially pyrazo[3,4-d]pyrimidines, pyrazopyrimidines, especially pyrazo[3,4-d]pyrimidines and pyridopyrimidines, especially pyrido[2,3-d]pyrimidines.
- Exemplary compounds include compounds of formulae I-IV below.
- the above compounds can be prepared and administered as described in the cited documents.
- the compound of formula I can be prepared and formulated as described in WO 1996/10028 .
- the compound of formula II and its preparation is disclosed in Example 11 lc3 of WO 1997/16452 .
- the compound of formula IV can be prepared in analogy thereof. Both latter compounds can be formulated as described in WO 1997/16452 .
- the compound of formula III is discussed by R. Gamse et al in J. Bone Miner. Res. 14 (Suppl. 1), 1999, S487 .
- Additional useful compounds are described by T. Schindler, F. Sicheri et al. in Molecular Cell, 1999 (3), 639, 647 ; J. M. Hamby et al, J. Med. Chem. 40, 1997, 2296- 2303 ; R. L. Panek et al, J. Pharmacol. Exp. Ther. 283, 1997, 1433-1444 ; and S. R. Klutchko et al, J. Med. Chem. 41, 1998, 3276-3292 .
- src inhibitors include S I606, also known as bosutinib (by Wyeth) and the compound dasatinib, also know as Spyrcel (by Bristol-Myers Squibb) which is disclosed in WO 2000/62778 and U.S. Pat. No. 6,596,746 .
- Small-molecule c-Myc inhibitors include 10074-G5, also known as Biphenyl-2-yl-(7-nitrobenzo[1,2,5]oxadiazol-4-ylamine; Quarfloxin (also known as CX-3543); and 10074-G5, also known as Biphenyl-2-yl-(7-nitrobenzo[1,2,5]oxadiazol-4-ylamine.
- CX-3543 reportedly suppresses c-Myc activity by binding to the c-Myc quadruplex, four-stranded DNA secondary structures that regulate transcription of specific oncogenes including c-Myc.
- c-Myc inhibitors include the compounds disclosed in United States Patent Application Publication No. 2007/0203188 (published August 30, 2007 ).
- a method for the in vitro production of immortalized primary mammalian epithelial cells comprising infecting primary mammalian epithelial cells with a retroviral vector carrying an oncogene selected from the group consisting of c-Myc, Ha-Ras, NeuT, c-Src and combinations thereof to provide infected cells, wherein said primary mammalian epithelial cells are capable of being infected by said retroviral vector and under conditions whereby the c-Myc, Ha-Ras, NeuT, c-Src and combinations thereof are expressed in said infected cells.
- Retroviral and Adenoviral Expression Systems are suitable gene delivery systems.
- Retroviral-mediated gene transfer is widely used to express proteins in a variety of cell lines, including hematopoietic cells for a variety of reasons, including analysis of their effects on blood cell proliferation, differentiation, and biological function.
- the Murine Stem Cell Virus (“MSCV”) Retroviral Expression System contains vectors that are optimized for introducing and expressing target genes in pluripotent cell lines, including murine or human hematopoietic, embryonic stem (ES), and embryonal carcinoma (EC) cells.
- Adenoviral Expression Systems include the ViraPowerTM Adenoviral Expression System (by Life Technologies), which is useful, for example, for creation of a replication-incompetent adenovirus that can be used to deliver and transiently express target gene(s) of interest in either dividing or non-dividing mammalian cells.
- Also provided is a method for diagnosing a prostate cancer comprising: (a) providing a biological test sample from a subject afflicted with a prostate cancer or suspected of having prostate cancer or at risk for developing prostate cancer; (b) determining a level of at least one biological marker or a molecular genetic signature based on a gene expression pattern in the test sample that is associated with the diagnosis of the prostate cancer;(c) comparing the level of said at least one biological marker or said molecular genetic signature in said test sample to the level of the biological marker or the level of the molecular genetic signature in a control sample, wherein an elevated level of the biological marker or the molecular genetic signature in said test sample relative to the level of the biological marker or the molecular genetic signature in said control sample is a diagnostic indicator of the presence of prostate cancer in said subject.
- Biological specimens may include nucleic acid derived from the tumor under obtained from the patient.
- Nucleic acid may be derived from the tumor either by biopsy, or from cells derived from the tumor in urine or proteins made as a consequence of the gene signature secreted into the patients blood.
- a method of classifying a prostate tumor comprising: (a) providing a prostate tumor sample; (b) detecting a molecular genetic signature derived from gene expression pattern or activity of one or more of a set of genes in the sample, wherein the genes are selected from the group consisting of c-Myc, Ha-Ras, NeuT, c-Src and combinations thereof; and (c) classifying the prostate tumor as belonging to a tumor subclass based on the results of the detecting step.
- Subjects may be stratified into subcategories that are based on the presence of a molecular genetic signature and/ or the functional pathways linked to the molecular genetic signature.
- the molecular genetic signature may be based on a gene expression pattern or activity of one or more of a set of genes in a test sample derived from a subject having a cancer tumor, in particular prostate cancer tumor, wherein the one or more set of genes are selected from the group consisting of c-Myc, Ha-Ras, NeuT, c-Src and combinations thereof
- Also provided is a method of selecting a treatment for a subject having a prostate tumor comprising: (a) providing a sample derived from a subject having a prostate tumor; (b) detecting a molecular genetic signature derived from gene expression pattern or activity of one or more of a set of genes in the sample, wherein the genes are selected from the group consisting of c-Myc, Ha-Ras, NeuT, c-Src and combinations thereof; and (c) selecting a treatment based on the results of the detecting step (b). (ie oncogene based therapies would be given based on the onco signature in the patients tumor)
- a non-naturally occurring cell produced by transforming a cell with one or more exogenous oncogenes, allowing the cell to divide at least once, wherein the cell is a human cell transformed by a vector containing the one or more exogenous oncogenes, wherein the one or more exogenous oncogenes are selected from the group consisting of c-Myc, Ha-Ras, NeuT, c-Src and combinations thereof.
- the signature could be applied to genetic material derived from the prostate cancer - i.e. in biofluids related to the prostate including prostate, urine, blood or other biospecimens.
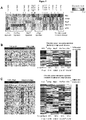
- the signature may also be applied to other cancer types in particular as shown for breast cancer.
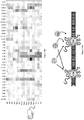
- the c-Myc signature the signature is seen in both prostate tumors and in the breast tumors derived from transgenic expression of c-Myc in the mammary gland of transgenic mice ( Figure 7C ).
- a cancer may be identified by obtaining a biological sample from a subject afflicted with prostate cancer or suspected of having prostate cancer or at risk for developing prostate cancer and determining whether genetic material from the biological sample has a genetic signature as described herein.
- the biological sample may be derived from a prostate biopsy.
- the biological sample is derived from biofluids related to the prostate, including prostate, urine, blood or other biospecimens.
- the method may include massaging a prostate prior to obtaining a urine sample for genetic signature identification.
- the method may include other fluids as described above.
- Oligonucleotide sequences can be introduced into cells as is known in the art. Transfection, electroporation, fusion, liposomes, colloidal polymeric particles and viral and non-viral vectors as well as other means known in the art may be used to deliver the oligonucleotide sequences to the cell. The method of delivery selected will depend at least on the cells to be treated and the location of the cells and will be known to those skilled in the art. Localization can be achieved by liposomes, having specific markers on the surface for directing the liposome, by having injection directly into the tissue containing the target cells, by having depot associated in spatial proximity with the target cells, specific receptor mediated uptake, viral vectors, or the like. Oncogenes can be introduced into cells by transduction or transfection. Transduction can conducted using either retroviral or other viral delivery systems
- mice were in the FVB strain.
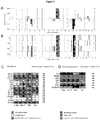
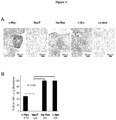
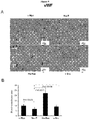
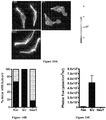
- Mouse prostate epithelial cell culture were isolated from prostate glands of 12 week old male mice and maintained as previously described [42] and analyzed after 25 passages with at least three lines of each genotype.
- Cells were seeded in 24-well-plates at a concentration of 1x10 4 cells / well, each sample in triplicate x 7 days. Growing transformed cells in DMEM medium with 10% FBS, while control PEC cells were cultured in prostate epithelial primary culture medium. Harvest cells every 24 hours, suspended cells in 100 ⁇ l PBS, added an equal volume of 0.4% Trypan blue, after 5 minutes counted cells by CountessTM Autocounted Cell Counter (C10227, Invitrogen Carlsbad, CA).
- the PEC (prostate epithelial cells) lines transformed with Ha-Ras, v-Src, and NeuT oncogenes were generated and transfected with a lentiviral vector containing the luc2 gene to generate stable bioluminescent cancer cell lines.
- the Luc2-tomato red expression vector was previously described ( Liu, H., et al., Proc Natl Acad Sci U.S.A. 2010, 107, 18115-18120 ).
- the isogenic PEC lines were maintained in Dulbecco's modified Eagle's medium (DMEM) supplemented with 10% fetal bovine serum (FBS) and 1% penicillin-Streptomycin and cultured in 5% CO2 at 37 °C.
- DMEM Dulbecco's modified Eagle's medium
- FBS fetal bovine serum
- penicillin-Streptomycin penicillin-Streptomycin
- Cells were grown to confluence on 12-well plates in DMEM medium containing 10% FBS. The monolayers were wounded with a P10 micropipette tip. The cells were washed immediately after scoring with PBS and serum-free DMEM was added (16). The cell migration was monitored for 20h, and pictures were taken at 9h, 12h, 15h and 20h time points using an Axiovert 200 Zeiss microscope system. Images were analyzed using ImageJ software.
- Mouse cytokine arrays spotted on nitrocellulose membrane were obtained from Raybiotech.
- Conditioned medium was prepared by culturing cells in serum-free DMEM for 48hours. Membranes were then processed according to the manufacture's instructions for assessment of secreted cytokines in conditioned medium (see Katiyar, S. et al., Mol Cell Biol 2007, 27, 1356-1369 ).
- mice Male nu/nu mice, 12weeks old, were anesthetized by exposure to 3% isoflurane. Anesthetized mice received 1x10 6 cells suspended in 50 ⁇ L of Dulbecco's Phosphate Buffer Saline lacking of calcium and magnesium (DPBS) and 50 ⁇ L of BD Matrigel Membrane Basement (BD Biosciences, Bedford, MA) by subcutaneous injection below one dorsal flank. The injection has been performed using 27G1 ⁇ 2 needle. Tumor progression has been followed by bioluminescence measurement once a week until tumor excision using as described previously (18). Three mice at a time were monitored dorsally.
- DPBS Dulbecco's Phosphate Buffer Saline lacking of calcium and magnesium
- BD Matrigel Membrane Basement BD Biosciences, Bedford, MA
- Regions of interest (ROI) from displayed images were drawn around the tumor sites or the metastatic lesion and quantified using the Living Image 3.0 software. (Caliper Life Sciences). Tumor samples were harvested after 3 weeks. All experiments involving mice were carried out under the approval of Thomas Jefferson University's IACUC.
- mice Male FVB mice, 8 weeks old, were anesthetized by exposure to 3% isoflurane. 2x10 5 cancer cells suspended in 100 ⁇ L of DPBS were injected into the left ventricle of the heart of the mouse. Injections were performed using a 30G1 ⁇ 2 needle and a 1mL syringe. To confirm the presence of cells in the systemic circulation, animals were imaged using IVIS LUMINA XR system (Caliper Life Sciences, Hopkinton MA). A successful intracardiac injection was indicated by systemic bioluminescence distributed through the animal body. Mice not properly injected were removed from the study.
- mice received the substrate of luciferase, DLuciferin (Gold Biotechnology), at 15mg/mL in PBS by intraperitoneal injection of 10 ⁇ L of Luciferin stock solution per gram of body weight (manufacturer's recommendation) and were anesthetized by exposure to 3% isoflurane.
- D-luciferin injection animals were placed inside the camera box of the IVIS Lumina XR (Caliper Life Sciences, Hopkinton MA) and received continuous exposure to 2.5% isoflurane. Imaging times ranges from 5 seconds (for later time points) to 5 minutes (for earlier time points), depending on the bioluminescence of metastatic lesion. Only one mouse was imaged ventrally.
- Results were analyzed using Living Image 3.0 software.
- D-Luciferin was diluted in PBS to final concentration of 300 ⁇ g/mL and used to soak freshly isolated organs for 2 to 3 minutes before imaging. Animal experiments were approved by the Thomas Jefferson University's IACUC.
- the three-dimensional invasion assay was performed as previously reported. Briefly, 100 ml of 1.67 mg/ml Rat Tail collagen type I (BD Biosciences) was pipetted into the top chamber of a 24-well 8 mm pore transwell (Corning, Lowell, MA). The transwell was incubated at 37°C overnight to allow the collagen to solidify. 30,000 cells were then seeded on the bottom of the transwell membrane and allowed to attach. Serum-free growth medium was placed into the bottom chamber, while 10ug/mlosteopontin (R&D System), or 15ng/ml CCL5 (R&D System), or 10% FBS was used as a chemo attractant in the medium of the upper chamber.
- Rat Tail collagen type I (BD Biosciences) was pipetted into the top chamber of a 24-well 8 mm pore transwell (Corning, Lowell, MA). The transwell was incubated at 37°C overnight to allow the collagen to solidify. 30,000 cells were then seeded on the bottom of the
- the cells were then chemo attracted across the filter through the collagen above for three days.
- Cells were fixed in 4% formaldehyde, permeabilized with 0.2% Triton-X in PBS and then stained with 40 mg/ml propidium iodide (PI) for 2 h. Fluorescence was analyzed by confocal zsections (one section every 20 mm) at 10x magnification from the bottom of the filter using a Zeiss LSM 510 Meta inverted confocal microscope at the Kimmel Cancer Center Bioimaging Facilit.
- Tumor samples and soft tissues were fixed in 4% para-formaldehyde (PFA, Fisher) and processed for paraffin bedding, sectioning, H&E andimmunohistochemistry (IHC). Bones were fixed in 4% PFA at 4°C for 72h, decalcified in 0.5M EDTA (pH 8) for 7 days at 4°C, and embedded in paraffin (19). vWF staining on tumor sections was performed by the Pathology Core Facility of KCC.
- PFA para-formaldehyde
- CK14 (Covance) PRB-155P and CK8 (clone1E8, Covance) MMS-162P staining was performed after deparaffinization and rehydration without performing the antigen retrieval treatment on bones and brains samples to distinguish basal from luminal prostate epithelial cells.
- TRAP thyroid-resistant acid phosphatase staining was performed after deparaffinization and rehydratation as directed by the manufacturer (Sigma-Aldrich) to identify active osteoclasts at the surface between metastatic lesion and compact bone (5) (20).
- Tetrachrome method was performed on bones to identify woven bone in the osteoblastic lesion areas (5,21). (RV202, Santa Cruz Biotechnology) staining was performed only on brain samples to discriminate sarcoma from carcinoma.
- RNA quality assessment is based on the RNA Integrity Number (RIN).
- Microarray data was preprocessed using background correction, quantile normalization, and summarization were performed on the Mouse Gene 1.0 ST gene expression microarrays using the Robust Multichip Analysis (RMA) workflow in Affymetrix Expression Console version 1.1 [Affymetrix, Inc., Santa Clara, CA].
- RMA Robust Multichip Analysis
- Differentially expressed genes were identified for each of the four over-expressing cell lines, by performing pairwise comparisons against the Pec control cell line. These comparisons were performed using significance analysis of microarrays (SAM) with a false discovery rate cutoff of 1% and two-fold change cutoff.
- SAM significance analysis of microarrays
- Western blot assays were performed in PEC cells as indicated. Cells were pelleted and lysed in buffer (50 mM HEPES, pH 7.2, 150 mMNaCl, 1 mM EDTA, 1 mM EGTA, 1 mM DTT, 0.1% Tween 20) supplemented with protease inhibitor cocktail (Roche Diagnostics, Mannheim, Germany). Antibodies used for Western blot are: AR (H-280, Santa Cruz Biotechnology).
- Microarray analysis methods Preprocessing and Differential Expression Analysis.
- Microarray data was preprocessed using background correction, quantile normalization, and summarization were performed on the Mouse Gene 1.0 ST gene expression microarrays using the Robust Multichip Analysis (RMA) [45] workflow in Affymetrix Expression Console version 1.1 [Affymetrix, Inc., Santa Clara, CA].
- RMA Robust Multichip Analysis
- Differentially expressed genes were identified for each of the four over-expressing cell lines, c-Myc, NeuT, Ha-Ras, and v-Src, by performing pairwise comparisons against the PEC control cell line. These comparisons were performed using significance analysis of microarrays (SAM) with a false discovery rate cutoff of 1% and two-fold change cutoff.
- SAM significance analysis of microarrays
- ROC receiver operating characteristic
- the first dataset comprises 185 samples log2 normalized mRNA expression data was downloaded from the MSKCC prostate cancer database website (http://cbio.mskcc.org/cancergenomics/prostate/data/) [20]. Gene profiles in this MSKCC dataset were median-centered and Pearson's correlation was computed between each MSKCC sample and the log2 fold change profile for each oncogene-specific signature.
- the second prostate cancer dataset including distant metastasis samples, was previously obtained from the MSKCC Gerald Laboratory and samples were processed as described in [33]. Briefly, microarray samples were processed using the Robust Multichip Average (RMA) procedure [45] with custom CDFs dated July 30, 2009 (version 12) [47].
- RMA Robust Multichip Average
- the expression patterns of the four oncogene over-expressing cell lines were compared against expression data for clinical traits including disease stage, grade, and recurrence, previously published by Lapointe et al. [3].
- the dataset was downloaded from the publications website. This dataset contains 5153 probesets and 112 prostate cancer samples with annotations including tumor grade, tumor stage, and disease recurrence. Probeset annotations were updated using the Array Information Library Universal Navigator GPL3044 annotation file dated 7/9/2009 [48]. Probetsets lacking gene symbol annotations were eliminated as well as probesets with at least 25% missing values, resulting in a total of 4232 features for 3327 unique genes. Differential expression analysis was performed for advanced stage vs. early stage, high grade vs.
- Oncogene transformed prostate cell lines convey contact-independent growth.
- Fig. 1A Primary prostate epithelial cell cultures were established from the ventral prostates of FVB mice ( FIG. 1A ). Cells were transduced with retroviral expression vectors encoding a single distinct oncogene (c-Myc, Ha-Ras (V-12), v-Src and NeuT, an activating mutant of ErbB2). The cellular morphology of the prostate epithelial cells was altered over the four-week period ( Fig. 1B ). Individual colonies of oncogene-transduced cells were selected and characterized. Cellular growth assays were conducted by cell counting ( Fig. 1C ). A substantial growth advantage was observed in each oncogene transduced cell line compared with primary prostate epithelial cells.
- the oncogene transduced PEC lines were examined for growth in soft agar. Colony size and number were characterized for each oncogene ( Fig. 2B ) [27]. Non-transformed PECs failed to grow in soft agar as previously described [27]. Oncogene transduction increased the size and number of colonies ( Fig. 2C, D ).
- Fig. 3A Tumor formation studies were conducted in FVB mice. A subcutaneous injection of 1x10 6 cells resulted in tumor growth. Serial measurements were conducted by vernier calipers. Each of the prostate tumor lines grew subcutaneously in immune competent mice. Growth was sustained for c-Myc, Ha-Ras and v-Src transformed PECs ( Fig. 3A ). The extirpated tumors were hemorrhagic ( Fig. 3B ) with histological features of poorly differentiated prostate adenocarcinoma ( Fig. 3C , Supplement 1).
- VWF Von Willebrand factor
- mRNA was prepared from the oncogene transformed PEC cell lines.
- Microarray analysis identified a total of 2635 out of 22115 genes that were significantly altered in expression (at least two-fold change) in oncogene over-expressing cell lines when compared with non-transformed prostate epithelial cell control samples ( Fig. 5 ).
- the heatmap of genes identified as significantly different in their expression (at least 2-fold change) is shown in Figure 5 .
- the rows of the heatmap represent unique genes and are displayed by their pattern of up- and down-regulation for all four of the oncogene induced cell lines
- a sizable number of up- and down-regulated genes were shared amongst all four cell lines (Group 1; 251 genes).
- Group 1 contains genes that share differential expression patterns across all four cell lines
- group 15 contains genes whose differential expression is specific to the Src cell lines.
- Genes with up and down-regulation specific to Ha-Ras were the most prevalent (Group 14; 584 genes), followed by c-Myc-specific genes (Group 8; 332 genes), NeuT-specific genes (Group 12; 277 genes), and v-Src-specific genes (Group 15; 215 genes).
- the murine prostate oncogene expression signature in high grade and advanced stage human prostate cancer is the murine prostate oncogene expression signature in high grade and advanced stage human prostate cancer.
- the prostate "oncogene expression signature” was defined as genes that were significantly altered in expression level and that were uniquely altered in expression by a specific oncogene compared with primary prostate epithelial cells ( Fig. 5 ).
- the oncogene expression signature thereby identified was compared to gene signatures obtained from other published databases to identify similarities to other well-studied disease phenotypes and cell lines. Comparisons were performed against gene signatures representative of differential expression in advanced state vs. early stage prostate cancer, high grade vs low grade prostate cancer, recurrent vs. nonrecurrent prostate cancer [3].
- the gene signature heatmaps representing advanced stage/early stage, high grade/low grade, and recurrent/nonrecurrent prostate cancer phenotypes [3] are shown on the left and the heatmaps on the right represent genes that are differentially expressed in the prostate oncogene expression signature.
- the heatmaps in Figures 6-8 are labeled with the percentage of genes within the "oncogene expression signature" that are differentially expressed.
- P values for the statistical significance of the similarity between the genes expressed in the prostate cancer cell lines and the gene signature of the disease phenotype are shown. P values are based on the hypergeometric distribution and represent the probability of these genes being differentially expressed in the disease phenotype if they were selected at random. Low p values indicate a degree of similarity between an oncogene cell line and a disease phenotype that is unlikely to occur merely by chance.
- c-Myc specific gene expression signature in prostate cancer epithelial cells resembles the c-Myc signature in fibroblasts and mammary tumors.
- Fig. 7A depicts the genes shared between c-Myc transduced fibroblasts ( Fig. 7A ), c-Myc-induced mammary tumors ( Fig.
- ROC curves have been used previously to evaluate the diagnostic ability of PSA [29, 30] as well as its ability to identify metastatic disease [31].
- the c-Myc signature ROC curve exhibited better sensitivity/specificity characteristics than PSA, as evident in the area under the ROC curves.
- the area under the ROC curve represents the potential of a variable to discriminate between two conditions [32], indicating that the c-Myc signature performs as a better discriminator of metastatic disease than serum PSA levels.
- the c-Myc signature correlates with metastatic prostate cancer.
- Prostate oncogene induced gene expression and recurrence free survival in human prostate cancer Prostate oncogene induced gene expression and recurrence free survival in human prostate cancer.
- FIG. 8A provides a heatmap showing the expression profiles of genes in the human prostate cancer samples from the Glinsky's data set, which was upregulated in the oncogene-transformed prostate cancer cell lines. Genes that were highly expressed in each of the four prostate oncogene cell lines had a significant association with poor outcome (p ⁇ 0.005) ( Fig. 8B,E ).
- FIG. 1 Establishment of Oncogene Transformed Prostate Cancer Cell Lines.
- A FVB mice, (II) prostates were used to establish Primary prostate epithelial cells (PEC) as shown by phase contrast microscopy (ventral prostates of male FVB mice at 12 weeks of age).
- B Schematic representation of the methods deployed and phase contrast microscopy of oncogene induced cell lines derived from PEC transduced by distinct oncogenes (c-Myc, NeuT, Ha-Ras, v-Src). Photo of individual colonies derived from oncogene-transduced PEC that were selected and characterized.
- C Growth curves of PEC lines determined by cell counting. Data are mean ⁇ SEM of N>3 separate experiments.
- FIG. 3 Prostate epithelial cell lines grow in immune competent mice.
- A PEC tumor diameter, determined by vernier caliper measurement, is shown as days after inoculation in FVB mice. The diameter mean ⁇ SEM for N>5 separate experiments. The NeuT tumors grew for 2 weeks then decreased in size.
- B Photograph of representative tumor derived from oncogene-induced lines. NeuT induced tumors were harvested at 15 days after cell injection.
- C Hemotoxylin and eosin and
- D VWF staining of PEC demonstrates poorly differentiated prostate adenocarcinoma with local vascularity.
- Figure 4 Oncogene transformed prostate epithelial cell tumors metastasize to lung.
- Figure 5 Hierarchical clustering of microarray gene expression.
- Figure 6 Genes associated with high grade and advanced stage human prostate cancer.
- Heatmaps of the left-hand side represent the prostate cancer high grade and advanced stage signatures, while heatmaps on the right represent genes that are differentially expressed in at least one of the four prostate cancer cell lines. The percentage of these genes that are differentially expressed within each individual prostate cancer cell line is shown in the respective columns along with the p value for the degree of similarity with the high grade and advanced stage phenotypes.
- Figure 7 c-Myc and Ha-Ras specific oncogene signature in prostate tumors is conserved in fibroblasts.
- Heatmaps of (A) and (B) show the genes that are differentially expressed in the oncogene-induced prostate cancer cell lines and in c-Myc and Ha-Ras transduced fibroblasts (3T3 cell line) [46]. Heatmaps of the left-hand side represent the transduced fibroblasts gene signatures, while heatmaps on the right represent genes that are differentially expressed in at least one of the four prostate cancer cell lines. Heatmap of (C) shows the intersection of genes that are differentially expressed in the c-Myc prostate cancer cell line and in the respective c-Myc-induced mouse mammary tumor samples [46].
- Heatmaps of the left-hand side represent the tumor sample gene signatures, while heatmaps on the right represent genes that are differentially expressed in the prostate cancer cell lines.
- the p values shown under each prostate cell line heatmap represent the significance of the overlap between the prostate and mammary cancer datasets.
- (D) ROC curve for the utility of PSA (orange) and the c-Myc signature (green) to identify metastatic disease.
- the x-axis represents the false positive rate (1-specificity) and the y-axis represents the true positive rate (sensitivity).
- the dashed line represents no discriminative ability.
- a heatmap depicts the consistency between each of the four prostate cancer cell line signatures and samples in MSKCC prostate cancer datasets. Red indicates positive Pearson correlation, while blue indicates negative Pearson correlation.
- Figure 8 Gene expression correlates of oncogene transformed prostate cancer cell lines with recurrence-free survival.
- A Expression profile of human prostate cancer samples [11] that were upregulated in the oncogene transferred prostate cancer cell lines. Bars along the bottom of the heatmap indicate whether a sample has high (upper 25 th percentile) or low expression (lower 75 th percentile) based on genes upregulated in each of the four oncogene-transformed cell lines. Kaplan Meier curves are shown for high and low expression populations for (B) c-Myc upregulated genes, (C) NeuT upregulated genes, (D) Ha-Ras upregulated genes, (E) v- Src upregulated genes.
- IHC Immunohistochemical staining of PEC tumors for VWF as a marker of neoangiogenesis. Representative example of IHC for VWF for each cell line.
- B The relative concentration of blood vessels are shown for the four oncogene induced mouse prostate tumors. Quantitation of VWF staining from oncogene-induced prostate tumors. Data are mean ⁇ SEM for N>3 separate tumors. In the NeuT group, the blood vessel concentration is lower and Ha-Ras vascularity is greater (p ⁇ 0.01).
- Medium for primary culture comprised F-12 500ml, 10% FBS , Insulin 5ug/ml, EGF 10ng/ml,Hydrocortisone 1ug/ml, transferrin 5ng/ml, bovine pituitary extraction 30ug/ml, IX pen-strep, and 1 X Gentamicin.Mice prostate derived from 12 weeks old FVB mice, ventral prostate, was removed, washed in PBS, the prostate tissues were chopped in a 6 cm plate for several minutes using razor blades. The chopped tissues were added in 0.5 mg/ml collagenase solution and the plates were put in 37°C, 5% CO2 incubator for 16h. The digested tissues were washed with PBS and the resulting cells pellet resuspended using the medium, and then planted in 10cm cell plates.
- pBABE-IRES-target gene was transfected into 293T cells by calcium phosphate precipitation.
- DNA and CaCl2 were mixed in HBS buffer, and the mixture made up to afinal volume of 1ml, which was allowed to stand for 20mins at RT. This mixture was then mixed into 293T cells and the cells put into incubator for 5 hours then the incubation medium was removed and replace with fresh medium. After 48 hours, the supernatant of 293T cells was collected, mixed with equal volume of fresh medium, and the resulting mixture was filtered by 0.45um filter. Polybrene( final concentration 8ug/ml ) was then added into the mixture, which was then added into prostate epithelial cells which were in passage one. After another 48 hours of infection, the medium was removed and replace with fresh medium (DMEM,10% FBS).
- a culture medium comprised DMEM, 10% FBS, and IX pen-strep.was added puromysin, and the final concentration was made up to 1 ⁇ 2ug/ml.
- the cells were repeatedly treated with puromysin for at least 1 month, until the negative cells were dead, and the positive clones with oncogene expression were left. When the clones were big enough, picked the clones by were picked by cloning cylinders (Specialty Media, cat# TR-1004), and the cells were appropriately marked. The cells were then grown for at least 25 passages. Characterized in assays of growth in tissue culture soft agar, in vivo implantation, metastasis, microarray and histopathology.
- Figure 1 illustrates oncogene transduced PEC lines form colonies in soft agar.
- Figure 1A illustrates phase contrast microscopy of oncogene induced cell lines were transduced by distinct oncogenes (c-Myc, NeuT, Ha-Ras, v-Src). Photo of individual colonies derived from oncogene-transduced PEC that were selected and characterized.
- Figure 1B illustrates growth curves of PEC lines determined by cell counting. Data are mean ⁇ SEM of N>3 separate experiments.
- Figures 1C and 1D describe Western Blot analysis of 3 separate clones of each oncogene induced PEC with antibodies as shown for detection of c-Myc, NeuT, Ha-Ras and v-Src and Figures 1D describes markers of basal (CK5) vs luminal (CK8) prostate cancer. GDI is used as a protein loading control.
- Figure 1E describes soft agar assays of oncogene transduced PEC. Non-transformed PEC failed to grow in soft agar. The size ( Figure IE) and number ( Figure IF) of colonies from oncogene transduced PEC lines are shown as mean ⁇ SEM of N>5 separate experiments.
- Figure 2 depicts copy number aberrations in the four oncogene cell lines assessed by array CGH.
- Figure 2A illustrates the percentage of the four cell lines sharing copy gain or loss regions is shown as a function of genomic position.
- Figure 2B illustrates regions of copy gain (red) or loss (blue) for each of the four cell lines are shown as a function of genomic position.
- oncogenes are identified with mRNA overexpression (red), DNA amplification (yellow), or both (purple) among the four oncogene cell lines, with corresponding amplification in the MKSCC prostate cancer database (listed on righthand side).
- tumor suppressor genes are identified with mRNA underexpression (blue), DNA copy loss (pink), or both (orange) among the four oncogene cell lines, with corresponding copy loss in the MKSCC prostate cancer database (listed on right-hand side).
- Figure 3 illustrates prostate epithelial cell lines grow in immune competent mice.
- Figure 3A PEC tumor diameter determined by vernier caliper measurement is shown as days after inoculation in FVB 30 mice. The diameter mean ⁇ SEM for N>5 separate experiments.
- Figure 3B shows photograph of representative tumor derived from oncogene-induced lines. NeuT induced tumors were harvested at 15 days after cell injection.
- Figure 3C shows Hematoxylin and eosin staining at low and high magnification (see also supplemental data 1-4).
- Figure 4 shows oncogene transformed prostate epithelial cell tumors metastasize to lung.
- Figure 4A shows Hematoxylin and eosin stain of murine lung post tumor implantation demonstrating representative example of lung metastasis.
- Figure 4B shows Frequency of lung metastases were detected in mice for c-Myc, NeuT and v-Src PEC groups 5 weeks after subcutaneous injection. The rates were 100% frequency in Ha-Ras and v-Src groups.
- Figure 5 shows hierarchical clustering of microarray gene expression.
- Heatmaps of the left-hand side represent the prostate cancer high grade and advanced stage signatures, while heatmaps on the right represent genes that are differentially expressed in the four prostate cancer cell lines. The percentage of these genes that are differentially expressed within each individual prostate cancer cell line is shown in the respective columns along with the p value for the degree of similarity with the high grade and advanced stage phenotypes.
- Figure 6 shows c-Myc- and Ha-Ras-specific oncogene signatures in prostate tumors are conserved in other tissues.
- Heatmaps show genes that are differentially expressed in the oncogene-induced prostate cancer cell lines and in Figure 6A Ha-Ras and Figure 6B c-Myc fibroblasts (3T3 cell line).
- Figure 6C A heatmap shows the intersection of genes that are differentially expressed in the c- Myc prostate cancer cell line and mouse mammary tumor samples. The p values shown under each prostate cell line heatmap represent the significance of the overlap between the prostate and fibroblast/mammary tumor signatures.
- Figure 6D shows a classifier based on canonical analysis of c-Myc signature distinguishes human tumor (red) from normal tissue (light blue), along the x-axis, in the Lapointe 2004 dataset.
- ROC curves for the classifier performance are shown for E) the Lapointe 2004 dataset and F) the Taylor 2010 MSKCC dataset, with AUC values of 0.990 and 0.977, respectively.
- Figure 7 shows gene expression correlates of oncogene transformed prostate cancer cell lines with recurrence-free survival.
- Figure 7A shows expression profile of human prostate cancer samples (13) that were upregulated in the oncogene transferred prostate cancer cell lines. Bars along the bottom of the heatmap indicate whether a sample has high (upper 25th percentile) or low expression (lower 75th percentile) based on genes upregulated in each of the four oncogene transformed cell lines. Kaplan Meier curves are shown for high and low expression populations for ( Figure 7B ) c-Myc upregulated genes.
- Figure 8 illustrates gene expression correlates of oncogene transformed prostate cancer cell lines with recurrence-free survival.
- Figure 9 illustrates histological features of poorly differentiated prostate adenocarcinoma.
- Figures 10A-10D demonstrate that Src enhances 3D matrigel invasion of isogenic prostate cancer cell lines.
- Figure 10D shows mean distances of invasion ⁇ SEM from 3 independent experiments for PEC lines (PEC-NeuT, PEC-Ras, and PEC-Src). As shown in Figures 10C and 10D , invasion into matrigel was more efficient for the c-Src transduced line. Statistical analysis of the results shown was conducted using the Student's t test.
- Figures 11A and 11B demonstrate isogenic prostate cancer cell line tumors are vascular.
- subcutaneous tumor growth in NCR nude mice was quantitated over 3 weeks following subcutaneous innoculation of 1x10 5 cells for each of the 3 lines (PEC-NeuT, PEC-Ras, and PEC-Src) using normalized photon flux to quantitate tumor volume.
- Mean sizes ⁇ SEM from 3 independent experiments for PEC lines are shown.
- the lines grew as subcutaneous tumors in NCR nude mice; the relative size as determined by photon flux suggested more rapid growth amongst the Ras-derived lines
- Statistical analysis of the data was conducted using the Student's t test.
- FIGS 12A-12E demonstrate prostate cancer lines develop metastasis. Tomato-Red. Cells were injected into the left cardiac ventricle of 16 mice for each cell line. Bioluminescence images were acquired and quantified 14 days after xenografting. Representative in vivo images of mice are shown in Figure 12A . As shown, upon introduction of tumors into the arterial circulation via the left ventricle of the heart (I.C. Injection), tumors developed rapidly in multiple organs, including liver, brain, bladder, adrenal gland and kidney, within two weeks of injection.
- I.C. Injection the left ventricle of the heart
- Figure 12B shows representative images of brain metastasis in mice following the intracardiac injection of the isogenic prostate cancer lines.
- Figure 12E shows H&E staining of brain metastasis formed after 2 weeks of PEC-Src and PEC-NeuT intracardiac injection. Also, CK14 staining corroborated the presence of prostate epithelial cells within the brain (arrow).
- Figures 13A-13C demonstrate liver metastasis of prostate tumor cell lines. Isogenic PEC lines expressing the Luc2-Tomato-Red fusion protein were injected into the ventricle of FVB mice and the in vivo bioluminescent signal quantified.
- Figure 12A illustrates the percentage of mice with liver tumors. Hepatic metastasis in the mice injected with the Ras and Src PEC lines developed liver metastasis ( ⁇ 100% of the animals). Although the NeuT tumors grew subcutaneously, none developed liver metastasis.
- Figure 12B illustrates the tumor size determined by photonflux and Figure 13C illustrates representative mice images showing liver metastasis.
- Kidney metastasis were identified in the mice injected with the Ras and Src derived lines.
- Figure 13D illustrates the percentage of mice with kidney tumors.
- Figure 13E illustrates size of kidney tumors by photon flux and
- Figure 13F illustrates representative images of kidney metastasis.
- Figures 14A-14C demonstrate isogenic prostate cancer cell lines develop osteolytic bone metastases.
- Figure 14A illustrates representative in vivo images of FVB mice that underwent intracardiac injection of PEC lines expressing Luc2-Tomato-Red fusion protein and the in vivo bioluminescent signal was quantified.
- FIG 14A the bony metastasis of the mice were osteolytic in nature.
- Figure 14C illustrates the size of-tumor mass on photon flux. Histological analysis of the osteolytic bone lesions of the prostate tumors evidenced, adenocarcinoma resembling the primary tumor.
- Figures 15A-15F demonstrate Src enhances osteolytic prostate cancer bone metastases.
- FVB mice 2 weeks after PEC-Src intracardiac injection developed osteolytic bone lesions.
- Figure 15A shows tumor area in bones was significantly increased in the PEC-Src group compared with PEC-Ras and PEC-NeuT. The area of the tumor was six-fold greater in c-Src compared to Ras driven tumors.
- Figure 15B illustrates representative X-Rays before (t0) and 14d (t14) after intracardiac injection of cells. Low density areas colocalized with the metastatic tumors (arrowhead) indicating osteolytic lesions. The bone lesions were found primarily at the epiphyseal junction as osteolytic lesions at two weeks.
- FIG. 15C Hisological analysis confirmed adenocarcinoma at the site of bony metastasis.
- Tartrate resistant acid phosphatase (“TRAP”) staining shown in Figure 15C , corroborated the presence of osteoblast (arrows) in the bone-tumor interface.
- Figure 15D shows Haematoxylin Eosin (“H&E”) staining of bone metastasis formed after.
- Figures 15E and 15F show cytokeratin (CK) 14 staining and CK8 staining respectively, both corroborating the presence of epithelial cells within bone.
- CK cytokeratin
- FIGS 16A-16G demonstrate osteolytic prostate cancer cell lines express function CCL5 and osteopontin (“OPN") receptors.
- Figures 16A-16D show Fluorescence-Activated Cell Sorting ("FACS") analysis of CCR5 expression on PEC lines. As shown, FACS analysis using a CCR5 specific antibody confirmed the presence of the CCR5 receptor in PEC lines.
- FACS Fluorescence-Activated Cell Sorting
- Figures 16E and 16F show results of Matrigel invasion assays of the PEC-Src line conducted using OPN as CD44 ligand and CCL5 as CCR5 ligand and quantified as mean + SEM ( Figure 16 G) .
- Figures 16D and 16E the addition of OPN or CCR5 enhanced PEC invasiveness into matrigel.
- the in vivo tumor gene expression in the oncogene transformed PEC was compared with the expression in vivo in the dorsolateral ventral prostate of mice with the same strain.
- Figure 16F shows chemokine receptor and ligand gene expression of prostate tumor cell lines in tissue culture.
- Figure 16G shows chemokine receptor and ligand gene expression of prostate tumor cell lines after subcutaneous implantation.
- the gene expression showed a notable up regulation in vivo of the cytokine and chemokines.
- upregulation of CCR5 and CCR2 was observed in the c-Myc, NeuT and Src PEC lines.
- Upregulation of the receptor ligands CCL2, CCL7, and CCL8 was observed (2- to 3-fold).
- CCL7, CCL8 and CCL5 are ligands for CCR5, CCL8 and CCL5 for CCR1 ( Figure 15H ).
- microarray based gene expression profiling showed activation of a CCR5 signaling module when the PEC lines were grown in vivo vs tissue culture.
- CCL2 binds CCR2 and CCR4. Given that CCR5 and its ligands CCL5, CCL7 and CCL8 were induced in the PEC in vivo, the effect of the CCR5 antagonist on prostate tumor growth was examined.
- Figures 17A-17D demonstrate that CCR5 antagonists block spinal osteolytic prostate cancer metastasis.
- PEC lines transduced with vectors expressing the Luc2-Tomato-Red fusion protein were injected into the ventricle of FVB mice and the in vivo bioluminescent signal was quantified after 2 weeks. Mice were treated with oral maraviroc (8 mg/kg) or control.
- Figure 17A illustrates representative examples of mice from each group.
- Figure 17B illustrates photon flux as a volumetric analysis of total tumor mass and
Landscapes
- Health & Medical Sciences (AREA)
- Life Sciences & Earth Sciences (AREA)
- Chemical & Material Sciences (AREA)
- Engineering & Computer Science (AREA)
- General Health & Medical Sciences (AREA)
- Organic Chemistry (AREA)
- Biomedical Technology (AREA)
- Biotechnology (AREA)
- Zoology (AREA)
- Veterinary Medicine (AREA)
- Medicinal Chemistry (AREA)
- Animal Behavior & Ethology (AREA)
- Genetics & Genomics (AREA)
- Wood Science & Technology (AREA)
- Bioinformatics & Cheminformatics (AREA)
- Immunology (AREA)
- Oncology (AREA)
- Public Health (AREA)
- Pharmacology & Pharmacy (AREA)
- Microbiology (AREA)
- Biochemistry (AREA)
- Pathology (AREA)
- Proteomics, Peptides & Aminoacids (AREA)
- Molecular Biology (AREA)
- Analytical Chemistry (AREA)
- General Engineering & Computer Science (AREA)
- Cell Biology (AREA)
- Chemical Kinetics & Catalysis (AREA)
- Nuclear Medicine, Radiotherapy & Molecular Imaging (AREA)
- General Chemical & Material Sciences (AREA)
- Epidemiology (AREA)
- Hematology (AREA)
- Urology & Nephrology (AREA)
- Environmental Sciences (AREA)
- Physics & Mathematics (AREA)
- Hospice & Palliative Care (AREA)
- Food Science & Technology (AREA)
- Biophysics (AREA)
- Biodiversity & Conservation Biology (AREA)
- Animal Husbandry (AREA)
Description
- Methods and compositions for diagnosing and treating cancer, including prostate cancer, are provided. In particular, methods and compositions useful for prostate cancer diagnostics, research, treatment stratification, and treatment are provided. Also provided are cells and transgenic, non-human mammals that can be used in these methods.
- This invention was made with government support under Grant Nos. RQ1CA70896, R01CA75503, R01 CA86072, P30CA56036, and R01CA132115-02 awarded by National Institutes of Health (NIH). The government has certain rights in the invention.
- Cancer is a significant health problem throughout the world. Although advances have been made in detection and therapy of cancer, no vaccine or other universally successful method for prevention and/or treatment is currently available. Current therapies, which are generally based on a combination of chemotherapy or surgery and radiation, continue to prove inadequate in many patients.
- Prostate cancer, for example, is a significant health problem for men in the United States and throughout the world. Although advances have been made in the detection and treatment of the disease, prostate cancer remains an important cause of cancer-related deaths in men, affecting more than 221,000 men in the United States each year. For men in North America, the life-time odds of getting prostate cancer are now 19.6%, with a 4.6% risk of death. Prostate cancer was the cause of approximately 250,000 deaths worldwide in 2009.
- No vaccine or other universally successful method for the prevention or treatment of prostate cancer is currently available. Management of the disease currently relies on a combination of early diagnosis (through routine Prostate-Specific Antigen ("PSA") test) and aggressive treatment, which may include one or more of a variety of treatments such as surgery, radiotherapy, chemotherapy and hormone therapy. The course of treatment for a particular Prostate cancer is often selected based on a variety of prognostic parameters, including an analysis of histology and disease spread. However, the use of PSA, which is the current standard for screening, results in less than optimal treatment decisions because the PSA test has high false positive and false negative rates. Approximately 45 million PSA were conducted in 2009min the USA, with a specificity of approximately 27%. Approximately 1 million biopsies of the prostate were undertaken last year in the USA based on elevated PSA, from which 250,000 tumors were identified. The high mortality observed in prostate cancer patients indicates that improvements are needed in the treatment, diagnosis and prevention of the disease.
- Another complicating factor with the use of PSA test is that doctors' recommendations for PSA screening vary. Some encourage yearly screening for men over
age 50, and some advise men who are at a higher risk for prostate cancer to begin screening atage 40 or 45. Yet others caution against routine screening. Typically, PSA level below 4.0 ng/mL is considered as normal. However, the referenced PSA level seem arbitrary and useless in view of two reports, one by Thompson IM et al. ("Prevalence of prostate cancer among men with a prostate-specific antigen level < or = 4.0 ng per milliliter," New England Journal of Medicine 2004, 350(22), 2239-2246) and the other by Smith DS et al. ("The early detection of prostate carcinoma with prostate specific antigen: The Washington University experience," Cancer 1997, 80(9), 1853-1856). According to Thompson IM et al. prostate cancer was diagnosed in 15.2 percent of men with a PSA level at or below 4.0 ng/mL. Fifteen percent of those men, or approximately 2.3 percent overall, had high-grade cancers. According to Smith DS et al. 25 to 35 percent of men who had a PSA level between 4.1 and 9.9 ng/mL and who underwent a prostate biopsy were found to have prostate cancer, while 65 to 75 percent of the remaining men did not have prostate cancer. Thus, there is no specific normal or abnormal PSA level. - Also, molecular mechanisms contributing to prostate cancer recurrence and therapy resistance are poorly understood. Androgen ablation therapy results in 60% to 80% initial response rate (see Scher, H. I., and Sawyers, C. L., J Clin Oncol 2005, 23, 8253-8261). The majority of patients undergoing androgen antagonist therapy however subsequently relapse. Early diagnosis may provide an opportunity for curative surgery, however ∼ 30% of men who receive radical prostatectomy relapse, attributed to micrometastatic disease. Therefore, a need exists medical interventions that can detect and/or forestall molecular drivers of metastatic malignancy at early stages of the disease.
- A mammalian prostate cancer cell line comprising at least one or more of a set of primary mammalian epithelial cells which have been infected with a retroviral vector carrying an oncogene is provided. The oncogene may be selected from the group consisting of c-Myc, Ha-Ras, NeuT, c-Src and combinations thereof and in which said oncogene or combination of genes is expressed. The mammalian prostate cancer cell line can include any suitable mammalian cell, including primary murine epithelial cells. The primary mammalian epithelial cells may be derived from any immune competent mammal, including immune competent rodents, including rats and mice.
- Also provided is an animal model of cancer comprising an immune competent mammal implanted with a cancer cell line transformed with one or more of a set of oncogenes selected from the group consisting of c-Myc, Ha-Ras, NeuT, c-Src and combinations thereof.
- An immunocompetent transgenic mouse created using the mammalian prostate cancer cell line may develop a prostate tumor capable of producing a detectable molecular genetic signature based on an expression level of one or more of a set of oncogenes selected from the group consisting of c-Myc, Ha-Ras, NeuT, c-Src and combinations thereof.
- Further provided is a method for the in vitro production of immortalized primary mammalian epithelial cells, the method comprising infecting primary mammalian epithelial cells with a retroviral vector carrying an oncogene selected from the group consisting of c-Myc, Ha-Ras, NeuT, c-Src and combinations thereof to provide infected cells, wherein said primary mammalian epithelial cells are capable of being infected by said retroviral vector and under conditions whereby the c-Myc, Ha-Ras, NeuT, c-Src and combinations thereof are expressed in said infected cells.
- Also provided is a method for diagnosing a prostate cancer, the method comprising: (a) providing a biological test sample from a subject afflicted with a prostate cancer or suspected of having prostate cancer or at risk for developing prostate cancer; (b) determining a level of at least one biological marker or a molecular genetic signature based on a gene expression pattern or activity of one or more of a set of genes in the test sample, wherein the one or more set of genes are selected from the group consisting of c-Myc, Ha-Ras, NeuT, c-Src and combinations thereof; (c) comparing the level of said at least one biological marker or said molecular genetic signature in said test sample to the level of the biological marker or the level of the molecular genetic signature in a control sample, wherein an elevated level of the biological marker or the molecular genetic signature in said test sample relative to the level of the biological marker or the molecular genetic signature in said control sample is a diagnostic indicator of the presence of prostate cancer in said subject.
- A method of classifying a cancer tumor, including a prostate tumor, may comprise: (a) providing a cancer tumor or a prostate tumor sample; (b) detecting a molecular genetic signature derived from gene expression pattern or activity of one or more of a set of genes in the sample, wherein the genes are selected from the group consisting of c-Myc, Ha-Ras, NeuT, c-Src and combinations thereof; and (c) classifying the prostate tumor as belonging to a tumor subclass based on the results of the detecting step (b).
- Also provided is a method of stratifying a subject having a cancer tumor, including a prostate tumor, for a clinical trial, the method comprising: (a) providing a sample derived from a subject having the cancer tumor or the prostate tumor; (b) detecting a molecular genetic signature derived from gene expression pattern or activity of one or more of a set of genes in the sample, wherein the genes are selected from the group consisting of c-Myc, Ha-Ras, NeuT, c-Src, ErbB2 and combinations thereof; and (c) stratifying the subject for a clinical trial based on the results of the detecting step.
- A method of selecting a treatment for a subject having a prostate tumor may comprise: (a) providing a sample derived from a subject having a prostate tumor; (b) detecting a molecular genetic signature derived from a gene expression pattern or activity of one or more of a set of genes in the sample, wherein the genes are selected from the group consisting of c-Myc, Ha-Ras, NeuT, c-Src and combinations thereof; and (c) selecting a treatment based on the results of the detecting step.
- Further provided is a non-naturally occurring cell produced by transforming a cell with one or more exogenous oncogenes, allowing the cell to divide at least once, wherein the cell is a mammalian cell transformed by a vector containing the one or more exogenous oncogenes, wherein the one or more exogenous oncogenes are selected from the group consisting of c-Myc, Ha-Ras, NeuT, c-Src and combinations thereof.
- It has been discovered that oncogene transformation of prostate epithelial cells induces metastatic cells associated with increased expression of chemokine receptor type 5 ("CCR5") and its ligands (CCL5, CCL8, CCL7). The CCR5 receptor is functionally relevant to the bony metastasis as evidenced by the reduction in metastasis with daily oral CCR5 antagonist Maraviroc.
- According to a first aspect of the invention there is provided a CCR5 antagonist for use in inhibiting metastasis of cancer susceptible to treatment in an immunocompetent subject at risk for developing metastasis of cancer, wherein the CCR5 antagonist is maraviroc or vicriviroc.
- Embodiments of the invention are described by the dependent claims.
-
-
Figure 1 illustrates oncogene transduced PEC lines form colonies in soft agar; -
Figure 2 illustrates copy number aberrations in the four oncogene cell lines assessed by array CGH; -
Figure 3 illustrates prostate epithelial cell lines grow in immune competent mice; -
Figure 4 illustrates oncogene transformed prostate epithelial cell tumors metastasize to lung; -
Figure 5 illustrates hierarchical clustering of microarray gene expression; -
Figure 6 illustrates c-Myc- and Ha-Ras-specific oncogene signatures in prostate tumors are conserved in other tissues; -
Figure 7 illustrates gene expression correlates of oncogene transformed prostate cancer cell lines with recurrence-free survival; and -
Figure 8 illustrates gene expression correlates of oncogene transformed prostate cancer cell lines with recurrence-free survival. -
Figure 9 illustrates histological features of poorly differentiated prostate adenocarcinoma; -
Figure 10 illustrates Src enhancement of 3D Matrigel invasion of isogenic prostate cancer cell lines, wherein:-
Figure 10A illustrates wounding assay of cellular migration showing wound, -
Figure 10B illustrates quantitation of closure for N=3 separate experiments, -
Figure 10C illustrates 3-D invasion assay using prostate cancer cell lines in matrigel, and -
Figure 10D illustrates mean distances of invasion ± SEM from 3 independent experiments for PEC lines (PEC-NeuT, PEC-Ras, and PEC-Src);
-
-
Figure 11 illustrates isogenic prostate cancer cell line tumors are vascular, wherein:-
Figure 11A illustrates subcutaneous tumor growth in NCR nude mice, quantitated over 3 weeks following subcutaneous innoculation of 1 x 10⁵ cells for each of the 3 lines using normalized photon flux to quantitate tumor volume, -
Figure 11B illustrates immunohistochemical staining for von Willebrand factor (WF) showing vascularity of the lines with enhanced VWF staining of the Ras line;
-
-
Figure 12 illustrates prostate cancer lines develop metastasis. Results from an experiment wherein PEC lines transduced with vectors expressing the Luc2-Tomato-Red fusion protein were injected into the ventricle of FVB mice and the in vivo bioluminescent signal was quantified weekly, presented as follows:-
Figure 12A illustrates representative total body bioluminescence images of at two weeks after intracardiac injection of prostate epithelial cells, -
Figure 12B illustrates representative images of brain metastasis in mice following intracardiac injection of the isogenic prostate cancer lines, -
Figure 12C illustrates quantification (mean ± SEM, n=6) of Bioluminescence Imaging (BLI) shown as proportion of mice with tumors, -
Figure 12D illustrates mean total proton flux as a measure of metastatic brain tumor burden for each of the isogenic lines, -
Figure 12E illustrates Haematoxylin Eosin ("H&E") staining of brain metastasis formed after 2 weeks of PEC-Src and PEC-NeuT intracardiac injection and Cytokeartin 14 ("CK14") staining corroborating the presence of prostate epithelial cells within the brain;
-
-
Figure 13 illustrates liver metastasis of prostate tumor cell lines. Results from an experiment wherein isogenic PEC lines expressing the Luc2-Tomato-Red fusion protein were injected into the ventricle of FVB mice and the in vivo bioluminescent signal quantified are presented as follows:-
Figure 13A illustrates the percentage of mice with liver tumors, -
Figure 13B illustrates the tumor size determined by photonflux, -
Figure 13C illustrates representative mice images showing liver metastasis, -
Figure 13D illustrates the percentage of mice with kidney tumors, -
Figure 13E illustrates size of kidney tumors by photon flux, and -
Figure 13F illustrates representative images of kidney metastasis;
-
-
Figure 14 illustrates isogenic prostate cancer cell lines develop osteolytic bone metastases:-
Figure 14A illustrates representative in vivo images of FVB mice that underwent intracardiac injection of PEC lines expressing Luc2-Tomato-Red fusion protein and the in vivo bioluminescent signal was quantified, -
Figure 14B illustrates quantification (mean ± SEM, n=6) of Bioluminescence Imaging (BLI) as proportion of mice with tumors, and -
Figure 14C illustrates size of-tumor mass on photon flux;
-
-
Figure 15 illustrates Src enhancement of osteolytic prostate cancer bone metastases. Results from an experiment whereinFVB mice 2 weeks after PEC-Src intracardiac injection developed osteolytic bone lesions presented as follows:-
Figure 15A illustrates that tumor area in bones was significantly increased in the PEC-Src group compared with PEC-Ras and PEC-NeuT, -
Figure 15B illustrates representative X-Rays before (tO) and 14 days (tl4) after intracardiac injection of cells, -
Figure 15C illustrates Tartrate-Resistant Acid Phosphatase ("TRAP") staining, - corroborating the presence of osteoblast (arrows) in the bone-tumor interface,
-
Figure 15D illustrates H&E staining of bone metastasis formed after, -
Figure 15E illustrates CK14 staining and,Figure 15F illustrates CK8 staining, and both corroborate the presence of epithelial cells within bone;
-
-
Figure 16 illustrates osteolytic prostate cancer cell lines express function CCL5 and osteopontin ("OPN") receptors:-
Figures 16A-16D illustrate fluorescence activated cell sorter ("FACS") analysis of CCR5 expression on PEC lines, -
Figures 16E and 16F illustrate Matrigel invasion assays of the PEC-Src line conducted using OPN as CD44 ligand and CCL5 as CCR5 ligand, and -
Figure 16G illustrates Matrigel invasion of the PEC-Src line quantified as mean + SEM, - and
-
Figure 16F illustrates chemokine receptor and ligand gene expression of prostate tumor cell lines in tissue culture, and -
Figure 16G illustrates relative abundance of cytokine ligands and receptors after subcutaneous implantation compared with expression in tissue culture;
-
-
Figure 17 illustrates CCR5 antagonists blocking spinal osteolytic prostate cancer metastasis. Results from an experiment wherein PEC lines transduced with vectors expressing the Luc2-Tomato-Red fusion protein were injected into the ventricle of FVB mice and the in vivo bioluminescent signal was quantified after 2 weeks are shown inFigures 16A-16D :-
Figure 17A illustrates representative examples of mice from each group are shown (Mice were treated with oral maraviroc (8 mg/kg) or control), -
Figure 17B illustrates photon flux as a volumetric analysis of total tumor mass, -
Figure 17C illustrates lower limb bony mass in the mice (Data are mean + SEM for N=8 separate mice in each group, P< 0.05); and -
Figure 17D shows representative X-ray images of lower limb bony mass in the mice.
-
-
Figures 18A-18H illustrate flurine- 18, sodium fluoride ("F- 18-NaF") imaging correlated with X-ray analysis demonstrated the presence of spine metastasis; -
Figures 19A and19B shows daily oral treatment with Maraviroc reduced spine metastasis by >90%; and -
Figure 20 illustrates data from tPEC cell line microarray. - The present subject matter will now be described more fully hereinafter with reference to the accompanying Figures and Examples, in which representative embodiments are shown. The present subject matter can, however, be embodied in different forms and should not be construed as limited to the embodiments set forth herein. Rather, these embodiments are provided to describe and enable one of skill in the art. Unless otherwise defined, all technical and scientific terms used herein have the same meaning as commonly understood by one of ordinary skill in the art to which the subject matter pertains.
- New treatments for diseases, such as cancer and in particular prostate cancer, require new testing regimes in animals. These testing regimes have been limited by the lack of prostate cancer cell lines that can be implanted in immune competent (or "immunocompetent") animals. This is important because the immune system plays an important role in the onset and progression of human prostate cancer. To screen of new drugs useful for treating patients with prostate cancer it is necessary to develop prostate cancer cell lines that can be studied in immune competent animals, which reflect the human disease by histology, and undergo the same type of behavior in vivo, including metastasis to the lungs and bones as occurs in human disease.
- Cancer cell lines that can be implanted in immune competent, or immunocompetent, animals, including humans and non- human animals, including mammals, are disclosed. Exemplary non-human mammals include, for example, rodents such as rats, guinea pigs, and mice, and farm animals such as pigs, sheep, goats, horses, and cattle.
- As any type of cell in the body may be a source of cancer, any suitable type of cancer cell line may be used. A suitable cancer type includes carcinoma (cancer of the epithelial cells), sarcoma (cancer of the bone, muscle or other connective tissues), lymphoma (cancer of the lymphatic system), leukemia (cancer of blood cells or blood precursor cells) and melanoma (cancer of the pigment-providing cells).
- A prostate cancer cell line is provided, wherein the prostate cell line comprises at least one or more of a set of primary mammalian epithelial cells which have been infected with a retroviral vector carrying an oncogene selected from the group consisting of c-Myc, Ha-Ras, NeuT, c-Src and combinations thereof, and wherein said oncogene or combinations of genes are expressed.
- In one embodiment, a mouse prostate cancer cell line is provided, wherein murine prostate cells are transduced with an oncogene selected from the group consisting of c-Myc, Ha-Ras, NeuT, c-Src and combinations thereof. Suitable mouse prostate cell line can be obtained by infecting the primary murine epithelial cells with a retroviral vector carrying the oncogene under conditions that allow the oncogene to be expressed in the primary murine epithelial cells.
- Transgenic immunocompetent mouse models of human cancers, for example, have the potential to be more reflective of human cancers than xenograft models because, inter alia, transgenic mice form tumors in situ, (i.e., in an environment more similar to the human tumor and in the setting of a normal immune system). Therefore, immunocompetent non-human mammals may be engineered to express one or more of the oncogenes described herein, including c-Myc, Ha-Ras, NeuT, c-Src or combinations thereof, and to develop cancer
- There several advantages to using transgenic mouse models of human cancer in research. For example, small-animal X-ray computed tomography (microCT) could be used to monitor progression of tumor relatively cheaply and also as highly quantitative three- dimensional method for visualizing blood vessels and angiogenesis preclinically. Using such a method it is possible to achieve rapid and accurate assessment of vascularity during preclinical therapeutic trials in living mice. Tumor assessment with microCT enables rapid qualitative visual renderings of data as well as quantitative analysis of tumor blood volume, vessel density, vessel caliber, degree of branching, and tortuosity using segmentation analysis.
- Examples of immunocompetent mice that are suitable include (random bred CD1, Charles River Laboratories, St. Constant, PQ), C57BI/6J (B6), C57BI/6x 129/J Fl (Fl, Jackson Laboratories, Bar Harbor, ME), FVB/N, C57BV6, BALB/c and ND4.
- FVB/N mice may be used to engineer the transgenic mouse models. FVB/N mice are suitable for most transgenic experiments and genetic analyses contemplated and/or described herein. The inbred FVB/N strain is characterized by vigorous reproductive performance and consistently large litters and fertilized FVB/N eggs contain large and prominent pronuclei, which facilitate microinjection of DNA.
- An immunocompetent transgenic mouse created using the mammalian prostate cancer cell line described herein develops a prostate tumor capable of producing a detectable molecular genetic signature based on an expression level of one or more of a set of oncogenes selected from the group consisting of c-Myc, Ha-Ras, NeuT, c-Src and combinations thereof
- Metastasis is the leading cause of death in cancer patients. Current chemotherapeutic anti-cancer treatments use cytotoxic, hormonal or immunomodulator drugs aimed at decreasing the number of cancer cells in the patient's body. However, a growing body of evidence suggests that most metastatic cells are resistant to anti-cancer drugs and therefore currently available drugs are not effectively stopping the dissemination of cancer cells to other tissues or organs. At present, there is no effective method for treating most metastatic tumors despite the numerous and diverse therapeutic innovations in the cancer therapeutic field.
- A "vector" or "construct" refers to a macromolecule or complex of molecules comprising a polynucleotide to be delivered to a host cell, either in vitro or in vivo. The polynucleotide to be delivered may comprise a sequence of interest for gene therapy. Vectors include, for example, transposons and other site-specific mobile elements, viral vectors, e.g., adenovirus, adeno-associated virus (AAV), poxvirus, papillomavirus, lentivirus, herpesvirus, foamivirus and retrovirus vectors, and including pseudotyped viruses, liposomes and other lipid- containing complexes, and other macromolecular complexes capable of mediating delivery of a polynucleotide to a host cell, e.g., DNA coated gold particles, polymer-DNA complexes, liposome-DNA complexes, liposome-polymer-DNA complexes, virus-polymer-DNA complexes, e.g., adenovirus-polylysine-DNA complexes, and antibody-DNA complexes. Vectors can also comprise other components or functionalities that further modulate gene delivery and/or gene expression, or that otherwise provide beneficial properties to the cells to which the vectors will be introduced. Such other components include, for example, components that influence binding or targeting to cells (including components that mediate cell-type or tissue-specific binding); components that influence uptake of the vector nucleic acid by the cell; components that influence localization of the polynucleotide within the cell after uptake (such as agents mediating nuclear localization); and components that influence expression of the polynucleotide. Such components also might include markers, such as detectable and/or selectable markers that can be used to detect or select for cells that have taken up and are expressing the nucleic acid delivered by the vector. Such components can be provided as a natural feature of the vector (such as the use of certain viral vectors which have components or functionalities mediating binding and uptake), or vectors can be modified to provide such functionalities. A large variety of such vectors are known in the art and are generally available. When a vector is maintained in a host cell, the vector can either be stably replicated by the cells during mitosis as an autonomous structure, incorporated within the genome of the host cell, or maintained in the host cell's nucleus or cytoplasm.
- Human Prostate cancer has embedded within the genetic makeup and signatures that reflect oncogenic signaling. The cell lines described herein advantageously reflect one or more of these oncogenic signaling pathways, thus facilitating, for example, the testing of oncogene specific compounds or nucleic acids based therapies. In particular, prostate cancer cell lines as provided herein are useful for the testing of and/or screening for oncogene specific compounds or nucleic acids based therapies.
- Examples of suitable oncogene specific inhibitors include inibitors for c-Myc, Ha-Ras c-Src, and ErbB2 oncogenes. Several suitable anti-cancer agents targeting the ErbBs, which are in clinical use or development, including those that fall in the categories of chimeric or humanised monoclonal antibodies against the ErbB family and Small Molecule ErbB Tyrosine Kinase Inhibitors. The chimeric or humanised monoclonal include antibodies that prevent ligand-binding and ligand-dependent receptor activation (e.g., Cetuximab that targets the ligand-binding subdomain III of ErbB1), antibodies that interfere with ligand-independent receptor activation (e.g., Trastuzumab that targets subdomain IV of ErbB2), and antibodies that prevent receptor heterodimerisation (e.g. the anti-ErbB2 antibody Pertuzumab that targets an area around the dimerisation loop in subdomain II of ErbB2). Exemplary Small molecule ErbB tyrosine kinase inhibitors include two ErbB 1-specific tyrosine kinase inhibitors Gefitinib/Iressa and Erlotinib, which have been approved for the treatment of non-small cell lung cancer, and the dual ErbBl/ErbB2 inhibitor Lapatinib, which is marketed as TYKERB® and is indicated in combination with capecitabine for the treatment of patients with advanced or metastatic breast cancer; and in combination with letrozole for the treatment of postmenopausal women with hormone receptor positive metastatic breast cancer that overexpresses the HER2.
- Other ErbB2 receptor inhibitors include GW-282974 (Glaxo Wellcome PLC), and the monoclonal antibodies AR-209 (Aronex Pharmaceuticals Inc. of The Woodlands, Tex., USA) and 2B-1 (Chiron). Exemplary ErbB2 inhibitors also include those described in
WO 1998/02434 (published Jan. 22, 1998 WO 1999/35146 (published Jul. 15, 1999 WO 1999/35132 (published Jul. 15, 1999 WO 1998/02437 (published Jan. 22, 1998 WO 1997/13760 (published Apr. 17, 1997 WO 1995/19970 (published Jul. 27, 1995 U.S. Pat. No. 5,587,458 (issued Dec. 24, 1996 ), andU.S. Pat. No. 5,877,305 (issued Mar. 2, 1999 ). ErbB2 receptor inhibitors are also described inU.S. Provisional Application No. 60/117,341, filed Jan. 27, 1999 U.S. Provisional Application No. 60/117,346, filed Jan. 27, 1999 - Examples of c-Src protein tyrosine kinase inhibitors that are useful include, but are not limited to, the compounds which are generically and specifically disclosed in
WO 1996/10028 WO 1997/28161 WO 1997/32879 WO1997/49706 

- The above compounds can be prepared and administered as described in the cited documents. The compound of formula I can be prepared and formulated as described in
WO 1996/10028 WO 1997/16452 WO 1997/16452 - Additional useful compounds (e.g., PP1) are described by T. Schindler, F. Sicheri et al. in Molecular Cell, 1999 (3), 639, 647; J. M. Hamby et al, J. Med. Chem. 40, 1997, 2296- 2303; R. L. Panek et al, J. Pharmacol. Exp. Ther. 283, 1997, 1433-1444; and S. R. Klutchko et al, J. Med. Chem. 41, 1998, 3276-3292.
- Other src inhibitors include S I606, also known as bosutinib (by Wyeth) and the compound dasatinib, also know as Spyrcel (by Bristol-Myers Squibb) which is disclosed in
WO 2000/62778 U.S. Pat. No. 6,596,746 . - Small-molecule c-Myc inhibitors include 10074-G5, also known as Biphenyl-2-yl-(7-nitrobenzo[1,2,5]oxadiazol-4-ylamine; Quarfloxin (also known as CX-3543); and 10074-G5, also known as Biphenyl-2-yl-(7-nitrobenzo[1,2,5]oxadiazol-4-ylamine. CX-3543 reportedly suppresses c-Myc activity by binding to the c-Myc quadruplex, four-stranded DNA secondary structures that regulate transcription of specific oncogenes including c-Myc.
- Other c-Myc inhibitors include the compounds disclosed in United States Patent Application Publication No.
2007/0203188 (published August 30, 2007 ). - A method for the in vitro production of immortalized primary mammalian epithelial cells is provided, the method comprising infecting primary mammalian epithelial cells with a retroviral vector carrying an oncogene selected from the group consisting of c-Myc, Ha-Ras, NeuT, c-Src and combinations thereof to provide infected cells, wherein said primary mammalian epithelial cells are capable of being infected by said retroviral vector and under conditions whereby the c-Myc, Ha-Ras, NeuT, c-Src and combinations thereof are expressed in said infected cells.
- Any suitable gene delivery system can be used. Particular examples of suitable gene delivery systems include Retroviral and Adenoviral Expression Systems. Retroviral-mediated gene transfer is widely used to express proteins in a variety of cell lines, including hematopoietic cells for a variety of reasons, including analysis of their effects on blood cell proliferation, differentiation, and biological function. In particular, the Murine Stem Cell Virus ("MSCV") Retroviral Expression System (by Clontech Laboratories, Inc) contains vectors that are optimized for introducing and expressing target genes in pluripotent cell lines, including murine or human hematopoietic, embryonic stem (ES), and embryonal carcinoma (EC) cells. Particular examples of Adenoviral Expression Systems, include the ViraPower™ Adenoviral Expression System (by Life Technologies), which is useful, for example, for creation of a replication-incompetent adenovirus that can be used to deliver and transiently express target gene(s) of interest in either dividing or non-dividing mammalian cells.
- Also provided is a method for diagnosing a prostate cancer, the method comprising: (a) providing a biological test sample from a subject afflicted with a prostate cancer or suspected of having prostate cancer or at risk for developing prostate cancer; (b) determining a level of at least one biological marker or a molecular genetic signature based on a gene expression pattern in the test sample that is associated with the diagnosis of the prostate cancer;(c) comparing the level of said at least one biological marker or said molecular genetic signature in said test sample to the level of the biological marker or the level of the molecular genetic signature in a control sample, wherein an elevated level of the biological marker or the molecular genetic signature in said test sample relative to the level of the biological marker or the molecular genetic signature in said control sample is a diagnostic indicator of the presence of prostate cancer in said subject.
- Biological specimens may include nucleic acid derived from the tumor under obtained from the patient. Nucleic acid may be derived from the tumor either by biopsy, or from cells derived from the tumor in urine or proteins made as a consequence of the gene signature secreted into the patients blood.
- Further provided is a method of classifying a prostate tumor, the method comprising: (a) providing a prostate tumor sample; (b) detecting a molecular genetic signature derived from gene expression pattern or activity of one or more of a set of genes in the sample, wherein the genes are selected from the group consisting of c-Myc, Ha-Ras, NeuT, c-Src and combinations thereof; and (c) classifying the prostate tumor as belonging to a tumor subclass based on the results of the detecting step.
- Also disclosed is a method of stratifying a subject having a cancer tumor, including a prostate tumor, for a clinical trial, the method comprising: (a) providing a sample derived from a subject having the cancer tumor or the prostate tumor; (b) detecting a molecular genetic signature derived from gene expression pattern or activity of one or more of a set of genes in the sample, wherein the genes are selected from the group consisting of c-Myc, Ha-Ras, NeuT, c-Src, ErbB2 and combinations thereof; and (c) stratifying the subject for a clinical trial based on the results of the detecting step.
- Subjects may be stratified into subcategories that are based on the presence of a molecular genetic signature and/ or the functional pathways linked to the molecular genetic signature.
- The molecular genetic signature may be based on a gene expression pattern or activity of one or more of a set of genes in a test sample derived from a subject having a cancer tumor, in particular prostate cancer tumor, wherein the one or more set of genes are selected from the group consisting of c-Myc, Ha-Ras, NeuT, c-Src and combinations thereof
- Also provided is a method of selecting a treatment for a subject having a prostate tumor, the method comprising: (a) providing a sample derived from a subject having a prostate tumor; (b) detecting a molecular genetic signature derived from gene expression pattern or activity of one or more of a set of genes in the sample, wherein the genes are selected from the group consisting of c-Myc, Ha-Ras, NeuT, c-Src and combinations thereof; and (c) selecting a treatment based on the results of the detecting step (b). (ie oncogene based therapies would be given based on the onco signature in the patients tumor)
- Further disclosed is a non-naturally occurring cell produced by transforming a cell with one or more exogenous oncogenes, allowing the cell to divide at least once, wherein the cell is a human cell transformed by a vector containing the one or more exogenous oncogenes, wherein the one or more exogenous oncogenes are selected from the group consisting of c-Myc, Ha-Ras, NeuT, c-Src and combinations thereof. The signature could be applied to genetic material derived from the prostate cancer - i.e. in biofluids related to the prostate including prostate, urine, blood or other biospecimens. The signature may also be applied to other cancer types in particular as shown for breast cancer. In the case of the c-Myc signature the signature is seen in both prostate tumors and in the breast tumors derived from transgenic expression of c-Myc in the mammary gland of transgenic mice (
Figure 7C ). - A cancer may be identified by obtaining a biological sample from a subject afflicted with prostate cancer or suspected of having prostate cancer or at risk for developing prostate cancer and determining whether genetic material from the biological sample has a genetic signature as described herein. The biological sample may be derived from a prostate biopsy.Alternatively, the biological sample is derived from biofluids related to the prostate, including prostate, urine, blood or other biospecimens. The method may include massaging a prostate prior to obtaining a urine sample for genetic signature identification. The method may include other fluids as described above.
- New treatments require new testing regimes in animals. These studies have been limited by the lack of prostate cancer cell lines that can be implanted in immune competent animals. The immune system plays an important role in the onset and progression of human prostate cancer. To enable screening of new drugs to treat patients with prostate cancer it is necessary to develop prostate cancer cell lines that can be studied in immune competent animals, that reflect the human disease by histology, and the same type of behavior in vivo, including metastasis to the lungs and bones as occurs in human disease. The methods related to the creation of these cell lines that can be used in immune competent mice is described in the
supplement 3. - Oligonucleotide sequences can be introduced into cells as is known in the art. Transfection, electroporation, fusion, liposomes, colloidal polymeric particles and viral and non-viral vectors as well as other means known in the art may be used to deliver the oligonucleotide sequences to the cell. The method of delivery selected will depend at least on the cells to be treated and the location of the cells and will be known to those skilled in the art. Localization can be achieved by liposomes, having specific markers on the surface for directing the liposome, by having injection directly into the tissue containing the target cells, by having depot associated in spatial proximity with the target cells, specific receptor mediated uptake, viral vectors, or the like. Oncogenes can be introduced into cells by transduction or transfection. Transduction can conducted using either retroviral or other viral delivery systems
- Experimental procedures with transgenic mice were approved by the ethics committee of Thomas Jefferson University. Mice were in the FVB strain. Mouse prostate epithelial cell culture were isolated from prostate glands of 12 week old male mice and maintained as previously described [42] and analyzed after 25 passages with at least three lines of each genotype. Transduction of cells by the retroviral expression vector encoding either c-Myc, Ha-Ras, v-Src, NeuT, in the vector pBABE-IRES-GFP, was previously described [43, 44].
- Cells were seeded in 24-well-plates at a concentration of 1x10⁴ cells / well, each sample in triplicate x 7 days. Growing transformed cells in DMEM medium with 10% FBS, while control PEC cells were cultured in prostate epithelial primary culture medium. Harvest cells every 24 hours, suspended cells in 100 µl PBS, added an equal volume of 0.4% Trypan blue, after 5 minutes counted cells by Countess™ Autocounted Cell Counter (C10227, Invitrogen Carlsbad, CA).
- Cells (3x10³/ml) were seeded into 0.3% soft agar Sigma) in a suspension dish (Nalgene Nunc International, Rochester, NY). Colonies were stained by 0.04% crystal violet acetate and counted under a vertical microscope after 2 weeks of incubation.
- 1x10⁶ cells in 100 µl volume were injected subcutaneously into 7∼8 weeks FVB male mice. Cell suspension we mixed with a 20% by volume BD Matrigel (BD Biosciences, Bedford, MA), resulting in a final cell concentration of 10-7 cells/ml. Tumor growth was measured by vernier calipers twice a week. Tumor samples were harvested after 30 days (except NeuT-induced tumors which were harvested after 16 days).
- The PEC (prostate epithelial cells) lines transformed with Ha-Ras, v-Src, and NeuT oncogenes were generated and transfected with a lentiviral vector containing the luc2 gene to generate stable bioluminescent cancer cell lines. The Luc2-tomato red expression vector was previously described (Liu, H., et al., Proc Natl Acad Sci U.S.A. 2010, 107, 18115-18120). The isogenic PEC lines were maintained in Dulbecco's modified Eagle's medium (DMEM) supplemented with 10% fetal bovine serum (FBS) and 1% penicillin-Streptomycin and cultured in 5% CO2 at 37 °C.
- Cells were grown to confluence on 12-well plates in DMEM medium containing 10% FBS. The monolayers were wounded with a P10 micropipette tip. The cells were washed immediately after scoring with PBS and serum-free DMEM was added (16). The cell migration was monitored for 20h, and pictures were taken at 9h, 12h, 15h and 20h time points using an
Axiovert 200 Zeiss microscope system. Images were analyzed using ImageJ software. - Mouse cytokine arrays spotted on nitrocellulose membrane were obtained from Raybiotech. Conditioned medium was prepared by culturing cells in serum-free DMEM for 48hours. Membranes were then processed according to the manufacture's instructions for assessment of secreted cytokines in conditioned medium (see Katiyar, S. et al., Mol Cell Biol 2007, 27, 1356-1369).
- Male nu/nu mice, 12weeks old, were anesthetized by exposure to 3% isoflurane. Anesthetized mice received 1x10⁶ cells suspended in 50µL of Dulbecco's Phosphate Buffer Saline lacking of calcium and magnesium (DPBS) and 50µL of BD Matrigel Membrane Basement (BD Biosciences, Bedford, MA) by subcutaneous injection below one dorsal flank. The injection has been performed using 27G½ needle. Tumor progression has been followed by bioluminescence measurement once a week until tumor excision using as described previously (18). Three mice at a time were monitored dorsally. Regions of interest (ROI) from displayed images were drawn around the tumor sites or the metastatic lesion and quantified using the Living Image 3.0 software. (Caliper Life Sciences). Tumor samples were harvested after 3 weeks. All experiments involving mice were carried out under the approval of Thomas Jefferson University's IACUC.
- Male FVB mice, 8 weeks old, were anesthetized by exposure to 3% isoflurane. 2x10⁵ cancer cells suspended in 100µL of DPBS were injected into the left ventricle of the heart of the mouse. Injections were performed using a 30G½ needle and a 1mL syringe. To confirm the presence of cells in the systemic circulation, animals were imaged using IVIS LUMINA XR system (Caliper Life Sciences, Hopkinton MA). A successful intracardiac injection was indicated by systemic bioluminescence distributed through the animal body. Mice not properly injected were removed from the study. In order to in vivo imaging mice, animals received the substrate of luciferase, DLuciferin (Gold Biotechnology), at 15mg/mL in PBS by intraperitoneal injection of 10 µL of Luciferin stock solution per gram of body weight (manufacturer's recommendation) and were anesthetized by exposure to 3% isoflurane. At 10-15 minutes after D-luciferin injection animals were placed inside the camera box of the IVIS Lumina XR (Caliper Life Sciences, Hopkinton MA) and received continuous exposure to 2.5% isoflurane. Imaging times ranges from 5 seconds (for later time points) to 5 minutes (for earlier time points), depending on the bioluminescence of metastatic lesion. Only one mouse was imaged ventrally. Results were analyzed using Living Image 3.0 software. For ex vivo BLI, D-Luciferin was diluted in PBS to final concentration of 300µg/mL and used to soak freshly isolated organs for 2 to 3 minutes before imaging. Animal experiments were approved by the Thomas Jefferson University's IACUC.
- Development of bone metastasis was monitored by X-ray radiography using IVIS Lumina XR (Caliper Life Sciences). Mice were anesthetized, arranged in prone position and exposed to an X-ray for 5 min. Administration of Maraviroc (antagonist of CCR5). Male FVB mice received an oral dose of Maraviroc (Selleck Chemicals LLC) of 8mg/kg every 12 hours since 5 days before inoculation of cancer cells as well as after ic injection until euthanasia. The drug was dissolved in water containing 5% DMSO and 0.5% IN HCl. Control mice were maintained on an identical dosing schedule and received same injection of volume of vehicle.
- The three-dimensional invasion assay was performed as previously reported. Briefly, 100 ml of 1.67 mg/ml Rat Tail collagen type I (BD Biosciences) was pipetted into the top chamber of a 24-well 8 mm pore transwell (Corning, Lowell, MA). The transwell was incubated at 37°C overnight to allow the collagen to solidify. 30,000 cells were then seeded on the bottom of the transwell membrane and allowed to attach. Serum-free growth medium was placed into the bottom chamber, while 10ug/mlosteopontin (R&D System), or 15ng/ml CCL5 (R&D System), or 10% FBS was used as a chemo attractant in the medium of the upper chamber. The cells were then chemo attracted across the filter through the collagen above for three days. Cells were fixed in 4% formaldehyde, permeabilized with 0.2% Triton-X in PBS and then stained with 40 mg/ml propidium iodide (PI) for 2 h. Fluorescence was analyzed by confocal zsections (one section every 20 mm) at 10x magnification from the bottom of the filter using a Zeiss LSM 510 Meta inverted confocal microscope at the Kimmel Cancer Center Bioimaging Facilit.
- Tumor samples and soft tissues were fixed in 4% para-formaldehyde (PFA, Fisher) and processed for paraffin bedding, sectioning, H&E andimmunohistochemistry (IHC). Bones were fixed in 4% PFA at 4°C for 72h, decalcified in 0.5M EDTA (pH 8) for 7 days at 4°C, and embedded in paraffin (19). vWF staining on tumor sections was performed by the Pathology Core Facility of KCC. CK14 (Covance) PRB-155P and CK8 (clone1E8, Covance) MMS-162P staining was performed after deparaffinization and rehydration without performing the antigen retrieval treatment on bones and brains samples to distinguish basal from luminal prostate epithelial cells. TRAP (tartrate-resistant acid phosphatase) staining was performed after deparaffinization and rehydratation as directed by the manufacturer (Sigma-Aldrich) to identify active osteoclasts at the surface between metastatic lesion and compact bone (5) (20). Tetrachrome method was performed on bones to identify woven bone in the osteoblastic lesion areas (5,21). (RV202, Santa Cruz Biotechnology) staining was performed only on brain samples to discriminate sarcoma from carcinoma.
- Whole brains and legs after removing skin and muscles were flash-frozen in optimal cutting temperature media (OCT compound Tissue Tek) and stored at -80 °C. Tissues were sectioned on a cryostat () and mounted on membrane slides NF 1.0 PEN. LCM was performed using PALM Microbeam system (Carl Zeiss) and PALM Robo v4.2 software. The frozen sections were stained with cresyl violet (LCM staining kit, Ambion). The capture was completed within 2 hours from the staining step to assure quality RNA. Tissue collected in the adhesive caps (Carl Zeiss) was directly stored at -80°C with the cap down. Captured cells were lysed and RNA extracted as manufacturer's recommendations (RNeasy Micro Kit Qiagen). (see Bos, P. D. et al. Nature 2009, 459, 1005-1009; and Wang, W. Z. et al. BMC ). The integrity of RNA was checked using 2100 Bioanalyzer (Agilent) by Nucleic Acids Facility at KCC. RNA quality assessment is based on the RNA Integrity Number (RIN).
- Preprocessing and Differential Expression Analysis. Microarray data was preprocessed using background correction, quantile normalization, and summarization were performed on the Mouse Gene 1.0 ST gene expression microarrays using the Robust Multichip Analysis (RMA) workflow in Affymetrix Expression Console version 1.1 [Affymetrix, Inc., Santa Clara, CA]. Differentially expressed genes were identified for each of the four over-expressing cell lines, by performing pairwise comparisons against the Pec control cell line. These comparisons were performed using significance analysis of microarrays (SAM) with a false discovery rate cutoff of 1% and two-fold change cutoff.
- Western blot assays were performed in PEC cells as indicated. Cells were pelleted and lysed in buffer (50 mM HEPES, pH 7.2, 150 mMNaCl, 1 mM EDTA, 1 mM EGTA, 1 mM DTT, 0.1% Tween 20) supplemented with protease inhibitor cocktail (Roche Diagnostics, Mannheim, Germany). Antibodies used for Western blot are: AR (H-280, Santa Cruz Biotechnology).
- From the CGH data, copy gains and losses were determined for metastatic Src-transformed cells recovered from brains and bones relative to oncogene transformed cell lines. Genomic copy variation regions were identified as genomic segments where all three replicate samples of the metastatic Src-transformed cell line demonstrated a gain or loss relative to the Srctransformed cell line. Copy number data was summarized by plotting the frequency of gains and losses across the mouse genome.
- Animal Imaging was performed according to the Institutional Animal Care and Use Committee. Flurine-18, Sodium fluoride (F-18-NaF) in isotonic solution was obtained from IBA Molecular (Ashburn, VA). 210 ± 9.54 µCi of F-18-NaF in 150 µl was injected through lateral tail vain to unanesthetized mice. One hour later animals were anesthetized with 1.5 % sulfuring in 98.5% O2 and imaged with Inveon microPET scanner (Siemens Hoffman estate, IL). A high spatial resolution (1 mm in full width at half maximum) and sensitivity (>10%) PET scanner on average 1.5 Million counts was obtained in 10 minute imaging. An ordered-subset expectation maximization 3-diminsional (3D) algorithm with 5 iterations and 8 subset was used for demonstration.
- Comparisons between groups were analyzed by two-sided t-test. A difference of P < 0.05 was considered to be statistically significant. All analyses were done with SPSS 11.5 software. Data are expressed as mean ± SEM.
- Microarray data was preprocessed using background correction, quantile normalization, and summarization were performed on the Mouse Gene 1.0 ST gene expression microarrays using the Robust Multichip Analysis (RMA) [45] workflow in Affymetrix Expression Console version 1.1 [Affymetrix, Inc., Santa Clara, CA]. Differentially expressed genes were identified for each of the four over-expressing cell lines, c-Myc, NeuT, Ha-Ras, and v-Src, by performing pairwise comparisons against the PEC control cell line. These comparisons were performed using significance analysis of microarrays (SAM) with a false discovery rate cutoff of 1% and two-fold change cutoff.
- Differential expression patterns of the four oncogene over-expressing cell lines were compared against a previously published dataset including oncogene-transduced fibroblasts and induced mammary tumors [46]. This dataset was generated on the Affymetrix Murine 11K microarray A and B set and contains Ha-Ras-overexpressing samples, c-Myc overexpressing samples as well as normal controls. Raw data (Affymetrix .CEL files) from Huang et al. [46] were obtained from the publications website. The .CEL files were processed using RMA with updated probeset definition from the University of Michigan custom CDF website (
Entrez probesets version 12, dated July 30, 2009) [47]. A total of 6143 genes from this dataset were mapped to gene symbols and used for comparative analysis. Differential expression analysis was performed to identify differentially regulated genes specific to Ras and Myc cell lines vs. the controls using SAM with an FDR cutoff of 10%. The differentially expressed genes identified in this dataset were compared against our four oncogene over-expressing cell lines. - A receiver operating characteristic (ROC) curve was used to plot the sensitivity and specificity over the range of discriminative values for PSA at diagnosis and correlation with the c-Myc signature [29-31]. For the evaluation of PSA, samples with abnormal PSA and a clinical metastasis event were considered true positives, and samples with abnormal PSA and no clinical metastasis event were considered false positives. For the evaluation of the c-Myc signature, samples with high correlation with the signature and clinical metastasis were considered true positives, and samples with low or negative correlation and a clinical metastasis event were considered false positives.
- Gene signatures exclusive to each of the four oncogene-transformed prostate cancer cell lines were compared against two previously published prostate datasets. The first dataset comprises 185 samples log2 normalized mRNA expression data was downloaded from the MSKCC prostate cancer database website (http://cbio.mskcc.org/cancergenomics/prostate/data/) [20]. Gene profiles in this MSKCC dataset were median-centered and Pearson's correlation was computed between each MSKCC sample and the log2 fold change profile for each oncogene-specific signature. The second prostate cancer dataset, including distant metastasis samples, was previously obtained from the MSKCC Gerald Laboratory and samples were processed as described in [33]. Briefly, microarray samples were processed using the Robust Multichip Average (RMA) procedure [45] with custom CDFs dated July 30, 2009 (version 12) [47].
- The expression patterns of the four oncogene over-expressing cell lines were compared against expression data for clinical traits including disease stage, grade, and recurrence, previously published by Lapointe et al. [3]. The dataset was downloaded from the publications website. This dataset contains 5153 probesets and 112 prostate cancer samples with annotations including tumor grade, tumor stage, and disease recurrence. Probeset annotations were updated using the Array Information Library Universal Navigator GPL3044 annotation file dated 7/9/2009 [48]. Probetsets lacking gene symbol annotations were eliminated as well as probesets with at least 25% missing values, resulting in a total of 4232 features for 3327 unique genes. Differential expression analysis was performed for advanced stage vs. early stage, high grade vs. low grade, and recurrent vs. nonrecurrent disease, using SAM with an FDR cutoff of 25%. The differentially expressed genes identified in this dataset were compared against the four oncogene over-expressing prostate cancer cell lines. Significance in the overlap between the differentially expressed genes from the LaPointe dataset and genes in our data was evaluated using the hypergeometric test.
- All upregulated genes meeting at least a twofold change cut off from the four oncogene over-expressing cell lines were investigated for their relationship to disease recurrence by using a previously published microarray dataset with clinical data for recurrence-free survival [11]. Microarray data that was processed with Affymetrix Microarray Suite v.5.0, as described in [11], and clinical data for each prostate sample were downloaded from the supplementary information section of the author's website (http://www.ordwayresearch.org/Glinsky-Supplemental2.htm1). Data was log2 transformed and for each of the four cell lines, and genes with multiple probesets were handled by averaging them together and scaling them to the probeset with the largest variance. Genes with variance in the lowest 50th percentile were filtered out of the analysis. The average expression for each of the four lines over-expression signatures in the recurrence dataset was used to divide the population into the high (upper 25th percentile) and low (lower 75th percentile) expression group. Recurrence-free survival curves were plotted for the high and low expression populations, and significant p values were calculated using the log rank test.
- Primary prostate epithelial cell cultures were established from the ventral prostates of FVB mice (
Fig. 1A ). Cells were transduced with retroviral expression vectors encoding a single distinct oncogene (c-Myc, Ha-Ras (V-12), v-Src and NeuT, an activating mutant of ErbB2). The cellular morphology of the prostate epithelial cells was altered over the four-week period (Fig. 1B ). Individual colonies of oncogene-transduced cells were selected and characterized. Cellular growth assays were conducted by cell counting (Fig. 1C ). A substantial growth advantage was observed in each oncogene transduced cell line compared with primary prostate epithelial cells. - Western blot analysis was conducted to examine the relative expression of each of the oncogenes used to transduce the PEC. The presence of oncogenic c-Myc, Ha-Ras, ErbB2 and v-Src was identified by Western blot. The increase in abundance of each oncogene was specific to each cell line (
Fig. 2A ). The relative abundance of Src was increased in each of the lines compared to primary PEC and was approximately 2-fold greater in v-Src transformed PEC compared with the other tumor cell lines (Shorter exposure,Fig. 2A ). Oncogene transformation of fibroblasts or murine epithelial cells conveys contact-independent growth in solid agar. The oncogene transduced PEC lines were examined for growth in soft agar. Colony size and number were characterized for each oncogene (Fig. 2B ) [27]. Non-transformed PECs failed to grow in soft agar as previously described [27]. Oncogene transduction increased the size and number of colonies (Fig. 2C, D ). - Tumor formation studies were conducted in FVB mice. A subcutaneous injection of 1x10⁶ cells resulted in tumor growth. Serial measurements were conducted by vernier calipers. Each of the prostate tumor lines grew subcutaneously in immune competent mice. Growth was sustained for c-Myc, Ha-Ras and v-Src transformed PECs (
Fig. 3A ). The extirpated tumors were hemorrhagic (Fig. 3B ) with histological features of poorly differentiated prostate adenocarcinoma (Fig. 3C , Supplement 1). Immunostaining of tumors for Von Willebrand factor (VWF) confirmed angiogenesis and demonstrated significantly greater VWF staining in tumors induced by Ha-Ras (Supplement 2A, B). The tumor stained for CK5, AR, MUC1 and MGK (the murine homologue of PSA) (Supplement 2C). Lung metastases were characterized at autopsy by histopathological assessment as described in the Materials and Methods (Fig. 4A ). The number of lung metastases derived from the primary PECs were increased in the Ha-Ras, v-Src and c-Myc sublines (Fig. 4B ). - In order to further characterize the molecular genetic signaling pathways regulated by specific oncogenes in prostate epithelial cells, mRNA was prepared from the oncogene transformed PEC cell lines. Microarray analysis identified a total of 2635 out of 22115 genes that were significantly altered in expression (at least two-fold change) in oncogene over-expressing cell lines when compared with non-transformed prostate epithelial cell control samples (
Fig. 5 ). The heatmap of genes identified as significantly different in their expression (at least 2-fold change) is shown inFigure 5 . The rows of the heatmap represent unique genes and are displayed by their pattern of up- and down-regulation for all four of the oncogene induced cell lines A sizable number of up- and down-regulated genes were shared amongst all four cell lines (Group 1; 251 genes). Forexample Group 1 contains genes that share differential expression patterns across all four cell lines, whilegroup 15 contains genes whose differential expression is specific to the Src cell lines. Genes with up and down-regulation specific to Ha-Ras were the most prevalent (Group 14; 584 genes), followed by c-Myc-specific genes (Group 8; 332 genes), NeuT-specific genes (Group 12; 277 genes), and v-Src-specific genes (Group 15; 215 genes). - The prostate "oncogene expression signature" was defined as genes that were significantly altered in expression level and that were uniquely altered in expression by a specific oncogene compared with primary prostate epithelial cells (
Fig. 5 ). The oncogene expression signature thereby identified was compared to gene signatures obtained from other published databases to identify similarities to other well-studied disease phenotypes and cell lines. Comparisons were performed against gene signatures representative of differential expression in advanced state vs. early stage prostate cancer, high grade vs low grade prostate cancer, recurrent vs. nonrecurrent prostate cancer [3]. The gene signature heatmaps representing advanced stage/early stage, high grade/low grade, and recurrent/nonrecurrent prostate cancer phenotypes [3] (Figure 6A,B ) are shown on the left and the heatmaps on the right represent genes that are differentially expressed in the prostate oncogene expression signature. The heatmaps inFigures 6-8 are labeled with the percentage of genes within the "oncogene expression signature" that are differentially expressed. P values for the statistical significance of the similarity between the genes expressed in the prostate cancer cell lines and the gene signature of the disease phenotype are shown. P values are based on the hypergeometric distribution and represent the probability of these genes being differentially expressed in the disease phenotype if they were selected at random. Low p values indicate a degree of similarity between an oncogene cell line and a disease phenotype that is unlikely to occur merely by chance. - A "high grade" prostate cancer gene signature was previously determined from 61 primary prostate tumors [3].
Figure 6A shows that 34 genes from the prostate oncogene expression signature were common to the high grade gene signature (p = 2.97 x 10⁻⁵). For each oncogene induced prostate cancer cell line, the proportion of significant genes contributing to that cell line is shown. For example, the overlap between the prostate oncogene expression signature and high grade disease includes a combination of genes that are significant genes in c-Myc (47%), NeuT (53%), Ha-Ras (71%), and v-Src (62%).Figure 6B depicts the 72 genes that were common between the prostate oncogene signature and the advanced stage gene signature (p= 4.13 x 10⁻⁸). These results indicate a significant degree of similarity between the prostate oncogene expression signature and high-grade disease (p = 2.97 x 10⁻⁵) and between the oncogene expression signature and the advanced stage disease phenotype (p= 4.13 x 10⁻⁸). - No significant overlap was identified between the prostate oncogene expression signature and the recurrent/nonrecurrent disease signature identified by Lapointe et al. [3]. When the prostate oncogene expression signature was compared with the Lapointe data, the Ha-Ras cell line captured the highest level of similarity with high grade disease (71%), while the v-Src cell line showed the highest similarity with advanced stage disease (67%).
- In previous studies we identified gene expression signatures that were specific to the oncogene used to transform fibroblasts (3T3 cells) that were recapitulated in mammary tumors induced by c-Myc or Ha-Ras [28]. The previously defined c-Myc and Ha-Ras induced molecular signature was compared with the gene expression signature induced by these oncogenes in the prostate cancer epithelial cells. The heatmaps in
Fig. 7A depicts the genes shared between c-Myc transduced fibroblasts (Fig. 7A ), c-Myc-induced mammary tumors (Fig. 7C ) (left-hand heatmaps) and the c-Myc induced prostate oncogene expression signature (right-hand heatmaps). A significant overlap was identified between the prostate oncogene expression signature and the genes differentially regulated by c-Myc transduction in mouse fibroblasts (108 genes, hypergeometric p = 5.84x10⁻¹²) or mammary tumors (363 genes; hypergeometric p = 7.5916e-012). Within the prostate oncogene expression signature, c-Myc cell lines demonstrated the largest proportion of similarity with both the Myc transduced fibroblasts (92%) (Fig. 7A ) and the c-Myc-induced mammary tumors (85%) (Fig 7C ). - Comparisons of the prostate oncogene expression signature against Ha-Ras transduced fibroblasts (
Fig. 7B ). Significant overlap was identified between the prostate oncogene expression signature and genes differentially expressed upon Ras oncogene transduction in the mouse fibroblasts (64 genes, hypergeometric p = 5.65x10⁻⁹). Surprisingly, the Ha-Ras transformed prostate epithelial cell lines showed less commonality with the Ha-Ras transduced fibroblast signature (52%) (Fig. 7C ) than the v-Src, c-Myc, and NeuT cell lines. - ROC curves have been used previously to evaluate the diagnostic ability of PSA [29, 30] as well as its ability to identify metastatic disease [31]. In the MSKCC PCa samples, the c-Myc signature ROC curve exhibited better sensitivity/specificity characteristics than PSA, as evident in the area under the ROC curves. The area under the ROC curve represents the potential of a variable to discriminate between two conditions [32], indicating that the c-Myc signature performs as a better discriminator of metastatic disease than serum PSA levels.
- All the samples were obtained from publically available prostate cancer datasets [11, 20, 33]. This comparison showed that the c-Myc signature shows a positive correlation in a subset of tumor samples that is more evident in advanced stage tumors and anticorrelated with normal prostate tissue (
Figure 7E ). In contrast, the Ha-Ras and v-Src signatures are most consistently correlated with expression profiles within normal prostate tissue, and their correlation among tumor samples is more heterogeneous. - In order to examine the relationship between genes expressed in the oncogene transformed cell lines and survival rates from human prostate cancer, a previously published microarray dataset of human prostate tumor samples with known clinical recurrence-free survival time was used [11]. Genes in this published dataset that correspond to those upregulated in each of the four oncogene transformed prostate cancer cell lines, were used to assign the samples as high (upper 25th percentile) or low (lower 75th percentile). Kaplan Meier analysis was used to evaluate the difference in recurrence-free survival associated with high expression versus low expression of these genes.
Figure 8A provides a heatmap showing the expression profiles of genes in the human prostate cancer samples from the Glinsky's data set, which was upregulated in the oncogene-transformed prostate cancer cell lines. Genes that were highly expressed in each of the four prostate oncogene cell lines had a significant association with poor outcome (p<0.005) (Fig. 8B,E ). - (A) (I) FVB mice, (II) prostates were used to establish Primary prostate epithelial cells (PEC) as shown by phase contrast microscopy (ventral prostates of male FVB mice at 12 weeks of age). (B) Schematic representation of the methods deployed and phase contrast microscopy of oncogene induced cell lines derived from PEC transduced by distinct oncogenes (c-Myc, NeuT, Ha-Ras, v-Src). Photo of individual colonies derived from oncogene-transduced PEC that were selected and characterized. (C) Growth curves of PEC lines determined by cell counting. Data are mean ± SEM of N>3 separate experiments.
- (A) Western Blot analysis of 3 separate clones of each oncogene induced PEC shows antibodies were used for the detection of c-Myc, NeuT, Ha-Ras and v-Src as shown. GDI is used as a protein loading control. (B) Soft agar assays of oncogene transduced PEC. Non-transformed PEC failed to grow in soft agar. (C), (D) The size (C) and number (D) of colonies from oncogene transduced PEC lines are shown as mean ± SEM of N>5 separate experiments.
- (A) PEC tumor diameter, determined by vernier caliper measurement, is shown as days after inoculation in FVB mice. The diameter mean ± SEM for N>5 separate experiments. The NeuT tumors grew for 2 weeks then decreased in size. (B) Photograph of representative tumor derived from oncogene-induced lines. NeuT induced tumors were harvested at 15 days after cell injection. (C) Hemotoxylin and eosin and (D) VWF staining of PEC demonstrates poorly differentiated prostate adenocarcinoma with local vascularity.
- (A) Hemotoxylin and eosin stain of murine lung post tumor implantation demonstrating representative example of lung metastasis. (B) Frequency of lung metastases were detected in mice for c-Myc, NeuT and v-
Src PEC groups 5 weeks after subcutaneous injection. The rates were 100% frequency in Ha-Ras and v-Src groups. - (A) Overview of the two-way hierarchical clustering of three separate clones of four distinct oncogene transformed cell lines. Comparison is shown with primary (non-transformed) PEC. Moving average plots for the T test statistic. FVB mice injected intravenously with equal number of PEC. Differentially expressed genes are organized into patterns of up- and down-regulation in each of the four oncogene over-expressing cell lines. Data are mean ± SEM of N>3 separate experiments for a total of N=30 mice.
- Heatmaps of genes that are differentially expressed in the four oncogene transformed PEC lines and differentially expressed genes in (A) high grade vs low grade and (B) advanced stage vs early stage prostate cancer [3]. Heatmaps of the left-hand side represent the prostate cancer high grade and advanced stage signatures, while heatmaps on the right represent genes that are differentially expressed in at least one of the four prostate cancer cell lines. The percentage of these genes that are differentially expressed within each individual prostate cancer cell line is shown in the respective columns along with the p value for the degree of similarity with the high grade and advanced stage phenotypes.
- Heatmaps of (A) and (B) show the genes that are differentially expressed in the oncogene-induced prostate cancer cell lines and in c-Myc and Ha-Ras transduced fibroblasts (3T3 cell line) [46]. Heatmaps of the left-hand side represent the transduced fibroblasts gene signatures, while heatmaps on the right represent genes that are differentially expressed in at least one of the four prostate cancer cell lines. Heatmap of (C) shows the intersection of genes that are differentially expressed in the c-Myc prostate cancer cell line and in the respective c-Myc-induced mouse mammary tumor samples [46]. Heatmaps of the left-hand side represent the tumor sample gene signatures, while heatmaps on the right represent genes that are differentially expressed in the prostate cancer cell lines. The p values shown under each prostate cell line heatmap represent the significance of the overlap between the prostate and mammary cancer datasets. (D) ROC curve for the utility of PSA (orange) and the c-Myc signature (green) to identify metastatic disease. The x-axis represents the false positive rate (1-specificity) and the y-axis represents the true positive rate (sensitivity). The dashed line represents no discriminative ability. (E) A heatmap depicts the consistency between each of the four prostate cancer cell line signatures and samples in MSKCC prostate cancer datasets. Red indicates positive Pearson correlation, while blue indicates negative Pearson correlation.
- (A) Expression profile of human prostate cancer samples [11] that were upregulated in the oncogene transferred prostate cancer cell lines. Bars along the bottom of the heatmap indicate whether a sample has high (upper 25th percentile) or low expression (lower 75th percentile) based on genes upregulated in each of the four oncogene-transformed cell lines. Kaplan Meier curves are shown for high and low expression populations for (B) c-Myc upregulated genes, (C) NeuT upregulated genes, (D) Ha-Ras upregulated genes, (E) v- Src upregulated genes.
- (A) Immunohistochemical (IHC) staining of PEC tumors for VWF as a marker of neoangiogenesis. Representative example of IHC for VWF for each cell line. (B) The relative concentration of blood vessels are shown for the four oncogene induced mouse prostate tumors. Quantitation of VWF staining from oncogene-induced prostate tumors. Data are mean ± SEM for N>3 separate tumors. In the NeuT group, the blood vessel concentration is lower and Ha-Ras vascularity is greater (p<0.01).
- Medium for primary culture comprised F-12 500ml, 10% FBS , Insulin 5ug/ml, EGF 10ng/ml,Hydrocortisone 1ug/ml, transferrin 5ng/ml, bovine pituitary extraction 30ug/ml, IX pen-strep, and 1 X Gentamicin.Mice prostate derived from 12 weeks old FVB mice, ventral prostate, was removed, washed in PBS, the prostate tissues were chopped in a 6 cm plate for several minutes using razor blades. The chopped tissues were added in 0.5 mg/ml collagenase solution and the plates were put in 37°C, 5% CO2 incubator for 16h. The digested tissues were washed with PBS and the resulting cells pellet resuspended using the medium, and then planted in 10cm cell plates.
- pBABE-IRES-target gene was transfected into 293T cells by calcium phosphate precipitation. DNA and CaCl2 were mixed in HBS buffer, and the mixture made up to afinal volume of 1ml, which was allowed to stand for 20mins at RT. This mixture was then mixed into 293T cells and the cells put into incubator for 5 hours then the incubation medium was removed and replace with fresh medium. After 48 hours, the supernatant of 293T cells was collected, mixed with equal volume of fresh medium, and the resulting mixture was filtered by 0.45um filter. Polybrene( final concentration 8ug/ml ) was then added into the mixture, which was then added into prostate epithelial cells which were in passage one. After another 48 hours of infection, the medium was removed and replace with fresh medium (DMEM,10% FBS).
- To a culture medium comprised DMEM, 10% FBS, and IX pen-strep.was added puromysin, and the final concentration was made up to 1∼2ug/ml. The cells were repeatedly treated with puromysin for at least 1 month, until the negative cells were dead, and the positive clones with oncogene expression were left. When the clones were big enough, picked the clones by were picked by cloning cylinders (Specialty Media, cat# TR-1004), and the cells were appropriately marked. The cells were then grown for at least 25 passages. Characterized in assays of growth in tissue culture soft agar, in vivo implantation, metastasis, microarray and histopathology.
-
Figure 1 illustrates oncogene transduced PEC lines form colonies in soft agar.Figure 1A illustrates phase contrast microscopy of oncogene induced cell lines were transduced by distinct oncogenes (c-Myc, NeuT, Ha-Ras, v-Src). Photo of individual colonies derived from oncogene-transduced PEC that were selected and characterized.Figure 1B illustrates growth curves of PEC lines determined by cell counting. Data are mean ± SEM of N>3 separate experiments.Figures 1C and 1D describe Western Blot analysis of 3 separate clones of each oncogene induced PEC with antibodies as shown for detection of c-Myc, NeuT, Ha-Ras and v-Src andFigures 1D describes markers of basal (CK5) vs luminal (CK8) prostate cancer. GDI is used as a protein loading control.Figure 1E describes soft agar assays of oncogene transduced PEC. Non-transformed PEC failed to grow in soft agar. The size (Figure IE) and number (Figure IF) of colonies from oncogene transduced PEC lines are shown as mean ± SEM of N>5 separate experiments. -
Figure 2 depicts copy number aberrations in the four oncogene cell lines assessed by array CGH.Figure 2A illustrates the percentage of the four cell lines sharing copy gain or loss regions is shown as a function of genomic position.Figure 2B illustrates regions of copy gain (red) or loss (blue) for each of the four cell lines are shown as a function of genomic position. InFigure 2C oncogenes are identified with mRNA overexpression (red), DNA amplification (yellow), or both (purple) among the four oncogene cell lines, with corresponding amplification in the MKSCC prostate cancer database (listed on righthand side). InFigure 2D , tumor suppressor genes are identified with mRNA underexpression (blue), DNA copy loss (pink), or both (orange) among the four oncogene cell lines, with corresponding copy loss in the MKSCC prostate cancer database (listed on right-hand side).Figure 3 illustrates prostate epithelial cell lines grow in immune competent mice. - In
Figure 3A PEC tumor diameter determined by vernier caliper measurement is shown as days after inoculation inFVB 30 mice. The diameter mean ± SEM for N>5 separate experiments.Figure 3B shows photograph of representative tumor derived from oncogene-induced lines. NeuT induced tumors were harvested at 15 days after cell injection.Figure 3C shows Hematoxylin and eosin staining at low and high magnification (see also supplemental data 1-4). -
Figure 4 shows oncogene transformed prostate epithelial cell tumors metastasize to lung.Figure 4A shows Hematoxylin and eosin stain of murine lung post tumor implantation demonstrating representative example of lung metastasis.Figure 4B shows Frequency of lung metastases were detected in mice for c-Myc, NeuT and v-Src PEC groups 5 weeks after subcutaneous injection. The rates were 100% frequency in Ha-Ras and v-Src groups. -
Figure 5 shows hierarchical clustering of microarray gene expression.Figure 5A shows an overview of the two-way hierarchical clustering of three separate clones of four distinct oncogene transformed cell lines. Comparison is shown with primary (non-transformed) PEC. Differentially expressed genes are organized into patterns of up- and down- regulation in each of the four oncogene overexpressing cell lines. Data are mean ± SEM of N>3 separate experiments for a total of N=30 mice. Heatmaps of genes that are differentially expressed in the four oncogene transformed PEC lines and differentially expressed genes in (Figure 5B ) high grade vs low grade and (Figure 5C ) advanced stage vs early stage prostate cancer (8). Heatmaps of the left-hand side represent the prostate cancer high grade and advanced stage signatures, while heatmaps on the right represent genes that are differentially expressed in the four prostate cancer cell lines. The percentage of these genes that are differentially expressed within each individual prostate cancer cell line is shown in the respective columns along with the p value for the degree of similarity with the high grade and advanced stage phenotypes. -
Figure 6 shows c-Myc- and Ha-Ras-specific oncogene signatures in prostate tumors are conserved in other tissues. Heatmaps show genes that are differentially expressed in the oncogene-induced prostate cancer cell lines and inFigure 6A Ha-Ras andFigure 6B c-Myc fibroblasts (3T3 cell line). InFigure 6C A heatmap shows the intersection of genes that are differentially expressed in the c- Myc prostate cancer cell line and mouse mammary tumor samples. The p values shown under each prostate cell line heatmap represent the significance of the overlap between the prostate and fibroblast/mammary tumor signatures.Figure 6D shows a classifier based on canonical analysis of c-Myc signature distinguishes human tumor (red) from normal tissue (light blue), along the x-axis, in theLapointe 2004 dataset. ROC curves for the classifier performance are shown for E) theLapointe 2004 dataset and F) the Taylor 2010 MSKCC dataset, with AUC values of 0.990 and 0.977, respectively. -
Figure 7 shows gene expression correlates of oncogene transformed prostate cancer cell lines with recurrence-free survival.Figure 7A shows expression profile of human prostate cancer samples (13) that were upregulated in the oncogene transferred prostate cancer cell lines. Bars along the bottom of the heatmap indicate whether a sample has high (upper 25th percentile) or low expression (lower 75th percentile) based on genes upregulated in each of the four oncogene transformed cell lines. Kaplan Meier curves are shown for high and low expression populations for (Figure 7B ) c-Myc upregulated genes. -
Figure 8 illustrates gene expression correlates of oncogene transformed prostate cancer cell lines with recurrence-free survival. -
Figure 9 illustrates histological features of poorly differentiated prostate adenocarcinoma. -
Figures 10A-10D demonstrate that Src enhances 3D matrigel invasion of isogenic prostate cancer cell lines. The isogenic prostate cancer cell lines were derived from transduction of murine epithelial and prostate epithelial cells in retro viruses encoding either oncogenic NeuT, Ha-Ras, or c-Src. As shown inFigure 10A , these cells conveyed the ability to migrate into a wound with the NeuT line, conveying the most rapid wound closure. WhileFigure 10A illustrateswounding assay of cellular migration showing wound,Figure 10B illustrates quantitation of closure for N=3 separate experiments.Figure 10C illustrates 3-D invasion assay using prostate cancer cell lines in matrigel.Figure 10D shows mean distances of invasion ± SEM from 3 independent experiments for PEC lines (PEC-NeuT, PEC-Ras, and PEC-Src). As shown inFigures 10C and 10D , invasion into matrigel was more efficient for the c-Src transduced line. Statistical analysis of the results shown was conducted using the Student's t test. -
Figures 11A and 11B demonstrate isogenic prostate cancer cell line tumors are vascular. InFigure 11A subcutaneous tumor growth in NCR nude mice was quantitated over 3 weeks following subcutaneous innoculation of 1x10⁵ cells for each of the 3 lines (PEC-NeuT, PEC-Ras, and PEC-Src) using normalized photon flux to quantitate tumor volume. Mean sizes ± SEM from 3 independent experiments for PEC lines are shown. Associated with enhanced Src kinase activity, the lines grew as subcutaneous tumors in NCR nude mice; the relative size as determined by photon flux suggested more rapid growth amongst the Ras-derived lines Statistical analysis of the data was conducted using the Student's t test. - In
Figure 11B , immunohistochemical staining for von Willebrand factor (WF) showed vascularity of the lines with enhanced VWF staining of the Ras line. In other words, the enhanced tumor growth rate of the Ras line was associated with increased angiogenesis, as evidenced by increased von Willebrand factor, (VWF) staining. -
Figures 12A-12E demonstrate prostate cancer lines develop metastasis. Tomato-Red. Cells were injected into the left cardiac ventricle of 16 mice for each cell line. Bioluminescence images were acquired and quantified 14 days after xenografting. Representative in vivo images of mice are shown inFigure 12A . As shown, upon introduction of tumors into the arterial circulation via the left ventricle of the heart (I.C. Injection), tumors developed rapidly in multiple organs, including liver, brain, bladder, adrenal gland and kidney, within two weeks of injection. -
Figure 12B shows representative images of brain metastasis in mice following the intracardiac injection of the isogenic prostate cancer lines.Figure 12C shows quantification (mean ± SEM, n=6) of Bioluminescence Imaging (BLI) as proportion of mice with tumors. (Statistical comparison was performed using Student's t test with Welch's correction for heterogeneous variances) -
Figure 12D shows mean total proton fiux as a measure of metastatic brain tumor burden for each of the isogenic lines (data are mean ±SEM, n=5). -
Figure 12E shows H&E staining of brain metastasis formed after 2 weeks of PEC-Src and PEC-NeuT intracardiac injection. Also, CK14 staining corroborated the presence of prostate epithelial cells within the brain (arrow). - Photonic emission evidenced metastasis in the brains of mice injected with the Ras and Src prostate cancer cell lines. Less frequent metastasis occurred to the brains of mice injected with the NeuT lines. The relative frequency of metastasis amongst the mice demonstrated 100% of the Ha-Ras and Src lines developed tumors in mice, and the relative tumor burden was 1x10⁹ for Ras, 5x10⁸ in c-Src, with 1x10⁴ for NeuT. As shown in
Figure 3E , histological analysis of the brain metastasis of the mice injected with the Ras or Src PEC lines showed the primary histology was adenocarcinoma. -
Figures 13A-13C demonstrate liver metastasis of prostate tumor cell lines. Isogenic PEC lines expressing the Luc2-Tomato-Red fusion protein were injected into the ventricle of FVB mice and the in vivo bioluminescent signal quantified.Figure 12A illustrates the percentage of mice with liver tumors. Hepatic metastasis in the mice injected with the Ras and Src PEC lines developed liver metastasis (∼100% of the animals). Although the NeuT tumors grew subcutaneously, none developed liver metastasis.Figure 12B illustrates the tumor size determined by photonflux andFigure 13C illustrates representative mice images showing liver metastasis. - Kidney metastasis were identified in the mice injected with the Ras and Src derived lines.
Figure 13D illustrates the percentage of mice with kidney tumors.Figure 13E illustrates size of kidney tumors by photon flux andFigure 13F illustrates representative images of kidney metastasis. -
Figures 14A-14C demonstrate isogenic prostate cancer cell lines develop osteolytic bone metastases.Figure 14A illustrates representative in vivo images of FVB mice that underwent intracardiac injection of PEC lines expressing Luc2-Tomato-Red fusion protein and the in vivo bioluminescent signal was quantified. - As shown in
Figure 14A , the bony metastasis of the mice were osteolytic in nature.Figure 14B shows quantification (mean ± SEM, n=6) of BLI as proportion of mice with tumors. As illustrated, 100% of the mice injected with the c-Src tumors developed bony metastasis, 65% amongst the Ha-Ras, and 15% amongst NeuT. The bony photon flux was dramatically enhanced in the c-Src tumors, with total photon flux 5x10⁷ vs. Ha-Ras 1x10⁶ and NeuT 1x10⁴.Figure 14C illustrates the size of-tumor mass on photon flux. Histological analysis of the osteolytic bone lesions of the prostate tumors evidenced, adenocarcinoma resembling the primary tumor. -
Figures 15A-15F demonstrate Src enhances osteolytic prostate cancer bone metastases.FVB mice 2 weeks after PEC-Src intracardiac injection developed osteolytic bone lesions.Figure 15A shows tumor area in bones was significantly increased in the PEC-Src group compared with PEC-Ras and PEC-NeuT. The area of the tumor was six-fold greater in c-Src compared to Ras driven tumors. -
Figure 15B illustrates representative X-Rays before (t0) and 14d (t14) after intracardiac injection of cells. Low density areas colocalized with the metastatic tumors (arrowhead) indicating osteolytic lesions. The bone lesions were found primarily at the epiphyseal junction as osteolytic lesions at two weeks. - Hisological analysis confirmed adenocarcinoma at the site of bony metastasis. Tartrate resistant acid phosphatase ("TRAP") staining, shown in
Figure 15C , corroborated the presence of osteoblast (arrows) in the bone-tumor interface.Figure 15D shows Haematoxylin Eosin ("H&E") staining of bone metastasis formed after.Figures 15E and 15F , show cytokeratin (CK) 14 staining and CK8 staining respectively, both corroborating the presence of epithelial cells within bone. -
Figures 16A-16G demonstrate osteolytic prostate cancer cell lines express function CCL5 and osteopontin ("OPN") receptors.Figures 16A-16D show Fluorescence-Activated Cell Sorting ("FACS") analysis of CCR5 expression on PEC lines. As shown, FACS analysis using a CCR5 specific antibody confirmed the presence of the CCR5 receptor in PEC lines. -
Figures 16E and 16F show results of Matrigel invasion assays of the PEC-Src line conducted using OPN as CD44 ligand and CCL5 as CCR5 ligand and quantified as mean + SEM (Figure 16 G) . As shown inFigures 16D and 16E , the addition of OPN or CCR5 enhanced PEC invasiveness into matrigel. For the comparison to tissue, the in vivo tumor gene expression in the oncogene transformed PEC was compared with the expression in vivo in the dorsolateral ventral prostate of mice with the same strain.Figure 16F shows chemokine receptor and ligand gene expression of prostate tumor cell lines in tissue culture. AndFigure 16G shows chemokine receptor and ligand gene expression of prostate tumor cell lines after subcutaneous implantation. The gene expression showed a notable up regulation in vivo of the cytokine and chemokines. Specifically upregulation of CCR5 and CCR2 was observed in the c-Myc, NeuT and Src PEC lines. Upregulation of the receptor ligands CCL2, CCL7, and CCL8 was observed (2- to 3-fold). CCL7, CCL8 and CCL5 are ligands for CCR5, CCL8 and CCL5 for CCR1 (Figure 15H ). These studies indicate the induction of cytokine receptor and ligand expression in PEC tumors in vivo compared with tissue culture marked in red square. - Therefore, the microarray based gene expression profiling showed activation of a CCR5 signaling module when the PEC lines were grown in vivo vs tissue culture.
- CCL2 binds CCR2 and CCR4. Given that CCR5 and its ligands CCL5, CCL7 and CCL8 were induced in the PEC in vivo, the effect of the CCR5 antagonist on prostate tumor growth was examined.
-
Figures 17A-17D demonstrate that CCR5 antagonists block spinal osteolytic prostate cancer metastasis. PEC lines transduced with vectors expressing the Luc2-Tomato-Red fusion protein were injected into the ventricle of FVB mice and the in vivo bioluminescent signal was quantified after 2 weeks. Mice were treated with oral maraviroc (8 mg/kg) or control.Figure 17A illustrates representative examples of mice from each group.Figure 17B illustrates photon flux as a volumetric analysis of total tumor mass andFigure 17C illustrates lower limb bony mass in the mice. The data shown are mean + SEM for N=8 separate mice in each group, P< 0.05. - As shown in
Figures 17A and 17B , the CCR5 antagonist Maraviroc (8 mg/kg oral) reduced total body metastatic burden by >50% and reduced bony metastasis by >50% (seeFigures 17C and 17D ). Further, Flurine-18, Sodium fluoride ("F-18-NaF") imaging correlated with X-ray analysis demonstrated the presence of spine metastasis (Figures 18A-18H ). Daily oral treatment with Maraviroc reduced spine metastasis by >90% (Figures 19A-19B ). -
- 1. Jemal, A., et al., Cancer statistics, 2003. CA Cancer J Clin, 2003. 53(1): p. 5-26.
- 2. Singh, D., et al., Gene expression correlates of clinical prostate cancer behavior. Cancer Cell, 2002. 1(2): p. 203-9.
- 3. Lapointe, J., et al., Gene expression profiling identifies clinically relevant subtypes of prostate cancer. Proc Natl Acad Sci U S A, 2004. 101(3): p. 811-6.
- 4. Kattan, M.W., T.M. Wheeler, and P.T. Scardino, Postoperative nomogram for disease recurrence after radical prostatectomy for prostate cancer. J Clin Oncol, 1999. 17(5): p. 1499-507.
- 5. Kattan, M.W., et al., A preoperative nomogram for disease recurrence following radical prostatectomy for prostate cancer. J Natl Cancer Inst, 1998. 90(10): p. 766-71.
- 6. Graefen, M., et al., Early prostate-specific antigen relapse after radical retropubic prostatectomy: prediction on the basis of preoperative and postoperative tumor characteristics. Eur Urol, 1999. 36(1): p. 21-30.
- 7. Dhanasekaran, S.M., et al., Delineation of prognostic biomarkers in prostate cancer. Nature, 2001. 412(6849): p. 822-6.
- 8. Varambally, S., et al., The polycomb group protein EZH2 is involved in progression of prostate cancer. Nature, 2002. 419(6907): p. 624-9.
- 9. Henshall, S.M., et al., Survival analysis of genome-wide gene expression profiles of prostate cancers identifies new prognostic targets of disease relapse. Cancer Res, 2003. 63(14): p. 4196-203.
- 10. LaTulippe, E., et al., Comprehensive gene expression analysis of prostate cancer reveals distinct transcriptional programs associated with metastatic disease. Cancer Res, 2002. 62(15): p. 4499-506.
- 11. Glinsky, G.V., et al., Gene expression profiling predicts clinical outcome of prostate cancer. J Clin Invest, 2004. 113(6): p. 913-23.
- 12. Jenkins, R.B., et al., Detection of c-Myc oncogene amplification and chromosomal anomloies in metastatic prostatic carcinoma by fluorescence in situ hybridization. Cancer Res., 1997. 57(3): p. 524-31.
- 13. Qian, J., R.B. Jenkins, and D.G. Bostwick, Detection of chromosomal anomalies and c-myc gene amplification in the cribriform pattern of prostatic intraepithelial neoplasia and carcinoma by fluorescence in situ hybridization. Mod Pathol, 1997. 10(11): p. 1113-9.
- 14. Ellwood-Yen, K., et al., Myc-driven murine prostate cancer shares molecular features with human prostate tumors. Cancer Cell, 2003. 4(3): p. 223-38.
- 15. Creighton, C.J., Multiple oncogenic pathway signatures show coordinate expression patterns in human prostate tumors. PLoS One, 2008. 3(3): p. e1816.
- 16. Gumerlock, P.H., et al., Activated ras alleles in human carcinoma of the prostate are rare. Cancer Res, 1991. 51(6): p. 1632-7.
- 17. Carter, B.S., J.I. Epstein, and W.B. Isaacs, ras gene mutations in human prostate cancer. Cancer Res, 1990. 50(21): p. 6830-2.
- 18. Uzgare, A.R., P.J. Kaplan, and N.M. Greenberg, Differential expression and/or activation of P38MAPK, erk1/2, and jnk during the initiation and progression of prostate cancer. Prostate, 2003. 55(2): p. 128-39.
- 19. Le Page, C., et al., Expression and localisation of Akt-1, Akt-2 and Akt-3 correlate with clinical outcome of prostate cancer patients. Br J Cancer, 2006. 94(12): p. 1906-12.
- 20. Taylor, B.S., et al., Integrative genomic profiling of human prostate cancer. Cancer Cell, 2010. 18(1): p. 11-22.
- 21. Weber, M.J. and D. Gioeli, Ras signaling in prostate cancer progression. J Cell Biochem, 2004. 91(1): p. 13-25.
- 22. Ware, J.L., et al., Differential reactivity with anti-c-erbB-2 antiserum among human malignant and benighn prostatic tissue [abstract]. Proc Am Assoc Cancer Res, 1989. 30: p. 1737.
- 23. Hughes, C., et al., Molecular pathology of prostate cancer. J Clin Pathol, 2005. 58(7): p. 673-84.
- 24. Paronetto, M.P., et al., Expression of a truncated form of the c-Kit tyrosine kinase receptor and activation of Src kinase in human prostatic cancer. Am J Pathol, 2004. 164(4): p. 1243-51.
- 25. Bull, J.H., et al., Identification of potential diagnostic markers of prostate cancer and prostatic intraepithelial neoplasia using cDNA microarray. Br J Cancer, 2001. 84(11): p. 1512-9.
- 26. Cohen, S. and B.S. Rabin, Psychologic stress, immunity, and cancer. J Natl Cancer Inst, 1998. 90(1): p. 3-4.
- 27. Lawson, D.A., et al., Isolation and functional characterization of murine prostate stem cells. Proc Natl Acad Sci U S A, 2007. 104(1): p. 181-6.
- 28. Huang, E.S., et al., Gene expression phenotypes of oncogenic signaling pathways. Cell Cycle, 2003. 2(5): p. 415-7.
- 29. Catalona, W.J., et al., Selection of optimal prostate specific antigen cutoffs for early detection of prostate cancer: receiver operating characteristic curves. J Urol, 1994. 152(6 Pt 1): p. 2037-42.
- 30. Thompson, I.M., et al., Effect of finasteride on the sensitivity of PSA for detecting prostate cancer. J Natl Cancer Inst, 2006. 98(16): p. 1128-33.
- 31. Akimoto, S., et al., Relationship between prostate-specific antigen, clinical stage, and degree of bone metastasis in patients with prostate cancer: comparison with prostatic acid phosphatase and alkaline phosphatase. Int J Urol, 1997. 4(6): p. 572-5.
- 32. Hanley, J.A. and B.J. McNeil, The meaning and use of the area under a receiver operating characteristic (ROC) curve. Radiology, 1982. 143(1): p. 29-36.
- 33. Sharma, A., et al., Novel functions of the retinoblastoma tumor suppressor in controlling lethal tumor phenotypes. (In Press). J Clin Invest, 2010: p. (In Press).
- 34. Neve, R.M., et al., A collection of breast cancer cell lines for the study of functionally distinct cancer subtypes. Cancer Cell, 2006. 10(6): p. 515-27.
- 35. Chin, K., et al., Genomic and transcriptional aberrations linked to breast cancer pathophysiologies. Cancer Cell, 2006. 10(6): p. 529-41.
- 36. Welsh, J.B., et al., Analysis of gene expression identifies candidate markers and pharmacological targets in prostate cancer. Cancer Res, 2001. 61(16): p. 5974-8.
- 37. Mori, S., et al., Utilization of genomic signatures to identify phenotype-specific drugs. PLoS One, 2009. 4(8): p. e6772.
- 38. Sato, K., et al., Clinical significance of alterations of .
- 39. Casimiro, M., et al., ErbB-2 induces the cyclin D1 gene in prostate epithelial cells in vitro and in vivo. Cancer Res, 2007. 67(9): p. 4364-72.
- 40. Gioeli, D., S. Kraus, and M.J. Weber, Signal Transduction by the Ras-MAP Kinase Pathway in Prostate Cancer Progression, in Prostate cancer : signaling networks, genetics, and new treatment strategies, R.G. Pestell and M.T. Nevalainen, Editors. 2008, Humana Press: Totowa, NJ. p. 223-256.
- 41. Scherl, A., et al., Prostatic intraepithelial neoplasia and intestinal metaplasia in prostates of probasin-RAS transgenic mice. Prostate, 2004. 59(4): p. 448-59.
- 42. Ilio, K.Y., et al., The primary culture of rat prostate basal cells. J Androl, 1998. 19(6): p. 718-24.
- 43. Li, Z., et al., Cyclin D1 regulates cellular migration through the inhibition of .
- 44. Liu, M., et al., p21CIP1 attenuates Ras- and c-Myc-dependent breast tumor epithelial mesenchymal transition and cancer stem cell-like gene expression in vivo. Proc Natl Acad Sci U S A, 2009. 106(45): p. 19035-9.
- 45. Irizarry, R.A., et al., Summaries of Affymetrix GeneChip probe level data. Nucleic Acids Res, 2003. 31(4): p. e15.
- 46. Huang, E., et al., Gene expression phenotypic models that predict the activity of oncogenic pathways. Nat Genet, 2003. 34(2): p. 226 - 230.
- 47. Dai, M., et al., Evolving gene/transcript definitions significantly alter the interpretation of GeneChip data. Nucleic Acids Res, 2005. 33(20): p. e175.
- 48. Chen, R., L. Li, and A.J. Butte, AILUN: reannotating gene expression data automatically. Nat Methods, 2007. 4(11): p. 879.
Claims (6)
- A CCR5 antagonist for use in inhibiting metastasis of cancer susceptible to treatment in an immunocompetent subject at risk for developing metastasis of cancer, wherein the CCR5 antagonist is maraviroc or vicriviroc.
- The CCR5 antagonist for use in inhibiting metastasis of cancer according to claim 1, wherein the CCR5 antagonist inhibits tumor metastasis in or more organs selected from the group consisting of liver, brain, bladder, lung, adrenal gland, kidney, bone and combinations thereof.
- The CCR5 antagonist for use in inhibiting metastasis of cancer according to claim 1 or claim 2, wherein the cancer is prostate cancer.
- The CCR5 antagonist for use in inhibiting metastasis of cancer according to any preceding claim, wherein the CCR5 antagonist is maraviroc.
- The CCR5 antagonist for use in inhibiting metastasis of cancer according to any one of claims 1 to 3, wherein the CCR5 antagonist is vicriviroc.
- The CCR5 antagonist for use in inhibiting metastasis of cancer according to any one of claims 1 to 4, wherein said use comprises daily oral administration of maraviroc and wherein said metastasis is bony metastasis.
Priority Applications (1)
| Application Number | Priority Date | Filing Date | Title |
|---|---|---|---|
| EP19173075.3A EP3597761A1 (en) | 2011-03-09 | 2012-03-09 | Prostate cancer cell lines, gene signatures and uses thereof |
Applications Claiming Priority (2)
| Application Number | Priority Date | Filing Date | Title |
|---|---|---|---|
| US201161450767P | 2011-03-09 | 2011-03-09 | |
| PCT/US2012/028546 WO2012122499A2 (en) | 2011-03-09 | 2012-03-09 | Prostate cancer cell lines, gene signatures and uses thereof |
Related Child Applications (1)
| Application Number | Title | Priority Date | Filing Date |
|---|---|---|---|
| EP19173075.3A Division EP3597761A1 (en) | 2011-03-09 | 2012-03-09 | Prostate cancer cell lines, gene signatures and uses thereof |
Publications (3)
| Publication Number | Publication Date |
|---|---|
| EP2683643A2 EP2683643A2 (en) | 2014-01-15 |
| EP2683643A4 EP2683643A4 (en) | 2015-04-29 |
| EP2683643B1 true EP2683643B1 (en) | 2019-05-08 |
Family
ID=46798838
Family Applications (2)
| Application Number | Title | Priority Date | Filing Date |
|---|---|---|---|
| EP19173075.3A Pending EP3597761A1 (en) | 2011-03-09 | 2012-03-09 | Prostate cancer cell lines, gene signatures and uses thereof |
| EP12755544.9A Active EP2683643B1 (en) | 2011-03-09 | 2012-03-09 | Prostate cancer cell lines, gene signatures and uses thereof |
Family Applications Before (1)
| Application Number | Title | Priority Date | Filing Date |
|---|---|---|---|
| EP19173075.3A Pending EP3597761A1 (en) | 2011-03-09 | 2012-03-09 | Prostate cancer cell lines, gene signatures and uses thereof |
Country Status (11)
| Country | Link |
|---|---|
| US (1) | US10952415B2 (en) |
| EP (2) | EP3597761A1 (en) |
| JP (2) | JP2014518610A (en) |
| CN (1) | CN104169425A (en) |
| AU (1) | AU2012225232B2 (en) |
| BR (1) | BR112013023050A8 (en) |
| CA (1) | CA2829219C (en) |
| DK (1) | DK2683643T3 (en) |
| ES (1) | ES2740399T3 (en) |
| MX (1) | MX2013010330A (en) |
| WO (1) | WO2012122499A2 (en) |
Families Citing this family (16)
| Publication number | Priority date | Publication date | Assignee | Title |
|---|---|---|---|---|
| US10952415B2 (en) | 2011-03-09 | 2021-03-23 | Richard G. Pestell | Prostate cancer cell lines, gene signatures and uses thereof |
| JP6518585B2 (en) | 2012-05-14 | 2019-05-22 | リチャード ジー. ペステル | Use of CCR5 Modifiers for the Treatment of Cancer |
| CN103881975B (en) * | 2014-04-04 | 2015-10-21 | 武汉大学 | Human Prostate Cancer Cells and primary separation and Culture thereof and Secondary Culture method and purposes |
| FR3022142B1 (en) * | 2014-06-16 | 2019-07-12 | Universite Paul Sabatier - Toulouse Iii | INHIBITION OF CCL7 CHEMOKINE OR CCR3 RECEPTOR FOR THE TREATMENT AND DIAGNOSIS OF PROSTATE CANCER |
| US9994912B2 (en) | 2014-07-03 | 2018-06-12 | Abbott Molecular Inc. | Materials and methods for assessing progression of prostate cancer |
| US20180104232A1 (en) * | 2015-03-12 | 2018-04-19 | The University Of Chicago | Methods for determining prognosis for breast cancer patients |
| CN107923918A (en) * | 2015-09-09 | 2018-04-17 | 私募蛋白质体公司 | Method for developing personalized drug therapy plan and the targeted drug exploitation composed based on protein group |
| CN111315882A (en) * | 2017-11-09 | 2020-06-19 | 国立大学法人东京医科齿科大学 | Cancer-promoting factor expression inhibitor, method for screening active ingredient thereof, expression cassette useful for the method, diagnostic agent, and diagnostic method |
| US10721069B2 (en) | 2018-08-18 | 2020-07-21 | Eygs Llp | Methods and systems for enhancing privacy and efficiency on distributed ledger-based networks |
| US11316691B2 (en) | 2019-04-15 | 2022-04-26 | Eygs Llp | Methods and systems for enhancing network privacy of multiple party documents on distributed ledger-based networks |
| US11206138B2 (en) * | 2019-05-02 | 2021-12-21 | Ernst & Young U.S. Llp | Biosignature-based tokenization of assets in a blockchain |
| US11232439B2 (en) | 2019-08-09 | 2022-01-25 | Eygs Llp | Methods and systems for preventing transaction tracing on distributed ledger-based networks |
| CN115004628A (en) | 2019-11-20 | 2022-09-02 | 艾格斯有限责任公司 | System, apparatus and method for identifying and securely storing distinguishing traits in a distributed ledger based on replaceable and non-replaceable tokens within a distributed ledger based network |
| EP4136600A1 (en) | 2020-04-15 | 2023-02-22 | Eygs LLP | Intelligent assertion tokens for authenticating and controlling network communications using a distributed ledger |
| US11629196B2 (en) | 2020-04-27 | 2023-04-18 | Incelldx, Inc. | Method of treating SARS-CoV-2-associated hypercytokinemia by administering a human monoclonal antibody (PRO-140) that inhibits CCR5/CCL5 binding interactions |
| US11402391B2 (en) | 2020-12-21 | 2022-08-02 | Incelldx, Inc. | Methods of treating a long-hauler subject for chronic COVID-19 by administering a CCR5 or CCL5 antagonist |
Family Cites Families (35)
| Publication number | Priority date | Publication date | Assignee | Title |
|---|---|---|---|---|
| US5587458A (en) | 1991-10-07 | 1996-12-24 | Aronex Pharmaceuticals, Inc. | Anti-erbB-2 antibodies, combinations thereof, and therapeutic and diagnostic uses thereof |
| ATE419355T1 (en) | 1992-02-06 | 2009-01-15 | Novartis Vaccines & Diagnostic | MARKER FOR CANCER AND BIOSYNTHETIC BINDING PROTEIN FOR IT |
| IL112248A0 (en) | 1994-01-25 | 1995-03-30 | Warner Lambert Co | Tricyclic heteroaromatic compounds and pharmaceutical compositions containing them |
| KR970706288A (en) | 1994-09-29 | 1997-11-03 | 베르너 발데크, 안네테 반네르 | Pyrrolo [2,3-d] pyrimidines and their uses (Pyrrolo [2,3-d] pyrimidines and Their Use) |
| US20040151719A1 (en) | 1995-06-06 | 2004-08-05 | Human Genome Sciences, Inc. | Human G-protein chemokine receptor (CCR5) HDGNR10 |
| GB9520822D0 (en) | 1995-10-11 | 1995-12-13 | Wellcome Found | Therapeutically active compounds |
| CN1066147C (en) | 1995-11-01 | 2001-05-23 | 诺瓦提斯公司 | Purine derivatives and processes for their preparation |
| CH690773A5 (en) | 1996-02-01 | 2001-01-15 | Novartis Ag | Pyrrolo (2,3-d) pyrimides and their use. |
| WO1997032879A1 (en) | 1996-03-06 | 1997-09-12 | Novartis Ag | 7-ALKYL-PYRROLO[2,3-d]PYRIMIDINES |
| WO1997049706A1 (en) | 1996-06-25 | 1997-12-31 | Novartis Ag | SUBSTITUTED 7-AMINO-PYRROLO[3,2-d]PYRIMIDINES AND THE USE THEREOF |
| ES2186908T3 (en) | 1996-07-13 | 2003-05-16 | Glaxo Group Ltd | HETEROCICICLES CONDENSED COMPOUNDS AS INHIBITORS OF PPROTEINA-TIROSINA-QUINASAS. |
| AR007855A1 (en) | 1996-07-13 | 1999-11-24 | Glaxo Group Ltd | HETERO-CYCLE COMPOUNDS FUSED AS PROTEIN INHIBITORS THYROSINE KINASE, THEIR PREPARATION METHODS, INTERMEDIARIES, USE IN MEDICINES AND PHARMACEUTICAL COMPOSITIONS CONTAINING THEM |
| GB9800569D0 (en) | 1998-01-12 | 1998-03-11 | Glaxo Group Ltd | Heterocyclic compounds |
| GB9800575D0 (en) | 1998-01-12 | 1998-03-11 | Glaxo Group Ltd | Heterocyclic compounds |
| PE20001420A1 (en) | 1998-12-23 | 2000-12-18 | Pfizer | CCR5 MODULATORS |
| BRPI0009721B8 (en) | 1999-04-15 | 2021-11-23 | Bristol Myers Squibb Co | Cyclic protein tyrosine kinase inhibitors |
| US6689765B2 (en) | 1999-05-04 | 2004-02-10 | Schering Corporation | Piperazine derivatives useful as CCR5 antagonists |
| US7825121B2 (en) | 1999-05-04 | 2010-11-02 | Schering Corporation | Piperazine derivatives useful as CCR5 antagonists |
| JP2003523744A (en) | 2000-02-09 | 2003-08-12 | ヒューマン ジノーム サイエンシーズ, インコーポレイテッド | Antibodies to CCR5 |
| US6667314B2 (en) | 2000-05-26 | 2003-12-23 | Pfizer, Inc. | Tropane derivatives useful in therapy |
| DE10034109C1 (en) | 2000-07-13 | 2001-09-06 | Juergen W Mueller | Geographic position and commercial data combining method, using databank storing position data for each geographic location and associated commercial data |
| EP1366058B1 (en) | 2001-02-09 | 2011-01-26 | Human Genome Sciences, Inc. | Human g-protein chemokine receptor (ccr5) hdgnr10 |
| US20020182624A1 (en) * | 2001-02-28 | 2002-12-05 | Eos Biotechnology, Inc. | Chemokine receptors and disease |
| GB0108876D0 (en) | 2001-04-09 | 2001-05-30 | Novartis Ag | Organic Compounds |
| WO2004054616A1 (en) | 2002-12-13 | 2004-07-01 | Ono Pharmaceutical Co., Ltd. | Antagonist and agonist binding to strong binding site of chemokine receptor |
| EP1623721A1 (en) | 2003-05-06 | 2006-02-08 | Ono Pharmaceutical Co., Ltd. | Effector cell function inhibitor |
| EP1831210A1 (en) | 2004-12-23 | 2007-09-12 | Pfizer Limited | 8-aza-bicyclo[3.2.1]octane derivatives with an activity on chemokine ccr5 receptors |
| US20090118175A1 (en) | 2005-05-06 | 2009-05-07 | Macina Roberto A | Compositions and Methods for Detection, Prognosis and Treatment of Breast Cancer |
| WO2007098010A2 (en) | 2006-02-17 | 2007-08-30 | University Of Pittsburgh - Of The Commonwealth System Of Higher Education | Improved low molecular weight myc-max inhibitors |
| RU2008140144A (en) | 2006-03-10 | 2010-04-20 | Оно Фармасьютикал Ко., Лтд. (Jp) | NITROGEN CONTAINING HETEROCYCLIC DERIVATIVE AND PHARMACEUTICAL PRODUCT INCLUDING SUCH DERIVATIVE AS AN ACTIVE INGREDIENT |
| JOP20090061B1 (en) | 2008-02-11 | 2021-08-17 | Ferring Int Center Sa | METHODS OF TREATING PROSTATE CANCER WITH GnRH ANTAGONIST |
| EP3181705A1 (en) | 2008-11-12 | 2017-06-21 | Caris Life Sciences Switzerland Holdings GmbH | Methods and systems of using exosomes for determining phenotypes |
| US10952415B2 (en) | 2011-03-09 | 2021-03-23 | Richard G. Pestell | Prostate cancer cell lines, gene signatures and uses thereof |
| US20130246300A1 (en) | 2012-03-13 | 2013-09-19 | American Express Travel Related Services Company, Inc. | Systems and Methods for Tailoring Marketing |
| US10884952B2 (en) | 2016-09-30 | 2021-01-05 | Intel Corporation | Enforcing memory operand types using protection keys |
-
2012
- 2012-03-09 US US14/003,384 patent/US10952415B2/en active Active
- 2012-03-09 BR BR112013023050A patent/BR112013023050A8/en not_active Application Discontinuation
- 2012-03-09 JP JP2013557917A patent/JP2014518610A/en active Pending
- 2012-03-09 WO PCT/US2012/028546 patent/WO2012122499A2/en active Application Filing
- 2012-03-09 CN CN201280020337.8A patent/CN104169425A/en active Pending
- 2012-03-09 MX MX2013010330A patent/MX2013010330A/en unknown
- 2012-03-09 DK DK12755544.9T patent/DK2683643T3/en active
- 2012-03-09 EP EP19173075.3A patent/EP3597761A1/en active Pending
- 2012-03-09 CA CA2829219A patent/CA2829219C/en active Active
- 2012-03-09 EP EP12755544.9A patent/EP2683643B1/en active Active
- 2012-03-09 AU AU2012225232A patent/AU2012225232B2/en active Active
- 2012-03-09 ES ES12755544T patent/ES2740399T3/en active Active
-
2016
- 2016-11-10 JP JP2016219554A patent/JP2017078070A/en active Pending
Also Published As
| Publication number | Publication date |
|---|---|
| US10952415B2 (en) | 2021-03-23 |
| EP3597761A1 (en) | 2020-01-22 |
| CA2829219A1 (en) | 2012-09-13 |
| ES2740399T3 (en) | 2020-02-05 |
| CN104169425A (en) | 2014-11-26 |
| JP2017078070A (en) | 2017-04-27 |
| BR112013023050A8 (en) | 2018-09-25 |
| EP2683643A2 (en) | 2014-01-15 |
| WO2012122499A2 (en) | 2012-09-13 |
| WO2012122499A3 (en) | 2014-04-17 |
| BR112013023050A2 (en) | 2016-12-06 |
| AU2012225232B2 (en) | 2016-05-12 |
| CA2829219C (en) | 2021-03-16 |
| DK2683643T3 (en) | 2019-08-12 |
| JP2014518610A (en) | 2014-08-07 |
| US20140109245A1 (en) | 2014-04-17 |
| EP2683643A4 (en) | 2015-04-29 |
| AU2012225232A1 (en) | 2013-05-09 |
| MX2013010330A (en) | 2014-11-26 |
Similar Documents
| Publication | Publication Date | Title |
|---|---|---|
| EP2683643B1 (en) | Prostate cancer cell lines, gene signatures and uses thereof | |
| Salvador-Barbero et al. | CDK4/6 inhibitors impair recovery from cytotoxic chemotherapy in pancreatic adenocarcinoma | |
| Coates et al. | Parallel genomic alterations of antigen and payload targets mediate polyclonal acquired clinical resistance to sacituzumab govitecan in triple-negative breast cancer | |
| Regales et al. | Dual targeting of EGFR can overcome a major drug resistance mutation in mouse models of EGFR mutant lung cancer | |
| Karachaliou et al. | Common co-activation of AXL and CDCP1 in EGFR-mutation-positive non-small cell lung cancer associated with poor prognosis | |
| Volk et al. | A CHAF1B-dependent molecular switch in hematopoiesis and leukemia pathogenesis | |
| Jakob et al. | Phase II study of gefitinib in patients with advanced salivary gland cancers | |
| Charytonowicz et al. | PPARγ agonists enhance ET-743–induced adipogenic differentiation in a transgenic mouse model of myxoid round cell liposarcoma | |
| US20190271047A1 (en) | Phosphatidylinositol-3-kinase pathway biomarkers | |
| Viola et al. | A validation study for the use of ROS1 immunohistochemical staining in screening for ROS1 translocations in lung cancer | |
| Hanna et al. | A phase II trial of all-trans retinoic acid (ATRA) in advanced adenoid cystic carcinoma | |
| Jin et al. | Therapeutic implications of activating noncanonical PIK3CA mutations in head and neck squamous cell carcinoma | |
| Francica et al. | Depletion of FOXM1 via MET targeting underlies establishment of a DNA damage–Induced senescence program in gastric cancer | |
| Turrell et al. | Age-associated microenvironmental changes highlight the role of PDGF-C in ER+ breast cancer metastatic relapse | |
| Noerz et al. | Combined targeting of AKT and mTOR synergistically inhibits formation of primary colorectal carcinoma tumouroids in vitro: A 3D tumour model for pre-therapeutic drug screening | |
| Wei et al. | Exosomes derived from MDR cells induce cetuximab resistance in CRC via PI3K/AKT signaling‑mediated Sox2 and PD‑L1 expression | |
| Zhu et al. | Individualized therapy based on the combination of mini‑PDX and NGS for a patient with metastatic AFP‑producing and HER‑2 amplified gastric cancer | |
| CN105189786A (en) | FALZ for use as a target for therapies to treat cancer | |
| Jaurand et al. | Biomolecular pathways and malignant pleural mesothelioma | |
| WO2021108927A1 (en) | Methods and compositions for treating cancers having f-box and wd-repeat protein 7 (fbxw7) alterations and/or cyclin l1 (ccnl1) gain or amplification | |
| Ito et al. | Src-homology 2 domain-containing phosphatase 2 in resected EGFR mutation-positive lung adenocarcinoma | |
| Ruzzi et al. | ADK-VR2, a cell line derived from a treatment-naïve patient with SDC4-ROS1 fusion-positive primarily crizotinib-resistant NSCLC: a novel preclinical model for new drug development of ROS1-rearranged NSCLC | |
| Dubash et al. | Modeling the novel SERD elacestrant in cultured fulvestrant-refractory HR-positive breast circulating tumor cells | |
| Bae et al. | Oncogenic fusion of BCAR4 activates EGFR signaling and is sensitive to dual inhibition of EGFR/HER2 | |
| US11253522B2 (en) | Cancer treatment targeted to tumor adaptive responses to protein synthesis stress |
Legal Events
| Date | Code | Title | Description |
|---|---|---|---|
| PUAI | Public reference made under article 153(3) epc to a published international application that has entered the european phase |
Free format text: ORIGINAL CODE: 0009012 |
|
| 17P | Request for examination filed |
Effective date: 20131008 |
|
| AK | Designated contracting states |
Kind code of ref document: A2 Designated state(s): AL AT BE BG CH CY CZ DE DK EE ES FI FR GB GR HR HU IE IS IT LI LT LU LV MC MK MT NL NO PL PT RO RS SE SI SK SM TR |
|
| R17D | Deferred search report published (corrected) |
Effective date: 20140417 |
|
| RIC1 | Information provided on ipc code assigned before grant |
Ipc: C12N 15/87 20060101AFI20140425BHEP |
|
| REG | Reference to a national code |
Ref country code: HK Ref legal event code: DE Ref document number: 1194097 Country of ref document: HK |
|
| RIC1 | Information provided on ipc code assigned before grant |
Ipc: A61K 31/46 20060101ALI20141212BHEP Ipc: C12N 15/87 20060101AFI20141212BHEP Ipc: C12N 5/09 20100101ALI20141212BHEP Ipc: A61K 31/506 20060101ALI20141212BHEP Ipc: A01K 67/027 20060101ALI20141212BHEP Ipc: G01N 33/574 20060101ALI20141212BHEP Ipc: C12Q 1/68 20060101ALI20141212BHEP |
|
| DAX | Request for extension of the european patent (deleted) | ||
| A4 | Supplementary search report drawn up and despatched |
Effective date: 20150327 |
|
| RIC1 | Information provided on ipc code assigned before grant |
Ipc: C12N 5/09 20100101ALI20150323BHEP Ipc: A61K 31/506 20060101ALI20150323BHEP Ipc: G01N 33/574 20060101ALI20150323BHEP Ipc: C12N 15/87 20060101AFI20150323BHEP Ipc: C12Q 1/68 20060101ALI20150323BHEP Ipc: A61K 31/46 20060101ALI20150323BHEP Ipc: A01K 67/027 20060101ALI20150323BHEP |
|
| 17Q | First examination report despatched |
Effective date: 20160502 |
|
| STAA | Information on the status of an ep patent application or granted ep patent |
Free format text: STATUS: EXAMINATION IS IN PROGRESS |
|
| REG | Reference to a national code |
Ref country code: DE Ref legal event code: R079 Ref document number: 602012059894 Country of ref document: DE Free format text: PREVIOUS MAIN CLASS: B66C0001420000 Ipc: C12Q0001688600 |
|
| GRAP | Despatch of communication of intention to grant a patent |
Free format text: ORIGINAL CODE: EPIDOSNIGR1 |
|
| STAA | Information on the status of an ep patent application or granted ep patent |
Free format text: STATUS: GRANT OF PATENT IS INTENDED |
|
| RIC1 | Information provided on ipc code assigned before grant |
Ipc: G01N 33/574 20060101ALI20181022BHEP Ipc: A61K 31/506 20060101ALI20181022BHEP Ipc: C12N 5/09 20100101ALI20181022BHEP Ipc: A01K 67/027 20060101ALI20181022BHEP Ipc: C12Q 1/6886 20140115AFI20181022BHEP Ipc: A61K 31/46 20060101ALI20181022BHEP |
|
| INTG | Intention to grant announced |
Effective date: 20181122 |
|
| RIC1 | Information provided on ipc code assigned before grant |
Ipc: A61K 31/46 20060101ALI20181022BHEP Ipc: A61K 31/506 20060101ALI20181022BHEP Ipc: A01K 67/027 20060101ALI20181022BHEP Ipc: G01N 33/574 20060101ALI20181022BHEP Ipc: C12Q 1/6886 20180101AFI20181022BHEP Ipc: C12N 5/09 20100101ALI20181022BHEP |
|
| RIC1 | Information provided on ipc code assigned before grant |
Ipc: G01N 33/574 20060101ALI20181022BHEP Ipc: C12N 5/09 20100101ALI20181022BHEP Ipc: A01K 67/027 20060101ALI20181022BHEP Ipc: C12Q 1/6886 20180101AFI20181022BHEP Ipc: A61K 31/506 20060101ALI20181022BHEP Ipc: A61K 31/46 20060101ALI20181022BHEP |
|
| GRAS | Grant fee paid |
Free format text: ORIGINAL CODE: EPIDOSNIGR3 |
|
| GRAA | (expected) grant |
Free format text: ORIGINAL CODE: 0009210 |
|
| STAA | Information on the status of an ep patent application or granted ep patent |
Free format text: STATUS: THE PATENT HAS BEEN GRANTED |
|
| AK | Designated contracting states |
Kind code of ref document: B1 Designated state(s): AL AT BE BG CH CY CZ DE DK EE ES FI FR GB GR HR HU IE IS IT LI LT LU LV MC MK MT NL NO PL PT RO RS SE SI SK SM TR |
|
| REG | Reference to a national code |
Ref country code: GB Ref legal event code: FG4D |
|
| REG | Reference to a national code |
Ref country code: CH Ref legal event code: EP Ref country code: AT Ref legal event code: REF Ref document number: 1130209 Country of ref document: AT Kind code of ref document: T Effective date: 20190515 |
|
| REG | Reference to a national code |
Ref country code: DE Ref legal event code: R096 Ref document number: 602012059894 Country of ref document: DE Ref country code: IE Ref legal event code: FG4D |
|
| REG | Reference to a national code |
Ref country code: DK Ref legal event code: T3 Effective date: 20190808 |
|
| REG | Reference to a national code |
Ref country code: NL Ref legal event code: FP |
|
| REG | Reference to a national code |
Ref country code: LT Ref legal event code: MG4D |
|
| PG25 | Lapsed in a contracting state [announced via postgrant information from national office to epo] |
Ref country code: FI Free format text: LAPSE BECAUSE OF FAILURE TO SUBMIT A TRANSLATION OF THE DESCRIPTION OR TO PAY THE FEE WITHIN THE PRESCRIBED TIME-LIMIT Effective date: 20190508 Ref country code: HR Free format text: LAPSE BECAUSE OF FAILURE TO SUBMIT A TRANSLATION OF THE DESCRIPTION OR TO PAY THE FEE WITHIN THE PRESCRIBED TIME-LIMIT Effective date: 20190508 Ref country code: AL Free format text: LAPSE BECAUSE OF FAILURE TO SUBMIT A TRANSLATION OF THE DESCRIPTION OR TO PAY THE FEE WITHIN THE PRESCRIBED TIME-LIMIT Effective date: 20190508 Ref country code: NO Free format text: LAPSE BECAUSE OF FAILURE TO SUBMIT A TRANSLATION OF THE DESCRIPTION OR TO PAY THE FEE WITHIN THE PRESCRIBED TIME-LIMIT Effective date: 20190808 Ref country code: SE Free format text: LAPSE BECAUSE OF FAILURE TO SUBMIT A TRANSLATION OF THE DESCRIPTION OR TO PAY THE FEE WITHIN THE PRESCRIBED TIME-LIMIT Effective date: 20190508 Ref country code: PT Free format text: LAPSE BECAUSE OF FAILURE TO SUBMIT A TRANSLATION OF THE DESCRIPTION OR TO PAY THE FEE WITHIN THE PRESCRIBED TIME-LIMIT Effective date: 20190908 Ref country code: LT Free format text: LAPSE BECAUSE OF FAILURE TO SUBMIT A TRANSLATION OF THE DESCRIPTION OR TO PAY THE FEE WITHIN THE PRESCRIBED TIME-LIMIT Effective date: 20190508 |
|
| PG25 | Lapsed in a contracting state [announced via postgrant information from national office to epo] |
Ref country code: RS Free format text: LAPSE BECAUSE OF FAILURE TO SUBMIT A TRANSLATION OF THE DESCRIPTION OR TO PAY THE FEE WITHIN THE PRESCRIBED TIME-LIMIT Effective date: 20190508 Ref country code: BG Free format text: LAPSE BECAUSE OF FAILURE TO SUBMIT A TRANSLATION OF THE DESCRIPTION OR TO PAY THE FEE WITHIN THE PRESCRIBED TIME-LIMIT Effective date: 20190808 Ref country code: LV Free format text: LAPSE BECAUSE OF FAILURE TO SUBMIT A TRANSLATION OF THE DESCRIPTION OR TO PAY THE FEE WITHIN THE PRESCRIBED TIME-LIMIT Effective date: 20190508 Ref country code: GR Free format text: LAPSE BECAUSE OF FAILURE TO SUBMIT A TRANSLATION OF THE DESCRIPTION OR TO PAY THE FEE WITHIN THE PRESCRIBED TIME-LIMIT Effective date: 20190809 |
|
| PG25 | Lapsed in a contracting state [announced via postgrant information from national office to epo] |
Ref country code: CZ Free format text: LAPSE BECAUSE OF FAILURE TO SUBMIT A TRANSLATION OF THE DESCRIPTION OR TO PAY THE FEE WITHIN THE PRESCRIBED TIME-LIMIT Effective date: 20190508 Ref country code: RO Free format text: LAPSE BECAUSE OF FAILURE TO SUBMIT A TRANSLATION OF THE DESCRIPTION OR TO PAY THE FEE WITHIN THE PRESCRIBED TIME-LIMIT Effective date: 20190508 Ref country code: SK Free format text: LAPSE BECAUSE OF FAILURE TO SUBMIT A TRANSLATION OF THE DESCRIPTION OR TO PAY THE FEE WITHIN THE PRESCRIBED TIME-LIMIT Effective date: 20190508 Ref country code: EE Free format text: LAPSE BECAUSE OF FAILURE TO SUBMIT A TRANSLATION OF THE DESCRIPTION OR TO PAY THE FEE WITHIN THE PRESCRIBED TIME-LIMIT Effective date: 20190508 |
|
| REG | Reference to a national code |
Ref country code: ES Ref legal event code: FG2A Ref document number: 2740399 Country of ref document: ES Kind code of ref document: T3 Effective date: 20200205 |
|
| REG | Reference to a national code |
Ref country code: DE Ref legal event code: R097 Ref document number: 602012059894 Country of ref document: DE |
|
| PG25 | Lapsed in a contracting state [announced via postgrant information from national office to epo] |
Ref country code: SM Free format text: LAPSE BECAUSE OF FAILURE TO SUBMIT A TRANSLATION OF THE DESCRIPTION OR TO PAY THE FEE WITHIN THE PRESCRIBED TIME-LIMIT Effective date: 20190508 |
|
| PLBE | No opposition filed within time limit |
Free format text: ORIGINAL CODE: 0009261 |
|
| STAA | Information on the status of an ep patent application or granted ep patent |
Free format text: STATUS: NO OPPOSITION FILED WITHIN TIME LIMIT |
|
| PG25 | Lapsed in a contracting state [announced via postgrant information from national office to epo] |
Ref country code: TR Free format text: LAPSE BECAUSE OF FAILURE TO SUBMIT A TRANSLATION OF THE DESCRIPTION OR TO PAY THE FEE WITHIN THE PRESCRIBED TIME-LIMIT Effective date: 20190508 |
|
| 26N | No opposition filed |
Effective date: 20200211 |
|
| PG25 | Lapsed in a contracting state [announced via postgrant information from national office to epo] |
Ref country code: PL Free format text: LAPSE BECAUSE OF FAILURE TO SUBMIT A TRANSLATION OF THE DESCRIPTION OR TO PAY THE FEE WITHIN THE PRESCRIBED TIME-LIMIT Effective date: 20190508 |
|
| PG25 | Lapsed in a contracting state [announced via postgrant information from national office to epo] |
Ref country code: SI Free format text: LAPSE BECAUSE OF FAILURE TO SUBMIT A TRANSLATION OF THE DESCRIPTION OR TO PAY THE FEE WITHIN THE PRESCRIBED TIME-LIMIT Effective date: 20190508 |
|
| PG25 | Lapsed in a contracting state [announced via postgrant information from national office to epo] |
Ref country code: MC Free format text: LAPSE BECAUSE OF FAILURE TO SUBMIT A TRANSLATION OF THE DESCRIPTION OR TO PAY THE FEE WITHIN THE PRESCRIBED TIME-LIMIT Effective date: 20190508 |
|
| REG | Reference to a national code |
Ref country code: CH Ref legal event code: PL |
|
| REG | Reference to a national code |
Ref country code: BE Ref legal event code: MM Effective date: 20200331 |
|
| PG25 | Lapsed in a contracting state [announced via postgrant information from national office to epo] |
Ref country code: LU Free format text: LAPSE BECAUSE OF NON-PAYMENT OF DUE FEES Effective date: 20200309 |
|
| PG25 | Lapsed in a contracting state [announced via postgrant information from national office to epo] |
Ref country code: LI Free format text: LAPSE BECAUSE OF NON-PAYMENT OF DUE FEES Effective date: 20200331 Ref country code: CH Free format text: LAPSE BECAUSE OF NON-PAYMENT OF DUE FEES Effective date: 20200331 |
|
| PG25 | Lapsed in a contracting state [announced via postgrant information from national office to epo] |
Ref country code: BE Free format text: LAPSE BECAUSE OF NON-PAYMENT OF DUE FEES Effective date: 20200331 |
|
| PG25 | Lapsed in a contracting state [announced via postgrant information from national office to epo] |
Ref country code: MT Free format text: LAPSE BECAUSE OF FAILURE TO SUBMIT A TRANSLATION OF THE DESCRIPTION OR TO PAY THE FEE WITHIN THE PRESCRIBED TIME-LIMIT Effective date: 20190508 Ref country code: CY Free format text: LAPSE BECAUSE OF FAILURE TO SUBMIT A TRANSLATION OF THE DESCRIPTION OR TO PAY THE FEE WITHIN THE PRESCRIBED TIME-LIMIT Effective date: 20190508 |
|
| PG25 | Lapsed in a contracting state [announced via postgrant information from national office to epo] |
Ref country code: MK Free format text: LAPSE BECAUSE OF FAILURE TO SUBMIT A TRANSLATION OF THE DESCRIPTION OR TO PAY THE FEE WITHIN THE PRESCRIBED TIME-LIMIT Effective date: 20190508 Ref country code: IS Free format text: LAPSE BECAUSE OF FAILURE TO SUBMIT A TRANSLATION OF THE DESCRIPTION OR TO PAY THE FEE WITHIN THE PRESCRIBED TIME-LIMIT Effective date: 20190908 |
|
| REG | Reference to a national code |
Ref country code: AT Ref legal event code: UEP Ref document number: 1130209 Country of ref document: AT Kind code of ref document: T Effective date: 20190508 |
|
| PGFP | Annual fee paid to national office [announced via postgrant information from national office to epo] |
Ref country code: FR Payment date: 20230327 Year of fee payment: 12 Ref country code: DK Payment date: 20230329 Year of fee payment: 12 |
|
| PGFP | Annual fee paid to national office [announced via postgrant information from national office to epo] |
Ref country code: IT Payment date: 20230321 Year of fee payment: 12 |
|
| P01 | Opt-out of the competence of the unified patent court (upc) registered |
Effective date: 20230517 |
|
| PGFP | Annual fee paid to national office [announced via postgrant information from national office to epo] |
Ref country code: ES Payment date: 20230403 Year of fee payment: 12 |
|
| PGFP | Annual fee paid to national office [announced via postgrant information from national office to epo] |
Ref country code: NL Payment date: 20240326 Year of fee payment: 13 Ref country code: IE Payment date: 20240327 Year of fee payment: 13 |
|
| PGFP | Annual fee paid to national office [announced via postgrant information from national office to epo] |
Ref country code: AT Payment date: 20240404 Year of fee payment: 13 |
|
| PGFP | Annual fee paid to national office [announced via postgrant information from national office to epo] |
Ref country code: DE Payment date: 20240327 Year of fee payment: 13 Ref country code: GB Payment date: 20240327 Year of fee payment: 13 |