EP2676384B1 - Characterization of non-ase noise on optical signals - Google Patents
Characterization of non-ase noise on optical signals Download PDFInfo
- Publication number
- EP2676384B1 EP2676384B1 EP12747668.7A EP12747668A EP2676384B1 EP 2676384 B1 EP2676384 B1 EP 2676384B1 EP 12747668 A EP12747668 A EP 12747668A EP 2676384 B1 EP2676384 B1 EP 2676384B1
- Authority
- EP
- European Patent Office
- Prior art keywords
- signal
- ase
- contribution
- optical
- noise
- Prior art date
- Legal status (The legal status is an assumption and is not a legal conclusion. Google has not performed a legal analysis and makes no representation as to the accuracy of the status listed.)
- Active
Links
- 230000003287 optical effect Effects 0.000 title claims description 258
- 238000012512 characterization method Methods 0.000 title claims description 23
- 238000001228 spectrum Methods 0.000 claims description 119
- 238000000034 method Methods 0.000 claims description 106
- 230000028161 membrane depolarization Effects 0.000 claims description 61
- 230000003595 spectral effect Effects 0.000 claims description 41
- 238000012360 testing method Methods 0.000 claims description 28
- 238000004458 analytical method Methods 0.000 claims description 21
- 239000000523 sample Substances 0.000 claims description 21
- 239000002131 composite material Substances 0.000 claims description 14
- 230000005540 biological transmission Effects 0.000 claims description 13
- 230000009022 nonlinear effect Effects 0.000 claims description 12
- 238000004891 communication Methods 0.000 claims description 10
- 230000000644 propagated effect Effects 0.000 claims description 7
- 230000002269 spontaneous effect Effects 0.000 claims description 5
- 239000006185 dispersion Substances 0.000 claims description 4
- 230000010287 polarization Effects 0.000 description 92
- 238000010561 standard procedure Methods 0.000 description 55
- 238000010183 spectrum analysis Methods 0.000 description 33
- 230000006870 function Effects 0.000 description 21
- 238000013459 approach Methods 0.000 description 19
- 230000004044 response Effects 0.000 description 12
- 230000000694 effects Effects 0.000 description 10
- 238000005259 measurement Methods 0.000 description 9
- 238000004422 calculation algorithm Methods 0.000 description 8
- 230000008033 biological extinction Effects 0.000 description 7
- 230000009021 linear effect Effects 0.000 description 7
- 238000012544 monitoring process Methods 0.000 description 6
- 230000006735 deficit Effects 0.000 description 5
- 230000001419 dependent effect Effects 0.000 description 5
- 239000013307 optical fiber Substances 0.000 description 5
- 238000001514 detection method Methods 0.000 description 3
- 238000012545 processing Methods 0.000 description 3
- 230000002123 temporal effect Effects 0.000 description 3
- 230000001427 coherent effect Effects 0.000 description 2
- 238000010586 diagram Methods 0.000 description 2
- 230000009699 differential effect Effects 0.000 description 2
- 230000005684 electric field Effects 0.000 description 2
- 238000005516 engineering process Methods 0.000 description 2
- 230000001747 exhibiting effect Effects 0.000 description 2
- 239000000835 fiber Substances 0.000 description 2
- 238000012423 maintenance Methods 0.000 description 2
- 238000007639 printing Methods 0.000 description 2
- 230000001902 propagating effect Effects 0.000 description 2
- 238000003860 storage Methods 0.000 description 2
- 238000013024 troubleshooting Methods 0.000 description 2
- 238000009827 uniform distribution Methods 0.000 description 2
- 101100456566 Caenorhabditis elegans dpy-22 gene Proteins 0.000 description 1
- 230000005374 Kerr effect Effects 0.000 description 1
- 230000003044 adaptive effect Effects 0.000 description 1
- 238000004364 calculation method Methods 0.000 description 1
- 230000000295 complement effect Effects 0.000 description 1
- 238000004883 computer application Methods 0.000 description 1
- 238000010276 construction Methods 0.000 description 1
- 238000007405 data analysis Methods 0.000 description 1
- 238000009826 distribution Methods 0.000 description 1
- 238000005315 distribution function Methods 0.000 description 1
- 230000009977 dual effect Effects 0.000 description 1
- 238000011156 evaluation Methods 0.000 description 1
- 238000011065 in-situ storage Methods 0.000 description 1
- 239000011159 matrix material Substances 0.000 description 1
- 238000000691 measurement method Methods 0.000 description 1
- 238000010606 normalization Methods 0.000 description 1
- 238000012552 review Methods 0.000 description 1
- 238000011896 sensitive detection Methods 0.000 description 1
- 230000008054 signal transmission Effects 0.000 description 1
- 230000036962 time dependent Effects 0.000 description 1
Images


Classifications
-
- H—ELECTRICITY
- H04—ELECTRIC COMMUNICATION TECHNIQUE
- H04B—TRANSMISSION
- H04B10/00—Transmission systems employing electromagnetic waves other than radio-waves, e.g. infrared, visible or ultraviolet light, or employing corpuscular radiation, e.g. quantum communication
- H04B10/07—Arrangements for monitoring or testing transmission systems; Arrangements for fault measurement of transmission systems
- H04B10/073—Arrangements for monitoring or testing transmission systems; Arrangements for fault measurement of transmission systems using an out-of-service signal
-
- H—ELECTRICITY
- H04—ELECTRIC COMMUNICATION TECHNIQUE
- H04B—TRANSMISSION
- H04B10/00—Transmission systems employing electromagnetic waves other than radio-waves, e.g. infrared, visible or ultraviolet light, or employing corpuscular radiation, e.g. quantum communication
- H04B10/07—Arrangements for monitoring or testing transmission systems; Arrangements for fault measurement of transmission systems
- H04B10/075—Arrangements for monitoring or testing transmission systems; Arrangements for fault measurement of transmission systems using an in-service signal
- H04B10/077—Arrangements for monitoring or testing transmission systems; Arrangements for fault measurement of transmission systems using an in-service signal using a supervisory or additional signal
- H04B10/0775—Performance monitoring and measurement of transmission parameters
-
- H—ELECTRICITY
- H04—ELECTRIC COMMUNICATION TECHNIQUE
- H04B—TRANSMISSION
- H04B10/00—Transmission systems employing electromagnetic waves other than radio-waves, e.g. infrared, visible or ultraviolet light, or employing corpuscular radiation, e.g. quantum communication
- H04B10/07—Arrangements for monitoring or testing transmission systems; Arrangements for fault measurement of transmission systems
- H04B10/075—Arrangements for monitoring or testing transmission systems; Arrangements for fault measurement of transmission systems using an in-service signal
- H04B10/079—Arrangements for monitoring or testing transmission systems; Arrangements for fault measurement of transmission systems using an in-service signal using measurements of the data signal
- H04B10/0795—Performance monitoring; Measurement of transmission parameters
- H04B10/07953—Monitoring or measuring OSNR, BER or Q
-
- H—ELECTRICITY
- H04—ELECTRIC COMMUNICATION TECHNIQUE
- H04J—MULTIPLEX COMMUNICATION
- H04J14/00—Optical multiplex systems
- H04J14/02—Wavelength-division multiplex systems
-
- H—ELECTRICITY
- H04—ELECTRIC COMMUNICATION TECHNIQUE
- H04J—MULTIPLEX COMMUNICATION
- H04J14/00—Optical multiplex systems
- H04J14/06—Polarisation multiplex systems
Definitions
- the invention relates to the determination of in-band optical noise in optical telecommunication applications. More specifically, the invention relates to the determination of non-ASE optical noise on optical telecommunication links.
- the Optical Signal-to-Noise Ratio is a conventional measure of the quality of a signal carried by an optical telecommunication link. Under normal and proper operating conditions, the OSNR of an optical communication link is typically high, often in excess of 15 dB or 20 dB, or even greater.
- the dominant component of the noise in an optical communication link is typically unpolarized Amplified Spontaneous Emission (ASE) noise, which is a spectrally broadband noise source contributed by the optical amplifiers in the link.
- ASE Amplified Spontaneous Emission
- Polarization-nulling methods exploit the fact that the signal peak is generally polarized whereas ASE noise is generally unpolarized.
- a polarization controller disposed before a linear polarizer, the combination serving as polarization analyzer, it is possible to orthogonally align the polarization axis of the analyzer to the State Of Polarization (SOP) of the signal-under-test in order to find a condition where the signal peak is maximally suppressed.
- SOP State Of Polarization
- Differential polarization response methods involve the polarization-sensitive detection of an optical spectrum with optical spectrum analyzer means, where two or more optical spectrum traces are acquired under different polarization analysis conditions.
- the differential polarization response approach does not require that the polarized signal be suppressed or close to the electronic noise floor of the measurement instrument for any of the acquired optical spectrum traces.
- differential polarization response methods employ a mathematical discrimination of the signal peak from the in-band ASE noise in the acquired optical spectrum traces using calculations and a comparison between the acquired traces. This results in significantly less stringent requirements on both the polarization control of the signal-under-test and the quality of the Optical Spectrum Analyzer (OSA) components (e.g. polarization extinction ratio), and leads to a significantly reduced measurement time in comparison to polarization-nulling methods.
- OSA Optical Spectrum Analyzer
- non-ASE optical noise there are other optical sources of distortion that may be present and significant on optical telecommunication signals of advanced modulation formats for next generation high-speed networks. Any such optical component which imparts impairment on optical signals and which is not ASE-related will be herein referred to as "non-ASE optical noise".
- multilevel modulation is a key enabler to significantly improve the spectral efficiency of optical fiber links employing already existing optical amplifiers and fiber transmission lines.
- phase modulation, often combined with amplitude modulation, of an optical carrier is an attractive means to achieve such multibit-per-symbol transmission.
- impairments arising from dispersion phenomena that are "linear" with respect to the electric field can be, in principle, completely compensated at the receiver using digital signal processing.
- coherent-detection approaches remain susceptible to optical Non-Linear Effects (NLEs), such as Cross-Phase Modulation (XPM), Self-Phase Modulation (SPM), and polarization cross-talk.
- NLEs Non-Linear Effects
- XPM arising from adjacent or nearby "legacy" intensity-modulated signals (e.g. 10 Gbit/s OOK signals) may drastically impair phase-modulated coherent telecommunication signals.
- XPM manifests itself on propagating optical signals in the form of signal depolarization which may be confused with ASE noise in prior-art polarization-nulling and differential polarization response methods. Accordingly, it is useful to characterize and discriminate signal depolarization from ASE noise, especially on live systems, as NLE-type impairments are very system and in situ dependent.
- MZIs Mach-Zehnder Interferometers
- Incident light having a linear SOP parallel to the modulation axis of the modulator will undergo a high degree of modulation to provide the modulated (normally data-carrying) signal, whereas light having an SOP orthogonal to the modulation axis will normally undergo a much lower degree of modulation, this non-modulated portion being termed herein "carrier leakage".
- the non-modulated carrier leakage may introduce some extra optical noise to the system receiver.
- the non-modulated carrier leakage and the modulated signal are both substantially polarized and have mutually-orthogonal SOPs. Therefore, it is useful to measure and discriminate the carrier leakage from the modulated signal and/or from ASE noise for advanced signal-quality characterization.
- WO 03/041306 A2 discloses characterization of a transmission path of an optical signal.
- a transmission value representing a property of a transmission path of an optical signal having at least one optical communication signal is derived by converting the optical signal, or at least a part thereof, into an electrical signal.
- An electrical filter is provided for at least substantially removing spectral components resulting from the at least one optical communication signal from the converted electrical signal, and the transmission value is then derived from the filtered converted electrical signal.
- the transmission value is preferably derived from a measured spectral power density of the filtered converted electrical signal.
- a method for determining a noise parameter characterizing an optical Signal-Under-Test (SUT) having a (polarized) signal contribution, an Amplified Spontaneous Emission (ASE) noise contribution and a non-ASE optical noise contribution, such as a carrier-leakage contribution or a depolarized-signal contribution, within an optical-signal bandwidth comprises acquiring optical spectrum trace(s) of the SUT, discriminating at least the non-ASE optical noise contribution from the ASE-noise contribution using the optical spectrum trace(s) and/or a trace obtained from the optical spectrum trace(s); and determining the noise parameter using discriminated non-ASE optical noise contribution and/or the discriminated ASE-noise contribution.
- non-ASE optical noises each exhibit some specific optical properties notably in optical spectral shape and polarization, which are different from that of the polarized data-carrying signal and the ASE-noise. These qualitative differences are exploited herein to discriminate the non-ASE optical noises from the polarized data-carrying signal and the ASE-noise in acquired optical spectrum traces. More specifically, embodiments described here are based on a polarization-sensitive spectrum analysis of the SUT to be characterized. Based on this analysis, at least the specific polarization properties of the non-ASE optical noise(s) are exploited to discriminate it (them) from others. The specific optical spectrum properties of the non-ASE optical noise(s) may also be exploited to complete the discrimination.
- One aspect of the invention provides a method for determining a noise parameter characterizing an optical SUT having a signal contribution, an ASE-noise contribution and a non-ASE optical noise contribution within an optical-signal bandwidth.
- the method comprises: acquiring, for each of a number n SOP of varied state-of-polarization analysis conditions of the SUT, at least one polarization-analyzed optical spectrum trace; discriminating at least the non-ASE optical noise contribution from the ASE-noise contribution using the acquired polarization-analyzed optical spectrum traces and/or a trace obtained from the acquired polarization-analyzed optical spectrum traces; and determining the noise parameter characterizing the SUT using the discriminated non-ASE optical noise contribution and/or the discriminated ASE-noise contribution.
- Another aspect of the invention provides a method for determining a noise parameter characterizing an optical SUT having a signal contribution, a carrier-leakage contribution and an ASE-noise contribution within an optical-signal bandwidth.
- the method comprises: acquiring at least one optical spectrum trace of the SUT; discriminating at least the carrier-leakage contribution from the ASE-noise contribution using the acquired optical spectrum trace(s) and/or a trace obtained from the acquired optical spectrum trace(s); and determining the noise parameter on the SUT using the discriminated carrier-leakage contribution and/or the discriminated ASE-noise contribution.
- Yet another aspect of the invention provides a method for determining a noise parameter characterizing an optical SUT having a polarized-signal contribution, a depolarized-signal contribution and an ASE-noise contribution within an optical-signal bandwidth, the depolarized-signal contribution being at least partly imparted from a non-linear effect to be characterized.
- the method comprises: acquiring, for each of a number n SOP of varied state-of-polarization analysis conditions of the signal under test, at least one polarization-analyzed optical spectrum trace; discriminating at least the depolarized-signal contribution from the ASE-noise contribution using the acquired polarization-analyzed optical spectrum traces and/or a trace obtained from the acquired polarization-analyzed optical spectrum traces; and determining the noise parameter on the SUT using the discriminated depolarized-signal contribution and/or the discriminated ASE-noise contribution.
- the methods described herein which discriminate non-ASE optical noise from the data-carrying signal and ASE noise may be employed to characterize a non-ASE optical noise per se on the SUT, but that it may alternately be employed to provide an improved characterization of the in-band ASE-noise on the SUT compared to the prior art methods by discriminating ASE-noise from non-ASE optical noise.
- the noise parameter to be characterized may either be an ASE-noise parameter or a non-ASE noise parameter.
- a probe signal may be propagated in the optical channel to be characterized by employing an optical test source at the transmitter end of the optical telecommunication link. At the receiver end or anywhere else on the optical link, the probe signal will typically undergo substantially the same ASE and non-ASE noise as if it were a data-carrying signal and characterization of the probe signal provides characterization of the optical telecommunication channel.
- the optical signal referred to as the SUT encompasses both a data-carrying signal and a probe signal.
- characterization of the propagated probe signal referred to as the SUT, provides a characterization of the optical telecommunication channel under test.
- trace is not to be construed limitatively to data that is displayed graphically, but is intended to encompass data which is not displayed graphically but nonetheless used for any suitable purpose.
- (vacuum) wavelength denoted ⁇
- optical frequency denoted v.
- the relationship between a small optical-frequency difference, for instance within a narrow (e.g. 50-GHz) DWDM channel, and the corresponding small wavelength difference is nearly linear and well known.
- differential polarization response approach may correspond to the Passive Polarization-Induced Discrimination (PPID) approach as described in International Patent Application Publication WO 2008/122123 A1 to Gariépy et al. (commonly owned by the Applicant) and that the two nomenclatures refer to the same technique.
- the technique referred to as the "differential polarization response approach” also includes variants of the PPID approach including the approach referred to as the improved differential polarization response approach in International Patent Application Publication WO 2011/020195 A1 to He et al. (also commonly owned by the Applicant).
- the methods and systems described herein relate to the characterization of an optical Signal-Under-Test (SUT) p which is used in optical telecommunications to transmit data over, for instance, a Dense Wavelength Division Multiplexing (DWDM) optical channel.
- the SUT p corresponds to one of the DWDM optical channels.
- the SUT p In the optical-channel bandwidth of interest, the SUT p generally comprises a modulated signal contribution s arising from the data-carrying signal, and an Amplified Spontaneous Emission (ASE-) noise contribution n ASE arising from ASE noise of optical amplifiers in the optical transmission system.
- ASE- Amplified Spontaneous Emission
- the SUT p may also comprise a non-modulated carrier-leakage contribution C L which may arise from an imperfect modulation at the transmitter.
- Fig. 1 shows the optical spectrum p( ⁇ ) of an example SUT p, along with the optical spectrum of its signal contribution s( ⁇ ).
- the State-Of-Polarization (SOP) of one signal may be influenced by the other signals.
- the change is caused by the optical Kerr effect, also known as “nonlinear birefringence", which has a different magnitude for parallel and perpendicular optical electric-field components.
- DWDM Dense Wavelength Division Multiplexing
- the XPM-induced NLE gives rise to a rapid change of SOP on each DWDM signal.
- Such a nonlinear polarization effect results in a time-dependent "scrambling" of the SOP on a time scale shorter than a symbol period. This leads to an apparent partial depolarization of the (data-carrying) signal contribution of the SUT, referred to herein as "NLE-induced signal depolarization”.
- PMD Polarization Mode Dispersion
- OSA Optical Spectrum Analyzer
- DDD Differential Group Delay
- RBW OSA Resolution BandWidth
- PMD may lead to an optical-frequency-dependent SOP variation which manifests itself on the SUT, depending upon the SOP of the signal, as a depolarization of the signal contribution, referred to herein as "PMD-related signai depolarization".
- Equation (1) also applies in the presence of signal depolarization, comprising either or both of NLE-induced signal depolarization and PMD-related signal depolarization.
- S dp ( ⁇ ) NLE and S dp ( ⁇ ) PMD corresponding respectively to an NLE-induced depolarized-signal contribution S dp-NLE and a PMD-related depolarized-signal contribution S dp-PMD .
- the carrier-leakage contribution C L , the depolarized-signal contribution S dp , the NLE-induced depolarized-signal contribution S dp-NLE and the PMD-related depolarized-signal contribution S dp-PMD each represent a non-ASE noise contribution.
- An optical spectrum trace of the SUT p, acquired by an OSA, represents the SUT p convolved with the filter spectral response of the OSA f( ⁇ ).
- the optical spectrum trace P( ⁇ ) is thus the spectrally-resolved optical power of the SUT p.
- the optical spectrum trace P( ⁇ ) includes a signal contribution S(A), an ASE-noise contribution N ASE ( ⁇ ) and a carrier-leakage contribution C L ( ⁇ ), which appear as being merged in the optical spectrum trace P( ⁇ ).
- the methods and systems described herein are used to discriminate the (polarized) signal contribution S( ⁇ ) from the ASE-noise contribution N ASE ( ⁇ ) and a non-ASE optical noise contribution C L ( ⁇ ) and/or S dp ( ⁇ ) in the optical spectrum trace P( ⁇ ) in order to determine one or more noise parameters of the SUT.
- the instrument noise associated with the detection system itself, namely the OSA, on the acquired optical spectrum trace P(A) is considered to contribute negligibly to the observed optical noise.
- Fig. 1 shows a single optical signal p within its corresponding optical channel, but in general other e.g. DWDM optical channels also share the optical spectrum (e.g. telecom C band), each channel carrying one optical signal (not shown). Typically, the other optical signals are present in the optical spectrum on both sides of the optical signal p.
- DWDM optical channels also share the optical spectrum (e.g. telecom C band), each channel carrying one optical signal (not shown).
- the other optical signals are present in the optical spectrum on both sides of the optical signal p.
- a DWDM optical channel is specified as a spectral bandwidth over which an optical signal propagating through the link exhibits minimal loss, i.e. the channel bandwidth, allocated for the transmission of an optical signal in a WDM transmission scheme.
- the optical-signal bandwidth is defined as the actual width of the signal peak, i.e. the bandwidth over which the signal contribution is non negligible.
- the channel bandwidth may be larger than or just as large as (or even narrower than) the signal bandwidth, depending on the density of the DWDM channels, the effective bandwidth of the optical channel, and the signal transmission rate for a given transmission scheme.
- the depolarized-signal contribution S dp ( ⁇ ) exhibits a different spectral shape than that of the ASE-noise contribution N ASE ( ⁇ ), since S dp ( ⁇ ) follows the spectral shape of the signal contribution S( ⁇ ) whereas the ASE-noise contribution N ASE ( ⁇ ) is substantially uniform at least in the central area of the optical-signal bandwidth, assuming that f( ⁇ ) has a RBW that is narrower than that of the signal contribution S( ⁇ ), which is generally the case.
- the optical-signal bandwidth (determined by the signal baud) for high-speed networks (40G, 100G or higher) generally exceeds 10 GHz (even with advanced multi-level modulation formats), and current commercial field-deployable OSAs, such as models FTB-5240BP and FTB-5240S-P manufactured and marketed by EXFO Inc., have typical RBWs respectively of approximately 4 and 8 GHz in the (C-band) wavelength region of most DWDM systems.
- the depolarized-signal contribution S dp ( ⁇ ) and the ASE-noise contribution N ASE ( ⁇ ) have similar polarization properties, that is both are depolarized.
- the carrier-leakage contribution C L ( ⁇ ) also has some specific optical properties, notably both its optical spectral shape and polarization, which are different from that of the modulated signal contribution S( ⁇ ) and the ASE-noise contribution N ASE ( ⁇ ).
- the SOP of the carrier leakage C L is approximately orthogonal to the SOP of the signal contribution S.
- its corresponding optical spectrum shape C L ( ⁇ ) usually closely resembles the carrier spectrum, which in turn is determined by the spectral line shape of the CW laser source employed in the transmitter, rather than that of the signal S.
- a first embodiment is described in which the dominant source of non-ASE optical noise on the SUT is a carrier-leakage contribution C L .
- signal depolarization S p is assumed negligible and hence is not considered.
- the described method of this first embodiment is used to discriminate the carrier-leakage contribution C L from the data-carrying signal contribution S and the ASE-noise contribution N ASE , in order to determine either or both an ASE-noise parameter, e.g. the ASE-only OSNR, or a non-ASE noise parameter, e.g. the carrier-leakage extinction ratio.
- a second embodiment is then described in which the SUT manifests both a signal-depolarization contribution S dp and a carrier-leakage contribution C L .
- Both non-ASE optical noise contributions (C L and S dp ) are then discriminated on acquired optical spectrum traces in order to determine either or both an ASE-noise parameter, e.g. the ASE-only OSNR, or a non-ASE optical noise parameter, e.g. a degree of signal depolarization parameter (i.e the complement of degree of polarization).
- an ASE-noise parameter e.g. the ASE-only OSNR
- a non-ASE optical noise parameter e.g. a degree of signal depolarization parameter (i.e the complement of degree of polarization).
- the second embodiment may be simplified to the case where carrier-leakage is not present and where the only non-ASE optical noise to be evaluated is the signal depolarization.
- the method of the second embodiment is applied to the case where a probe signal is propagated in an optical telecommunication channel that is not carrying a data-carrying signal, in order to characterize non-ASE optical noise on this channel.
- polarization-sensitive spectrum analysis which exploits the differential polarization and spectral properties of the signal contribution S, the ASE-noise contribution and the non-ASE optical-noise contribution in order to discriminate between these. This common approach is then applied to each of the three embodiments used herein for performing the polarization-sensitive spectrum analysis.
- the polarization-sensitive spectrum analysis method described herein is only one example of a possible method and that multiple variants of this method exist such as, for example, methods described in International Patent Application Publication WO 2008/122123 A1 to Gariépy et al. and WO 2011/020195 A1 to He et al. , both applications being commonly owned by the Applicant.
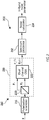
- Fig. 2 illustrates the main components of a system 200 suitable for conducting the methods as described hereinafter, including the polarization-sensitive spectrum analysis.
- the system 200 receives a SUT p and comprises a Varied-SOP polarization-sensitive Optical Spectral Analyzer (VSOP-OSA) 210, a spectrum processor 212 and a noise calculator 214.
- the VSOP-OSA 210 comprises a polarization controller, in this case a polarization scrambler 216, placed before a polarization-diversity OSA 218 (see, for example, the polarization-diversity OSA described in commonly-owned U.S. Patent No.
- the optical spectrum analysis means is not limited to a polarization-diversity OSA but could encompass other polarization-sensitive spectrum analysis means providing polarimetric information on the SUT for example.
- the polarization beam splitter 220 is replaced by a linear polarizer, such that only one polarization-analyzed sample p // is acquired for each condition of the polarization scrambler 216.
- the polarization beam splitter 220 is used to obtain two orthogonally-analyzed samples p ⁇ and p // of the input optical signal p.
- the polarization scrambler 216 is typically controlled by a control unit (not shown) which causes the SOP analysis conditions to be varied among acquisitions of pairs of samples p ⁇ and p // .
- the OSA 222 simultaneously acquires two polarization-analyzed optical spectrum traces (P ⁇ ( ⁇ ) and P // ( ⁇ )) respectively corresponding to samples p ⁇ and p // .
- P ⁇ ( ⁇ ) and P // ( ⁇ ) respectively corresponding to samples p ⁇ and p // .
- the spectrum processor 212 receives the two traces P ⁇ ( ⁇ ), P // ( ⁇ ) and discriminates the signal contribution s, the ASE-noise contribution n ASE and a non-ASE optical noise contribution (carrier-leakage contribution C L and/or depolarized-signal contribution s dp ).
- the noise calculator 214 evaluates an in-band noise parameter from the discriminated contributions.
- the ASE-only OSNR for example or any non-ASE optical noise parameter can then be calculated using the discriminated contributions.
- Fig. 2 is given as an illustrative example only of a suitable system for applying the methods described herein and that components or combination of components described may be replaced by any other components or combination of components which performs the functions required for their application.
- a plurality of polarization-analyzed optical spectrum traces of the SUT should be acquired by varying the SOP analysis conditions of the VSOP-OSA 210. In accordance with the system 200 of Fig. 2 , this is performed by generating, by means of the polarization scrambler 216, a number n SOP of different SOPs from the SOP of the SUT incident thereon.
- an extrema trace for example a maxima ratio trace r max ( ⁇ ) or a minima ratio trace r min ( ⁇ ) corresponding to the n SOP pairs of mutually-orthogonal polarization-analyzed optical spectrum traces P // ( ⁇ ) and P ⁇ ( ⁇ ) is calculated.
- the extrema trace r' min ( ⁇ ) or r' max ( ⁇ ) is obtained by identifying the one of the ratio traces among the acquired n SOP pairs of optical spectra for which the signal peaks exhibits, respectively, a minimum or maximum.
- the extrema trace r' min ( ⁇ ) then corresponds to the pair of mutually-orthogonal optical spectrum traces P // ( ⁇ ), P ⁇ ( ⁇ ) for which the SOP analysis condition (e.g.
- the axis of the analyzer defined by the polarization-controller / linear-polarizer combination is the more closely aligned with the SOP of the signal, and thereby to the optical spectrum trace (say P // ( ⁇ )) for which the signal contribution is most suppressed.
- this polarization-sensitive spectrum analysis may be compared to the polarization-nulling approach where the SOP is scrambled until the signal is completely suppressed.
- the methods described herein are more general compared to the polarization-nulling approach, in that it is not required that the signal be substantially or completely suppressed in any of the polarization-analyzed mutually-orthogonal optical spectrum traces P // ( ⁇ ), P ⁇ ( ⁇ ).
- the non-perfect alignment of the SOP of the signal in the extrema trace r min ( ⁇ ) or r max ( ⁇ ) is compensated by the parameter ⁇ as described hereinbelow.
- the extrema trace r min ( ⁇ ) or r max ( ⁇ ) is rather evaluated wavelength-by-wavelength in order to construct a composite extrema trace.
- Such construction of a composite extrema trace permits significant compensation for certain effects usually associated with signal impairments, notably PMD, which may otherwise lead to a wavelength-dependent error on the discriminated contributions.
- r minmin ⁇ min r min ⁇ ; 1 / r max ⁇ ⁇
- Equations (9) and (10) are useful especially for compensating variations of optical power from one acquisition to another, they are optional and, in other embodiments of polarization-sensitive spectrum analysis, one or the other may be omitted without departing from the general concept described herein.
- the thereby-obtained extrema trace which in this embodiment is the composite extrema optical spectral trace P minmin ( ⁇ ), corresponds to an optical spectrum trace where the proportion of polarized-signal contribution S p ( ⁇ ) is minimized.
- P minmin ⁇ 0.5 ⁇ S ⁇ + ⁇ 1 ⁇ ⁇ S ⁇ + 0.5 N ASE ⁇ + 1 ⁇ ⁇ C L ⁇
- ⁇ is the coefficient of residual polarized-signal contribution S p ( ⁇ ) in P minmin ( ⁇ ).
- the first contribution, ⁇ SOP arises from the fact that it is not required that the signal, more specifically the polarized-signal contribution S p ( ⁇ ), be substantially or completely suppressed in any of the polarization-analyzed mutually-orthogonal optical spectrum traces P // ( ⁇ ), P ⁇ ( ⁇ ).
- the second contribution, ⁇ PBS comes from the inherent extinction-ratio limitation of the polarization beam splitter (for instance 220) employed to separate P // ( ⁇ ) and P ⁇ ( ⁇ ). It will be appreciated that in some cases, this latter contribution may be sufficiently small to be assumed null.
- n SOP is at least about 50 (which yields ⁇ ⁇ 0.01)
- this latter non-perfect alignment is usually considered to not have a significant practical effect on the polarization-sensitive spectrum analysis and the characterization of non-ASE optical noise contributions. Consequently, the factor (1- ⁇ ) may be neglected in the following.
- this aforedescribed non-perfect alignment cannot be considered negligible, it remains possible to take it into account.
- the aforedescribed prior-art polarization-nulling approach represents a special case of the polarization-sensitive spectrum analysis described herein, for which the ⁇ parameter may be considered null.
- a condition may arise if the number of SOP analysis conditions n SOP is very high, so that, on at least one of the acquired optical spectrum trace, the SOP of the SUT, as generated by the polarization scrambler 216, is substantially aligned with the polarization beam splitter 220.
- the method described herein is more general and is also applicable to a reduced number of SOP analysis conditions n SOP for which the parameter ⁇ cannot be assumed null or negligibly small.
- the ASE-noise contribution N ASE ( ⁇ ) is assumed to be substantially depolarized, resulting in also half of the ASE-noise contribution N ASE ( ⁇ ) to show in optical spectral trace P minmin ( ⁇ ).
- P minmin optical spectral trace
- FIG. 3 shows an example of an optical spectrum trace P sum ( ⁇ ) of a channel of a commercial 40G system, as acquired by a FTB-5240BP OSA by EXFO Inc. having a RBW of about 3.5 GHz, where the dominant source of non-ASE optical noise on the SUT is a carrier-leakage contribution C L .
- Illustrated in Fig. 3 are the total optical spectrum trace P sum ( ⁇ ), its data-carrying signal contribution S(A) and combined carrier-leakage and ASE-noise contributions C L ( ⁇ ) + N ASE ( ⁇ ).
- non-ASE noise is assumed to only include carrier leakage.
- Signal depolarization S dp is assumed negligible and is hence not considered.
- the method of this first embodiment is used to discriminate the carrier-leakage contribution C L from the data-carrying signal contribution S and the ASE-noise contribution N ASE in order to determine either or both of an ASE-noise parameter, e.g. the ASE-only OSNR, or a non-ASE noise parameter, e.g. the carrier-leakage extinction ratio.
- the respective SOPs and degrees of polarization of the signal S( ⁇ ), the carrier-leakage C L ( ⁇ ) and ASE-noise N ASE ( ⁇ ) contributions are in general different, that is:
- Fig. 4 shows the method 400 of the first embodiment for determining a noise parameter on a SUT having signal S(A), ASE-noise N ASE ( ⁇ ) and carrier-leakage C L ( ⁇ ) contributions.
- the carrier-leakage contribution C L ( ⁇ ) may be discriminated from the signal S(A) and ASE-noise N ASE ( ⁇ ) contributions by means of differential properties of spectral shape and polarization.
- step 402 a polarization-sensitive spectrum analysis of the SUT is conducted.
- the carrier-leakage contribution C L ( ⁇ ) is discriminated in P minmin ( ⁇ ).
- step 406 the signal S(A) and ASE-noise N ASE ( ⁇ ) contributions are also discriminated in P minmin ( ⁇ ) and P sum ( ⁇ ). Having discriminated all contributions, in step 408, the noise parameter(s) to be characterized are determined from at least one or a combination of the discriminated signal S(A), ASE-noise N ASE ( ⁇ ) and carrier-leakage C L ( ⁇ ) contributions.
- step 402 a polarization-sensitive spectrum analysis of the SUT is conducted as described hereinabove.
- Step 402 may be implemented, for example, by employing the VSOP-OSA 210 of Fig. 2 .
- P minmin ⁇ ⁇ S ⁇ + 0.5 N ASE ⁇ + C L ⁇
- P sum ⁇ S ⁇ + N ASE ⁇ + C L ⁇
- Step 404 the carrier-leakage contribution C L ( ⁇ ) is discriminated in P minmin ( ⁇ ).
- Step 404 may be implemented, for example, by the spectrum processor 212 of Fig. 2 .
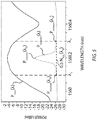
- Fig. 5 illustrates step 404 in the case where the number n SOP is very large (n SOP ⁇ ⁇ ) and the effect of the polarization beam splitter extinction ratio is assumed negligible ( ⁇ PBS ⁇ 0).
- the coefficient ⁇ of residual S( ⁇ ) in P minmin ( ⁇ ) then approaches zero ( ⁇ ⁇ 0), i.e. ⁇ S (A) is assumed negligible compared to 0.5 N ASE ( ⁇ ).
- the ASE-noise contribution N ASE ( ⁇ 0 ) may be estimated, at the peak wavelength ⁇ 0 of C L ( ⁇ ), by a linear interpolation on minima trace P minmin ( ⁇ ), between "shoulder points" at wavelengths ⁇ 1 and ⁇ 2 selected, as explained hereafter, on each side of the carrier-leakage peak.
- This technique is herein referred to as "shoulder interpolation”.
- the total power of the carrier-leakage contribution may be determined from C L ( ⁇ 0 ), that is the peak power of the power spectrum trace of the carrier leakage C L ( ⁇ ).
- the carrier-leakage contribution can be then estimated with good accuracy by judicious choice of the shoulder-point wavelengths ⁇ 1 and ⁇ 2 where C L ( ⁇ ) contributes negligibly to P minmin ( ⁇ ). This is normally readily achievable since C L ( ⁇ ) is typically much narrower than the DWDM channel bandwidth.
- the technique used to select the shoulder points may vary.
- ⁇ could be chosen in an adaptive way as the - X-dB bandwidth (e.g. the -20-dB bandwidth with respect to the peak transmission) of the filter function f(A) corresponding to the OSA that is being used in the acquisition.
- Step 406 the signal S(A) and ASE-noise N ASE ( ⁇ ) contributions are discriminated in P minmin ( ⁇ ) and P sum ( ⁇ ).
- Step 404 may also implemented, for example, by the spectrum processor 212 of Fig. 2 .
- Fig. 6 illustrates step 404 in the case where the coefficient ⁇ cannot be neglected ( ⁇ ⁇ 0).
- Fig. 6 shows an example of an optical spectrum trace acquired on a channel of a commercial 40G/10G mixed system for which the channel spacing is 50-GHz, as acquired by a FTB-5240BP OSA by EXFO Inc. having a RBW of about 3.5 GHz, for which there is significant residual signal contribution ⁇ S(A) in P minmin ( ⁇ ) as well as some carrier-leakage contribution C L .
- Fig. 6 illustrates the total optical spectrum trace P sum ( ⁇ ) and the minima trace P minmin ( ⁇ ).
- C L ( ⁇ ) may be discriminated from [ ⁇ S( ⁇ ) + 0.5 N ASE ( ⁇ ) ] by means of higher-order polynomial curve fitting using multiple, carefully chosen points comprising the composite minima trace P minmin ( ⁇ ).
- the trace P sum ( ⁇ ) may be used to estimate the shape of [ ⁇ S( ⁇ ) + 0.5 N ASE ( ⁇ ) ].
- the shape of P sum ( ⁇ ) is fitted over P minmin ( ⁇ ) so as to interpolate [ ⁇ S( ⁇ ) + 0.5 N ASE ( ⁇ ) ] in the spectral region where C L is non-negligible.
- C L ( ⁇ ) is then found using Equations (17a) and (17b).
- C L ( ⁇ ) may also be found or discriminated from [ ⁇ S( ⁇ ) + 0.5 N ASE ( ⁇ ) ] in P minmin ( ⁇ ) based on a technique predicated upon both the slow variation (or substantial uniformity) of [ ⁇ S( ⁇ ) + 0.5 N ASE ( ⁇ ) ] under C L ( ⁇ ), as illustrated in Fig. 6 , and the fact that C L ( ⁇ ) has the same measured spectral shape as the filter function f( ⁇ ) of the OSA, which is typically known or easily determined using a pre-calibration procedure or modeling. Referring to Fig.
- the processing uses measurements made at two distinct wavelengths ⁇ 0 and ⁇ 1 (generally different from peak wavelength ⁇ 0 and shoulder-point wavelength ⁇ 1 of Fig. 5 ) that lie within the optical-signal bandwidth of the SUT and are generally positioned on the same side of the peak of the carrier-leakage contribution.
- C L ⁇ ⁇ C L ⁇ 0
- C L ⁇ 0 ⁇ C L ⁇ 0 ⁇ C L ⁇ 1 ⁇ ⁇ S ⁇ 0 ⁇ S ⁇ 1 C L ⁇ 0 ⁇ C L ⁇ 1
- ⁇ C L is estimated to be less than 0.1 dB.
- the signal S( ⁇ ) and ASE-noise N ASE ( ⁇ ) contributions should also be discriminated in accordance with step 406.
- the noise parameter(s) to be characterized i.e. either or both an ASE-noise parameter, e.g. the ASE-only OSNR, or a non-ASE noise parameter, e.g. the carrier-leakage extinction ratio, is (are) calculated from at least one or a combination of the discriminated signal S( ⁇ ), ASE-noise N ASE ( ⁇ ) and carrier-leakage C L ( ⁇ ) contributions.
- the thereby-determined noise parameter(s) are output for use, for example, in monitoring, maintenance or troubleshooting of a DWDM optical system.
- the noise parameter(s) may be output by graphical display, by printing, by generating an electrical signal or by storage into memory for later retrieval. Other parameters may also be displayed or otherwise output in a graphical or numerical form. Step 408 may be implemented, for example, by employing the noise calculator 214 of Fig. 2 .
- any other useful ASE-noise parameters and/or non-ASE noise parameters may also be determined and subsequently output.
- the carrier leakage is obtained through an analysis performed on a minima trace of n SOP pairs of traces obtained with varied SOP analysis conditions of the SUT. It is however noted that, instead of using the minima trace, the carrier leakage may be obtained through the analysis of a maxima trace, which would be generally combined with the total-power optical spectrum trace of the SUT (P sum ( ⁇ )).
- the carrier-leakage contribution is evaluated based on a combination of polarization and spectral analysis of the SUT. It is noted that such a polarization analysis would not adequately discriminate the carrier-leakage contribution from the other contributions in the case of polarization-multiplexed signals. Accordingly, in another embodiment, the carrier-leakage contribution is evaluated using only spectral analysis, i.e. based on the different spectral-shape properties between the signal contribution, the carrier-leakage contribution and the ASE-noise contribution. The carrier-leakage contribution is then evaluated without employing a polarization-based analysis. Such an approach becomes practicable especially when the carrier-leakage contribution is sufficiently significant to be readily detectable on any optical spectrum trace P sum ( ⁇ ) of the SUT.
- the presence of carrier leakage is detectable on the total power optical spectrum trace P sum ( ⁇ ) of the SUT as a deformation of the optical signal at the carrier peak wavelength. Because the carrier-leakage contribution has a very narrow bandwidth and thus varies rapidly compared to the signal contribution and the ASE-noise contribution, the carrier-leakage contribution may be discriminated from the other contributions by applying to P sum ( ⁇ ) one of the techniques described hereinabove as being applied to P minmin ( ⁇ ) with reference to Fig. 6 .
- Equations (18a) to (20) may be modified as follows for cases where [S(A) + N ASE ( ⁇ )] varies slowly (or is almost uniform) under C L ( ⁇ ) and where C L ( ⁇ ) has substantially the same measured spectral shape as the filter function f(A) of the OSA, which is known or easily determined using a pre-calibration procedure or modeling.
- FIG. 7 depicts an example of an optical spectrum trace P sum ( ⁇ ) encompassing a few channels of a commercial 80-channel 10G/40G mixed system, as acquired by a FTB-5240BP OSA by EXFO Inc. having a RBW of about 3.5 GHz.
- the dominant source of non-ASE optical noise on this SUT is a depolarized-signal contribution S dp , although a carrier-leakage contribution C L may also be present.
- Fig. 7 illustrates the total optical spectrum trace P sum ( ⁇ ) and its depolarized part, i.e. S dp ( ⁇ ) + N ASE ( ⁇ ).
- the described method of this second embodiment is used to discriminate both non-ASE optical noise contributions (C L and S dp ) on acquired optical spectrum traces in order to determine either or both of an ASE-noise parameter, e.g. the ASE-only OSNR, or a non-ASE optical noise parameter, e.g. a degree of signal depolarization parameter.
- an ASE-noise parameter e.g. the ASE-only OSNR
- a non-ASE optical noise parameter e.g. a degree of signal depolarization parameter.
- the second embodiment may be simplified to the case where carrier-leakage is not present and where the only non-ASE optical noise to be evaluated is the signal depolarization.
- the optical spectrum shape and the SOP of the SUT are influenced by depolarization induced by either or both of NLEs or PMD.
- depolarized-signal S dp depolarized-signal S dp
- polarized signal S p polarized signal S p
- ASE-noise N ASE and carrier-leakage C L contributions have different spectral-shape and polarization properties that may be exploited to mutually discriminate them in acquired optical spectrum traces.
- the method of the second embodiment employs polarization-sensitive spectrum analysis such as described hereinabove.
- Fig. 8 shows the method 800 of the second embodiment for determining a noise parameter on a SUT having depolarized-signal S dp ( ⁇ ), polarized-signal S p ( ⁇ ), ASE-noise N ASE ( ⁇ ) and carrier-leakage C L ( ⁇ ) contributions.
- the carrier-leakage C L ( ⁇ ) and depolarized-signal S dp ( ⁇ ) contributions may be discriminated from the polarized-signal S(A) and ASE-noise N ASE ( ⁇ ) contributions by means of differential properties of spectral shape and polarization.
- step 802 a polarization-sensitive spectrum analysis of the SUT is conducted.
- step 804 the carrier-leakage contribution C L ( ⁇ ) is discriminated in P minmin ( ⁇ ) and subtracted from P minmin ( ⁇ ) and P sum ( ⁇ ) to yield P' minmin ( ⁇ ) and P' sum ( ⁇ ), the latter being equivalent to P minmin ( ⁇ ) and P sum ( ⁇ ) but exempt of any carrier-leakage contribution C L ( ⁇ ).
- step 806 the ASE-noise contribution N ASE ( ⁇ ) is discriminated in either P' minmin ( ⁇ ) or P' sum ( ⁇ ).
- step 808 the coefficient ⁇ is evaluated if necessary.
- step 810 the depolarized-signal S dp ( ⁇ ) and polarized-signal S p ( ⁇ ) contributions are discriminated in P' minmin ( ⁇ ) and P' sum ( ⁇ ). Having discriminated all contributions, in step 812, the noise parameter(s) to be characterized is (are) determined from at least one or a combination of the discriminated depolarized-signal S dp ( ⁇ ), polarized-signal S p ( ⁇ ) and ASE-noise N ASE ( ⁇ ) contributions.
- step 802 a polarization-sensitive spectrum analysis of the SUT is conducted as described herein above.
- Step 802 may be implemented, for example, by employing the VSOP-OSA 210 of Fig. 2 .
- P minmin ⁇ 0.5 S dp ⁇ + ⁇ S p ⁇ + 0.5 N ASE ⁇ + C L ⁇
- P sum ⁇ S ⁇ + N ASE ⁇ + C L ⁇
- step 804 the carrier-leakage contribution C L ( ⁇ ) is discriminated in P minmin ( ⁇ ).
- Step 804 may be implemented, for example, by the spectrum processor 212 of Fig. 2 .
- Step 804 is considered optional in that it may be omitted in cases where it is assumed that the carrier-leakage contribution C L ( ⁇ ) is not significant compared to the other contributions and/or where it does not need to be specifically characterized.
- step 804 may be undertaken, for example, by means of higher-order polynomial curve fitting using multiple, carefully chosen, points on the composite minima trace P minmin ( ⁇ ), as described hereinabove with reference to step 404 of the method of the first embodiment. This enables the trace underlying the carrier leakage to be estimated at the peak wavelength ⁇ 0 of C L ( ⁇ ), i.e.
- step 404 may also be similarly adapted to discriminate the carrier-leakage contribution C L ( ⁇ ) in P minmin ( ⁇ ) in presence of depolarized-signal contribution S dp ( ⁇ ).
- the ASE-noise contribution N ASE ( ⁇ ) is discriminated in either P' minmin ( ⁇ ) or P' sum ( ⁇ ) based on the differential optical spectral shape properties of the ASE-noise contribution N ASE ( ⁇ ) (which is normally substantially uniform in wavelength within the optical signal bandwidth) and the polarized-signal S p ( ⁇ ) and depolarized-signal S dp ( ⁇ ) contributions (which both follow the optical spectral shape of the signal contribution S( ⁇ )). More specifically, in the central portion (e.g., within the -3-dB BW or the -10-dB BW) of optical spectrum traces of the SUT, i.e.
- Step 806 may be implemented, for example, by the spectrum processor 212 of Fig. 2 .
- Fig. 9 illustrates step 806. It shows an example of an optical spectrum trace acquired by a FTB-5240BP OSA by EXFO Inc. having a RBW of about 3.5 GHz, on a channel of a commercial 40G/10G mixed system for which the channels are spaced by 50 GHz.
- a system configuration comprising such a channel plan is typically highly susceptible to NLE-induced signal depolarization, particularly when the 10G channels are modulated in amplitude.
- Fig. 9 illustrates the total optical spectrum trace P' sum ( ⁇ ) and the composite minima trace P minmin ( ⁇ ).
- the ASE-noise contribution N ASE ( ⁇ ) is discriminated from depolarized-signal S dp ( ⁇ ) and polarized-signal S p ( ⁇ ) contributions in either P' minmin ( ⁇ ) or P' sum ( ⁇ ) based on a technique predicated upon both the slow variation (or substantial uniformity) of the ASE-noise contribution N ASE ( ⁇ ) "under” (i.e. superposed upon) the depolarized-signal S dp ( ⁇ ) and polarized-signal S p ( ⁇ ) contributions.
- the differential optical spectrum trace ⁇ P( ⁇ ) is indicative of the optical spectrum shape of the signal contribution S( ⁇ ) (or of the polarized-signal contribution S p ( ⁇ ), which is the same).
- the so-obtained knowledge of the optical spectrum shape of the signal contribution S( ⁇ ) and of the ASE-noise contribution N ASE ( ⁇ ) allows for discrimination of the signal and ASE-noise contributions in P' sum ( ⁇ ) or P' minmin ( ⁇ ), as will now be described.
- the processing is carried out using measurements acquired at two distinct wavelengths ⁇ 1 and ⁇ 2 (generally different from ⁇ 1 and ⁇ 2 of Figs. 5 and 6 ) that lie within the optical-signal bandwidth of the SUT and are generally positioned on the same side of the peak (i.e. spectral midpoint) of the signal contribution S( ⁇ ).
- wavelengths ⁇ 1 and ⁇ 2 such that there is a substantially equal level of ASE-noise contribution N ASE ( ⁇ ) at ⁇ 1 and ⁇ 2 (i.e.
- step 808 the coefficient ⁇ of residual polarized-signal contribution S p ( ⁇ ) in P minmin ( ⁇ ) is evaluated if necessary.
- Step 806 may also be implemented, for example, by means of the spectrum processor 212 of Fig. 2 .
- the first contribution, ⁇ SOP arises from the fact that it is not required that the signal, more specifically the polarized-signal contribution S p ( ⁇ ), be substantially or completely suppressed in any of the polarization-analyzed mutually-orthogonal optical spectrum traces P // ( ⁇ ), P ⁇ ( ⁇ ).
- the second contribution, ⁇ PBS comes from the inherent extinction-ratio limitation of the polarization beam splitter employed to separate P // ( ⁇ ) and P ⁇ ( ⁇ ).
- the ⁇ parameter may be considered null assuming that the polarization scrambler / PBS combination provides a sufficiently large extinction ratio.
- step 808 may be omitted and coefficient ⁇ set to zero.
- ⁇ SOP can be estimated, for n SOP » 1, by: ⁇ SOP ⁇ 1 2 C e n SOP where C e is a factor dependent upon the polarization-scrambling efficiency.
- the parameter ⁇ SOP may also be estimated from a pre-calibration procedure for a given n SOP value if ⁇ PBS is known.
- a polarized calibration signal is input to the VSOP-OSA 210, which is generated so as to exhibit no or very low ASE noise (N ASE ( ⁇ ) ⁇ 0) and no or very minor NLEs and PMD effects such that ⁇ is close to zero or negligible compared to ⁇ SOP .
- step 810 the depolarized-signal S dp ( ⁇ ) and polarized-signal S p ( ⁇ ) contributions are discriminated in P' minmin ( ⁇ ) and P' sum ( ⁇ ).
- Step 810 may be implemented, for example, by the spectrum processor 212 of Fig. 2 .
- the coefficient ⁇ may be evaluated directly.
- the noise parameter or noise parameters to be characterized i.e. either or both an ASE-noise parameter, e.g. the ASE-only OSNR, or a non-ASE noise parameter, e.g. a degree of signal depolarization parameter, are calculated from at least one or a combination of the discriminated polarized-signal S p ( ⁇ ), depolarized-signal S dp ( ⁇ ) and ASE-noise N ASE ( ⁇ ) contributions.
- the thereby-determined noise parameter(s) are then output for use, for example, in monitoring, maintenance or troubleshooting of a DWDM optical system.
- the noise parameter(s) can be output by graphical display, by printing, by generating an electrical signal or by storage in memory for later retrieval. Other parameters may also be displayed or otherwise output in a graphical or numerical form. Step 810 may be implemented, for example, by employing the noise calculator 214 of Fig. 2 .
- any other useful ASE-noise parameters and/or non-ASE noise parameters may also be determined and subsequently output.
- the coefficient ⁇ of signal depolarization comprising both NLE-induced and PMD-related signal depolarization is determined from the aforedescribed method. However, it may be useful to discriminate the NLE-induced signal depolarization ⁇ NLE from the PMD-related signal depolarization ⁇ PMD coefficients for better characterization of NLEs on a SUT.
- Equation (47) any method known in the art for measuring or estimating ⁇ eff may be employed, e.g. the ""Jones Matrix Eigenanalysis (JME)" method.
- Another method for estimating the effective DGD effect ⁇ PPB is disclosed herein. This method is based on the SOP variation of the polarized signal as a function of optical frequency.
- R(v) a power-ratio spectrum R(v) as :
- R v P max v ⁇ P min v / P max v + P min v ⁇ 2
- P minmin v 1 ⁇ 2 ⁇ SOP v / 1 ⁇ 2 ⁇ SOP v 0 ⁇ n sop + 1 ) / n sop 1 ⁇ 2 ⁇ SOP v ⁇ 1 ⁇ 2 ⁇ SOP v
- ⁇ NL is independent of ⁇ RBW .
- two sets of polarization-sensitive spectrum analysis data are acquired as mentioned above with respective two RBWs of OSA, i.e RBW 1 and RBW 2 .
- ⁇ 1 , ⁇ 1 , P 1 , P minmin1 ( ⁇ ), P sum1 ( ⁇ ) and N ASE1 ( ⁇ ) correspond to the polarization-sensitive spectrum analysis data as obtained with RBW 1
- ⁇ 2 , ⁇ 2 , P 2 , P minmin2 ( ⁇ ), P sum2 ( ⁇ ) and N ASE2 ( ⁇ ) correspond to the polarization-sensitive spectrum analysis data as obtained with RBW 2 .
- ⁇ NL P 2 ⁇ ⁇ P 1 / 1 ⁇ ⁇
- the thereby-discriminated NLE-induced signal depolarization coefficient ⁇ NLE may then be used to characterize NLEs on the SUT.
- the PMD-related signal depolarization ⁇ PMD coefficient may also constitute a noise parameter characterizing the SUT.
- step 804 corresponding to discrimination of the carrier-leakage contribution, may be adapted to allow it to be undertaken subsequent to steps 808 and 810, these latter steps corresponding to discrimination between the ASE-noise, the depolarized-signal and the polarized-signal contributions.
- the disclosed method is not limited to live (i.e. real data-carrying) channels, but may also be used to characterize non-ASE optical noise on one or more non-data-carrying test channels (i.e. dark channels) of an optical telecommunication system.
- a test source may be used generate a probe optical signal that is propagated in the optical telecommunication channel to be characterized.
- the test source is a polarized Continuous Wave (CW) source, i.e. non-modulated, having, for instance, a spectral extent that encompasses a significant portion of the effective optical channel bandwidth.
- CW Continuous Wave
- modulated test source may be employed as well.
- the test source is inserted at the transmitter end of the optical telecommunication link. At the receiver end, or anywhere else along the optical link, the propagated probe signal will typically undergo the same impairments as a data-carrying signal, and consequently characterization of the probe signal enables characterization of the optical channel.
- the SUT corresponds to the probe signal as propagated through the optical channel under characterization.
- the probe signal (SUT) which is being characterized and which is representative of non-ASE optical noise on the optical telecommunication channel, then comprises a depolarized-signal contribution S dp ( ⁇ ), a polarized-signal contribution S p ( ⁇ ) and an ASE-noise contribution N ASE ( ⁇ ).
- S dp depolarized-signal contribution
- S p polarized-signal contribution
- N ASE ASE-noise contribution
- the steps of the method of Fig. 8 are applied on the probe signal as they would be on the SUT of the second embodiment, except for step 804 of discriminating the carrier leakage, which is omitted in the case of a CW probe signal since there is then no possible carrier leakage.
- step 804 of discriminating the carrier leakage which is omitted in the case of a CW probe signal since there is then no possible carrier leakage.
- the fact that the probe signal has a chosen known optical spectrum serves to facilitate implementation of step 806 of evaluating the ASE-noise contribution N ASE ( ⁇ ) and all other steps remain unchanged.
- the embodiments described hereinabove use polarization-sensitive spectrum analysis to discriminate non-ASE optical noise contributions from signal and ASE-noise contributions.
- the carrier-leakage contribution may also be discriminated from the other contributions without resort to polarization-sensitive spectrum analysis. For example, this may be made possible by simply employing knowledge of the spectral shape of the signal contribution.
- the discrimination between the carrier leakage contribution and the other contributions is carried out using the known or predetermined spectral shape of the signal contribution.
- an optical spectrum trace P( ⁇ ) of the SUT including the carrier-leakage contribution and all other contributions, is acquired.
- the spectral shape of the signal contribution is fitted on optical spectrum trace P( ⁇ ) The result of the fit provides an estimation of the signal contribution S(A), including both polarized-signal contribution S p ( ⁇ ) and any possible depolarized-signal contribution S dp ( ⁇ ).
- NLE-induced signal depolarization which may be characterized, for example, by the NLE-induced signal depolarization coefficient ⁇ NLE , provided that the SOP relation between each signal of the DWDM channels is arbitrary. More specifically, NLE-induced signal depolarization that is present on a DWDM optical channel may generally be considered indicative of NLE-induced signal depolarization on neighboring channels copropagating in the same optical fiber.
- NLE-induced signal depolarization on a channel-under-test is being evaluated by actually applying the method of the second embodiment, or a variant thereof, on another channel of the DWDM optical telecommunication link, the value obtained being indicative of NLE-induced signal depolarization on the channel-under-test.
- This may be of particular value in the case of a polarization-multiplexing - non-polarization-multiplexing mixed system, such as 40G-10G mixed systems, for instance, for which 40G channels are polarization-multiplexed whereas 10G channels are non-polarization multiplexed.
- the method of the second embodiment cannot be applied to the polarization-multiplexed channels.
- NLE-induced signal depolarization may be characterized on a plurality of channels of a DWDM system and the values obtained be averaged to determine a NLE-related noise parameter that applies to any channel of the DWDM systems.
Description
- This application claims priority under 35USC§119(e) of
US provisional patent application 61/444,295 filed February 18, 2011 US provisional patent application 61/471,457 filed April 4, 2011 - This application is also related to PCT patent application serial number
PCT/CA2008/000647 filed on April 4, 2008 US 12/594,503 PCT/CA2010/001285 filed on August 19, 2010 US 12/859,648 PCT/CA2011/050085 filed on February 14, 2011 - The invention relates to the determination of in-band optical noise in optical telecommunication applications. More specifically, the invention relates to the determination of non-ASE optical noise on optical telecommunication links.
- The Optical Signal-to-Noise Ratio (OSNR) is a conventional measure of the quality of a signal carried by an optical telecommunication link. Under normal and proper operating conditions, the OSNR of an optical communication link is typically high, often in excess of 15 dB or 20 dB, or even greater. The dominant component of the noise in an optical communication link is typically unpolarized Amplified Spontaneous Emission (ASE) noise, which is a spectrally broadband noise source contributed by the optical amplifiers in the link.
- Some methods exist for characterization of ASE noise on optical telecommunication signals based on an in-band analysis of the optical signal. Such methods include methods referred to as "polarization-nulling" methods (see J. H. Lee et al., "OSNR Monitoring Technique Using Polarization-Nulling Method", IEEE Photonics Technology Letters, Vol. 13, No. 1, January 2001) as well as variants thereof, and the methods referred to as "differential polarization response" methods (see International Patent Application Publication
WO 2008/122123 A1 to Gariépy et al. ; andWO 2011/020195 A1 to He et al. , both applications being commonly owned by the Applicant). - Polarization-nulling methods exploit the fact that the signal peak is generally polarized whereas ASE noise is generally unpolarized. By means of a polarization controller disposed before a linear polarizer, the combination serving as polarization analyzer, it is possible to orthogonally align the polarization axis of the analyzer to the State Of Polarization (SOP) of the signal-under-test in order to find a condition where the signal peak is maximally suppressed. An optical spectrum trace is acquired while the signal peak is suppressed and reveals the in-band ASE noise within the optical-channel bandwidth.
- Differential polarization response methods involve the polarization-sensitive detection of an optical spectrum with optical spectrum analyzer means, where two or more optical spectrum traces are acquired under different polarization analysis conditions. However, unlike polarization-nulling methods, the differential polarization response approach does not require that the polarized signal be suppressed or close to the electronic noise floor of the measurement instrument for any of the acquired optical spectrum traces. Instead, differential polarization response methods employ a mathematical discrimination of the signal peak from the in-band ASE noise in the acquired optical spectrum traces using calculations and a comparison between the acquired traces. This results in significantly less stringent requirements on both the polarization control of the signal-under-test and the quality of the Optical Spectrum Analyzer (OSA) components (e.g. polarization extinction ratio), and leads to a significantly reduced measurement time in comparison to polarization-nulling methods.
- However, in addition to ASE noise, there are other optical sources of distortion that may be present and significant on optical telecommunication signals of advanced modulation formats for next generation high-speed networks. Any such optical component which imparts impairment on optical signals and which is not ASE-related will be herein referred to as "non-ASE optical noise".
- For example, multilevel modulation is a key enabler to significantly improve the spectral efficiency of optical fiber links employing already existing optical amplifiers and fiber transmission lines. To this end, phase modulation, often combined with amplitude modulation, of an optical carrier is an attractive means to achieve such multibit-per-symbol transmission. In implementations using coherent detection, impairments arising from dispersion phenomena that are "linear" with respect to the electric field can be, in principle, completely compensated at the receiver using digital signal processing. However, coherent-detection approaches remain susceptible to optical Non-Linear Effects (NLEs), such as Cross-Phase Modulation (XPM), Self-Phase Modulation (SPM), and polarization cross-talk. In particular, XPM arising from adjacent or nearby "legacy" intensity-modulated signals (e.g. 10 Gbit/s OOK signals) may drastically impair phase-modulated coherent telecommunication signals. XPM manifests itself on propagating optical signals in the form of signal depolarization which may be confused with ASE noise in prior-art polarization-nulling and differential polarization response methods. Accordingly, it is useful to characterize and discriminate signal depolarization from ASE noise, especially on live systems, as NLE-type impairments are very system and in situ dependent.
- Moreover, advanced modulation formats for next-generation high-speed networks are typically generated with transmitters comprising a continuous-wave (CW) light source and a modulator, usually based on multiple Mach-Zehnder Interferometers (MZIs). Such MZI devices, comprising modulation sections oriented with respect to a modulation axis, are normally optimized for operation with a particular SOP of the light input thereto, and deviations in the SOP of the input light, normally CW light, will generally degrade or otherwise alter the MZI modulation properties. Incident light having a linear SOP parallel to the modulation axis of the modulator will undergo a high degree of modulation to provide the modulated (normally data-carrying) signal, whereas light having an SOP orthogonal to the modulation axis will normally undergo a much lower degree of modulation, this non-modulated portion being termed herein "carrier leakage". The non-modulated carrier leakage may introduce some extra optical noise to the system receiver. Also, the non-modulated carrier leakage and the modulated signal are both substantially polarized and have mutually-orthogonal SOPs. Therefore, it is useful to measure and discriminate the carrier leakage from the modulated signal and/or from ASE noise for advanced signal-quality characterization.
- Upon application of in-band OSNR measurement methods of the art, such as prior-art polarization-nulling methods and prior-art differential polarization response methods, non-ASE optical noise such as signal depolarization and carrier leakage may be confused with ASE noise, therefore leading to inappropriate characterization of the in-band noise superposed on the optical signal-under-test.
- Accordingly, for advanced signal-quality characterization and OSNR measurement, there is a need for a method enabling characterization of non-ASE optical noise, such as signal depolarization and carrier leakage, on optical signals and/or allowing improved characterization of ASE noise that discriminates between ASE- and non-ASE optical noise on the signal-under-test.
-
WO 03/041306 A2 - Lee J H et al: "A Review of the Polarization-Nulling Technique for Monitoring Optical-Signal-to-Noise Ratio in Dynamic WDM Networks", Journal of Lightwave Technology, IEEE Service Center, New York, NY, US, vol. 24, no. 11, 1 November 2006 (2006-11-01), pages 4162-4171, XP011150128, ISSN: 0733-8724, DOI: 10.1109/JLT.2006.883120 discloses use of polarization-nulling technique utilizing the different properties of optical signal and amplified spontaneous emission (ASE) noise for accurate monitoring of the opticalsignal-to-noise ratio (OSNR) in dynamic optical networks. The authors analyze these effects on the performance of the polarization-nulling technique.
- Daniel Gariepy et al: "Novel OSA-based method for in-band OSNR measurement", Optical Fiber Communication (OFC), Collocated National Fiber Optic Engineers Conference, 2010 Conference On (OFC/NFOEC), IEEE, Piscataway, NJ, USA, 21 March 2010 (2010-03-21), pages 1-3, XP031677268 discloses a "Hybrid Differential Spectral Response" OSNR measurement approach. The method relies partially on the polarization properties of the signal, and also on the differential spectral (i.e. resolution-bandwidth-dependent) characteristics of the signal and optical noise.
- Skold M et al: "PMD-insensitive dop-based OSNR monitoring by spectral SOP measurements", 2005 Optical Fiber Communications Conference Technical Digest (IEEE Cat. No. 05CH37672) IEEE Piscataway, NJ, USA, IEEE, vol. 4, 6 March 2005 (2005-03-06), pages 193-195, XP010831884, ISBN: 978-1-55752-783-7 discloses a degree of polarization method including spectral state of polarization measurements to characterize and separate the underestimation of OSNR due to polarization-mode dispersion.
- There is provided herein a method for determining a noise parameter characterizing an optical Signal-Under-Test (SUT) having a (polarized) signal contribution, an Amplified Spontaneous Emission (ASE) noise contribution and a non-ASE optical noise contribution, such as a carrier-leakage contribution or a depolarized-signal contribution, within an optical-signal bandwidth. The method comprises acquiring optical spectrum trace(s) of the SUT, discriminating at least the non-ASE optical noise contribution from the ASE-noise contribution using the optical spectrum trace(s) and/or a trace obtained from the optical spectrum trace(s); and determining the noise parameter using discriminated non-ASE optical noise contribution and/or the discriminated ASE-noise contribution.
- The signal depolarization and the carrier leakage, referred to herein as "non-ASE optical noises", each exhibit some specific optical properties notably in optical spectral shape and polarization, which are different from that of the polarized data-carrying signal and the ASE-noise. These qualitative differences are exploited herein to discriminate the non-ASE optical noises from the polarized data-carrying signal and the ASE-noise in acquired optical spectrum traces. More specifically, embodiments described here are based on a polarization-sensitive spectrum analysis of the SUT to be characterized. Based on this analysis, at least the specific polarization properties of the non-ASE optical noise(s) are exploited to discriminate it (them) from others. The specific optical spectrum properties of the non-ASE optical noise(s) may also be exploited to complete the discrimination.
- One aspect of the invention provides a method for determining a noise parameter characterizing an optical SUT having a signal contribution, an ASE-noise contribution and a non-ASE optical noise contribution within an optical-signal bandwidth. The method comprises: acquiring, for each of a number nSOP of varied state-of-polarization analysis conditions of the SUT, at least one polarization-analyzed optical spectrum trace; discriminating at least the non-ASE optical noise contribution from the ASE-noise contribution using the acquired polarization-analyzed optical spectrum traces and/or a trace obtained from the acquired polarization-analyzed optical spectrum traces; and determining the noise parameter characterizing the SUT using the discriminated non-ASE optical noise contribution and/or the discriminated ASE-noise contribution.
- Another aspect of the invention provides a method for determining a noise parameter characterizing an optical SUT having a signal contribution, a carrier-leakage contribution and an ASE-noise contribution within an optical-signal bandwidth. The method comprises: acquiring at least one optical spectrum trace of the SUT; discriminating at least the carrier-leakage contribution from the ASE-noise contribution using the acquired optical spectrum trace(s) and/or a trace obtained from the acquired optical spectrum trace(s); and determining the noise parameter on the SUT using the discriminated carrier-leakage contribution and/or the discriminated ASE-noise contribution.
- Yet another aspect of the invention provides a method for determining a noise parameter characterizing an optical SUT having a polarized-signal contribution, a depolarized-signal contribution and an ASE-noise contribution within an optical-signal bandwidth, the depolarized-signal contribution being at least partly imparted from a non-linear effect to be characterized. The method comprises: acquiring, for each of a number nSOP of varied state-of-polarization analysis conditions of the signal under test, at least one polarization-analyzed optical spectrum trace; discriminating at least the depolarized-signal contribution from the ASE-noise contribution using the acquired polarization-analyzed optical spectrum traces and/or a trace obtained from the acquired polarization-analyzed optical spectrum traces; and determining the noise parameter on the SUT using the discriminated depolarized-signal contribution and/or the discriminated ASE-noise contribution.
- It should be understood that the methods described herein which discriminate non-ASE optical noise from the data-carrying signal and ASE noise may be employed to characterize a non-ASE optical noise per se on the SUT, but that it may alternately be employed to provide an improved characterization of the in-band ASE-noise on the SUT compared to the prior art methods by discriminating ASE-noise from non-ASE optical noise. Accordingly, the noise parameter to be characterized may either be an ASE-noise parameter or a non-ASE noise parameter.
- It should be appreciated that the methods described herein are not limited to live (i.e. real data-carrying) channels, but that they may also be employed to characterize a dark channel, i.e. an optical telecommunication channel that is not carrying data. To this end, a probe signal may be propagated in the optical channel to be characterized by employing an optical test source at the transmitter end of the optical telecommunication link. At the receiver end or anywhere else on the optical link, the probe signal will typically undergo substantially the same ASE and non-ASE noise as if it were a data-carrying signal and characterization of the probe signal provides characterization of the optical telecommunication channel. Accordingly, in this specification, the optical signal referred to as the SUT encompasses both a data-carrying signal and a probe signal. In the case of a probe signal, characterization of the propagated probe signal, referred to as the SUT, provides a characterization of the optical telecommunication channel under test.
- In this specification, the expression "trace" is not to be construed limitatively to data that is displayed graphically, but is intended to encompass data which is not displayed graphically but nonetheless used for any suitable purpose.
- In this specification, (vacuum) wavelength, denoted λ, will often be used interchangeably with optical frequency, denoted v. The relationship between a small optical-frequency difference, for instance within a narrow (e.g. 50-GHz) DWDM channel, and the corresponding small wavelength difference is nearly linear and well known.
- In this specification, reference is made to the differential polarization response approach. It should be understood that this approach may correspond to the Passive Polarization-Induced Discrimination (PPID) approach as described in International Patent Application Publication
WO 2008/122123 A1 to Gariépy et al. (commonly owned by the Applicant) and that the two nomenclatures refer to the same technique. The technique referred to as the "differential polarization response approach" also includes variants of the PPID approach including the approach referred to as the improved differential polarization response approach in International Patent Application PublicationWO 2011/020195 A1 to He et al. (also commonly owned by the Applicant). -
-
Fig. 1 is a graph illustrating the optical spectrum of an example Signal-Under-Test (SUT) to be characterized, along with the optical spectrum of its signal contribution, its ASE-noise contribution and its carrier-leakage contribution; -
Fig. 2 is a block diagram showing the main parts of a system for determining a noise parameter or noise parameter(s) on a SUT by employing a polarization-sensitive spectrum analysis; -
Fig. 3 is a graph of an optical spectrum trace of an example SUT exhibiting a modulated signal contribution S(λ), a (non-modulated) carrier-leakage contribution CL(λ) and an ASE-noise contribution NASE(λ); -
Fig. 4 is a flowchart illustrating a method for determining a noise parameter on a SUT having signal S(λ), carrier-leakage CL(λ) and ASE-noise NASE(λ) contributions, in accordance with a first embodiment; -
Fig. 5 is a graph of an optical spectrum trace of an example SUT illustrating a step of interpolating a minimum trace Pminmin(λ) to discriminate the carrier-leakage contribution CL(λ) from the ASE-noise contribution NASE(λ), in accordance with the first embodiment and in the case where there is absence of signal depolarization; -
Fig. 6 is a graph of an optical spectrum trace of a SUT illustrating a step of interpolating a minimum trace Pminmin(λ) to discriminate the carrier-leakage contribution CL(λ) from the ASE-noise contribution NASE(λ), in accordance with the first embodiment and in the case where there is presence of signal depolarization; -
Fig. 7 is a graph of an optical spectrum trace of SUT exhibiting a modulated signal contribution S(A) with a depolarized signal contribution Sdp(λ), as well as an ASE-noise contribution NASE(λ); -
Fig. 8 is a flowchart illustrating a method for determining a noise parameter on a SUT having polarized-signal Sp(λ), depolarized-signal Sdp(λ), carrier-leakage CL(λ) and ASE-noise NASE(λ) contributions, in accordance with a second embodiment; and -
Fig. 9 is a graph of an optical spectrum trace of a SUT illustrating a step of discriminating the ASE-noise contribution in a minima trace Pminmin(λ), in accordance with the second embodiment. - It will be noted that throughout the appended drawings, like features are identified by like reference numerals.
- Now referring to
Fig. 1 , the methods and systems described herein relate to the characterization of an optical Signal-Under-Test (SUT) p which is used in optical telecommunications to transmit data over, for instance, a Dense Wavelength Division Multiplexing (DWDM) optical channel. Throughout the present description, the SUT p corresponds to one of the DWDM optical channels. In the optical-channel bandwidth of interest, the SUT p generally comprises a modulated signal contribution s arising from the data-carrying signal, and an Amplified Spontaneous Emission (ASE-) noise contribution nASE arising from ASE noise of optical amplifiers in the optical transmission system. As explained hereinbefore, the SUT p may also comprise a non-modulated carrier-leakage contribution CL which may arise from an imperfect modulation at the transmitter.Fig. 1 shows the optical spectrum p(λ) of an example SUT p, along with the optical spectrum of its signal contribution s(λ). the optical spectrum of its ASE-noise contribution nASE(λ) and the optical spectrum of its carrier-leakage contribution CL(λ), such that:


- When multiple optical signals are transmitted through an optical fiber, the State-Of-Polarization (SOP) of one signal may be influenced by the other signals. The change is caused by the optical Kerr effect, also known as "nonlinear birefringence", which has a different magnitude for parallel and perpendicular optical electric-field components. In a Dense Wavelength Division Multiplexing (DWDM) system, the XPM-induced NLE gives rise to a rapid change of SOP on each DWDM signal. Such a nonlinear polarization effect results in a time-dependent "scrambling" of the SOP on a time scale shorter than a symbol period. This leads to an apparent partial depolarization of the (data-carrying) signal contribution of the SUT, referred to herein as "NLE-induced signal depolarization".
- In addition to NLE-induced signal depolarization, Polarization Mode Dispersion (PMD) in the optical link can partially depolarize the signal contribution detected by the Optical Spectrum Analyzer (OSA). PMD is defined as the average over optical frequency of the Differential Group Delay (DGD), whose value generally varies as a function of wavelength. PMD generally leads to a variation of the SOP of the signal as a function of wavelength. Since the OSA Resolution BandWidth (RBW) is not infinitesimally small, the signal SOP can vary across this small but non-zero RBW. For instance, depending upon the SOP of the signal, a DGD of 4 ps may lead to an apparent 1% depolarization of the signal contribution as detected with an OSA having a RBW of 50 pm. Hence, in contrast with the "temporal" NLE-induced polarization scrambling, PMD may lead to an optical-frequency-dependent SOP variation which manifests itself on the SUT, depending upon the SOP of the signal, as a depolarization of the signal contribution, referred to herein as "PMD-related signai depolarization".
- Equation (1) also applies in the presence of signal depolarization, comprising either or both of NLE-induced signal depolarization and PMD-related signal depolarization. The signal contribution s(A) can be decomposed into a polarized-signal contribution sp(λ) and a depolarized-signal contribution Sdp(λ), that is:

- The depolarized-signal sdp(λ) can be expressed in turn as:

- The carrier-leakage contribution CL, the depolarized-signal contribution Sdp, the NLE-induced depolarized-signal contribution Sdp-NLE and the PMD-related depolarized-signal contribution Sdp-PMD each represent a non-ASE noise contribution.
- An optical spectrum trace of the SUT p, acquired by an OSA, represents the SUT p convolved with the filter spectral response of the OSA f(λ). The optical spectrum trace P(λ) is thus the spectrally-resolved optical power of the SUT p. Within the bandwidth corresponding to the channel bandwidth CBW, the optical spectrum trace P(λ) includes a signal contribution S(A), an ASE-noise contribution NASE(λ) and a carrier-leakage contribution CL(λ), which appear as being merged in the optical spectrum trace P(λ).


- Again, the signal contribution S(A) may be decomposed into a polarized-signal contribution Sp(λ) and a depolarized-signal contribution Sdp(λ), that is:


- The methods and systems described herein are used to discriminate the (polarized) signal contribution S(λ) from the ASE-noise contribution NASE(λ) and a non-ASE optical noise contribution CL(λ) and/or Sdp(λ) in the optical spectrum trace P(λ) in order to determine one or more noise parameters of the SUT. The instrument noise associated with the detection system itself, namely the OSA, on the acquired optical spectrum trace P(A) is considered to contribute negligibly to the observed optical noise.
-
Fig. 1 shows a single optical signal p within its corresponding optical channel, but in general other e.g. DWDM optical channels also share the optical spectrum (e.g. telecom C band), each channel carrying one optical signal (not shown). Typically, the other optical signals are present in the optical spectrum on both sides of the optical signal p. - A DWDM optical channel is specified as a spectral bandwidth over which an optical signal propagating through the link exhibits minimal loss, i.e. the channel bandwidth, allocated for the transmission of an optical signal in a WDM transmission scheme. The optical-signal bandwidth is defined as the actual width of the signal peak, i.e. the bandwidth over which the signal contribution is non negligible. The channel bandwidth may be larger than or just as large as (or even narrower than) the signal bandwidth, depending on the density of the DWDM channels, the effective bandwidth of the optical channel, and the signal transmission rate for a given transmission scheme.
- The depolarized-signal contribution Sdp(λ) exhibits a different spectral shape than that of the ASE-noise contribution NASE(λ), since Sdp(λ) follows the spectral shape of the signal contribution S(λ) whereas the ASE-noise contribution NASE(λ) is substantially uniform at least in the central area of the optical-signal bandwidth, assuming that f(λ) has a RBW that is narrower than that of the signal contribution S(λ), which is generally the case. For example, the optical-signal bandwidth (determined by the signal baud) for high-speed networks (40G, 100G or higher) generally exceeds 10 GHz (even with advanced multi-level modulation formats), and current commercial field-deployable OSAs, such as models FTB-5240BP and FTB-5240S-P manufactured and marketed by EXFO Inc., have typical RBWs respectively of approximately 4 and 8 GHz in the (C-band) wavelength region of most DWDM systems. The depolarized-signal contribution Sdp(λ) and the ASE-noise contribution NASE(λ) have similar polarization properties, that is both are depolarized.
- The carrier-leakage contribution CL(λ) also has some specific optical properties, notably both its optical spectral shape and polarization, which are different from that of the modulated signal contribution S(λ) and the ASE-noise contribution NASE(λ). The SOP of the carrier leakage CL is approximately orthogonal to the SOP of the signal contribution S. As shown in
Fig. 1 , since the carrier leakage CL is non-modulated or modulated only to a limited degree, its corresponding optical spectrum shape CL(λ) usually closely resembles the carrier spectrum, which in turn is determined by the spectral line shape of the CW laser source employed in the transmitter, rather than that of the signal S. - These qualitative differences are exploited to discriminate the (polarized) signal contribution S(A) from the ASE-noise contribution NASE(λ) and the non-ASE optical noise contribution in acquired optical spectrum traces P(A).
- A first embodiment is described in which the dominant source of non-ASE optical noise on the SUT is a carrier-leakage contribution CL. In this first embodiment, signal depolarization Sp is assumed negligible and hence is not considered. The described method of this first embodiment is used to discriminate the carrier-leakage contribution CL from the data-carrying signal contribution S and the ASE-noise contribution NASE, in order to determine either or both an ASE-noise parameter, e.g. the ASE-only OSNR, or a non-ASE noise parameter, e.g. the carrier-leakage extinction ratio.
- A second embodiment is then described in which the SUT manifests both a signal-depolarization contribution Sdp and a carrier-leakage contribution CL. Both non-ASE optical noise contributions (CL and Sdp) are then discriminated on acquired optical spectrum traces in order to determine either or both an ASE-noise parameter, e.g. the ASE-only OSNR, or a non-ASE optical noise parameter, e.g. a degree of signal depolarization parameter (i.e the complement of degree of polarization). Of course, it should be understood that the second embodiment may be simplified to the case where carrier-leakage is not present and where the only non-ASE optical noise to be evaluated is the signal depolarization.
- In a third embodiment, the method of the second embodiment is applied to the case where a probe signal is propagated in an optical telecommunication channel that is not carrying a data-carrying signal, in order to characterize non-ASE optical noise on this channel.
- Common to all three embodiments is the polarization-sensitive spectrum analysis, which exploits the differential polarization and spectral properties of the signal contribution S, the ASE-noise contribution and the non-ASE optical-noise contribution in order to discriminate between these. This common approach is then applied to each of the three embodiments used herein for performing the polarization-sensitive spectrum analysis. It should be appreciated that the polarization-sensitive spectrum analysis method described herein is only one example of a possible method and that multiple variants of this method exist such as, for example, methods described in International Patent Application Publication
WO 2008/122123 A1 to Gariépy et al. andWO 2011/020195 A1 to He et al. , both applications being commonly owned by the Applicant. -
Fig. 2 illustrates the main components of asystem 200 suitable for conducting the methods as described hereinafter, including the polarization-sensitive spectrum analysis. Thesystem 200 receives a SUT p and comprises a Varied-SOP polarization-sensitive Optical Spectral Analyzer (VSOP-OSA) 210, aspectrum processor 212 and anoise calculator 214. The VSOP-OSA 210 comprises a polarization controller, in this case apolarization scrambler 216, placed before a polarization-diversity OSA 218 (see, for example, the polarization-diversity OSA described in commonly-ownedU.S. Patent No. 6,636,306 and commercially available as the EXFO FTB-5240 series of optical spectrum analyzers) comprising a combination of a polarization beam splitter (PBS) 220 and a dual channel Optical Spectrum Analyzer (OSA) 222. It should be appreciated that the optical spectrum analysis means is not limited to a polarization-diversity OSA but could encompass other polarization-sensitive spectrum analysis means providing polarimetric information on the SUT for example. For instance, in one embodiment, thepolarization beam splitter 220 is replaced by a linear polarizer, such that only one polarization-analyzed sample p// is acquired for each condition of thepolarization scrambler 216. Thepolarization beam splitter 220 is used to obtain two orthogonally-analyzed samples p⊥ and p// of the input optical signal p. Thepolarization scrambler 216 is typically controlled by a control unit (not shown) which causes the SOP analysis conditions to be varied among acquisitions of pairs of samples p⊥ and p//. - The
OSA 222 simultaneously acquires two polarization-analyzed optical spectrum traces (P⊥(λ) and P//(λ)) respectively corresponding to samples p⊥ and p//. The case where the OSNR is null on one of the acquired traces, i.e. the signal is completely suppressed, is a special case but it should be emphasized that the methods described hereinafter do not require such a condition. - The
spectrum processor 212 receives the two traces P⊥(λ), P//(λ) and discriminates the signal contribution s, the ASE-noise contribution nASE and a non-ASE optical noise contribution (carrier-leakage contribution CL and/or depolarized-signal contribution sdp). Thenoise calculator 214 evaluates an in-band noise parameter from the discriminated contributions. The ASE-only OSNR for example or any non-ASE optical noise parameter can then be calculated using the discriminated contributions. - It should be appreciated that the system illustrated in
Fig. 2 is given as an illustrative example only of a suitable system for applying the methods described herein and that components or combination of components described may be replaced by any other components or combination of components which performs the functions required for their application. - Employing the VSOP-
OSA 210 ofFig. 2 , a plurality of pairs of mutually-orthogonal polarization-analyzed optical spectrum traces P//(λ), P⊥(λ) of the SUT p are acquired such that:


- Now, in order to perform a polarization-sensitive spectrum analysis of the SUT, a plurality of polarization-analyzed optical spectrum traces of the SUT should be acquired by varying the SOP analysis conditions of the VSOP-
OSA 210. In accordance with thesystem 200 ofFig. 2 , this is performed by generating, by means of thepolarization scrambler 216, a number nSOP of different SOPs from the SOP of the SUT incident thereon. These different SOPs are then input into the polarization-diversity OSA 218 to provide a pair of mutually-orthogonal polarization-analyzed optical spectrum traces P//(λ) and P⊥(λ), whose spectral width encompasses at least the DWDM channel-under-test. - In order to perform polarization analysis of the SUT, an extrema trace, for example a maxima ratio trace rmax(λ) or a minima ratio trace rmin(λ) corresponding to the nSOP pairs of mutually-orthogonal polarization-analyzed optical spectrum traces P//(λ) and P⊥(λ) is calculated. In this embodiment, for each pair of said mutually-orthogonal polarization-analyzed optical spectrum traces P//(λ) and P⊥(λ), a ratio trace r(λ) is obtained by dividing traces P//(λ) and P⊥(λ) (r(λ) = P//(λ)/P⊥(λ)). An extrema trace rmin(λ) or rmax(λ) corresponding to the nSOP acquisitions is then obtained by evaluating the minimum value Rmin(λ) or the maximum value Rmax(λ) for each of wavelengths λ among the ratio traces r(λ) as follows:


- If little or no PMD is present along the signal path, one may consider another embodiment which is easier to understand in terms of the significance of the extrema trace r'min(λ) or r'max(λ). In this embodiment, the extrema trace r'min(λ) or r'max(λ) is obtained by identifying the one of the ratio traces among the acquired nSOP pairs of optical spectra for which the signal peaks exhibits, respectively, a minimum or maximum. The extrema trace r'min(λ) then corresponds to the pair of mutually-orthogonal optical spectrum traces P//(λ), P⊥(λ) for which the SOP analysis condition (e.g. the axis of the analyzer defined by the polarization-controller / linear-polarizer combination) is the more closely aligned with the SOP of the signal, and thereby to the optical spectrum trace (say P//(λ)) for which the signal contribution is most suppressed. In this case, this polarization-sensitive spectrum analysis may be compared to the polarization-nulling approach where the SOP is scrambled until the signal is completely suppressed. It should be emphasized, however, that the methods described herein are more general compared to the polarization-nulling approach, in that it is not required that the signal be substantially or completely suppressed in any of the polarization-analyzed mutually-orthogonal optical spectrum traces P//(λ), P⊥(λ). The non-perfect alignment of the SOP of the signal in the extrema trace rmin(λ) or rmax(λ) is compensated by the parameter ε as described hereinbelow.
- Herein, the extrema trace rmin(λ) or rmax(λ) is rather evaluated wavelength-by-wavelength in order to construct a composite extrema trace. Such construction of a composite extrema trace permits significant compensation for certain effects usually associated with signal impairments, notably PMD, which may otherwise lead to a wavelength-dependent error on the discriminated contributions.
- Furthermore, one can undertake a "min-selecting" operation on the minimum ratio traces rmin(λ) and the point-by-point multiplicative inverse of the maximum ratio trace rmax(λ) as a function of wavelength to obtain a combined composite extrema ratio trace, viz:

- Any variation in the overall optical power in the channel from one acquired extrema-ratio trace to another may be compensated in data analysis by normalization using the corresponding total optical spectrum trace Psum(λ). In this way, one synthesizes (or "constructs") a min-selecting composite extrema optical spectral trace Pminmin(λ), referred to herein as a "constructed composite extrema trace", as :

- It should be appreciated that although the last two steps, corresponding to Equations (9) and (10), are useful especially for compensating variations of optical power from one acquisition to another, they are optional and, in other embodiments of polarization-sensitive spectrum analysis, one or the other may be omitted without departing from the general concept described herein.
- The thereby-obtained extrema trace, which in this embodiment is the composite extrema optical spectral trace Pminmin(λ), corresponds to an optical spectrum trace where the proportion of polarized-signal contribution Sp(λ) is minimized. Of course, as previously mentioned, the herein-described polarization-sensitive spectrum analysis method does not require the signal to be suppressed in any of the acquired polarization-analyzed optical spectrum traces, and hence a portion of polarized-signal contribution will generally remain, such that:


- The coefficient ε is generally composed of two contributions, i.e. εSOP and εPBS, where ε = εSOP + εPBS. The first contribution, εSOP, arises from the fact that it is not required that the signal, more specifically the polarized-signal contribution Sp(λ), be substantially or completely suppressed in any of the polarization-analyzed mutually-orthogonal optical spectrum traces P//(λ), P⊥(λ). The second contribution, εPBS, comes from the inherent extinction-ratio limitation of the polarization beam splitter (for instance 220) employed to separate P//(λ) and P⊥(λ). It will be appreciated that in some cases, this latter contribution may be sufficiently small to be assumed null.
- The non-perfect orthogonal alignment of the SOP of the polarized-signal contribution Sp(λ) in the extrema trace rmin(λ) is compensated by the coefficient ε. In the same way, the SOP of the carrier-leakage contribution CL(λ), which is orthogonal to that of the polarized-signal contribution Sp(λ), may not be perfectly aligned in the extrema trace rmin(λ), resulting in the factor (1-ε) in Equations (11a) and (11b). When the number of SOP analysis conditions nSOP is at least about 50 (which yields ε < 0.01), this latter non-perfect alignment is usually considered to not have a significant practical effect on the polarization-sensitive spectrum analysis and the characterization of non-ASE optical noise contributions. Consequently, the factor (1-ε) may be neglected in the following. Of course, in cases where this aforedescribed non-perfect alignment cannot be considered negligible, it remains possible to take it into account.
- It should be noted that the aforedescribed prior-art polarization-nulling approach represents a special case of the polarization-sensitive spectrum analysis described herein, for which the ε parameter may be considered null. Such a condition may arise if the number of SOP analysis conditions nSOP is very high, so that, on at least one of the acquired optical spectrum trace, the SOP of the SUT, as generated by the
polarization scrambler 216, is substantially aligned with thepolarization beam splitter 220. However, the method described herein is more general and is also applicable to a reduced number of SOP analysis conditions nSOP for which the parameter ε cannot be assumed null or negligibly small. - The depolarized-signal contribution Sdp(λ) is also depolarized, and hence half of this contribution appears in optical spectral trace Pminmin(λ).
- Here, for simplicity, the ASE-noise contribution NASE(λ) is assumed to be substantially depolarized, resulting in also half of the ASE-noise contribution NASE(λ) to show in optical spectral trace Pminmin(λ). However, it should be noted that a possible slight polarization of the ASE noise, resulting in a DOP of 10% for example, would not have significant impact on the characterization of ASE and non-ASE optical noise contributions for practical OSNR values.
- A first embodiment is described with reference to
Fig. 3 which shows an example of an optical spectrum trace Psum(λ) of a channel of a commercial 40G system, as acquired by a FTB-5240BP OSA by EXFO Inc. having a RBW of about 3.5 GHz, where the dominant source of non-ASE optical noise on the SUT is a carrier-leakage contribution CL. Illustrated inFig. 3 are the total optical spectrum trace Psum(λ), its data-carrying signal contribution S(A) and combined carrier-leakage and ASE-noise contributions CL(λ) + NASE(λ). - In this first embodiment, non-ASE noise is assumed to only include carrier leakage. Signal depolarization Sdp is assumed negligible and is hence not considered. The method of this first embodiment is used to discriminate the carrier-leakage contribution CL from the data-carrying signal contribution S and the ASE-noise contribution NASE in order to determine either or both of an ASE-noise parameter, e.g. the ASE-only OSNR, or a non-ASE noise parameter, e.g. the carrier-leakage extinction ratio.
- From
Fig. 3 , it can be observed that: - A) The spectral shape of the signal contribution S(A) on acquired optical spectrum trace Psum(λ) is dominated by the optical spectrum of the modulated signal, a consequence of the signal bandwidth being much wider than the RBW of the OSA (40 GHz versus about 3.5 GHz);
- B) The spectral shape of the carrier-leakage contribution CL(λ) on acquired optical spectrum trace Psum(λ) follows that of the filter function f(A) of the OSA (with a RBW of about 3.5GHz), a consequence of the carrier-like, i.e. Dirac-delta-function-like optical spectrum of the carrier-leakage contribution CL(λ), which is much narrower than the RBW of the OSA (about 3.5 GHz); and
- C) The spectral shape of the ASE-noise contribution NASE(λ) is significantly different from both that of the signal S(A) and the carrier-leakage CL(λ) contribution. The spectral shape of the ASE-noise contribution NASE(λ) may be considered to be substantially uniform over the channel bandwidth, i.e. in-band.
- In addition to the spectral-shape differences, the respective SOPs and degrees of polarization of the signal S(λ), the carrier-leakage CL(λ) and ASE-noise NASE(λ) contributions are in general different, that is:
- A) The signal S(A) and the carrier-leakage CL(λ) contributions are significantly polarized, but with mutually orthogonal SOPs; and
- B) The ASE-noise contribution NASE(λ) is substantially depolarized.
-
Fig. 4 shows themethod 400 of the first embodiment for determining a noise parameter on a SUT having signal S(A), ASE-noise NASE(λ) and carrier-leakage CL(λ) contributions. In accordance with this method, the carrier-leakage contribution CL(λ) may be discriminated from the signal S(A) and ASE-noise NASE(λ) contributions by means of differential properties of spectral shape and polarization. Instep 402, a polarization-sensitive spectrum analysis of the SUT is conducted. Instep 404, the carrier-leakage contribution CL(λ) is discriminated in Pminmin(λ). Instep 406, the signal S(A) and ASE-noise NASE(λ) contributions are also discriminated in Pminmin(λ) and Psum(λ). Having discriminated all contributions, instep 408, the noise parameter(s) to be characterized are determined from at least one or a combination of the discriminated signal S(A), ASE-noise NASE(λ) and carrier-leakage CL(λ) contributions. These steps are now described in more detail. - In
step 402, a polarization-sensitive spectrum analysis of the SUT is conducted as described hereinabove. Step 402 may be implemented, for example, by employing the VSOP-OSA 210 ofFig. 2 . As a result of the polarization-sensitive spectrum analysis, assuming no signal depolarization (ξ = 0), we have:

- In
step 404, the carrier-leakage contribution CL(λ) is discriminated in Pminmin(λ). Step 404 may be implemented, for example, by thespectrum processor 212 ofFig. 2 . -
Fig. 5 illustratesstep 404 in the case where the number nSOP is very large (nSOP → ∞) and the effect of the polarization beam splitter extinction ratio is assumed negligible (εPBS → 0). The coefficient ε of residual S(λ) in Pminmin(λ) then approaches zero (ε → 0), i.e. ε S (A) is assumed negligible compared to 0.5 NASE(λ). As shown inFig. 5 , in this case, the ASE-noise contribution NASE(λ0) may be estimated, at the peak wavelength λ0 of CL(λ), by a linear interpolation on minima trace Pminmin(λ), between "shoulder points" at wavelengths λ1 and λ2 selected, as explained hereafter, on each side of the carrier-leakage peak. This technique is herein referred to as "shoulder interpolation". The peak power of the power spectrum trace of the carrier leakage CL(λ) may then be estimated by:
- As mentioned before, as the actual carrier-leakage contribution CL(λ) is approximately a Dirac-delta function, and is hence much narrower than the OSA filter function f(A), the total power of the carrier-leakage contribution may be determined from CL(λ0), that is the peak power of the power spectrum trace of the carrier leakage CL(λ). The spectrum trace of the carrier leakage CL(λ) is then obtained by:


- The carrier-leakage contribution can be then estimated with good accuracy by judicious choice of the shoulder-point wavelengths λ1 and λ2 where CL(λ) contributes negligibly to Pminmin(λ). This is normally readily achievable since CL(λ) is typically much narrower than the DWDM channel bandwidth. For example, in the specific case of
Fig. 5 , the shoulder points are selected such that Δλ = λ2 - λ1 = 0.2 nm, which corresponds to about 25 GHz at wavelengths around 1550 nm. Of course, the technique used to select the shoulder points may vary. For example, in another case, Δλ could be chosen in an adaptive way as the - X-dB bandwidth (e.g. the -20-dB bandwidth with respect to the peak transmission) of the filter function f(A) corresponding to the OSA that is being used in the acquisition. - In
step 406, the signal S(A) and ASE-noise NASE(λ) contributions are discriminated in Pminmin(λ) and Psum(λ). Step 404 may also implemented, for example, by thespectrum processor 212 ofFig. 2 . - In the case of
Fig. 5 where residual S(A) in Pminmin(λ) is assumed negligible compared to the ASE-noise NASE(λ) (ε λ 0), the ASE-noise contribution NASE(λ) may be determined, for example, by removing the carrier-leakage contribution CL(λ) from the minima Pminmin(λ) and the total Psum(λ) traces. Accordingly, defining :


-
Fig. 6 illustratesstep 404 in the case where the coefficient ε cannot be neglected (ε ≠ 0).Fig. 6 shows an example of an optical spectrum trace acquired on a channel of a commercial 40G/10G mixed system for which the channel spacing is 50-GHz, as acquired by a FTB-5240BP OSA by EXFO Inc. having a RBW of about 3.5 GHz, for which there is significant residual signal contribution ε S(A) in Pminmin(λ) as well as some carrier-leakage contribution CL.Fig. 6 illustrates the total optical spectrum trace Psum(λ) and the minima trace Pminmin(λ). - In this case, the presence of residual signal contribution in Pminmin(λ) renders it more difficult, although not impossible, to employ linear shoulder interpolation to discriminate the carrier-leakage contribution CL(λ) from ε S(λ) + 0.5 NASE(λ) in Pminmin(λ). This difficulty arises from the presence of the non-flat residual signal contribution ε S(λ), which makes the method more sensitive to a proper choice of shoulder-point wavelengths λ1 and λ2. More sophisticated or advanced interpolation or curve-fitting approaches may then be employed to improve the accuracy.
- Accordingly, the carrier-leakage contribution CL(λ) may be discriminated from [ ε S(λ) + 0.5 NASE(λ) ] by means of higher-order polynomial curve fitting using multiple, carefully chosen points comprising the composite minima trace Pminmin(λ). Once [ ε S(λ0) + 0.5 NASE(λ0) ] is determined, CL(λ0) may be found as:


- Of course, other interpolation methods may be used as well for discriminating the carrier-leakage CL(λ). For example, the trace Psum(λ) may be used to estimate the shape of [ ε S(λ) + 0.5 NASE(λ) ]. In this case, the shape of Psum(λ) is fitted over Pminmin(λ) so as to interpolate [ ε S(λ) + 0.5 NASE(λ) ] in the spectral region where CL is non-negligible. CL(λ) is then found using Equations (17a) and (17b).
- As another example, CL(λ) may also be found or discriminated from [ ε S(λ) + 0.5 NASE(λ) ] in Pminmin(λ) based on a technique predicated upon both the slow variation (or substantial uniformity) of [ ε S(λ) + 0.5 NASE(λ) ] under CL(λ), as illustrated in
Fig. 6 , and the fact that CL(λ) has the same measured spectral shape as the filter function f(λ) of the OSA, which is typically known or easily determined using a pre-calibration procedure or modeling. Referring toFig. 6 , the processing uses measurements made at two distinct wavelengths λ0 and λ1 (generally different from peak wavelength λ0 and shoulder-point wavelength λ1 ofFig. 5 ) that lie within the optical-signal bandwidth of the SUT and are generally positioned on the same side of the peak of the carrier-leakage contribution. By assuming a substantially uniform distribution of [ ε S(λ) + 0.5 NASE(λ) ] under the carrier-leakage peak and therefore a substantially equal level of [ ε S(λ) + 0.5 NASE(λ) ] at λ0 and λ1 (i.e. Δ = [ ε S(λ0) + 0.5 NASE(λ0) ] - [ ε S(λ1) + 0.5 NASE(λ1) ] → 0) on the trace Pminmin(λ), we find:


- For cases where Δ ≠ 0, the relative deviation on CL(λ0) may be estimated by:

- For example, in the case illustrated in
Fig. 6 , δCL is estimated to be less than 0.1 dB. - Having discriminated the carrier-leakage contribution CL(λ) in the case of
Fig. 6 , the signal S(λ) and ASE-noise NASE(λ) contributions should also be discriminated in accordance withstep 406. To this end, the discriminated carrier-leakage contribution CL(λ) is first removed from both the minima Pminmin(λ) and the total Psum(λ) traces, i.e. :

- Methods known as differential polarization response methods and more specifically the methods described in International Patent Application Publication
WO 2011/020195 A1 to He et al. (commonly owned by the Applicant) may then be applied to P'minmin(λ) and P'sum(λ) to discriminate the signal S(A) from the ASE-noise NASE(λ) contribution. For example :


- Having discriminated all contributions, in
step 408, the noise parameter(s) to be characterized, i.e. either or both an ASE-noise parameter, e.g. the ASE-only OSNR, or a non-ASE noise parameter, e.g. the carrier-leakage extinction ratio, is (are) calculated from at least one or a combination of the discriminated signal S(λ), ASE-noise NASE(λ) and carrier-leakage CL(λ) contributions. The thereby-determined noise parameter(s) are output for use, for example, in monitoring, maintenance or troubleshooting of a DWDM optical system. For example, the noise parameter(s) may be output by graphical display, by printing, by generating an electrical signal or by storage into memory for later retrieval. Other parameters may also be displayed or otherwise output in a graphical or numerical form. Step 408 may be implemented, for example, by employing thenoise calculator 214 ofFig. 2 . - An example of a noise parameter that can be determined and subsequently output is the ASE-only OSNR, as defined over a 0.1-nm resolution bandwidth:


- Of course, any other useful ASE-noise parameters and/or non-ASE noise parameters may also be determined and subsequently output.
- It should be appreciated that the algorithm described herein for discriminating the ASE-noise contribution and the carrier-leakage contribution from the modulated signal contribution in the measured optical spectrum traces is only one example of a suitable algorithm. Other suitable algorithms may be employed for that purpose. For example, algorithms described in International Patent Application Publication
WO 2011/097734 A1 to Gariépy et al. (commonly owned by applicant), may be adapted for discriminating the noise contribution from the carrier-leakage contribution in Pminmin(λ) by employing f(A) in lieu of the reference trace. - In the embodiments described herein, the carrier leakage is obtained through an analysis performed on a minima trace of nSOP pairs of traces obtained with varied SOP analysis conditions of the SUT. It is however noted that, instead of using the minima trace, the carrier leakage may be obtained through the analysis of a maxima trace, which would be generally combined with the total-power optical spectrum trace of the SUT (Psum(λ)).
- In the embodiments described hereinabove, the carrier-leakage contribution is evaluated based on a combination of polarization and spectral analysis of the SUT. It is noted that such a polarization analysis would not adequately discriminate the carrier-leakage contribution from the other contributions in the case of polarization-multiplexed signals. Accordingly, in another embodiment, the carrier-leakage contribution is evaluated using only spectral analysis, i.e. based on the different spectral-shape properties between the signal contribution, the carrier-leakage contribution and the ASE-noise contribution. The carrier-leakage contribution is then evaluated without employing a polarization-based analysis. Such an approach becomes practicable especially when the carrier-leakage contribution is sufficiently significant to be readily detectable on any optical spectrum trace Psum(λ) of the SUT.
- The presence of carrier leakage is detectable on the total power optical spectrum trace Psum(λ) of the SUT as a deformation of the optical signal at the carrier peak wavelength. Because the carrier-leakage contribution has a very narrow bandwidth and thus varies rapidly compared to the signal contribution and the ASE-noise contribution, the carrier-leakage contribution may be discriminated from the other contributions by applying to Psum(λ) one of the techniques described hereinabove as being applied to Pminmin(λ) with reference to
Fig. 6 . - For example, in one embodiment, Equations (18a) to (20) may be modified as follows for cases where [S(A) + NASE(λ)] varies slowly (or is almost uniform) under CL(λ) and where CL(λ) has substantially the same measured spectral shape as the filter function f(A) of the OSA, which is known or easily determined using a pre-calibration procedure or modeling. Accordingly, when Δ = [ S(λ0) + NASE(λ0)] - [ S(λ1) + NASE(λ1)] → 0, we have:


- CL(λ0)) can be obtained from:


- A second embodiment is now described with reference to
Fig. 7 , which depicts an example of an optical spectrum trace Psum(λ) encompassing a few channels of a commercial 80-channel 10G/40G mixed system, as acquired by a FTB-5240BP OSA by EXFO Inc. having a RBW of about 3.5 GHz. The dominant source of non-ASE optical noise on this SUT is a depolarized-signal contribution Sdp, although a carrier-leakage contribution CL may also be present.Fig. 7 illustrates the total optical spectrum trace Psum(λ) and its depolarized part, i.e. Sdp(λ) + NASE(λ). - The described method of this second embodiment is used to discriminate both non-ASE optical noise contributions (CL and Sdp) on acquired optical spectrum traces in order to determine either or both of an ASE-noise parameter, e.g. the ASE-only OSNR, or a non-ASE optical noise parameter, e.g. a degree of signal depolarization parameter. Of course, it will be understood that the second embodiment may be simplified to the case where carrier-leakage is not present and where the only non-ASE optical noise to be evaluated is the signal depolarization.
- The optical spectrum shape and the SOP of the SUT are influenced by depolarization induced by either or both of NLEs or PMD. As explained hereinabove, depolarized-signal Sdp, polarized signal Sp, ASE-noise NASE and carrier-leakage CL contributions have different spectral-shape and polarization properties that may be exploited to mutually discriminate them in acquired optical spectrum traces. To this end, the method of the second embodiment employs polarization-sensitive spectrum analysis such as described hereinabove.
-
Fig. 8 shows themethod 800 of the second embodiment for determining a noise parameter on a SUT having depolarized-signal Sdp(λ), polarized-signal Sp(λ), ASE-noise NASE(λ) and carrier-leakage CL(λ) contributions. In accordance with this method, the carrier-leakage CL(λ) and depolarized-signal Sdp(λ) contributions may be discriminated from the polarized-signal S(A) and ASE-noise NASE(λ) contributions by means of differential properties of spectral shape and polarization. Instep 802, a polarization-sensitive spectrum analysis of the SUT is conducted. Instep 804, the carrier-leakage contribution CL(λ) is discriminated in Pminmin(λ) and subtracted from Pminmin(λ) and Psum(λ) to yield P'minmin(λ) and P'sum(λ), the latter being equivalent to Pminmin(λ) and Psum(λ) but exempt of any carrier-leakage contribution CL(λ). Instep 806, the ASE-noise contribution NASE(λ) is discriminated in either P'minmin(λ) or P'sum(λ). Instep 808, the coefficient ε is evaluated if necessary. Instep 810, the depolarized-signal Sdp(λ) and polarized-signal Sp(λ) contributions are discriminated in P'minmin(λ) and P'sum(λ). Having discriminated all contributions, instep 812, the noise parameter(s) to be characterized is (are) determined from at least one or a combination of the discriminated depolarized-signal Sdp(λ), polarized-signal Sp(λ) and ASE-noise NASE(λ) contributions. These steps are now described in more detail. - In
step 802, a polarization-sensitive spectrum analysis of the SUT is conducted as described herein above. Step 802 may be implemented, for example, by employing the VSOP-OSA 210 ofFig. 2 . As a result of the polarization-sensitive spectrum analysis, we have:

- In
step 804, the carrier-leakage contribution CL(λ) is discriminated in Pminmin(λ). Step 804 may be implemented, for example, by thespectrum processor 212 ofFig. 2 . Step 804 is considered optional in that it may be omitted in cases where it is assumed that the carrier-leakage contribution CL(λ) is not significant compared to the other contributions and/or where it does not need to be specifically characterized. - In cases where the carrier-leakage contribution CL(λ) is to be discriminated,
step 804 may be undertaken, for example, by means of higher-order polynomial curve fitting using multiple, carefully chosen, points on the composite minima trace Pminmin(λ), as described hereinabove with reference to step 404 of the method of the first embodiment. This enables the trace underlying the carrier leakage to be estimated at the peak wavelength λ0 of CL(λ), i.e. P'minmin(λ0) = [ 0.5 Sdp(λ0) + ε Sp(λ0) + 0.5 NASE(λ0) ], and once [ 0.5 Sdp(λ0) + ε Sp(λ0) + 0.5 NASE(λ0) ] is determined, CL(λ0) may be found as:

- Of course, the other example implementations of
step 404 described hereinabove may also be similarly adapted to discriminate the carrier-leakage contribution CL(λ) in Pminmin(λ) in presence of depolarized-signal contribution Sdp(λ). - Having now discriminated the carrier-leakage contribution CL(λ), this contribution is subtracted from Pminmin(λ) and Psum(λ) to yield P'minmin(λ) and P'sum(λ) which are respectively equivalent to Pminmin(λ) and Psum(λ) but free of carrier-leakage contribution CL(λ) :


- The following steps are thus performed on P'minmin(λ) and P'sum(λ).
- In
step 806, the ASE-noise contribution NASE(λ) is discriminated in either P'minmin(λ) or P'sum(λ) based on the differential optical spectral shape properties of the ASE-noise contribution NASE(λ) (which is normally substantially uniform in wavelength within the optical signal bandwidth) and the polarized-signal Sp(λ) and depolarized-signal Sdp(λ) contributions (which both follow the optical spectral shape of the signal contribution S(λ)). More specifically, in the central portion (e.g., within the -3-dB BW or the -10-dB BW) of optical spectrum traces of the SUT, i.e. P'minmin(λ) or P'sum(λ), the optical spectral shape of the polarized-signal Sp(λ) and depolarized-signal Sdp(λ) contributions varies with a much greater wavelength dependence than that of the ASE noise contribution NASE(λ). Step 806 may be implemented, for example, by thespectrum processor 212 ofFig. 2 . -
Fig. 9 illustratesstep 806. It shows an example of an optical spectrum trace acquired by a FTB-5240BP OSA by EXFO Inc. having a RBW of about 3.5 GHz, on a channel of a commercial 40G/10G mixed system for which the channels are spaced by 50 GHz. A system configuration comprising such a channel plan is typically highly susceptible to NLE-induced signal depolarization, particularly when the 10G channels are modulated in amplitude.Fig. 9 illustrates the total optical spectrum trace P'sum(λ) and the composite minima trace Pminmin(λ). - The ASE-noise contribution NASE(λ) is discriminated from depolarized-signal Sdp(λ) and polarized-signal Sp(λ) contributions in either P'minmin(λ) or P'sum(λ) based on a technique predicated upon both the slow variation (or substantial uniformity) of the ASE-noise contribution NASE(λ) "under" (i.e. superposed upon) the depolarized-signal Sdp(λ) and polarized-signal Sp(λ) contributions.
- From Equations (22a) and (22b), a differential optical spectrum trace ΔP(λ) is defined as :

- Accordingly, the differential optical spectrum trace ΔP(λ) is indicative of the optical spectrum shape of the signal contribution S(λ) (or of the polarized-signal contribution Sp(λ), which is the same). The so-obtained knowledge of the optical spectrum shape of the signal contribution S(λ) and of the ASE-noise contribution NASE(λ) allows for discrimination of the signal and ASE-noise contributions in P'sum(λ) or P'minmin(λ), as will now be described.
- Referring to
Fig. 9 , the processing is carried out using measurements acquired at two distinct wavelengths λ1 and λ2 (generally different from λ1 and λ2 ofFigs. 5 and6 ) that lie within the optical-signal bandwidth of the SUT and are generally positioned on the same side of the peak (i.e. spectral midpoint) of the signal contribution S(λ). By properly selecting wavelengths λ1 and λ2 such that there is a substantially equal level of ASE-noise contribution NASE(λ) at λ1 and λ2 (i.e. Δ = NASE(λ1) - NASE(λ2) → 0) and a different level of signal contribution in P'sum(λ) at λ1 and λ2 (i.e. P'sum(λ1) ≠ P'sum(λ2), for example P'sum(λ2)/P'sum(λ1) = 0.5, as illustrated inFig. 9 ), we find:

- Now, based on Equation (33), NASE(λ) can be determined from:


- It should be noted that the algorithm described herein for discriminating the noise contribution from the signal contribution in the measured optical spectrum traces is only one example of such an algorithm. Other suitable algorithms may be employed for that purpose. For example, algorithms described in International Patent Application Publication
WO 2011/097734 A1 to Gariépy et al. (commonly owned by applicant), may be adapted for this discrimination by employing ΔP(λ) in lieu of the reference trace. - In
step 808, the coefficient ε of residual polarized-signal contribution Sp(λ) in Pminmin(λ) is evaluated if necessary. Step 806 may also be implemented, for example, by means of thespectrum processor 212 ofFig. 2 . - As mentioned hereinabove, the coefficient ε is generally comprised of two contributions, i.e. εSOP and εPBS, where ε = εSOP + εPBS. The first contribution, εSOP, arises from the fact that it is not required that the signal, more specifically the polarized-signal contribution Sp(λ), be substantially or completely suppressed in any of the polarization-analyzed mutually-orthogonal optical spectrum traces P//(λ), P⊥(λ). More specifically, εSOP is a function of the residual angle δ, in the Jones-vector domain, between the SOP of the polarized signal contribution Sp(λ) and the polarization axis of the
polarization beam splitter 220, such that εSOP = sin2 δ. The second contribution, εPBS, comes from the inherent extinction-ratio limitation of the polarization beam splitter employed to separate P//(λ) and P⊥(λ). - As mentioned hereinabove, in the aforedescribed prior-art polarization-nulling approach which represents a special case of the polarization-sensitive spectrum analysis described herein, the ε parameter may be considered null assuming that the polarization scrambler / PBS combination provides a sufficiently large extinction ratio. In such a case, step 808 may be omitted and coefficient ε set to zero.
- As described in International Patent Application Publication
WO 2011/020195 A1 to He et al. (commonly owned by applicant), the parameter εSOP can be estimated as a function of a sufficiently large number nSOP , wherein the distribution of these SOPs is assumed to be approximately known, by employing an ab initio statistical approach, from a probability density function on εSOP. It is noted that the parameter εSOP used herein is related to the κ in International Patent Application PublicationWO 2011/020195 A1 , by the relation εSOP = (1-κ). - When the SOPs are independently and uniformly distributed on the Poincare sphere, the expectation value µ of the calculated probability distribution function yields the following ab initio estimated εSOP, as a function of the number nSOP:

- In a more general case where the SOPs provide good coverage of the Poincare sphere but are not highly uniformly distributed thereon, εSOP can be estimated, for nSOP » 1, by:

- The parameter εPBS may be determined by a pre-calibration procedure of the system used for conducting the polarization-sensitive spectrum analysis (VSOP-
OSA 210 ofFig. 2 for instance). To this end, a polarized calibration signal is input to the VSOP-OSA 210, which is easily generated so as to exhibit negligible ASE noise (NASE(λ) ≈ 0) and negligible NLEs and PMD effects such that ξ is close to zero. Then, by applying a sufficiently large number of SOP analysis conditions nSOP (→ ∞), εSOP becomes negligible, and:
- Similarly, the parameter εSOP may also be estimated from a pre-calibration procedure for a given nSOP value if εPBS is known. Again, a polarized calibration signal is input to the VSOP-
OSA 210, which is generated so as to exhibit no or very low ASE noise (NASE(λ) ≈ 0) and no or very minor NLEs and PMD effects such that ξ is close to zero or negligible compared to εSOP. The calibration source should be substantially polarized, i.e. have a degree of depolarization that is close to 0, or at least, much smaller than εSOP as estimated in Equation (37) for the given nSOP. Acquisition is then conducted for number nSOP of SOP analysis conditions. Then, for the given nSOP, εSOP may be evaluated as :
- Similarly, ε = εSOP + εPBS may be evaluated as a whole by applying the same pre-calibration procedure and :

- In
step 810, the depolarized-signal Sdp(λ) and polarized-signal Sp(λ) contributions are discriminated in P'minmin(λ) and P'sum(λ). Step 810 may be implemented, for example, by thespectrum processor 212 ofFig. 2 . - Knowing the coefficient ε, the polarized-signal contribution Sp(λ) may be found from P'sum(λ) or P'minmin(λ) or, equivalently, from the differential optical spectrum trace ΔP(λ), as follows :

step 806, we find :
- Having discriminated the depolarized-signal Sdp(λ) and polarized-signal Sp(λ) contributions, the coefficient ξ may be calculated as per its definition, i.e. :

- If no ASE-noise parameter is to be determined,
step 810 may be replaced by a simple evaluation of the coefficient ξ based, for example on the following equation that is obtained following a polarization-sensitive spectrum analysis of the SUT as described hereinabove and combining Equations (7b), (11), (15a) and (15b) :
- Then, from NASE(λ) and ε as determined in the previous steps, the coefficient ξ may be evaluated directly.
- Once all contributions have been discriminated, in
step 812, the noise parameter or noise parameters to be characterized, i.e. either or both an ASE-noise parameter, e.g. the ASE-only OSNR, or a non-ASE noise parameter, e.g. a degree of signal depolarization parameter, are calculated from at least one or a combination of the discriminated polarized-signal Sp(λ), depolarized-signal Sdp(λ) and ASE-noise NASE(λ) contributions. The thereby-determined noise parameter(s) are then output for use, for example, in monitoring, maintenance or troubleshooting of a DWDM optical system. For example, the noise parameter(s) can be output by graphical display, by printing, by generating an electrical signal or by storage in memory for later retrieval. Other parameters may also be displayed or otherwise output in a graphical or numerical form. Step 810 may be implemented, for example, by employing thenoise calculator 214 ofFig. 2 . - Examples of noise parameters that may be determined and subsequently output are the ASE-only OSNR as per Equation (25) and the optical-signal (S(λ)) to depolarization-noise (Sdp(λ)) ratio (depolarization-OSNR), which may be defined, in dB units, as:

- Of course, any other useful ASE-noise parameters and/or non-ASE noise parameters may also be determined and subsequently output.
- As mentioned hereinabove, signal depolarization that is manifest on optical spectrum traces acquired with a commercial OSA, i.e. having a non-zero RBW, is characterized by both a NLE-induced signal depolarization and a PMD-related signal depolarization, such that ξ = ξNLE + ξPMD. The coefficient ξ of signal depolarization comprising both NLE-induced and PMD-related signal depolarization is determined from the aforedescribed method. However, it may be useful to discriminate the NLE-induced signal depolarization ξNLE from the PMD-related signal depolarization ξPMD coefficients for better characterization of NLEs on a SUT.
- To this end, the degree of PMD-related signal depolarization, related to the effective DGD-induced temporal pulse broadening τPPB and to the RBW of OSA, may be estimated by :

- Another method for estimating the effective DGD effect τPPB is disclosed herein. This method is based on the SOP variation of the polarized signal as a function of optical frequency.
- Among the nSOP acquired pairs of optical spectrum traces P//(λ), P⊥(λ), the pair of traces Pmax(ν) and Pmin(ν) which corresponds to the maximum ratio P//(ν0)/P⊥(ν0) or P⊥(ν0)/P//(ν0) at given optical frequency within the signal bandwidth (typically selected as the signal peak optical frequency ν0) is selected. The selected pair corresponds to orthogonal SOP analysis conditions as obtained concurrently at outputs p// and p⊥ of the
polarization beam splitter 220 ofFig. 2 . If the DGD (PMD) effect on the SUT is small or negligible, we have :

- However, in the presence of DGD (PMD) effects, the SOP of the polarized signal contribution Sp varies as a function of wavelength. As a consequence, the residual angle δ(ν), in the Jones-vector domain, between the SOP of the polarized signal contribution Sp(λ) and one of the polarization axes of the
polarization beam splitter 220, which corresponds to the acquisition of the pair of traces Pmin(ν) and Pmax(ν), also actually varies as a function of wavelength, and so is the coefficient εSOP(ν) of residual polarized-signal contribution. Hence, at v = ν0 :


- Defining a power-ratio spectrum R(v) as :

- For a sufficiently large number of nSOP and given the particular residual angle δ(ν), by employing the relation τPPB = (1/π)(dδ(ν)/dν), and considering sin(2δ)→0 or cos(2δ)→1, ξPMD and τPPB may be estimated by :


- Another method for distinguishing ξNL from ξPMD is proposed herein. This method is based on the dependence of ξPMD as a function of the RBW, ΔνRBW , of the OSA, as can be observed in Equation (48), and the fact that ξNL is independent of ΔνRBW. Then, two sets of polarization-sensitive spectrum analysis data are acquired as mentioned above with respective two RBWs of OSA, i.e RBW1 and RBW2. From Equations (45) and (48), one obtains:


and defining :
- The NLE-induced signal depolarization coefficient ξNL is then determined as follows :

- The thereby-discriminated NLE-induced signal depolarization coefficient ξNLE may then be used to characterize NLEs on the SUT. An example of a noise parameter that may be determined to characterize NLEs is an optical-signal (S(λ)) to NLE-induced depolarization-noise (Sdp(λ)NLE) ratio (or NLE-depolarization-OSNR), such as :

- The PMD-related signal depolarization ξPMD coefficient may also constitute a noise parameter characterizing the SUT. Another example of a noise parameter that may be determined to characterize the SUT is an optical-signal (S(λ)) to polarization-pulse-broadening-depolarization-noise (Sdp(λ)PMD) ratio (or PPS-depolarization-OSNR), which may be defined, in dB units, as :

- It should be appreciated that the different steps described herein are provided for purpose of illustration and that they may be varied without departing from the general concept described herein. For example, some steps may be omitted or interchanged. For instance,
step 804, corresponding to discrimination of the carrier-leakage contribution, may be adapted to allow it to be undertaken subsequent tosteps - It should be appreciated that the disclosed method is not limited to live (i.e. real data-carrying) channels, but may also be used to characterize non-ASE optical noise on one or more non-data-carrying test channels (i.e. dark channels) of an optical telecommunication system.
- To this end, a test source may be used generate a probe optical signal that is propagated in the optical telecommunication channel to be characterized. In accordance with this third embodiment, the test source is a polarized Continuous Wave (CW) source, i.e. non-modulated, having, for instance, a spectral extent that encompasses a significant portion of the effective optical channel bandwidth. However, it should be appreciated that a modulated test source may be employed as well. The test source is inserted at the transmitter end of the optical telecommunication link. At the receiver end, or anywhere else along the optical link, the propagated probe signal will typically undergo the same impairments as a data-carrying signal, and consequently characterization of the probe signal enables characterization of the optical channel.
- Accordingly, in this third embodiment, the SUT corresponds to the probe signal as propagated through the optical channel under characterization. As in the method of the second embodiment, the probe signal (SUT) which is being characterized and which is representative of non-ASE optical noise on the optical telecommunication channel, then comprises a depolarized-signal contribution Sdp(λ), a polarized-signal contribution Sp(λ) and an ASE-noise contribution NASE(λ). However, contrary to a data-carrying SUT and if it does not undergo modulation, there is no carrier leakage on the probe signal.
- In accordance with the method of this third embodiment, the steps of the method of
Fig. 8 are applied on the probe signal as they would be on the SUT of the second embodiment, except forstep 804 of discriminating the carrier leakage, which is omitted in the case of a CW probe signal since there is then no possible carrier leakage. The fact that the probe signal has a chosen known optical spectrum serves to facilitate implementation ofstep 806 of evaluating the ASE-noise contribution NASE(λ) and all other steps remain unchanged. - It should be appreciated that in other cases where a modulated probe signal is used instead of a Continuous Wave (CW) source, the method of the second embodiment may still be applied to the modulated probe signal.
- The embodiments described hereinabove use polarization-sensitive spectrum analysis to discriminate non-ASE optical noise contributions from signal and ASE-noise contributions. However, the carrier-leakage contribution may also be discriminated from the other contributions without resort to polarization-sensitive spectrum analysis. For example, this may be made possible by simply employing knowledge of the spectral shape of the signal contribution.
- Accordingly, in yet another embodiment, the discrimination between the carrier leakage contribution and the other contributions is carried out using the known or predetermined spectral shape of the signal contribution. To this end, an optical spectrum trace P(λ) of the SUT, including the carrier-leakage contribution and all other contributions, is acquired. Then, in order to estimate the signal contribution S(λ) in optical spectrum trace P(λ), the spectral shape of the signal contribution is fitted on optical spectrum trace P(λ) The result of the fit provides an estimation of the signal contribution S(A), including both polarized-signal contribution Sp(λ) and any possible depolarized-signal contribution Sdp(λ). After S(λ) has been so determined, [CL(λ) + NASE(λ)] may be found as :

- It should be noted that the precision of the estimation thus achieved increases with the relative contribution of carrier leakage and thus of the relevance of evaluating it.
- It should be appreciated that many other variations of the embodiments described herein are also possible.
- For example, it will be appreciated that in DWDM optical telecommunication systems having a large number of channels, the signal in each channel generally suffers from similar NLE-induced signal depolarization, which may be characterized, for example, by the NLE-induced signal depolarization coefficient ξNLE, provided that the SOP relation between each signal of the DWDM channels is arbitrary. More specifically, NLE-induced signal depolarization that is present on a DWDM optical channel may generally be considered indicative of NLE-induced signal depolarization on neighboring channels copropagating in the same optical fiber.
- Accordingly, in one embodiment, NLE-induced signal depolarization on a channel-under-test is being evaluated by actually applying the method of the second embodiment, or a variant thereof, on another channel of the DWDM optical telecommunication link, the value obtained being indicative of NLE-induced signal depolarization on the channel-under-test. This may be of particular value in the case of a polarization-multiplexing - non-polarization-multiplexing mixed system, such as 40G-10G mixed systems, for instance, for which 40G channels are polarization-multiplexed whereas 10G channels are non-polarization multiplexed. In this case, the method of the second embodiment cannot be applied to the polarization-multiplexed channels. However, characterization of NLE-induced signal depolarization on non-polarization-multiplexed channels provides for an estimation of the NLE-induced signal depolarization on nearby polarization-multiplexed channels. Moreover, in other embodiments, NLE-induced signal depolarization may be characterized on a plurality of channels of a DWDM system and the values obtained be averaged to determine a NLE-related noise parameter that applies to any channel of the DWDM systems.
- Although illustrated in the block diagrams as groups of discrete components communicating with each other via distinct data signal connections, it will be understood by those skilled in the art that the illustrated embodiments may be provided by a combination of hardware and software components, with some components being implemented by a given function or operation of a hardware or software system, and many of the data paths illustrated being implemented by data communication within a computer application or operating system. The illustrated structure is thus only provided for efficiency of teaching the described embodiment.
- The embodiments described above are intended to be illustrative only. The scope of the invention is therefore intended to be limited solely by the appended claims.
Claims (14)
- A method (400; 800) for determining a noise parameter characterizing an optical signal-under-test having a signal contribution, an Amplified Spontaneous Emission (ASE) noise contribution and a non- ASE optical noise contribution within an optical-signal bandwidth, wherein said signal contribution is polarized and wherein said non-ASE optical noise contribution comprises a depolarized-signal contribution at least partly imparted from a non-linear effect to be characterized, said method comprising:acquiring (402; 802) a plurality of optical spectrum traces of the signal-under-test, the plurality of optical spectrum traces including a pair of mutually-orthogonal polarization-analyzed optical spectrum traces ( P⊥(λ), P//(λ) ) for each of a number nSOP of varied state-of-polarization analysis conditions of the signal-under-test;discriminating (406; 806) at least said non-ASE optical noise contribution from said ASE-noise contribution and said signal contribution based on known different spectral-shape properties between said non-ASE optical noise contribution, said ASE-noise contribution and said signal contribution, wherein said discriminating is carried out by using the plurality of optical spectrum traces and an extrema trace obtained by:i) calculating a ratio of the mutually-orthogonal polarization-analyzed optical spectrum traces ( P⊥(λ), P//(λ) ) to obtain a ratio trace (r(λ)), for each said nSOP acquisitions;ii) determining an extrema trace corresponding to minimum values (rmin(λ)) or maximum values (rmax(λ)) of the calculated ratio traces; anddetermining (408; 812) said noise parameter characterizing said signal-under-test using at least one of the discriminated non-ASE optical noise contribution and the discriminated ASE-noise contribution.
- The method (400; 800) as claimed in claim 1, wherein said signal contribution comprises a data-carrying signal contribution.
- The method (400; 800) as claimed in any one of claims 1 to 2, wherein the signal-under-test is a non-data-carrying probe optical signal as propagated over an optical communication channel to be characterized, said signal contribution comprising a probe signal contribution and characterization of said noise parameter on said signal-under-test provides a characterization of said optical communication channel.
- The method (400; 800) as claimed in any one of claims 1 to 3, wherein said non-ASE optical noise contribution comprises at least a carrier-leakage contribution arising at least partially from imperfect modulation at transmission.
- The method (400; 800) as claimed in claim 4, wherein said discriminating comprises discriminating at least said carrier-leakage contribution from said ASE-noise contribution in said extrema trace based on known different spectral-shape properties between said carrier-leakage contribution and said ASE-noise contribution.
- The method (400; 800) as claimed in claim 4, wherein a spectral shape of said carrier-leakage contribution is known and wherein said discriminating comprises discriminating at least said carrier-leakage contribution from said ASE-noise contribution in said extrema trace using the known spectral shape of said carrier-leakage contribution.
- The method (400; 800) as claimed in any one of claims 1 to 6, wherein said extrema trace is a minimum trace.
- The method (400; 800) as claimed in claim 7, wherein said discriminating comprises performing an interpolation on said minimum trace to estimate said ASE-noise contribution in said minimum trace.
- The method (400; 800) as claimed in any one of claims 1 to 8, wherein said extrema trace is a composite minimum trace obtained by selecting, for each wavelength individually, a minimum value among said optical spectrum traces.
- The method (400; 800) as claimed in claim 1, wherein said discriminating comprises discriminating at least said depolarized-signal contribution from said ASE-noise contribution in said extrema trace based on known different spectral-shape properties between said depolarized-signal contribution and said ASE-noise contribution.
- The method (400; 800) as claimed in claim 1, wherein said extrema trace is a composite extrema trace obtained by selecting, for each wavelength individually, an extrema value among said ratio traces.
- The method (400; 800) as claimed in claim 1, wherein said depolarized-signal contribution comprises a Non-Linear-Effect-induced (NLE-induced) signal depolarization part and a Polarization-Mode-Dispersion-related (PMD-related) signal depolarization part, and wherein said method comprises:estimating said PMD-related signal depolarization part from a PMD parameter indicative of a PMD-related signal depolarization part in said signal-under-test; andestimating said NLE-induced signal depolarization part using the discriminated depolarized-signal part and the estimated PMD-related signal depolarization part;wherein said noise parameter is determined using at least the estimated NLE-induced signal depolarization part.
- The method (400; 800) as claimed in claim 12, further comprising:from the plurality of optical spectrum traces, selecting a maximum trace and a minimum trace;from the plurality of optical spectrum traces, determining a composite extrema trace obtained by selecting, for each wavelength individually, a maximum value or a minimum value among the plurality of optical spectrum traces; andestimating said PMD-related signal depolarization part using a power-ratio spectral trace calculated from at least said maximum trace and said minimum trace and said composite extrema trace.
- The method (400; 800) as claimed in claim 10, wherein said depolarized-signal contribution comprises a Non-Linear-Effect-induced (NLE-induced) signal depolarization part, said method further comprising:estimating said NLE-induced signal depolarization part on a first said optical signal under-test using the discriminated depolarized-signal part; andestimating a NLE-induced signal depolarization part on a second optical signal-under-test of a same wavelength-division-multiplexing communication link from the NLE-induced signal depolarization part as estimated on at least the first said optical signal under-test.
Applications Claiming Priority (3)
| Application Number | Priority Date | Filing Date | Title |
|---|---|---|---|
| US201161444295P | 2011-02-18 | 2011-02-18 | |
| US201161471457P | 2011-04-04 | 2011-04-04 | |
| PCT/CA2012/050089 WO2012109754A1 (en) | 2011-02-18 | 2012-02-16 | Characterization of non-ase noise on optical signals |
Publications (3)
| Publication Number | Publication Date |
|---|---|
| EP2676384A1 EP2676384A1 (en) | 2013-12-25 |
| EP2676384A4 EP2676384A4 (en) | 2017-07-19 |
| EP2676384B1 true EP2676384B1 (en) | 2021-03-31 |
Family
ID=46671902
Family Applications (1)
| Application Number | Title | Priority Date | Filing Date |
|---|---|---|---|
| EP12747668.7A Active EP2676384B1 (en) | 2011-02-18 | 2012-02-16 | Characterization of non-ase noise on optical signals |
Country Status (4)
| Country | Link |
|---|---|
| US (1) | US9438336B2 (en) |
| EP (1) | EP2676384B1 (en) |
| CN (1) | CN103370890B (en) |
| WO (1) | WO2012109754A1 (en) |
Families Citing this family (9)
| Publication number | Priority date | Publication date | Assignee | Title |
|---|---|---|---|---|
| CN102652406B (en) * | 2011-07-27 | 2015-03-11 | 华为技术有限公司 | Method and device for determining optical signal to noise ratio (osnr) cost |
| JP6400119B2 (en) * | 2014-04-17 | 2018-10-03 | 華為技術有限公司Huawei Technologies Co.,Ltd. | Method and apparatus for monitoring optical signal to noise ratio |
| CN103983428B (en) * | 2014-06-05 | 2016-09-28 | 中国科学技术大学 | The method measuring all-fiber pulse laser ASE noise |
| EP3018839B1 (en) * | 2014-11-05 | 2020-01-15 | EXFO Inc. | In-band noise and/or spectral deformation measurement on polarization-multiplexed signals |
| CN106559133B (en) * | 2015-09-28 | 2020-02-14 | 华为技术有限公司 | Optical signal detection method and network equipment thereof |
| US10567105B2 (en) * | 2016-02-02 | 2020-02-18 | Nec Corporation | Band identifying circuit, wavelength-multiplexed optical signal transmission device, wavelength-multiplexed optical signal transmission system, and band identifying method |
| EP3376687A1 (en) * | 2017-03-17 | 2018-09-19 | Xieon Networks S.à r.l. | Determination of channel osnr and channel osnr margin at real network conditions |
| JP7169980B2 (en) * | 2017-04-26 | 2022-11-11 | エクスフォ インコーポレイティッド | Noiseless measurement of spectral shape of modulated signals using spectral correlation |
| CN110086532B (en) * | 2019-04-17 | 2020-07-28 | 武汉邮电科学研究院有限公司 | Method and device for distinguishing nonlinear noise from spontaneous radiation noise in communication system |
Family Cites Families (12)
| Publication number | Priority date | Publication date | Assignee | Title |
|---|---|---|---|---|
| KR100419424B1 (en) * | 2001-09-22 | 2004-02-19 | 삼성전자주식회사 | Apparatus for optical signal performance monitoring in wavelength division multiplexing system |
| US6870629B1 (en) * | 2001-10-29 | 2005-03-22 | Precision Photonics Corporation | Optical frequency sweep control and readout by using a phase lock |
| WO2003041306A2 (en) | 2001-11-09 | 2003-05-15 | Newton Photonics, Inc. | Characterization of a transmission path of an optical signal having an optical communication signal |
| CN100477562C (en) * | 2005-08-04 | 2009-04-08 | 上海交通大学 | Method for monitoring optical signal in optical transmission system |
| CN101098191B (en) * | 2006-06-27 | 2012-02-29 | 中兴通讯股份有限公司 | Photosignal source device for implementing adjustable optical signal-to-noise ratio and controlling means |
| US7756369B2 (en) * | 2006-11-29 | 2010-07-13 | Acterna Llc | OSNR monitoring apparatus and method using polarization splitting |
| CA2684152C (en) * | 2007-04-05 | 2017-05-09 | Exfo Electro-Optical Engineering Inc. | Method and system for determining in-band optical noise |
| WO2009062237A1 (en) * | 2007-11-12 | 2009-05-22 | Nicta Ipr Pty Ltd | In-band osnr monitor with pmd insensitivity |
| ATE554541T1 (en) * | 2008-06-19 | 2012-05-15 | Acterna Llc | DETERMINING OPTICAL IN-BAND SIGNAL-NOISE DISTANCES IN OPTICAL SIGNALS WITH TIME-VARYING POLARIZATION STATES USING POLARIZATION EXTINCTION |
| JP2011024189A (en) * | 2009-06-19 | 2011-02-03 | Fujitsu Ltd | Osnr monitor device, and osnr measurement device |
| CA2761027A1 (en) | 2009-08-19 | 2011-02-24 | Exfo Inc. | In-band optical noise measurement using differential polarization response |
| US8249467B2 (en) | 2010-03-11 | 2012-08-21 | Ciena Corporation | Self test of a dual polarization transmitter |
-
2012
- 2012-02-16 EP EP12747668.7A patent/EP2676384B1/en active Active
- 2012-02-16 CN CN201280009309.6A patent/CN103370890B/en active Active
- 2012-02-16 WO PCT/CA2012/050089 patent/WO2012109754A1/en active Application Filing
-
2013
- 2013-08-13 US US13/965,823 patent/US9438336B2/en active Active
Non-Patent Citations (1)
| Title |
|---|
| None * |
Also Published As
| Publication number | Publication date |
|---|---|
| US20130330071A1 (en) | 2013-12-12 |
| US9438336B2 (en) | 2016-09-06 |
| WO2012109754A1 (en) | 2012-08-23 |
| EP2676384A4 (en) | 2017-07-19 |
| EP2676384A1 (en) | 2013-12-25 |
| CN103370890A (en) | 2013-10-23 |
| CN103370890B (en) | 2017-03-01 |
Similar Documents
| Publication | Publication Date | Title |
|---|---|---|
| EP2676384B1 (en) | Characterization of non-ase noise on optical signals | |
| Lee et al. | A review of the polarization-nulling technique for monitoring optical-signal-to-noise ratio in dynamic WDM networks | |
| Sasai et al. | Digital longitudinal monitoring of optical fiber communication link | |
| US9829429B2 (en) | Determining a polarization-related characteristic of an optical link | |
| EP2467955B1 (en) | In-band optical noise measurement using differential polarization response | |
| US8364034B2 (en) | In-band optical noise measurement using differential polarization response | |
| US11971323B2 (en) | Estimating nonlinear phase shift in a multi-span fiber-optic link using a coherent receiver | |
| US9673894B2 (en) | Characterization of linear crosstalk on multiplexed optical signals | |
| Eto et al. | Location-resolved PDL monitoring with Rx-side digital signal processing in multi-span optical transmission system | |
| Sena et al. | DSP-based link tomography for amplifier gain estimation and anomaly detection in C+ L-band systems | |
| Sasai et al. | Revealing Raman-amplified power profile and Raman gain spectra with digital backpropagation | |
| Gariépy et al. | Novel OSNR measurement techniques based on optical spectrum analysis and their application to coherent-detection systems | |
| Sasai et al. | Linear Least Squares Estimation of Fiber-Longitudinal Optical Power Profile | |
| Jennevé et al. | Measurement of optical nonlinear distortions and their uncertainties in coherent systems | |
| US20040247319A1 (en) | Characterization of a transmission path of an optical signal having an optical communication signal | |
| Anderson et al. | Robust, low cost, in-band optical signal to noise monitoring using polarization diversity | |
| Hui et al. | Non-blocking PMD monitoring in live optical systems | |
| Yao et al. | Advanced Optical Measurements for Data Centers | |
| Sousa et al. | Online group-velocity dispersion monitor based on clock frequency power analysis | |
| He et al. | All-Optical GOSNR Estimation on an Open Line System Using Polarization-Resolved Optical Spectrum Analysis | |
| Jiang et al. | In-situ monitoring of PMD and PDL in a traffic-carrying transatlantic fiber-optic system | |
| Wang et al. | Monitoring PMD-induced penalty and other system performance metrics via a high-speed spectral polarimeter | |
| Jiang et al. | PMD and PDL monitoring of traffic-carrying transatlantic fibre-optic system | |
| Kaneko et al. | Experimental Performance Evaluation of Rx DSP-based Fiber-longitudinal Power Profile Estimation | |
| Dods et al. | A novel broadband asynchronous histogram technique for optical performance monitoring |
Legal Events
| Date | Code | Title | Description |
|---|---|---|---|
| PUAI | Public reference made under article 153(3) epc to a published international application that has entered the european phase |
Free format text: ORIGINAL CODE: 0009012 |
|
| 17P | Request for examination filed |
Effective date: 20130917 |
|
| AK | Designated contracting states |
Kind code of ref document: A1 Designated state(s): AL AT BE BG CH CY CZ DE DK EE ES FI FR GB GR HR HU IE IS IT LI LT LU LV MC MK MT NL NO PL PT RO RS SE SI SK SM TR |
|
| DAX | Request for extension of the european patent (deleted) | ||
| REG | Reference to a national code |
Ref country code: DE Ref legal event code: R079 Ref document number: 602012074995 Country of ref document: DE Free format text: PREVIOUS MAIN CLASS: H04B0010080000 Ipc: H04B0010079000 |
|
| RA4 | Supplementary search report drawn up and despatched (corrected) |
Effective date: 20170620 |
|
| RIC1 | Information provided on ipc code assigned before grant |
Ipc: H04B 10/073 20130101ALI20170613BHEP Ipc: H04B 10/079 20130101AFI20170613BHEP Ipc: H04J 14/02 20060101ALI20170613BHEP Ipc: H04B 10/077 20130101ALI20170613BHEP |
|
| STAA | Information on the status of an ep patent application or granted ep patent |
Free format text: STATUS: EXAMINATION IS IN PROGRESS |
|
| 17Q | First examination report despatched |
Effective date: 20180302 |
|
| GRAP | Despatch of communication of intention to grant a patent |
Free format text: ORIGINAL CODE: EPIDOSNIGR1 |
|
| STAA | Information on the status of an ep patent application or granted ep patent |
Free format text: STATUS: GRANT OF PATENT IS INTENDED |
|
| INTG | Intention to grant announced |
Effective date: 20201123 |
|
| GRAS | Grant fee paid |
Free format text: ORIGINAL CODE: EPIDOSNIGR3 |
|
| GRAA | (expected) grant |
Free format text: ORIGINAL CODE: 0009210 |
|
| STAA | Information on the status of an ep patent application or granted ep patent |
Free format text: STATUS: THE PATENT HAS BEEN GRANTED |
|
| AK | Designated contracting states |
Kind code of ref document: B1 Designated state(s): AL AT BE BG CH CY CZ DE DK EE ES FI FR GB GR HR HU IE IS IT LI LT LU LV MC MK MT NL NO PL PT RO RS SE SI SK SM TR |
|
| REG | Reference to a national code |
Ref country code: GB Ref legal event code: FG4D Ref country code: CH Ref legal event code: EP |
|
| RAP3 | Party data changed (applicant data changed or rights of an application transferred) |
Owner name: EXFO INC. |
|
| REG | Reference to a national code |
Ref country code: AT Ref legal event code: REF Ref document number: 1378132 Country of ref document: AT Kind code of ref document: T Effective date: 20210415 |
|
| REG | Reference to a national code |
Ref country code: DE Ref legal event code: R096 Ref document number: 602012074995 Country of ref document: DE |
|
| REG | Reference to a national code |
Ref country code: IE Ref legal event code: FG4D |
|
| REG | Reference to a national code |
Ref country code: LT Ref legal event code: MG9D |
|
| PG25 | Lapsed in a contracting state [announced via postgrant information from national office to epo] |
Ref country code: NO Free format text: LAPSE BECAUSE OF FAILURE TO SUBMIT A TRANSLATION OF THE DESCRIPTION OR TO PAY THE FEE WITHIN THE PRESCRIBED TIME-LIMIT Effective date: 20210630 Ref country code: BG Free format text: LAPSE BECAUSE OF FAILURE TO SUBMIT A TRANSLATION OF THE DESCRIPTION OR TO PAY THE FEE WITHIN THE PRESCRIBED TIME-LIMIT Effective date: 20210630 Ref country code: FI Free format text: LAPSE BECAUSE OF FAILURE TO SUBMIT A TRANSLATION OF THE DESCRIPTION OR TO PAY THE FEE WITHIN THE PRESCRIBED TIME-LIMIT Effective date: 20210331 Ref country code: HR Free format text: LAPSE BECAUSE OF FAILURE TO SUBMIT A TRANSLATION OF THE DESCRIPTION OR TO PAY THE FEE WITHIN THE PRESCRIBED TIME-LIMIT Effective date: 20210331 |
|
| PG25 | Lapsed in a contracting state [announced via postgrant information from national office to epo] |
Ref country code: SE Free format text: LAPSE BECAUSE OF FAILURE TO SUBMIT A TRANSLATION OF THE DESCRIPTION OR TO PAY THE FEE WITHIN THE PRESCRIBED TIME-LIMIT Effective date: 20210331 Ref country code: LV Free format text: LAPSE BECAUSE OF FAILURE TO SUBMIT A TRANSLATION OF THE DESCRIPTION OR TO PAY THE FEE WITHIN THE PRESCRIBED TIME-LIMIT Effective date: 20210331 |
|
| REG | Reference to a national code |
Ref country code: NL Ref legal event code: MP Effective date: 20210331 |
|
| REG | Reference to a national code |
Ref country code: AT Ref legal event code: MK05 Ref document number: 1378132 Country of ref document: AT Kind code of ref document: T Effective date: 20210331 |
|
| PG25 | Lapsed in a contracting state [announced via postgrant information from national office to epo] |
Ref country code: AT Free format text: LAPSE BECAUSE OF FAILURE TO SUBMIT A TRANSLATION OF THE DESCRIPTION OR TO PAY THE FEE WITHIN THE PRESCRIBED TIME-LIMIT Effective date: 20210331 Ref country code: SM Free format text: LAPSE BECAUSE OF FAILURE TO SUBMIT A TRANSLATION OF THE DESCRIPTION OR TO PAY THE FEE WITHIN THE PRESCRIBED TIME-LIMIT Effective date: 20210331 Ref country code: NL Free format text: LAPSE BECAUSE OF FAILURE TO SUBMIT A TRANSLATION OF THE DESCRIPTION OR TO PAY THE FEE WITHIN THE PRESCRIBED TIME-LIMIT Effective date: 20210331 Ref country code: LT Free format text: LAPSE BECAUSE OF FAILURE TO SUBMIT A TRANSLATION OF THE DESCRIPTION OR TO PAY THE FEE WITHIN THE PRESCRIBED TIME-LIMIT Effective date: 20210331 Ref country code: EE Free format text: LAPSE BECAUSE OF FAILURE TO SUBMIT A TRANSLATION OF THE DESCRIPTION OR TO PAY THE FEE WITHIN THE PRESCRIBED TIME-LIMIT Effective date: 20210331 Ref country code: CZ Free format text: LAPSE BECAUSE OF FAILURE TO SUBMIT A TRANSLATION OF THE DESCRIPTION OR TO PAY THE FEE WITHIN THE PRESCRIBED TIME-LIMIT Effective date: 20210331 |
|
| PG25 | Lapsed in a contracting state [announced via postgrant information from national office to epo] |
Ref country code: IS Free format text: LAPSE BECAUSE OF FAILURE TO SUBMIT A TRANSLATION OF THE DESCRIPTION OR TO PAY THE FEE WITHIN THE PRESCRIBED TIME-LIMIT Effective date: 20210731 Ref country code: RO Free format text: LAPSE BECAUSE OF FAILURE TO SUBMIT A TRANSLATION OF THE DESCRIPTION OR TO PAY THE FEE WITHIN THE PRESCRIBED TIME-LIMIT Effective date: 20210331 Ref country code: PL Free format text: LAPSE BECAUSE OF FAILURE TO SUBMIT A TRANSLATION OF THE DESCRIPTION OR TO PAY THE FEE WITHIN THE PRESCRIBED TIME-LIMIT Effective date: 20210331 Ref country code: PT Free format text: LAPSE BECAUSE OF FAILURE TO SUBMIT A TRANSLATION OF THE DESCRIPTION OR TO PAY THE FEE WITHIN THE PRESCRIBED TIME-LIMIT Effective date: 20210802 Ref country code: ES Free format text: LAPSE BECAUSE OF FAILURE TO SUBMIT A TRANSLATION OF THE DESCRIPTION OR TO PAY THE FEE WITHIN THE PRESCRIBED TIME-LIMIT Effective date: 20210331 Ref country code: SK Free format text: LAPSE BECAUSE OF FAILURE TO SUBMIT A TRANSLATION OF THE DESCRIPTION OR TO PAY THE FEE WITHIN THE PRESCRIBED TIME-LIMIT Effective date: 20210331 |
|
| REG | Reference to a national code |
Ref country code: DE Ref legal event code: R097 Ref document number: 602012074995 Country of ref document: DE |
|
| PG25 | Lapsed in a contracting state [announced via postgrant information from national office to epo] |
Ref country code: DK Free format text: LAPSE BECAUSE OF FAILURE TO SUBMIT A TRANSLATION OF THE DESCRIPTION OR TO PAY THE FEE WITHIN THE PRESCRIBED TIME-LIMIT Effective date: 20210331 Ref country code: AL Free format text: LAPSE BECAUSE OF FAILURE TO SUBMIT A TRANSLATION OF THE DESCRIPTION OR TO PAY THE FEE WITHIN THE PRESCRIBED TIME-LIMIT Effective date: 20210331 |
|
| PLBE | No opposition filed within time limit |
Free format text: ORIGINAL CODE: 0009261 |
|
| STAA | Information on the status of an ep patent application or granted ep patent |
Free format text: STATUS: NO OPPOSITION FILED WITHIN TIME LIMIT |
|
| 26N | No opposition filed |
Effective date: 20220104 |
|
| PG25 | Lapsed in a contracting state [announced via postgrant information from national office to epo] |
Ref country code: IS Free format text: LAPSE BECAUSE OF FAILURE TO SUBMIT A TRANSLATION OF THE DESCRIPTION OR TO PAY THE FEE WITHIN THE PRESCRIBED TIME-LIMIT Effective date: 20210731 |
|
| PG25 | Lapsed in a contracting state [announced via postgrant information from national office to epo] |
Ref country code: IT Free format text: LAPSE BECAUSE OF FAILURE TO SUBMIT A TRANSLATION OF THE DESCRIPTION OR TO PAY THE FEE WITHIN THE PRESCRIBED TIME-LIMIT Effective date: 20210331 |
|
| PG25 | Lapsed in a contracting state [announced via postgrant information from national office to epo] |
Ref country code: MC Free format text: LAPSE BECAUSE OF FAILURE TO SUBMIT A TRANSLATION OF THE DESCRIPTION OR TO PAY THE FEE WITHIN THE PRESCRIBED TIME-LIMIT Effective date: 20210331 |
|
| REG | Reference to a national code |
Ref country code: CH Ref legal event code: PL |
|
| REG | Reference to a national code |
Ref country code: BE Ref legal event code: MM Effective date: 20220228 |
|
| PG25 | Lapsed in a contracting state [announced via postgrant information from national office to epo] |
Ref country code: LU Free format text: LAPSE BECAUSE OF NON-PAYMENT OF DUE FEES Effective date: 20220216 |
|
| PG25 | Lapsed in a contracting state [announced via postgrant information from national office to epo] |
Ref country code: LI Free format text: LAPSE BECAUSE OF NON-PAYMENT OF DUE FEES Effective date: 20220228 Ref country code: IE Free format text: LAPSE BECAUSE OF NON-PAYMENT OF DUE FEES Effective date: 20220216 Ref country code: CH Free format text: LAPSE BECAUSE OF NON-PAYMENT OF DUE FEES Effective date: 20220228 |
|
| PG25 | Lapsed in a contracting state [announced via postgrant information from national office to epo] |
Ref country code: BE Free format text: LAPSE BECAUSE OF NON-PAYMENT OF DUE FEES Effective date: 20220228 |
|
| PGFP | Annual fee paid to national office [announced via postgrant information from national office to epo] |
Ref country code: FR Payment date: 20230109 Year of fee payment: 12 |
|
| P01 | Opt-out of the competence of the unified patent court (upc) registered |
Effective date: 20230513 |
|
| PG25 | Lapsed in a contracting state [announced via postgrant information from national office to epo] |
Ref country code: HU Free format text: LAPSE BECAUSE OF FAILURE TO SUBMIT A TRANSLATION OF THE DESCRIPTION OR TO PAY THE FEE WITHIN THE PRESCRIBED TIME-LIMIT; INVALID AB INITIO Effective date: 20120216 |
|
| PG25 | Lapsed in a contracting state [announced via postgrant information from national office to epo] |
Ref country code: MK Free format text: LAPSE BECAUSE OF FAILURE TO SUBMIT A TRANSLATION OF THE DESCRIPTION OR TO PAY THE FEE WITHIN THE PRESCRIBED TIME-LIMIT Effective date: 20210331 Ref country code: CY Free format text: LAPSE BECAUSE OF FAILURE TO SUBMIT A TRANSLATION OF THE DESCRIPTION OR TO PAY THE FEE WITHIN THE PRESCRIBED TIME-LIMIT Effective date: 20210331 |
|
| PGFP | Annual fee paid to national office [announced via postgrant information from national office to epo] |
Ref country code: DE Payment date: 20240109 Year of fee payment: 13 Ref country code: GB Payment date: 20240111 Year of fee payment: 13 |