EP2656543B1 - Verfahren und vorrichtung zur dienstüberwachung und dienstüberwachungsverwaltung - Google Patents
Verfahren und vorrichtung zur dienstüberwachung und dienstüberwachungsverwaltung Download PDFInfo
- Publication number
- EP2656543B1 EP2656543B1 EP10795711.0A EP10795711A EP2656543B1 EP 2656543 B1 EP2656543 B1 EP 2656543B1 EP 10795711 A EP10795711 A EP 10795711A EP 2656543 B1 EP2656543 B1 EP 2656543B1
- Authority
- EP
- European Patent Office
- Prior art keywords
- service
- monitoring
- sub
- session
- metric
- Prior art date
- Legal status (The legal status is an assumption and is not a legal conclusion. Google has not performed a legal analysis and makes no representation as to the accuracy of the status listed.)
- Active
Links
- 238000012544 monitoring process Methods 0.000 title claims description 448
- 238000000034 method Methods 0.000 title claims description 83
- 238000005259 measurement Methods 0.000 claims description 12
- 230000000737 periodic effect Effects 0.000 claims description 4
- 230000000977 initiatory effect Effects 0.000 description 45
- 238000003326 Quality management system Methods 0.000 description 43
- 230000004044 response Effects 0.000 description 28
- 238000013442 quality metrics Methods 0.000 description 25
- 238000007726 management method Methods 0.000 description 11
- 238000010586 diagram Methods 0.000 description 10
- 238000012545 processing Methods 0.000 description 6
- 230000006870 function Effects 0.000 description 4
- 238000004458 analytical method Methods 0.000 description 3
- 230000008878 coupling Effects 0.000 description 3
- 238000010168 coupling process Methods 0.000 description 3
- 238000005859 coupling reaction Methods 0.000 description 3
- 238000001514 detection method Methods 0.000 description 3
- 230000000694 effects Effects 0.000 description 3
- 238000005516 engineering process Methods 0.000 description 3
- 230000011664 signaling Effects 0.000 description 3
- 230000008859 change Effects 0.000 description 2
- 238000004891 communication Methods 0.000 description 2
- 239000000284 extract Substances 0.000 description 2
- 230000007246 mechanism Effects 0.000 description 2
- 230000008569 process Effects 0.000 description 2
- 238000013519 translation Methods 0.000 description 2
- 230000009471 action Effects 0.000 description 1
- 238000007792 addition Methods 0.000 description 1
- 238000013459 approach Methods 0.000 description 1
- 230000008901 benefit Effects 0.000 description 1
- 238000003780 insertion Methods 0.000 description 1
- 230000037431 insertion Effects 0.000 description 1
- 238000007689 inspection Methods 0.000 description 1
- 230000003993 interaction Effects 0.000 description 1
- 238000002372 labelling Methods 0.000 description 1
- 230000006855 networking Effects 0.000 description 1
- 238000007781 pre-processing Methods 0.000 description 1
- 238000013441 quality evaluation Methods 0.000 description 1
- 230000007704 transition Effects 0.000 description 1
- 230000001960 triggered effect Effects 0.000 description 1
Images


Classifications
-
- H—ELECTRICITY
- H04—ELECTRIC COMMUNICATION TECHNIQUE
- H04L—TRANSMISSION OF DIGITAL INFORMATION, e.g. TELEGRAPHIC COMMUNICATION
- H04L43/00—Arrangements for monitoring or testing data switching networks
-
- H—ELECTRICITY
- H04—ELECTRIC COMMUNICATION TECHNIQUE
- H04L—TRANSMISSION OF DIGITAL INFORMATION, e.g. TELEGRAPHIC COMMUNICATION
- H04L41/00—Arrangements for maintenance, administration or management of data switching networks, e.g. of packet switching networks
- H04L41/06—Management of faults, events, alarms or notifications
- H04L41/0631—Management of faults, events, alarms or notifications using root cause analysis; using analysis of correlation between notifications, alarms or events based on decision criteria, e.g. hierarchy, tree or time analysis
- H04L41/065—Management of faults, events, alarms or notifications using root cause analysis; using analysis of correlation between notifications, alarms or events based on decision criteria, e.g. hierarchy, tree or time analysis involving logical or physical relationship, e.g. grouping and hierarchies
-
- H—ELECTRICITY
- H04—ELECTRIC COMMUNICATION TECHNIQUE
- H04L—TRANSMISSION OF DIGITAL INFORMATION, e.g. TELEGRAPHIC COMMUNICATION
- H04L41/00—Arrangements for maintenance, administration or management of data switching networks, e.g. of packet switching networks
- H04L41/50—Network service management, e.g. ensuring proper service fulfilment according to agreements
- H04L41/5032—Generating service level reports
-
- H—ELECTRICITY
- H04—ELECTRIC COMMUNICATION TECHNIQUE
- H04L—TRANSMISSION OF DIGITAL INFORMATION, e.g. TELEGRAPHIC COMMUNICATION
- H04L43/00—Arrangements for monitoring or testing data switching networks
- H04L43/08—Monitoring or testing based on specific metrics, e.g. QoS, energy consumption or environmental parameters
- H04L43/091—Measuring contribution of individual network components to actual service level
Definitions
- the invention relates to a method of and device for service monitoring and a method of and device for service monitoring management.
- One way of providing quality of service monitoring is to monitor the service at the point where that service is delivered, i.e. at the terminal that is running a service.
- service quality metrics are measured at the terminal and are reported to an entity in the network that records and collates those measurements centrally.
- RTCP Real-time Transport Control Protocol
- RTCP XR RTP Control Protocol extended Reports
- QoE Quality of Experience
- 3GPP TS 26.346 3GPP TS 26.346
- the Broadband Forum TR-069 specifies a protocol for communication between an Auto-Configuration Server (ACS) and Customer Premise Equipment (CPE).
- the Auto-Configuration Server (ACS) is a server within the service provider's network that has the ability to control and monitor a Customer Premise Equipment (CPE) with the Broadband Forum TR-069 protocol.
- the present invention seeks to provide a method of and a device for service monitoring and of service monitoring management that alleviates at least some of the disadvantages of the prior art.
- a method of service monitoring comprising the steps of receiving a service monitoring request to perform service monitoring of at least one service, and of at least one sub-service associated with the service, in a terminal.
- the method comprises the steps of monitoring terminal operational information; recording at least one value for a service monitoring metric and/or a sub-service monitoring metric derived from the terminal operational information.
- the method further comprises sending one or more service monitoring reports in respect of a service, wherein service monitoring metric values and sub-service monitoring metric values within the or each service monitoring report are relationally organised reflecting the association between the sub-service and the service.
- a device for service monitoring comprises a receiver coupled to receive a service monitoring request to perform service monitoring of at least one service, and of at least one sub-service associated with the service, in a terminal; a monitor operable to connect with a terminal operational information store and to monitor terminal operational information in the terminal operational information store.
- the device further comprises a record manager coupled to the monitor and to a metrics record and operable to record at least one value for a service monitoring metric and/or a sub-service monitoring metric derived from the terminal operational information in the metrics record; and a reporter coupled to the metrics record.
- the reporter is operable to send one or more service monitoring reports in respect of a service, wherein service monitoring metric values and sub-service monitoring metric values within the or each service monitoring report are relationally organised reflecting the association between the sub-service and the service.
- a method of service monitoring management comprising the steps of: receiving one or more service monitoring reports in respect of a service, wherein service monitoring metric values and sub-service monitoring metric values within the or each service monitoring report are relationally organised to reflect the association between the sub-service and the service.
- the method also comprises storing received service monitoring metric values and sub-service monitoring metric values in a relationally organised manner reflecting the association between the sub-service and the service; and performing service monitoring management by analysing the received service monitoring metric values and sub-service monitoring metric values with reference to the association between the service and the sub-service.
- a device for service monitoring management comprising a monitoring report receiver element operable to receive one or more service monitoring reports in respect of a service, wherein service monitoring metric values and sub-service monitoring metric values within the or each service monitoring report are relationally organised to reflect the association between the sub-service and the service.
- the device also comprises a storage element arranged to store service monitoring metric values and sub-service monitoring metric values in a relationally organised manner reflecting the association between the sub-service and the service and a received metric value storing element coupled to the monitoring report receiver element to receive service monitoring metric values and sub-service monitoring metric values there from and coupled to the storage element.
- the received metric value storing element is operable to store received service monitoring metric values and sub-service monitoring metric values in the storage element in a relationally organised manner reflecting the association between the sub-service and the service.
- the device further comprises a records analyser coupled to the storage element and operable to perform service monitoring management by analysing the received service monitoring metric values and sub-service monitoring metric values with reference to the association between the service and the sub-service.
- a terminal is a device on which services can be run.
- a terminal may be dedicated to running a single service, for example a terminal may be a set top box.
- a terminal may be capable of running a plurality of services, for example the terminal may be a computer or a smart phone.
- Such a terminal may have an application client stored in memory, and a service can be provided to the user of the terminal by interaction of an active application client on the terminal and a remote application server.
- a service may have one or more associated or related sub-services, which rely on the operation of the service. Services and their corresponding sub-services are exemplified by, but not limited to:
- a session of a service is defined as an occurrence of the service.
- a session of a service spans the time from the initiation of the service to the time that the service has terminated.
- a session of a sub-service spans the time from the initiation of the sub-service to the time that the sub-service has terminated.
- a single session for a service may have a number of sub-service sessions within the single service session.
- a number of different sub-service sessions such as a web-mail sub-service session or a number of different web-site sub-service sessions, might be accommodated.
- a single IPTV service session might include a number of different channel sub-service sessions and/or content on demand sub-service sessions. It will be clear that sub-service sessions may occur sequentially and/or simultaneously within a single service session, and that typically one or more service sessions may occur simultaneously in one terminal.
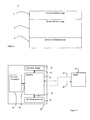
- Figure 1 illustrates three stages of operation of a session 2 of a service or a sub-service.
- the first stage of operation of a session 2 is the service initiation stage 4.
- This stage is a preliminary set up stage, and in this stage signalling messages are exchanged with the service provider, such as the applications server or a media server, in order to establish the session, for example to establish an operational service connection for service delivery.
- the service provider such as the applications server or a media server
- the service delivery stage 6 of session 2 begins. In this stage, the service is actually being delivered to the terminal.
- the third stage is a service termination stage 8 of session 2. In some service sessions this stage may be cut short or abandoned. However, in general during termination of a service, signalling will be exchanged with the service provider to tear down the channel used for the service.
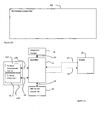
- a terminal 10 is provided with a Service Quality Monitoring and Reporting Module (SQMRM) 12.
- the Service Quality Monitoring and Reporting Module (SQMRM) 12 monitors the quality of service for services operating on terminal 10 under the direction of a Service Quality Management System (SQMS) 14.
- SQLRM Service Quality Monitoring and Reporting Module
- a Service Quality Monitoring and Reporting Module (SQMRM) 12 may be provided for each service to be monitored.
- SQMRM Service Quality Monitoring and Reporting Module
- One way in which this might be achieved is if the Service Quality Monitoring and Reporting Module (SQMRM) 12 is part of the application code providing the service, for example is provided as a plug-in for a browser.
- SQMS Service Quality Management System
- SQMRM Service Quality Monitoring and Reporting Module
- a single Service Quality Monitoring and Reporting Module (SQMRM) 12 may be instructed to monitor a number of services in the terminal 10.
- a Service Quality Monitoring and Reporting Module (SQMRM) 12 may be instructed to monitor a plurality of services on a plurality of terminals 10.
- the terminal 10 is provided with terminal information storage 16 in which is stored operational information generated by the operation of terminal 10.
- the operational information includes information such as: packet latency; packet jitter; throughput information; time to access channel; number of successful/unsuccessful channel accesses, for example.
- Other information relating to the terminal or the user, such as terminal temperature; location of the terminal; user identification information may also be stored in the terminal information storage (16).
- This operational information includes information that may be useful in analysing the quality of one or more services being run on the terminal 10.
- the Service Quality Monitoring and Reporting Module (SQMRM) 12 is coupled to the terminal information storage 16 and is operable to access the terminal information stored therein.
- the Service Quality Monitoring and Reporting Module (SQMRM) 12 is also provided with a metric parameter storage 18, for storing generic metric parameters and for storing service metric parameters for the or each service that the Service Quality Monitoring and Reporting Module (SQMRM) 12 has received instructions to monitor.
- the Service Quality Monitoring and Reporting Module (SQMRM) 12 is coupled to the metric parameter storage 18 and operable to store parameters for metrics therein.
- the Service Quality Monitoring and Reporting Module (SQMRM) 12 is operable to access parameters for metrics from the metric parameter storage 18.
- the Service Quality Monitoring and Reporting Module (SQMRM) 12 is also provided with a monitored session list storage 20, for storing a monitored session list identifying all active sessions of services for which monitoring instructions have been received by the Service Quality Monitoring and Reporting Module (SQMRM) 12.
- Service metrics values 22 for the or each service or sub-service for which a session is being monitored by the Service Quality Monitoring and Reporting Module (SQMRM) 12 can be stored for a monitored session in the monitored session list.
- these service metric values 22 are terminal information 38 obtained from the terminal information store 16.
- the Service Quality Monitoring and Reporting Module (SQMRM) 12 is coupled to the monitored session list storage 20 to manage a monitored session list in the monitored session list storage 20 and to store service metric values 22 for a monitored service session in the monitored session list.
- SQLRM Service Quality Monitoring and Reporting Module
- the metric parameter storage 18 and the monitored session list storage 20 may be part of the memory of the terminal 10 to which the Service Quality Monitoring and Reporting Module (SQMRM) 12 has access, while in other embodiments the Service Quality Monitoring and Reporting Module (SQMRM) 12 may be provided with its own memory.
- SQMRM Service Quality Monitoring and Reporting Module
- the Service Quality Monitoring and Reporting Module (SQMRM) 12 is coupled to a Service Quality Management System (SQMS) 14 to receive a monitoring instruction message 24, instructing Service Quality Monitoring and Reporting Module (SQMRM) 12 to monitor one or more services running on terminal 10.
- SQMS Service Quality Management System
- SQMRM Service Quality Monitoring and Reporting Module
- the monitoring instruction message 24 may be received by the Service Quality Monitoring and Reporting Module (SQMRM) 12 directly from the Service Quality Management System (SQMS) 14 or in other embodiments the monitoring instruction message 24 may be received indirectly from the Service Quality Management System (SQMS) 14 via other network elements, which are not shown in Figure 2 .
- SQMRM Service Quality Monitoring and Reporting Module
- the monitoring instruction message 24 contains parameters for generic metrics, to be reported by the Service Quality Monitoring and Reporting Module (SQMRM) 12. In some embodiments the monitoring instruction message 24 contains parameters for service metrics for use by the Service Quality Monitoring and Reporting Module (SQMRM) 12 in monitoring the service.
- SQMRM Service Quality Monitoring and Reporting Module
- Metrics may relate to anything that can be measured and relate to measurements from which useful information about the quality of service being provided by the system can be deduced.
- Generic metrics generally relate to identification information and/or quality monitoring process information.
- Service metrics generally relate to the operation or performance of the service or sub-service.
- the Service Quality Management System (SQMS) 14 is able to select metrics that the Service Quality Monitoring and Reporting Module (SQMRM) 12 reports regarding the service.
- SQLMS Service Quality Management System
- the Service Quality Management System (SQMS) 14 is able to determine how the Service Quality Monitoring and Reporting Module (SQMRM) 12 monitors the metrics of interest.
- the monitoring instruction message 24 may contain metrics and corresponding parameters additional to the default metrics and parameters.
- sub-services and corresponding metrics additional to the default sub-services and/or alternative parameters for service metrics or sub service metrics may be specified in the monitoring instruction message 24.
- a parameter specified for one or more of the metrics may relate to a threshold that notification is required if the metric value crosses the threshold.
- a notification threshold for a monitoring metric might be set for 90% of the normal or expected value.
- a hysteresis range of, for example 2% might be set to avoid flip-flop conditions. Therefore, if the value for the metric goes below 90% a service event is detected but the value for the metric must reach 92% before the service event is considered to have stopped. This is to avoid the situation where the metric value fluctuates around the threshold, resulting in many event notifications.
- a parameter specified for one or more of the metrics may relate to the value of the metric.
- the typical case here could be monitoring of state data like on/off or busy/idle/blocked, or monitoring a channel name. For example, in some embodiments it may be desired to monitor only when a certain channel is being watched or a certain type of channel is being watched (e.g. pay per view channel)
- a parameter specified for one or more of the metrics may relate to the range of the metric value. For example in some embodiments it may be desired to monitor a metric when its value is very low or very high.
- An example might be a generic metric that records the temperature of the terminal, where the temperature is to be recorded only if the temperature is outside an operating range. For example in one embodiment the temperature is to be recorded only if the temperature is less than -5 degrees Centigrade or greater than 30 degrees centigrade.
- a parameter specified for a service might be a wait value defining the maximum period permitted between reports relating to that service.
- a metric parameter record 26 for the service is formed in the metric parameter storage 18.
- the metric parameter record 26 may specify: the wait period, if any, defining the maximum period between monitoring report messages to be applied to the service; the service metrics to be used to monitor the service, together with any associated parameters such as range or threshold values; and sub-service metrics to be use to monitor sub-services of the service, together with any parameters associated with the sub-service metrics such as range or threshold values.
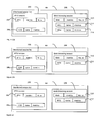
- the exemplary monitoring instruction message comprises:
- Service Quality Monitoring and Reporting Module (SQMRM) 12 is coupled to the Service Quality Management System (SQMS) 14 to return quality report message 28 to the Service Quality Management System (SQMS) 14, reporting values for service metric for the services for which quality of service monitoring has been requested.
- SQMS Service Quality Management System
- the quality report message 28 may be sent directly to the Service Quality Management System (SQMS) 14 from the Service Quality Monitoring and Reporting Module (SQMRM) 12, or in other embodiments the quality report message 28 may be sent indirectly to the Service Quality Management System (SQMS) 14 via other network elements, which are not shown in Figure 2 .
- SQMS Service Quality Management System
- SQMRM Service Quality Monitoring and Reporting Module
- the exemplary quality report message 28 comprises:
- additional generic metrics may relate to, for example, a generic metric relating to the service event triggering the sending of the report, for example whether the sending of the report message was triggered by a new service session; a new sub-service session; a elapse of a wait period; a metric threshold being exceeded by a metric value; a metric value dropping below a metric threshold; a sub-service session termination or a service session termination.
- Figures 5 a-e show respective exemplary service specific metrics for a number of different possible services.
- SQMS Service Quality Management System
- SQMRM Service Quality Monitoring and Reporting Module
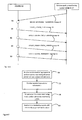
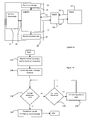
- a SERVICE_MONITORING_PARAMETERS message 30 is sent from Service Quality Management System (SQMS) 14 to Service Quality Monitoring and Reporting Module (SQMRM) 12 as a monitoring instruction message 24 instructing the Service Quality Monitoring and Reporting Module (SQMRM) 12 to monitor quality of service metrics for at least one service.
- the SERVICE_MONITORING_PARAMETERS message 30 may contain parameters 32 for service metrics of at least one service for which quality of service monitoring is to be carried out, together with generic metric parameters.
- the Service Quality Monitoring and Reporting Module (SQMRM) 12 stores the metric parameters 32 received by the Service Quality Monitoring and Reporting Module (SQMRM) 12 in the metric parameter storage 18 in step 34.
- the metric parameters 32 are used by the Service Quality Monitoring and Reporting Module (SQMRM) 12 in monitoring service sessions of monitored services.
- step 36 a session of a service for which service monitoring has been requested starts and the Service Quality Monitoring and Reporting Module (SQMRM) 12 creates an entry for the service session in the monitored session list in monitored session list storage 20.
- SQMRM Service Quality Monitoring and Reporting Module
- a session record is created for the service session when the start of a session is detected.
- values for service metrics 22 are obtained from terminal information 38, using respective parameters as appropriate, and are stored in the monitored session list storage 20.
- a SERVICE_SESSION_START message 40 containing values of metrics stored in monitored session list storage 20 for that service is sent back to Service Quality Management System (SQMS) 14 from Service Quality Monitoring and Reporting Module (SQMRM) 12 as a quality report message 28.
- SQMS Service Quality Management System
- SQMRM Service Quality Monitoring and Reporting Module
- the SERVICE_SESSION_START message 40 is sent back at the end of the service initiation stage of the service session, and contains values for service metrics for the service initiation stage of the service.
- SERVICE_SESSION_UPDATE messages 42 and 44 containing values of metrics stored in the monitored session list storage 20 for that service, are sent from Service Quality Monitoring and Reporting Module (SQMRM) 12 to Service Quality Management System (SQMS) 14 as quality report messages 28.
- SQMRM Service Quality Monitoring and Reporting Module
- SQMS Service Quality Management System
- the SERVICE_SESSION_UPDATE messages 42 and 44 are sent in response to a session event detected by the Service Quality Monitoring and Reporting Module (SQMRM) 12 at step 46 and step 48 respectively, as will be described in more detail below.
- a session of a service for which service monitoring has been requested terminates and a SERVICE_SESSION_TERMINATION message 52 is sent back to service quality management system 12 from Service Quality Monitoring and Reporting Module (SQMRM) 12 as a quality report message 28.
- SQMRM Service Quality Monitoring and Reporting Module
- the SERVICE_SESSION_TERMINATION message 52 contains values of metrics stored in the monitored session list storage 20 for that service during the termination stage of the session.
- the metrics and/or the parameters for metrics used during the service initiation stage, the service delivery stage and the service termination stage of the service session may be different from each other. This enables the service session monitoring to be adapted precisely to the different monitoring requirements in the different stages of a service session.
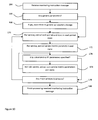
- step 54 a service monitoring request to perform service monitoring of a service and at least one subservice associated with the service is received.
- step 56 terminal operational information is monitored during operation of the service.
- step 58 at least one value for service monitoring metrics and/or sub-service monitoring metrics derived from the terminal operational information is recorded.
- step 60 one or more service monitoring reports 28 are sent in respect of a service, wherein service monitoring metric values and sub-service monitoring metric values within the or each service monitoring report are relationally organised reflecting the association between the sub-service and the service.
- Service Quality Monitoring and Reporting Module (SQMRM) 12 An exemplary embodiment implementation of the Service Quality Monitoring and Reporting Module (SQMRM) 12 will now be described with reference to Figures 8-11 .
- the quality monitoring of a single service by the Service Quality Monitoring and Reporting Module (SQMRM) 12 is described for simplicity.
- quality of service monitoring for a plurality of services is possible, as is clear from the above description.
- One way this can be achieved is with the embodiment described later with reference to Figures 12 and 13 .
- the skilled person will be able easily to apply the principles of service quality monitoring described herein to the quality of service monitoring of a plurality of services.
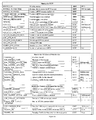
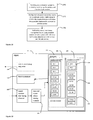
- FIG 8 shows an exemplary implementation of a Service Quality Monitoring and Reporting Module (SQMRM) 12; a metric parameter store 62, which may be stored in the metric parameter storage 18; and a monitored session list 64, which may be stored in the monitored session list storage 20.
- SQLRM Service Quality Monitoring and Reporting Module
- Metric parameter store 62 stores the parameters for the service monitoring operation carried out by Service Quality Monitoring and Reporting Module (SQMRM) 12.
- SQMRM Service Quality Monitoring and Reporting Module
- the parameters stored in metric parameter store 62 are:
- a respective service metric parameter set for each other service is also stored in metric parameter storage 62. This is shown in Figure 8 by a service metric parameter set for service n 74 shown in dashed lines. For clarity, further details of the parameters for additional services have not been shown.
- default parameters that can be set as the parameters for service metrics.
- these default parameters may be set as the parameters for generic metrics, service metrics or sub-service metrics unless the default parameter is over-ridden by a metric parameter received from the Service Quality Management System (SQMS) 14.
- SQLMS Service Quality Management System
- the monitored session list 64 is provided to record values for monitored metrics for an active session of a monitored service, as previously indicated.
- an exemplary session record 74 for session 1of service 1 is shown within the monitored session list storage 64.
- a generic metric record 76 may be provided in some embodiments
- Service metric value record 78 of the session record 74 is provided to store values for the metrics specified for the monitored service, determined according to the service metric parameters stored in the corresponding service metric parameter set 26 in metric parameter store 62.
- the service 1 has at least one sub-service, and a sub-service metric value record 80 stores metric values for this sub-service as a part of the session record 74 within the monitored session list storage 64.
- this sub-service session record 80 is added to the monitored session list 64 when a session of the sub-service is initiated.
- the sub-service metric value record 80 may remain in the session record 74 until the service session is terminated.
- the sub-service session record 80 is deleted when the sub-service session is terminated.
- the monitored session list 64 will have a session record 74 for every active session of a monitored service.
- service quality monitoring and reporting module (SQMRM) 12 has a receiver module 82, which is arranged to receive monitoring instruction message 24 and is operable to store metric parameters obtained from the monitoring instruction message 24 in the metric parameter store 62, as will be explained in more detail with reference to Figure 9 and Figure 10 .
- service quality monitoring and reporting module (SQMRM) 12 has monitor module 84 operable to monitor sessions of a service or sub-service for which monitoring is required, as will be explained in more detail with reference to Figure 9 .
- the monitor module 84 monitors the operation of the service to determine the occurrence of a service session event, as will be explained in more detail below.
- monitor module 84 is coupled to metric parameter store 62 to access metric parameters 70,72 for services and sub services that are being monitored.
- monitor module 84 is coupled to terminal information 86 to monitor services operating on the terminal 10.
- the monitor module 84 may monitor services operating on the terminal in a number of different ways, as will be apparent to a skilled person. In particular, if the terminal 10 supports event-based processing the monitor module 84 can use event-based processing to monitor service activity in the terminal 10. In some embodiments the monitor module 84 may intercept packets sent to or from services running on the terminal 10 in order to monitor the services running on terminal 10. In addition some monitoring may involve the use of terminal service information supplied from terminal information store 16 to the monitoring module 84.
- the service quality monitoring and reporting module (SQMRM) 12 is provided with a record manager module 88 for managing the monitored session list 64.
- the record manager module 88 is coupled to the monitor module 84 to receive notification from the record manager module 88 of the occurrence of a service session event and the record management module 88 operates to manage the monitored session list 64 in response to the notified session events.
- the record manager module 88 has three functional elements for managing the monitored session list 64, namely: a create element 90; a delete element 92 and an update element 94.
- the create element 90 operates to create a new entry in the monitored session list 64 in response to notification of the start of a new service session or new sub-service session.
- a service session record 74 is created in the monitored session list 64 to record values for the metrics for that service in a session in service metric value record 78 and, if applicable, the values for the metrics for a sub-service in a sub-service session sub-service metric value record 80.
- the metrics for which values are recorded in service session records service metric value record 78 and metrics for which values are recorded in sub-service session records sub-service metric value record 80 will correspond respectively to the metrics identified by service metric parameters 70 and sub-service metric parameters 72 in the service 1 metric parameter record 26 in the metric parameter store 62.
- the create element 90 operates to create a generic values record to store values for generic metrics.
- the delete element 92 operates to delete a service session record 74 in the monitored session list 64 in response to notification of the termination of the service session from the monitoring module 84.
- sub-service session records 80 may be deleted in response to notification of the termination of the sub-service session received from the monitoring module 84.
- a record of terminated service or sub-service sessions may be kept in memory for a period of time if memory is available.
- the update element 94 operates to update the metric values stored in a service session metric record 74 in the monitored session list 64 in response to a notification of the occurrence of a session metric update event received from the monitoring module 84.
- the update element 94 is operatively coupled to the terminal information 86 to obtain values for the service and/or sub-service metrics, and stores these values in the service metric value record 78 and sub-service metric value record 80 of the session record 74.
- the update element 94 also operates to update metric values in the generic metric value record 76.
- the update element 94 is operatively coupled to the terminal information 86 to obtain values for the generic metric values.
- Generic metrics that may be used in some embodiments are exemplified by but not limited to: terminal information such as make/model/manufacturer; absolute statistics on delay/latency/jitter/throughput; temperature; CPU load; memory usage.
- the update element 94 may also maintain a state indication (not shown explicitly in Figure 8 ) for a metric value record indicating whether the record is an active record, which is to be updated, or whether the record is terminated, in which case the record is not to be updated.
- values for a metric are recorded over a period of time prior to being sent in a service quality monitoring message 24.
- values for each metric at a plurality of different times may be recorded separately in the session record 74.
- the plurality of values for the same metric may be preprocessed, prior to being stored.
- pre-processing of the metric values is carried out by the update element 94 of the record manager module 88 and may involve accessing the stored values of metrics in order to combine stored metric values with newly obtained metric values. For example, in some cases the average value of a plurality of values for a metric taken at different times might be determined and then recorded in the session record by the update element 94.
- the service quality monitoring and reporting module (SQMRM) 12 is also provided with a reporter module 96, for sending reports 24 containing the stored values service session metrics.
- the reports might be sent to the service quality monitoring and reporting module (SQMS) 14 that instructed the monitoring of the service.
- the reports may be sent to any service monitoring entity.
- the service monitoring entity to which to send the service monitoring reports 24 are to be sent is specified in the received monitoring instruction message 24 relating to that service.
- the reporter module 96 is coupled to the monitor module 84 to receive a notification message 98 from the monitor module 84.
- the notification message 98 may relate to the occurrence of notifiable session events, such as the determination of a transition between the session stages that trigger the sending of a monitoring report message in some embodiments.
- the reporter module 96 is operable to send a service monitoring report 24 in response to notification of a session event.
- the reporter module 96 may be operable to send a service monitoring report 24 in response to the notifications of the end of: the service initiation stage 4 of the session; the service delivery stage 6 of the session; the service termination stage 8 of the session.
- the notification message 98 may alternatively or additionally relate to a notifiable service event, such as the start or termination of the service session; the elapse of a wait period; crossing a threshold set for a monitored metric; or the start or termination of a sub-service session in those embodiments with sub-services that will be discussed in more detail below.
- a notifiable service event such as the start or termination of the service session; the elapse of a wait period; crossing a threshold set for a monitored metric; or the start or termination of a sub-service session in those embodiments with sub-services that will be discussed in more detail below.
- the reporter module 96 may be operable to send a service monitoring report 24 in response to notification message 98 relating to the expiry of a service wait period for a service, as defined by a wait parameter 68 for the service.
- the reporter module 96 may be operable to send a service monitoring report 24 in response to a notification message 98 relating to the start or end of a sub-service session within the monitored service session.
- the reporter module 96 may be operable to send a service monitoring report 24 in response to a notification message 98 relating to the crossing by the value of a monitored metric of a threshold set for that metric, as defined by a threshold parameter for that metric stored in 70 or 72.
- a service monitoring report 24 for a service is sent in response to an update of the metric values in the service session record 74 in the monitored session list storage 64.
- the reporter module 96 may therefore be coupled to the update element 94 to receive a notification message 100 informing the reporter module 96 of the completion of an update of the values for service metrics in the service session record 74.
- the reporter module 96 is operable to send a service monitoring report 24 with the service session metric values on receipt of the notification of completion of an update.
- the service monitoring report 24 contains values for metrics for at least one service session.
- the reporter module 96 is coupled to the monitored session list 64 to obtain values for metrics 78 relating to a monitored service session.
- the reporter module 96 obtains metric values from the service metric value record 78 and from the sub-service metric value record 80 to form a service monitoring report 24.
- values for a metric are recorded over time prior to being sent in a service monitoring message 24
- values for each metric at a plurality of different times may be recorded separately in the session record 74 and all recorded metric values may be sent in a single report message 24.
- the plurality of values for the same metric may be preprocessed prior to being sent in the service monitoring message 24 by the reporter module 96.
- the average value of a plurality of values for a metric taken at different times might be determined by the reporter module 96, and only the average metric value sent in the service monitoring message 24.
- the service monitoring reports 24 may contain values for generic metrics. Therefore, the reporter module 96 is also coupled to the generic metric value record 76 to obtain values for generic metrics to be included in the service monitoring report 24.
- the generic metric information is obtained from the terminal information 38 and may in some embodiments relate to one or more of: report id; session id; report type; time stamp; location; terminal id; terminal address; terminal type; terminal name; user id; user name; access network id; result (of termination); error code; error message; trigger event.
- generic metric information such as a result of termination/error code/error message is generated by the monitor module 84 and may be supplied direct to the reporter module 96 or may be supplied to the record management module 88 for storing in the generic metric value record 76 relating to the respective update of the service.
- a service monitoring report 24 sent to a monitoring entity such as a Service Quality Management System (SQMS) 14, relates to values for service metrics for a single service, together with values for service metrics for any sub-services of the service.
- the reporter module 96 sends a service monitoring report 24 containing service metric values for more than one service.
- an indication of the number of different services for which metrics are included in a report may also be indicated, for example in the generic metrics section, of a service monitoring report 24.
- the reporter module 96 can add this generic metric value itself.
- the functional modules shown within the Service Quality Monitoring and Reporting Module (SQMRM) 12 in Figure 8 may be implemented in a computer software program running on a suitable processing device, in which the program flow and/or sub-routine calls may provide the described functionality without explicit couplings between the sub-routines.
- SQLRM Service Quality Monitoring and Reporting Module
- the method of Figure 9 applies to the monitoring of a single service, Service 1, and assumes that service 1 is not active, and so no sessions of service 1 are running, when the monitoring of Service1 is requested.
- the method of Figure 9 may be carried out by the service quality monitoring and reporting module (SQMRM) 12 in respect of a number of different services simultaneously, as will be apparent to a skilled person, and the simultaneous monitoring of more than one service will be described in more detail later.
- SQLRM service quality monitoring and reporting module
- step 102 of the exemplary method shown in Figure 9 no monitoring of the service, Service1, has been requested and no session of service 1 is running.
- thresholds and other parameters for service quality supervision for supervision of service quality metrics are received. These received thresholds and other parameters for service quality supervision may be stored ready for use during service supervision.
- the receiver module 82 receives a monitoring instruction message 24, and extracts metric parameters from the monitoring instruction message 24.
- the receive parameter module 82 stores received generic metric parameters in generic metric parameters store 62, and stores received metric parameters relating to Service1 in service metric parameter record 26 .
- step 106 of the exemplary method shown in Figure 9 activity on the terminal 10 is monitored to determine the start of a service session of Service1 for which monitoring has been instructed.
- the monitoring module 84 may monitor the terminal operation in order to detect the start of a session of service 1, for which monitoring has been instructed.
- the monitoring of the terminal operation in order to detect the start of a service session may be achieved by enabling the monitoring module 84 to monitor the terminal operating system.
- the monitoring module 84 and monitors the resource usage of the process that is running a session, for example the application client. This method is more suited to detection of service session rather than the detection of sub-service sessions.
- the monitoring of the terminal operation in order to detect the start of a session of service 1, for which monitoring has been instructed may be achieved by the implementation of the Service Quality Monitoring and Reporting Module (SQMRM) 12 internally within a service application client.
- the service application client can inform the Service Quality Monitoring and Reporting Module (SQMRM) 12 when a service session or a sub-service session initiation or termination event occurs.
- the monitoring of the terminal operation in order to detect the start of service session may be achieved by the use of a separate Service Quality Monitoring and Reporting Module (SQMRM) 12 that is able to connect to the service application client over an API (Application programming interface) or other interface.
- the service application client can inform the Service Quality Monitoring and Reporting Module (SQMRM) 12 when a service session or a sub-service session initiation or termination event occurs.
- SQMRM Service Quality Monitoring and Reporting Module
- the monitoring of the terminal operation in order to detect the start of a service session for some application clients may be achieved by the use of a plug-in for the browser implementing the functionality of the Service Quality Monitoring and Reporting Module (SQMRM) 12.
- SQLRM Service Quality Monitoring and Reporting Module
- step 108 of the exemplary method shown in Figure 9 a new service session is detected.
- the detection of the start of the service session may be accomplished in a variety of different ways in accordance with different embodiments, as set out above.
- step 110 of the exemplary method shown in Figure 9 the new service session is added to the monitored session list.
- step 110 the monitor module 84 notifies the create element 90 of the new session for monitored service 1 and the create element 90 adds the service 1 session to the monitored session list 64.
- a session record 74 is created for storing monitored metric values for service 1.
- step 112 of the exemplary method shown in Figure 9 values for at least the metrics specified for the service on the monitored session list are recorded.
- values for quality metrics for all services and sub services being monitored simultaneously are recorded in the respective session records in the monitored session list.
- the update element 94 identifies values for the service metrics specified to be monitored for service 1 from the terminal information 86 and obtains the respective metric values from the terminal information 86 and stores the service metrics values in service metric value record 78.
- step 114 of the exemplary method shown in Figure 9 it is determined whether the service initiation stage of the session has been complete.
- the determination of whether the service initiation stage of the session has been complete may be accomplished in a variety of different ways in accordance with different embodiments.
- the monitor module 84 monitors the terminal information 86/ terminal events/ to determine whether the session initiation stage 4 of the session is complete, and sends a notification message 98 to the reporter module 96. While the service initiation stage of the service session is not yet complete, step 114-no, the values for the metrics may be recorded one or more times in step 112.
- a report containing the recorded values for the metrics may be sent after each step of recording values for the metrics in step 112.
- a set of recorded values may be recorded at a plurality of time intervals, and sent in a single service session start report, as will be seen from a consideration of steps 114 and 116.
- the period between each step of recording values for the metrics in step 112 may be a default value, or may be instructed by the monitoring entity service quality management system (SQMS) 14. In embodiments of the invention this may be achieved by the use of a field in the monitoring instruction message 24, for example one of the metricN_parameter of the exemplary monitoring instruction message 24 shown in Figure 3 , being used to specify different reporting or recording periods.
- SQLMS monitoring entity service quality management system
- a service session start report may be sent, step 116 of the exemplary method shown in Figure 9 .
- the service start report contains one or more sets of metric values for the service session recorded in step 112, or may contain values reflecting averaged values recorded for the metrics over the service initiation stage of the session as previously discussed.
- the reporter module 96 in response to the notification message 98 received from the monitor module 84, the reporter module 96 prepares and sends a service session start report message 24 with the metric value sets stored in service metric value record 78 and the generic metrics.
- the service After the completion of the service initiation stage, the service enters the service delivery stage.
- the service In the service delivery stage of the service session, the service is monitored to determine the following session events:
- the monitoring module 84 monitors the operation of service 1 using the terminal information 86 and parameters stored in service metric parameter record 26 to determine session events in the service delivery stage 6 of the service session.
- different parameters of the metrics and/or a different set of metrics may be used in the service delivery stage.
- a new sub-service session may be initiated, for example if a new website is accessed via a browser.
- the start of the new sub-service session is detected in step 118 of the exemplary method shown in Figure 9 .
- the start of the new sub-service session is detected by the monitor module 84, by one of the variety of methods outlined above.
- the monitor module 84 notifies the record manager 88 of the new sub-service session with a service event notification.
- the sub-service session is added to the monitored session list, in step 130 of the exemplary method shown in Figure 9 .
- the create element 90 receives a notification from the monitoring module 84 of the start of the new sub-session and the create element 90 creates a sub-service record 80 in the session record 74 in response to the start of the sub-service notified by the monitoring module 84 to the create element 90.
- Step 130 is not necessary in all embodiments, and is therefore shown in dashed lines.
- a sub service relates to access to a particular URL or website.
- a web browser session a user may access a URL or web site address on more than one occasion.
- the record manager module 88 is also operable to distinguish between active sub-service metric record for a current sub-service session and inactive sub-service metric record for a sub-service session that has been previously terminated. This could be achieved using a state indication on the service session or sub-session record that can be updated by the Service Quality Monitoring and Reporting Module (SQMRM) 12 after the record has been stored.
- SQMRM Service Quality Monitoring and Reporting Module
- the sub-service metric value record 80 for that sub-service can be re-activated, for example by the create element 90 and the re-activated sub-service metric value record 80 used by the update element 94 to store the values for sub-service metrics.
- step 132 of the exemplary method shown in Figure 9 values for at least the sub-service metrics as defined in the sub-service session record in the monitored session list are stored. In some embodiments, values for the quality metrics for a corresponding service are also recorded in step 132. In some embodiments values for quality metrics for all services and sub services being monitored simultaneously are recorded in the respective session records in the monitored session list.
- the update element 94 identifies values for the sub-service metrics specified to be monitored for the sub-service from the terminal information 86 and obtains the metric values for those metrics from the terminal information 86 and stores the service metrics values in sub-service metric value record 80.
- the values for quality metrics of the sub-service are recorded for the session initiation stage of the sub-service session, and the end of the session initiation stage of the sub-service session is monitored in step 134 of the exemplary method shown in Figure 9 .
- the values for the metrics may be recorded once or a number of times, in step 132.
- the monitor module 84 monitors the terminal information 86 and/or terminal events to determine whether the session initiation stage 4 of the sub-service session is complete, and sends a service event notification message 98 to the reporter module 96 in response to a positive determination.
- a report containing the recorded metric values may be sent after each step of recording values for the metrics in step 132.
- a set of recorded values may be recorded at a plurality of time intervals, and sent in a single service session start report, as will be seen from a consideration of steps 134 and 136.
- the period between each step of recording values for the metrics in step 132 may be a default value, or may be instructed by the monitoring entity service quality management system (SQMS) 14
- SQL monitoring entity service quality management system
- this may be achieved by the use of a field in the monitoring instruction message 24, for example one of the metricN_parameter of the exemplary monitoring instruction message 24 shown in Figure 3 , being used to specify different reporting or recording periods.
- the update element 94 may send a notification 100 to the reporter module 96 when update of the session record 74 is complete.
- the reporter module 96 prepares and sends a service session update report message 24 with at least the metric value sets stored in sub-service metric value record 80 and the generic metrics stored in generic metric value record 76.
- a service session update report can be sent.
- the service session update report may contain one or more sets of metric values recorded in step 132, or may contain values reflecting averaged values recorded for the metrics over the service initiation stage of the sub-service session, as previously discussed.
- This step 136 may be omitted in some embodiments and is therefore shown in dashed lines.
- the reporter module 96 in response to the notification message 98 received from the monitor module 84, prepares and sends a service session update report message 24 with at least the metric value sets stored in sub-service metric value record 80 and the generic metrics stored in generic metric value record 76.
- Metric values for the service to which the sub-service is associated may be reported at the same time in some embodiments. In addition metric values for other sub-services associated with the service, and/or other service may also be reported in some embodiments.
- the wait period specified by the wait parameter relating to the service that was received in the service_monitoring_parameters message may expire, step 120 of the exemplary method shown in Figure 9 .
- the wait period counter is reset in step 138 of the exemplary method shown in Figure 9 and the values of quality metrics for at least the service and any sub-services specified on the service record 74 in the monitored session list 64 are recorded in step 140.
- a service session update report is then sent, in step 142.
- steps 120 and 138 are carried out by the monitor module 84. This may be achieved in some embodiments by the monitor module 84 reading the wait parameter value 68 for the monitored service from the service parameter store 26, and using this value to set a counter. Once the period of time specified by the wait period parameter 68 has expired, the monitor module 84 resets the counter with the wait period parameter 68. The monitor module then sends a service event notification or instruction to the record manager 88 in response to which the record manager 88 updates the service session record for the monitored service session 74.
- the record manager update element 94 identifies values for the metrics specified to be monitored for the service and any active sub-services from the terminal information 86 and obtains the metric values from the terminal information 86 and stores the service metrics values in service metric value record 78 and sub-service metric values in sub-service metric value record 80.
- the update element 94 may send a notification 100 to the reporter module 96 when update of the session record 74 is complete.
- the reporter module 96 prepares and sends a service session update report message 24 with at least the metric value sets stored in sub-service metric value record 80 and the generic metrics stored in generic metric value record 76.
- the value of a service quality metric may fall below a threshold set for that metric, step 122, or may exceed a service quality metric threshold, step 124 of the exemplary method shown in Figure 9 .
- the threshold may be a default value, or in some embodiments the threshold for the parameter may have been received with the monitoring instruction message 24. In either case, the values of quality metrics on the monitored session list are recorded in step 144. In some embodiments, a service session update report is sent, step 146. Thereafter, the service session monitoring continues.
- steps 122 or 124 are carried out by the monitor module 84. This may be achieved in some embodiments by the monitor module 84 reading the threshold parameter values for monitored service metrics or sub-service metrics, if applicable, from the service parameter store 26. During the service session monitoring, the values of the metrics for which a threshold is set are compared with the respective threshold. If the value of a metric crosses a monitored threshold, the monitor module 84 sends an instruction to the record manager 88 to update the service session record for the monitored service session 74.
- the record manager update element 94 identifies values for the metrics specified to be monitored for the service and any active sub-services from the terminal information 86 and obtains the metric values from the terminal information 86 and stores the service metrics values in service metric value record 78 and sub-service metric values in sub-service metric value record 80.
- the update element 94 may send a notification 100 to the reporter module 96 when update of the session record 74 is complete.
- the reporter module 96 prepares and sends a service session update report message 24 with at least the metric value sets stored in sub-service metric value record 80 and the and the generic metrics stored in generic metric value record 76.
- the recorded metric values are sent later, and the step of sending a service session update report is shown in dashed lines.
- an existing sub-service session may terminate, as shown in step 126 of the exemplary method shown in Figure 9 .
- the termination of the sub-service session is detected by monitor module 84.
- the monitor module 84 notifies the record manager 88 of the termination of the sub-service session with a session event notification.
- step 126 the values for metrics are recorded during the termination of the sub-service in 148 until the sub-service termination stage is complete, step 150.
- step 150 the values for metrics are recorded during the termination of the sub-service in 148 until the sub-service termination stage is complete.
- one or a number of different sets of values for quality metrics in the monitored session list may be recorded.
- one or more service session update messages may be sent step 148 during the sub-service termination stage.
- step 148 of the exemplary method shown in Figure 9 values for at least the sub-service metrics as defined in the sub-service session record in the monitored session list are stored. In some embodiments, values for the quality metrics for a corresponding service are also recorded in step 148. In some embodiments values for quality metrics for all services and sub services being monitored simultaneously are recorded in the respective session records in the monitored session list.
- the update element 94 in response to the notification of sub-service termination, identifies values for the sub-service metrics specified to be monitored for the sub-service from the terminal information 86 and obtains the metric values for those metrics from the terminal information 86 and stores the service metrics values in sub-service metric value record 80.
- the values for quality metrics of the sub-service are recorded during the session termination stage of the sub-service session, and the end of the session termination stage of the sub-service session is monitored in step 150 of the exemplary method shown in Figure 9 .
- the values for the metrics may be recorded once or a number of times, in step 148.
- the monitor module 84 monitors the terminal information 86 and/or session events to determine whether the session termination stage 4 of the sub-service session is complete. In some embodiments for example where the step 148 is executed a number of times, the monitor module 84 may send a sub-service session termination notification message to the record manager module 88 in response to a positive determination. In response, the update element 94 stops updating the record.
- a report containing the recorded metric values may be sent after each step of recording values for the metrics, as shown in step 154.
- a set of recorded values may be recorded at a plurality of time intervals, and sent in a single service session update report, as will be seen from a consideration of steps 150 and 152.
- the period between each step of recording values for the metrics in step 148 may be a default value, or may be instructed by the monitoring entity service quality management system (SQMS) 14
- SQL monitoring entity service quality management system
- this may be achieved by the use of a field in the monitoring instruction message 24, for example one of the metricN_parameter of the exemplary monitoring instruction message 24 shown in Figure 3 , being used to specify different reporting or recording periods.
- step 150-yes in some embodiments as shown in step 152 of the exemplary method shown in Figure 9 a service session update report can be sent.
- the service session update report may contain one or more sets of metric values recorded in step 148, or may contain values reflecting averaged values recorded for the metrics over the service initiation stage of the sub-service session, as previously discussed.
- This step 152 may be omitted in some embodiments and is therefore shown in dashed lines.
- the update element 94 sends a notification 100 to the reporter module 96 when update of the session record 74 is complete.
- the reporter module 96 prepares and sends a service session update report message 24 with at least the metric value sets stored in sub-service metric value record 80 and the generic metrics stored in generic metric value record 76..
- the sub-service record in the monitored session list may be deleted, step 154 as shown in dashed lines in Figure 9 .
- the sub-service record is not deleted, but is not updated after the end of the sub-service session, for example because the sub-service session status is marked as "terminated”.
- the delete element 92 deletes the sub-service session record 80 once the reporter module 96 has sent the service session update report message 24 with at least the metric value sets stored in sub-service metric value record 80.
- the termination of the service session may be determined, step 128 of the exemplary method shown in Figure 9 .
- the termination of the sub-service session is detected by monitor module 84.
- the monitor module 84 notifies the record manager 88 of the termination of the sub-service session with session event notification.
- step 128 the values for metrics are recorded during the termination of the sub-service in step 156 until the service termination stage is complete, step 158.
- step 158 the values for metrics are recorded during the termination of the sub-service in step 156 until the service termination stage is complete, step 158.
- one or a number of different sets of values for quality metrics in the monitored session list may be recorded.
- one or more service session update messages may be sent during step 156 during the sub-service termination stage.
- step 156 of the exemplary method shown in Figure 9 values for the service metrics as defined in the service metric value record 74 in the monitored session list 40 are stored. In some embodiments values for quality metrics for all services and sub services being monitored simultaneously are recorded in the respective session records in the monitored session list.
- the update element 94 in response to the notification of service termination, identifies values for the service metrics specified to be monitored for the service from the terminal information 86 and obtains the respective metric values for those metrics from the terminal information 86 and stores the service metrics values in service metric value record 74.
- the parameters for the metrics and/or the metrics themselves used during the termination phase may be different from the metrics and/or parameters used during the service delivery stage of the session.
- the values for quality metrics of the service are recorded during the session termination stage of the service session, and the end of the session termination stage of the sub-service session is monitored in step 158 of the exemplary method shown in Figure 9 .
- the values for the metrics may be recorded once or a number of times, in step 156.
- the monitor module 84 monitors the terminal information 86 and/or terminal events to determine whether the session termination stage 8 of the service session is complete.
- the monitor module 84 may send a service session termination notification message to the record manager module 88 in response to a positive determination by the monitor module 84 of the termination of the service session.
- the update element 94 stops updating the record.
- a service session termination report is sent as shown in step 160 of the exemplary method shown in Figure 9 .
- the service session termination report may contain one or more sets of metric values recorded during the termination stage of the session in step 156, or may contain values reflecting averaged values recorded for the metrics over the service termination stage of the sub-service session, as previously discussed.
- the update element 94 sends a notification 100 to the reporter module 96 when update of the session record 74 is complete.
- the reporter module 96 prepares and sends a service session termination report message 24 with the metric value sets stored in service record 74 and the generic metrics stored in generic metric value record 76.
- the service session, and any associated sub-service session records may be deleted from the monitored session list.
- the service session record is not deleted, but is not updated after the end of the service session.
- the delete element 92 deletes the service session record 78 once the reporter module 96 has sent a service session termination report message 24 with at least the metric value sets stored in service metric value record 74.
- Figure 10 illustrates an exemplary method of extracting parameter metrics from a monitoring instruction message 24 in accordance with one embodiment. This exemplary method may be carried out by receiver module 82 shown in Figure 8 .
- step 164 a monitoring instruction message 24 is received.
- step 166 it is determined whether any generic parameters are specified in the received monitoring instruction message 24. This may be done by parsing the received message in some embodiments, or by using any suitable parameter recognition technique.
- step 166-yes the generic parameters are extracted from the monitoring instruction message 24 and are stored in a generic parameter storage area for Service1, in step 168.
- a wait period parameter is extracted from the monitoring instruction message 24 and is stored in service metric parameter storage for Service1.
- the wait period parameter defines a period after which values of the service metrics should be recorded and reported.
- the wait period parameter for a service therefore specifies the maximum time that may elapse between service metric reports for a service being sent. It is envisaged that services will generally have a wait period parameter: however a wait parameter may be omitted for some embodiments, in which case step 170 may be omitted.
- step 172 the service metric parameters for Service 1 are extracted from the received monitoring instruction message 24 and are stored in service metric parameter storage for Service1. These are service metric parameters 70 in the exemplary embodiment shown in Figure 8 .
- less than a full set, or even no parameters for a particular metric are included in the monitoring instruction message 24. In this case, in some embodiments default values are used for the parameters.
- only the metrics specified on the monitoring instruction message 24 are measured by the Service Quality Monitoring and Reporting Module (SQMRM) 12 and used for service quality evaluation for the service.
- SQMRM Service Quality Monitoring and Reporting Module
- default metrics that are not specifically included in the monitoring instruction message 24 are measured and reported in addition to any metrics or any specific parameter values specified in the monitoring instruction message 24.
- step 174 it is determined whether the Service1 has any sub-services metric parameters in the monitoring instruction message 24.
- Service 1 has sub-service metric parameters
- the sub-service metric parameters are extracted from the received monitoring instruction message 24 and are stored in sub-service metric parameter storage for Service1 in step 176.
- Steps 174 and 176 are repeated until the metric parameters for all sub-services of service Service1 have been stored.
- step 174-no Once all the metric parameters for sub-services for Service1 have been stored (step 174-no) or if there were no sub-services of the service being processed, it is determined whether the monitoring instruction message 24 contains metric parameters relating to any more services in step 178. If so, (step 178-yes) the process returns to step 170 to extract the wait period; service metric parameters and then sub-service metric parameters, as appropriate for the or each further service for which metric parameters are included in the monitoring instruction message 24.
- step 178-no the processing of the monitoring instruction message 24 has finished, step 180.
- FIG. 11 An exemplary method for recording values for service session metrics and sub-service session metrics in accordance with one embodiment is shown in Figure 11 .
- This method may be carried out by the create element 90 in the exemplary implementation shown in Figure 8 for example in steps 112, 132, 140, 144, 148, and 156 of the exemplary method shown in Figure 9 .
- Figure 11 shows an exemplary method for recording metric values for the generic metrics and for all service sessions and sub-service sessions currently being monitored. As described above, in some embodiments it is not necessary to record values for all metrics currently being monitored in all sessions, and therefore steps may be omitted from the method of Figure 11 as appropriate, as will be appreciated by a skilled person.
- step 182 of Figure 11 the generic service quality metrics are recorded in generic metric value record 76.
- step 184 the service specific quality metrics are recorded.
- this is achieved by the update element 94 identifying values for the service metrics specified to be monitored for the service from the terminal information 86.
- the update element 94 obtains the metric values D64 for those metrics from the terminal information 86 and stores the metrics values in service session record 74.
- step 186-yes it is determined whether all the sub-services of the service have been processed in step 188. If all sub-services have not been processed (step 188-no), values for the metrics for a sub-service is recorded in step190.
- this is achieved by the update element 94 identifying values for the sub-service metrics specified to be monitored for the service from the terminal information 86.
- the update element 94 obtains the metric values for those metrics from the terminal information 86 and stores the metrics values in service session record 74.
- control returns to steps 186 and step 188 until all the sub-services of that service are processed.
- step 188-yes it is determined whether any other services are to be processed, step 192. If so, control returns to step 184 for recording values for service metrics and sub-service metrics, if applicable, for the further service. Once the service is processed, or all of the services are processed, the metric recording routine finishes.
- IPTV service session record 200 and a web service session record 198 are shown in the monitored session list 64.
- IPTV service session record 200 corresponds to the service session record 74 shown in Figure 8 .
- IPTV service metric record 202 corresponding to the service metric value record 78 shown in Figure 8 , stores values for IPTV service session metrics.
- TV1 sub-service record 206 corresponding to the sub-service metric value record 80 shown in Figure 8 , stores values for TV1 sub-service session metrics.
- COD sub-service record 208 corresponding to the sub-service metric value record 80 shown in Figure 8 , stores values for the COD sub-service session metrics.
- the service metrics and sub-service metrics used for the IPTV service session record 200 are as shown in Figure 5a , and therefore will not be explained in more detail.
- the web service session record 198 corresponds to the service session record 74 shown in Figure 8 .
- Web service metric record 210 corresponding to the service metric value record 78 shown in Figure 8 , stores values for web service session metrics.
- WS1 sub-service record 212 corresponding to the sub-service metric value record 80 shown in Figure 8 , stores values for WS1 sub-service session metrics.
- WS2 sub-service record 214 corresponding to the sub-service metric value record 80 shown in Figure 8 , stores values for the WS2 sub-service session metrics.
- the service metrics and sub-service metrics used for the web service session record 198 are as shown in Figure 5b , and therefore will not be explained in more detail.
- Event Action taken by SQMRM (step numbering as per Figure 9 ) Report message 1.Receive message instructing monitoring of IPTV service and web browsing service Store, step 104, IPTV metric parameters and web browsing metric parameter in parameter memory . None Start monitoring, step 106, for initiation of an IPTV session or a web browsing session 2.
- IPTV session - channel TV1 starts 108 -new IPTV service session start detected 110 - add IPTV service session to monitored session list
- Send IPTV session start report containing metric values stored during 112 112 & 114 - during IPTV session initiation stage, record values for IPTV metrics for IPTV session in monitored session list 116 - send IPTV session start report containing IPTV session initiation stage metric values, once IPTV session initiation stage complete 118 - TV1 sub-service session detected 130 - add TV1 sub-service session to IPTV session in monitored session list
- Open web site 1 again 118 - WS1 sub-service session detected Send web service session update report containing metric values stored during 132 130 -re-activate WS1 sub-service session in web service session in monitored session list 132 & 134 - during WS1 session initiation stage, record values for WS1 metrics for WS1 sub-service session in monitored session list 136 - send web service session update report containing WS1 sub-service session initiation stage metric values, once WS1 session initiation stage complete 8.
- WB1 service quality metric drops below threshold 122 - WB1 sub-service metric value crossing threshold event detected Send web service session update report containing metrics stored in 144 144 - record WB1 sub-service session quality metrics on monitored session list 146 - send web service session update report containing WS1 sub-service session metric values 12.
- WB1 service quality metric exceeds threshold 122 - WB1 sub-service metric value crossing threshold event detected Send web service session update report containing metrics stored in 144 144 - record WB1 sub-service session quality metrics on monitored session list 146 - send web service session update report containing WS1 sub-service session metric values 13.
- the service quality monitoring and reporting module (SQMRM) 12 is not located with or in the terminal 10 but instead is located in another network node.
- the service quality monitoring and reporting module (SQMRM) 12 in this situation acts as a proxy or an agent in monitoring service activity in the terminal.
- FIG 13 shows an outline block diagram illustrating a service quality monitoring and reporting module (SQMRM) acting as a proxy or as an agent. Elements that are the same as elements in Figure 2 have been given the same reference numerals.
- SQLRM service quality monitoring and reporting module
- the service quality monitoring and reporting module (SQMRM) 12 is not located in the terminal 220 In this case, the service quality monitoring and reporting module (SQMRM) 12 acts as an agent handling service quality reporting for the terminal 220.
- the service quality monitoring and reporting module (SQMRM) 12 may be located in another network node and may be used to perform service quality monitoring for a number of different terminals, and/or for a number of different services on the different terminals.
- a service quality monitoring and reporting module (SQMRM) 12 running in a home gateway may act as an agent for all computers or other terminals within a home area network.
- the service quality monitoring and reporting module (SQMRM) 12 acts as an agent to translate requests to that method and to translate reports from that method.
- the terminals may not support service quality reporting, the service quality monitoring and reporting module (SQMRM) 12 implement service quality reporting using methods such as packet inspection.
- SQMRM service quality monitoring and reporting module
- the Service Quality Monitoring and Reporting Module (SQMRM) 12 is also provided with a metric parameter storage 18, for storing generic metric parameters and for storing service metric parameters for the or each service that the Service Quality Monitoring and Reporting Module (SQMRM) 12 has received instructions to monitor.
- the Service Quality Monitoring and Reporting Module (SQMRM) 12 is also provided with a monitored session list storage 20, for storing a monitored session list identifying all active sessions of services for which monitoring instructions have been received by the Service Quality Monitoring and Reporting Module (SQMRM) 12.
- the metric parameter storage 18 and the monitored session list storage 20 may be part of the memory of the node to which the Service Quality Monitoring and Reporting Module (SQMRM) 12 is attached, while in other embodiments the Service Quality Monitoring and Reporting Module (SQMRM) 12 may be provided with its own memory.
- SQMRM Service Quality Monitoring and Reporting Module
- the Service Quality Monitoring and Reporting Module (SQMRM) 12 is coupled directly or indirectly via other network elements (not shown) to a Service Quality Management System (SQMS) 14 to receive a monitoring instruction message 24.
- the Service Quality Monitoring and Reporting Module (SQMRM) 12 is also coupled directly or indirectly via other network elements (not shown) to the Service Quality Management System (SQMS) 14 to return quality report message 28 to the Service Quality Management System (SQMS) 14.
- the terminal 220 in the embodiment shown in Figure 13 is provided with a terminal measurement control element 222 as well as the terminal information store 16.
- the service quality monitoring and reporting module (SQMRM) 12 is coupled to send monitoring instructions and to receive measurement reports from the terminal measurement control function 222 of the terminal 220.
- the service quality monitoring and reporting module (SQMRM) 12 is also coupled to order terminal information from the terminal information store 16 and to receive terminal information from the terminal information store 16.
- FIG. 14 shows a more detailed block diagram illustrating a service quality monitoring and reporting module (SQMRM) 12 for a terminal 220 operating a different quality monitoring system.
- SQLRM service quality monitoring and reporting module
- the service quality monitoring and reporting module (SQMRM) 12 is provided with an external measurement order element 224, which is coupled to the receiver module 82 and to the terminal measurement control element 222.
- the external measurement order element 224 is operable to generate a monitoring instruction message 226 suitable for requesting service quality monitoring from the terminal measurement control element 222.
- the service quality monitoring and reporting module (SQMRM) 12 is provided with an external event translation element 228, which is coupled to the terminal measurement control element 222 and the monitor module 84.
- the external event translation element 228 is operable to receive session event information 230 or other information from the terminal measurement control element 222, and to translate the received event information for monitor module 84.
- the update element 94 of the record manager 88 of the service quality monitoring and reporting module (SQMRM) 12 is provided with a terminal information order element 230, which is operable to generate a request 232 for terminal information 86 from terminal information store and a terminal information transform element 234, which is operable to receive terminal information 86 from terminal information store 16 and transform it so as to be suitable for storing in the monitored session list 64.
- a terminal information order element 230 which is operable to generate a request 232 for terminal information 86 from terminal information store
- a terminal information transform element 234 which is operable to receive terminal information 86 from terminal information store 16 and transform it so as to be suitable for storing in the monitored session list 64.
- the functional modules shown within the Service Quality Monitoring and Reporting Module (SQMRM) 12 in Figure 14 may be implemented in a computer software program running on a suitable processing device, in which the program flow and/or sub-routine calls may provide the described functionality without explicit couplings between the sub-routines.
- SQLRM Service Quality Monitoring and Reporting Module
- the report messages sent from the monitoring entity may be enhanced by intermediate nodes, as illustrated by the arrangement shown in Figures 14 . This may be particularly useful in embodiments in which terminals do not support service metrics, or in embodiments where terminals do not have access to information that might be requested in the monitoring reports. For example, terminals may not have access to location information or subscriber identity information in some embodiments.
- Figure 15 generally corresponds to the arrangement shown in Figure 2 .
- the same or similar elements have been given the same reference numerals, and will not be described further.
- Figure 15 shows an arrangement based on the arrangement shown in Figure 2
- corresponding embodiments implemented in the arrangement shown in Figure 13 would also be possible.
- a Service Quality Enhancement Module (SQEM) 230 is provided that is operable to enhance monitoring report messages 28.
- the service Quality Enhancement Module (SQEM) 230 is arranged to receive and forward monitoring instruction messages 24 being sent to the service quality monitoring and reporting module (SQMRM) 12 from the Service Quality management System (SQMS) 14.
- the service Quality Enhancement Module (SQEM) 230 is arranged to intercept returning monitoring report messages 28 and add any requested information that is available to the service Quality Enhancement Module (SQEM) 230 but that is missing from the monitoring report message 28, before forwarding the enhanced monitoring report message 232 to the Service Quality management System (SQMS) 14.
- the Service Quality Enhancement Module (SQEM) 230 may run on a node such as an Auto-Configuration Server (ACS) and may have information on the subscriber that is using a terminal, or on the geographical location of the terminal.
- ACS Auto-Configuration Server
- Service Quality Enhancement Module (SQEM) 230 may be implemented in the same node as, or as part of, the service quality monitoring and reporting module (SQMRM) 12 acting as a proxy or agent as shown in Figures 13 and 14 .
- FIG. 16 A method of monitoring report message enhancement in accordance with one embodiment is shown in Figure 16 .
- step 234 the Service Quality Enhancement Module (SQEM) 230 receives generic parameters and the service quality parameters from the Service Quality management System (SQMS) 14 in the monitoring instruction message 24.
- SQL Service Quality Enhancement Module
- the Service Quality Enhancement Module (SQEM) 230 then waits for a monitoring report message 28 to arrive in a second step, step 236.
- SQL Service Quality Enhancement Module
- step 238 the Service Quality Enhancement Module (SQEM) 230 examines the fields in the report to determine whether a field having a missing value is present, based on the parameters in the monitoring instruction message 24 received in step 234.
- SQL Service Quality Enhancement Module
- step 238-yes in a fourth step 240 the Service Quality Enhancement Module (SQEM) 230 whether the Service Quality Enhancement Module (SQEM) 230 has the information to set that field. If so, step 240 - yes, the Service Quality Enhancement Module (SQEM) 230 sets the missing value in the field in step 242.
- SQEM Service Quality Enhancement Module
- step 238, step 240 and if possible step 242 are repeated until all fields with missing values have been identified and considered. Once all fields with missing values have been found, step 238 - no, the enhanced monitoring report message 232 can be forwarded on to another Service Quality Enhancement Module (SQEM) 230 or to the Service Quality management System (SQMS) 14 in step 244.
- SQEM Service Quality Enhancement Module
- SQMS Service Quality management System
- the principles of the method described herein may be implemented in many different ways.
- the identified missing values may be added in a single update step after all the missing fields have been identified.
- Service Quality Enhancement Module SQEM 230
- the Service Quality Enhancement Module (SQEM) 230 is provided with:
- Service Quality Enhancement Module (SQEM) 230 These three stores are shown as part of the Service Quality Enhancement Module (SQEM) 230 in the exemplary embodiment. However, in some embodiments these data stores may be provided in the host node to which the Service Quality Enhancement Module (SQEM) 230 is attached, and the Service Quality Enhancement Module (SQEM) 230 merely needs to have access to these data stores.
- SQEM Service Quality Enhancement Module
- data relating to terminals, subscribers or services which may be useful stored in data store 252 must be updated periodically, as will be apparent to a skilled person. In some embodiments this information will be updated as part of the normal operation of the node to which the Service Quality Enhancement Module (SQEM) 230 is attached.
- SQL Service Quality Enhancement Module
- the Service Quality Enhancement Module (SQEM) 230 has an extractor element 256, which is arranged to receive a monitoring instruction message 24 being sent from a Service Quality management System (SQMS) 14 to a service quality monitoring and reporting module (SQMRM) 12.
- the extractor element 256 extracts the parameters for service quality enhancement from the monitoring instruction message 24 and stores the extracted parameters in the metric parameter store 250.
- the extractor element 256 then forwards the monitoring instruction message 24 on towards the service quality monitoring and reporting module (SQMRM) 12.
- Monitoring report messages 28 being sent from the service quality monitoring and reporting module (SQMRM) 12 to the Service Quality management System (SQMS) 14 are stored in the report store 254 as they pass through the network node to which the Service Quality Enhancement Module (SQEM) 230 is attached.
- SQEM Service Quality Enhancement Module
- a detector element 258 is provided to monitor the report store 254 and detect the arrival of a monitoring report message 28, as in step 236 of the method of Figure 16 .
- a missing data identification element 260 is coupled to the detector element 258 to receive notification of a monitoring report message 28.
- the missing data identification element 260 is coupled to the report store 254 to access the stored monitoring report message 28 for a service, and is coupled to the metric parameter store 252 to access the stored parameters for that service.
- the missing data identification element 260 examines the fields in the monitoring report message 28 to determine whether a field having a missing value is present, based on the parameters in the monitoring instruction message 24 received in step 234.
- the service quality monitoring and reporting module (SQMRM) 12 is also provided with an inserter element 262, which is coupled to receive data from the data store 252.
- the inserter element 262 is also coupled to the report store 254, in which the monitoring report message 28 is stored.
- the inserter element 262 is also coupled to receive insertion instructions from the missing data identification element 260.
- the missing data identification element 260 is also coupled to the data store 252. For each field of the monitoring report message having a missing value, the missing data identification element 260 determines whether the data store has the required information to add to that field. If so, the missing data identification element 260 instructs inserter element 262 to insert the appropriate data from the data store 252 into the respective field within the stored monitoring report message 28 to form an enhanced monitoring report message 232.
- the enhanced monitoring report message 232 can be forwarded on to another Service Quality Enhancement Module (SQEM) 230 or to the Service Quality management System (SQMS) 14.
- SQEM Service Quality Enhancement Module
- SQLMS Service Quality management System
- the functional modules shown within the Service Quality Enhancement Module (SQEM) 230 in Figure 17 may be implemented in a computer software program running on a suitable processing device, in which the program flow and/or sub-routine calls may provide the described functionality without explicit couplings between the sub-routines.
- SQL Service Quality Enhancement Module
- the Service Quality management System (SQMS) 14 will now be described with reference to Figures 17 and 18 .
- the Service Quality management System (SQMS) 14 both requests monitoring of the service by issuing a service monitoring instruction message 24 to the service quality monitoring and reporting module (SQMRM) 12 and receives the resulting monitoring report messages from the service quality monitoring and reporting module (SQMRM) 12.
- SQMS Service Quality management System
- the entity instructing the monitoring is the same as the entity receiving the monitoring reports.
- the preliminary steps of creating and sending a suitable service monitoring instruction message 24 are omitted.
- step 272 service monitoring report messages 24 containing metric values for services and associated sub-services, in which the metric values for services and sub-services are relationally organised to reflect the association between the sub-service and the service, are received.
- step 274 the service metric values and sub-service metric values are stored in a relationally organised manner reflecting the association between the sub-service and the service.
- step 276 service monitoring management is performed by analysing the received service monitoring metric values and sub-service monitoring metric values with reference to the association between the service and the sub-service.
- the exemplary embodiment of a Service Quality management System (SQMS) 14 is provided with a service metric value store 280 for storing the service monitoring metric values relating to the operation of a monitored service.
- SQLMS Service Quality management System
- a monitoring report receiver 282 is provided and is coupled to receive monitoring report messages, or enhanced monitoring report messages 232.
- the monitoring report receiver 282 is operable to extract service monitoring metric values from the monitoring report messages, or enhanced monitoring report messages 232.
- a metric values storing element 284 is provided.
- the metric values storing element 284 is coupled to the monitoring report receiver 282 and to the service metric value store 280 and is operable to store the received associated service metric values and sub-service metric values in the service metric value store 280 in a relationally organised manner reflecting the association between the sub-service and the service.
- metric values resulting from the operation of the exemplary embodiment described with reference to Figure 11 are shown as stored in the service metric value store 280.
- a first session record 286 is used for the IPTV service session, and a second session record 288 is used for the web service session that were described with reference to Figure 11 .
- the service metric values are denoted SM -n in both cases, where the number n denotes the nth set of service metric values received in that session.
- the sub-service metric values are denoted SSmMn in both cases, where the number m denotes the sub-service to which the metrics relate, and the number n denotes the nth set of metric values for that sub-service received in that session.
- the received metric values are stored in the service metric value store 280 in a relationally organised manner reflecting the association between the sub-service and the service.
- the service metric value store 280 in a relationally organised manner reflecting the association between the sub-service and the service.
- IPTV service session record 286 A similar arrangement is shown also for the IPTV service session record 286 as will be understood from a consideration of Figure 19 , but labelling of the different metric and submetric records has been omitted for clarity.
- service metric values and sub-service metric values may be stored in a relationally organised manner based on service session stages.
- the service metric value store 280 may be implemented as a relational database, which enables the relationships between different sets of data easy to manage and analyse.
- a records analyser 302 is also provided and is operable to access service metric value store 280 to a perform service monitoring management by analysing the metric values with reference to the relationship between services and sub-services.
- a service monitoring requestor 304 is shown, which is operable to create and send a monitoring instruction message 24.
- Embodiments of the invention provide a new method of and apparatus for service monitoring and a method of and device for service monitoring management. Embodiments may provide one or more of the following advantages:
Landscapes
- Engineering & Computer Science (AREA)
- Computer Networks & Wireless Communication (AREA)
- Signal Processing (AREA)
- Environmental & Geological Engineering (AREA)
- Data Exchanges In Wide-Area Networks (AREA)
- Computer And Data Communications (AREA)
Claims (15)
- Verfahren zur Dienstüberwachung, umfassend die folgenden Schritte:Empfangen (54, 104) einer Dienstüberwachungsanforderung zum Durchführen von Dienstüberwachung mindestens eines Dienstes und mindestens eines mit dem Dienst assoziierten Teildienstes in einem Endgerät, wobei das Verfahren für den oder jeden zu überwachenden Dienst die folgenden Schritte umfasst:Überwachen (56, 108, 114, 128, 118, 120, 122, 124, 126) von Endgeräte-Betriebsinformationen;Aufzeichnen (58, 112, 132, 140, 144, 148, 156) mindestens eines Wertes für eine Dienstüberwachungsmetrik und eine Teildienst-Überwachungsmetrik, der aus den Endgeräte-Betriebsinformationen abgeleitet wird; undSenden (60, 116, 136, 142, 146, 152) eines oder mehrerer Dienstüberwachungsberichte in Bezug auf einen Dienst, wobei Dienstüberwachungsmetrikwerte und Teildienst-Überwachungsmetrikwerte innerhalb des oder jedes Dienstüberwachungsberichts relational organisiert sind und die Assoziation zwischen dem Teildienst und dem Dienst widerspiegeln.
- Verfahren nach Anspruch 1, wobei der Schritt des Aufzeichnens (112, 132, 140, 144, 148, 156) ein Aufzeichnen von Werten für Dienstüberwachungsmetriken in einem Dienstprotokoll für die Dienstüberwachungsmetriken und Aufzeichnen von Werten für Teildienst-Überwachungsmetriken in einem mit dem Dienstprotokoll assoziierten Teildienstprotokoll umfasst.
- Verfahren nach einem der vorhergehenden Ansprüche, wobei der Schritt des Überwachens (108, 128, 118, 120, 122, 124, 126) ferner den Schritt des Bestimmens der Häufigkeit eines Dienstereignisses umfasst, das die Aktualisierung mindestens eines Dienstmetrikwerts oder Teildienst-Metrikwerts erfordert; und im Schritt des Aufzeichnens (112, 132, 140, 144, 148, 156) ein Wert für die mindestens eine Metrik, auf die sich das bestimmte Sitzungsereignis bezieht, aufgezeichnet wird.
- Verfahren nach einem der vorhergehenden Ansprüche, wobei Dienst- und Teildienst-Überwachungsmetrikparameter im Schritt des Überwachens (108, 114, 128, 118, 120, 122, 124, 126) von Endgeräte-Betriebsinformationen zum Bestimmen der Häufigkeit eines Dienstereignisses verwendet werden.
- Verfahren zur Dienstüberwachung nach einem der vorhergehenden Ansprüche, wobei die Dienstüberwachungsmetrikwerte und Teildienst-Überwachungsmetrikwerte innerhalb des oder jedes Dienstüberwachungsberichts (28) aus einer Kombination von jeweiligen gemessenen Metrikwerten gebildet werden.
- Verfahren zur Dienstüberwachung nach einem der vorhergehenden Ansprüche, wobei die Dienstüberwachungsanforderung (24) Parameter zur Messung der Dienstüberwachungsmetriken definiert.
- Verfahren zur Dienstüberwachung nach einem der vorhergehenden Ansprüche, wobei sich die Teildienst-Überwachungsmetrikwerte innerhalb eines Dienstüberwachungsberichts auf Teildienst-Überwachungsmetrikwerte beziehen, die während einer Mehrzahl von Teildienstsitzungen aufgezeichnet werden.
- Verfahren zur Dienstüberwachung nach einem der vorhergehenden Ansprüche, wobei ein empfangener Metrikparameter eine periodische Überwachungswarteperiode definiert, und ein Dienstereignis nach Ablauf einer entsprechenden Warteperiode detektiert wird.
- Vorrichtung zur Dienstüberwachung, umfassend:einen Empfänger (82) zum Empfangen einer Dienstüberwachungsanforderung zum Durchführen von Dienstüberwachung mindestens eines Dienstes und mindestens eines mit dem Dienst assoziierten Teildienstes in einem Endgerät;einen Überwacher (84), der so ausgelegt ist, dass er eine Verbindung mit einem Endgeräte-Betriebsinformationsspeicher (16) herstellt und Endgeräte-Betriebsinformationen (86) im Endgeräte-Betriebsinformationsspeicher (16) überwacht;einen Protokollverwalter (88), der mit dem Überwacher (84) gekoppelt und mit einem Metrikprotokoll (74) gekoppelt und so ausgelegt ist, dass er mindestens einen Wert für eine Dienstüberwachungsmetrik und eine Teildienst-Überwachungsmetrik aufzeichnet, der aus den Endgeräte-Betriebsinformationen (86) im Metrikprotokoll (74) abgeleitet wird; undeinen Berichterstatter (96), der mit dem Metrikprotokoll (74) gekoppelt und so ausgelegt ist, dass er einen oder mehrere Dienstüberwachungsberichte in Bezug auf einen Dienst sendet, wobei Dienstüberwachungsmetrikwerte und Teildienst-Überwachungsmetrikwerte innerhalb des oder jedes Dienstüberwachungsberichts relational organisiert sind und die Assoziation zwischen dem Teildienst und dem Dienst widerspiegeln.
- Vorrichtung nach Anspruch 9, ferner umfassend:einen Fehldaten-Identifikator (260), der mit einem Metrikspeicher gekoppelt ist, der Dienstüberwachungsmetriken für einen Dienst enthält, und mit einem Berichtspeicher gekoppelt ist, der eine Überwachungsberichtnachricht enthält, welche berichtete Dienstüberwachungsmetrikwerte für diesen Dienst enthält, wobei der Fehldaten-Identifikator (260) so ausgelegt ist, dass er Dienstüberwachungsmetriken für einen Dienst und berichtete Dienstüberwachungsmetrikwerte für diesen Dienst vergleicht, um fehlende Dienstüberwachungsmetriken zu identifizieren; undeinen Daten-Inserter (262), der mit dem Fehldaten-Identifikator (260) zum Empfangen von fehlenden Dienstüberwachungsmetrikwertdaten und mit einem Datenspeicher (252) gekoppelt ist, wobei der Daten-Inserter (262) so ausgelegt ist, dass er jegliche verfügbaren fehlenden Dienstüberwachungsmetrikwertdaten, die im Datenspeicher (252) identifiziert werden, in die Überwachungsberichtnachricht einfügt (242).
- Vorrichtung nach Anspruch 10, wobei der Fehldaten-Identifikator (260) mit dem Datenspeicher (252) gekoppelt und so ausgelegt ist, dass er bestimmt, ob ein Wert für die oder jede der fehlenden Dienstüberwachungsmetrik im Datenspeicher (252) verfügbar ist.
- Vorrichtung nach Anspruch 10 oder 11, wobei der Daten-Inserter (262) so ausgelegt ist, dass er bestimmt, ob ein Wert für die oder jede der fehlenden Dienstüberwachungsmetrik im Datenspeicher (252) verfügbar ist.
- Vorrichtung nach einem der Ansprüche 10 bis 12, ferner umfassend einen Extraktor (256), der so ausgelegt ist, dass er Dienstüberwachungsmetrikdaten aus einer Überwachungsanweisungsnachricht für den Dienst extrahiert, und mit dem Dienstüberwachungsmetrikspeicher (250) gekoppelt ist, um die Dienstüberwachungsmetrikdaten im Dienstüberwachungsmetrikspeicher (250) zu speichern.
- Verfahren zur Dienstüberwachungsverwaltung, umfassend die folgenden Schritte:Empfangen (270) eines oder mehrerer Dienstüberwachungsberichte in Bezug auf einen Dienst, wobei Dienstüberwachungsmetrikwerte und Teildienst-Überwachungsmetrikwerte innerhalb des oder jedes Dienstüberwachungsberichts relational organisiert sind, um die Assoziation zwischen dem Teildienst und dem Dienst widerzuspiegeln; undSpeichern (272) von empfangenen Dienstüberwachungsmetrikwerten und Teildienst-Überwachungsmetrikwerten in einer relational organisierten Weise, welche die Assoziation zwischen dem Teildienst und dem Dienst widerspiegelt; undDurchführen (274) von Dienstüberwachungsverwaltung durch Analysieren der empfangenen Dienstüberwachungsmetrikwerte und Teildienst-Überwachungsmetrikwerte in Bezug auf die Assoziation zwischen dem Dienst und dem Teildienst.
- Vorrichtung zur Dienstüberwachungsverwaltung, umfassend:Überwachungsberichtempfängerelement (282), das so ausgelegt ist, dass es einen oder mehrere Dienstüberwachungsberichte in Bezug auf einen Dienst empfängt, wobei Dienstüberwachungsmetrikwerte und Teildienst-Überwachungsmetrikwerte innerhalb des oder jedes Dienstüberwachungsberichts relational organisiert sind, um die Assoziation zwischen dem Teildienst und dem Dienst widerzuspiegeln;ein Speicherelement (280), das so ausgelegt ist, dass es Dienstüberwachungsmetrikwerte und Teildienst-Überwachungsmetrikwerte in einer relationalen organisierten Weise speichert, welche die Assoziation zwischen dem Teildienst und dem Dienst widerspiegelt; undein Empfangsmetrikwert-Speicherelement (284), das mit dem Überwachungsberichtempfängerelement (282) gekoppelt ist, um Dienstüberwachungsmetrikwerte und Teildienst-Überwachungsmetrikwerte davon zu empfangen, und mit dem Speicherelement (280) gekoppelt und so ausgelegt ist, dass es empfangene Dienstüberwachungsmetrikwerte und Teildienst-Überwachungsmetrikwerte in einer relational organisierten Weise, welche die Assoziation zwischen dem Teildienst und dem Dienst widerspiegelt, im Speicherelement (280) speichert; undProtokollanalysator (302), der mit dem Speicherelement (280) gekoppelt und so ausgelegt ist, dass er Dienstüberwachungsverwaltung durch Analysieren der empfangenen Dienstüberwachungsmetrikwerte und Teildienst-Überwachungsmetrikwerte in Bezug auf die Assoziation zwischen dem Dienst und dem Teildienst durchführt.
Applications Claiming Priority (1)
| Application Number | Priority Date | Filing Date | Title |
|---|---|---|---|
| PCT/EP2010/070321 WO2012084009A1 (en) | 2010-12-20 | 2010-12-20 | Method of and device for service monitoring and service monitoring management |
Publications (2)
| Publication Number | Publication Date |
|---|---|
| EP2656543A1 EP2656543A1 (de) | 2013-10-30 |
| EP2656543B1 true EP2656543B1 (de) | 2015-02-25 |
Family
ID=43877266
Family Applications (1)
| Application Number | Title | Priority Date | Filing Date |
|---|---|---|---|
| EP10795711.0A Active EP2656543B1 (de) | 2010-12-20 | 2010-12-20 | Verfahren und vorrichtung zur dienstüberwachung und dienstüberwachungsverwaltung |
Country Status (3)
| Country | Link |
|---|---|
| US (1) | US9521050B2 (de) |
| EP (1) | EP2656543B1 (de) |
| WO (1) | WO2012084009A1 (de) |
Families Citing this family (16)
| Publication number | Priority date | Publication date | Assignee | Title |
|---|---|---|---|---|
| WO2012143040A1 (en) | 2011-04-18 | 2012-10-26 | Telefonaktiebolaget L M Ericsson (Publ) | Method and apparatus for quality of service monitoring of services in a communication network |
| KR101600422B1 (ko) * | 2012-08-14 | 2016-03-21 | 주식회사 케이티 | 통화 단말과 다른 단말로 연속적으로 제공하는 감시 정보 서비스 방법 및 시스템 |
| US10185582B2 (en) * | 2012-11-28 | 2019-01-22 | Red Hat Israel, Ltd. | Monitoring the progress of the processes executing in a virtualization environment |
| KR101550062B1 (ko) | 2013-02-26 | 2015-09-04 | 주식회사 케이티 | M2m 디바이스의 제어권 공유 방법 및 이를 위한 m2m 서비스 플랫폼 |
| KR101441567B1 (ko) | 2013-03-05 | 2014-09-22 | 주식회사 케이티 | Ims 망을 통한 m2m 데이터 전달 방법 및 이를 위한 m2m 서비스 플랫폼 |
| US9788223B2 (en) | 2013-05-06 | 2017-10-10 | Nokia Solutions And Networks Oy | Processing customer experience events from a plurality of source systems |
| WO2015080512A1 (ko) * | 2013-11-28 | 2015-06-04 | 주식회사 케이티 | 컨트롤러와 네트워크 장치 간 이벤트를 처리하는 방법 |
| US20160085311A1 (en) * | 2014-09-24 | 2016-03-24 | Sony Corporation | Control unit and method of interacting with a graphical user interface |
| US9813432B2 (en) * | 2015-01-23 | 2017-11-07 | Cisco Technology, Inc. | Tracking anomaly propagation at the network level |
| US10333996B2 (en) * | 2016-10-14 | 2019-06-25 | CALLSTATS I/O Oy | Methods and systems for analyzing streaming media sessions |
| US10979480B2 (en) | 2016-10-14 | 2021-04-13 | 8X8, Inc. | Methods and systems for communicating information concerning streaming media sessions |
| WO2019088885A1 (en) * | 2017-10-30 | 2019-05-09 | Telefonaktiebolaget Lm Ericsson (Publ) | Network node, monitoring node and methods performed therein |
| JP6740274B2 (ja) * | 2018-03-29 | 2020-08-12 | 日本電信電話株式会社 | 情報処理装置、情報処理方法、および、情報処理プログラム |
| CN114721912A (zh) * | 2021-01-04 | 2022-07-08 | 腾讯科技(深圳)有限公司 | 一种数据分析方法、装置、设备及介质 |
| US20220295455A1 (en) * | 2021-03-12 | 2022-09-15 | Qualcomm Incorporated | Dynamic downlink waveform and decoder ue capabilities |
| CN113360752A (zh) * | 2021-04-23 | 2021-09-07 | 山东英信计算机技术有限公司 | 一种消息推送的方法、装置、设备及可读介质 |
Family Cites Families (14)
| Publication number | Priority date | Publication date | Assignee | Title |
|---|---|---|---|---|
| WO2000072183A2 (en) * | 1999-05-24 | 2000-11-30 | Aprisma Management Technologies, Inc. | Service level management |
| EP1678888B1 (de) * | 2003-08-21 | 2010-02-10 | Vidiator Enterprises Inc. | Metriken für die qualität der erfahrung (qoe) für drahtlose kommunikationsnetze |
| US7706291B2 (en) * | 2007-08-01 | 2010-04-27 | Zeugma Systems Inc. | Monitoring quality of experience on a per subscriber, per session basis |
| US8346225B2 (en) * | 2009-01-28 | 2013-01-01 | Headwater Partners I, Llc | Quality of service for device assisted services |
| JP5332580B2 (ja) * | 2008-12-15 | 2013-11-06 | 富士通株式会社 | シグナリングを伴うインターネットサービスにおけるネットワーク品質監視装置及び方法 |
| WO2010069372A1 (en) | 2008-12-17 | 2010-06-24 | Telefonaktiebolaget Lm Ericsson (Publ) | Monitoring media services in telecommunications networks |
| KR101094628B1 (ko) * | 2008-12-23 | 2011-12-15 | 주식회사 케이티 | 타임스탬프를 이용한 실시간 서비스 모니터링 네트워크 장치 및 그 방법 |
| US8495428B2 (en) * | 2009-06-30 | 2013-07-23 | International Business Machines Corporation | Quality of service management of end user devices in an end user network |
| US8619621B2 (en) * | 2009-08-20 | 2013-12-31 | Verizon Patent And Licensing Inc. | Performance monitoring-based network resource management with mobility support |
| US8578020B2 (en) * | 2009-12-24 | 2013-11-05 | Empire Technology Development Llc | Dynamic mobile application quality-of-service monitoring and reporting |
| US9729404B2 (en) | 2010-10-19 | 2017-08-08 | Telefonaktieboalget Lm Ericsson (Publ) | Quality of service monitoring device and method of monitoring quality of service |
| US20130326551A1 (en) * | 2012-05-30 | 2013-12-05 | Debdeep CHATTERJEE | Wireless multimedia quality of experience reporting |
| US20130325551A1 (en) * | 2012-06-05 | 2013-12-05 | Clear Demand, Inc. | System and method for modeling demand and optimizing prices with immunity to out-of-stock events |
| US9584382B2 (en) * | 2012-11-28 | 2017-02-28 | At&T Intellectual Property I, L.P. | Collecting and using quality of experience information |
-
2010
- 2010-12-20 US US13/995,714 patent/US9521050B2/en active Active
- 2010-12-20 EP EP10795711.0A patent/EP2656543B1/de active Active
- 2010-12-20 WO PCT/EP2010/070321 patent/WO2012084009A1/en active Application Filing
Also Published As
| Publication number | Publication date |
|---|---|
| US20140006612A1 (en) | 2014-01-02 |
| US9521050B2 (en) | 2016-12-13 |
| WO2012084009A1 (en) | 2012-06-28 |
| EP2656543A1 (de) | 2013-10-30 |
Similar Documents
| Publication | Publication Date | Title |
|---|---|---|
| EP2656543B1 (de) | Verfahren und vorrichtung zur dienstüberwachung und dienstüberwachungsverwaltung | |
| EP2656544B1 (de) | Verfahren und vorrichtung zur dienstüberwachung und dienstüberwachungsverwaltung | |
| US9917763B2 (en) | Method and apparatus for analyzing a service in a service session | |
| US8031726B2 (en) | Billing, alarm, statistics and log information handling in multi-services gateway device at user premises | |
| CN101895436B (zh) | 网络实时监测和控制系统 | |
| US9549010B2 (en) | Method and apparatus for media session identification, tracking, and analysis | |
| US20140317280A1 (en) | User Bandwidth Notification Model | |
| US9693255B2 (en) | Method and apparatus for reporting traffic and method and apparatus for counting network traffic | |
| JP5631330B2 (ja) | 大規模通信ネットワークシステムにおいて障害情報を配信する方法及び装置 | |
| CN101895413B (zh) | 网际协议语音参数的控制管理 | |
| EP2645765A1 (de) | Verfahren und system zur implementierung einer netzwerkverwaltung auf basis einer dünnen drahtlosen zugangspunktarchitektur | |
| KR20100027968A (ko) | 품질 통계의 수집 방법 및 품질 통계의 수집의 대응하는 관리 방법 | |
| WO2014110911A1 (zh) | Iptv系统中的故障处理方法及装置 | |
| US20090100174A1 (en) | Method and system for automatic polling of multiple device types | |
| US20190386903A1 (en) | Network operational flaw detection using metrics | |
| EP4030725A1 (de) | Datenabonnementverfahren, -vorrichtung und -system | |
| EP2733905A1 (de) | Verfahren, System und Vorrichtungen zur Verwaltung der Benutzerregistrierung eines Dienstes in einem IMS-Netzwerk | |
| US20150149629A1 (en) | User online state querying method and apparatus | |
| Garcia-Martin et al. | Network automation and data analytics in 3gpp 5g systems | |
| EP2630750B1 (de) | Vorrichtung zur dienstgüteüberwachung und verfahren zur dienstgüteüberwachung | |
| US20100138283A1 (en) | Audience research data collection method and system for iptv service | |
| CN101483551B (zh) | 远程监控家庭网关设备的方法及系统 | |
| US20100088762A1 (en) | Apparatus and method for monitoring network equipment | |
| KR101860464B1 (ko) | 영상 및 방송 기반 이종 플랫폼 관리 서비스 제공 방법 | |
| CN109314651B (zh) | 用于高效http管理流程的面向管理信息库的协议 |
Legal Events
| Date | Code | Title | Description |
|---|---|---|---|
| PUAI | Public reference made under article 153(3) epc to a published international application that has entered the european phase |
Free format text: ORIGINAL CODE: 0009012 |
|
| 17P | Request for examination filed |
Effective date: 20130621 |
|
| AK | Designated contracting states |
Kind code of ref document: A1 Designated state(s): AL AT BE BG CH CY CZ DE DK EE ES FI FR GB GR HR HU IE IS IT LI LT LU LV MC MK MT NL NO PL PT RO RS SE SI SK SM TR |
|
| DAX | Request for extension of the european patent (deleted) | ||
| REG | Reference to a national code |
Ref country code: DE Ref legal event code: R079 Ref document number: 602010022661 Country of ref document: DE Free format text: PREVIOUS MAIN CLASS: H04L0012240000 Ipc: H04L0012260000 |
|
| GRAP | Despatch of communication of intention to grant a patent |
Free format text: ORIGINAL CODE: EPIDOSNIGR1 |
|
| RIC1 | Information provided on ipc code assigned before grant |
Ipc: H04L 12/26 20060101AFI20140805BHEP Ipc: H04L 12/24 20060101ALI20140805BHEP |
|
| INTG | Intention to grant announced |
Effective date: 20140911 |
|
| GRAS | Grant fee paid |
Free format text: ORIGINAL CODE: EPIDOSNIGR3 |
|
| GRAA | (expected) grant |
Free format text: ORIGINAL CODE: 0009210 |
|
| AK | Designated contracting states |
Kind code of ref document: B1 Designated state(s): AL AT BE BG CH CY CZ DE DK EE ES FI FR GB GR HR HU IE IS IT LI LT LU LV MC MK MT NL NO PL PT RO RS SE SI SK SM TR |
|
| REG | Reference to a national code |
Ref country code: GB Ref legal event code: FG4D |
|
| REG | Reference to a national code |
Ref country code: CH Ref legal event code: EP |
|
| REG | Reference to a national code |
Ref country code: IE Ref legal event code: FG4D |
|
| REG | Reference to a national code |
Ref country code: DE Ref legal event code: R096 Ref document number: 602010022661 Country of ref document: DE Effective date: 20150409 |
|
| REG | Reference to a national code |
Ref country code: AT Ref legal event code: REF Ref document number: 712791 Country of ref document: AT Kind code of ref document: T Effective date: 20150415 |
|
| REG | Reference to a national code |
Ref country code: NL Ref legal event code: T3 |
|
| REG | Reference to a national code |
Ref country code: AT Ref legal event code: MK05 Ref document number: 712791 Country of ref document: AT Kind code of ref document: T Effective date: 20150225 |
|
| REG | Reference to a national code |
Ref country code: LT Ref legal event code: MG4D |
|
| PG25 | Lapsed in a contracting state [announced via postgrant information from national office to epo] |
Ref country code: FI Free format text: LAPSE BECAUSE OF FAILURE TO SUBMIT A TRANSLATION OF THE DESCRIPTION OR TO PAY THE FEE WITHIN THE PRESCRIBED TIME-LIMIT Effective date: 20150225 Ref country code: ES Free format text: LAPSE BECAUSE OF FAILURE TO SUBMIT A TRANSLATION OF THE DESCRIPTION OR TO PAY THE FEE WITHIN THE PRESCRIBED TIME-LIMIT Effective date: 20150225 Ref country code: NO Free format text: LAPSE BECAUSE OF FAILURE TO SUBMIT A TRANSLATION OF THE DESCRIPTION OR TO PAY THE FEE WITHIN THE PRESCRIBED TIME-LIMIT Effective date: 20150525 Ref country code: LT Free format text: LAPSE BECAUSE OF FAILURE TO SUBMIT A TRANSLATION OF THE DESCRIPTION OR TO PAY THE FEE WITHIN THE PRESCRIBED TIME-LIMIT Effective date: 20150225 Ref country code: HR Free format text: LAPSE BECAUSE OF FAILURE TO SUBMIT A TRANSLATION OF THE DESCRIPTION OR TO PAY THE FEE WITHIN THE PRESCRIBED TIME-LIMIT Effective date: 20150225 Ref country code: SE Free format text: LAPSE BECAUSE OF FAILURE TO SUBMIT A TRANSLATION OF THE DESCRIPTION OR TO PAY THE FEE WITHIN THE PRESCRIBED TIME-LIMIT Effective date: 20150225 |
|
| PG25 | Lapsed in a contracting state [announced via postgrant information from national office to epo] |
Ref country code: LV Free format text: LAPSE BECAUSE OF FAILURE TO SUBMIT A TRANSLATION OF THE DESCRIPTION OR TO PAY THE FEE WITHIN THE PRESCRIBED TIME-LIMIT Effective date: 20150225 Ref country code: RS Free format text: LAPSE BECAUSE OF FAILURE TO SUBMIT A TRANSLATION OF THE DESCRIPTION OR TO PAY THE FEE WITHIN THE PRESCRIBED TIME-LIMIT Effective date: 20150225 Ref country code: GR Free format text: LAPSE BECAUSE OF FAILURE TO SUBMIT A TRANSLATION OF THE DESCRIPTION OR TO PAY THE FEE WITHIN THE PRESCRIBED TIME-LIMIT Effective date: 20150526 Ref country code: IS Free format text: LAPSE BECAUSE OF FAILURE TO SUBMIT A TRANSLATION OF THE DESCRIPTION OR TO PAY THE FEE WITHIN THE PRESCRIBED TIME-LIMIT Effective date: 20150625 Ref country code: AT Free format text: LAPSE BECAUSE OF FAILURE TO SUBMIT A TRANSLATION OF THE DESCRIPTION OR TO PAY THE FEE WITHIN THE PRESCRIBED TIME-LIMIT Effective date: 20150225 |
|
| PG25 | Lapsed in a contracting state [announced via postgrant information from national office to epo] |
Ref country code: RO Free format text: LAPSE BECAUSE OF FAILURE TO SUBMIT A TRANSLATION OF THE DESCRIPTION OR TO PAY THE FEE WITHIN THE PRESCRIBED TIME-LIMIT Effective date: 20150225 Ref country code: CZ Free format text: LAPSE BECAUSE OF FAILURE TO SUBMIT A TRANSLATION OF THE DESCRIPTION OR TO PAY THE FEE WITHIN THE PRESCRIBED TIME-LIMIT Effective date: 20150225 Ref country code: SK Free format text: LAPSE BECAUSE OF FAILURE TO SUBMIT A TRANSLATION OF THE DESCRIPTION OR TO PAY THE FEE WITHIN THE PRESCRIBED TIME-LIMIT Effective date: 20150225 Ref country code: EE Free format text: LAPSE BECAUSE OF FAILURE TO SUBMIT A TRANSLATION OF THE DESCRIPTION OR TO PAY THE FEE WITHIN THE PRESCRIBED TIME-LIMIT Effective date: 20150225 Ref country code: DK Free format text: LAPSE BECAUSE OF FAILURE TO SUBMIT A TRANSLATION OF THE DESCRIPTION OR TO PAY THE FEE WITHIN THE PRESCRIBED TIME-LIMIT Effective date: 20150225 |
|
| REG | Reference to a national code |
Ref country code: DE Ref legal event code: R097 Ref document number: 602010022661 Country of ref document: DE |
|
| PG25 | Lapsed in a contracting state [announced via postgrant information from national office to epo] |
Ref country code: PL Free format text: LAPSE BECAUSE OF FAILURE TO SUBMIT A TRANSLATION OF THE DESCRIPTION OR TO PAY THE FEE WITHIN THE PRESCRIBED TIME-LIMIT Effective date: 20150225 |
|
| PG25 | Lapsed in a contracting state [announced via postgrant information from national office to epo] |
Ref country code: IT Free format text: LAPSE BECAUSE OF FAILURE TO SUBMIT A TRANSLATION OF THE DESCRIPTION OR TO PAY THE FEE WITHIN THE PRESCRIBED TIME-LIMIT Effective date: 20150225 |
|
| PLBE | No opposition filed within time limit |
Free format text: ORIGINAL CODE: 0009261 |
|
| STAA | Information on the status of an ep patent application or granted ep patent |
Free format text: STATUS: NO OPPOSITION FILED WITHIN TIME LIMIT |
|
| 26N | No opposition filed |
Effective date: 20151126 |
|
| PG25 | Lapsed in a contracting state [announced via postgrant information from national office to epo] |
Ref country code: SI Free format text: LAPSE BECAUSE OF FAILURE TO SUBMIT A TRANSLATION OF THE DESCRIPTION OR TO PAY THE FEE WITHIN THE PRESCRIBED TIME-LIMIT Effective date: 20150225 |
|
| PG25 | Lapsed in a contracting state [announced via postgrant information from national office to epo] |
Ref country code: BE Free format text: LAPSE BECAUSE OF FAILURE TO SUBMIT A TRANSLATION OF THE DESCRIPTION OR TO PAY THE FEE WITHIN THE PRESCRIBED TIME-LIMIT Effective date: 20150225 |
|
| PG25 | Lapsed in a contracting state [announced via postgrant information from national office to epo] |
Ref country code: LU Free format text: LAPSE BECAUSE OF FAILURE TO SUBMIT A TRANSLATION OF THE DESCRIPTION OR TO PAY THE FEE WITHIN THE PRESCRIBED TIME-LIMIT Effective date: 20151220 Ref country code: MC Free format text: LAPSE BECAUSE OF FAILURE TO SUBMIT A TRANSLATION OF THE DESCRIPTION OR TO PAY THE FEE WITHIN THE PRESCRIBED TIME-LIMIT Effective date: 20150225 |
|
| REG | Reference to a national code |
Ref country code: CH Ref legal event code: PL |
|
| REG | Reference to a national code |
Ref country code: IE Ref legal event code: MM4A |
|
| REG | Reference to a national code |
Ref country code: FR Ref legal event code: ST Effective date: 20160831 |
|
| PG25 | Lapsed in a contracting state [announced via postgrant information from national office to epo] |
Ref country code: CH Free format text: LAPSE BECAUSE OF NON-PAYMENT OF DUE FEES Effective date: 20151231 Ref country code: LI Free format text: LAPSE BECAUSE OF NON-PAYMENT OF DUE FEES Effective date: 20151231 Ref country code: IE Free format text: LAPSE BECAUSE OF NON-PAYMENT OF DUE FEES Effective date: 20151220 |
|
| PG25 | Lapsed in a contracting state [announced via postgrant information from national office to epo] |
Ref country code: FR Free format text: LAPSE BECAUSE OF NON-PAYMENT OF DUE FEES Effective date: 20151231 |
|
| PG25 | Lapsed in a contracting state [announced via postgrant information from national office to epo] |
Ref country code: HU Free format text: LAPSE BECAUSE OF FAILURE TO SUBMIT A TRANSLATION OF THE DESCRIPTION OR TO PAY THE FEE WITHIN THE PRESCRIBED TIME-LIMIT; INVALID AB INITIO Effective date: 20101220 Ref country code: BG Free format text: LAPSE BECAUSE OF FAILURE TO SUBMIT A TRANSLATION OF THE DESCRIPTION OR TO PAY THE FEE WITHIN THE PRESCRIBED TIME-LIMIT Effective date: 20150225 Ref country code: SM Free format text: LAPSE BECAUSE OF FAILURE TO SUBMIT A TRANSLATION OF THE DESCRIPTION OR TO PAY THE FEE WITHIN THE PRESCRIBED TIME-LIMIT Effective date: 20150225 |
|
| PG25 | Lapsed in a contracting state [announced via postgrant information from national office to epo] |
Ref country code: CY Free format text: LAPSE BECAUSE OF FAILURE TO SUBMIT A TRANSLATION OF THE DESCRIPTION OR TO PAY THE FEE WITHIN THE PRESCRIBED TIME-LIMIT Effective date: 20150225 |
|
| PG25 | Lapsed in a contracting state [announced via postgrant information from national office to epo] |
Ref country code: MT Free format text: LAPSE BECAUSE OF FAILURE TO SUBMIT A TRANSLATION OF THE DESCRIPTION OR TO PAY THE FEE WITHIN THE PRESCRIBED TIME-LIMIT Effective date: 20150225 |
|
| PG25 | Lapsed in a contracting state [announced via postgrant information from national office to epo] |
Ref country code: PT Free format text: LAPSE BECAUSE OF FAILURE TO SUBMIT A TRANSLATION OF THE DESCRIPTION OR TO PAY THE FEE WITHIN THE PRESCRIBED TIME-LIMIT Effective date: 20150225 Ref country code: MK Free format text: LAPSE BECAUSE OF FAILURE TO SUBMIT A TRANSLATION OF THE DESCRIPTION OR TO PAY THE FEE WITHIN THE PRESCRIBED TIME-LIMIT Effective date: 20150225 |
|
| PG25 | Lapsed in a contracting state [announced via postgrant information from national office to epo] |
Ref country code: AL Free format text: LAPSE BECAUSE OF FAILURE TO SUBMIT A TRANSLATION OF THE DESCRIPTION OR TO PAY THE FEE WITHIN THE PRESCRIBED TIME-LIMIT Effective date: 20150225 Ref country code: TR Free format text: LAPSE BECAUSE OF FAILURE TO SUBMIT A TRANSLATION OF THE DESCRIPTION OR TO PAY THE FEE WITHIN THE PRESCRIBED TIME-LIMIT Effective date: 20150225 |
|
| REG | Reference to a national code |
Ref country code: DE Ref legal event code: R079 Ref document number: 602010022661 Country of ref document: DE Free format text: PREVIOUS MAIN CLASS: H04L0012260000 Ipc: H04L0043000000 |
|
| PGFP | Annual fee paid to national office [announced via postgrant information from national office to epo] |
Ref country code: DE Payment date: 20221228 Year of fee payment: 13 |
|
| P01 | Opt-out of the competence of the unified patent court (upc) registered |
Effective date: 20230517 |
|
| PGFP | Annual fee paid to national office [announced via postgrant information from national office to epo] |
Ref country code: GB Payment date: 20231227 Year of fee payment: 14 |
|
| PGFP | Annual fee paid to national office [announced via postgrant information from national office to epo] |
Ref country code: NL Payment date: 20231226 Year of fee payment: 14 |