EP2469874A2 - Displays for easy visualizing of 3D disparity data - Google Patents
Displays for easy visualizing of 3D disparity data Download PDFInfo
- Publication number
- EP2469874A2 EP2469874A2 EP11189351A EP11189351A EP2469874A2 EP 2469874 A2 EP2469874 A2 EP 2469874A2 EP 11189351 A EP11189351 A EP 11189351A EP 11189351 A EP11189351 A EP 11189351A EP 2469874 A2 EP2469874 A2 EP 2469874A2
- Authority
- EP
- European Patent Office
- Prior art keywords
- disparity
- display
- statistic
- frame
- markers
- Prior art date
- Legal status (The legal status is an assumption and is not a legal conclusion. Google has not performed a legal analysis and makes no representation as to the accuracy of the status listed.)
- Withdrawn
Links
Images


Classifications
-
- H—ELECTRICITY
- H04—ELECTRIC COMMUNICATION TECHNIQUE
- H04N—PICTORIAL COMMUNICATION, e.g. TELEVISION
- H04N13/00—Stereoscopic video systems; Multi-view video systems; Details thereof
- H04N13/10—Processing, recording or transmission of stereoscopic or multi-view image signals
- H04N13/106—Processing image signals
- H04N13/172—Processing image signals image signals comprising non-image signal components, e.g. headers or format information
- H04N13/183—On-screen display [OSD] information, e.g. subtitles or menus
-
- H—ELECTRICITY
- H04—ELECTRIC COMMUNICATION TECHNIQUE
- H04N—PICTORIAL COMMUNICATION, e.g. TELEVISION
- H04N13/00—Stereoscopic video systems; Multi-view video systems; Details thereof
- H04N13/10—Processing, recording or transmission of stereoscopic or multi-view image signals
- H04N13/106—Processing image signals
- H04N13/144—Processing image signals for flicker reduction
-
- H—ELECTRICITY
- H04—ELECTRIC COMMUNICATION TECHNIQUE
- H04N—PICTORIAL COMMUNICATION, e.g. TELEVISION
- H04N13/00—Stereoscopic video systems; Multi-view video systems; Details thereof
- H04N2013/0074—Stereoscopic image analysis
- H04N2013/0081—Depth or disparity estimation from stereoscopic image signals
Definitions
- the present invention relates to video test and measurement instruments, and more particularly to disparity measurements for three-dimensional (3D) images.
- 3D content producers have to deal with a variety of new consumer issues including eye strain, headaches, and so on. Many of these issues can be detected during content creation or at post-production sites by measuring disparity values on a frame-by-frame basis.
- the disparity value indicates the horizontal (or vertical) translation value between the left and right image frames at each pixel location.
- a technician or engineer can determine the actual "depths" at various locations within a frame.
- Disparity information can be displayed in various ways.
- the Cel-Scope3D stereoscopic analyser available from Cel-Soft.com Ltd of Cambridge, United Kingdom displays disparity information for both horizontal and vertical directions in a "depth map" format.
- the Cel-Scope3D computes the disparities at various locations in the frame and then creates a color-coded distribution function (i.e., a histogram) of those disparities.
- the Cel-Scope3D provides an alarm for alerting a user whenever a measured disparity value in the distribution violates a pre-defined range.
- the color code in the distribution function maps back to a pseudo color coded edge map in such a way that the color of any edge point would be the same as the color of the depth value at that point when mapped into the histogram.
- Embodiments of the present invention provide various displays for easy visualization of disparity data. Some embodiments provide a "snapshot" display having a plurality of markers, each marker representing a disparity statistic of a horizontal or vertical segment of a 3D image under test. Other embodiments provide a "trend” display having a plurality of markers, each marker representing a disparity statistic, or a rate of change of a disparity statistic, calculated over a single frame or field of a 3D video under test on a frame-by-frame basis.
- the disparity statistic may be maximum disparity, minimum disparity, mean disparity, RMS disparity, or the like.
- FIG. 1 depicts a 3D video frame.
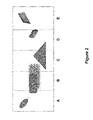
- FIG. 2 depicts a horizontally segmented video frame according to an embodiment of the present invention.
- FIG. 3 depicts a segmented frame disparity display according to an embodiment of the present invention.
- FIG. 4 depicts a vertically segmented video frame according to an embodiment of the present invention.
- FIG. 5 depicts a display of disparity trend data according to an embodiment of the present invention.
- FIG. 6 depicts a display of disparity rate of change according to an embodiment of the present invention.
- Embodiments of the present invention provide various new displays for visualizing disparity information.
- FIG. 1 depicts a video frame 100 that shows five objects 1, 2, 3, 4, and 5, each object having a different visual depth.
- Objects 1 and 2 have negative disparity and thus appears to be in front of the screen plane to a viewer.
- Objects 4 and 5 have positive disparity and thus appear to be behind the screen plane to a viewer.
- Object 3 has zero disparity and thus appears to be on the screen plane to a viewer.
- FIG. 2 depicts the same video frame as that shown in FIG. 1 , except that it is now divided into five segments A, B, C, D, and E.
- disparity values are calculated for each of the five segments
- a disparity statistic is calculated for each of the five segments based on the disparity values
- the disparity statistics are displayed on a graph.
- the disparity values may be calculated using any one of various methods such as the method described in co-pending U.S. Patent Application No. 13/004,124 titled "System and Methods to Efficiently Measure Stereoscopic Disparity and to Generate Related Mismatch Images" filed on January 11, 2011.
- the disparity statistics may be maximum disparity, minimum disparity, mean disparity, RMS disparity, and the like.
- the maximum positive and negative disparity values 305, 310, 315, and 320 for each of the segments A, B, C, D, and E are displayed in bar graph form.
- the maximum positive and negative disparity values 305, 310, 315, and 320 correspond to the objects 1, 2, 3, 4, and 5 shown in FIG. 2 .
- the display 300 provides a technician or engineer with a "snapshot" of the maximum positive and negative disparities in each vertical segment of the video frame, or in other words, a "segmented horizontal view" of the disparities.
- the "snapshot" display 300 allows a technician or engineer to immediately ascertain the positive and negative disparity values of a frame. This is particularly useful for a technician analyzing video data at a post-production facility because it helps to visualize a depth map without having to analyze complex depth data such as a histogram.
- an alarm limit 325 is displayed for positive disparities. In other embodiments, an alarm limit 330 is displayed for negative disparities. If either of these alarm limits is violated, the user is alerted.
- FIG. 4 depicts the same video frame as that shown in FIG. 1 , except that it is now divided vertically into five segments F, G, H, I and J.
- the disparities of each of these segments may be displayed in a manner similar to that of in FIG. 3 , thereby providing a "segmented vertical view" of the disparities (not shown).
- video frames described above are all divided into five segments, it will be appreciated that a video frame may alternatively be divided into any number of segments. Accordingly, in some embodiments, the number of the segments, or alternatively, the width or height of the segments, is user-definable.
- the displayed disparity statistics may be depicted using different shades of gray-scale or color-coding based on the value of their corresponding disparity statistic. For example, negative disparity statistics may be depicted using various shades of red, with the more negative disparity statistics being depicted using a more saturated red, and positive disparities may be displayed using various shades of cyan.
- the disparity statistics are displayed together with their corresponding disparity values in order to provide more insight into the disparity statistics. For example, a bar representing the maximum disparity for a particular segment may be depicted as overlaying the disparity values upon which the disparity statistic is based.
- the displays include user-definable ballistics such as peak detect, fast attack, slow decay, and the like.
- a disparity statistic is calculated over a single frame or field on a frame-by-frame basis and then the resulting value is depicted by a marker in a trend graph.
- the disparity statistic may be maximum disparity, minimum disparity, mean disparity, RMS disparity, or the like.
- FIG. 5 depicts a trend graph 500 of maximum positive disparities 505 and maximum negative disparities 510, with each marker corresponding to a single frame.
- each marker represents a value that is calculated based on the disparity statistics of two or more frames or fields.
- each marker on a trend graph may represent the moving average of the disparity statistics of the ten most recent frames or fields, or the like.
- various other calculations may be used such as filtering and the like.
- a positive disparity alarm limit 515 and a negative disparity alarm limit 520 are also displayed. If either of these alarm limits is violated, the user is alerted.
- FIG. 6 depicts a display 600 of the rate of change of the maximum positive disparities 605 and the maximum negative disparities 610 shown in FIG. 5 .
- the data shown in FIG. 6 is the first order derivative of the data shown in FIG. 5 .
- a positive alarm limit 615 and a negative alarm limit 620 are shown for the rate of change of the maximum positive disparities.
- a positive alarm limit 625 and a negative alarm limit 630 are shown for the rate of change of the maximum negative disparities. If any of these alarm limits is violated, the user is alerted.
- the displays described herein may be used in any disparity measurement application, and they are particularly useful in software applications such as the VQS 1000 Video Quality Analysis Software available from Tektronix, Inc. of Beaverton, Oregon.
- the VQS 1000 Video Quality Analysis Software is a useful tool for quality of experience (QoE) monitoring, network performance optimization, and remote in-service diagnostics of broadcast delivery issues.
- QoE quality of experience
- disparity statistics are depicted as bars in FIG. 3 , and depicted as points in FIG. 5 , it will be appreciated that those depictions are merely meant to be illustrative, and that disparity statistics may also be depicted using any other kind of marker.
Abstract
Description
- This application claims the benefit of
U.S. Provisional Patent Application No. 61/426,949 - The present invention relates to video test and measurement instruments, and more particularly to disparity measurements for three-dimensional (3D) images.
- The past few years have seen an explosive growth of interest in 3D video—both live and recorded program material. 3D content producers have to deal with a variety of new consumer issues including eye strain, headaches, and so on. Many of these issues can be detected during content creation or at post-production sites by measuring disparity values on a frame-by-frame basis. The disparity value indicates the horizontal (or vertical) translation value between the left and right image frames at each pixel location. Using a disparity value, a technician or engineer can determine the actual "depths" at various locations within a frame.
- Disparity information can be displayed in various ways. For example, the Cel-Scope3D stereoscopic analyser available from Cel-Soft.com Ltd of Cambridge, United Kingdom (described at http://www.cel-soft.com/celscope3d) displays disparity information for both horizontal and vertical directions in a "depth map" format. For a given frame, the Cel-Scope3D computes the disparities at various locations in the frame and then creates a color-coded distribution function (i.e., a histogram) of those disparities. In addition, the Cel-Scope3D provides an alarm for alerting a user whenever a measured disparity value in the distribution violates a pre-defined range. The color code in the distribution function maps back to a pseudo color coded edge map in such a way that the color of any edge point would be the same as the color of the depth value at that point when mapped into the histogram.
- While the Cel-Scope3D's "depth map" is a helpful display, video technicians and engineers need additional displays in order to visualize disparity information.
- Embodiments of the present invention provide various displays for easy visualization of disparity data. Some embodiments provide a "snapshot" display having a plurality of markers, each marker representing a disparity statistic of a horizontal or vertical segment of a 3D image under test. Other embodiments provide a "trend" display having a plurality of markers, each marker representing a disparity statistic, or a rate of change of a disparity statistic, calculated over a single frame or field of a 3D video under test on a frame-by-frame basis. The disparity statistic may be maximum disparity, minimum disparity, mean disparity, RMS disparity, or the like.
- The objects, advantages, and other novel features of the present invention are apparent from the following detailed description when read in conjunction with the appended claims and attached drawings.
-
FIG. 1 depicts a 3D video frame. -
FIG. 2 depicts a horizontally segmented video frame according to an embodiment of the present invention. -
FIG. 3 depicts a segmented frame disparity display according to an embodiment of the present invention. -
FIG. 4 depicts a vertically segmented video frame according to an embodiment of the present invention. -
FIG. 5 depicts a display of disparity trend data according to an embodiment of the present invention. -
FIG. 6 depicts a display of disparity rate of change according to an embodiment of the present invention. - Embodiments of the present invention provide various new displays for visualizing disparity information.
- I. Segmented frame depth "snapshot" display
- By way of example, consider
FIG. 1 , which depicts avideo frame 100 that shows fiveobjects Objects Objects 4 and 5 have positive disparity and thus appear to be behind the screen plane to a viewer.Object 3 has zero disparity and thus appears to be on the screen plane to a viewer. -
FIG. 2 depicts the same video frame as that shown inFIG. 1 , except that it is now divided into five segments A, B, C, D, and E. In some embodiments of the present invention, disparity values are calculated for each of the five segments, a disparity statistic is calculated for each of the five segments based on the disparity values, and the disparity statistics are displayed on a graph. The disparity values may be calculated using any one of various methods such as the method described in co-pendingU.S. Patent Application No. 13/004,124 titled "System and Methods to Efficiently Measure Stereoscopic Disparity and to Generate Related Mismatch Images" filed on January 11, 2011. The disparity statistics may be maximum disparity, minimum disparity, mean disparity, RMS disparity, and the like. - For example, as shown in
FIG. 3 , the maximum positive andnegative disparity values negative disparity values objects FIG. 2 . Thus, the display 300 provides a technician or engineer with a "snapshot" of the maximum positive and negative disparities in each vertical segment of the video frame, or in other words, a "segmented horizontal view" of the disparities. - The "snapshot" display 300 allows a technician or engineer to immediately ascertain the positive and negative disparity values of a frame. This is particularly useful for a technician analyzing video data at a post-production facility because it helps to visualize a depth map without having to analyze complex depth data such as a histogram.
- In some embodiments, an
alarm limit 325 is displayed for positive disparities. In other embodiments, analarm limit 330 is displayed for negative disparities. If either of these alarm limits is violated, the user is alerted. -
FIG. 4 depicts the same video frame as that shown inFIG. 1 , except that it is now divided vertically into five segments F, G, H, I and J. In some embodiments, the disparities of each of these segments may be displayed in a manner similar to that of inFIG. 3 , thereby providing a "segmented vertical view" of the disparities (not shown). - Although the video frames described above are all divided into five segments, it will be appreciated that a video frame may alternatively be divided into any number of segments. Accordingly, in some embodiments, the number of the segments, or alternatively, the width or height of the segments, is user-definable.
- In some embodiments, the displayed disparity statistics may be depicted using different shades of gray-scale or color-coding based on the value of their corresponding disparity statistic. For example, negative disparity statistics may be depicted using various shades of red, with the more negative disparity statistics being depicted using a more saturated red, and positive disparities may be displayed using various shades of cyan.
- In some embodiments (not shown), the disparity statistics are displayed together with their corresponding disparity values in order to provide more insight into the disparity statistics. For example, a bar representing the maximum disparity for a particular segment may be depicted as overlaying the disparity values upon which the disparity statistic is based.
- Since these "snapshot" displays depict disparity information on a frame-by-frame basis, in some embodiments the displays include user-definable ballistics such as peak detect, fast attack, slow decay, and the like.
- II. "Trend" display
- In some embodiments, a disparity statistic is calculated over a single frame or field on a frame-by-frame basis and then the resulting value is depicted by a marker in a trend graph. The disparity statistic may be maximum disparity, minimum disparity, mean disparity, RMS disparity, or the like. For example,
FIG. 5 depicts a trend graph 500 of maximumpositive disparities 505 and maximumnegative disparities 510, with each marker corresponding to a single frame. In other embodiments (not shown), each marker represents a value that is calculated based on the disparity statistics of two or more frames or fields. For example, each marker on a trend graph may represent the moving average of the disparity statistics of the ten most recent frames or fields, or the like. Alternatively, instead of a moving average, various other calculations may be used such as filtering and the like. - In some embodiments, a positive
disparity alarm limit 515 and a negativedisparity alarm limit 520 are also displayed. If either of these alarm limits is violated, the user is alerted. - In other embodiments, the rate of the change of the above-mentioned values is displayed. For example,
FIG. 6 depicts a display 600 of the rate of change of the maximumpositive disparities 605 and the maximumnegative disparities 610 shown inFIG. 5 . The data shown inFIG. 6 is the first order derivative of the data shown inFIG. 5 . - In some embodiments, a
positive alarm limit 615 and anegative alarm limit 620 are shown for the rate of change of the maximum positive disparities. In other embodiments, apositive alarm limit 625 and anegative alarm limit 630 are shown for the rate of change of the maximum negative disparities. If any of these alarm limits is violated, the user is alerted. - These trend data displays are useful for understanding depth trends over time, both the disparity trend from frame-to-frame and the rate of change of disparity. This data, together with alarm settings, allows a user to view disparity information for an extended period of time, which is particularly useful for continuous video program material. An understanding of how depth information changes from frame-to-frame is particularly useful for analyzing scene-cuts with 3D data.
- It will be appreciated that the various displays described herein are useful for presenting disparity information for images of any size, from small cell-phone displays to large cinema screens.
- It will be appreciated that the displays described herein may be used in any disparity measurement application, and they are particularly useful in software applications such as the VQS 1000 Video Quality Analysis Software available from Tektronix, Inc. of Beaverton, Oregon. The VQS 1000 Video Quality Analysis Software is a useful tool for quality of experience (QoE) monitoring, network performance optimization, and remote in-service diagnostics of broadcast delivery issues.
- While disparity statistics are depicted as bars in
FIG. 3 , and depicted as points inFIG. 5 , it will be appreciated that those depictions are merely meant to be illustrative, and that disparity statistics may also be depicted using any other kind of marker. - It will be appreciated from the foregoing discussion that the present invention represents a significant advance in the field of video test and measurement instruments. Although specific embodiments of the invention have been illustrated and described for purposes of illustration, it will be understood that various modifications may be made without departing from the spirit and scope of the invention. Accordingly, the invention should not be limited except as by the appended claims.
Claims (14)
- A display of a test and measurement instrument comprising a plurality of markers, each marker representing a calculated disparity statistic of a segment of a three-dimensional image under test.
- The display of claim 1 wherein the disparity statistic is selected from the group consisting of maximum disparity, minimum disparity, mean disparity, and RMS disparity.
- The display of claim 1 wherein the segments are horizontal segments.
- The display of claim 1 wherein the segments are vertical segments.
- The display of claim 1 further comprising an alarm limit.
- The display of claim 1 wherein each marker is depicted in a shade of gray-scale or color-coding based on the value of the corresponding disparity statistic.
- The display of claim 1 wherein the plurality of markers is displayed together with a plurality of corresponding disparity values.
- A display of a test and measurement instrument comprising a plurality of markers, each marker being based on one or more disparity statistics, each disparity statistic being calculated over a single frame or field of a three-dimensional video under test on a frame-by-frame basis.
- The display of claim 8 wherein the disparity statistic is selected from the group consisting of maximum disparity, minimum disparity, mean disparity, and RMS disparity.
- The display of claim 8 further comprising a positive alarm limit.
- The display of claim 8 further comprising a negative alarm limit.
- A display of a test and measurement instrument comprising a plurality of markers, each marker representing a rate of change of a value based on one or more disparity statistics, each disparity statistic being calculated over a single frame or field of a three-dimensional video under test calculated on a frame-by-frame basis.
- The display of claim 12 wherein the disparity statistic is selected from the group consisting of maximum disparity, minimum disparity, mean disparity, and RMS disparity.
- The display of claim 12 further comprising an alarm limit.
Applications Claiming Priority (2)
| Application Number | Priority Date | Filing Date | Title |
|---|---|---|---|
| US201061426949P | 2010-12-23 | 2010-12-23 | |
| US13/172,631 US20120162394A1 (en) | 2010-12-23 | 2011-06-29 | Displays for easy visualizing of 3d disparity data |
Publications (2)
| Publication Number | Publication Date |
|---|---|
| EP2469874A2 true EP2469874A2 (en) | 2012-06-27 |
| EP2469874A3 EP2469874A3 (en) | 2012-09-05 |
Family
ID=45002722
Family Applications (1)
| Application Number | Title | Priority Date | Filing Date |
|---|---|---|---|
| EP11189351A Withdrawn EP2469874A3 (en) | 2010-12-23 | 2011-11-16 | Displays for easy visualizing of 3D disparity data |
Country Status (4)
| Country | Link |
|---|---|
| US (1) | US20120162394A1 (en) |
| EP (1) | EP2469874A3 (en) |
| JP (1) | JP2012134955A (en) |
| CN (1) | CN102685535A (en) |
Families Citing this family (3)
| Publication number | Priority date | Publication date | Assignee | Title |
|---|---|---|---|---|
| US10805625B2 (en) * | 2011-07-05 | 2020-10-13 | Texas Instruments Incorporated | Method, system and computer program product for adjusting a stereoscopic image in response to decoded disparities between views of the stereoscopic image |
| TW201325204A (en) * | 2011-12-15 | 2013-06-16 | Ind Tech Res Inst | Stereoscopic image pickup and display quality estimation system and method applicable thereto |
| CN103237108B (en) * | 2013-05-13 | 2015-11-25 | 百度在线网络技术(北京)有限公司 | For method of testing and the test terminal of mobile terminal |
Family Cites Families (13)
| Publication number | Priority date | Publication date | Assignee | Title |
|---|---|---|---|---|
| US20030167454A1 (en) * | 2001-03-30 | 2003-09-04 | Vassil Iordanov | Method of and system for providing metacognitive processing for simulating cognitive tasks |
| JP2003018619A (en) * | 2001-07-03 | 2003-01-17 | Olympus Optical Co Ltd | Three-dimensional image evaluation apparatus and display using the same |
| JP2003209858A (en) * | 2002-01-17 | 2003-07-25 | Canon Inc | Stereoscopic image generating method and recording medium |
| CN100584039C (en) * | 2002-10-23 | 2010-01-20 | 皇家飞利浦电子股份有限公司 | Method for post-processing a 3D digital video signal |
| US20080267290A1 (en) * | 2004-04-08 | 2008-10-30 | Koninklijke Philips Electronics N.V. | Coding Method Applied to Multimedia Data |
| JP4757812B2 (en) * | 2007-02-20 | 2011-08-24 | 富士フイルム株式会社 | Stereoscopic imaging apparatus, method, and program |
| DE112009000094T5 (en) * | 2008-01-04 | 2010-11-11 | 3M Innovative Properties Co., St. Paul | Refinement of three-dimensional models |
| US8345956B2 (en) * | 2008-11-03 | 2013-01-01 | Microsoft Corporation | Converting 2D video into stereo video |
| JP5577348B2 (en) * | 2008-12-01 | 2014-08-20 | アイマックス コーポレイション | 3D animation presentation method and system having content adaptation information |
| US9128984B2 (en) * | 2009-02-02 | 2015-09-08 | Hewlett-Packard Development Company, L.P. | Query plan analysis of alternative plans using robustness mapping |
| CN102835116B (en) * | 2010-04-01 | 2015-03-25 | 诺基亚公司 | Method and apparatus for selecting a stereoscopic imaging viewpoint pair |
| GB2479410A (en) * | 2010-04-09 | 2011-10-12 | Tektronix Uk Ltd | Measuring perceived stereoscopic visual depth |
| US9406132B2 (en) * | 2010-07-16 | 2016-08-02 | Qualcomm Incorporated | Vision-based quality metric for three dimensional video |
-
2011
- 2011-06-29 US US13/172,631 patent/US20120162394A1/en not_active Abandoned
- 2011-11-16 EP EP11189351A patent/EP2469874A3/en not_active Withdrawn
- 2011-11-22 JP JP2011255232A patent/JP2012134955A/en active Pending
- 2011-12-23 CN CN2011104371505A patent/CN102685535A/en active Pending
Also Published As
| Publication number | Publication date |
|---|---|
| US20120162394A1 (en) | 2012-06-28 |
| EP2469874A3 (en) | 2012-09-05 |
| CN102685535A (en) | 2012-09-19 |
| JP2012134955A (en) | 2012-07-12 |
Similar Documents
| Publication | Publication Date | Title |
|---|---|---|
| US9841277B2 (en) | Graphical feedback during 3D scanning operations for obtaining optimal scan resolution | |
| Sohn et al. | Predicting visual discomfort using object size and disparity information in stereoscopic images | |
| US9053656B2 (en) | Apparatus for evaluating optical properties of three-dimensional display, and method for evaluating optical properties of three-dimensional display | |
| JP5010001B2 (en) | 3D image display panel evaluation method and system | |
| US20050219362A1 (en) | Quality analysis in imaging | |
| US7167188B2 (en) | Method of and scaling unit for scaling a three-dimensional model and display apparatus | |
| US20180096525A1 (en) | Method for generating an ordered point cloud using mobile scanning data | |
| US8624914B2 (en) | Image processing apparatus and image processing method | |
| CN107229560A (en) | A kind of interface display effect testing method, image specimen page acquisition methods and device | |
| JP6723798B2 (en) | Information processing device, method, and program | |
| JP2015162718A (en) | Image processing method, image processing device and electronic equipment | |
| KR20130081835A (en) | Method and system for analyzing a quality of three-dimensional image | |
| EP2469874A2 (en) | Displays for easy visualizing of 3D disparity data | |
| CN103808492A (en) | Curve display method of OTDR collected data | |
| Gaich et al. | Digital rock mass characterization 2017–Where are we now? What comes next? | |
| US20190273845A1 (en) | Vibration monitoring of an object using a video camera | |
| Repasi et al. | Analysis of image distortions by atmospheric turbulence and computer simulation of turbulence effects | |
| US7505039B2 (en) | Track of statistics | |
| Redi et al. | On the impact of packet-loss impairments on visual attention mechanisms | |
| KR101332628B1 (en) | Method and system for measuring a quality of three-dimensional image | |
| CN105915884A (en) | Method for preventing display terminal 3D crosstalk and system thereof | |
| CN106331677B (en) | The evaluation method and system of bore hole stereoscopic display intermediate-resolution index | |
| US11423551B1 (en) | Enhanced presentation methods for visualizing motion of physical structures and machinery | |
| US8941717B2 (en) | Semi-automatic 3D stereoscopic disparity cursor | |
| CN108195563B (en) | Display effect evaluation method and device of three-dimensional display device and evaluation terminal |
Legal Events
| Date | Code | Title | Description |
|---|---|---|---|
| AK | Designated contracting states |
Kind code of ref document: A2 Designated state(s): AL AT BE BG CH CY CZ DE DK EE ES FI FR GB GR HR HU IE IS IT LI LT LU LV MC MK MT NL NO PL PT RO RS SE SI SK SM TR |
|
| AX | Request for extension of the european patent |
Extension state: BA ME |
|
| PUAI | Public reference made under article 153(3) epc to a published international application that has entered the european phase |
Free format text: ORIGINAL CODE: 0009012 |
|
| PUAL | Search report despatched |
Free format text: ORIGINAL CODE: 0009013 |
|
| AK | Designated contracting states |
Kind code of ref document: A3 Designated state(s): AL AT BE BG CH CY CZ DE DK EE ES FI FR GB GR HR HU IE IS IT LI LT LU LV MC MK MT NL NO PL PT RO RS SE SI SK SM TR |
|
| AX | Request for extension of the european patent |
Extension state: BA ME |
|
| RIC1 | Information provided on ipc code assigned before grant |
Ipc: H04N 13/04 20060101AFI20120727BHEP |
|
| 17P | Request for examination filed |
Effective date: 20130305 |
|
| 17Q | First examination report despatched |
Effective date: 20140612 |
|
| RAP1 | Party data changed (applicant data changed or rights of an application transferred) |
Owner name: TEKTRONIX, INC. |
|
| STAA | Information on the status of an ep patent application or granted ep patent |
Free format text: STATUS: THE APPLICATION IS DEEMED TO BE WITHDRAWN |
|
| 18D | Application deemed to be withdrawn |
Effective date: 20160601 |